Heterocyclic Amine-Induced Feeding Deterrence and Antennal Response of Honey Bees

 , , and
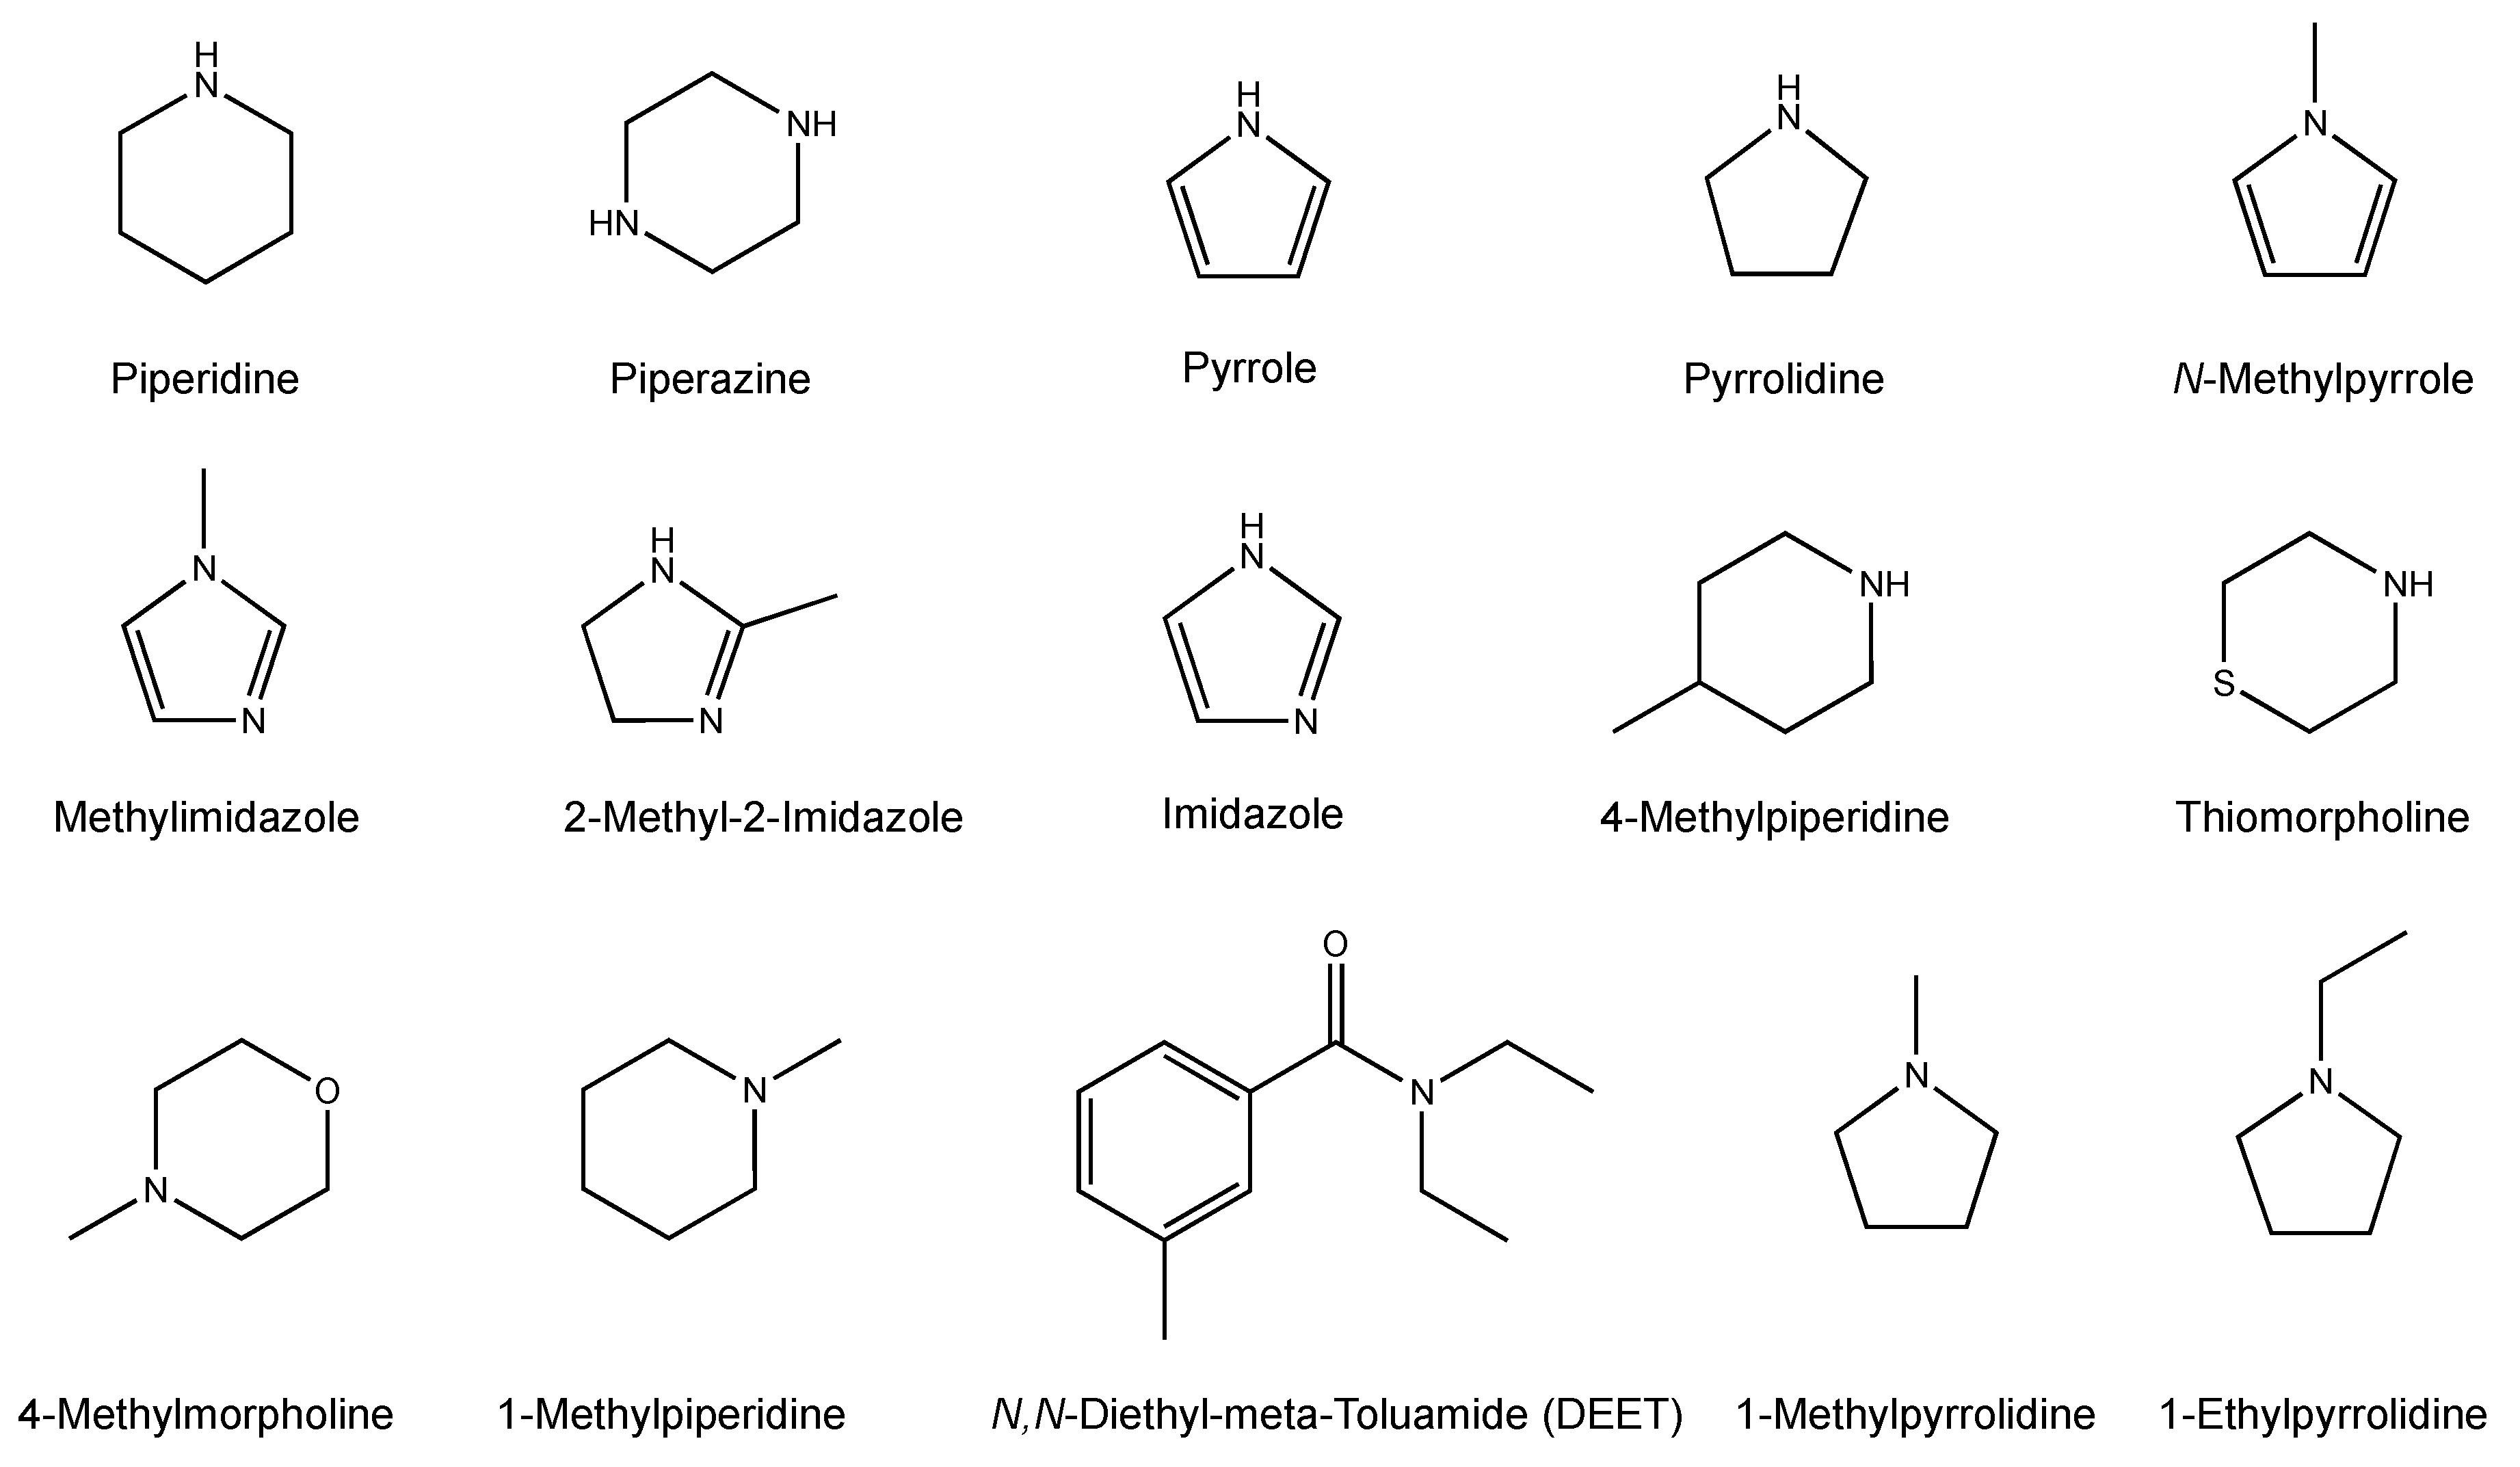
Abstract
:Simple Summary
Abstract
1. Introduction
2. Materials and Methods
2.1. Subjects
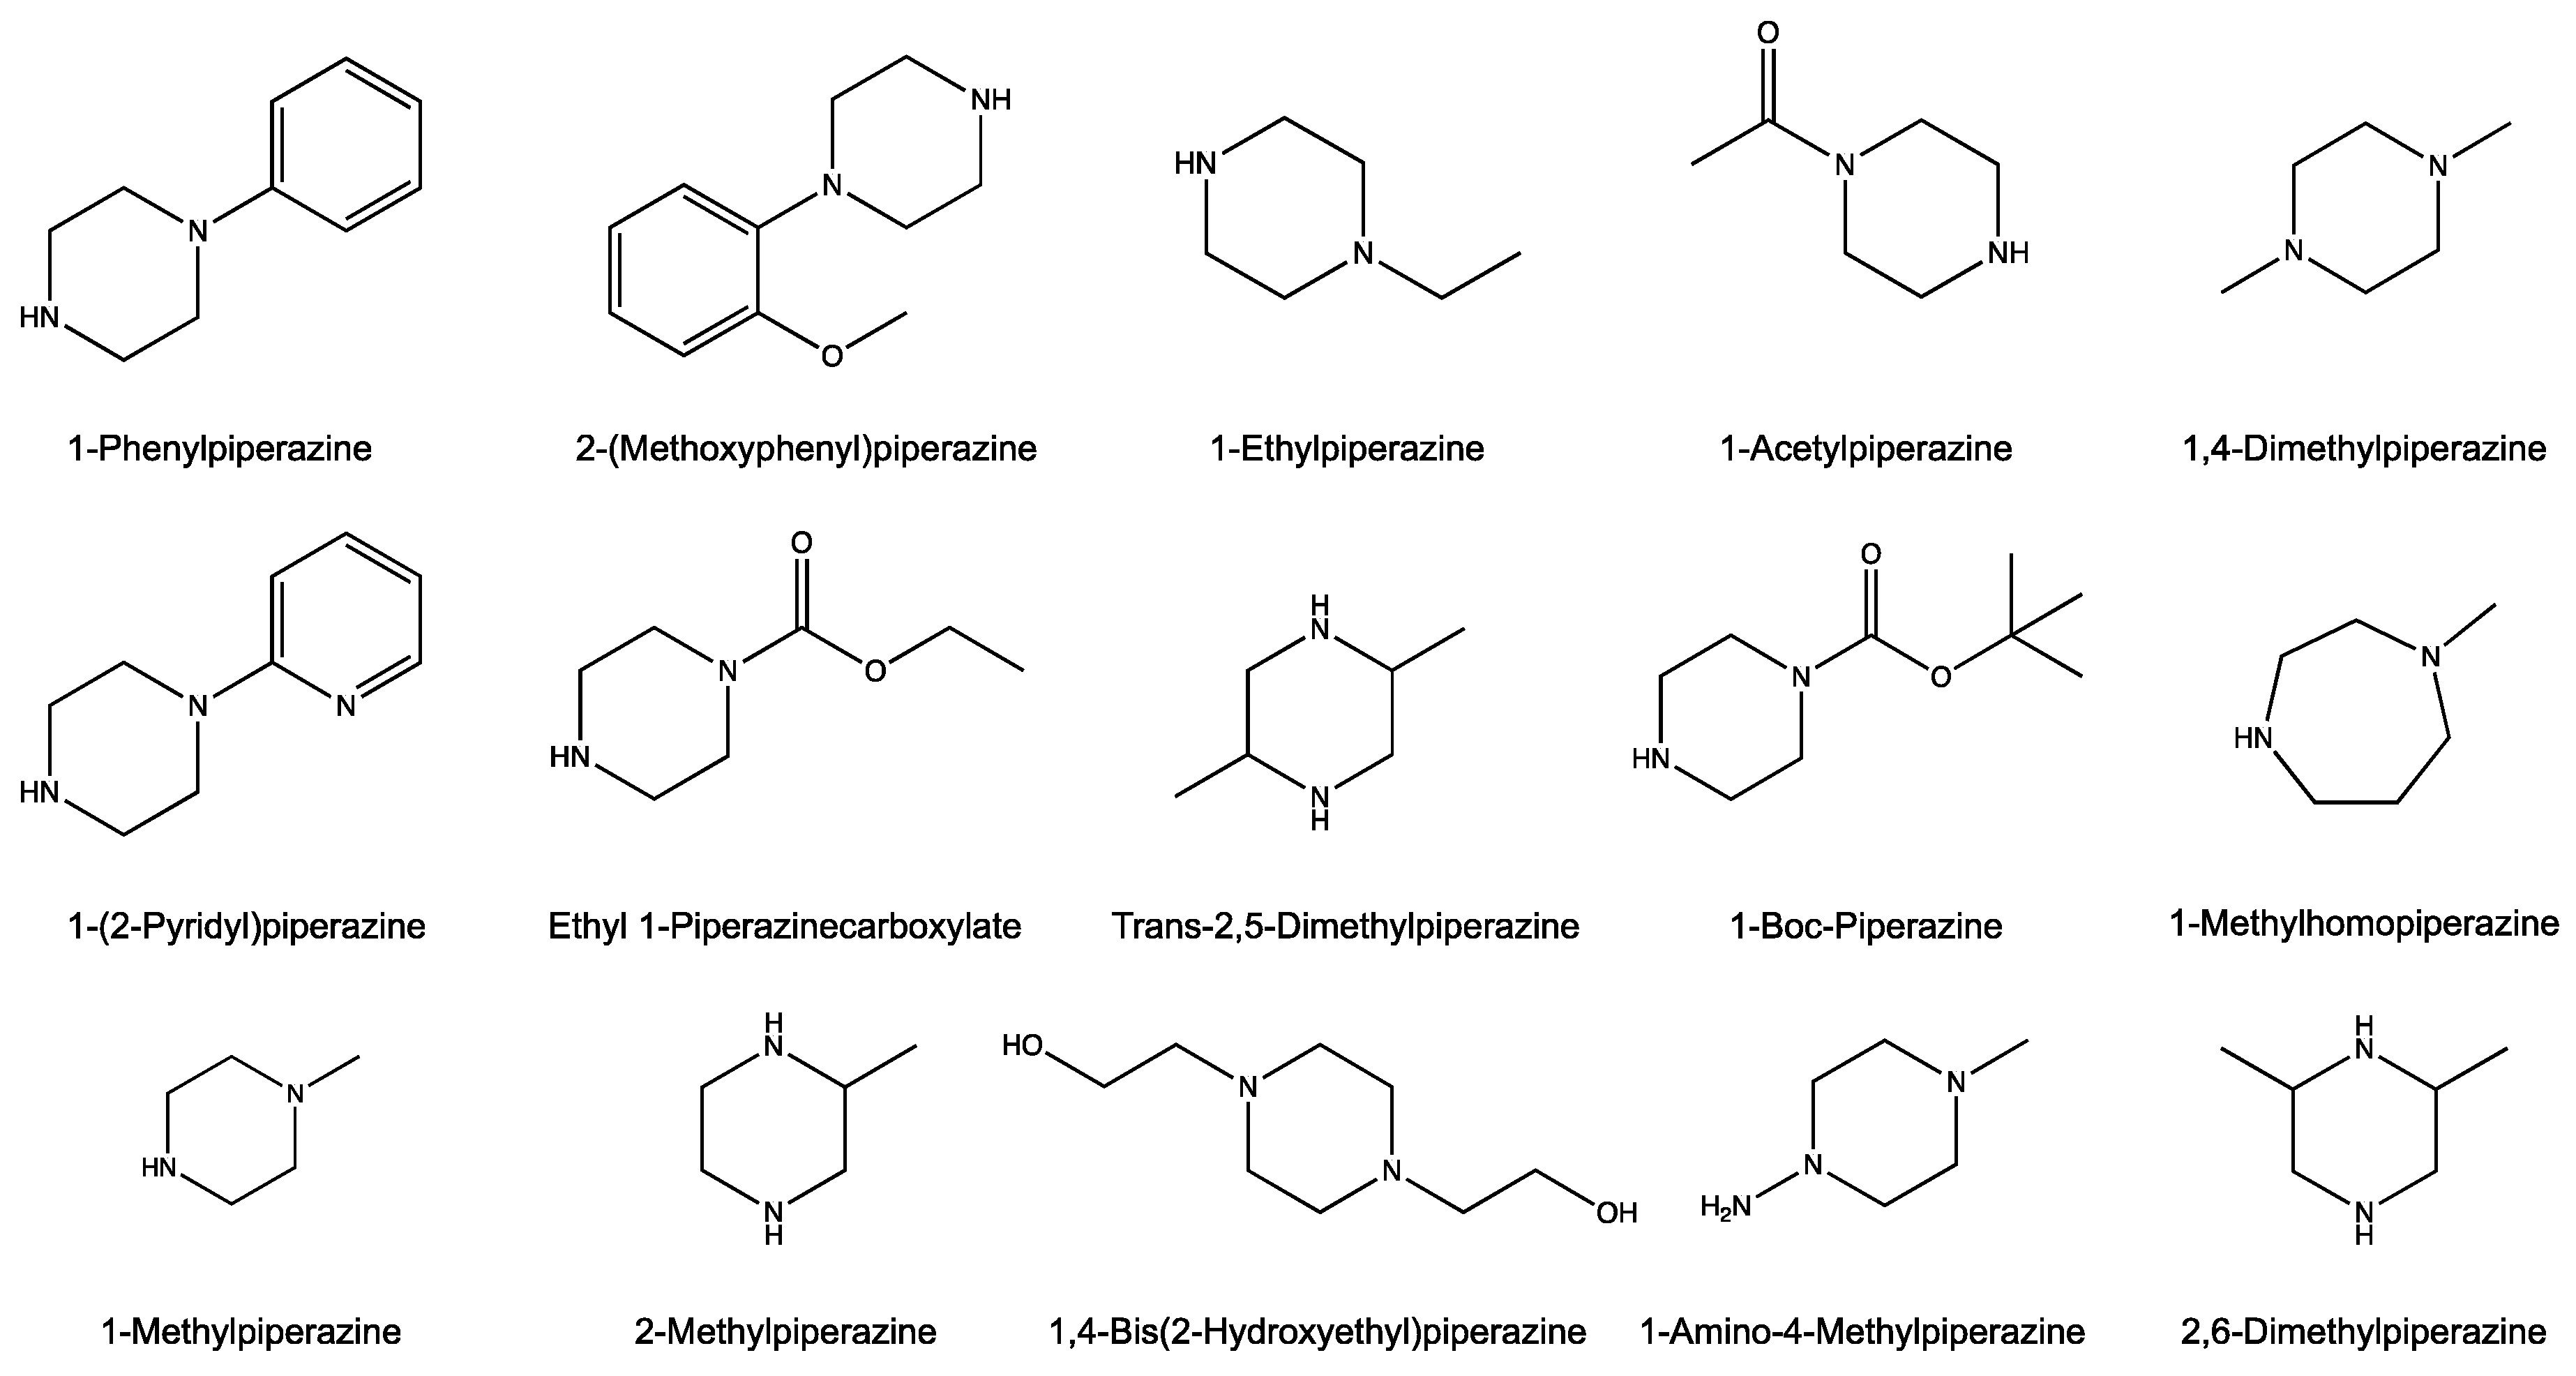
2.2. Chemicals
2.3. Video-Tracking Recordings
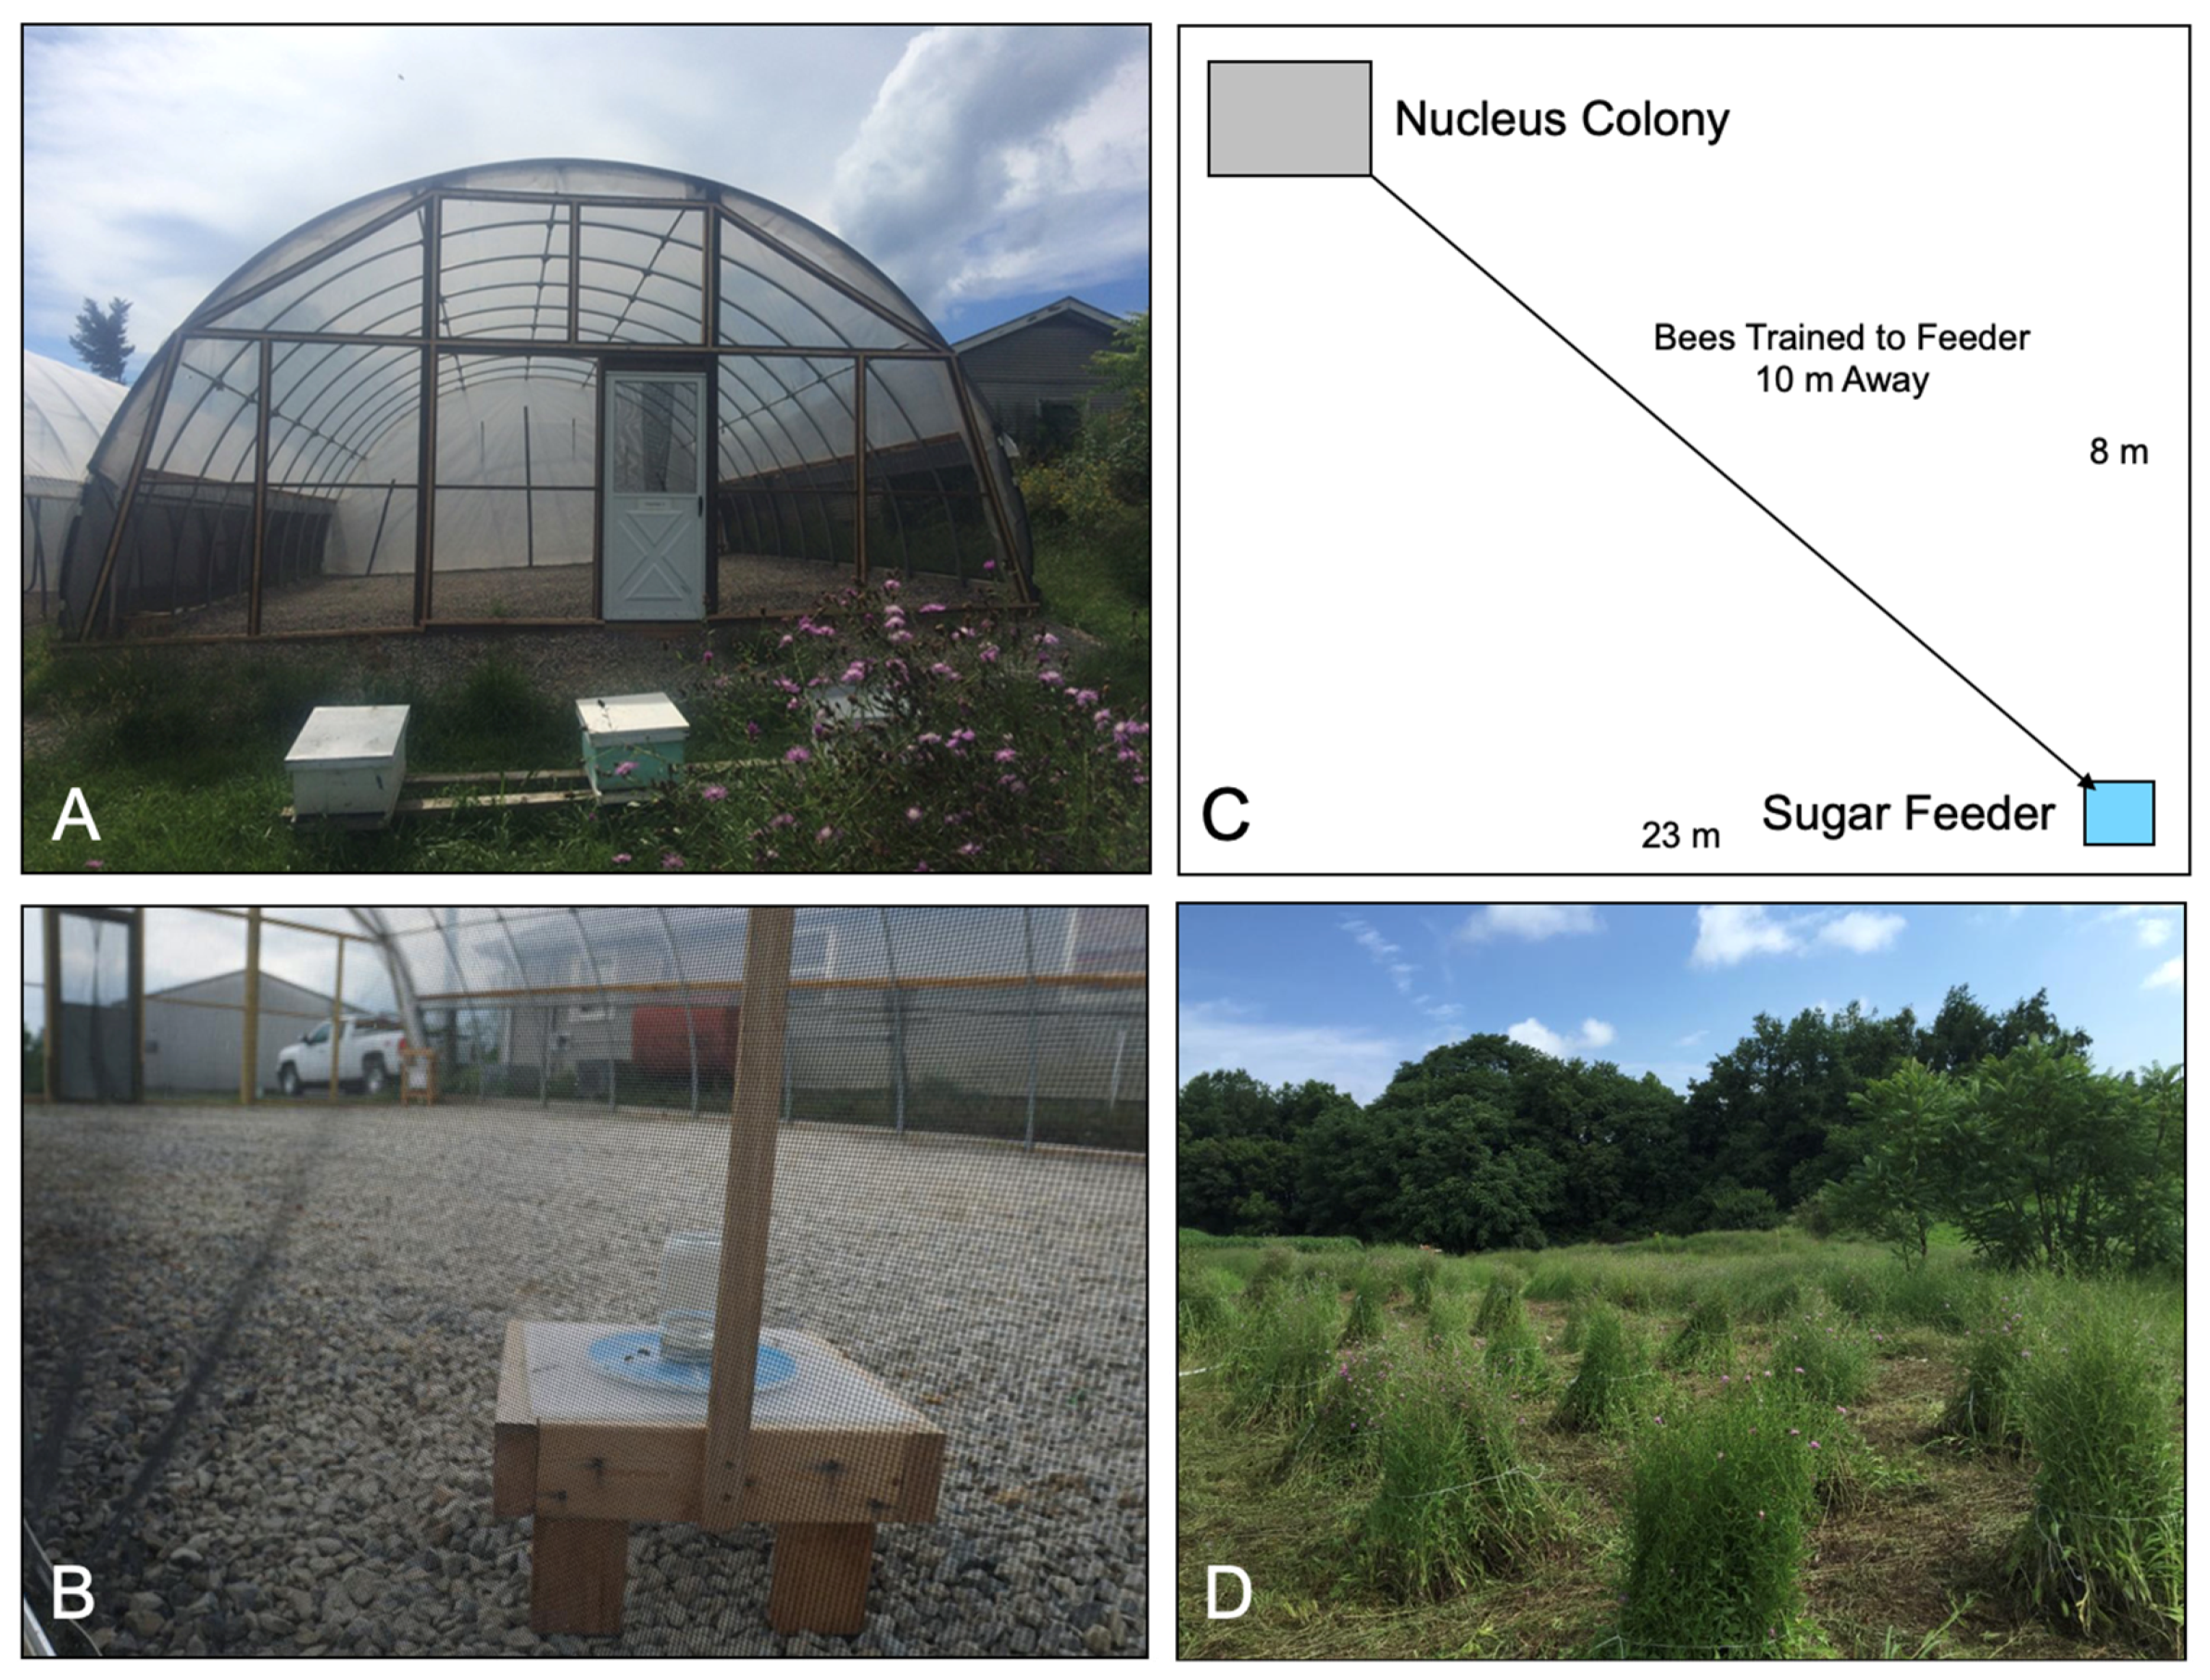
2.4. High-Tunnel Experiments
2.5. Field Experiments with Melon Flowers and Knapweed
2.6. Electroantennogram (EAG) Recordings
3. Results
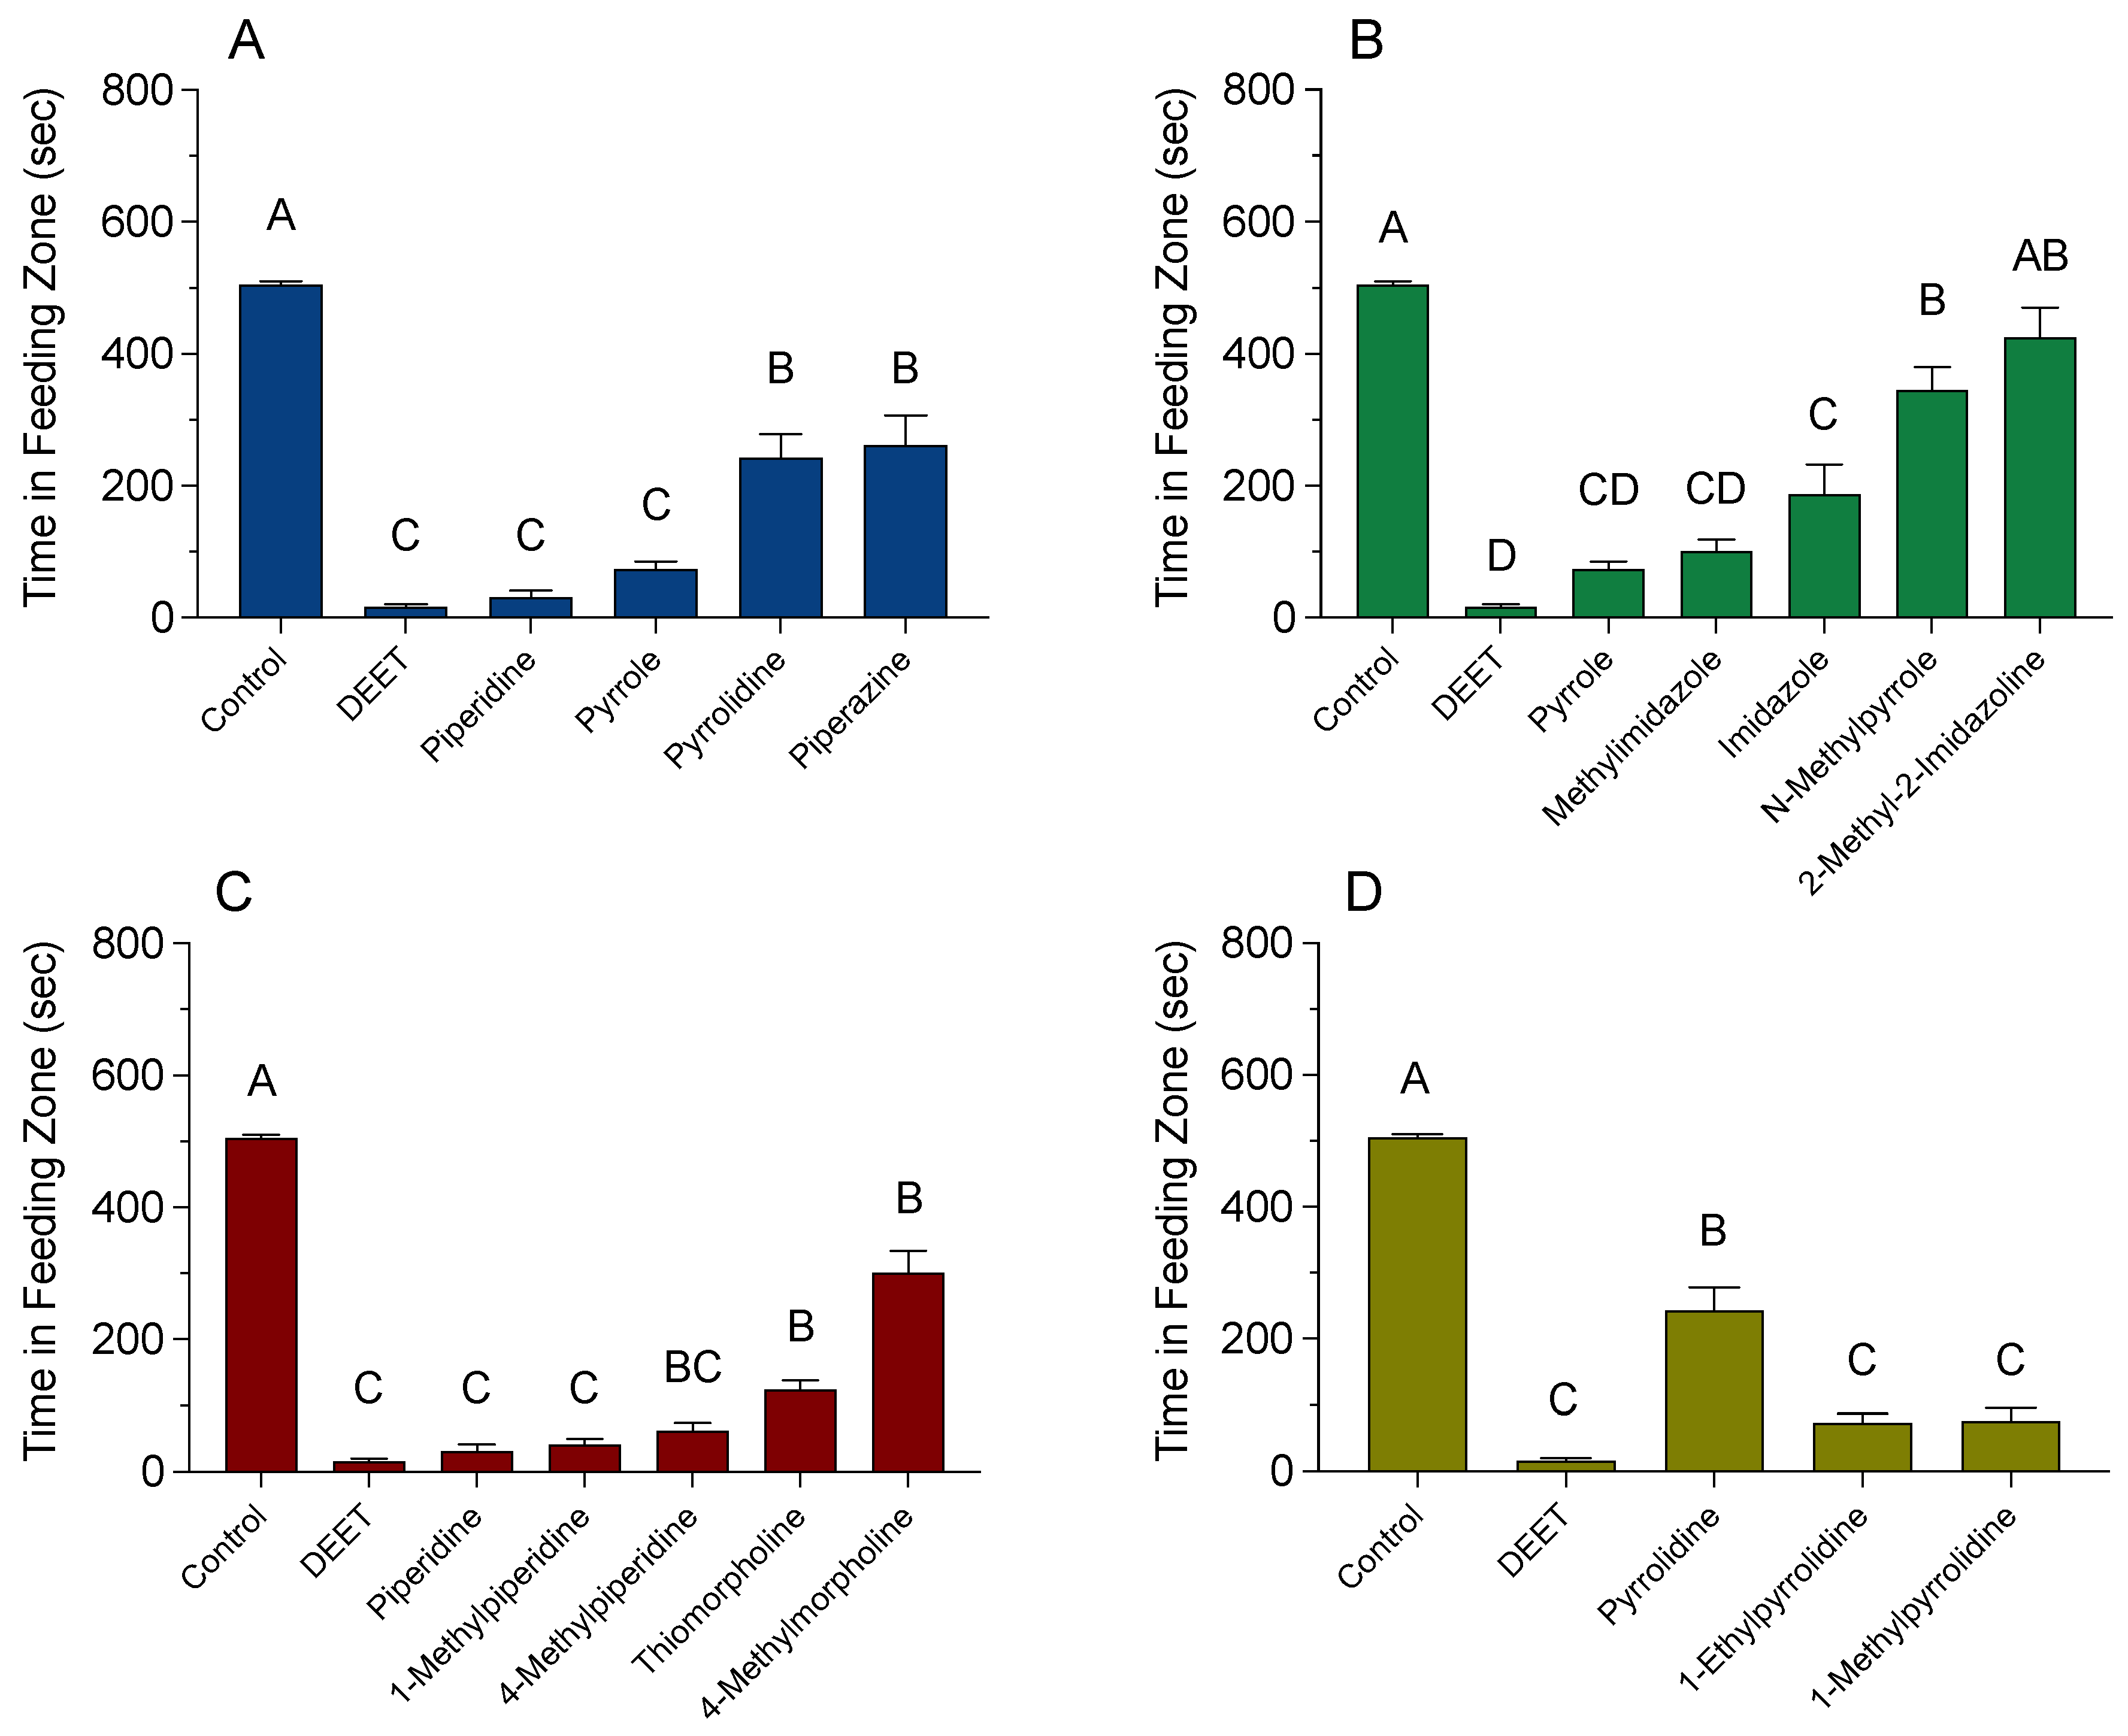
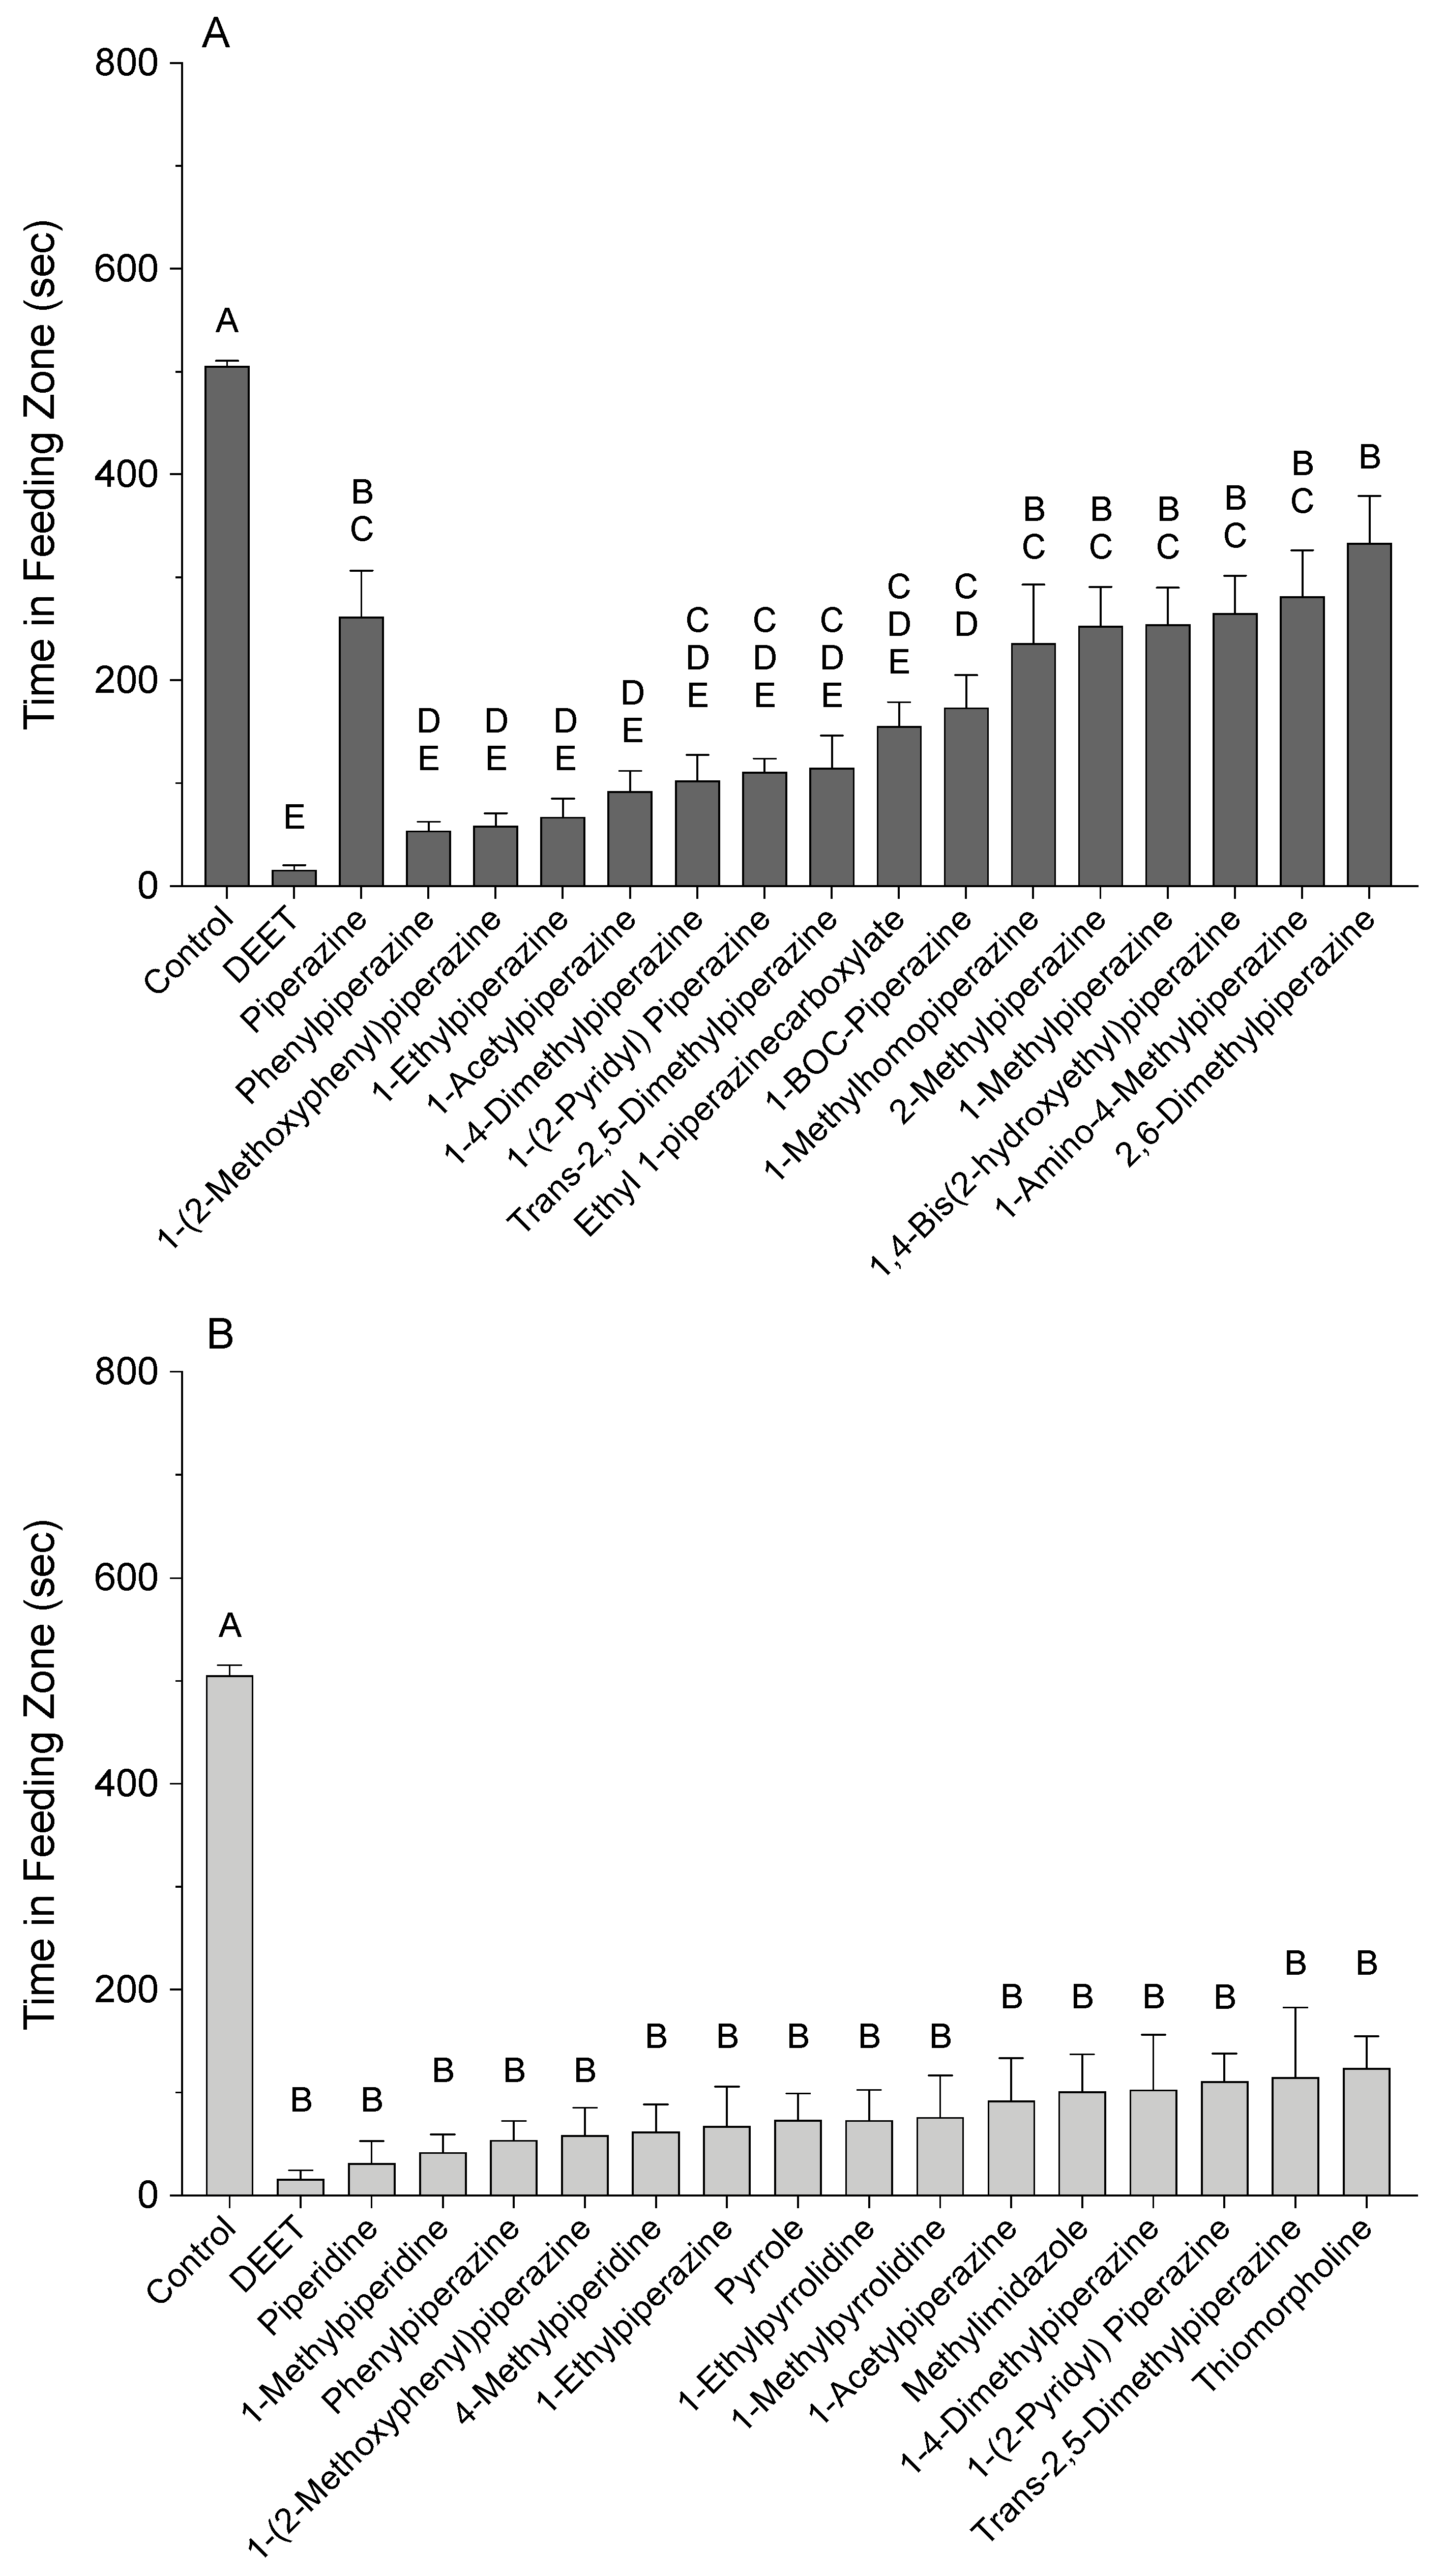
3.1. Video-Tracking Recordings
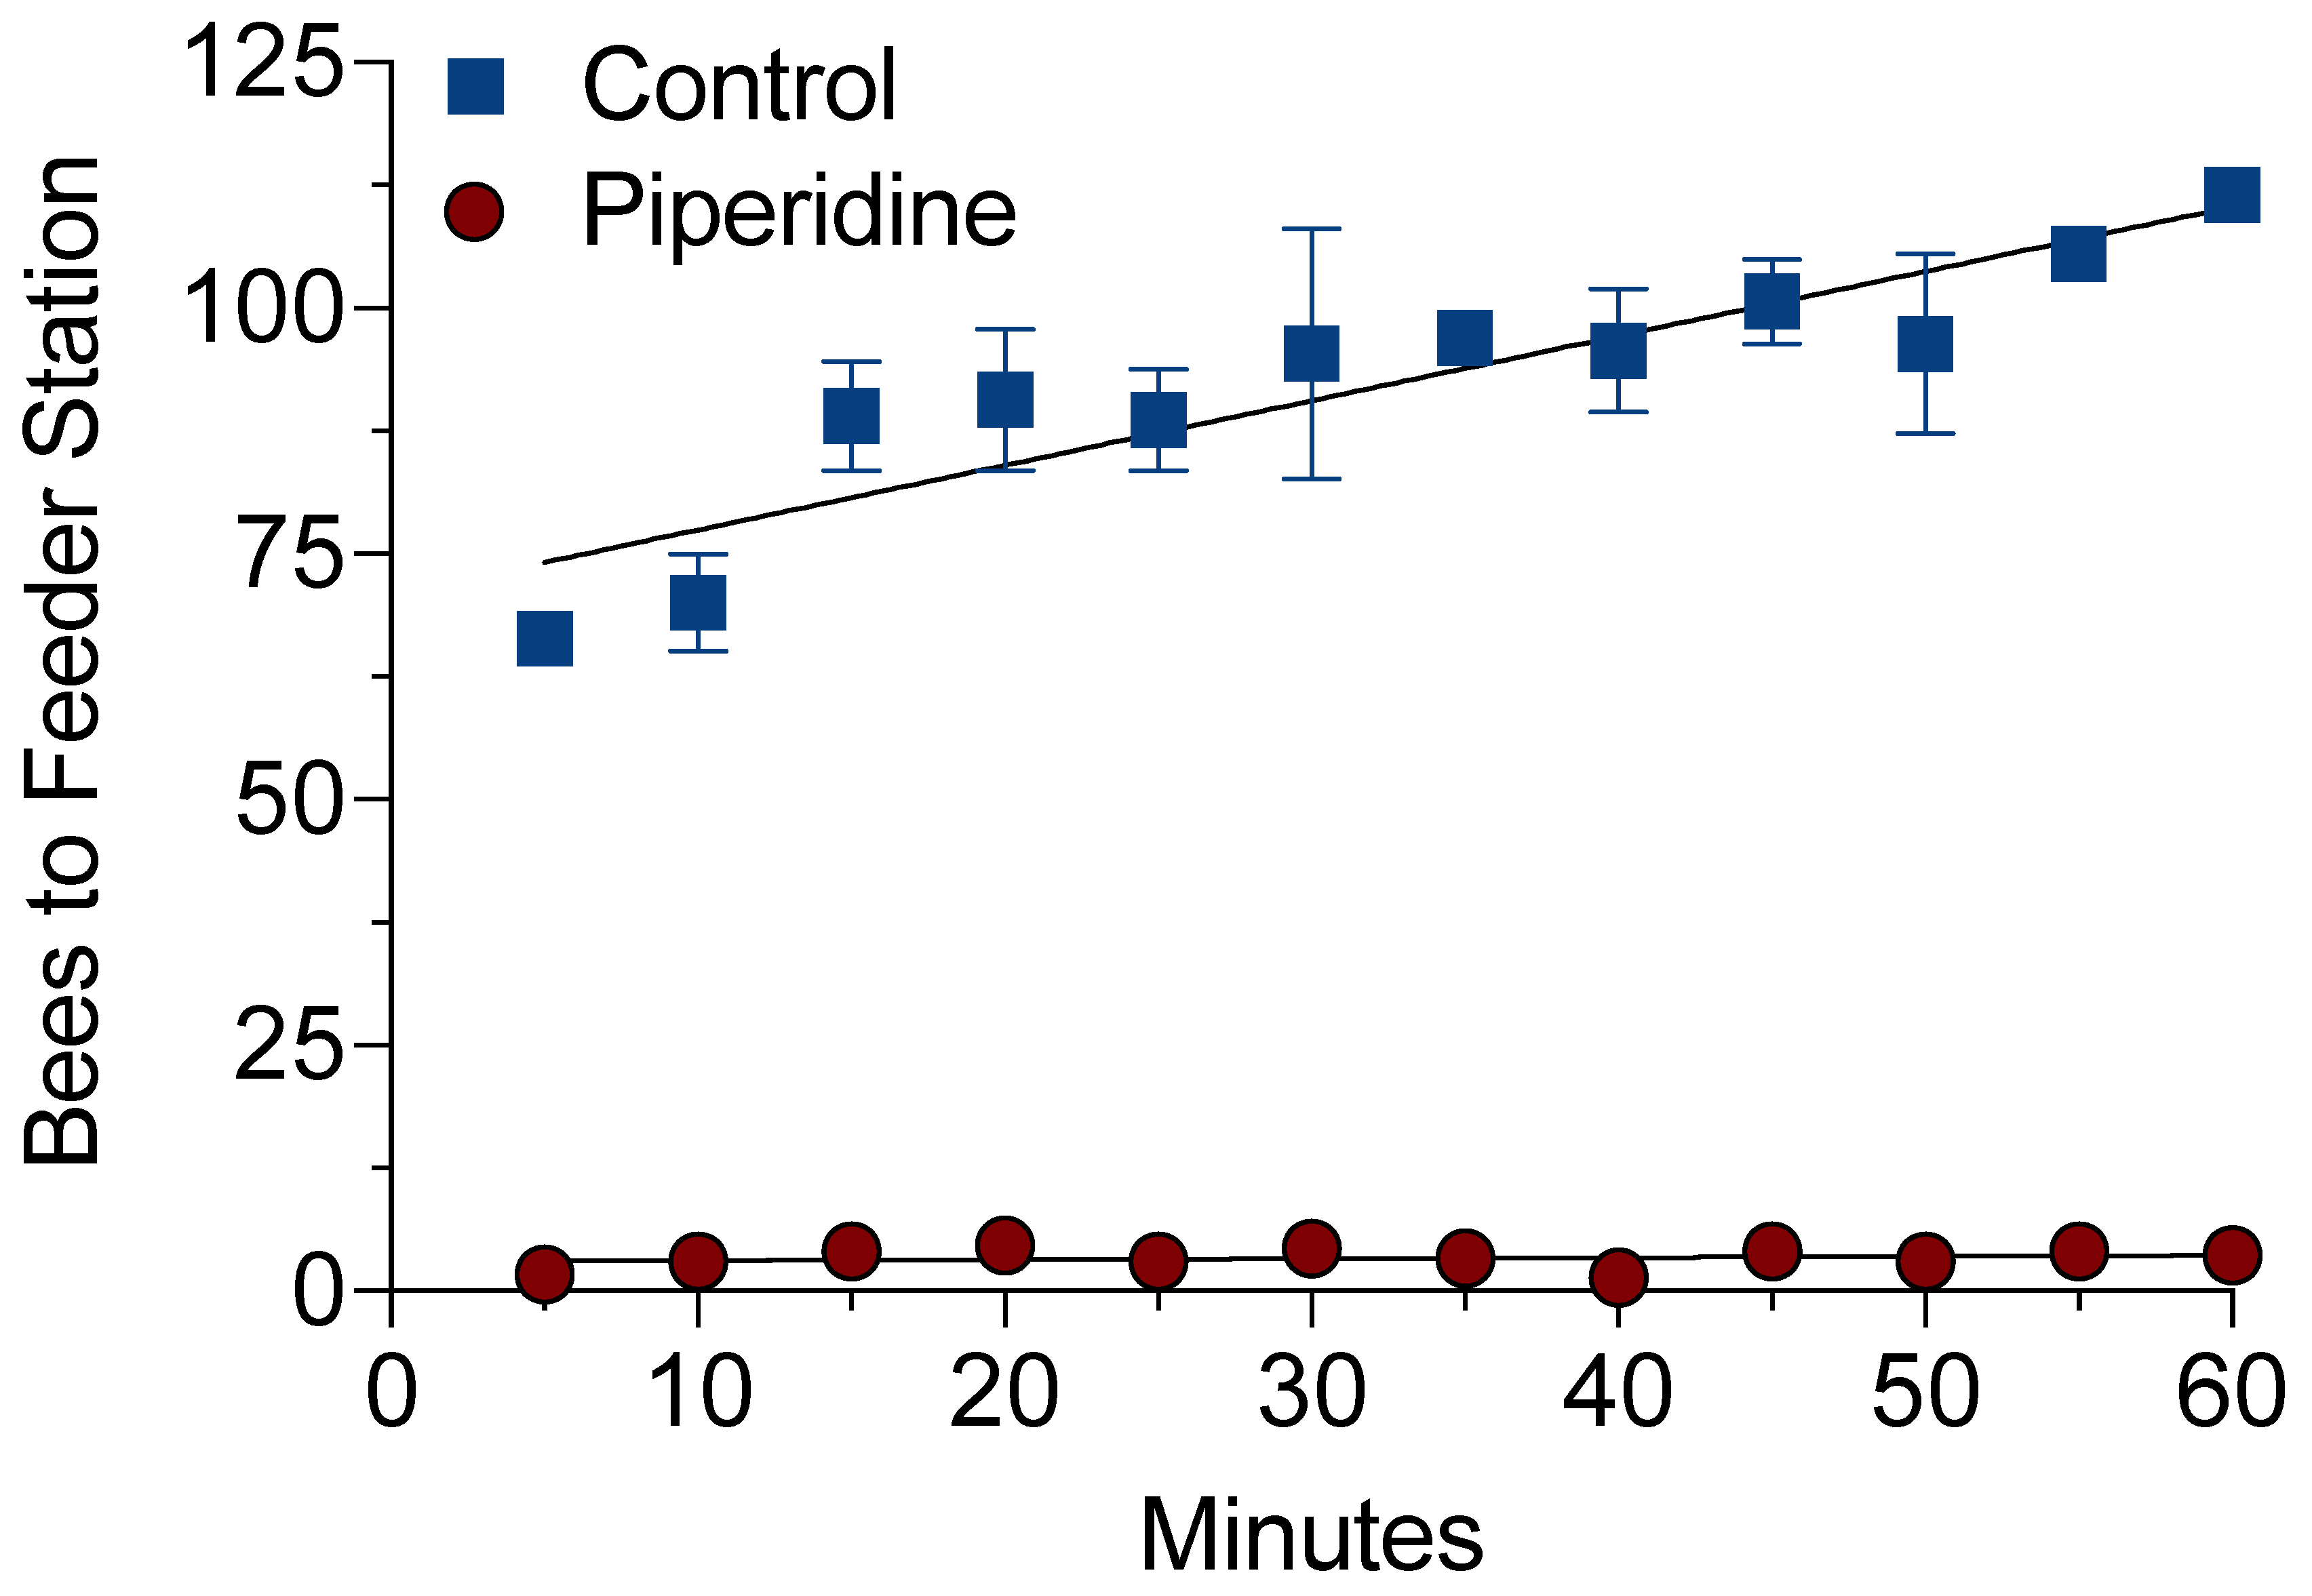
3.2. High-Tunnel Experiments
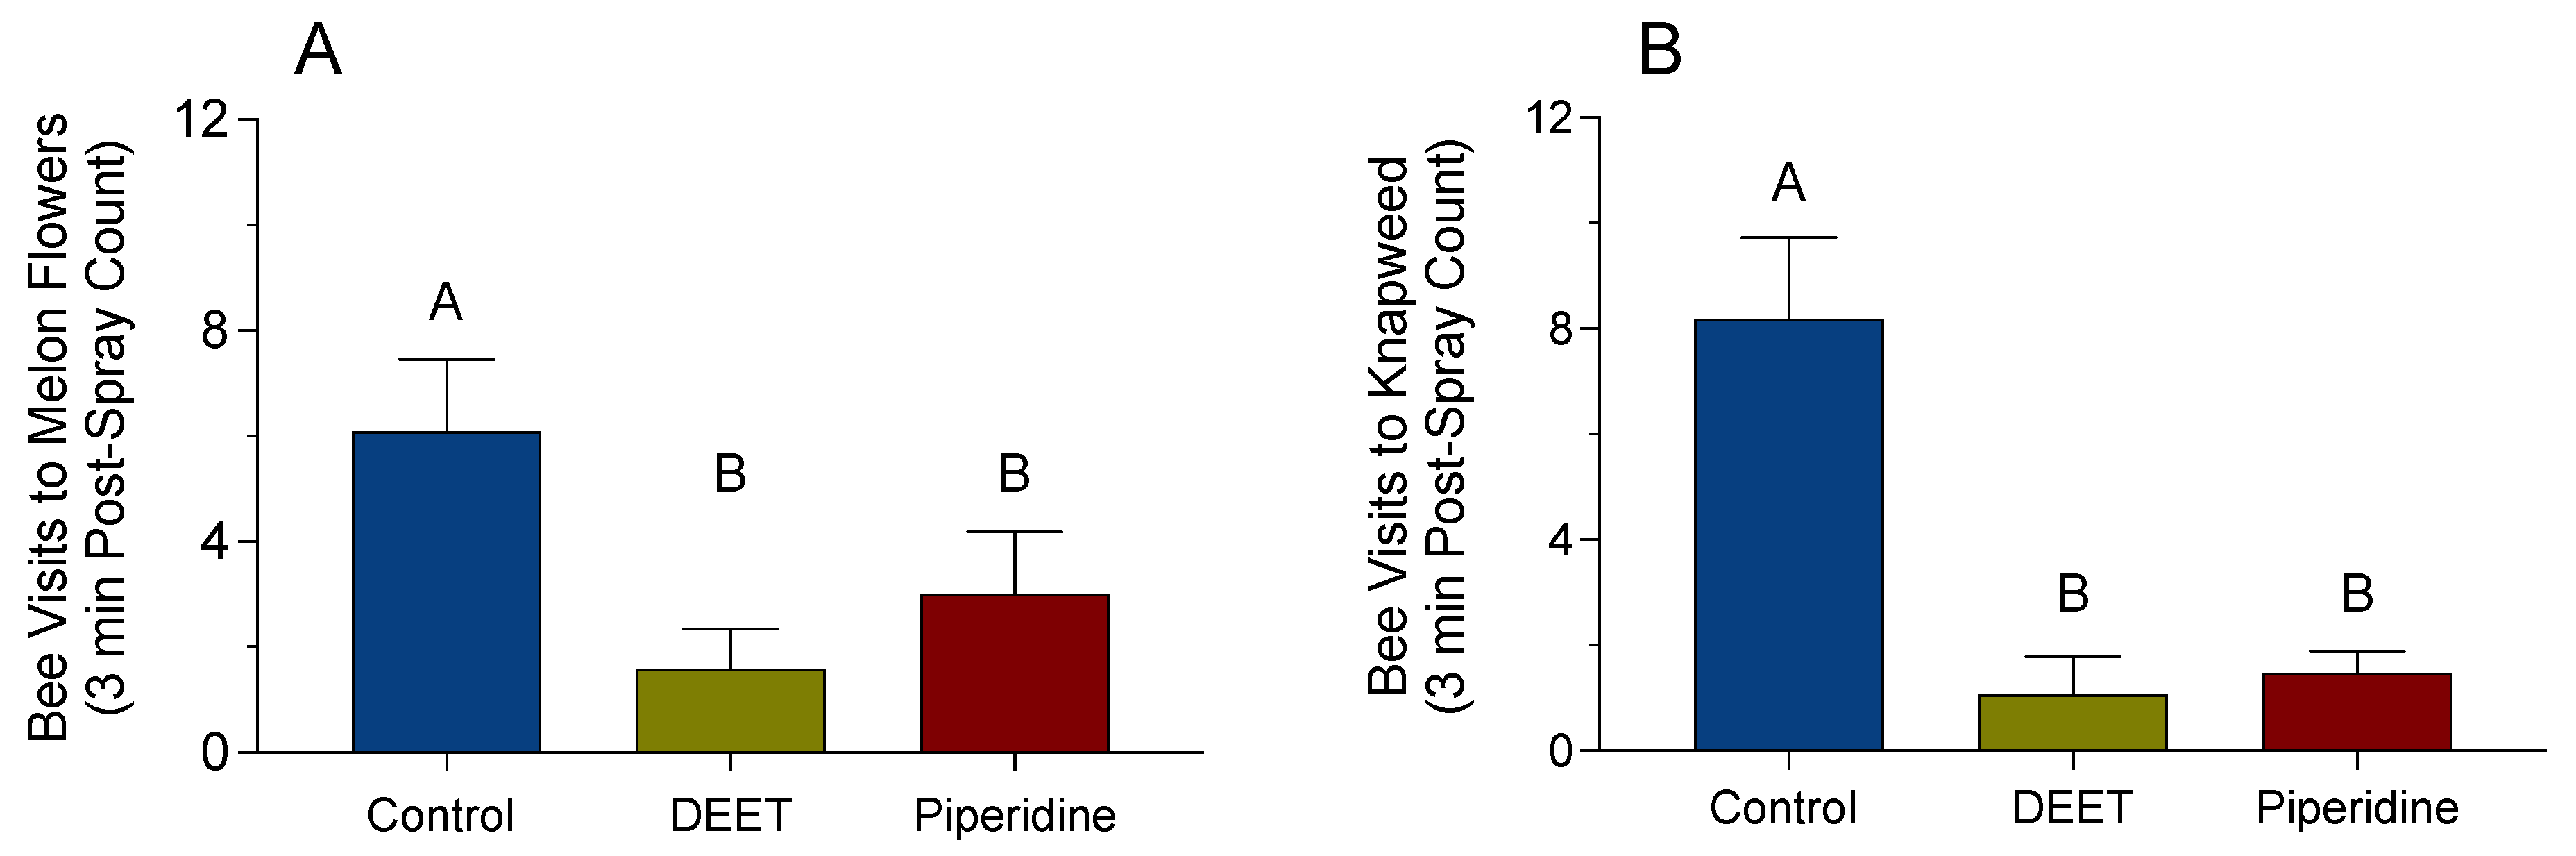
3.3. Field Experiment with Melon Flowers and Knapweed
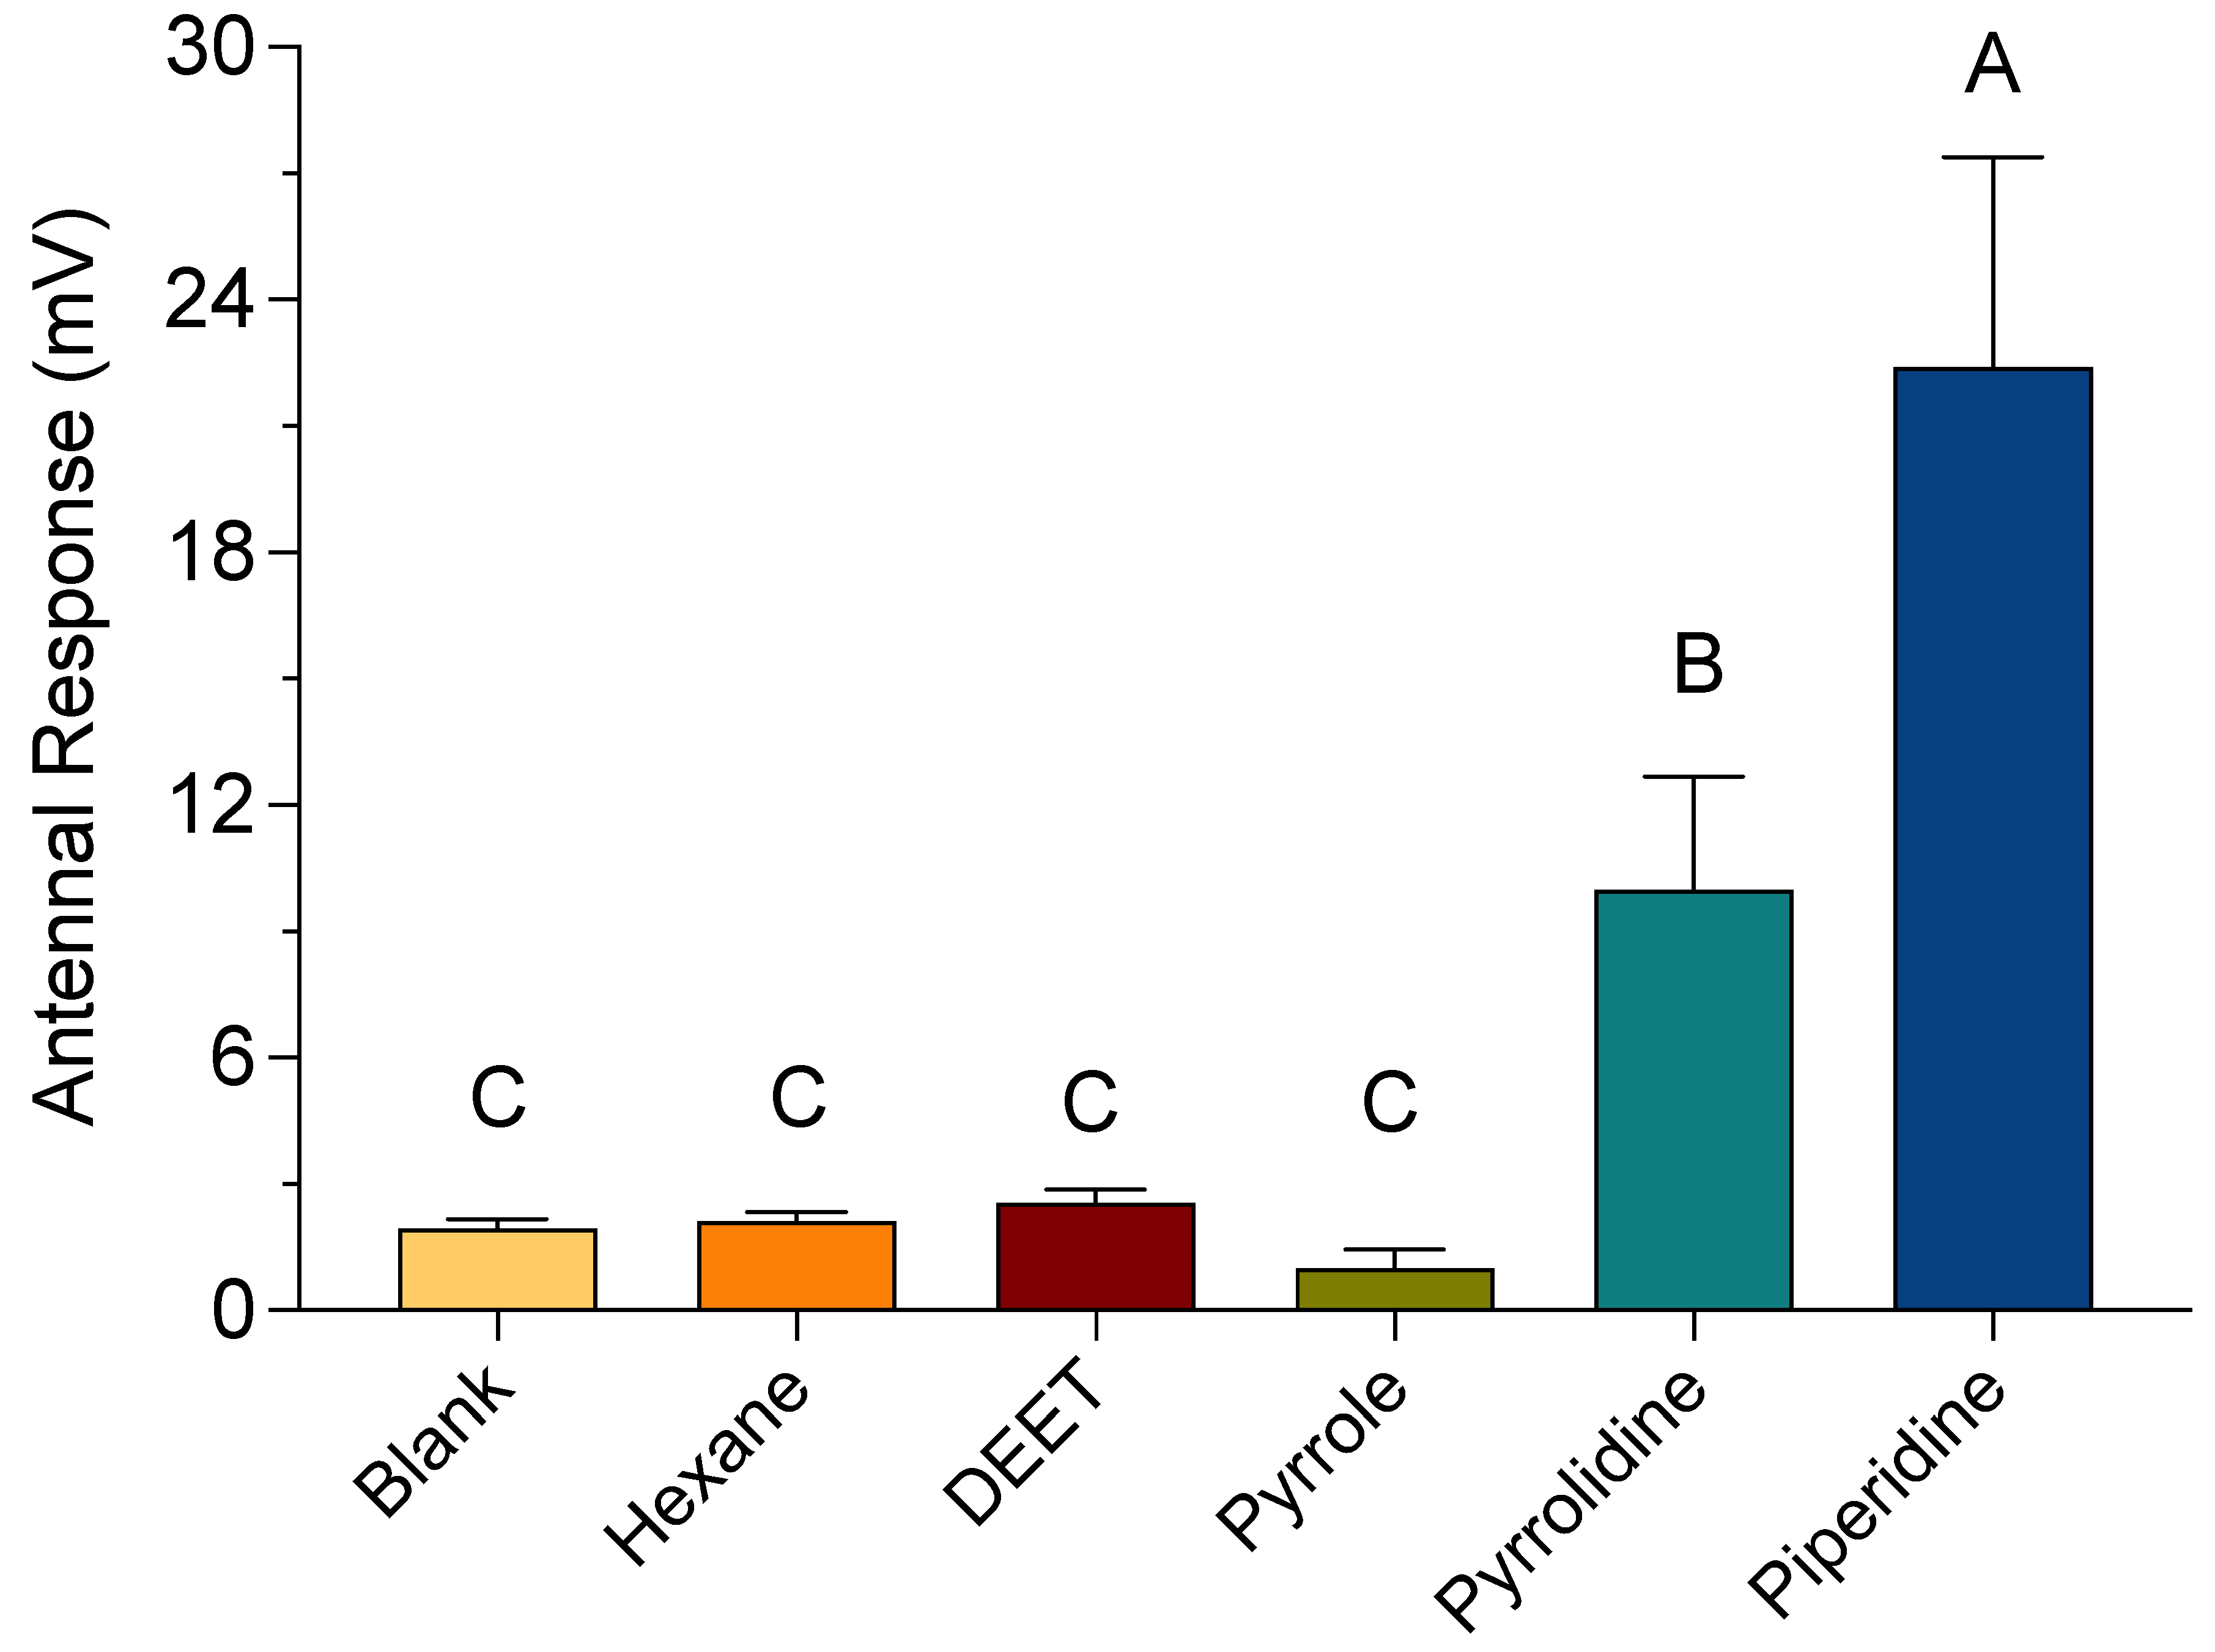
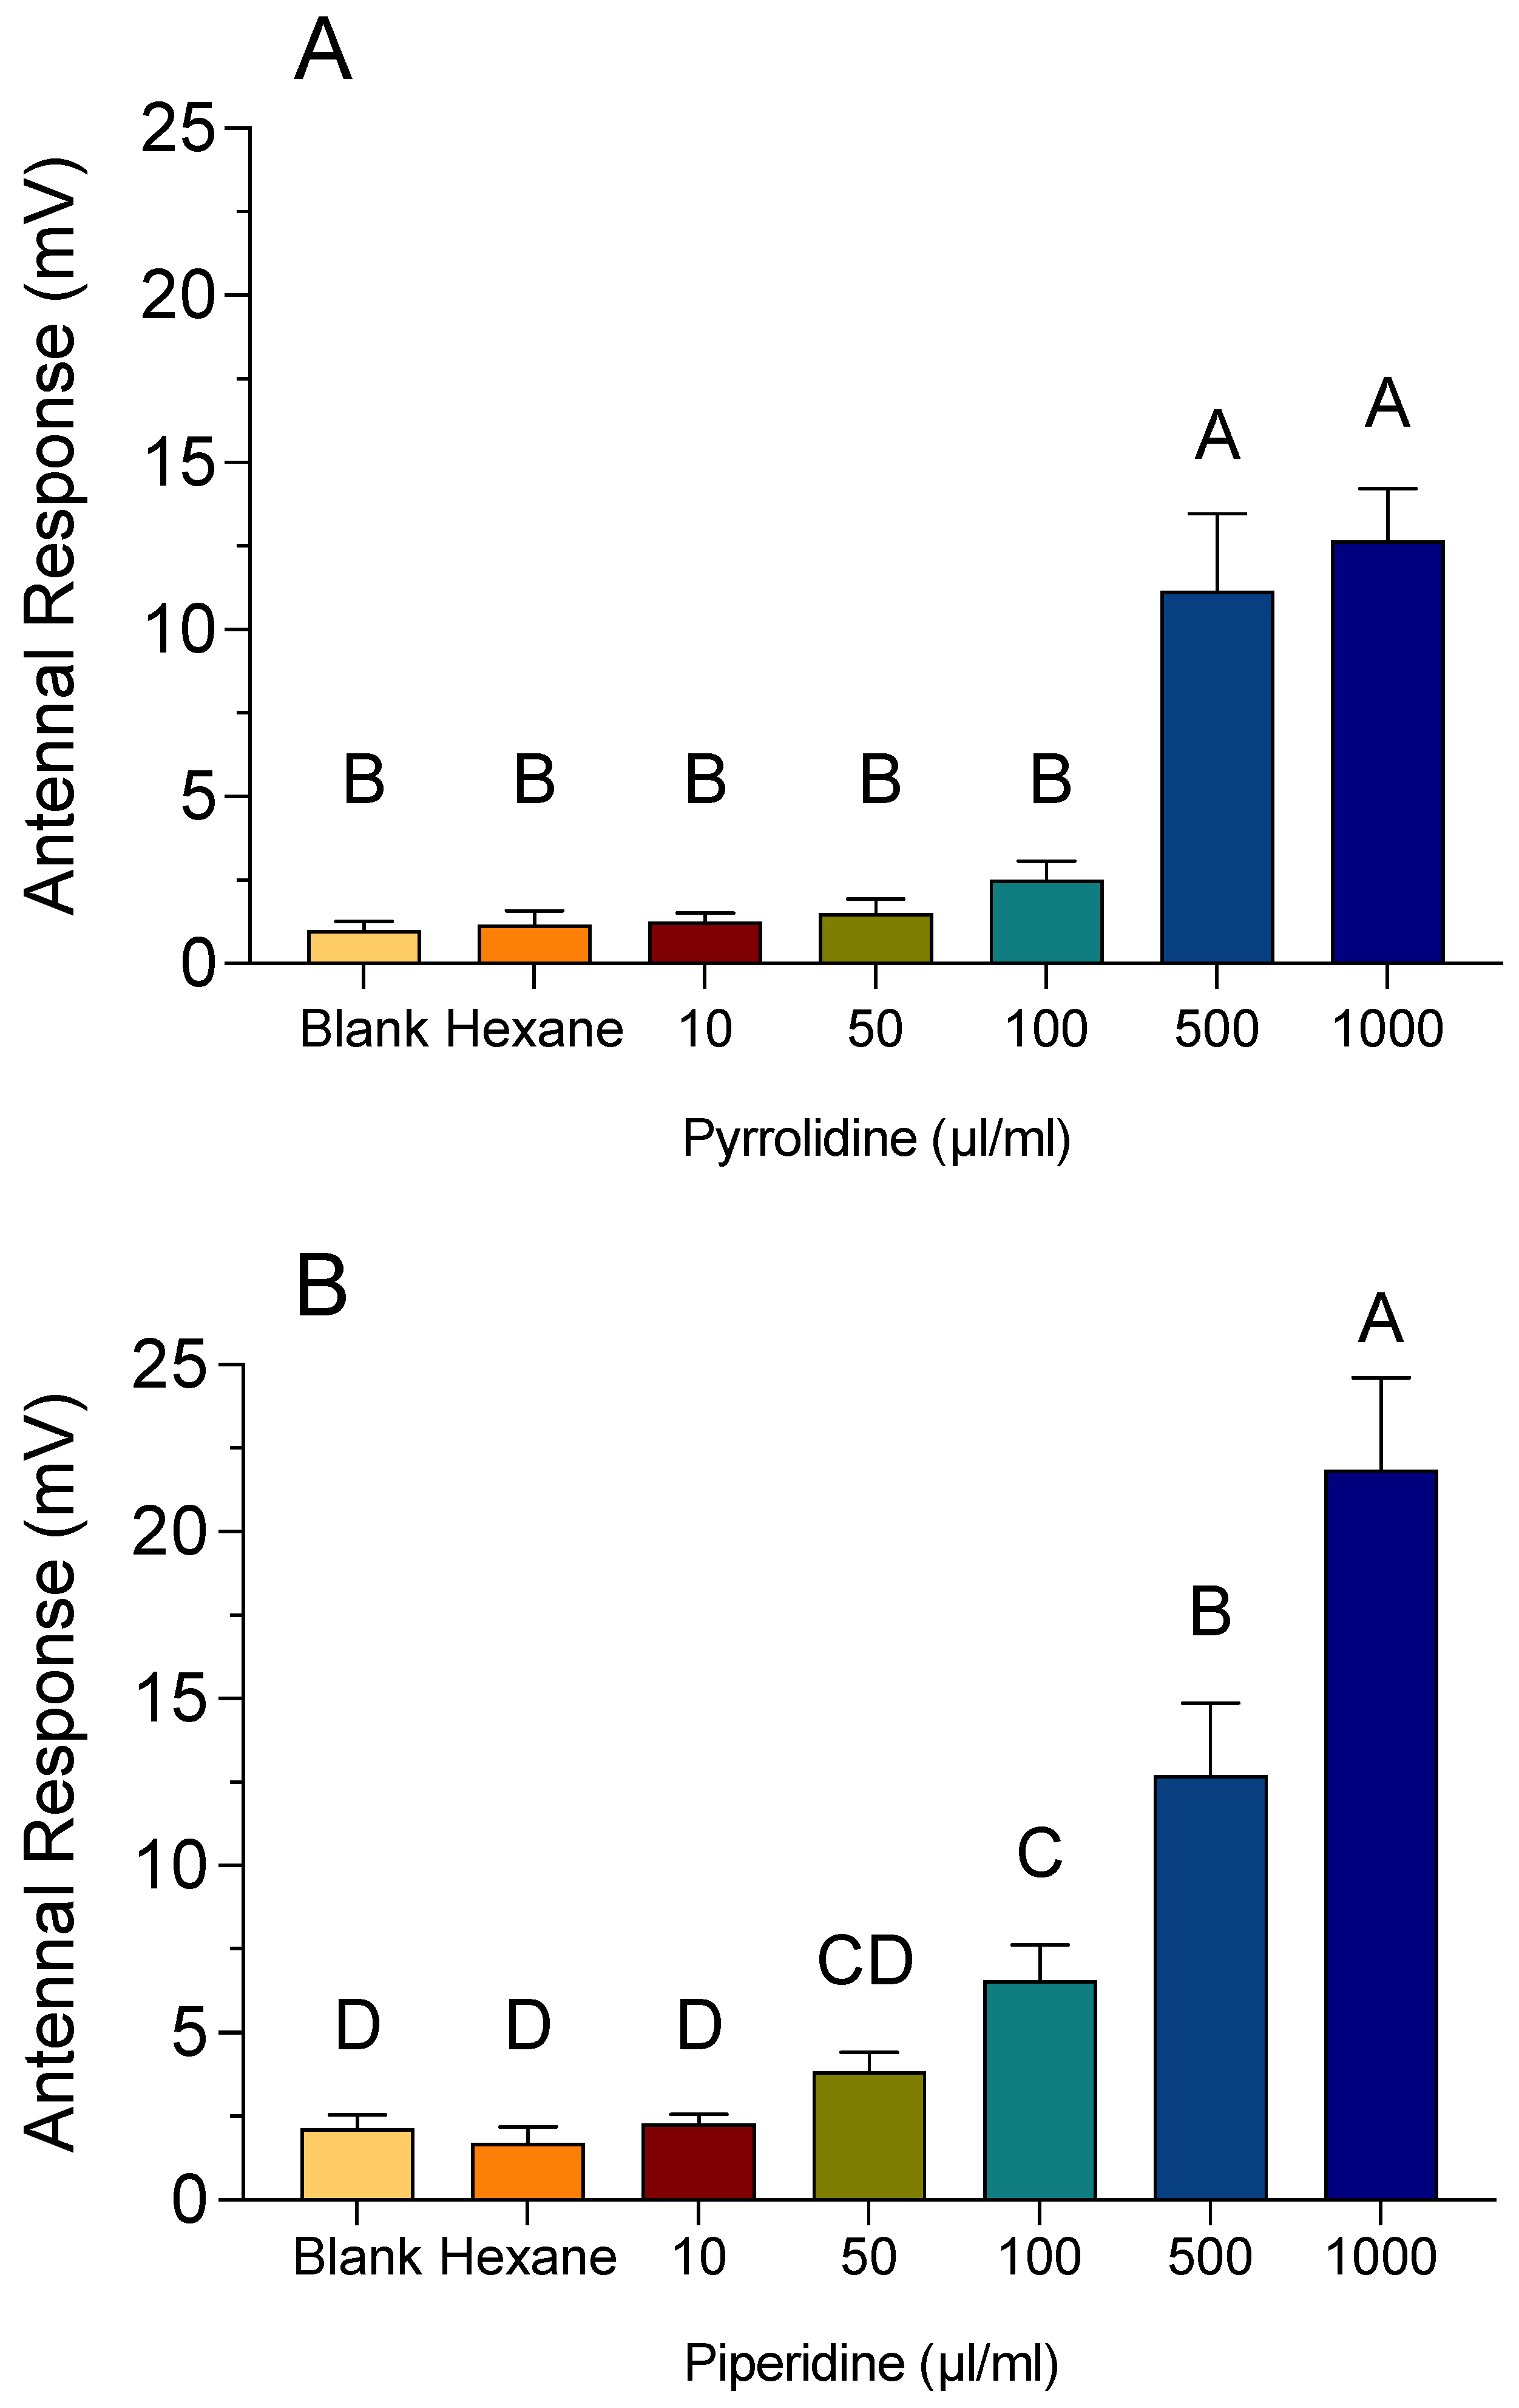
3.4. EAG Recordings
4. Discussion
5. Conclusions
Author Contributions
Funding
Institutional Review Board Statement
Informed Consent Statement
Data Availability Statement
Acknowledgments
Conflicts of Interest
References
- Gallai, N.; Salles, J.M.; Settele, J.; Vaissiere, B.E. Economic valuation of the vulnerability of world agriculture confronted with pollinator decline. Ecol. Econ. 2009, 68, 810–821. [Google Scholar] [CrossRef]
- Mullin, C.A.; Frazier, M.; Frazier, J.L.; Ashcraft, S.; Simonds, R.; Pettis, J.S. High levels of miticides and agrochemicals in North American apiaries: Implications for honey bee health. PLoS ONE 2010, 5, e9754. [Google Scholar] [CrossRef] [PubMed] [Green Version]
- Van Engelsdorp, D.; Meixner, M.D. A historical review of managed honey bee populations in Europe and the United States and the factors that may affect them. J. Invertebr. Pathol. 2010, 103 (Suppl. 1), S80–S95. [Google Scholar] [CrossRef] [PubMed]
- Sanchez-Bayo, F.; Goka, K. Pesticide residues and bees—A risk assessment. PLoS ONE 2014, 9, e94482. [Google Scholar] [CrossRef] [PubMed] [Green Version]
- O’Neal, S.T.; Brewster, C.C.; Bloomquist, J.R.; Anderson, T.D. Amitraz and its metabolite modulate honey bee cardiac function and tolerance to viral infection. J. Invertebr. Pathol. 2017, 149, 119–126. [Google Scholar] [CrossRef] [PubMed] [Green Version]
- O’Neal, S.T.; Anderson, T.D.; Wu-Smart, J.Y. Interactions between pesticides and pathogen susceptibility in honey bees. Curr. Opin. Insect Sci. 2018, 26, 57–62. [Google Scholar] [CrossRef] [PubMed] [Green Version]
- Reeves, A.M.; O’Neal, S.T.; Fell, R.D.; Brewster, C.C.; Anderson, T.D. In-hive acaricides alter biochemical and morphological indicators of honey bee nutrition, immunity, and development. J. Insect Sci. 2018, 18, 8. [Google Scholar] [CrossRef]
- O’Neal, S.T.; Reeves, A.M.; Fell, R.D.; Brewster, C.C.; Anderson, T.D. Chlorothalonil exposure alters virus susceptibility and markers of immunity, nutrition, and development in honey bees. J. Insect Sci. 2019, 19, 14. [Google Scholar] [CrossRef]
- Carvalho, F.P. Pesticides, environment, and food safety. Food Energy Secur. 2017, 6, 48–60. [Google Scholar] [CrossRef]
- Jones, G.D.G. The responses of the honey-bee to repellent chemicals. J. Exp. Biol. 1952, 29, 372–386. [Google Scholar]
- Woodrow, A.W.; Green, N.; Tucker, H.; Schonhorst, M.H.; Hamilton, K.C. Evaluation of chemicals as honey bee attractants and repellents. J. Econ. Entomol. 1965, 58, 1094–1102. [Google Scholar] [CrossRef]
- Atkins, E.L.; Macdonald, R.L.; Greywood-Hale, E.A. Repellent additives to reduce pesticide hazards to honey bees: Field tests. Environ. Entomol. 1975, 4, 207–210. [Google Scholar] [CrossRef]
- Katz, T.M.; Miller, J.H.; Hebert, A.A. Insect repellents: Historical perspectives and new developments. J. Am. Acad. Dermatol. 2008, 58, 865–871. [Google Scholar] [CrossRef] [PubMed]
- Brown, M.; Hebert, A.A. Insect repellents: An overview. J. Am. Acad. Dermatol. 1997, 36, 243–249. [Google Scholar] [CrossRef]
- Dickens, J.C.; Bohbot, J.D. Mini review: Mode of action of mosquito repellents. Pestic. Biochem. Phys. 2013, 106, 149–155. [Google Scholar] [CrossRef]
- Lawrence, K.L.; Achee, N.L.; Bernier, U.R.; Mundal, K.D.; Benante, J.P. Field evaluations of topical arthropod repellents in North, Central, and South America. J. Med. Entomol. 2014, 51, 980–988. [Google Scholar] [CrossRef]
- Diaz, J.H. Chemical and plant-based insect repellents: Efficacy, safety, and toxicity. Wilderness Environ. Med. 2016, 27, 153–163. [Google Scholar] [CrossRef] [Green Version]
- McGovern, T.P.; Schreck, C.E.; Jackson, J. Mosquito repellents: Alicyclic amides as repellents for Aedes aegypti and Anopheles quadrimaculatus. Mosq. News 1978, 38, 346–349. [Google Scholar]
- Solberg, V.B.; Klein, T.A.; McPherson, K.R.; Bradford, B.A.; Burge, J.R.; Wirtz, R.A. Field evaluation of DEET and a piperidine repellent (Ai3-37220) against Amblyomma americanum (Acari: Ixodidae). J. Med. Entomol. 1995, 32, 870–875. [Google Scholar] [CrossRef]
- Debboun, M.; Strickman, D.; Solberg, V.B.; Wilkerson, R.C.; McPherson, K.R.; Golenda, C.; Keep, L.; Wirtz, R.A.; Burge, R.; Klein, T.A. Field evaluation of DEET and a piperidine repellent against Aedes communis (Diptera: Culicidae) and Simulium venustum (Diptera: Simuliidae) in the Adirondack Mountains of New York. J. Med. Entomol. 2000, 37, 919–923. [Google Scholar] [CrossRef] [Green Version]
- Klun, J.A.; Schmidt, W.F.; Debboun, M. Stereochemical effects in an insect repellent. J. Med. Entomol. 2001, 38, 809–812. [Google Scholar] [CrossRef] [PubMed] [Green Version]
- Klun, J.A.; Khrimian, A.; Margaryan, A.; Kramer, M.; Debboun, M. Synthesis and repellent efficacy of a new chiral piperidine analog: Comparison with DEET and Bayrepel activity in human-volunteer laboratory assays against Aedes aegypti and Anopheles stephensi. J. Med. Entomol. 2003, 40, 293–299. [Google Scholar] [CrossRef] [PubMed] [Green Version]
- Schreck, C.E.; Fish, D.; McGovern, T.P. Activity of repellents applied to skin for protection against Amblyomma americanum and Ixodes scapularis ticks (Acari: Ixodidae). J. Am. Mosq. Control. Assoc. 1995, 11, 136–140. [Google Scholar] [PubMed]
- Klun, J.A.; Schmidt, W.F. Methods and Compositions for Repelling Arthropods. Patent 2003 No. US 6,562,841 B1, 13 May 2003. [Google Scholar]
- Yang, L.; Liu, Y.; Bernier, U.; Tsikolia, M.; Linthicum, K.; Bloomquist, J. Vapor Phase Repellents: New Methods, Chemistry, and Mechanisms of Action; National Meeting of the American Chemical Society: Boston, MA, USA, 2018. [Google Scholar]
- Larson, N.R.; Anderson, T.D. Video tracking protocol to screen deterrent chemistries for honey bees. JoVE 2017, 124, e55603. [Google Scholar] [CrossRef] [PubMed]
- Wilson, J.M.; Anderson, T.D.; Kuhar, T.P. Sublethal effects of the insecticide pyrifluquinazon on the European honey bee (Hymenoptera: Apidae). J. Econ. Entomol. 2019, 112, 1050–1054. [Google Scholar] [CrossRef] [PubMed]
- Tangtrakulwanich, K.; Chen, H.; Baxendale, F.; Brewer, G.; Zhu, J.J. Characterization of olfactory sensilla of Stomoxys calcitrans and electrophysiological responses to odorant compounds associated with hosts and oviposition media. Med. Vet. Entomol. 2011, 25, 327–336. [Google Scholar] [CrossRef] [Green Version]
- Larson, N.R.; O’Neal, S.T.; Bernier, U.R.; Bloomquist, J.R.; Anderson, T.D. Terpenoid-induced feeding deterrence and antennal response of honey bees. Insects 2020, 11, 83. [Google Scholar] [CrossRef] [Green Version]
- Free, J.B.; Pickett, J.A.; Ferguson, A.W.; Simpkins, J.R.; Smith, M.C. Repelling foraging honeybees with alarm pheromones. J. Agric. Sci. 1985, 105, 255–260. [Google Scholar] [CrossRef]
- Collins, A.M.; Rubink, W.L.; Cuadriello Aguilar, J.I.; Hellmich, R.L. Use of insect repellents for dispersing defending honey bees (Hymenoptera: Apidae). J. Econ. Entomol. 1996, 89, 608–613. [Google Scholar] [CrossRef] [Green Version]
- Das, S. Screening of bioactive compounds for development of new pesticides: A mini review. Univers. J. Agric. Res. 2016, 4, 15–20. [Google Scholar] [CrossRef]
- Carroll, J.F.; Benante, J.P.; Klun, J.A.; White, C.E.; Debboun, M.; Pound, J.M.; Dheranetra, W. Twelve-hour duration testing of cream formulations of three repellents against Amblyomma americanum. Med. Vet. Entomol. 2008, 22, 144–151. [Google Scholar] [CrossRef]
- Singh, N.K.; Eliash, N.; Kamer, Y.; Zaidman, I.; Plettner, E.; Soroker, V. The effect of DEET on chemosensing of the honey bee and its parasite Varroa destructor. Apidologie 2015, 46, 380–391. [Google Scholar] [CrossRef]
- Bernier, U.R.; Furman, K.D.; Kline, D.L.; Allan, S.A.; Barnard, D.R. Comparison of contact and spatial repellency of catnip oil and N,N-diethyl-3-methylbenzamide (deet) against mosquitoes. J. Med. Entomol. 2005, 42, 306–311. [Google Scholar]
- Abramson, C.I.; Giray, T.; Mixson, T.A.; Nolf, S.L.; Wells, H.; Kence, A.; Kence, M. Proboscis conditioning experiments with honeybees, Apis mellifera caucasica, with butyric acid and DEET mixture as conditioned and unconditioned stimuli. J. Insect Sci. 2010, 10, 122. [Google Scholar] [CrossRef]
- De Brito Sanchez, M.G.; Lorenzo, E.; Su, S.; Liu, F.; Zhan, Y.; Giurfa, M. The tarsal taste of honey bees: Behavioral and electrophysiological analyses. Front. Behav. Neurosci. 2014, 8, 1–16. [Google Scholar] [CrossRef] [Green Version]
- Sanford, J.L.; Shields, V.D.C.; Dickens, J.C. Gustatory receptor neuron responds to DEET and other insect repellents in the yellow-fever mosquito, Aedes aegypti. Naturwissenschaften 2013, 100, 269–273. [Google Scholar] [CrossRef]
- Sparks, J.T.; Dickens, J.C. Bitter-sensitive gustatory receptor neuron responds to chemically diverse insect repellents in the common malaria mosquito Anopheles quadrimaculatus. Sci. Nat. 2016, 103, 39. [Google Scholar] [CrossRef]
- Dethier, V.G.; Browne, B.L.; Smith, C.N. The designation of chemicals in terms of the responses they elicit from insects. J. Econ. Entomol. 1960, 53, 134–136. [Google Scholar] [CrossRef]
- Bernier, U.; Kline, D.; Posey, K.H. Human emanations and related natural compounds that inhibit mosquito host-finding abilities. In Insect Repellents: Principles, Methods and Uses; Mustapha Debboun, S.F., Strickman, D., Eds.; CRC Press: Boca Raton, FL, USA, 2006. [Google Scholar]
- Robertson, H.M.; Wanner, K.W. The chemoreceptor superfamily in the honey bee, Apis mellifera: Expansion of the odorant, but not gustatory, receptor family. Genome Res. 2006, 16, 1395–1403. [Google Scholar] [CrossRef] [Green Version]
- Dunipace, L.; Meister, S.; McNealy, C.; Amrein, H. Spatially restricted expression of candidate taste receptors in the Drosophila gustatory system. Curr. Biol. 2001, 11, 822–835. [Google Scholar] [CrossRef] [Green Version]
- Scott, K.; Brady, R., Jr.; Cravchik, A.; Morozov, P.; Rzhetsky, A.; Zuker, C.; Axel, R. A chemosensory gene family encoding candidate gustatory and olfactory receptors in Drosophila. Cell 2001, 104, 661–673. [Google Scholar] [CrossRef]


Publisher’s Note: MDPI stays neutral with regard to jurisdictional claims in published maps and institutional affiliations. |
© 2021 by the authors. Licensee MDPI, Basel, Switzerland. This article is an open access article distributed under the terms and conditions of the Creative Commons Attribution (CC BY) license (http://creativecommons.org/licenses/by/4.0/).
Share and Cite
Larson, N.R.; O’Neal, S.T.; Kuhar, T.P.; Bernier, U.R.; Bloomquist, J.R.; Anderson, T.D. Heterocyclic Amine-Induced Feeding Deterrence and Antennal Response of Honey Bees. Insects 2021, 12, 69. https://0-doi-org.brum.beds.ac.uk/10.3390/insects12010069
Larson NR, O’Neal ST, Kuhar TP, Bernier UR, Bloomquist JR, Anderson TD. Heterocyclic Amine-Induced Feeding Deterrence and Antennal Response of Honey Bees. Insects. 2021; 12(1):69. https://0-doi-org.brum.beds.ac.uk/10.3390/insects12010069
Chicago/Turabian StyleLarson, Nicholas R., Scott T. O’Neal, Thomas P. Kuhar, Ulrich R. Bernier, Jeffrey R. Bloomquist, and Troy D. Anderson. 2021. "Heterocyclic Amine-Induced Feeding Deterrence and Antennal Response of Honey Bees" Insects 12, no. 1: 69. https://0-doi-org.brum.beds.ac.uk/10.3390/insects12010069