
Mapping the Potential Distribution of Ticks in the Western Kanto Region, Japan: Predictions Based on Land-Use, Climate, and Wildlife


Abstract
:Simple Summary
Abstract
1. Introduction
2. Materials and Methods
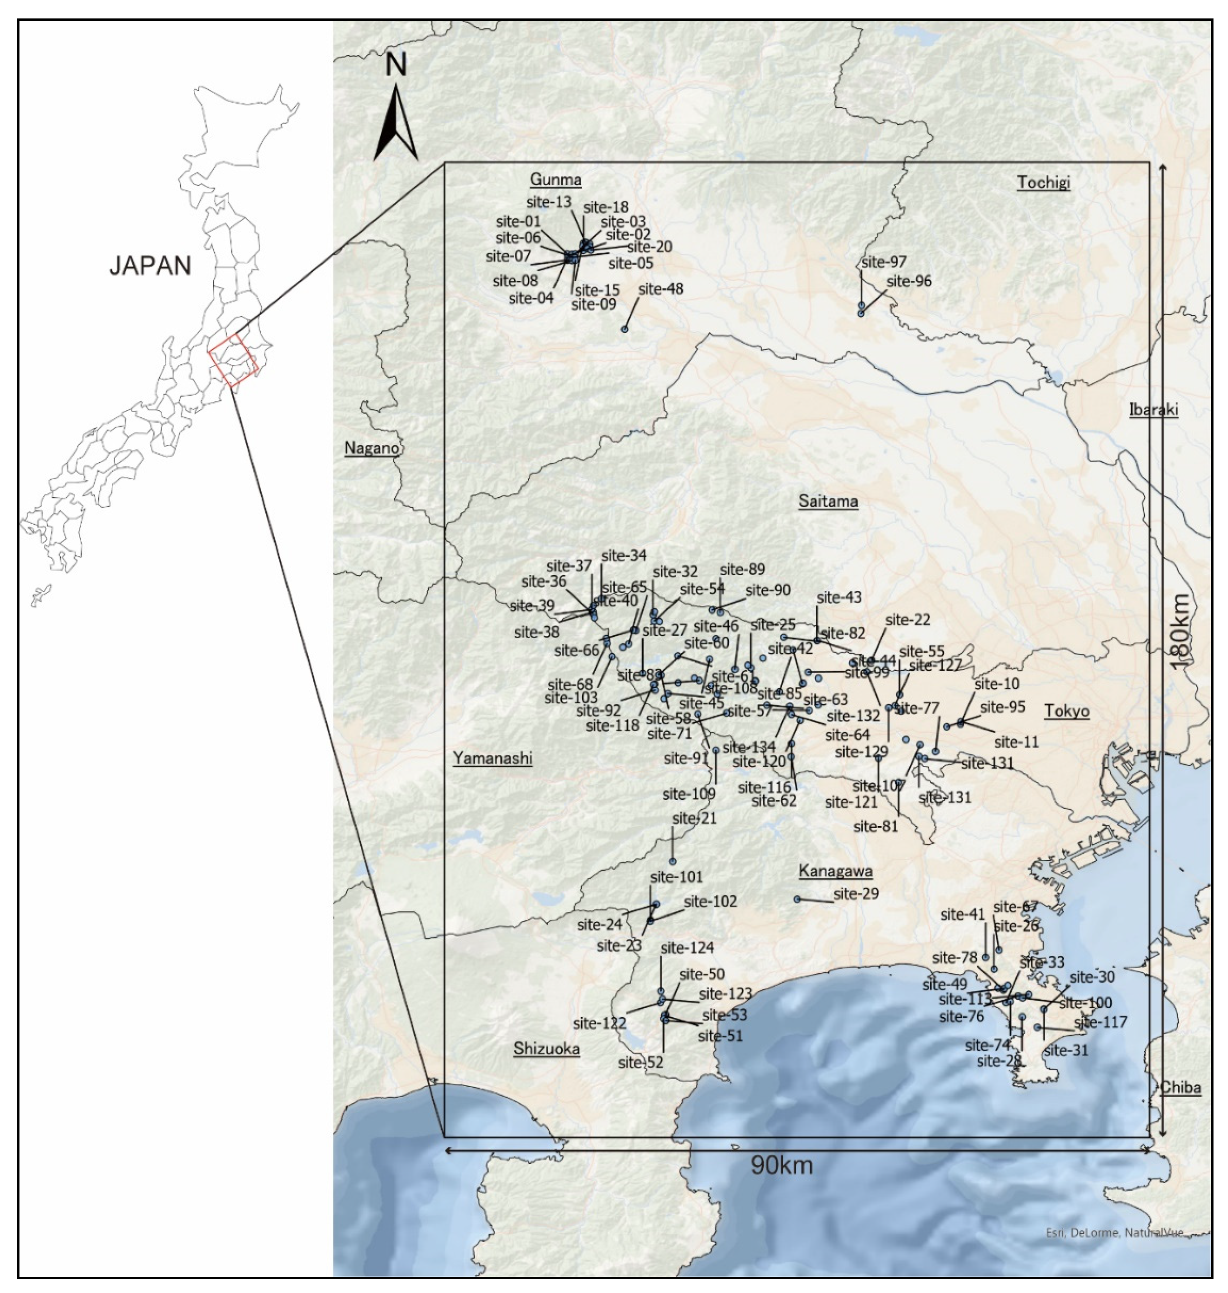
2.1. Study Area
2.2. Tick Survey
2.3. Land-Use Factors
2.4. Climatic Factors
2.5. Wildlife Factors
2.6. Tick Species Selection
2.7. Maximum Entropy (MaxEnt) Modeling
3. Results
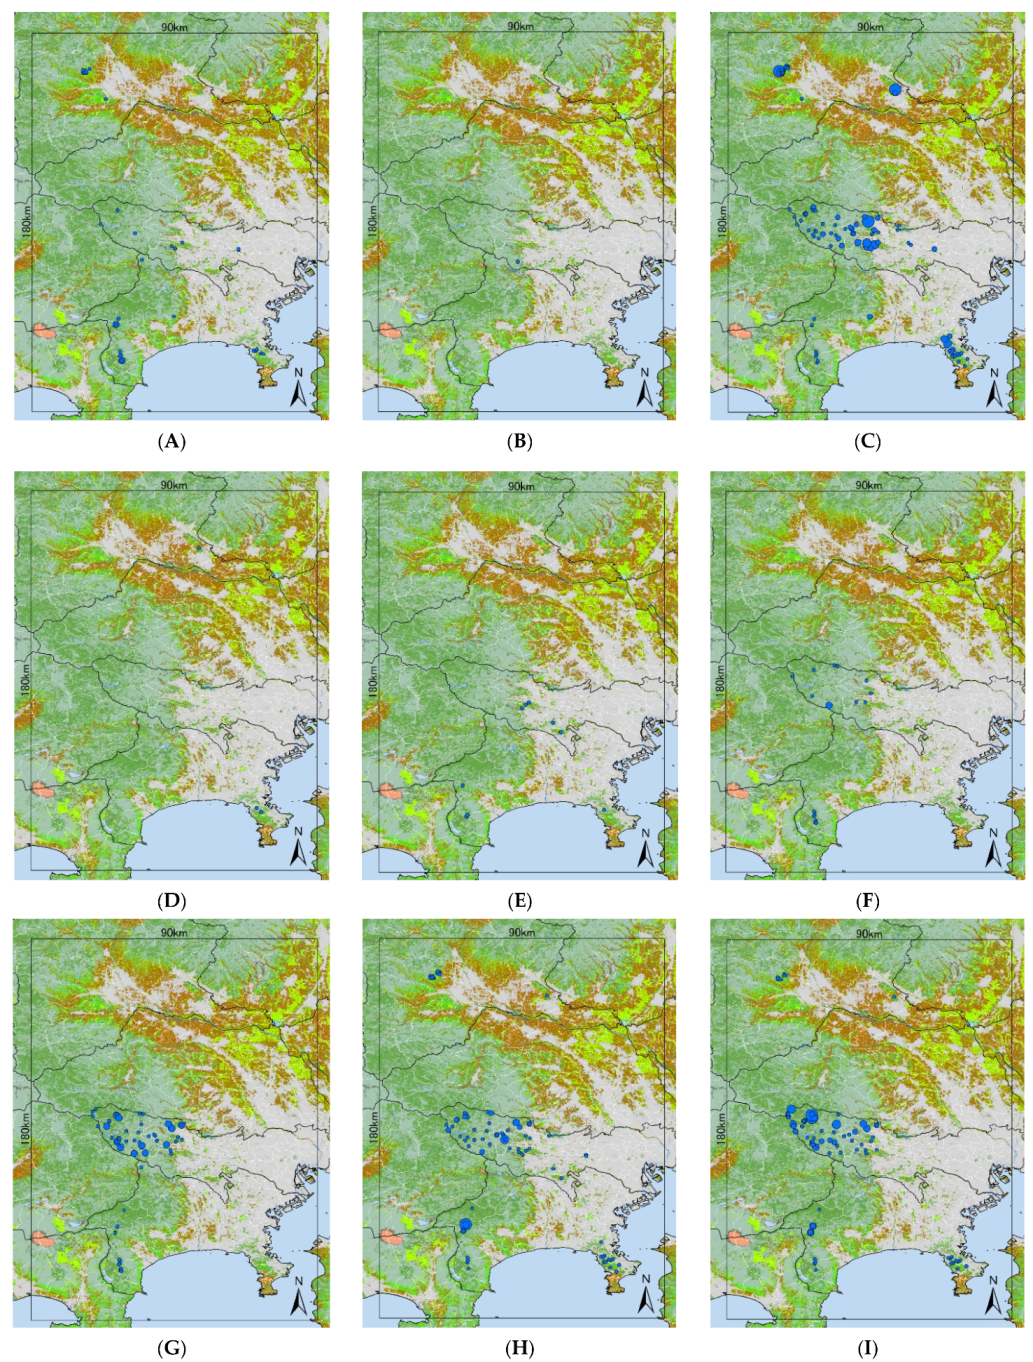
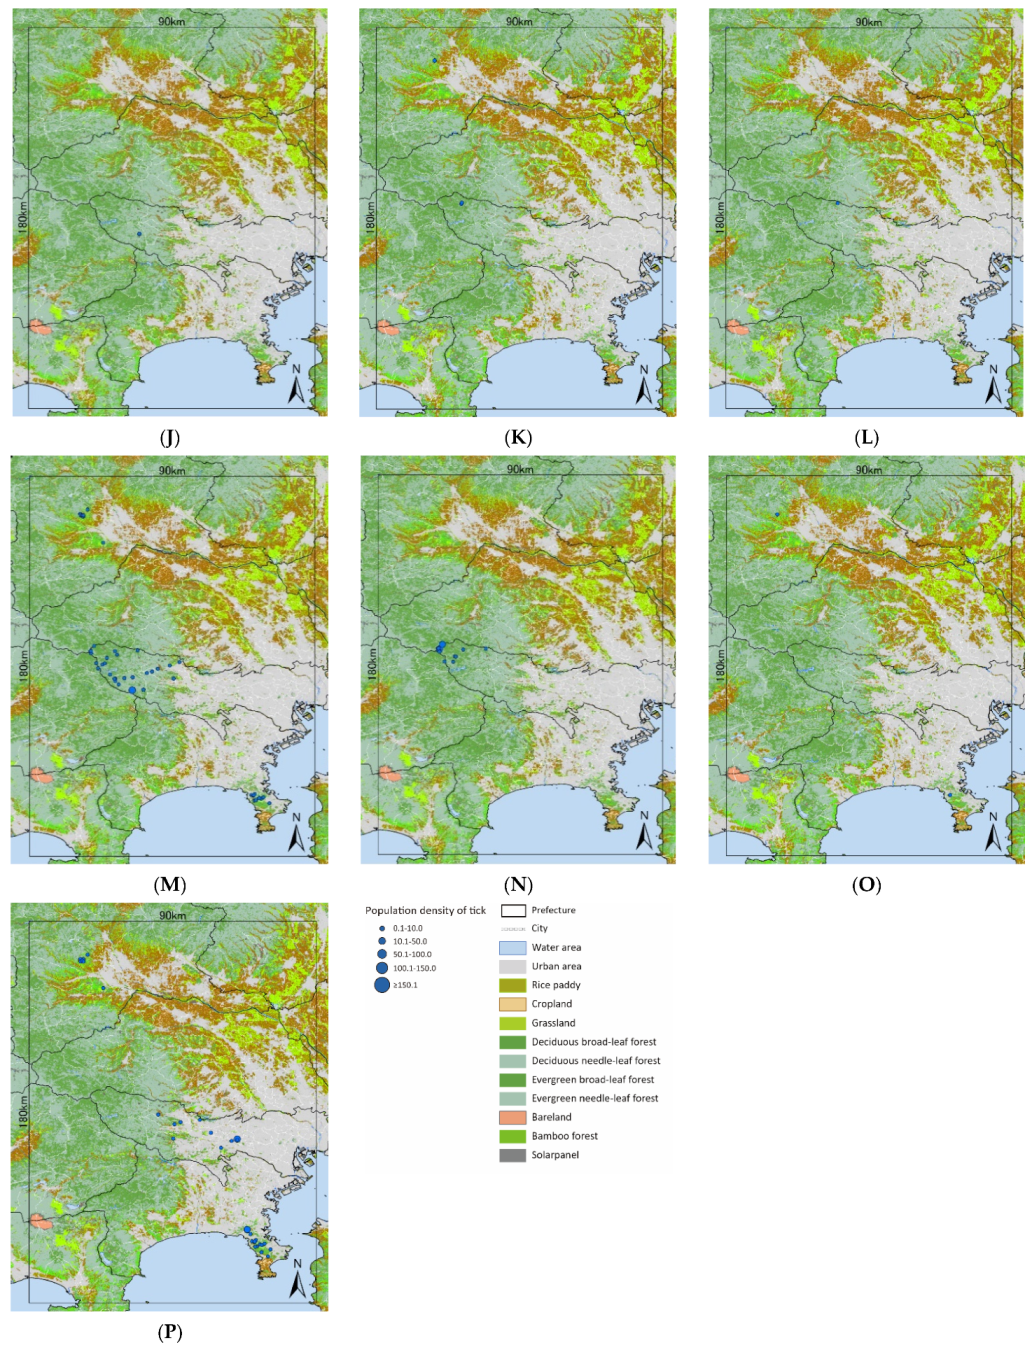
3.1. Tick Survey
3.2. MaxEnt Models
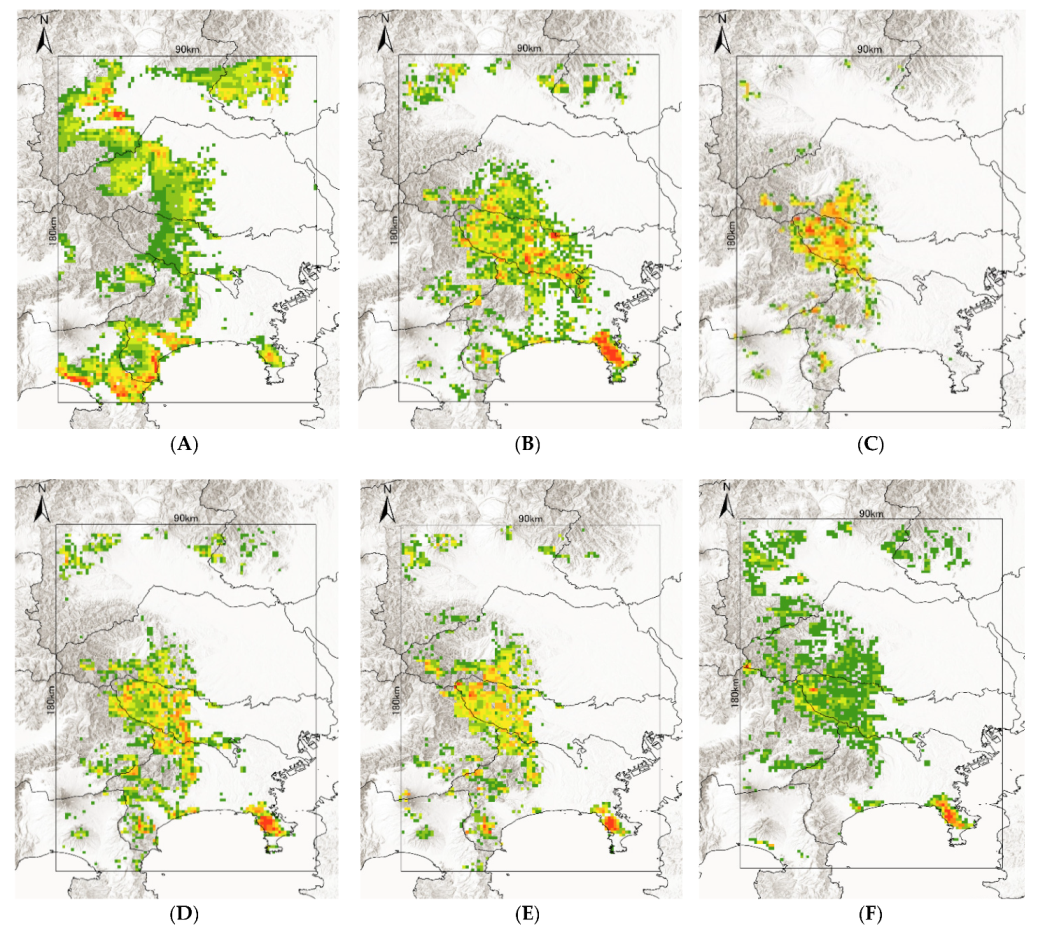
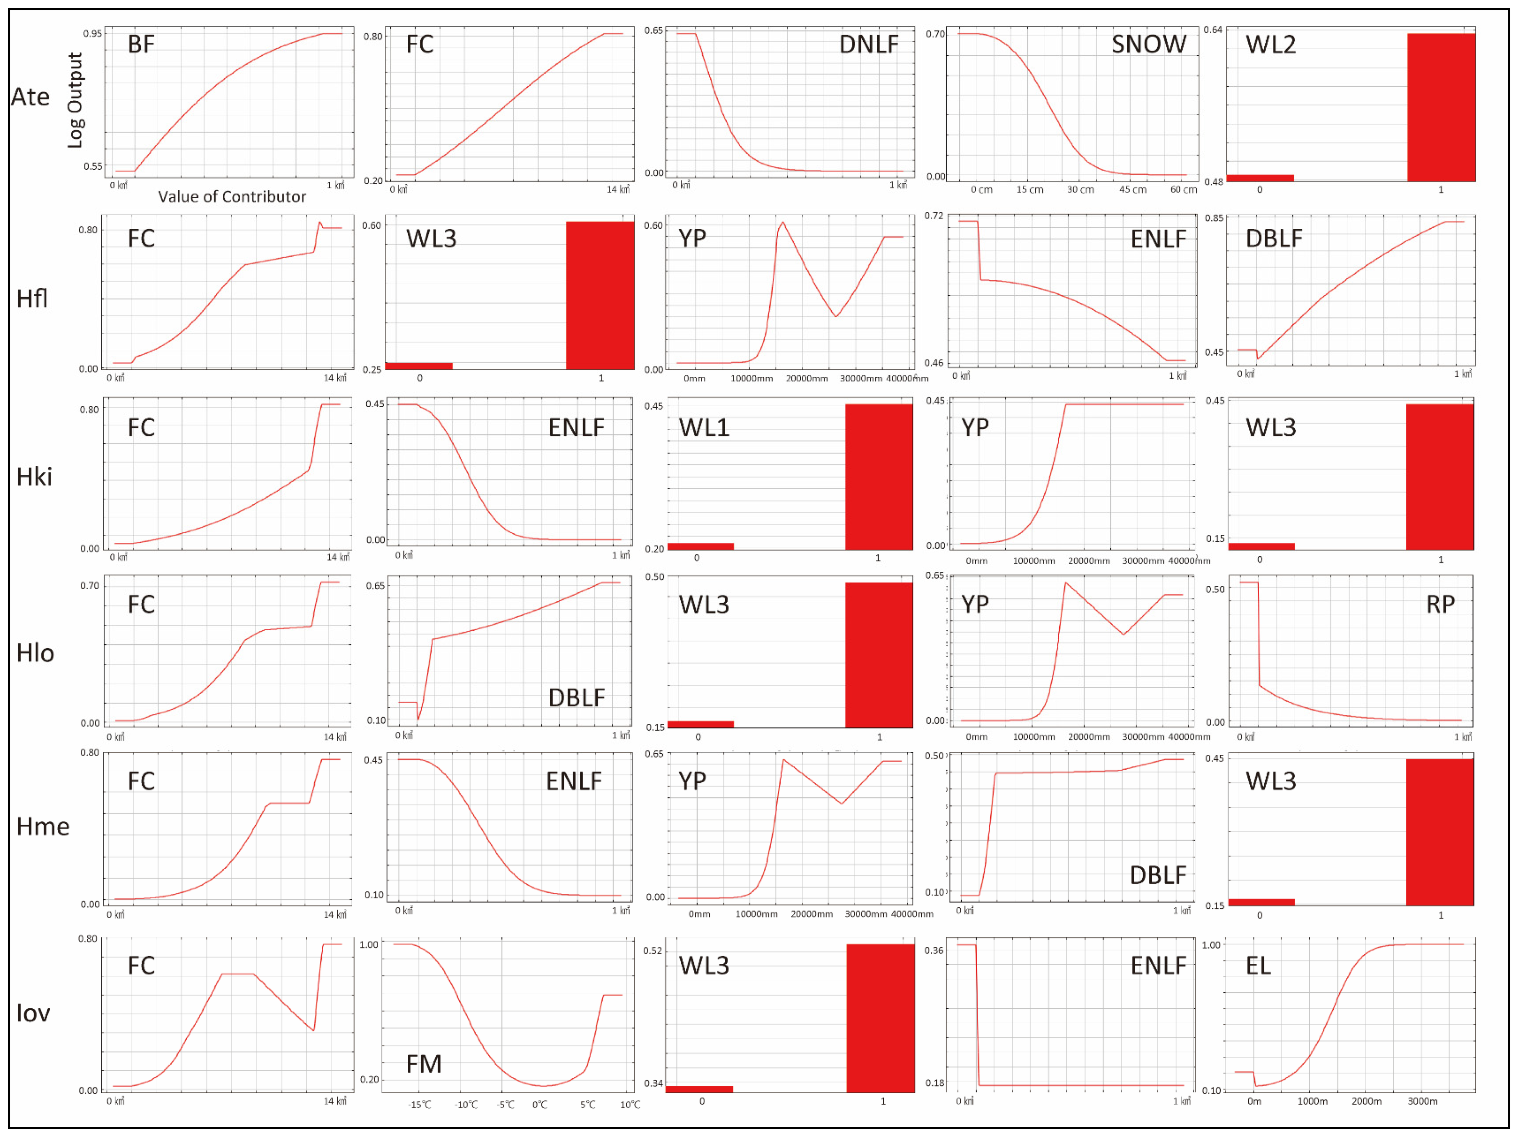
- A. testudinariumThe model performance for A. testudinarium was adequate (AUC = 7.00). The predicted distribution in Figure 3A indicated that suitable environments are spreading in the southwestern part of our study area, and a relatively lower suitability is shown at the base of the western mountainous area and in Tochigi Prefecture. The most important determinants of the A. testudinarium distribution were bamboo forest areas, forest connectivity, deciduous needle-leaf forest areas, snow depth, and wild boar distribution (Table 2). Collectively, the contribution of these variables to the model was 83.2%. The highest permutation importance was shown in the forest connectivity (PI = 46.3). Positive responses were observed for bamboo forest areas, forest connectivity, and wild boar distribution, while deciduous needle-leaf forest area and snow depth responded negatively for the habitat suitability of A. testudinarium (Figure 4).
- H. flavaThe model performance for H. flava was good (AUC = 0.84). Haemaphysalis flava has widespread suitable habitats in western Tokyo and Kanagawa Prefecture (Figure 3B). The most important variables for H. flava were forest connectivity, raccoon distribution, annual precipitation, evergreen needle-leaf forest areas, and deciduous broad-leaf areas. The tick distribution was positively influenced by forest continuity and raccoon distribution, and negatively influenced by evergreen needle-leaf forest areas and elevation. The response to annual precipitation was initially positive and then negative, which indicates that the habitat suitability increased with moderate precipitation (Figure 4). The cumulative contribution of these variables to the model was 73.2% (Table 2). The highest permutation importance was shown in forest connectivity (PI = 39.3).
- H. kitaokaiThe model performance for H. kitaokai was good (AUC = 0.88). Haemaphysalis kitaokai was predicted to be distributed in the mountainous areas of Tokyo metropolis, Kanagawa Prefecture, Saitama Prefecture, and Yamanashi Prefecture (Figure 3C). The most important variables for H. kitaokai were forest connectivity, evergreen needle-leaf forest areas, sika deer distribution, annual precipitation, and raccoon distribution. The highest permutation importance was shown in evergreen needle-leaf forest areas (PI = 21.8). The cumulative contribution of these variables was 86.7%. A negative response was only observed for evergreen needle-leaf forest areas, and the permutation impact for the model was the largest among the variables (PI = 21.8) (Table 2). Positive responses were observed for the other four variables. The cumulative contribution of these variables to the model was 73.4% (Figure 4).
- H. longicornisThe model performance for H. longicornis was adequate (AUC = 0.79). The predicted distribution of H. longicornis was similar to that of H. flava but was skewed toward mountainous areas (Figure 3D). The most important variables for H. longicornis were forest connectivity, deciduous broad-leaf forest areas, raccoon distribution, annual precipitation, and rice paddy field areas. These variables showed a cumulative contribution of 79.9%. The highest permutation importance was shown in forest connectivity (PI = 49.3). Forest connectivity had the highest permutation importance to the model (PI = 49.3) (Table 2). Positive responses were observed for forest connectivity and raccoon distribution. Negative responses were observed for rice paddy field areas, and the response to annual precipitation was initially positive and then peaked between 1500 mm and 2000 mm (Figure 4).
- H. megaspinosaThe model performance for H. megaspinosa was good (AUC = 0.83). The predicted distribution of H. megaspinosa was similar to the prediction for H. longicornis, but the suitable environment for H. megaspinosa included more mountainous areas (Figure 3E). The most important variables for H. megaspinosa were forest connectivity, evergreen needle-leaf forest areas, annual precipitation, deciduous broad-leaf forest areas, and raccoon distribution. The highest permutation importance for the model was forest connectivity (PI = 29.5) (Table 2). Forest connectivity, deciduous broad-leaf forest areas, and raccoon distribution showed positive responses. The response to annual precipitation was initially positive and then peaked between 1500 mm and 2000 mm. A negative response was observed for evergreen needle-leaf forest areas. The highest permutation importance was shown in forest connectivity (PI = 29.5), and the cumulative contribution of these variables was 82.1% (Table 2).
- I. ovatusThe model performance for I. ovatus was excellent (AUC = 0.91). The relatively low suitability for I. ovatus was shown in the western Tokyo metropolis, western Saitama Prefecture, and southwestern Gunma Prefecture, while high suitability was shown in Miura Peninsula and Kanagawa Prefecture (Figure 3F). The most important variables for I. ovatus were forest connectivity, mean temperature in February, raccoon distribution, evergreen needle-leaf forest areas, and elevation. Forest connectivity had the highest permutation importance among the variables (PI = 45.7), and the cumulative contribution of these variables was 84.0% (Table 2). Positive responses were observed for raccoon distribution and elevation. A negative response was obtained for mean temperature in February up until 5 °C, and rapid positive responses were observed between 5 °C and 10 °C. Forest connectivity between 6 km2 and 15 km2 showed peaks in the log output (Figure 4). The contribution of these variables was 84.0% for the model of suitable environments for I. ovatus (Table 2).
4. Discussion
5. Conclusions
Supplementary Materials
Author Contributions
Funding
Institutional Review Board Statement
Data Availability Statement
Acknowledgments
Conflicts of Interest
References
- McCoy, K.D.; Léger, E.; Dietrich, M. Host Specialization in Ticks and Transmission of Tick-Borne Diseases: A Review. Front. Cell. Infect. Microbiol. 2013, 3, 1–12. [Google Scholar] [CrossRef] [PubMed] [Green Version]
- Ito, S.; Jurado, C.; Bosch, J.; Ito, M.; Sánchez-Vizcaíno, J.M.; Isoda, N.; Sakoda, Y. Role of Wild Boar in the Spread of Classical Swine Fever in Japan. Pathogens 2019, 8, 206. [Google Scholar] [CrossRef] [Green Version]
- Gehrt, S.D.; Riley, S.P.D.; Cypher, B.L. Urban Carnivores -Ecology, Conflict, and Conservation; Ghert, S.D., Riley, S.P.D., Cypher, B.L., Eds.; The Johns Hopkins University Press: Baltimore, MD, USA, 2010; ISBN 978-0-8018-9386-6. [Google Scholar]
- Hayama, S. Wildlife Issues; Chijinshokan: Tokyo, Japan, 2001; pp. 11–38. ISBN 978-4-8052-0689-8. [Google Scholar]
- Cahill, S.; Llimona, F.; Gràcia, J. Spacing and Nocturnal Activity of Wild Boar Sus Scrofa in a Mediterranean Metropolitan Park. Wildl. Biol. 2003, 9, 3–13. [Google Scholar] [CrossRef]
- Hollis-Etter, K.M.; Anchor, C.L.; Chelsvig, J.E.; Dubey, J.P.; Warner, R.E. Suburban White-Tailed Deer Seropositive for Toxoplasma gondii from Chicago, Illinois. Parasitol. Res. 2019, 118, 2271–2276. [Google Scholar] [CrossRef] [PubMed]
- Jansen, A.; Luge, E.; Guerra, B.; Wittschen, P.; Gruber, A.D.; Loddenkemper, C.; Schneider, T.; Lierz, M.; Ehlert, D.; Appel, B.; et al. Leptospirosis in Urban Wild Boars, Berlin, Germany. Emerg. Infect. Dis. 2007, 13, 739–742. [Google Scholar] [CrossRef]
- Bradley, C.A.; Altizer, S. Urbanization and the Ecology of Wildlife Diseases. Trends Ecol. Evol. 2007, 22, 95–102. [Google Scholar] [CrossRef]
- Morimoto, Y. What Is Satoyama? Points for Discussion on Its Future Direction. Landsc. Ecol. Eng. 2011, 7, 163–171. [Google Scholar] [CrossRef]
- Torii, H. Paguma larvata (Smith, 1827). In The Wild Mammals of Japan; Ohdachi, S.D., Ishibashi, Y., Iwasa, M.A., Fukui, D., Saito, T., Eds.; Shoka-do: Kyoto, Japan, 2015; pp. 267–268. ISBN 978-4-87974-691-7. [Google Scholar]
- Castillo-Contreras, R.; Carvalho, J.; Serrano, E.; Mentaberre, G.; Fernández-Aguilar, X.; Colom, A.; González-Crespo, C.; Lavín, S.; López-Olvera, J.R. Urban Wild Boars Prefer Fragmented Areas with Food Resources near Natural Corridors. Sci. Total Environ. 2018, 615, 282–288. [Google Scholar] [CrossRef]
- Ohashi, H.; Hoshino, Y.; Oono, K. Long-Term Changes in the Species Composition of Plant Communities Caused by the Population Growth of Sika Deer (Cervus nippon) in Okutama, Tokyo. Veg. Sci. 2007, 24, 123–151. [Google Scholar]
- Yamaguti, N.; Tipton, V.J.; Keegan, H.L.; Toshioka, S. Ticks of Japan, Korea and the Ryukyu Islands. Brigh. Young Univ. Sci. Bull. Biol. Ser. 1971, 15, 1–226. [Google Scholar]
- Takada, N. A Pictorial Review of Medical Acarology; Kinpodo: Kyoto, Japan, 1990; ISBN 4-7653-0564-3. [Google Scholar]
- Fujimoto, K.; Yamaguchi, N.; Takahashi, M. Ixodid Ticks on Vegetations and Wild Animals at the Low Mountain Zone Lying South-Western Part of Saitama Prefecture. J. Med. Entomol. Zool. 1986, 37, 325–331. [Google Scholar] [CrossRef] [Green Version]
- National Institute of Infectious Diseases. Japanese spotted fever 1999–2019. Infect. Agents Surveill. Rep. 2020, 41, 133–135.
- Takada, N.; Fujita, H.; Takahashi, M.; Natsuaki, M. Guide Map for Distribution of Medical Acari. In Medical Acarology in Japan; Takada, N., Ed.; Hokuryukan: Tokyo, Japan, 2019; pp. 329–341. ISBN 978-4-8326-1053-8. [Google Scholar]
- Taira, M.; Oitate, N.; Nishijima, H.; Ohta, R.; Sato, S.; Takamatsu, Y.; Furukawa, T.; Kurosu, G.; Shimojima, M.; Saijo, M.; et al. A First Case of Severe Fever with Thrombocytopenia Syndrome in Kanto region. Infect. Agents Surveill. Rep. 2021, 42, 150–152. [Google Scholar]
- Phillips, S.J.; Anderson, R.P.; Schapire, R.E. Maximum Entropy Modeling of Species Geographic Distributions. Ecol. Model. 2006, 190, 231–259. [Google Scholar] [CrossRef] [Green Version]
- Yang, X.; Gao, Z.; Zhou, T.; Zhang, J.; Wang, L.; Xiao, L.; Wu, H.; Li, S. Mapping the Potential Distribution of Major Tick Species in China. Int. J. Environ. Res. Public Health 2020, 17, 5145. [Google Scholar] [CrossRef]
- Du, Z.; Wang, Z.; Liu, Y.; Wang, H.; Xue, F.; Liu, Y. Ecological Niche Modeling for Predicting the Potential Risk Areas of Severe Fever with Thrombocytopenia Syndrome. Int. J. Infect. Dis. 2014, 26, 1–8. [Google Scholar] [CrossRef] [PubMed] [Green Version]
- Verburg, P.H.; Neumann, K.; Nol, L. Challenges in Using Land Use and Land Cover Data for Global Change Studies. Glob. Chang. Biol. 2011, 17, 974–989. [Google Scholar] [CrossRef] [Green Version]
- Porretta, D.; Mastrantonio, V.; Amendolia, S.; Gaiarsa, S.; Epis, S.; Genchi, C.; Bandi, C.; Otranto, D.; Urbanelli, S. Effects of Global Changes on the Climatic Niche of the Tick Ixodes ricinus Inferred by Species Distribution Modelling. Parasites Vectors 2013, 6, 974–989. [Google Scholar] [CrossRef] [PubMed] [Green Version]
- Randolph, S.E. Climate, Satellite Imagery and the Seasonal Abundance of the Tick Rhipicephalus appendiculatus In Southern Africa: A New Perspective. Med. Vet. Entomol. 1993, 7, 243–258. [Google Scholar] [CrossRef] [PubMed]
- Kuris, A.M.; Blaustein, A.R.; Alio, J.J. Hosts as Islands. Am. Nat. 1980, 116, 570–586. [Google Scholar] [CrossRef]
- Yamauchi, T.; Takada, A. Illustrations of Common Adult Ticks in the Mainland Japan. Bull. Hoshizaki Green Fund. 2015, 18, 287–305. [Google Scholar]
- Fujita, H.; Takada, N. Identification of Immature Ticks in Japan. In Acari and Emerging/Reemerging Infectious Diseases; Organizing Committee of SADI, Ed.; Zenkoku Nouson Kenkyukai Publishing: Tokyo, Japan, 2007; pp. 53–68. ISBN 978-4-8813-7127-5. [Google Scholar]
- Esri ArcGIS Pro Ver. 2.5. 2020.
- Lane, R.S.; Mun, J.; Stubbs, H.A. Horizontal and Vertical Movements of Host-Seeking Ixodes pacificus (Acari: Ixodidae) Nymphs in a Hardwood Forest. J. Vector Ecol. 2009, 34, 252–266. [Google Scholar] [CrossRef] [PubMed]
- Japan Aerospace Exploration Agency High Resolution Land Use Land Cover Map Ver. 21.03. Available online: https://www.eorc.jaxa.jp/ALOS/en/lulc/lulc_index_v2103.htm (accessed on 5 December 2021).
- Beier, P.; Noss, R.F. Do Habitat Corridors Provide Connectivity? Conserv. Biol. 1998, 12, 1241–1252. [Google Scholar] [CrossRef]
- Randolph, S.E. Tick Ecology: Processes and Patterns behind the Epidemiological Risk Posed by Ixodid Ticks as Vectors. Parasitology 2004, 129, S37–S65. [Google Scholar] [CrossRef] [PubMed]
- Randolph, S.E. Population Dynamics and Density-dependent Seasonal Mortality Indices of the Tick Rhipicephalus appendiculatus in Eastern and Southern Africa. Med. Vet. Entomol. 1994, 8, 351–368. [Google Scholar] [CrossRef] [PubMed]
- National Spatial Planning and Regional Policy Bureau National Land Numerical Data. Available online: https://nlftp.mlit.go.jp/ksj/gml/datalist/KsjTmplt-G02.html (accessed on 18 June 2021).
- Ministry of the Environment of Japan. The National Survey on the Natural Environment: Report of the Distributional Survey of Japanese Animals (Mammals). 2004. Available online: http://www.biodic.go.jp/ne_research_e.html (accessed on 5 December 2021).
- Kanagawa Prefecture. Third Kanagawa Prefecture Raccoon Control Implementation Plan. 2016. Available online: https://www.pref.kanagawa.jp/documents/15083/202104dai3jiaraigumaboujokeikaku.pdf (accessed on 5 December 2021).
- Kanagawa Prefecture. Wild Boar Control Plan of Kanagawa Prefecture. 2018. Available online: http://www.pref.kanagawa.jp/documents/40204/inosisi-keikaku.pdf (accessed on 5 December 2021).
- Merow, C.; Smith, M.J.; Silander, J.A.; Merow, C.; Silander, J.A. A Practical Guide to MaxEnt for Modeling Species’ Distributions: What It Does, and Why Inputs and Settings Matter. Ecography 2013, 36, 1–12. [Google Scholar] [CrossRef]
- Feng, X.; Park, D.S.; Liang, Y.; Pandey, R.; Papeş, M. Collinearity in Ecological Niche Modeling: Confusions and Challenges. Ecol. Evol. 2019, 9, 10365. [Google Scholar] [CrossRef] [PubMed] [Green Version]
- Liu, C.; Berry, P.M.; Dawson, T.P.; Pearson, R.G. Selecting Thresholds of Occurrence in the Prediction of Species Distributions. Ecography 2005, 28, 385–393. [Google Scholar] [CrossRef]
- Yamauchi, T. A Bibliographical Survey of Host–parasite Relationships between Birds and Ticks from Japan. Bull. Hoshizaki Found. 2001, 5, 271–308. [Google Scholar]
- Inokuma, H.; Oonishi, T. Ixodid Ticks in Dogs during Hunting Season in Japan. J. Jpn. Vet. Med. Assoc. 1995, 48, 786–789. [Google Scholar] [CrossRef] [Green Version]
- Takada, N.; Natsuaki, Y.; Fujita, H.I.V. Vector tick. In Medical Acarology in Japan; Takada, N., Ed.; Hokuryukan: Tokyo, Japan, 2019; pp. 200–249. ISBN 978-4-8326-1053-8. [Google Scholar]
- Apanaskevich, M.A.; Apanaskevich, D.A. Reinstatement of Dermacentor bellulus (Acari: Ixodidae) as a valid species previously confused with D. taiwanensis and comparison of all parasitic stages. J. Med. Entomol. 2015, 52, 573–595. [Google Scholar] [CrossRef] [Green Version]
- Rochlin, I. Modeling the Asian Longhorned Tick (Acari: Ixodidae) Suitable Habitat in North America. J. Med. Entomol. 2018, 56, 384–391. [Google Scholar] [CrossRef] [PubMed]
- Pascoe, E.L.; Marcantonio, M.; Caminade, C.; Foley, J.E. Modeling Potential Habitat for Amblyomma Tick Species in California. Insects 2019, 10, 201. [Google Scholar] [CrossRef] [PubMed] [Green Version]
- Takada, A. Survey of Ixodid Ticks on Wild Animals in Shizuoka Prefecture, Japan. Bull. Mus. Nat. Environ. Hist. Shizuoka 2017, 10, 1–13. [Google Scholar]
- Ochi, J. Utilization of Abundoned Bamboo Forest and Managed Bamboo Forest by Wild Animals. Bull. Yamanashi For. Res. Inst. 2020, 39, 9–14. [Google Scholar]
- Yamaguchi, N.; Kitaoka, S. Ixodidae. In Acari of Japan; Ebara, S., Ed.; Zenkoku Nouson Kenkyukai Publishing: Tokyo, Japan, 1980; pp. 145–161. ISBN 978-4-8813-7010-0. [Google Scholar]
- Yamauchi, T.; Yano, S.; Yamamoto, T.; Yamamoto, E.; Miyamoto, T.; Yano, S.; Yamamoto, T.; Yamamoto, E.; Miyamoto, T. Ticks (Acari: Ixodidae) from Medium-Sized to Large Mammals in Ehime Prefecture, Japan. Exp. Appl. Acarol. 2013, 60, 263–270. [Google Scholar] [CrossRef] [PubMed]
- Doi, K.; Kono, M.; Kato, T.; Hayama, S. Ecological Traps and Boosters of Ixodid Ticks: The Differing Ecological Roles of Two Sympatric Introduced Mammals. Ticks Tick-Borne Dis. 2021, 12, 101687. [Google Scholar] [CrossRef] [PubMed]
- Takada, A. Ticks on Raccoon-Dogs, Eurasian Badgers, Masked Palm Civets in Shizuoka City. Nat. Hist. Tokai Dist. 2016, 9, 25–29. [Google Scholar]
- Guglielmone, A.A.; Robbins, R.G.; Apanaskevich, D.A.; Petney, T.N.; Estrada-Peña, A.; Horak, I.G. Hard Ticks The World; Springer: Dordrecht, The Netherlands, 2014; ISBN 978-94-007-7496-4. [Google Scholar]
- Doi, K.; Kato, T.; Hayama, S. Infestation of Introduced Raccoons (Procyon lotor) with Indigenous Ixodid Ticks on the Miura Peninsula, Kanagawa Prefecture, Japan. Int. J. Parasitol. Parasites Wildl. 2018, 7, 355–359. [Google Scholar] [CrossRef]
- Yoshizaki, M.; Hoshino, Y.; Ohshiman, N.; Ohashi, H. Changes in Species Composition of Wetland Plant Communities over 50 Years in Relation to Sika Deer Population in the Ozegahara Moor. Veg. Sci. 2021, 38, 95–117. [Google Scholar] [CrossRef]
- Tsunoda, T.; Tatsuzawa, S. Questing Height of Nymphs of the Bush Tick, Haemaphysalis longicornis, and Its Closely Related Species, H. mageshimaensis: Correlation with Body Size of the Host. Parasitology 2004, 128, 503–509. [Google Scholar] [CrossRef]
- Tsukada, H.; Nakamura, Y.; Kamio, T.; Inokuma, H.; Hanafusa, Y.; Matsuda, N.; Maruyama, T.; Ohba, T.; Nagata, K. Higher Sika Deer Density Is Associated with Higher Local Abundance of Haemaphysalis longicornis Nymphs and Adults but Not Larvae in Central Japan. Bull. Entomol. Res. 2012, 104, 19–28. [Google Scholar] [CrossRef] [PubMed]
- Weiler, M.; Duscher, G.G.; Wetscher, M.; Walochnik, J. Tick Abundance: A One Year Study on the Impact of Flood Events along the Banks of the River Danube, Austria. Exp. Appl. Acarol. 2017, 71, 151–157. [Google Scholar] [CrossRef] [PubMed] [Green Version]
- Ootake, H.; Ito, I.; Hayashi, K. Relationship between Population Density of the Tick, H. longicornis, and Environmental Factors in the Permanent Pasture. 1. Ixodid Fauna and Seasonal Fluctuation of the Tick in Kawatabi. Jpn. Soc. Grassl. Sci. 1985, 30, 452–457. [Google Scholar]
- Heath, A.C.G. Implications for New Zealand of Potentially Invasive Ticks Sympatric with Haemaphysalis longicornis Neumann, 1901 (Acari: Ixodidae). Syst. Appl. Acarol. 2013, 18, 1–26. [Google Scholar] [CrossRef]
- Matsuyama, H.; Agetsuma, N.; Okada, A.; Suzuki, M. The Effect of Deer Exclusion on Tick Abundance in Japan: The Verification Based on Field Experiment for Controlling Deer Density. Med. Entomol. Zool. 2019, 70, 153–158. [Google Scholar] [CrossRef]
- Okabe, F.; Agetsuma, N. Habitat Use by Introduced Raccoons and Native Raccoon Dogs in a Deciduous Forest of Japan. J. Mammal. 2007, 88, 1090–1097. [Google Scholar] [CrossRef]
- Duscher, T.; Hodžić, A.; Glawischnig, W.; Duscher, G.G. The Raccoon Dog (Nyctereutes procyonoides) and the Raccoon (Procyon lotor)—Their Role and Impact of Maintaining and Transmitting Zoonotic Diseases in Austria, Central Europe. Parasitol. Res. 2017, 116, 1411–1416. [Google Scholar] [CrossRef] [Green Version]
- Fish, D.; Dowler, R.C. Host Associations of Ticks (Acari: Ixodidae) Parasitizing Medium-Sized Mammals in a Lyme Disease Endemic Area of Southern New York. J. Med. Entomol. 1989, 26, 200–209. [Google Scholar] [CrossRef]
- Berrada, Z.L.; Goethert, H.K.; Telford, S.R. Raccoons and Skunks as Sentinels for Enzootic Tularemia. Emerg. Infect. Dis. 2006, 12, 1019–1021. [Google Scholar] [CrossRef]
- Prange, S.; Gehrt, S.D.; Wiggers, E.P. Influences of anthropogenic resources on raccoon (Procyon lotor) movements and spatial distribution. J. Mammal. 2004, 85, 483–490. [Google Scholar] [CrossRef]


| Code | Variable | Data Type | Unit | Range |
|---|---|---|---|---|
| UR | Urban area | Area-Continuous | km2 | 0.0–1.0 |
| RP | Rice paddy area | Area-Continuous | km2 | 0.0–1.0 |
| CL | Cropland area | Area-Continuous | km2 | 0.0–1.0 |
| AL | Agricultural land area | Area-Continuous | km2 | 0.0–1.0 |
| GL | Grassland area | Area-Continuous | km2 | 0.0–1.0 |
| DBLF | Deciduous broadleaf forest area | Area-Continuous | km2 | 0.0–1.0 |
| DNLF | Deciduous needleleaf forest area | Area-Continuous | km2 | 0.0–1.0 |
| EBLF | Evergreen broadleaf forest area | Area-Continuous | km2 | 0.0–1.0 |
| ENLF | Evergreen needleleaf forest area | Area-Continuous | km2 | 0.0–1.0 |
| BF | Bamboo forest area | Area-Continuous | km2 | 0.0–1.0 |
| FA | Forest area | Area-Continuous | km2 | 0.0–1.0 |
| BL | Bare land area | Area-Continuous | km2 | 0.0–1.0 |
| SP | Solar panel area | Area-Continuous | km2 | 0.0–1.0 |
| WA | Water area | Area-Continuous | km2 | 0.0–1.0 |
| FC | Forest connectivity | Area-Continuous | km2 | −1.0–12.7 |
| FM | Mean temperature in February | Temperature-Continuous | °C | −20.0–10.0 |
| AM | Mean temperature in August | Temperature-Continuous | °C | 10.0–30.0 |
| YP | Annual precipitation | Precipitation-Continuous | mm | 0–40,000 |
| JP | Rain season (June) precipitation | Precipitation-Continuous | mm | 0–40,000 |
| SNOW | Snow depth | Depth-Continuous | mm | 0–60 |
| EL | Elevation | Height-Continuous | m | 0–3776 |
| WL1 | Sika deer distribution | Present/Absent-Categorical | present (1)/absent (0) | 0/1 |
| WL2 | Wild boar distribution | Present/Absent-Categorical | present (1)/absent (0) | 0/1 |
| WL3 | Raccoon distribution | Present/Absent-Categorical | present (1)/absent (0) | 0/1 |
| WL4 | Raccoon dog distribution | Present/Absent-Categorical | present (1)/absent (0) | 0/1 |
| WL5 | Masked palm civet distribution | Present/Absent-Categorical | present (1)/absent (0) | 0/1 |
| A. testudinarium | H. flava | H. kitaokai | H. longicornis | H. megaspinosa | I. ovatus | ||||||||||||
|---|---|---|---|---|---|---|---|---|---|---|---|---|---|---|---|---|---|
| AUC = 0.70 | AUC = 0.84 | AUC = 0.88 | AUC = 0.79 | AUC = 0.83 | AUC = 0.91 | ||||||||||||
| SD = 0.15 | SD = 0.03 | SD = 0.04 | SD = 0.06 | SD = 0.06 | SD = 0.03 | ||||||||||||
| Threshold = 0.37 | Threshold = 0.26 | Threshold = 0.37 | Threshold = 0.32 | Threshold = 0.30 | Threshold = 0.36 | ||||||||||||
| Variable | %Cont | PI | Variable | %Cont | PI | Variable | %Cont | PI | Variable | %Cont | PI | Variable | %Cont | PI | Variable | %Cont | PI |
| BF | 37.6 | 2.1 | FC | 27.6 | 39.3 | FC | 48.4 | 17.9 | FC | 31.0 | 49.3 | FC | 40.2 | 29.5 | FC | 50.7 | 45.7 |
| FC | 12.7 | 46.3 | WL3 | 15.2 | 7.7 | ENLF | 17.3 | 21.8 | DBLF | 14.8 | 10.3 | ENLF | 16.0 | 16.8 | FM | 11.2 | 2.9 |
| DNLF | 12.1 | 1.2 | YP | 14.1 | 14.0 | WL1 | 9.7 | 3.9 | WL3 | 12.8 | 9.8 | YP | 10.0 | 4.9 | WL3 | 10.3 | 11.1 |
| SNOW | 10.5 | 25.3 | ENLF | 9.9 | 2.5 | YP | 7.2 | 4.5 | YP | 11.4 | 4.6 | DBLF | 8.2 | 9.2 | ENLF | 8.3 | 2.4 |
| WL2 | 10.3 | 2.0 | DBLF | 7.8 | 5.6 | WL3 | 4.1 | 2.1 | RP | 9.9 | 1.0 | WL3 | 7.7 | 5.8 | EL | 3.5 | 9.6 |
Publisher’s Note: MDPI stays neutral with regard to jurisdictional claims in published maps and institutional affiliations. |
© 2021 by the authors. Licensee MDPI, Basel, Switzerland. This article is an open access article distributed under the terms and conditions of the Creative Commons Attribution (CC BY) license (https://creativecommons.org/licenses/by/4.0/).
Share and Cite
Doi, K.; Kato, T.; Tabata, I.; Hayama, S.-i. Mapping the Potential Distribution of Ticks in the Western Kanto Region, Japan: Predictions Based on Land-Use, Climate, and Wildlife. Insects 2021, 12, 1095. https://0-doi-org.brum.beds.ac.uk/10.3390/insects12121095
Doi K, Kato T, Tabata I, Hayama S-i. Mapping the Potential Distribution of Ticks in the Western Kanto Region, Japan: Predictions Based on Land-Use, Climate, and Wildlife. Insects. 2021; 12(12):1095. https://0-doi-org.brum.beds.ac.uk/10.3390/insects12121095
Chicago/Turabian StyleDoi, Kandai, Takuya Kato, Iori Tabata, and Shin-ichi Hayama. 2021. "Mapping the Potential Distribution of Ticks in the Western Kanto Region, Japan: Predictions Based on Land-Use, Climate, and Wildlife" Insects 12, no. 12: 1095. https://0-doi-org.brum.beds.ac.uk/10.3390/insects12121095