1. Introduction
Advances in high-throughput DNA-sequencing are driving rapid progress in genome analysis of a wide range of organisms, including many mosquitoes [
1]. High-quality genome sequences can provide a basis for addressing a broad suite of fundamental questions concerning the evolutionary history, molecular physiology, and behavioral genetics of mosquito vectors [
2,
3,
4,
5]. Furthermore, integration of these genomic insights with emerging genetic engineering technologies presents a promising approach for developing novel methods to control vector abundance and pathogen transmission [
6,
7,
8].
The mosquito genus
Aedes contains many species capable of transmitting pathogens of veterinary and human significance [
9]. Among the aedine species,
Aedes aegypti and
Aedes albopictus are the two most important vectors of human viruses, including dengue, chikungunya, and Zika; they are also the two aedine species with the most well-developed genomic resources.
Ae. aegypti and
Ae. albopictus are estimated to have diverged approximately 70 million years ago [
10]. They appear to exhibit strong synteny based on comparative linkage mapping with RFLP markers [
11], and both genomes are comprised of a large proportion of repetitive DNA elements, components of which are common to both species [
10,
12]. The percent identity of protein-coding gene sequences is also relatively high (~85%) based on BLAST alignments [
13].
The sequencing and assembly of both the
Ae. aegypti and
Ae. albopictus genomes have been particularly challenging due to the large size and large repetitive DNA content of these genomes. Initial genome sequences for both species represented groundbreaking advances [
10,
14] but produced fragmented assemblies with relatively short scaffold sizes. This limitation was largely overcome for
Ae. aegypti with a recent chromosome-level genome assembly (AaegL5.0) produced by sequencing 166 Gb with long-read PacBio technology, combined with 10X and Hi-C sequencing, leading to a 1.2 Gb genome assembly with 94% of sequence reads mapped to the three chromosomes [
12]. Similarly, for
Ae. albopictus, Palatini et al. (2020) also applied PacBio, 10X, and Hi-C sequencing to produce a substantially improved genome assembly, AalbF2. The AalbF2 assembly exhibits significantly improved contiguity (N50 scaffold length = 55.7 Mb) relative to the Chen et al. (2015) assembly, and 75% of the assembled genome maps to chromosomes. However, the AalbF2 assembly size is 2.54 Gb, which is approximately twice the expected size of 1.19–1.28 Gb based on cytofluorimetric estimates of genome size [
15]. Identification of up to 1329 likely artifactually duplicated gene copies in the AalbF2 assembly further suggests the presence of haplotigs that were not able to be collapsed in the assembly [
15].
Here, we construct a high-density linkage map for
Ae. albopictus based on 111,328 informative single nucleotide polymorphisms (SNPs) obtained by RNAseq. We used RNAseq to identify SNPs because it is an efficient and affordable approach to obtain a reduced representation of the genome (i.e., transcribed regions). We then perform a linkage-map anchored reassembly of AalbF2. Anchoring a genome assembly on a linkage map is a powerful approach, especially when high-density linkage markers are available, because the map positions can be used to order contigs for scaffold assembly, as well as ordering scaffolds and removing haplotigs [
16]. We refer to this new map-anchored reassembly as AalbF3 to denote that it is based on the contigs of Palatini et al. (2020). We demonstrate the utility of AalbF3 by using it as a reference for a bulk-segregant-based comparative genomics analysis that identifies chromosomal regions with clusters of candidate SNPs putatively associated with photoperiodic diapause. Although several previous studies have used RNAseq to identify genes affecting photoperiod diapause in
Ae. albopictus [
5,
17,
18,
19,
20], this is the first study to take a genetic mapping-based approach. Photoperiodic diapause is a form of dormancy that allows temperate-zone populations of
Ae. albopictus to survive over winter. This trait is a crucial ecological adaptation underpinning rapid range expansion and climatic adaptation of
Ae. albopictus across the temperate range of its global distribution [
21], and a potential target for novel control strategies based on disrupting the diapause response.
2. Materials and Methods
2.1. Summary of Approach
Our study design is based on the observation that tropical populations of
Ae. albopictus are genetically incapable of photoperiodic diapause and temperate populations have a robust, genetically determined diapause response [
22,
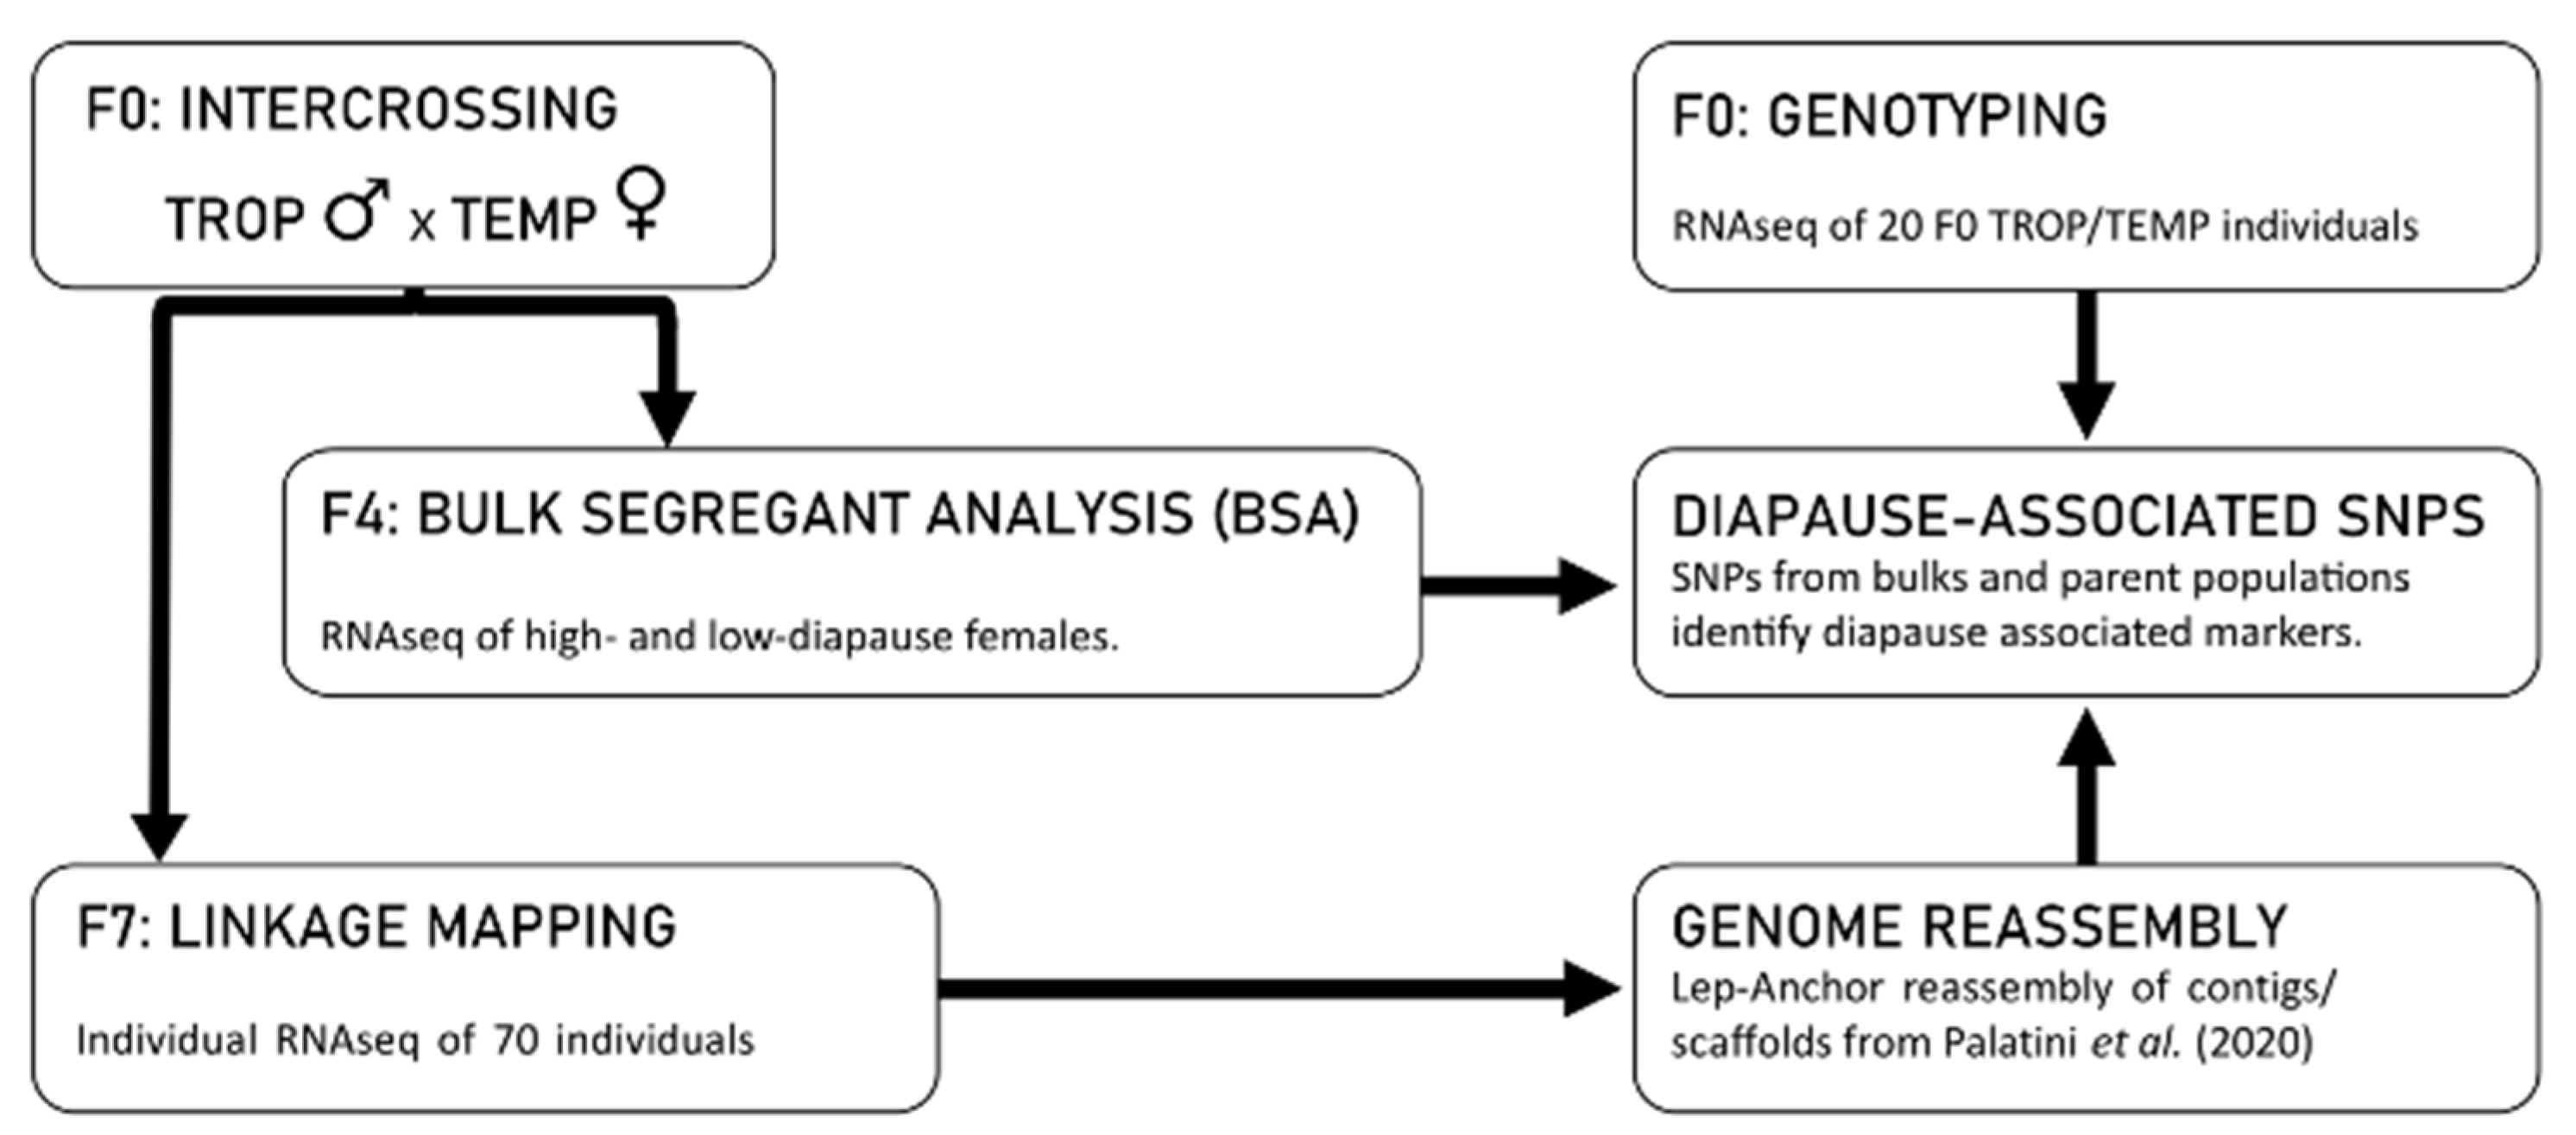
23]. Furthermore, preliminary data indicated that tropical and temperate populations differ at up to 1 million SNP sites across the genome. Our approach consists of the following five components illustrated in
Figure 1: (1) We constructed a high-density linkage map by crossing a single tropical male to a single temperate female and genotyping 70 individuals at more than 111,328 informative SNP loci in the F
7 intercross generation; (2) We used the resulting linkage map to create a chromosome-level reassembly of the
Ae. albopictus genome sequence using Lep-Anchor [
16] and the scaffolds of the Palatini et al. (2020) AalbF2
Ae. albopictus genome assembly; (3) We performed a bulk segregant analysis (BSA) of diapause incidence in the F
4 intercross generation of two independent lines created by crossing a temperate female and tropical male and determining SNP frequencies of high- and low-diapause bulks; (4) We genotyped 9 tropical males and 11 temperate females at almost 1 million SNP loci using RNAseq; (5) We identified candidate regions of the
Ae. albopictus genome putatively associated with diapause by identifying SNPs that differed both between tropical and temperate samples and between high- and low-diapause bulks.
2.2. Collection of Mosquito Strains
We used a population from Manassas, Virginia (“TEMP”, a diapausing, temperate population) and a population from Kuala Lumpur, Malaysia (“TROP”, a non-diapausing, tropical population). The TEMP colony was established with over 500 larvae collected from a local tire recycling center and maintained for seven generations under near-optimal conditions of larval nutrition, a 16L:8D photoperiod at 21 °C and approximately 80% relative humidity as described previously [
24,
25]. These conditions were chosen based on the previous optimization of mosquito rearing and to provide a long-day (non-diapause) control for diapause-inducing conditions (8L:16D, 21 °C). The TROP colony was established using at least 1000 eggs collected from oviposition traps and was maintained for three generations under the same conditions as the TEMP colony. Both colonies were maintained as large (census size > 300 individuals), outbred populations before initiating the intercross mating described below. The TEMP population corresponds to “VA” and “MAN” and the TROP population corresponds to “KLP” of previous publications from this laboratory [
5,
18,
23,
25].
2.3. Intercrossing Tropical and Temperate Lines for Linkage Mapping and BSA
The intercross lines used for the linkage mapping and BSA were established by mating an individual TROP male and an individual TEMP female for each line (
Figure 1). We performed all of the crosses between tropical males and temperate females to maximize the chances of obtaining individual females with a high diapause incidence in the F
4 intercross generation for the BSA experiment. The rationale for this decision was that some genes affecting diapause might be sex-linked. To perform the cross, sixty mating cages were established with one TROP male and three TEMP females per cage. After four days to allow for mating, TROP males were snap-frozen in liquid nitrogen and stored at −80 °C and TEMP females were individually placed into fly vials with a strip of unbleached paper towel as a substrate for oviposition. Two females that oviposited > 20 eggs each were snap-frozen in liquid nitrogen and stored at −80 °C for subsequent RNAseq genotyping. The eggs (intercross F
1) of these females were maintained and hatched out under the near-optimal conditions described above to establish two independent intercross lines. Both lines were used for the BSA in the intercross F
4 generation. We choose to breed to the intercross F
4 generation for the BSA experiment because we hypothesized that additional intercross generations would lead to a decrease in the diapause response of intercross females. Additionally, one line was arbitrarily chosen and maintained to the intercross F
7 generation to increase recombination among marker SNPs for linkage mapping (
Figure 1). We choose to interbreed to the F
7 generation for the linkage map experiment to obtaining sufficient recombination to resolve the relative positions of our high-density SNP makers without excessive multiple recombination events between markers. Additional details can be found in the
Supplementary File S1.1.
2.4. Linkage Mapping: Tissue Preparation, RNA Extraction, and Sequencing
In the intercross F
7 generation, larvae were reared to adults, collected one week after eclosion, snap-frozen in liquid nitrogen, and individually stored at −80 °C. Total RNA was extracted from each of the two parents and 70 individual F
7 intercross mosquitoes using a modified TRI
® Reagent (Sigma Aldrich, St. Louis, MO) RNA extraction protocol described in previous publications [
17,
19]. Samples of total RNA from two intercross F
0 parents were used for library preparation and sequencing alongside those of other TROP and TEMP individuals as described below (see “
Bulk segregant analysis: RNA extraction and sequencing”). Samples of total RNA from the 70 individual F
7 offspring were used to create individual sequencing libraries using a modified protocol from the NEBNext
® Ultra™ RNA Library Prep Kit and NEBNext Poly(A) mRNA Magnetic Isolation Module (New England Biolabs, Ipswich, Massachusetts). Paired-end libraries were sequenced on an Illumina HiSeq 4000 instrument (read length = 150 bp) at the Institute for Genome Sciences (IGS), University of Maryland. Additional details are described in the
File S1.2. Raw reads for the linkage mapping component of this study are accessible through NCBI BioProject accession number PRJNA694122 (~1.9 billion read pairs,
Table S2).
2.5. Linkage Mapping: Read Cleaning and Alignment to the Palatini et al. (2020) Assembly
We removed contaminant and low-quality reads and performed read trimming, using a combination of custom scripts, Trimmomatic version 0.39, and SolexaQA++ version 3.1.7.1. Scripts for all analyses are available in the Dryad repository located here:
https://0-doi-org.brum.beds.ac.uk/10.5061/dryad.mgqnk98z4. Alignment was performed using STAR version 2.7.1a. Additional details are provided in the
File S1.3.
2.6. Linkage Mapping: Determining Linkage Groups
Linkage mapping was conducted with Lep-MAP3 [
26] as an “F
2” population; i.e., the two F
0 individuals that founded the intercross line were used as grandparents and the 70 (F
7) intercross individuals were considered to be F
2 offspring for the purposes of Lep-MAP3. As noted above, we used F
7 intercross offspring rather than F
2 offspring to produce a finer-scale linkage map by allowing more recombination events between markers. As F
7 offspring will have approximately 6 times more recombination events than F
2 offspring, the genetic distances estimated by the Lep-MAP3 pipeline will be about sixfold overestimates, for which we have corrected below. We verified that the Lep-MAP3 pipeline is robust to the use of non-F
2 offspring in place of F
2 offspring by simulating comparable F
7 data and running Lep-MAP3 on these data.
SNP genotypes were determined in a likelihood framework within Lep-MAP3. First, the likelihood of each genotype for each individual was calculated with the Lep-MAP3 pipeline (pileupParser.awk + pileup2posterior.awk) using samtools mpileup [
27] from individual .bam alignments (mapped to the scaffold level assembly of Palatini et al. (2020)). Then we made an F2 pedigree file with two “dummy” parents and ran the ParentCall2 module on this pedigree and the genotype likelihoods. After this, we ran the Filtering2 module with parameter dataTolerance = 0.0001 to remove markers showing distorted segregation (1:10,000 odds of the observed distortion due to chance, assuming an F
2 population).
Using a custom script, markers were separated into 4 types based on the genotypes of the intercross F0 parents (1: AA female + BB male, 2: AB + AA, 3: AA + AB, 4: AB + AB), and a Lep-MAP3 map file was created for each group of markers. The module SeparateChromosomes2 was called on each of these groups (parameter map), a LOD score limit (lodLimit) between 8 and 11 and (lod3Mode = 2) was used for each group to split these markers into three major linkage groups (pseudochromosomes). Different LOD scores were used for each group because they contained a different number of SNP markers. Nearby markers were inspected to match the three linkage groups in all grandparent combinations, yielding a map with ~ 100,000 markers in 12 linkage groups, with groups 3, 6, 9, and 12 matching to the first pseudochromosome, 1, 4, 7, and 10 matching to the second pseudochromosome, and 2, 5, 8, and 11 to the third. Then the module JoinSingles2All was called with lodLimit = 10, increasing the number of markers in linkage groups to almost 183,000, with the new markers consisting mostly of markers with uncertain grandparental genotypes.
OrderMarkers2 (OM2) was then run on the 12 linkage groups. Because of the difficulty of phasing the data when both grandparents were heterozygous, we did not include these linkage groups in further analyses (linkage groups 10, 11, 12). We used the parameter grandParentalPhase = 1 in OM2 to phase data on the (homozygote) grandparents. Module OM2 was run 5 times for each of the remaining 9 groups and the solution with the highest likelihood was kept for each linkage group. Also, the marker intervals were calculated (calculateIntervals = file), indicating uncertainty of marker positions, which were used later in the analysis.
2.7. Genome Sequence Reassembly Using Lep-Anchor
Genome anchoring, haplotype reduction, and scaffold reassembly of the Palatini et al. (2020) AalbF2 genome assembly were achieved with Lep-Anchor [
16]. The input initially consisted of the 9 linkage maps described above with marker intervals from Lep-MAP3 consisting of 111,328 SNP markers. Additionally, we used a contig-contig alignment chain file calculated using HaploMerger2 [
28] and mappings from minimap2 [
29] for
Ae. albopictus PacBio reads (SRR8839546-57, 60–70). We first split the scaffold level assembly of Palatini et al. (2020) into contigs using a custom script. To utilize the scaffolding links (Hi-C) from the Palatini et al. (2020) genome, we constructed an artificial paf file with alignments between each contig joined initially into scaffolds. We followed the pipeline given in Lep-Anchor’s wiki [
30] (scripts provided in our dryad repository), first removing contigs being full haplotypes with findFullHaplotypes.awk (parameter minScore = 20) based on the alignment chain only. We then mapped the markers in these haplotype contigs into non-haplotypes using the LiftoverHaplotypes module. Next, CleanMap was run to put contigs into chromosomes. CleanMap split 11 contigs into two or more chromosomes. We determined the split sites in these 11 contigs by inspecting the contig-contig alignments manually and by HaploMerger2 (hm.batchA3.misjoin_processing). A total of 5 contigs could be split exactly, and the location of the split-site could be approximated based on the alignments for 5 of the remaining 6 contigs.
We then ran PlaceAndOrientContigs (POC) with a bed file from Map2Bed including all non-haplotype contigs not assigned to any chromosome (i.e., contigs with no linkage map markers). Following POC, we used the propagate script (iterated 9 times, until additional contigs could not be added) to place contigs that could be assigned to a single chromosome. The remaining contigs were left without chromosome assignment. We ran POC three times, first with only the contigs with a clear assignment and two more times removing newly found haplotypes between runs (using removeHaplotypes.awk).
Custom R scripts were used to obtain Marey maps for each chromosome. This pipeline was run twice: after the first run, we identified regions in three of the maps that contradicted the other maps (one in pseudochromosome 2, and two in pseudochromosome 3). The contradictory regions were all in those maps produced using markers for which one intercross F0 parent was a heterozygote. The problematic regions produced by the first pipeline run seemed to be caused by gaps without markers (and a high amount of crossing over due to the F7 intercross design). By flipping markers in one region (of linkage map 5) and splitting two other maps into 2 and 6 parts (linkage maps 4 and 8, respectively) we could obtain a set of 15 consistent maps that were used in the second run of the pipeline.
2.8. Genome Reassembly: Analysis of Lep-Anchor Results
To compare the genome sequence reassembly produced by Lep-Anchor (AalbF3) to the AalbF2 assembly of Palatini et al. (2020), we calculated genome size and GC content, the number and size of scaffolds and contigs, maximum scaffold length, and the percentage of each genome in scaffolds of 50 kb or more. We also compared the two genome assemblies using BUSCO version 4.0.4 [
31] using the “Diptera odb10” dataset of single-copy genes and default configurations.
To compare the annotations of the two genomes, we used custom scripts to analyze the annotation of AalbF2 accessed through the NCBI
Ae. albopictus Annotation Release 102 [
32]. Using custom scripts, we built an annotation for the AalbF3 reassembly out of the NCBI annotation as follows: for each feature annotation, we determined whether or not the entirety of the annotation fell in a contig of AalbF3. If it did, we calculated its new position on the scaffolds of AalbF3, and included the re-mapped feature in our new annotation. We also compared the number of feature annotations in the two assemblies to the number of features in the NCBI
Ae. aegypti Annotation Release 101 [
33].
Finally, we aligned the transcriptome sequences from 11 male TROP individuals and 9 female TEMP individuals to both the AalbF2 assembly and the AalbF3 reassembly. The transcriptome sequences were cleaned and filtered as described in
File S1.3. Both genomes were indexed using the bowtie2-build tool from bowtie2 version 2.3.5.1 [
34]. We then aligned the cleaned and filtered reads to each genome using the default (end-to-end) settings of the bowtie2 aligner. We used the bowtie2 aligner with end-to-end settings for this analysis because it is a commonly used algorithm for short-read alignment that produces easily interpretable results. Although overall alignment rates might be higher using a split-read aligner such as HISAT2 or STAR, because only 11 contigs from the AalbF2 assembly were cut to produce the AalbF3 reassembly (see above), using end-to-end alignments should not affect the comparison of alignment rates between the two assemblies.
2.9. Lep-Anchor Genome Sequence Reassembly: Establishing Chromosome Identity
A preliminary analysis indicated that approximately half of pseudochromosome 3 of AalbF3 was inverted relative to its true orientation. We, therefore, inverted the scaffolds in this region to align them with the physical mapping of AalbF2 and with the syntenic region of the Ae. aegypti chromosome 3. We note that our linkage map contained supporting markers for both orientations of this inverted part of pseudochromosome 3.
To further determine the correspondence between the pseudochromosomes of the AalbF3 reassembly and the Ae. albopictus physical chromosomes, we took two approaches. First, we used the sequence of 50 fluorescence in situ hybridization (FISH) probes used by Palatini et al. (2020) to link scaffold positions in AalbF2 to relative positions on the physical chromosomes. For the 33 of their 50 probes which mapped to contigs that were included in AalbF3, we used custom scripts to determine the corresponding position on each of our pseudochromosomes. Of the remaining 17 probe sequences, we were able to assign 16 unambiguously to a position on both AalbF3 and the Ae. aegypti assembly (AaegL5.0) using BLASTn (version 2.9.0+) searches that identified a single high bit-score match (bit-score >2000).
Second, we analyzed synteny between each pseudochromosome and the chromosomes of
Ae. aegypti. We downloaded the AaegL5.0 protein set (GCF_002204515.2) and the
Ae. albopictus AalbF2 protein set (GCF_006496715.1) and identified putative orthologues as reciprocal best hits [
35] using BLASTp (version 2.9.0+) with the following thresholds: e-value = 1e-20, percent identity = 85%, percent query sequence coverage = 50%. We then used custom scripts to filter the AaegL5.0 annotation file [
33] and the annotation file for AalbF3 (see above) to determine the position of each putatively orthologous gene on each species’ respective chromosomes.
We also discovered that the male-determining gene
Nix was found on a scaffold belonging to pseudochromosome 3, whereas
in-situ hybridization has shown it to be located on chromosome 1 [
36]. Further investigation of this scaffold suggested that it was chimeric: the 5’ contigs of the scaffold had a single putative ortholog gene from our previous analysis, which mapped to chromosome 3 of
Ae. aegypti; the 3’ contigs of the scaffold had two putative ortholog genes, both of which mapped to chromosome 1 of
Ae. aegypti, and this region also contained
Nix. The results of the synteny analysis with
Ae. aegypti described above showed that chimeric contigs such as this one are extremely rare in our analysis. We, therefore, moved
Nix to its inferred position on pseudochromosome 1 by cutting the scaffold (scaffold 3.129), leaving 2,225,968 bases on the 5’ end (which matched to chromosome 3 of
Ae. aegypti) in place, and moving the remaining bases of the 3’ end to pseudochromosome 1, assigning it a position based on the synteny of the two orthologous genes on this (sub-) scaffold with
Ae. aegypti. We also used custom scripts to modify the accompanying annotation file to account for the changes in the corresponding assembly.
2.10. Bulk Segregant Analysis (BSA): Measuring Diapause Phenotypes
The diapause phenotypes of individual females from the two F
4 intercross lines were determined to create bulks of individuals with extreme phenotypes for subsequent SNP genotyping using RNAseq. Here, we define the diapause phenotype of an individual female as diapause incidence (DI), the proportion of diapause eggs produced by a female maintained under an unambiguous short-day photoperiod (8L:16D) at 21 °C, conditions that produce the optimal expression of diapause in
Ae. albopictus [
25,
37]. F
4 intercross eggs from the two BSA lines were hatched and larvae were reared under near-optimal conditions as described above. Experimental details are provided in the
File S1.4. For the first line, diapause incidence was measured for 60 females with 20 to 64 eggs per female. For the second line, diapause incidence was measured for 78 females with 22 to 69 eggs per female. For both lines, females with eggs that had a DI ≤ 10% (line 1) or 5% (line 2) were assigned to the low-diapause bulk, and females with eggs that had a DI ≥ 50% were assigned to the high-diapause bulk (
SI, Figure S1). Thus, a total of four bulks of adult females were produced based on the diapause incidence of their eggs: a low-diapause bulk (
n = 11 females) and a high diapause bulk (
n = 11) from the first line, and a low-diapause bulk (
n = 12 females) and a high-diapause bulk (
n = 8 females) from the second.
2.11. Bulk Segregant Analysis: RNA Extraction and Sequencing of Bulks, TEMP, and TROP Individuals
Total RNA was extracted from the 9 individual TROP males and 11 individual TEMP females, including the parents, used to produce the intercross lines, as described above (see "
Linkage mapping: RNA extraction and sequencing”). For the four bulks, total RNA was extracted from individual F
4 females and assessed on an Agilent chip as described above. Due to relatively low RNA extraction yields from the individual females comprising the bulks, it was necessary to pool equal amounts of RNA from females within each bulk. This produced four bulk RNA samples (low- and high-diapause from each line, see
SI Table S1). Illumina paired-end mRNA-Seq library construction was performed on the TEMP and TROP individual and bulk RNA samples according to the TruSeq RNA sample preparation kit (Version 2) (Illumina Inc., San Diego, CA, USA). The 20 individual TEMP and TROP libraries were individually barcoded and the 4 bulk libraries were individually barcoded according to the manufacturer’s instructions. Illumina paired-end sequencing was conducted by IGS at the University of Maryland. Additional details are provided in
File S1.5. Raw reads for the BSA, TEMP and TROP sequencing components of this study are accessible through NCBI BioProject accession number PRJNA694122 (~1.2 billion read pairs,
Table S2).
2.12. Bulk Segregant Analysis: Cleaning and Aligning Transcriptomes
All sequencing libraries from the TEMP, TROP, and bulk samples were cleaned and aligned to the AalbF3 genome assembly using the steps described for linkage mapping (See “Linkage mapping: cleaning and aligning transcriptomes”).
2.13. Bulk Segregant Analysis: SNP Calling and Filtering
We identified single-nucleotide polymorphisms (SNPs) in a joint-genotyping context [
38] using the GATK pipeline, version 4.1.4.0, largely following GATK best practices [
39]. Details are provided in
File S1.6. After SNP calling and initial quality filtering, we further filtered our SNP set to include only SNPs which were genotyped in all four bulks (i.e., both the high-diapause and low-diapause bulks from both lines) and at least five individuals from the temperate population and at least five individuals from the tropical population. For each SNP, we calculated the difference in reference allele frequency (referred to hereafter as Allele Frequency Difference, or AFD [
40] for three comparisons: (1) between the (diapausing) TEMP and (non-diapausing) TROP individuals, (2) between the high-diapause and low-diapause bulks of the first BSA line, and (3) between the high-diapause and low-diapause bulks of the second BSA line.
2.14. Bulk Segregant Analysis: Identifying Putative Diapause-Associated SNPs
We first filtered potentially diapause-associated SNPs by identifying those for which all three allele frequency differences (AFDs) had the same sign (i.e., TEMP vs. TROP, high-diapause vs. low-diapause bulks for both BSA lines). From among the resulting 46,736 SNPs, we then calculated a diapause associated
p-value and false discovery threshold as described in detail in
File S1.7. Briefly, for each SNP, a
p-value was calculated as the percentile |AFD| between the TEMP and TROP samples. As the maximum possible |AFD| depends on the minor allele frequency (MAF), we binned the SNPs by MAF as described in the
File S1.7, and then calculated percentiles within each bin. Then, again for each SNP, two additional
p-values were calculated as the percentile |AFD| between the high-diapause and low-diapause bulks for each BSA line, contingent upon the parental genotype at that site. The contingency was applied since SNPs for which the parents had two of each allele are more likely to become strongly differentiated solely by chance than SNPs for which the parents have one reference allele and three alternate alleles. Finally, all three
p-values were multiplied to produce an overall diapause-associated
p-value. We then established three
p-value false-discovery thresholds to account for the testing of multiple SNPs. These thresholds correspond to an expectation of 0.05, 1, and 5 false-positive SNPs based on the set of 46,736 SNPs described above. Finally, we identified putative diapause-associated SNPs as those that meet the following two criteria. First, an |AFD| > 0.5 between the TEMP and TROP samples, indicating that the SNP is segregating in nature. Second, a
p-value less than the
p-value false-discovery threshold corresponding to 0.05, 1, and 5 false-positive SNPs (see
File S1.7).
Finally, we used custom scripts and the annotation file to identify genes (including long non-coding RNAs, lncRNA) and pseudogenes within 50 kb of the diapause-related SNPs at each false-discovery threshold.
4. Discussion
Producing a high-quality genome sequence for
Ae. albopictus represents a significant challenge due to the large size and abundance of repetitive DNA in the genome of this mosquito [
10,
15]. Our approach employed RNAseq as a method for reduced-representation sequencing to identify SNP markers for linkage map construction. This method succeeded in producing 111,328 informative SNP markers spread throughout the
Ae. albopictus genome. We also used an unconventional F
7 intercross design to construct the linkage map, rather than the more common F
2 design. This approach has the potential drawback that it increases the probability of multiple, and therefore undetected, recombination events between markers; for this reason, the approximately 50 cM length of each chromosome is likely an underestimate. This conclusion is consistent with the results of a previous linkage map analysis of
Ae. albopictus based on 73 single-strand conformation polymorphism cDNA markers, which identified three linkage groups of 64.5, 76.5, and 71.6 cM [
42]. Nevertheless, the F
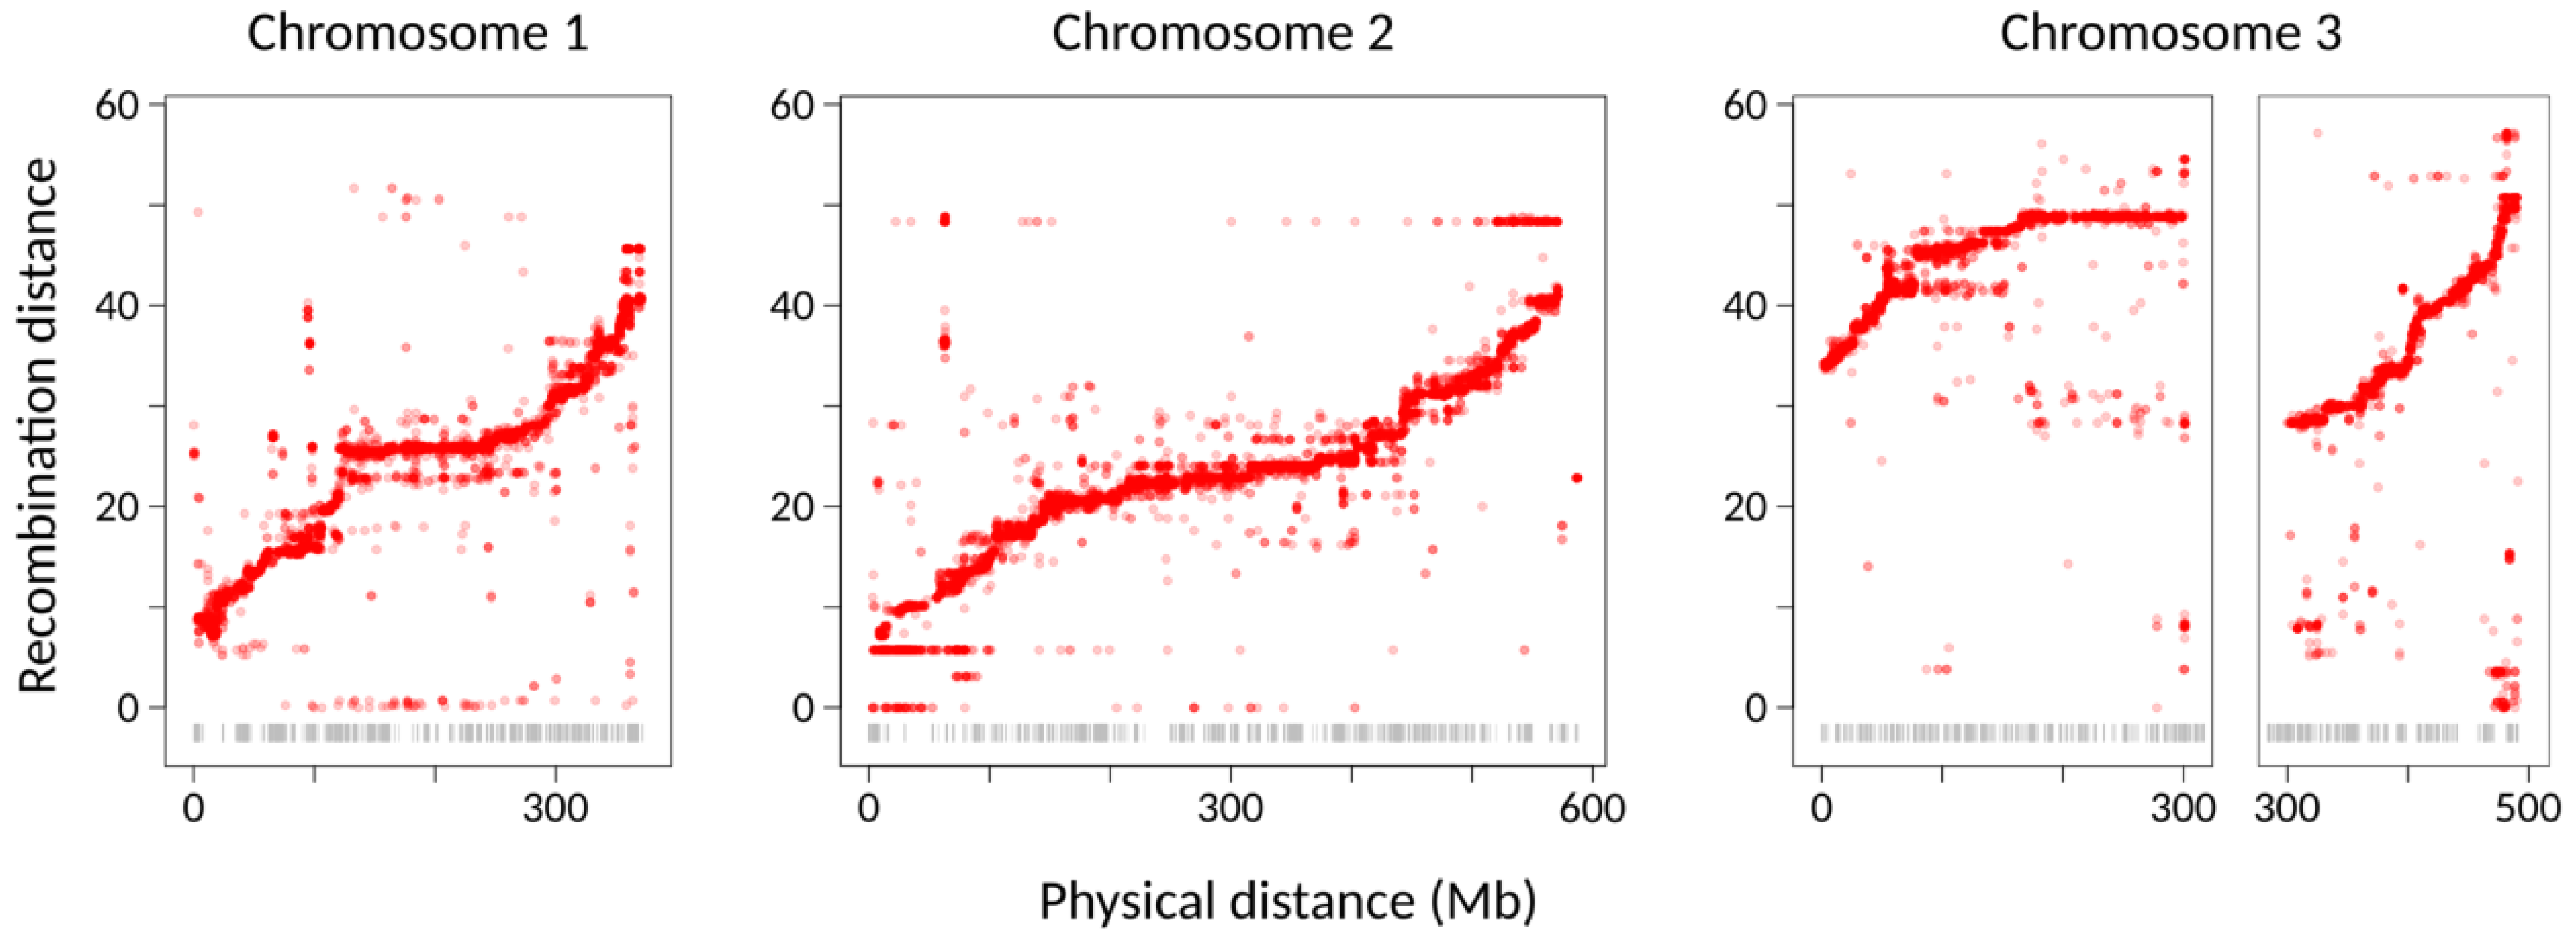
7 approach increases the number of recombination events and therefore allows for finer-scale mapping, which was valuable in using the high-density linkage map as a basis for the Lep-Anchor reassembly (see below). Our strategy was successful in producing three chromosome-sized linkage groups with presumably-centromeric regions of reduced recombination (
Figure 2), consistent with the
Ae. albopictus karyotype [
41].
We used our high-density linkage map to perform Lep-Anchored reassembly of contigs from the AalbF2 assembly produced by Palatini et al. [
15]. We refer to the resulting reassembly as AalbF3. The rationale for using Lep-Anchored reassembly is that the map positions of the high-density linkage markers can be used to remove haplotigs, as well as order contigs and scaffolds and put them into chromosomes [
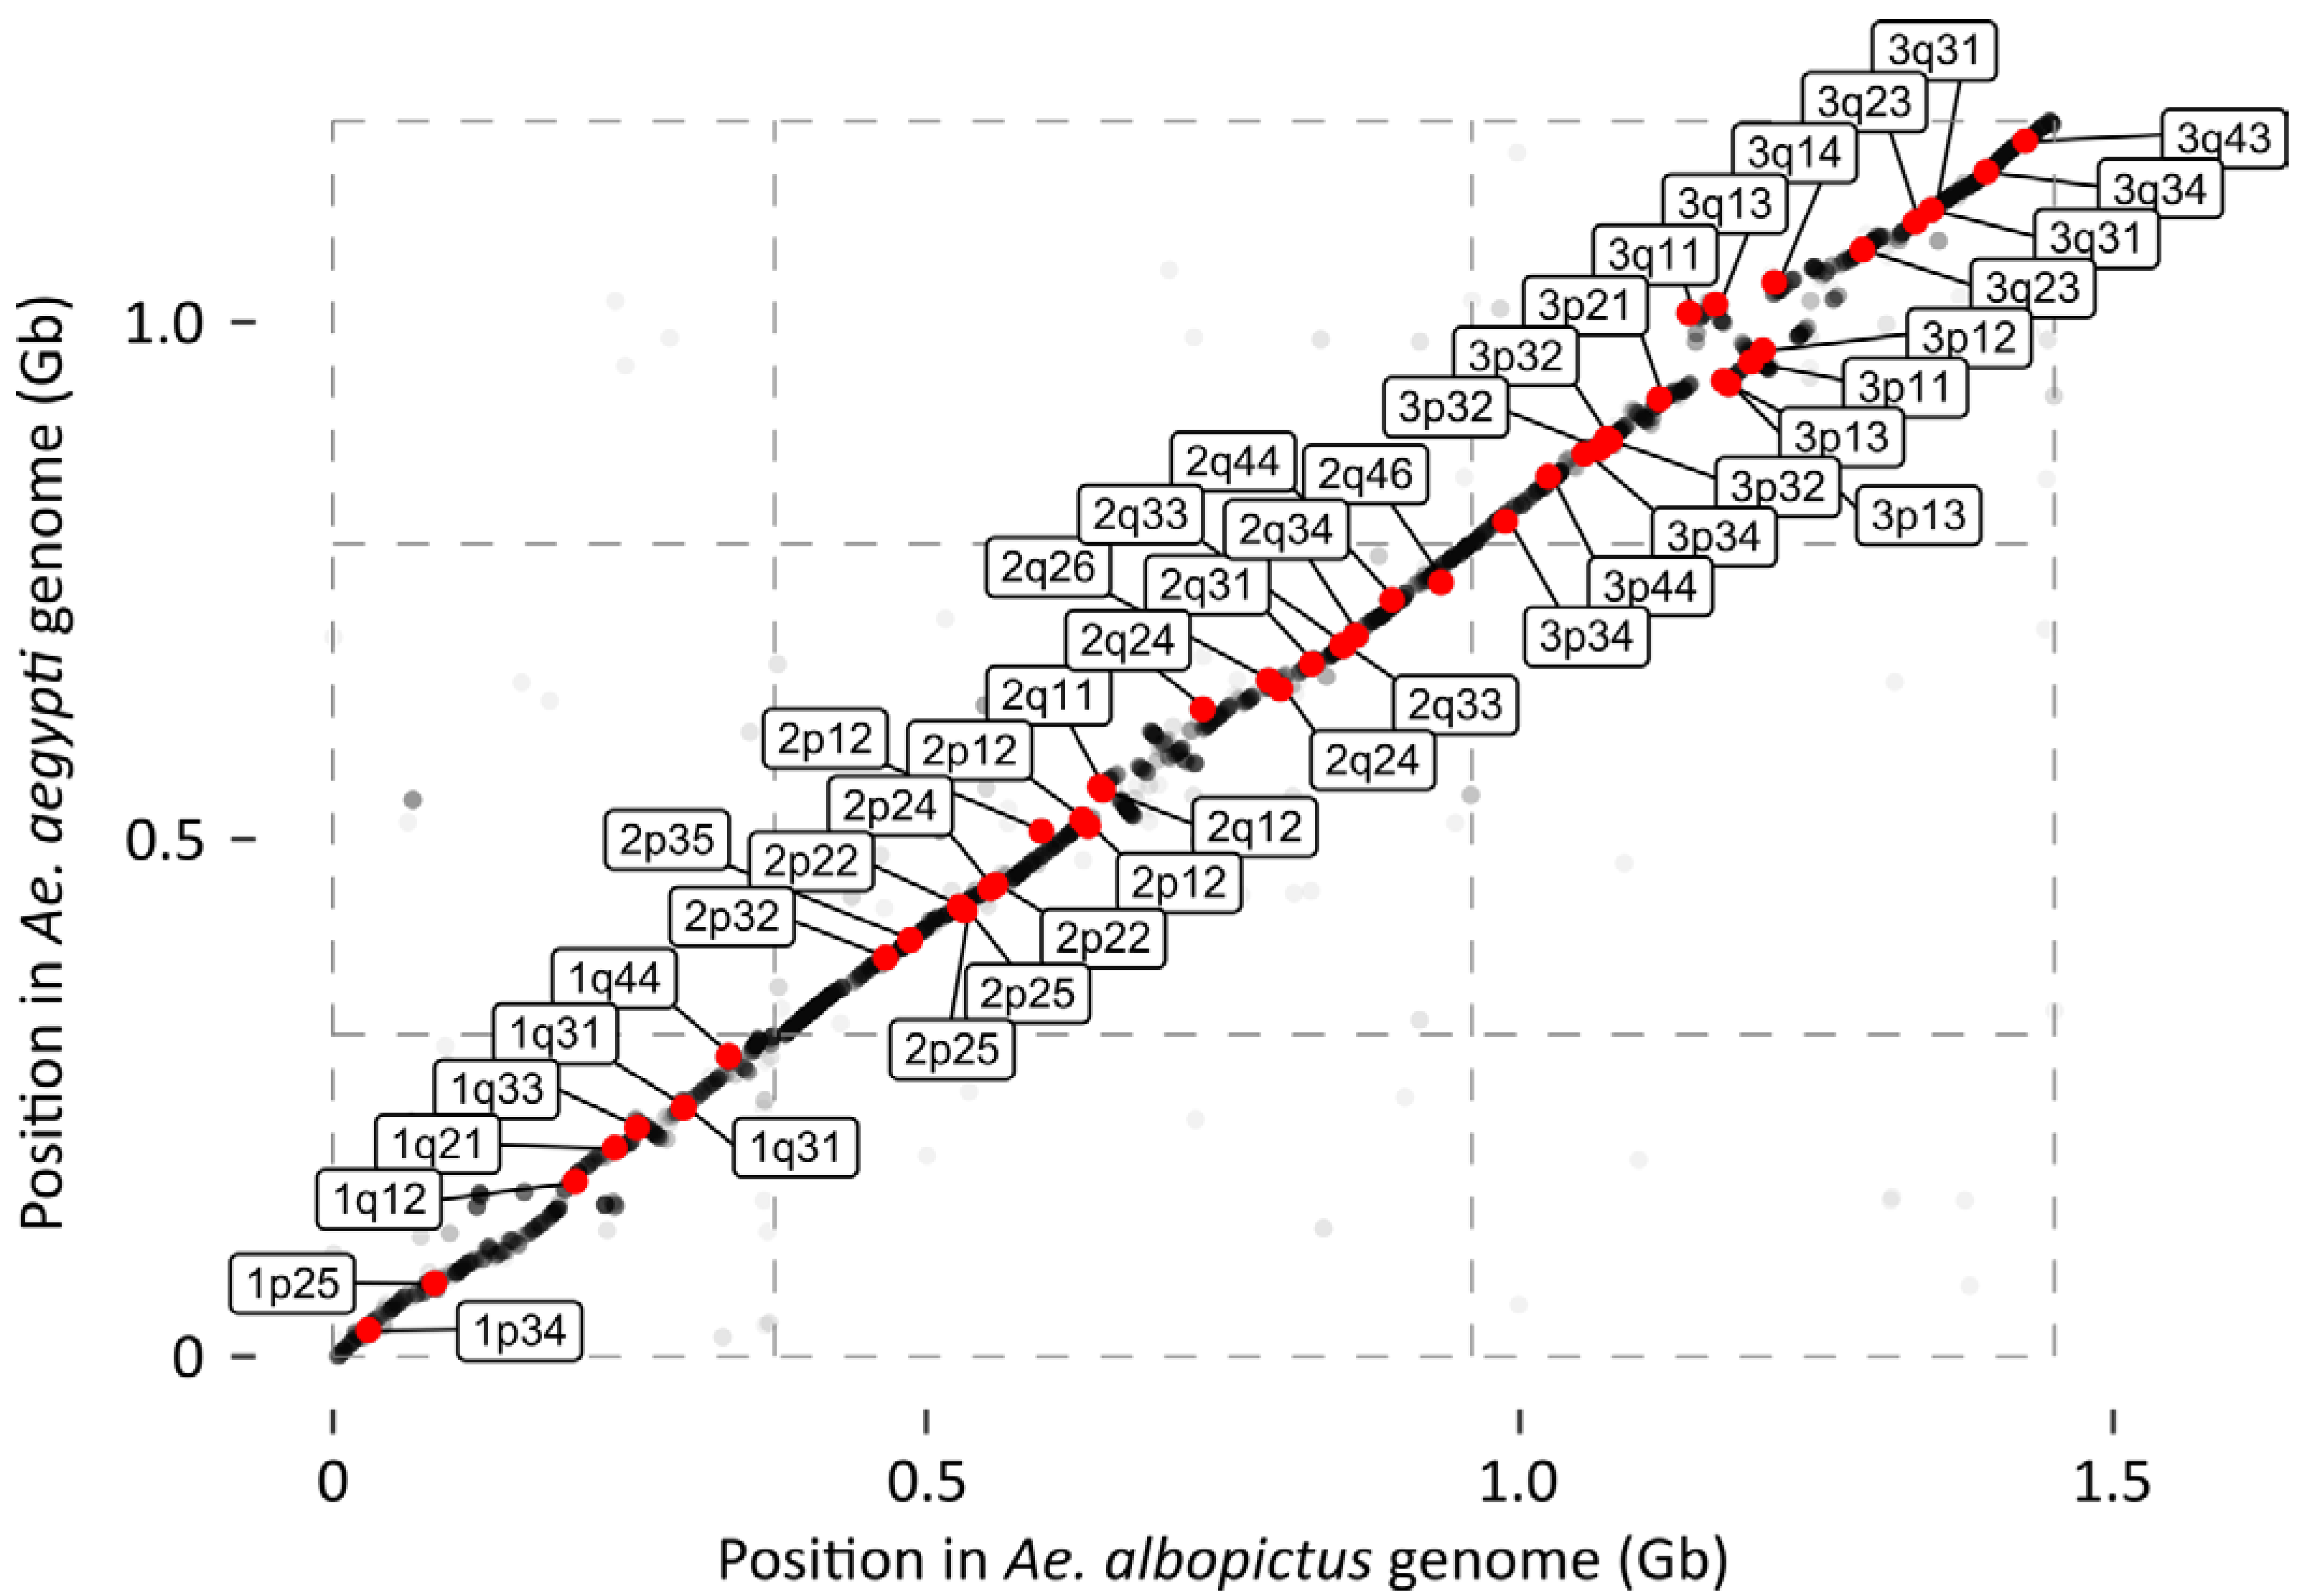
16]. Indeed, two lines of evidence indicate that our reassembly was largely successful in correctly ordering the scaffolds. First, the FISH probes described in Palatini et al. [
15] map to the correct chromosomes of AalbF3, and in the expected order, with only a few, small scale exceptions. Second, synteny of the
Ae. albopictus AalbF3 chromosomes with
Ae. aegypti was extremely strong, even at scales as small as 10–20 Mb (
Figure 3). Although the precise order and spacing of all 573 scaffolds to each other is not known with certainty, these results indicate that the overall ordering of these scaffolds by the linkage map is accurate.
The AalbF3 reassembly is an improvement relative to the previous AalbF2 assembly in several respects. First, cytometric estimates [
43,
44] and comparisons to the
Ae. aegypti genome suggests that the size of the AalbF2 assembly (2.54 Gb) is two times larger than expected, likely due to the presence of haplotypes incorrectly determined to be unique contigs during assembly. This inference is further supported by the identification of up to 1329 likely artifactually duplicated gene copies in AalbF2 [
15]. The Lep-Anchor reassembly process identified and discarded 43% of AalbF2, bringing the total genome size to 1.45 Gb (
Table 1), which is much closer to the cytometric estimates of 1.19–1.28 Gb [
15]. Second, while BUSCO analysis indicates a slightly lower percentage of complete BUSCO genes in AalbF3 (93.2%) relative to AalbF2 (94.6%), the number of complete and single-copy BUSCO genes is higher in AalbF3 (84.3%) relative to AalbF2 (78%). Also, the number of complete and duplicated BUSCO genes is lower in AalbF3 (8.9%) relative to AalbF2 (16.6%) (
Table 2). Finally, the proportion of aligned RNAseq reads that mapped concordantly to a single position of AalbF3 was 46%, a substantial improvement relative to 22% for the AalbF2 assembly.
Despite the significant advantages of AalbF3 described above, AalbF2 may provide a more suitable reference assembly for certain genomic studies, such as those focused on certain classes of non-coding regions of the genome. By taking into account long-read data, contig-contig alignments, and previous (Hi-C) scaffolding links, Lep-Anchor can assemble many contigs that do not have any markers on them, but are linked by other data (e.g., PacBio reads). Nevertheless, approximately 200 Mb of AalbF2 was discarded during reassembly due to lack of linkage-map markers and linking PacBio reads. Because we used RNAseq-derived SNP data to construct the linkage map used for reassembly, the discarded contigs are likely very gene-poor but may contain biologically important non-transcribed sequences. We provide a list of all the discarded contigs from AalbF2 in our dryad repository.
We used the improvements to the
Ae. albopictus reference genome assembly (AalbF3) to identify chromosomal regions putatively associated with diapause by combining two sources of evidence. First, we used a bulk segregant analysis (BSA) in the intercross F
4 generation of two experimental lines created by crossing a single TEMP female to a single TROP male. Our approach was to identify SNPs with extreme allele frequency differences between high-diapause and low-diapause bulks in each line. Second, we used the comparison of genome-wide SNP frequencies between 11 females from the TEMP population, which has a robust photoperiodic diapause response, and 9 males from the TROP population that is genetically incapable of diapause [
22,
23]. Calculating a combined
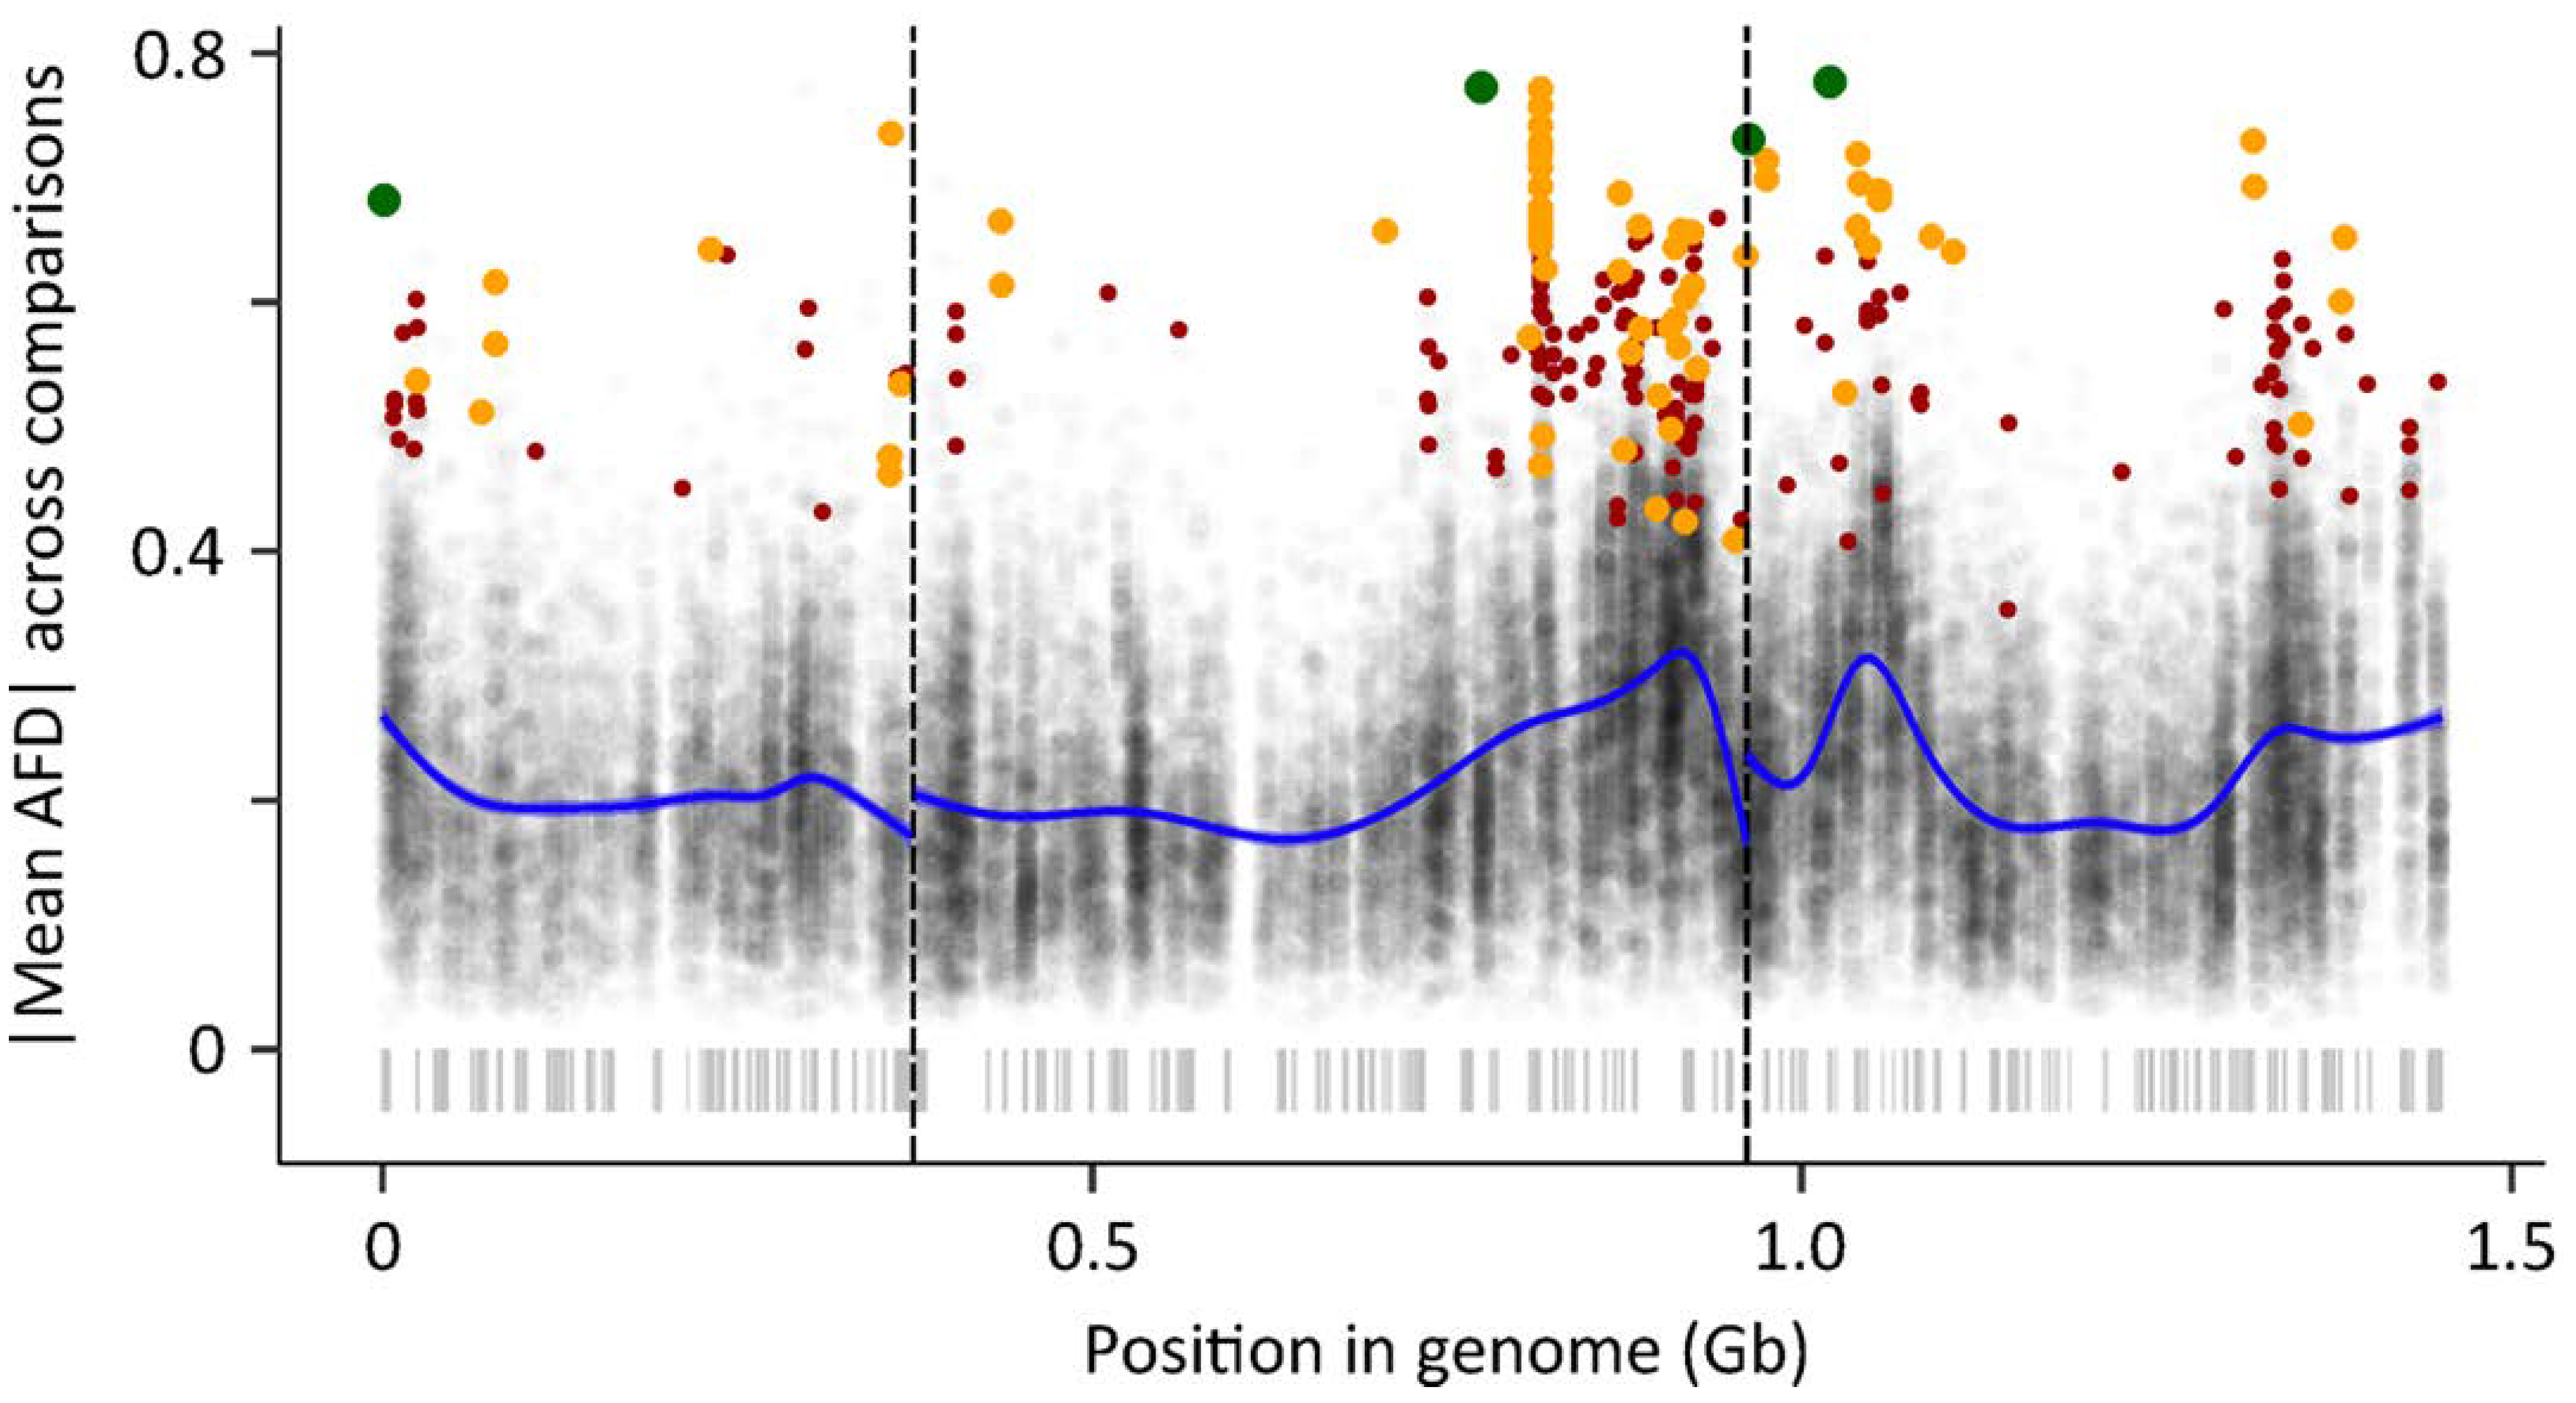
p-value and applying the strictest correction for false-discovery indicated 4 SNPs distributed across all three chromosomes that were highly differentiated in both comparisons: the TROP vs. TEMP populations that represent the frequency of these SNPs in colonies recently derived from natural populations, and the two bulk segregant analyses that show SNP differentiation associated with phenotypic extremes of the experimental intercross lines (
Figure 4,
SI Figure S3). The concordant elevated |AFD| in both the BSA and TEMP vs. TROP comparison at the beginning of chromosome 1, the end of chromosome 2, and both the beginning and end of chromosome 3 are particularly notable. Decreasing the stringency of the false-discovery rate resulted in the identification of 77 and 260 SNPs, many more than expected due to false discovery caused by multiple tests (1 and 5, respectively). The SNPs identified at FDR thresholds of 1 and 5 tended to have a smaller level of differentiation between the different comparisons (
SI, Figure S3), suggesting that they may have a smaller effect size on the diapause phenotype than those SNPs identified under more stringent FDR threshold of 0.05.
Despite several notable clusters of concordant elevated |AFD| noted above, the overall distribution of candidate SNPs on all three chromosomes implies a polygenic architecture underlying the evolution of photoperiodic diapause in
Ae. albopictus (
Figure 4). This is consistent with a number of recent studies that have used high-throughput sequencing approaches, including RNAseq and genome-wide SNP analyses, to probe the genetic basis of diapause in other species [
45,
46,
47]. The list of gene models located within 50 Kb of SNPs at three FDR thresholds (
SI, Table S4) includes a number of intriguing candidates, including genes implicated in cell-cycle regulation (
gametogenetin-binding protein 2-like), epigenetic regulation (
methyl-CpG-binding domain protein 3), and cold tolerance (
ice-structuring glycoprotein). The genes in
SI Table S4 do not overlap substantially with genes identified in previous studies comparing transcriptional changes associated with diapause in
Ae. albopictus [
5,
17,
18]. We hypothesize that this is because the earlier transcriptional studies focused on tissues and developmental stages related to the proximal physiological basis of diapause (i.e., “downstream” processes). The candidate SNPs identified in this study are presumably related to the evolution of this complex adaptation from a tropical, ancestral population incapable of undergoing photoperiodic diapause, to a temperate, derived population that relies on diapause to survive temperate winters [
21,
22,
48]. Thus, the chromosomal regions identified in this analysis will provide a basis for more targeted studies investigating the functional and evolutionary genetics of genes that may be involved in the more “upstream” regulation of diapause in
Ae. albopictus. In the longer term, characterizing the genetic basis of diapause may provide a foundation for novel vector control strategies based on the disruption of this crucial ecological adaptation.


 ,
, 


