
Exploring Two Honey Bee Traits for Improving Resistance Against Varroa destructor: Development and Genetic Evaluation

 , , and
Abstract
:Simple Summary
Abstract
1. Introduction
2. Materials and Methods
2.1. Colonies, General Management and Performance Testing Protocol
2.2. Repeatability, Heritability, and Phenotypic Correlation Estimates
3. Results
4. Discussion
Author Contributions
Funding
Institutional Review Board Statement
Informed Consent Statement
Data Availability Statement
Acknowledgments
Conflicts of Interest
References
- Le Conte, Y.; Ellis, M.; Ritter, W. Varroa mites and honey bee health: can Varroa explain part of the colony losses? Apidologie 2010, 41, 353–363. [Google Scholar] [CrossRef] [Green Version]
- Neumann, P.; Carreck, N.L. Honey bee colony losses. J. Apic. Res. 2010, 49, 1–6. [Google Scholar] [CrossRef] [Green Version]
- Bogdanov, S. Contaminants of bee products. Apidologie 2006, 38, 1–18. [Google Scholar] [CrossRef] [Green Version]
- Milani, N. The resistance of Varroa jacobsoni Oud. to acaricides. Apidologie 1999, 30, 229–234. [Google Scholar] [CrossRef]
- Spreafico, M.; Eördegh, F.R.; Bernardinelli, I.; Colombo, M. First detection of strains of Varroa destructor resistant to coumaphos. Results of laboratory tests and field trials. Apidologie 2001, 32, 49–55. [Google Scholar] [CrossRef] [Green Version]
- Trouiller, J. Monitoring Varroa jacobsoni resistance to pyrethroids in western Europe. Apidologie 1998, 29, 537–546. [Google Scholar] [CrossRef] [Green Version]
- Tihelka, E. Effects of synthetic and organic acaricides on honey bee health: a review. Slov. Vet. Res. 2018, 55, 22. [Google Scholar] [CrossRef] [Green Version]
- Guichard, M.; Dietemann, V.; Neuditschko, M.; Dainat, B. Advances and perspectives in selecting resistance traits against the parasitic mite Varroa destructor in honey bees. Genet. Sel. Evol. 2020, 52. [Google Scholar] [CrossRef] [PubMed]
- Mondet, F.; Beaurepaire, A.; McAfee, A.; Locke, B.; Alaux, C.; Blanchard, S.; Danka, R.; Le Conte, Y. Honey bee survival mechanisms against the parasite Varroa destructor: a systematic review of phenotypic and genomic research efforts. Int. J. Parasitol. 2020, 50, 433–447. [Google Scholar] [CrossRef] [PubMed]
- Leclercq, G.; Blacquière, T.; Gengler, N.; Francis, F. Hygienic removal of freeze-killed brood does not predict Varroa-resistance traits in unselected stocks. J. Apic. Res. 2018, 1–8. [Google Scholar] [CrossRef]
- Spivak, M.; Danka, R.G. Perspectives on hygienic behavior in Apis mellifera and other social insects. Apidologie 2020. [Google Scholar] [CrossRef]
- Büchler, R.; Costa, C.; Mondet, F.; Kezic, N.; Kovacic, M. Screening for Low Varroa Mite Reproduction (SMR) and Recapping in European Honey Bees. 2017. Available online: https://www.beebreeding.net/index.php/2017/09/01/new-smr-protocol/ (accessed on 27 February 2019).
- Oddie, M.A.Y.; Büchler, R.; Dahle, B.; Kovacic, M.; Le Conte, Y.; Locke, B.; de Miranda, J.; Mondet, F.; Neumann, P. Rapid parallel evolution overcomes global honey bee parasite. Sci. Rep. 2018, 8, 7704. [Google Scholar] [CrossRef] [Green Version]
- Cheruiyot, S.K.; Lattorff, H.M.G.; Kahuthia-Gathu, R.; Mbugi, J.P.; Muli, E. Varroa-specific hygienic behavior of Apis mellifera scutellata in Kenya. Apidologie 2018, 49, 439–449. [Google Scholar] [CrossRef] [Green Version]
- Martin, S.J.; Hawkins, G.; Brettell, L.; Reece, N.; Correia-Oliveira, M.E.; Allsopp, M.H. Varroa destructor reproduction and cell re-capping in mite-resistant Apis mellifera populations. Apidologie 2019. [Google Scholar] [CrossRef] [Green Version]
- Buchegger, M.; Büchler, R.; Fuerst-Waltl, B.; Kovacic, M.; Willam, A. Relationships between resistance characteristics of honey bees (Apis mellifera) against Varroa mites (Varroa destructor). J. Cent. Eur. Agric. 2018, 19, 954–958. [Google Scholar] [CrossRef] [Green Version]
- Delaplane, K.S.; van der Steen, J.; Guzman-Novoa, E. Standard methods for estimating strength parameters of Apis mellifera colonies. J. Apic. Res. 2013, 52. [Google Scholar] [CrossRef]
- Guichard, M.; Neuditschko, M.; Soland, G.; Fried, P.; Grandjean, M.; Gerster, S.; Dainat, B.; Bijma, P.; Brascamp, E.W. Estimates of genetic parameters for production, behaviour, and health traits in two Swiss honey bee populations. Apidologie 2020. [Google Scholar] [CrossRef]
- Büchler, R.; Andonov, S.; Bienefeld, K.; Costa, C.; Hatjina, F.; Kezic, N.; Kryger, P.; Spivak, M.; Uzunov, A.; Wilde, J. Standard methods for rearing and selection of Apis mellifera queens. J. Apic. Res. 2013, 52. [Google Scholar] [CrossRef] [Green Version]
- Smartbees, Sustainable Management of Resilient Bee Populations. Performance Testing Protocol A Guide for European Honey Bee Breeders. Available online: https://www.smartbees-fp7.eu/resources/Publications/2016/ENG_SMARTBEES-Protocol-for-performance-testing_2015_ISBN.pdf (accessed on 3 March 2021).
- Einsatz und Erprobung von Prüfparametern zur Selektion einer varroatoleranten Honigbiene in der Praxis. Abschlussbericht über die wissenschaftliche Betreuung bei der Durchführung des Forschungs- und Entwicklungsvorhabens (Project report) LLH Kirchhain and LB Hohen Neuendorf, 03UM008. Available online: https://www2.hu-berlin.de/bienenkunde/index.php?id=126 (accessed on 3 March 2021).
- Dainat, B.; Dietemann, V.; Imdorf, A.; Charrière, J.D. A scientific note on the ‘Liebefeld Method’ to estimate honey bee colony strength: its history, use, and translation. Apidologie 2020, 51, 422–427. [Google Scholar] [CrossRef] [Green Version]
- Imdorf, A.; Bühlmann, G.; Gerig, L.; Kilchenmann, V.; Wille, H. Überprüfung der Schätzmethode zur Ermittlung der Brutfläche und der Anzahl Arbeiterinnen in freifliegenden Bienenvölkern. Apidologie 1987, 18, 137–146. [Google Scholar] [CrossRef]
- Brascamp, E.W.; Bijma, P. Methods to estimate breeding values in honey bees. Genet. Sel. Evol. 2014, 46, 1–15. [Google Scholar] [CrossRef] [Green Version]
- Brascamp, E.W.; Bijma, P. A note on genetic parameters and accuracy of estimated breeding values in honey bees. Genet. Sel. Evol. 2019, 51. [Google Scholar] [CrossRef] [Green Version]
- R-Core-Team. R: A Language and Environment for Statistical Computing; R Foundation for Statistical Computing: Vienna, Austria, 2018; Available online: http://www.R-project.org/ (accessed on 18 February 2021).
- Büchler, R.; Kovacic, M.; Buchegger, M.; Puškadija, Z.; Hoppe, A.; Brascamp, E.W. Evaluation of Traits for the Selection of Apis Mellifera for Resistance against Varroa Destructor. Insects 2020, 11, 618. [Google Scholar] [CrossRef]
- Eynard, S.E.; Sann, C.; Basso, B.; Guirao, A.L.; Le Conte, Y.; Servin, B.; Tison, L.; Vignal, A.; Mondet, F. Descriptive analysis of the Varroa non-reproduction trait in honey bee colonies and association with other traits related to Varroa resistance. Insects 2020, 11, 492. [Google Scholar] [CrossRef]
- Facchini, E.; Bijma, P.; Pagnacco, G.; Rizzi, R.; Brascamp, E.W. Hygienic behaviour in honeybees: a comparison of two recording methods and estimation of genetic parameters. Apidologie 2019. [Google Scholar] [CrossRef] [Green Version]
- Spivak, M.; Reuter, G.S. Performance of hygienic honey bee colonies in a commercial apiary. Apidologie 1998, 29, 291–302. [Google Scholar] [CrossRef] [Green Version]
- Büchler, R. Design and success of a German breeding program for Varroa tolerance. Am. Bee J. 2000, 140, 662–665. [Google Scholar]
- Delaplane, K.S.; Berry, J.A.; Skinner, J.A.; Parkman, J.P.; Hood, W.M. Integrated pest management against Varroa destructor reduces colony mite levels and delays treatment threshold. J. Apic. Res. 2005, 44, 157–162. [Google Scholar] [CrossRef]
- Villa, J.D.; Danka, R.G.; Harris, J.W. Repeatability of measurements of removal of mite-infested brood to assess Varroa Sensitive Hygiene. J. Apic. Res. 2017, 56, 631–634. [Google Scholar] [CrossRef]
- Büchler, R. Varroa tolerance in honey bees occurrence, characters and breeding. Bee World 1994, 75, 54–70. [Google Scholar] [CrossRef]
- Buchegger, M. Beziehungen Zwischen den Merkmalen SMR (Suppressed Mite Reproduction), Recapping und Weiteren Resistenzmerkmalen Gegen Varroa Destructor (Varroamilbe) bei Apis Mellifera Carnica (Westliche Honigbiene ssp. Carnica); Universität für Bodenkultur Wien: Vienna, Austria, 2018. [Google Scholar]
- Harbo, J.R.; Harris, J.W. Heritability in honey bees (Hymenoptera: Apidae) of characteristics associated with resistance to Varroa jacobsoni (Mesostigmata: Varroidae). J. Econ. Entomol. 1999, 92, 261–265. [Google Scholar] [CrossRef] [Green Version]
- Moretto, G.; Goncalves, L.S.; de Jong, D. Heritability of africanized and European honey bee defensive behavior against the mite Varroa jacobsoni. Rev. Bras. Genet. 1993, 16, 71–77. [Google Scholar]
- Wielewski, P.; Arnaut de Toledo, V.A.; Martins, E.; Costa-Maia, F.M.; Faquinello, P.; Lino-Lourenco, D.A.; Colla Ruvolo-Takasusulki, M.; Lopes de Oliveira, C.; Sereia, M.J. Relationship Between Hygienic Behavior and Varroa destructor Mites in Colonies Producing Honey or Royal Jelly. Sociobiology 2012, 59, 251–274. [Google Scholar]
- Milne, C.P., Jr. Estimates of the heritabilities of and genetic correlation between two components of honeybee (Hymenoptera: Apidae) Hygienic behavior: uncapping and removing. Ann. Entomol. Soc. Am. 1985, 78, 841–844. [Google Scholar] [CrossRef]
- Le Conte, Y.; Bruchou, C.; Benhamouda, K.; Gauthier, C.; Cornuet, J.M. Heritability of the queen brood post-capping stage duration in Apis mellifera mellifera L. Apidologie 1994, 25, 513–519. [Google Scholar] [CrossRef] [Green Version]
- Moritz, R.F.A. Heratibility of the post capping stage in Apis mellifera and its relation to varroatosis resistance. J. Hered. 1985, 76, 267–270. [Google Scholar] [CrossRef]
- Garcia, R.C.; Escocard de Oliveira, N.T.; Camargo, S.C.; Pires, B.G.; Lopes de Oliveira, C.A.; Teixeira, R.d.A.; Pickler, M.A. Honey and propolis production, hygiene and defense behaviors of two generations of Africanized honey bees. Sci. Agric. 2013, 70, 74–81. [Google Scholar] [CrossRef] [Green Version]
- Costa-Maia, F.M.; de Toledo, V.D.A.; Martins, E.N.; Lino-Lourenco, D.A.; Sereia, M.J.; de Oliveira, C.A.L.; Faquinello, P.; Halak, A.L. Estimates of covariance components for hygienic behavior in Africanized honeybees (Apis mellifera). Rev. Bras. Zootec.-Braz. J. Anim. Sci. 2011, 40, 1909–1916. [Google Scholar] [CrossRef] [Green Version]


| Variable Name | Trait | Unit | N | Min Median Max | Evaluation Method | Frequency | Data Aggregation Method |
|---|---|---|---|---|---|---|---|
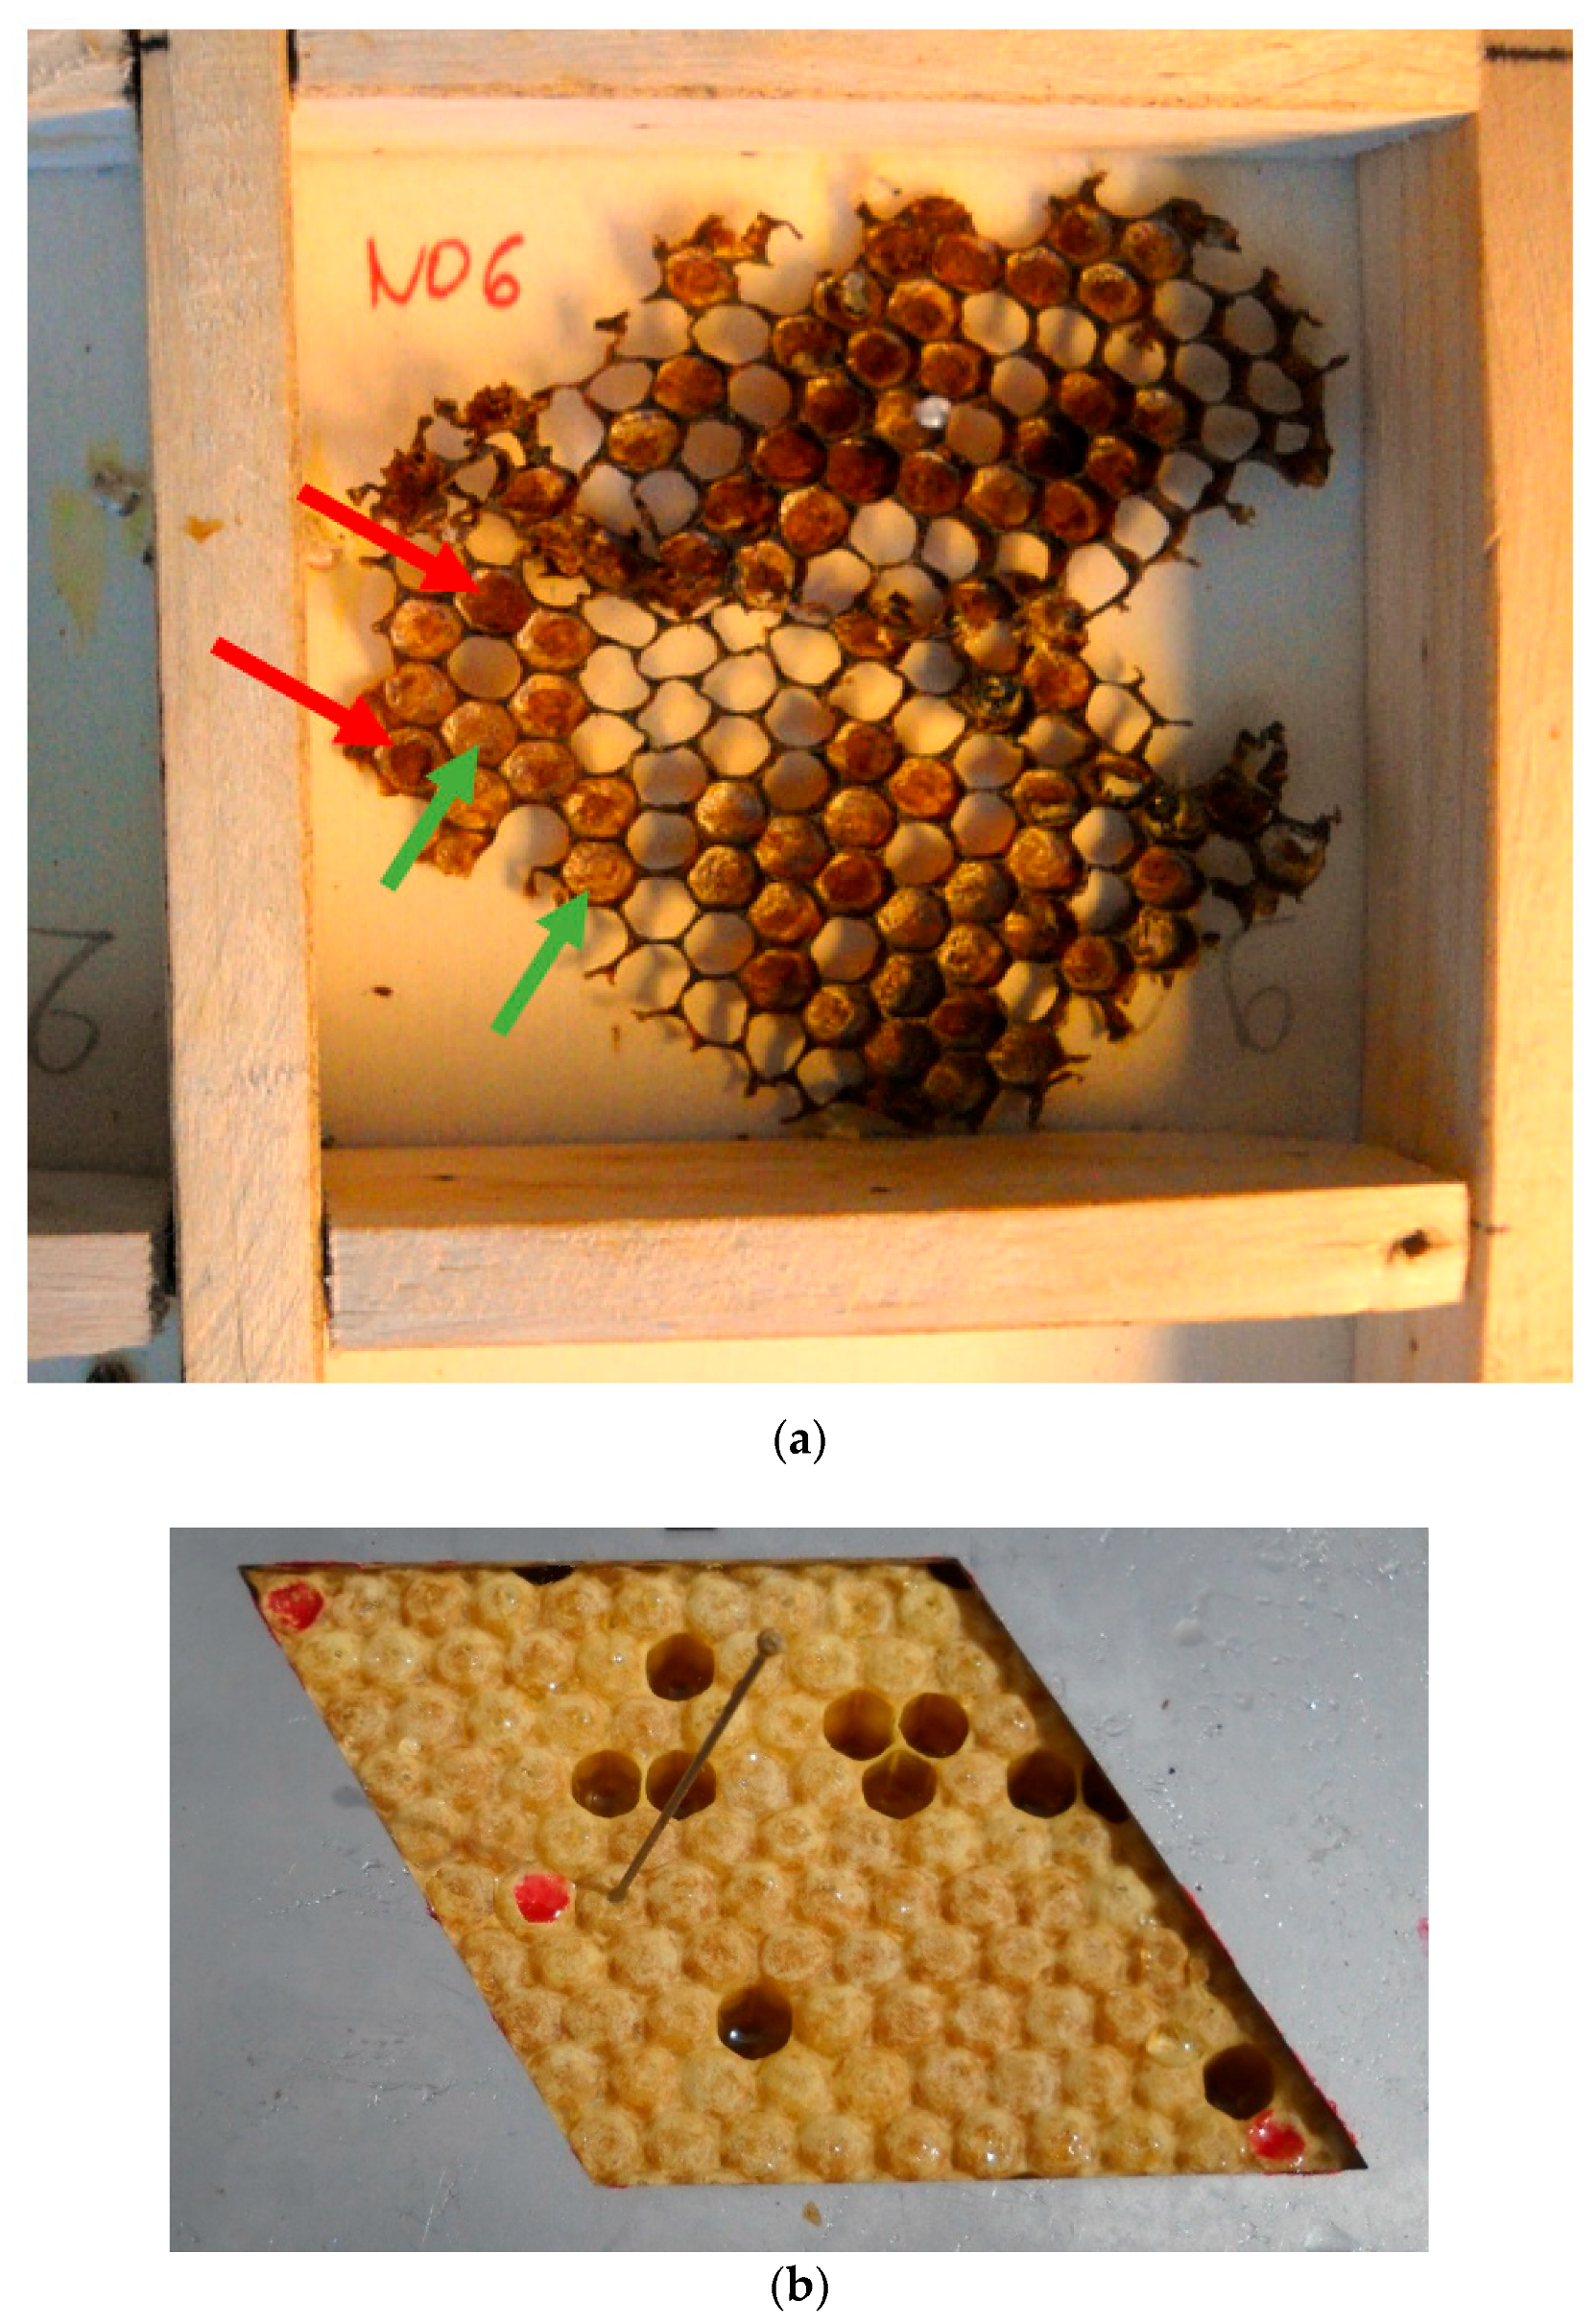
| ‘Recapping’ | Recapping of worker brood cells | % of recapped cells | 115 | 0 0.8 28.1 | Sample of cell caps cut from a brood area next to emerging bees (see Figure 1a) | Every three weeks from spring to summer | Mean of repetitions |
| ‘Solidness’ | Compactness of brood | Number of cells | 121 | 50.5 54.8 107.5 | Number of cells between first and last pinned cells counted when pin-test performed on 50 capped cells (see Figure 1b) | ||
| ‘Honey’ | Honey production | Kg of extracted honey | 97 | 0 17.9 60.1 | Weighing of honey combs before extraction; deduction of the weight of the empty combs. | At each harvest | Sum of all harvests during evaluation period |
| ‘Gentleness’ | Gentleness | Score between 1 (not gentle) and 4 (very gentle) | 111 | 1 2.7 3.7 | According to Smartbees testing protocol [20] | Every 3 weeks between spring and summer | Mean of all notes |
| ‘Calmness’ | Calmness | Score between 1 (not calm) and 4 (very calm) | 110 | 1 2.5 3.5 | |||
| ‘Swarming’ | Swarming | Score given by evaluator | 106 | 0 12 38 | Colony gets 1 if presence of queen cells with egg, 2 if presence of queen cells with larvae, 3 if presence of capped queen cells. | At each visit (up to 2 times/week during swarming season) | Sum of scores of all visits. Colonies which swarmed got a final score of (maximal score of the apiary) +1. |
| Variable Name | Trait | Unit | N | Min Median Max | Evaluation Method | Frequency | Data Aggregation Method |
| ‘Varroaspring’ | Varroa rate in spring | Naturally fallen mites per day in Spring | 112 | 0 1 51 | Naturally fallen mites counted on an oiled paper placed below the meshed floor of the hive; bi-weekly counts and paper replacement; total timeframe of 3 weeks | During the three first weeks of testing in Spring | Mean mite fall per day |
| ‘Varroasummer’ | Varroa rate in summer | Mites/100 adult worker bees | 93 | 0 1.3 15.2 | Sample of about 300 adult workers taken from brood frames, washed with soap water | Once, at the end of the evaluation season | - |
| ‘Varroacumul’ | Varroa cumulated mite fall | Naturally fallen mites | 92 | 7 171 2559 | Naturally fallen mites counted on an oiled paper placed below the colony; bi-weekly counts and paper replacement; | During the whole season | Sum of all counted mites |
| ‘Varroagrowth’ | Varroa growth rate between Spring and summer | - | 91 | 0.52 1.13 2.06 | - | - | Combination of mite fall in Spring and infestation rate on workers in summer according to [21] |
| Variable Name | Trait | Unit | N | Min Median Max | Evaluation Method | Frequency | Data Aggregation Method |
| ‘Hygfull’ | Number of non-opened cells at the end of the pin-test | % of non-opened cells | 121 | 0 22.8 96.3 | Pin-killed brood according to standard protocol [19] checked after having been exposed to workers during 12 h overnight | Every three weeks from spring to summer | Mean of repetitions |
| ‘Hygprogress’ | Number of cells containing pupae in progress of being removed at the end of the pin-test | % of cells with pupae in progress of being removed | 121 | 2.7 34.4 62.0 | |||
| ‘Hygempty’ | Number of completely cleared cells at the end of the pin-test | % of completely cleared cells | 121 | 1 36.4 96.0 | |||
| ‘Colbeesspring’ | Colony size (workers) in spring | Number of workers | 116 | 3800 11,100 22,600 | Estimation by Liebefeld method [22,23] | Once at first colony evaluation in spring | - |
| ‘Colbroodspring’ | Colony size (brood) in spring | Surface of brood in dm2 | 116 | 9.7 50.9 105.9 | |||
| ‘Colbeessummer’ | Colony size (workers) in summer | Number of workers | 102 | 6100 13,900 20,600 | Once at last colony evaluation in summer | - | |
| ‘Colbroodsummer’ | Colony size (brood) in summer | Surface of brood in dm2 | 102 | 14.9 59.3 106.5 | |||
| ‘Colbeesgrowth’ | Colony size (workers) growth rate from spring to summer | - | 97 | 0.50 1.31 3.12 | Ratio of nb of workers in summer on nb of workers in spring | - | - |
| ‘Colbroodgrowth’ | Colony size (brood) growth rate from spring to summer | - | 97 | 0.58 1.12 3.65 | Ratio of brood surface in summer on brood surface in spring | - | - |
| Recapping | ||||||
|---|---|---|---|---|---|---|
| 2018 | R2018-B | R2018-C | R2018-D | R2018-E | R2018-F | |
| R2018-A | 0.01 (0.22) | 0.21(0.21) | −0.05 (0.22) | 0.58 (0.15) | 0.00 (0.22) | |
| R2018-B | 0.34(0.20) | −0.03 (0.22) | 0.41 (0.19) | −0.13 (0.22) | ||
| R2018-C | 0.07 (0.22) | 0.59 (0.15) | 0.19 (0.22) | |||
| R2018-D | −0.07 (0.22) | −0.23 (0.21) | ||||
| R2018-E | 0.46 (0.18) | |||||
| 2019 | R2019-B | R2019-C | ||||
| R2019-A | 0.31 (0.17) | 0.32 (0.17) | ||||
| R2019-B | 0.29 (0.17) | |||||
| 2020 | R2020-B | R2020-C | R2020-D | R2020-E | ||
| R2020-A | 0.28 (0.16) | 0.08 (0.17) | 0.02 (0.17) | −0.04 (0.17) | ||
| R2020-B | 0.15 (0.17) | 0.15 (0.17) | 0.07 (0.17) | |||
| R2020-C | 0.44 (0.14) | 0.22 (0.16) | ||||
| R2020-D | 0.05 (0.17) | |||||
| Solidness | ||||||
| 2018 | S2018-B | S2018-C | S2018-D | S2018-E | S2018-F | |
| S2018-A | 0.59 (0.15) | 0.18 (0.22) | 0.19 (0.22) | −0.19 (0.22) | 0.57 (0.15) | |
| S2018-B | −0.07 (0.22) | −0.06 (0.22) | −0.29 (0.21) | 0.13 (0.22) | ||
| S2018-C | 0.18 (0.22) | 0.19 (0.22) | 0.09 (0.22) | |||
| S2018-D | 0.06 (0.22) | −0.02 (0.22) | ||||
| S2018-E | 0.09 (0.22) | |||||
| 2019 | S2019-B | S2019-C | S2019-D | |||
| S2019-A | 0.12 (0.19) | −0.01 (0.19) | 0.11 (0.19) | |||
| S2019-B | 0.49 (0.15) | 0.23 (0.18) | ||||
| S2019-C | 0.35 (0.17) | |||||
| 2020 | S2020-B | S2020-C | S2020-D | S2020-E | ||
| S2020-A | 0.21 (0.17) | 0.01 (0.17) | 0.13 (0.17) | 0.46 (0.14) | ||
| S2020-B | 0.42 (0.14) | 0.80 (0.06) | 0.53 (0.13) | |||
| S2020-C | 0.46 (0.14) | 0.37 (0.15) | ||||
| S2020-D | 0.73 (0.08) | |||||
| Recapping | Solidness | Honey | Calmness | Swarming | Varroaspring | Varroasummer | Varroacumul | Varroagrowth | Hygfull | Hygprogress | Hygempty | Colbeesspring | Colbroodspring | Colbeessummer | Colbroodsummer | Colbeesgrowth | |
|---|---|---|---|---|---|---|---|---|---|---|---|---|---|---|---|---|---|
| Recapping | 0.05 (0.24) 0.04 (0.16) | ||||||||||||||||
| Solidness | −0.14 (0.11) | 0.25 (0.29) 0.24 (0.26) | |||||||||||||||
| Honey | −0.01 (0.11) | −0.01 (0.11) | 0.40 (0.28) 0.35 (0.27) | ||||||||||||||
| Calmness | −0.08 (0.11) | 0.11 (0.11) | 0.12 (0.11) | 0.62 (0.28) 0.54 (0.31) | |||||||||||||
| Swarming | 0.04 (0.11) | −0.06 (0.11) | −0.09 (0.11) | −0.10 (0.11) | 0.32 (0.34) 0.17 (0.25) | ||||||||||||
| Varroaspring | −0.01 (0.11) | −0.06 (0.11) | 0.12 (0.11) | 0.05 (0.11) | 0.17 (0.11) | 0.25 (0.20) 0.05 (0.18) | |||||||||||
| Recapping | Solidness | Honey | Calmness | Swarming | Varroaspring | Varroasummer | Varroacumul | Varroagrowth | Hygfull | Hygprogress | Hygempty | Colbeesspring | Colbroodspring | Colbeessummer | Colbroodsummer | Colbeesgrowth | |
| Varroasummer | −0.19 (0.11) | 0.11 (0.11) | −0.08 (0.11) | 0.07 (0.11) | 0.09 (0.11) | 0.29 (0.10) | 0.49 (0.26) 0.72 (0.30) | ||||||||||
| Varroacumul | −0.07 (0.11) | −0.09 (0.11) | 0.02 (0.11) | 0.13 (0.11) | 0.03 (0.11) | 0.38 (0.09) | 0.47 (0.09) | 0.16 (0.23) 0.08 (0.18) | |||||||||
| Varroagrowth | −0.11 (0.11) | 0.13 (0.11) | −0.09 (0.11) | 0.04 (0.11) | −0.15 (0.11) | −0.64 (0.06) | 0.38 (0.09) | −0.04 (0.11) | 0.15 (0.30) 0.13 (0.24) | ||||||||
| Hygfull | −0.23 (0.10) | 0.15 (0.11) | −0.08 (0.11) | 0.03 (0.11) | −0.02 (0.11) | 0.04 (0.11) | 0.32 (0.10) | 0.25 (0.10) | 0.10 (0.11) | 0.60 (0.18) 0.52 (0.20) | |||||||
| Hygprogress | 0.11 (0.11) | 0.00 (0.11) | −0.05 (0.11) | 0.09 (0.11) | 0.08 (0.11) | 0.12 (0.11) | −0.14 (0.11) | 0.04 (0.11) | −0.14 (0.11) | −0.37 (0.09) | 0.20 (0.22) 0.11 (0.15) | ||||||
| Hygempty | 0.20 (0.11) | −0.16 (0.11) | 0.12 (0.11) | −0.08 (0.11) | −0.04 (0.11) | −0.10 (0.11) | −0.26 (0.10) | −0.29 (0.10) | −0.03 (0.11) | −0.85 (0.03) | −0.17 (0.11) | 0.47 (0.21) 0.38 (0.20) | |||||
| Recapping | Solidness | Honey | Calmness | Swarming | Varroaspring | Varroasummer | Varroacumul | Varroagrowth | Hygfull | Hygprogress | Hygempty | Colbeesspring | Colbroodspring | Colbeessummer | Colbroodsummer | Colbeesgrowth | |
| Colbeesspring | 0.12 (0.11) | −0.24 (0.10) | 0.29 (0.10) | 0.05 (0.11) | 0.41 (0.09) | 0.33 (0.10) | −0.05 (0.11) | 0.14 (0.11) | −0.36 (0.10) | 0.01 (0.11) | 0.09 (0.11) | −0.06 (0.11) | 0.11 (0.22) 0.06 (0.15) | ||||
| Colbroodspring | 0.06 (0.11) | −0.07 (0.11) | 0.34 (0.10) | 0.10 (0.11) | 0.26 (0.10) | 0.36 (0.10) | −0.01 (0.11) | 0.10 (0.11) | −0.36 (0.10) | −0.09 (0.11) | 0.24 (0.10) | −0.04 (0.11) | 0.65 (0.06) | 0.10 (0.21) 0.08 (0.16) | |||
| Colbeessummer | −0.03 (0.11) | −0.28 (0.10) | 0.40 (0.09) | 0.14 (0.11) | 0.05 (0.11) | 0.09 (0.11) | 0.28 (0.10) | 0.31 (0.10) | 0.10 (0.11) | 0.36 (0.10) | −0.16 (0.11) | −0.29 (0.10) | 0.23 (0.10) | 0.23 (0.10) | 0.71 (0.19) 0.65 (0.24) | ||
| Colbroodsummer | 0.02 (0.11) | −0.26 (0.10) | 0.23 (0.10) | 0.00 (0.11) | 0.10 (0.11) | 0.14 (0.11) | −0.02 (0.11) | 0.21 (0.10) | −0.14 (0.11) | −0.22 (0.10) | 0.17 (0.11) | 0.14 (0.11) | 0.26 (0.10) | 0.38 (0.09) | 0.41 (0.09) | 0.01 (0.20) 0.07 (0.18) | |
| Colbeesgrowth | −0.12 (0.11) | −0.07 (0.11) | −0.14 (0.11) | −0.06 (0.11) | −0.32 (0.10) | −0.24 (0.10) | 0.20 (0.11) | 0.01 (0.11) | 0.38 (0.09) | 0.18 (0.11) | −0.08 (0.11) | −0.15 (0.11) | −0.69 (0.06) | −0.51 (0.08) | 0.38 (0.09) | 0.08 (0.11) | 0.19 (0.25) 0.12 (0.19) |
Publisher’s Note: MDPI stays neutral with regard to jurisdictional claims in published maps and institutional affiliations. |
© 2021 by the authors. Licensee MDPI, Basel, Switzerland. This article is an open access article distributed under the terms and conditions of the Creative Commons Attribution (CC BY) license (http://creativecommons.org/licenses/by/4.0/).
Share and Cite
Guichard, M.; Droz, B.; Brascamp, E.W.; von Virag, A.; Neuditschko, M.; Dainat, B. Exploring Two Honey Bee Traits for Improving Resistance Against Varroa destructor: Development and Genetic Evaluation. Insects 2021, 12, 216. https://0-doi-org.brum.beds.ac.uk/10.3390/insects12030216
Guichard M, Droz B, Brascamp EW, von Virag A, Neuditschko M, Dainat B. Exploring Two Honey Bee Traits for Improving Resistance Against Varroa destructor: Development and Genetic Evaluation. Insects. 2021; 12(3):216. https://0-doi-org.brum.beds.ac.uk/10.3390/insects12030216
Chicago/Turabian StyleGuichard, Matthieu, Benoît Droz, Evert W. Brascamp, Adrien von Virag, Markus Neuditschko, and Benjamin Dainat. 2021. "Exploring Two Honey Bee Traits for Improving Resistance Against Varroa destructor: Development and Genetic Evaluation" Insects 12, no. 3: 216. https://0-doi-org.brum.beds.ac.uk/10.3390/insects12030216