Article

Determination of Moisture and Protein Content in Living Mealworm Larvae (Tenebrio molitor L.) Using Near-Infrared Reflectance Spectroscopy (NIRS)

Institute of Food Technology and Bioprocess Engineering, University of Applied Sciences Bremerhaven, An der Karlstadt 8, 27568 Bremerhaven, Germany
*
Author to whom correspondence should be addressed.
Submission received: 12 May 2022 / Revised: 31 May 2022 / Accepted: 19 June 2022 / Published: 20 June 2022
(This article belongs to the Section Insect Physiology, Reproduction and Development)

Abstract

:

Simple Summary

Insects are increasingly becoming a new protein source for animal feed and human food. Spectroscopic methods, such as near-infrared reflectance spectroscopy, represent a non-destructive and rapid technique that can be applied to perform an online analysis in chemical composition. The aim of the research was to determine the moisture and protein content of living mealworm larvae using near-infrared spectroscopy as a new technique in analyzing nutritional changes. The prediction results of the near-infrared reflectance measurements of living mealworm larvae are presented in this study. The moisture and protein content of the larvae could be predicted with high accuracy and were specifically manipulated by using different water sources (pure water and carrots) and amounts and varying humidity. It was also determined that the larvae can be optimally provided with pure water as well as carrots. High humidity led to faster growth and a higher final weight, which has a positive effect on reducing the time to harvest. This study can help insect producers to have the possibility to measure the composition of the larvae quickly and easily using near-infrared spectroscopy, modify larval composition with regard to water and protein content and improve rearing conditions in terms of water supply for mealworm larvae.

Abstract

Yellow mealworm larvae (Tenebrio molitor L.) are a sustainable source of protein for food and feed. This study represents a new approach in analyzing changes in the nutritional composition of mealworm larvae using near-infrared reflectance spectroscopy (NIRS) combined with multivariate analysis. The moisture and protein content of living larvae were scanned with a near-infrared spectrometer using wavelengths from 1100 to 2100 nm. Different feeding groups with varying moisture sources and amount and the difference between low (50%) and high (75%) humidity were tested, and the influence on larval moisture and protein content was measured. A calibration was developed, with modified partial least squares as the regression method. The NIR spectra were influenced by the moisture and protein content of the larvae, because the absorbance values of the larval groups differed greatly. The coefficient of the determination of calibration (R2c) and prediction (R2p) were over 0.98 for moisture and over 0.94 for protein content. The moisture source and content also had a significant influence on the weight gain of the larvae. Consequently, significant differences in protein content could be determined, depending on the water supply available. With respect to wet weight, the larvae moisture content varied from 60 to 74% and protein content from 16 to 24%. This investigation revealed that with non-invasive NIRS online monitoring, the composition of insects can be continuously recorded and evaluated so that specific feeding can be carried out in the course of larval development and composition.

1. Introduction

Numerous forecasts indicate that the world population will reach over 9 billion people by 2050 [1], which will require roughly double the current food production [2]. Global warming is gradually reducing the areas available for food production worldwide [3]. Climate change and environmental degradation also have a negative impact on food productivity [4]. Regarding the increasing scarcity of resources, several alternative protein sources are proposed, with insects receiving the most attention [5]. The most promising and well-studied edible insects for industrial feed production are the black soldier fly (Hermetia illucens), yellow mealworm (Tenebrio molitor), locusts (Locusta migratoria) and termites [3]. The yellow mealworm is, due to the frequency of consumption, a promising candidate for breeding and production on an industrial scale [4]. Tenebrio molitor is the first insect species that has been declared safe as food and feed according to the Scientific Opinion of the European Food Safety Authority (EFSA) on edible insects in January 2021. Insects have a lower environmental impact (e.g., land and water requirements, greenhouse gas emissions) compared to livestock such as pigs or chickens, and indoor, urban and vertical farming are advantageous for insect rearing [6]. Insects have high water, protein and fat content as well as polyunsaturated fatty acids, vitamins and minerals and are considered an alternative to ensure feed and food security [2,4]. Protein content can range between 25 and 75% (dry matter basis) [7,8,9,10,11] and also the fat content has a high variance with 10 to 70% on a dry matter basis [8,11,12,13]. T. molitor larvae need a source of water for optimal growth, even if they have a high level of protection against evaporation [14]. They also have high growth rates and feed conversion efficiencies because they do not need energy to maintain a constant body temperature. Insects can be reared on organic side streams and transformed into high-value feed and food resources [4,15,16]. Several studies showed that the nutritional composition of the feeding substrate has an influence on insect larval composition [7,17,18,19], and relative humidity also has an impact on the survival, growth rate and life cycle of Tenebrio molitor. Humidity over 70% showed the best results for larval development, survival and growth [20,21]. In order to ensure balanced and targeted feeding or to achieve a desired larval composition, it is essential to monitor and regulate larval feeding and water supply.
Near-infrared reflectance spectroscopy (NIRS) emerged as a fast technique for the quantitative determination of several nutritional parameters (i.e., water and protein) simultaneously and is used for quality and process control of food and feed. Current standard analytical methods such as the Kjeldahl method for protein analysis are extremely inefficient in terms of resources and time, and they are completely unsuitable for small insect producers. Therefore, NIRS offers a high potential to minimize costs and time concerning analytical investigations of insect samples. Consequently, it often replaces standard wet-chemical procedures for quality and process control as the measurement is non-destructive and can be carried out without complex sample preparation [22]. As an optical method, it is based on the interaction of light with the sample and has been one of the most successful techniques used for food quality assessment [23]. Many studies showed the correlation between chemical composition and corresponding absorbance spectra recorded by near-infrared spectroscopy [24,25]. NIR spectra result from overtones and the combination bonds of C-H, O-H and N-H groups of stretching vibrations [26,27], which are the most abundant chemical constituents in biological samples. NIRS has been successfully used for the analysis of water and protein by different food sectors, such as meat [27,28,29], cereals [30,31], fruit [32,33] and cheese [34,35]. There are also some applications that could be used for the detection of insect pests in stored grains [36,37,38], but without analyzing the chemical composition of these insects. It is also possible to analyze the protein content of insect-based energy bars [39]. Some NIR models were built to classify edible insect powders using Fourier-transform infrared spectroscopy (FTIR) [40]. There is currently no known application for determining the moisture and protein content of living insect larvae by near-infrared reflectance spectroscopy.
The objective of the present work was to obtain NIR calibrations and develop multivariate classification models to predict the water and protein content in living mealworm larvae. We also wanted to find out the best way in which the larvae can be supplied with water to ensure optimal growth for commercial rearing and whether it is possible to obtain diverse reference data for the moisture and protein content of the larvae by offering different moisture sources and volumes.

2. Materials and Methods

2.1. Insect Samples and Feeding Groups

Larvae of Tenebrio molitor used in this study were cultured at the University of Applied Sciences Bremerhaven (Bremerhaven, Germany). Larvae were kept under controlled conditions in a constant climate chamber (HPP 110, Memmert, Schwabach, Germany) at a temperature of 27 °C with a relative humidity of 70% and were fed ad libitum with wheat bran. Larvae for the experiment were selected when they reached eight weeks. Each feeding group contained 100 individuals, with an average weight of 12.04 ± 0.01 mg per individual at the start of the experiment, and was fed ad libitum with wheat bran at a rearing temperature of 27 °C. Relative humidity was varied (50 and 75%), as was the water source (none, pure water or carrots), water volume and watering interval (daily, every two days, weekly) in order to modify larval composition and investigate the influence on the biomass growth. Table 1 presents the different feeding groups. Carrots were analyzed for their water content (average water content of 88%), resulting in a water content of about 2.6 g per 3.0 g carrot. Consequently, the amount of pure water was adjusted accordingly and spread evenly with a spray flask on the wheat bran. Larvae were kept in 400 mL glass beakers for a five-week period.
After an experimental period of five weeks, larvae were separated from food leftovers and frass, starved for 24 h and measured using NIRS. Larval weight, survival rate and the amount of food leftovers and frass were also recorded. Following parameters were then calculated as described by Waldbauer (1968) [41]:
Data for food consumption and weight gain per larvae (LWGpL; Equation (1)) were calculated and used for determination of feed utilization parameters:
LWGpL = Larval   weight   end     Larval   weight   start   Number   of   larvae   at   beginning     Number   of   dead   larvae
The feed conversion ratio (FCR; Equation (2)) as the amount of feed needed (in kg) to obtain one kg of wet weight increase in the production animal:
FCR = Feed   consumed Weight   gained
The efficiency of conversion of ingested food (ECI, %; Equation (3)) was calculated according to the following formula:
ECI = Weight   gained Feed   consumed   ×   100 %
as well as the specific growth rate (SGR, %/day; Equation (4)):
SGR = lnFBW   lnIBW experimental   days   ×   100 %
where FBW stands for final body weight and IBW for initial body weight. After recording the data, larvae were frozen at −21 °C for 48 h in a freezer (HAS 47520, Beko, Neu-Isenburg, Germany) and stored prior to performing chemical analyses.

2.2. Spectra Collection

Living mealworm larvae were placed in a glass petri dish with an internal diameter of 70 mm and a depth of 20 mm. Spectra were scanned and collected using a near-infrared reflectance spectrometer (PSS 2120, Polytec GmbH, Waldbronn, Germany) with a wavelength between 1100 and 2100 nm. All samples were scanned ten times and the spectra were averaged (50 spectra in total per sample) prior to conducting statistical analyses.

2.3. Multivariate Analysis

Spectral data were prepared using Matlab (version R2020a, The MathWorks Inc., Natick, MA, USA) combined with PLS Toolbox (version 8.9.1, Eigenvector Research Inc., Wenatchee, WA, USA) to develop a calibration model for the prediction of moisture and protein content of living mealworm larvae. Samples were randomly partitioned into two subsets, a calibration set (n = 120) and an independent validation set (n = 60), to develop the prediction equations. Partial least squares (PLS) regression was used to obtain classification models in order to discriminate the differences in moisture and protein content. Different mathematical methods, such as mean center (MC), multiple scatter correction (MSC) and 1st (1D)- and 2nd (2D)-order derivative, were used for preprocessing. The optimum number of latent variables (LV) was defined at the maximum value of the variance. The predictive capability and accuracy of the PLS models were evaluated based on the coefficient of determination for calibration (R2c), root mean square error of calibration (RMSEC), coefficient of determination in prediction (R2p) and root mean square error of prediction (RMSEP). The ratio of performance to deviation (RPD), which is defined as standard deviation/RMSEP, was calculated to determine the practical utility applicability of the prediction models. High RPD values are required, whereas RPD values above 10 are considered equal to the reference method, RPD values greater than 3 are regarded as adequate for routine analysis and RPD higher than 2 represents a robust calibration. Where RPD values below 1.5, the results are unreliable and models have no prediction ability [22,42,43]. The preferred model was chosen with respect to the highest RPD and R2p, the lowest RMSEP, and number of latent variables were limited (≤10).

2.4. Proximate Analysis

Nutritional composition of Tenebrio molitor larvae was analyzed as described previously [44]. Moisture content was determined by drying larvae at 103 °C for 4 h in a drying oven (U10, Memmert, Schwabach, Germany). Protein content was measured using the Kjeldahl method and calculated according to DIN EN 25663 and the Association of German Agricultural Analytic and Research Institutes by multiplying the measured nitrogen content with a factor of 6.25 [45]. Protein contents were expressed as a percentage on a fresh weight basis.

2.5. Statistical Analysis

Statistical significance of the feeding results, including analyses, were replicated and performed three times (n = 3) and checked for normality and homogeneity of variances. Statistical analysis was performed by one-way ANOVA, followed by a Tukey–Kramer post hoc test using SigmaPlot 12.5 (Systat Software Inc., Düsseldorf, Germany). A confidence interval of 95% (p < 0.05) was presumed.

3. Results

3.1. Growth Rate and Feed Conversion Efficiency

The larval growth, feed conversion ratio as well as efficiency and specific growth rate are presented in Table 2. The larval weight gain ranged from 8.5 to 60.5 mg per larvae, with the significantly lowest weight gain in the groups without a water source (groups A and C). The larvae mass increased with humidity (75%), so that the larvae were approximately twice as heavy as those reared at 50%, even when no water source was available. All parameters measured were significantly affected by diet type. Dietary supplementation of water and carrots improved the growth rates to 5.1% per day (group K). In the absence of a water source, the growth rates are very low (1.5 and 2.4 ± 0.1 in groups A and C). As the water supply decreases, so does the weight of the food consumed. Furthermore, the increase in body weight per unit of food consumed is greatly reduced. When humidity is at its lowest, the amount of food consumed becomes exceedingly small, and although copious amounts of water may be drunk, the larvae cannot utilize their food well. High humidity of 75% leads to a better growth rate, feed conversion ratio and efficiency. The survival rate in all groups was 100%.

3.2. Nutritional Analysis

The moisture and protein content of the T. molitor larvae are shown in Table 3. The moisture content of the T. molitor larvae varied between 60.8 ± 0.1 and 72.9 ± 0.5% and was significantly lower (p < 0.05) in groups A and C which had no water source. The highest moisture content in the larvae was attained in the groups that had pure water (2.6 g) or carrots (3.0 g) available on a daily basis or pure water (2.6 g) every two days, but there were no significant differences. Increasing the amount of carrot to 10 g did not result in a significant increase in the moisture content. The protein content did not vary as widely as the moisture content, but it was between 16.0 ± 0.6 and 23.5 ± 0.1%. The highest protein content was achieved by group C (50% rh, no water) with 23.5 ± 0.1%, followed by group A (75% rh, no water) with a protein content of 22.1 ± 0.1%. Both groups recorded the lowest moisture content with 60.8 ± 0.1% (C) and 62.7 ± 0.7% (A). On average, the protein content decreases with increasing moisture content.

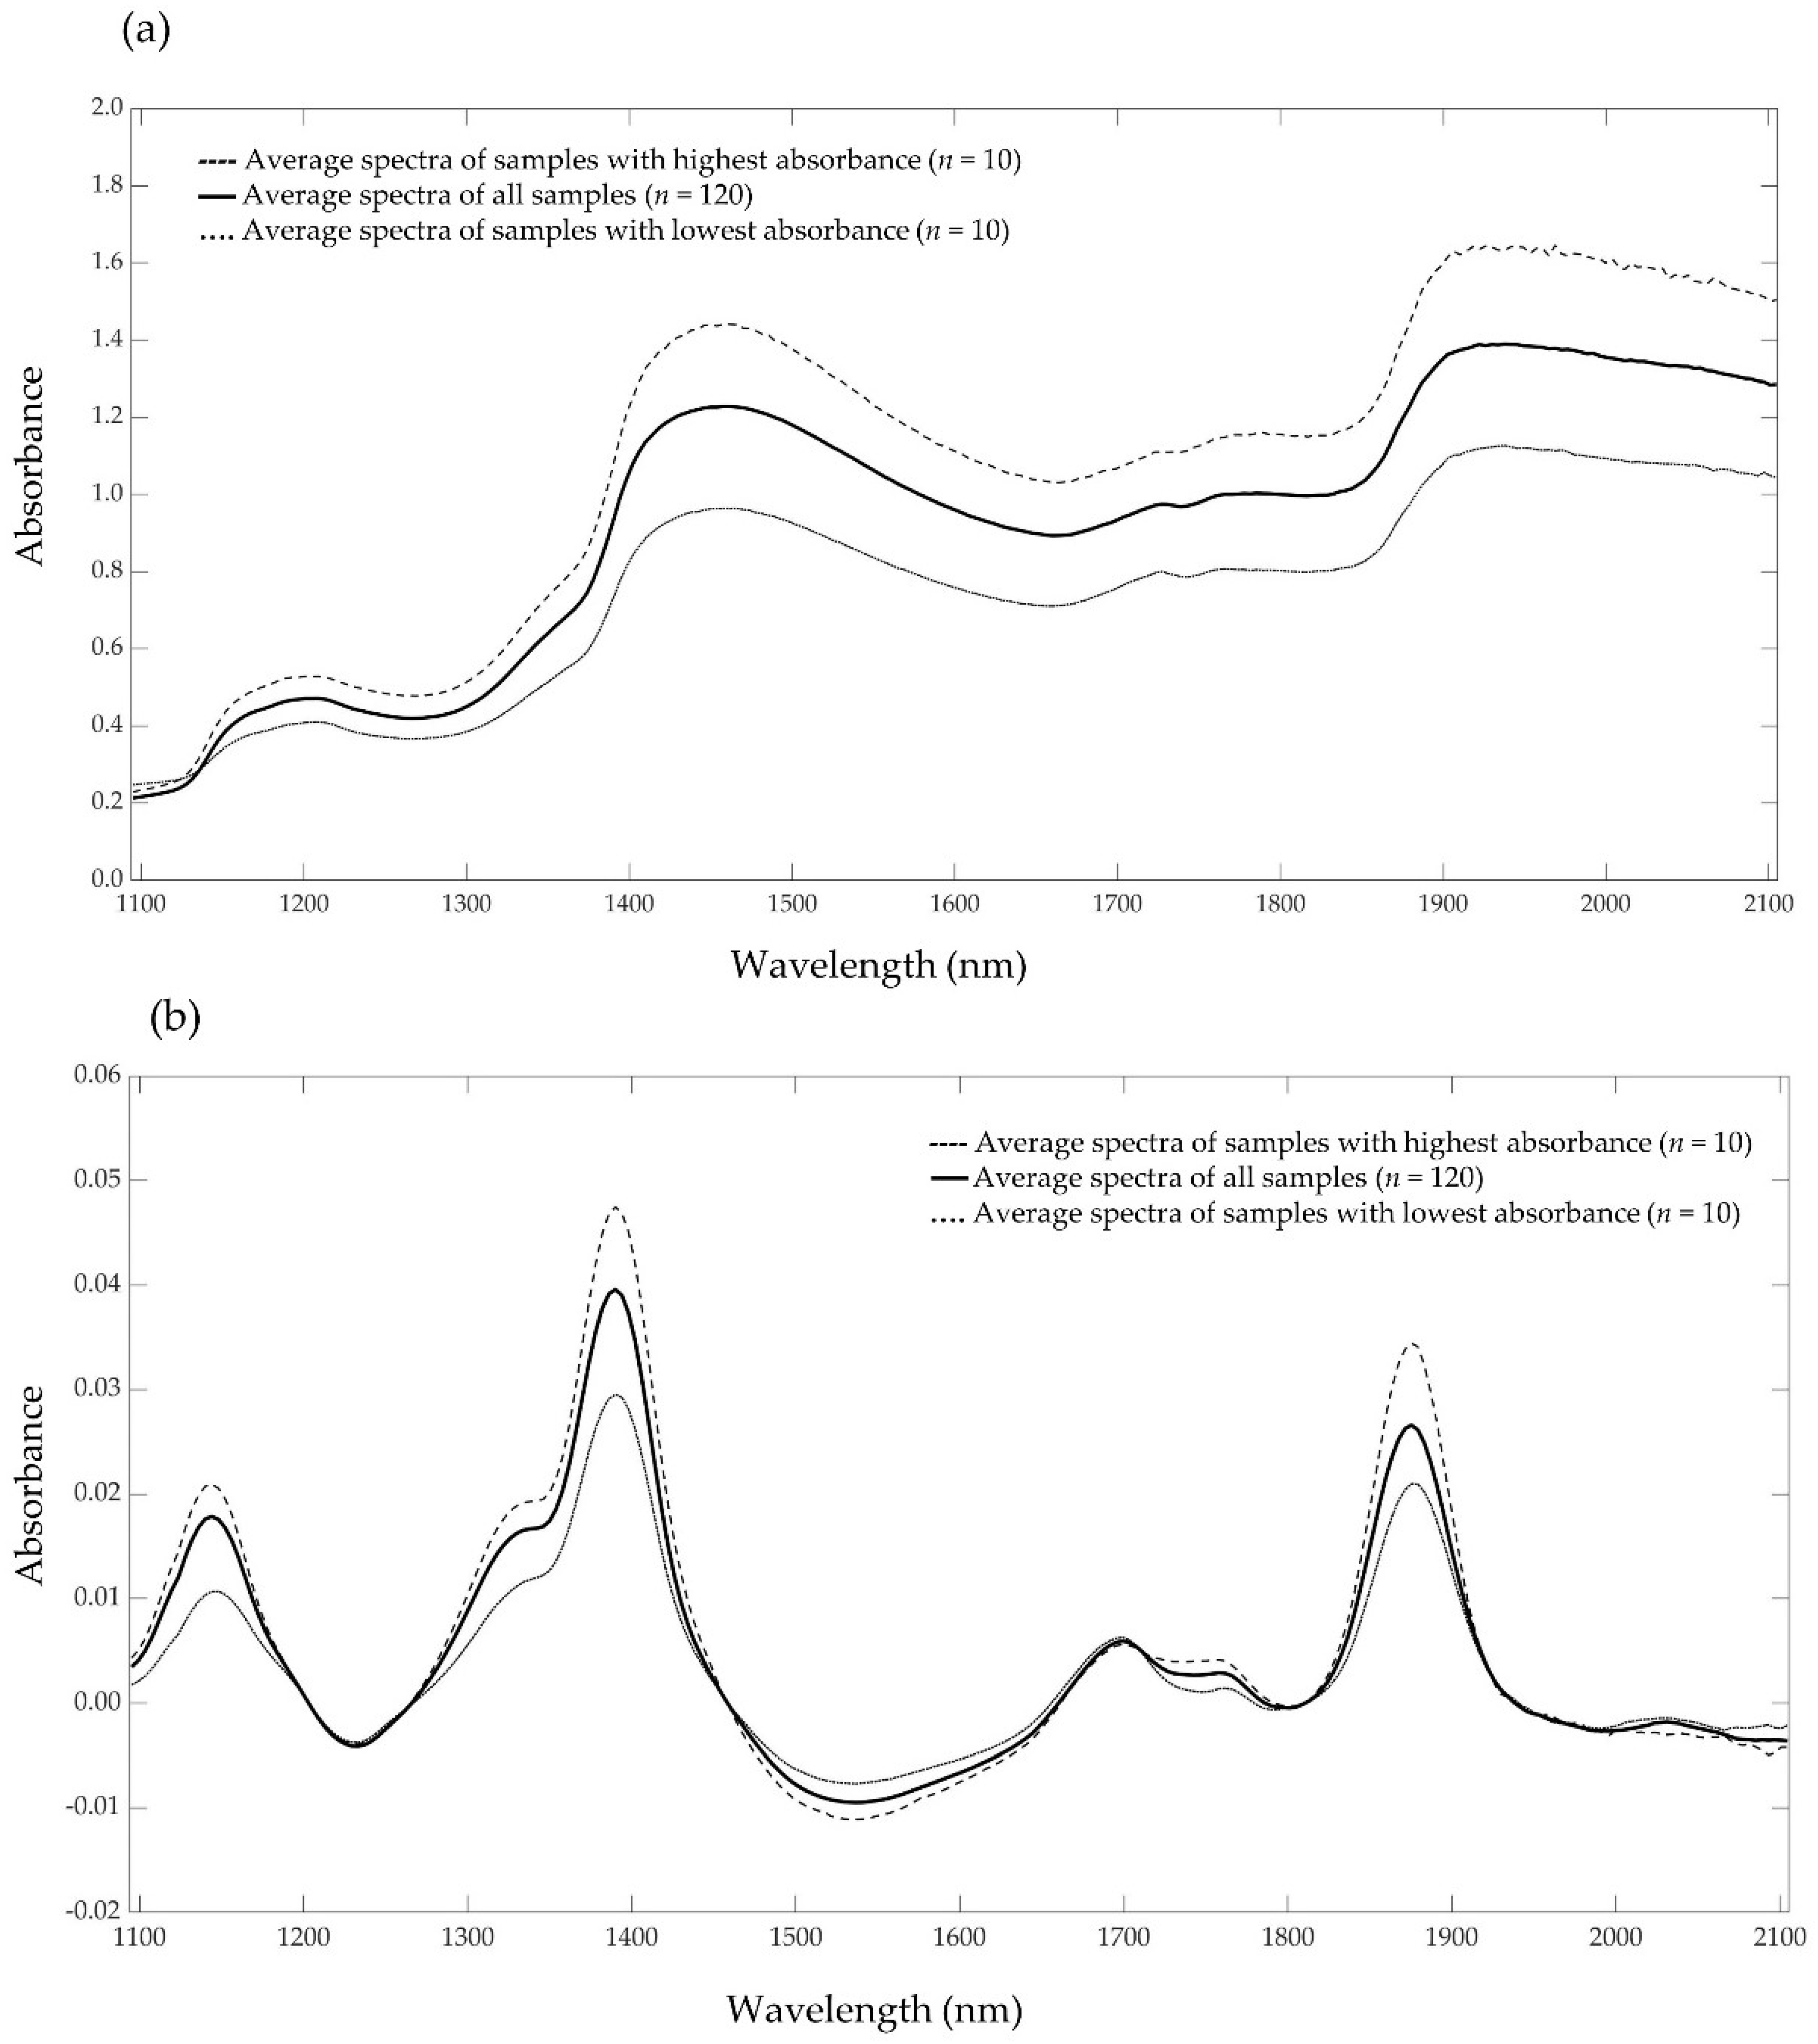
3.3. NIR Spectra and Reference Data

The average NIR raw spectra and first-order derivative preprocessed spectra are shown in Figure 1 (for further details of the NIR raw and preprocessed data of all groups, see Supplementary Figure S1). In the raw spectra (Figure 1a), six peaks can be identified at wavelengths of about 1200, 1450, 1726, 1785, 1950 and 2050 nm. Characteristic bands around 1200, 1726 and 1785 nm can be attributed to fat content [46,47]. Absorption bands at 1450 and 1950 nm can be related to moisture content [47]. Fluctuations in protein molecules begin at a wavelength around 2050 nm and fat molecules between 1725 and 1739 nm [48]. The first-order derivative preprocessing of the NIR spectra (Figure 1b) showed more abundant spectra bands and pronounced variance. The spectral shape was transformed and the signals highlighted by the first-order derivative attributable to the moisture and protein content of the samples [14,27].
Table 4 outlines the descriptive statistics for the moisture and protein content of the living mealworm larvae in the calibration and validation sets, measured by traditional chemical methods. Data showed a wide range of variability in the moisture content (between 60.4 and 72.9%), which is beneficial for the calibration development [27]. This variability is based on the different water source and humidity for the mealworm larvae. The variability in the protein content was lower, suggesting that the water source and amount does not have such a large impact on the protein composition of the larvae. During the development of the prediction equality, no outliers were detected.

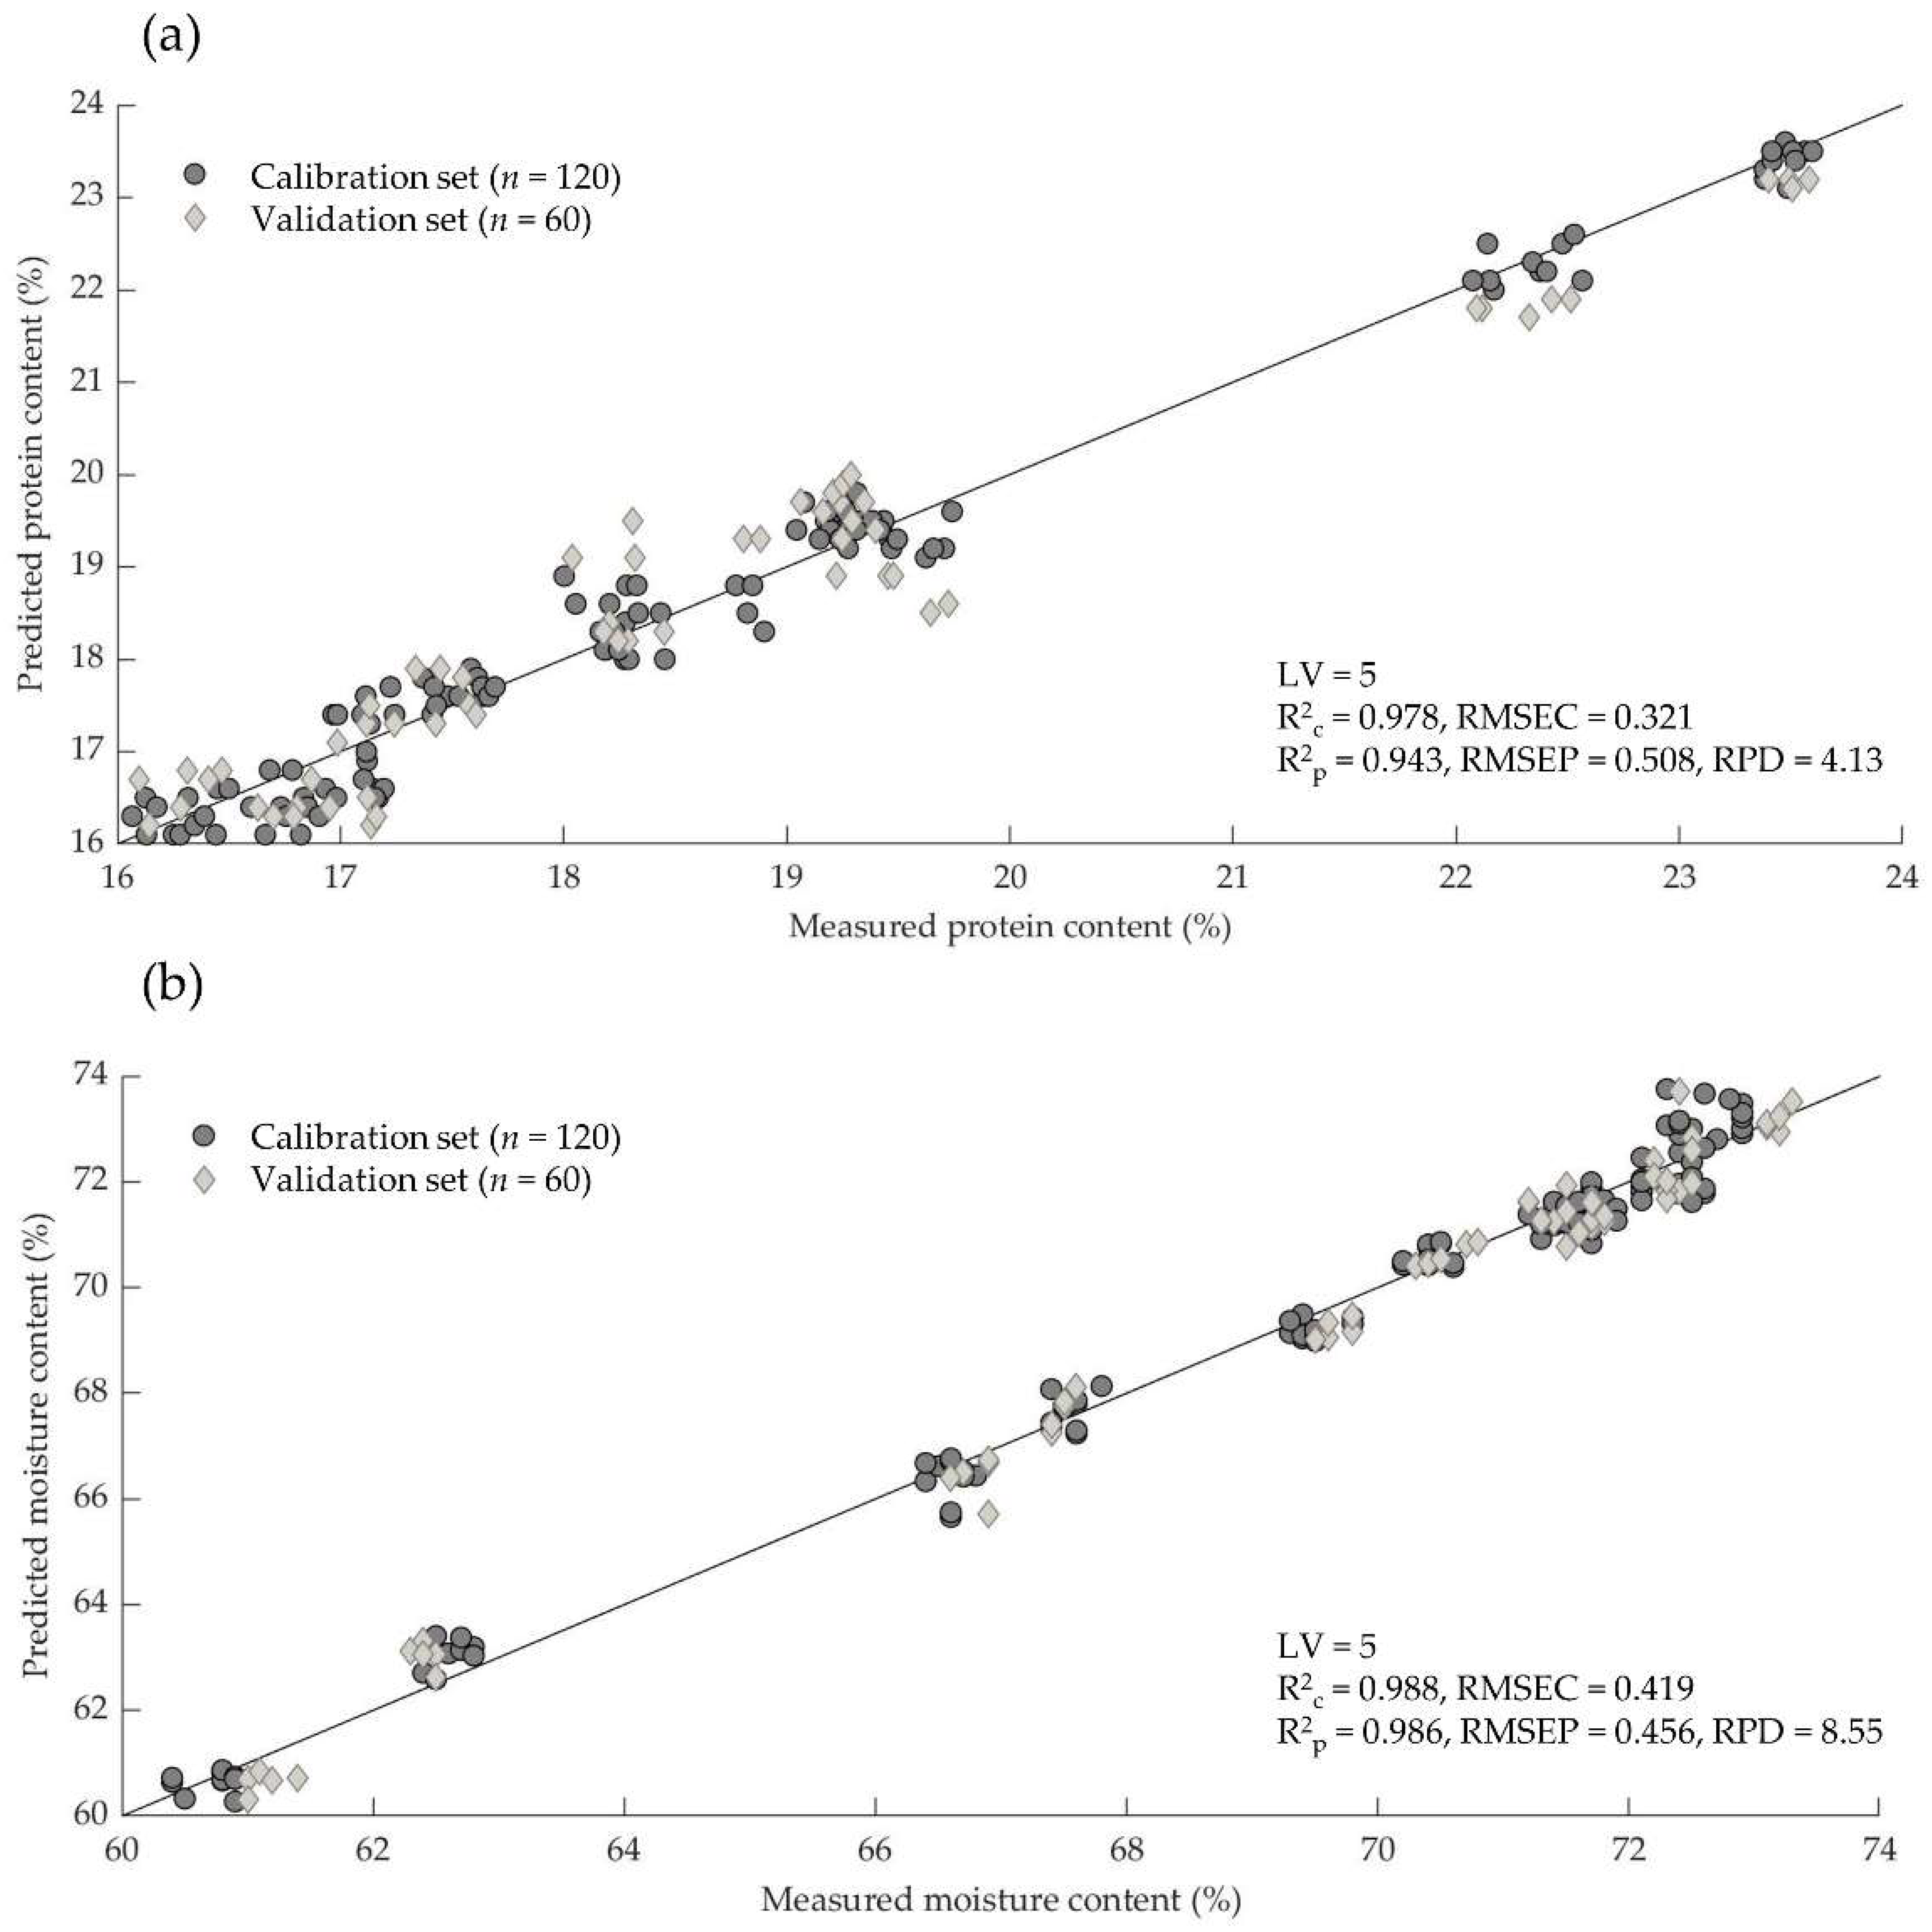
3.4. Prediction of Moisture and Protein Content

Table 5 summarizes the performance of the PLS models in the calibration and validation sets, based on raw spectra using different mathematical preprocessing treatments. Calibration models without pre-treatment do not provide the highest prediction accuracy. The calibration models were not improved by using MC, and the number of latent variables could not be reduced. After applying MSC, the predictability of the calibration model enhanced for all parameters and led to a smaller number of latent factors. The combination of MC and MSC with the 1st and 2nd derivative resulted in the smallest number of latent variables but reduced the predictability of the model. However, the mathematical treatment using the first derivative gave the best calibration models on all parameters for the prediction of the moisture and protein content, with high RPD values and very few latent variables.
The best model was selected in terms of a high R2p and RPD, a low RMSEP and a limitation of the number of factors (<10). The performance of the selected PLS model in terms of measured versus predicted values of moisture and protein is shown in Figure 2. The statistics indicate the ability to predict the moisture and protein content in living mealworm larvae (Table 5 and Figure 2). However, a mathematical preprocessing of the raw spectra is necessary to increase the prediction accuracy of the NIR models. For the prediction of the protein content (Figure 2a), the best results were observed with the 1st derivative pretreatment (R2p = 0.943, RMSEP = 0.508, RPD = 4.13).
For the moisture content, the prediction equation proved to be very reliable in the present study (Figure 2b). The best predictive ability was also achieved with the 1st derivative (R2p = 0.986, RMSEP = 0.456, RPD = 8.55). The range of the reference data for moisture is higher than for the protein content, so the prediction accuracy is better for this model too.
Insect breeders can determine larval composition using the two models. However, the requirement for this is a near-infrared reflectance spectrometer, which records the composition of the larvae and links it to the existing calibration for the evaluation of the measured data. The raw data of the calibration for the prediction of the water and protein content of yellow mealworm larvae determined in this study can be made available on request.

4. Discussion

The moisture and protein content for all groups of mealworm larvae in this study are comparable to other raw insects [49,50]. Our results clearly demonstrate that the protein content is hugely affected by water source and volume, and the moisture content of the larvae. In the groups with the simultaneous addition of water and carrots, no significant increase in the moisture content of the larvae could be observed, although the volume of water and the addition of carrots were increased. This could be due to the fact that the larvae are saturated with water at some point, meaning there is no advantage in adding more water. For industrial rearing, this points to the fact that mealworm larvae do not need to be watered daily, so the interval can be extended to every two days to achieve acceptable growth.
The results show that the relative humidity has a significant impact on larval composition and the biomass of the individual larvae, but it does not affect the survival rate at optimal rearing temperatures. This was also observed in other studies [20,21]. Larvae reared on dry wheat bran grew much more rapidly when pure water or carrots were available than when they were not, and the larvae showed highly significant differences in their specific growth rates. This is in agreement with the study by Urs and Hopkins [51]. Therefore, for an industrial mass production of Tenebrio molitor larvae, an increased humidity of 75% with an addition of a water source such as carrots would presumably lead to a faster growth rate with a higher final weight, which conclusively means a higher yield.
The reduced weight in the groups with no addition of water could also be an indication that evaporation is taking place. Weight loss rarely provides a reliable estimate of evaporation, as fecal excretion and larval metabolism also contribute to the reduced total weight [52]. However, some studies substantiate the conclusion that mealworms are an exception to this principle due to the storage of excreted nitrogen as uric acid and their special metabolism, because metabolic losses are compensated for by the amount of metabolic water gained [53,54].
No studies are currently available to predict the moisture and protein content in mealworm larvae or other insects. However, there is a large number of studies on animal products such as meat using NIRS, which are used for comparison. Our results are consistent with previously published data in poultry and beef samples (RPD > 2.56) [55,56,57,58]. On the other hand, no good correlations between the protein reference data and the NIR spectra (RPD < 2.35) for beef [59,60], poultry [61] and lamb [62] could be found in other studies. An explanation may be the analytical differences between NIRS (measures protein) and the Kjeldahl determination (measures nitrogen) [63], and the narrow variation range of protein content in beef samples [29]. Tenebrio molitor larvae have a high protein content [10,12,50], but also contain chitin in their cuticle [64]. Therefore, the true protein levels are overestimated when using the nitrogen-to-protein conversion factor of 6.25, due to the presence of non-protein nitrogen from chitin [65]. In our study, we did not determine the chitin content of the larvae and excluded that from the NIR spectra, so chitin and other nitrogen-containing compounds are also reflected. But other studies showed that is it possible to detect raw chitin using NIRS and create a calibration with a high prediction accuracy [66,67]. Hence, the prediction of chitin in living mealworm larvae could be the research topic of next studies. The prediction accuracy of the protein content is good in our study but may be improved by having a broader variability in the reference data, which positively influences the NIRS predictability. The difficulty is also in the measurement of living mealworm larvae, because the protein content can be predicted more precisely in homogenized samples, such as insect flour [68], than in intact samples [56]. The results show that calibration models without pre-treatment do not provide the highest prediction accuracy. This is in agreement with other studies [69,70]. The results for the prediction of the moisture content are much better as compared to beef [56,60], pork [58] or lamb [55]. Additionally, moisture and fat content can be highly correlated, meaning the ability of NIRS to predict moisture is similar to predicting fat content. We therefore wish to work out the correlation of the reference data and NIRS for fat in further studies and create NIR calibration models for the prediction of the fat content in living mealworm larvae.

5. Conclusions

The results of the current study prove the possibility of near-infrared reflectance spectroscopy to forecast moisture and protein content in living Tenebrio molitor larvae. Near-infrared spectroscopy offers an alternative to the standard analytical methods used to measure the chemical composition of mealworm larvae. It is possible to analyze the samples in their original live form, so that no larvae have to be killed for measurement. We were also able to show that mealworm larvae need a water source for rapid growth. This can be done as pure water or as a vegetable, such as carrots. In addition, it can be advantageous for industrial rearing to increase the humidity to 75%, so that the larvae also tend to grow faster and the time until harvest can be shortened.

Supplementary Materials

The following are available online at https://0-www-mdpi-com.brum.beds.ac.uk/article/10.3390/insects13060560/s1, Figure S1: Average NIR raw spectra (a) and preprocessed spectra (1st derivative) (b) of living mealworm larvae from all samples (n = 10) of all groups (n = 12).

Author Contributions

Conceptualization, N.K. and R.B.; methodology, N.K.; software, N.K.; validation, N.K.; formal analysis, N.K.; investigation, N.K.; resources, R.B.; data curation, N.K. and R.B.; writing—original draft preparation, N.K.; writing—review and editing, N.K. and R.B.; visualization, N.K.; supervision, R.B.; project administration, R.B.; funding acquisition, N.K. and R.B. All authors have read and agreed to the published version of the manuscript.

Funding

This project is supported via the German Federation of Industrial Research Associations (AIF—21106 N) within the program of promoting the Industrial Collective Research (IGF) of the German Ministry of Economics and Energy (BMWi), based on a resolution of the German Parliament.

Institutional Review Board Statement

Larval rearing and experiments were carried out under full observance of the German Animal Welfare Act.

Data Availability Statement

The data presented in this study are available on request from the corresponding author.

Acknowledgments

We would like to thank Deborah Lee for scientific editing and Pascal Krebs for his general support.

Conflicts of Interest

The authors declare no conflict of interest.

References

  1. Grafton, R.Q.; Daugbjerg, C.; Qureshi, M.E. Towards food security by 2050. Food Secur. 2015, 7, 179–183. [Google Scholar] [CrossRef]
  2. Belluco, S.; Losasso, C.; Maggioletti, M.; Alonzi, C.C.; Paoletti, M.G.; Ricci, A. Edible Insects in a Food Safety and Nutritional Perspective: A Critical Review. Compr. Rev. Food Sci. Food Saf. 2013, 12, 296–313. [Google Scholar] [CrossRef]
  3. Dobermann, D.; Swift, J.A.; Field, L.M. Opportunities and hurdles of edible insects for food and feed. Nutr. Bull. 2017, 42, 293–308. [Google Scholar] [CrossRef] [Green Version]
  4. van Huis, A.; Oonincx, D.G.A.B. The environmental sustainability of insects as food and feed. A review. Agron. Sustain. Dev. 2017, 37, 293–308. [Google Scholar] [CrossRef] [Green Version]
  5. Patel, S.; Suleria, H.A.R.; Rauf, A. Edible insects as innovative foods: Nutritional and functional assessments. Trends Food Sci. Technol. 2019, 86, 352–359. [Google Scholar] [CrossRef]
  6. Nikkhah, A.; van Haute, S.; Jovanovic, V.; Jung, H.; Dewulf, J.; Cirkovic Velickovic, T.; Ghnimi, S. Life cycle assessment of edible insects (Protaetia brevitarsis seulensis larvae) as a future protein and fat source. Sci. Rep. 2021, 11, 14030. [Google Scholar] [CrossRef] [PubMed]
  7. Finke, M.D. Nutrient Content of Insects. In Encyclopedia of Entomology; Capinera, J.L., Ed.; Kluwer Academic Publ: Dordrecht, The Netherlands, 2004; pp. 1563–1575. [Google Scholar]
  8. Finke, M.D. Complete nutrient content of four species of feeder insects. Zoo Biol. 2013, 32, 27–36. [Google Scholar] [CrossRef]
  9. Hong, J.; Han, T.; Kim, Y.Y. Mealworm (Tenebrio molitor Larvae) as an Alternative Protein Source for Monogastric Animal: A Review. Anim. Open Access J. MDPI 2020, 10, 2068. [Google Scholar] [CrossRef]
  10. Stull, V.J.; Kersten, M.; Bergmans, R.S.; Patz, J.A.; Paskewitz, S. Crude Protein, Amino Acid, and Iron Content of Tenebrio molitor (Coleoptera, Tenebrionidae) Reared on an Agricultural Byproduct from Maize Production: An Exploratory Study. Ann. Entomol. Soc. Am. 2019, 112, 533–543. [Google Scholar] [CrossRef]
  11. Mariod, A.A. Nutrient Composition of Mealworm (Tenebrio molitor). In African Edible Insects as Alternative Source of Food, Oil, Protein and Bioactive Components; Adam Mariod, A., Ed.; Springer eBook Collection, 1st ed.; Springer International Publishing: Cham, Germany, 2020; pp. 275–280. [Google Scholar]
  12. Bukkens, S.G. The nutritional value of edible insects. Ecol. Food Nutr. 1997, 36, 287–319. [Google Scholar] [CrossRef]
  13. Adámková, A.; Adámek, M.; Mlček, J.; Borkovcová, M.; Bednářová, M.; Kouřimská, L.; Skácel, J.; Ví tová, E. Welfare of the mealworm (Tenebrio molitor) breeding with regard to nutrition value and food safety. Potravin. Slovak J. Food Sci. 2017, 11, 460–465. [Google Scholar] [CrossRef] [Green Version]
  14. Murray, D.R.P. The importance of water on the normal growth of larvae of Tenebrio molitor. Entomol. Exp. Et Appl. 1968, 11, 149–168. [Google Scholar] [CrossRef]
  15. Rumpold, B.A.; Schlüter, O.K. Potential and challenges of insects as an innovative source for food and feed production. Innov. Food Sci. Emerg. Technol. 2013, 17, 1–11. [Google Scholar] [CrossRef]
  16. Sánchez-Muros, M.-J.; Barroso, F.G.; Manzano-Agugliaro, F. Insect meal as renewable source of food for animal feeding: A review. J. Clean. Prod. 2014, 65, 16–27. [Google Scholar] [CrossRef]
  17. Payne, C.L.; Scarborough, P.; Rayner, M.; Nonaka, K. A systematic review of nutrient composition data available for twelve commercially available edible insects, and comparison with reference values. Trends Food Sci. Technol. 2016, 47, 69–77. [Google Scholar] [CrossRef]
  18. Dreassi, E.; Cito, A.; Zanfini, A.; Materozzi, L.; Botta, M.; Francardi, V. Dietary fatty acids influence the growth and fatty acid composition of the yellow mealworm Tenebrio molitor (Coleoptera: Tenebrionidae). Lipids 2017, 52, 285–294. [Google Scholar] [CrossRef]
  19. Oonincx, D.G.A.B.; van Broekhoven, S.; van Huis, A.; van Loon, J.J.A. Feed Conversion, Survival and Development, and Composition of Four Insect Species on Diets Composed of Food By-Products. PLoS ONE 2015, 10, e0144601. [Google Scholar] [CrossRef] [Green Version]
  20. Mirzaeva, D.A.; Khujamshukurov, N.A.; Zokirov, B.; Soxibov, B.O.; Kuchkarova, D.K. Influence of Temperature and Humidity on the Development of Tenebrio molitor L. Int. J. Curr. Microbiol. Appl. Sci. 2020, 9, 3544–3559. [Google Scholar] [CrossRef]
  21. Johnsen, N.S.; Andersen, J.L.; Offenberg, J. The effect of relative humidity on the survival and growth rate of the yellow mealworm larvae (Tenebrio molitor, Linnaeus 1758). J. Insects Food Feed. 2021, 7, 311–318. [Google Scholar] [CrossRef]
  22. Prieto, N.; Andrés, S.; Giráldez, F.J.; Mantecón, A.R.; Lavín, P. Ability of near infrared reflectance spectroscopy (NIRS) to estimate physical parameters of adult steers (oxen) and young cattle meat samples. Meat Sci. 2008, 79, 692–699. [Google Scholar] [CrossRef]
  23. Fernández Pierna, J.A.; Vermeulen, P.; Amand, O.; Tossens, A.; Dardenne, P.; Baeten, V. NIR hyperspectral imaging spectroscopy and chemometrics for the detection of undesirable substances in food and feed. Chemom. Intell. Lab. Syst. 2012, 117, 233–239. [Google Scholar] [CrossRef]
  24. Kobayashi, K.-I.; Mori, M.; Nishino, K.; Toyota, T.; Nakauchi, S. Visualisation of Fat and Fatty Acid Distribution in Beef Using a Set of Filters Based on near Infrared Spectroscopy. J. Near Infrared Spectrosc. 2012, 20, 509–519. [Google Scholar] [CrossRef]
  25. Burger, J.; Geladi, P. Hyperspectral NIR imaging for calibration and prediction: A comparison between image and spectrometer data for studying organic and biological samples. Analyst 2006, 131, 1152–1160. [Google Scholar] [CrossRef] [PubMed]
  26. Osborne, B.G.; Fearn, T.; Hindle, P.H. Practical NIR Spectroscopy with Applications in Food and Beverage Analysis, 2nd ed.; Longman Food Technology; Longman Scientific & Technical: Harlow, UK, 1993. [Google Scholar]
  27. Prieto, N.; Roehe, R.; Lavín, P.; Batten, G.; Andrés, S. Application of near infrared reflectance spectroscopy to predict meat and meat products quality: A review. Meat Sci. 2009, 83, 175–186. [Google Scholar] [CrossRef] [PubMed]
  28. Isaksson, T.; Nilsen, B.N.; Tøgersen, G.; Hammond, R.P.; Hildrum, K.I. On-line, proximate analysis of ground beef directly at a meat grinder outlet. Meat Sci. 1996, 43, 245–253. [Google Scholar] [CrossRef]
  29. Prieto, N.; Andrés, S.; Giráldez, F.J.; Mantecón, A.R.; Lavín, P. Potential use of near infrared reflectance spectroscopy (NIRS) for the estimation of chemical composition of oxen meat samples. Meat Sci. 2006, 74, 487–496. [Google Scholar] [CrossRef] [PubMed]
  30. Bruno-Soares, A.M.; Murray, I.; Paterson, R.M.; Abreu, J.M. Use of near infrared reflectance spectroscopy (NIRS) for the prediction of the chemical composition and nutritional attributes of green crop cereals. Anim. Feed. Sci. Technol. 1998, 75, 15–25. [Google Scholar] [CrossRef]
  31. Caporaso, N.; Whitworth, M.B.; Fisk, I.D. Near-Infrared spectroscopy and hyperspectral imaging for non-destructive quality assessment of cereal grains. Appl. Spectrosc. Rev. 2018, 53, 667–687. [Google Scholar] [CrossRef] [Green Version]
  32. Dong, W.; Ni, Y.; Kokot, S. A near-infrared reflectance spectroscopy method for direct analysis of several chemical components and properties of fruit, for example, Chinese hawthorn. J. Agric. Food Chem. 2013, 61, 540–546. [Google Scholar] [CrossRef]
  33. Yi, J.; Sun, Y.; Zhu, Z.; Liu, N.; Lu, J. Near-infrared reflectance spectroscopy for the prediction of chemical composition in walnut kernel. Int. J. Food Prop. 2017, 20, 1633–1642. [Google Scholar] [CrossRef]
  34. Frank, J.F.; Birth, G.S. Application of Near Infrared Reflectance Spectroscopy to Cheese Analysis. J. Dairy Sci. 1982, 65, 1110–1116. [Google Scholar] [CrossRef]
  35. Margolies, B.J.; Barbano, D.M. Determination of fat, protein, moisture, and salt content of Cheddar cheese using mid-infrared transmittance spectroscopy. J. Dairy Sci. 2018, 101, 924–933. [Google Scholar] [CrossRef] [PubMed] [Green Version]
  36. Dowell, F.E.; Throne, J.E.; Wang, D.; Baker, J.E. Identifying Stored-Grain Insects Using Near-Infrared Spectroscopy. J. Econ. Entomol. 1999, 92, 165–169. [Google Scholar] [CrossRef]
  37. Johnson, J.B. An overview of near-infrared spectroscopy (NIRS) for the detection of insect pests in stored grains. J. Stored Prod. Res. 2020, 86, 101558. [Google Scholar] [CrossRef]
  38. Biancolillo, A.; Firmani, P.; Bucci, R.; Magrì, A.; Marini, F. Determination of insect infestation on stored rice by near infrared (NIR) spectroscopy. Microchem. J. 2019, 145, 252–258. [Google Scholar] [CrossRef]
  39. Beć, K.B.; Grabska, J.; Plewka, N.; Huck, C.W. Insect Protein Content Analysis in Handcrafted Fitness Bars by NIR Spectroscopy. Gaussian Process Regression and Data Fusion for Performance Enhancement of Miniaturized Cost-Effective Consumer-Grade Sensors. Molecules 2021, 26, 6390. [Google Scholar] [CrossRef]
  40. Mellado-Carretero, J.; García-Gutiérrez, N.; Ferrando, M.; Güell, C.; García-Gonzalo, D.; Lamo-Castellví, S. de Rapid discrimination and classification of edible insect powders using ATR-FTIR spectroscopy combined with multivariate analysis. J. Insects Food Feed. 2020, 6, 141–148. [Google Scholar] [CrossRef]
  41. Waldbauer, G.P. The Consumption and Utilization of Food by Insects. In Advances in Insect Physiology; Academic Press: London, UK, 1968; Volume 5, pp. 229–288. [Google Scholar]
  42. Barlocco, N.; Vadell, A.; Ballesteros, F.; Galietta, G.; Cozzolino, D. Predicting intramuscular fat, moisture and Warner-Bratzler shear force in pork muscle using near infrared reflectance spectroscopy. Anim. Sci. 2006, 82, 111–116. [Google Scholar] [CrossRef]
  43. Chang, C.-W.; Laird, D.A. Near-infrared reflectance spectroscopic analyis of soil C and N. Soil Sci. 2002, 167, 110–116. [Google Scholar] [CrossRef]
  44. Kröncke, N.; Grebenteuch, S.; Keil, C.; Demtröder, S.; Kroh, L.; Thünemann, A.F.; Benning, R.; Haase, H. Effect of Different Drying Methods on Nutrient Quality of the Yellow Mealworm (Tenebrio molitor L.). Insects 2019, 10, 84. [Google Scholar] [CrossRef] [Green Version]
  45. Verband Deutscher Landwirtschaftlicher Untersuchungs-und Forschungsanstalten. VDLUFA methodenbuch III. In VDLUFA-Verlag (Vol Ed), Band III-Die Chemische Untersuchung von Futtermitteln; VDLUFA-Verlag: Bonn, Germany, 2013; p. 2190. [Google Scholar]
  46. Rødbotten, R.; Nilsen, B.; Hildrum, K. Prediction of beef quality attributes from early post mortem near infrared reflectance spectra. Food Chem. 2000, 69, 427–436. [Google Scholar] [CrossRef]
  47. Leroy, B.; Lambotte, S.; Dotreppe, O.; Lecocq, H.; Istasse, L.; Clinquart, A. Prediction of technological and organoleptic properties of beef Longissimus thoracis from near-infrared reflectance and transmission spectra. Meat Sci. 2004, 66, 45–54. [Google Scholar] [CrossRef]
  48. Fourty, T.; Baret, F.; Jacquemoud, S.; Schmuck, G.; Verdebout, J. Leaf optical properties with explicit description of its biochemical composition: Direct and inverse problems. Remote Sens. Environ. 1996, 56, 104–117. [Google Scholar] [CrossRef]
  49. van Huis, A.; Rumpold, B.; Maya, C.; Roos, N. Nutritional Qualities and Enhancement of Edible Insects. Annu. Rev. Nutr. 2021, 41, 551–576. [Google Scholar] [CrossRef] [PubMed]
  50. Rumpold, B.A.; Schlüter, O.K. Nutritional composition and safety aspects of edible insects. Mol. Nutr. Food Res. 2013, 57, 802–823. [Google Scholar] [CrossRef]
  51. Urs, K.; Hopkins, T.L. Effect of moisture on growth rate and development of two strains of Tenebrio molitor L. (Coleoptera, Tenebrionidae). J. Stored Prod. Res. 1973, 8, 291–297. [Google Scholar] [CrossRef]
  52. Machin, J. Water balance in Tenebrio molitor, L. Larvae; the effect of atmospheric water absorption. J. Comp. Physiol. B 1975, 101, 121–132. [Google Scholar] [CrossRef]
  53. Mellanby, K. Humidity and Insect Metabolism. Nature 1936, 138, 124–125. [Google Scholar] [CrossRef]
  54. Mellanby, K. The effect of atmospheric humidity on the metabolism of the fasting mealworm (Tenebrio molitor L., Coleoptera). Proc. R. Soc. London. Ser. B, Boil. Sci. 1932, 111, 376–390. [Google Scholar] [CrossRef] [Green Version]
  55. Viljoen, M.; Hoffman, L.C.; Brand, T.S. Prediction of the chemical composition of mutton with near infrared reflectance spectroscopy. Small Rumin. Res. 2007, 69, 88–94. [Google Scholar] [CrossRef] [Green Version]
  56. Cozzolino, D.; Murray, I. Effect of Sample Presentation and Animal Muscle Species on the Analysis of Meat by near Infrared Reflectance Spectroscopy. J. Near Infrared Spectrosc. 2002, 10, 37–44. [Google Scholar] [CrossRef]
  57. Berzaghi, P.; Dalle Zotte, A.; Jansson, L.M.; Andrighetto, I. Near-infrared reflectance spectroscopy as a method to predict chemical composition of breast meat and discriminate between different n-3 feeding sources. Poult. Sci. 2005, 84, 128–136. [Google Scholar] [CrossRef] [PubMed]
  58. Viljoen, M.; Hoffman, L.C.; Brand, T.S. Prediction of the chemical composition of freeze dried ostrich meat with near infrared reflectance spectroscopy. Meat Sci. 2005, 69, 255–261. [Google Scholar] [CrossRef] [PubMed]
  59. Alomar, D.; Gallo, C.; Castañeda, M.; Fuchslocher, R. Chemical and discriminant analysis of bovine meat by near infrared reflectance spectroscopy (NIRS). Meat Sci. 2003, 63, 441–450. [Google Scholar] [CrossRef]
  60. Tøgersen, G.; Arnesen, J.; Nilsen, B.; Hildrum, K. On-line prediction of chemical composition of semi-frozen ground beef by non-invasive NIR spectroscopy. Meat Sci. 2003, 63, 515–523. [Google Scholar] [CrossRef]
  61. McDevitt, R.M.; Gavin, A.J.; Andrés, S.; Murray, I. The Ability of Visible and near Infrared Reflectance Spectroscopy to Predict the Chemical Composition of Ground Chicken Carcasses and to Discriminate between Carcasses from Different Genotypes. J. Near Infrared Spectrosc. 2005, 13, 109–117. [Google Scholar] [CrossRef]
  62. Cozzolino, D.; Murray, I.; Scaife, J.R.; Paterson, R. Study of dissected lamb muscles by visible and near infrared reflectance spectroscopy for composition assessment. Anim. Sci. 2000, 70, 417–423. [Google Scholar] [CrossRef]
  63. Lanza, E. Determination of Moisture, Protein, Fat, and Calories in Raw Pork and Beef By Near Infrared Spectroscopy. J. Food Sci. 1983, 48, 471–474. [Google Scholar] [CrossRef]
  64. Song, Y.-S.; Kim, M.-W.; Moon, C.; Seo, D.-J.; Han, Y.S.; Jo, Y.H.; Noh, M.Y.; Park, Y.-K.; Kim, S.-A.; Kim, Y.W.; et al. Extraction of chitin and chitosan from larval exuvium and whole body of edible mealworm, Tenebrio molitor. Entomol. Res. 2018, 48, 227–233. [Google Scholar] [CrossRef]
  65. Janssen, R.H.; Vincken, J.-P.; van den Broek, L.A.M.; Fogliano, V.; Lakemond, C.M.M. Nitrogen-to-Protein Conversion Factors for Three Edible Insects: Tenebrio molitor, Alphitobius diaperinus, and Hermetia illucens. J. Agric. Food Chem. 2017, 65, 2275–2278. [Google Scholar] [CrossRef]
  66. Song, H.-S.; Lee, K.-T.; Park, S.-M.; Kang, O.-J.; Cheong, H.-S. Measurement of Deproteinization and Deacetylation of Chitin and Chitosan by Near Infrared Spectroscopy. Korean J. Fish. Aquat. Sci. 2003, 36, 88–93. [Google Scholar] [CrossRef] [Green Version]
  67. Chen, S.; Tsai, C.-C.; Chen, R.L.; Yang, I.-C.; Hsiao, H.-Y.; Chen, C.-T.; Yang, C.-W. Deacetylation of Chitinous Materials Using Near Infrared Spectroscopy. Eng. Agric. Environ. Food 2008, 1, 33–38. [Google Scholar] [CrossRef]
  68. Benes, E.; Biró, B.; Fodor, M.; Gere, A. Analysis of wheat flour-insect powder mixtures based on their near infrared spectra. Food Chem. X 2022, 13, 100266. [Google Scholar] [CrossRef] [PubMed]
  69. Brøndum, J.; Munck, L.; Henckel, P.; Karlsson, A.; Tornberg, E.; Engelsen, S.B. Prediction of water-holding capacity and composition of porcine meat by comparative spectroscopy. Meat Sci. 2000, 55, 177–185. [Google Scholar] [CrossRef]
  70. Thennadil, S.N.; Martin, E.B. Empirical preprocessing methods and their impact on NIR calibrations: A simulation study. J. Chemom. 2005, 19, 77–89. [Google Scholar] [CrossRef]
Figure 1. Average NIR raw spectra (a) and preprocessed spectra (1st derivative) (b) of living mealworm larvae from samples with highest and lowest absorbance compared to all samples.
Insects 13 00560 g001
Figure 2. Comparison of measured and predicted values of protein (a) and moisture (b) content of living mealworm larvae in calibration and validation sets by NIRS (1100–2100 nm).
Insects 13 00560 g002
Table 1. Feeding groups of T. molitor larvae.
GroupRelative Humidity (%)Water SourceWatering Interval
A75None-
B75Pure water (2.6 g)1 × per day
C50None-
D50Pure water (2.6 g)1 × per day
E50Carrots (3.0 g)1 × per week
F75Pure water (2.6 g)Every two days
G75Carrots (3.0 g)1 × per week
H75Carrots (3.0 g)Every two days
I75Carrots (3.0 g)1 × per day
J75Carrots (10.0 g)1 × per week
K75Pure water (2.6 g) and carrots (3.0 g)1 × per week and 1 × per day
L75Pure water (2.6 g) and carrots (10.0 g)1 × per week and 1 × per day
Table 2. Average larval weight gain per larvae, feed conversion ratio (FCR), feed conversion efficiency (ECI) and specific growth rate (SGR) of Tenebrio molitor larvae. Values are given as mean ± standard deviation, n = 3.
GroupLWGpL (mg)FCR (-)ECI (%)SGR (% per Day)
A16.0 ± 0.1 g5.8 ± 0.2 b17.3 ± 0.7 e2.4 ± 0.1 e
B60.5 ± 0.1 a2.3 ± 0.0 e44.4 ± 0.9 b5.1 ± 0.0 a
C8.5 ± 0.0 h8.9 ± 0.2 a11.3 ± 0.3 f1.5 ± 0.1 f
D51.9 ± 0.2 c2.3 ± 0.0 e42.8 ± 0.4 b4.8 ± 0.1 a
E31.0 ± 0.1 f2.7 ± 0.1 c36.8 ± 0.9 d3.6 ± 0.1 d
F43.8 ± 0.1 d2.3 ± 0.1 e43.8 ± 1.0 b4.4 ± 0.0 b
G38.7 ± 0.1 e2.5 ± 0.1 d39.9 ± 1.0 c4.1 ± 0.0 c
H56.2 ± 0.1 b1.8 ± 0.0 f56.1 ± 1.0 a4.9 ± 0.0 a
I55.4 ± 0.4 b1.8 ± 0.1 f55.2 ± 3.9 a4.9 ± 0.2 a
J44.7 ± 0.0 d2.2 ± 0.0 e44.6 ± 0.5 b4.4 ± 0.0 b
K60.1 ± 0.1 a2.3 ± 0.1 e42.9 ± 1.0 b5.1 ± 0.0 a
L56.6 ± 0.3 b2.5 ± 0.1 d40.2 ± 1.7 b5.0 ± 0.1 a
a–h Superscripts denote significant differences; p < 0.05; A: 75% rh, no water; B: 75% rh, 2.6 g water per day; C: 50% rh, no water; D: 50% rh, 2.6 g water per day; E: 50% rh, 3.0 g carrots per week; F: 75% rh, 2.6 g water every two days; G: 75% rh, 3.0 g carrots per week; H: 75% rh, 3.0 g carrots every two days; I: 75% rh, 3.0 g carrots per day; J: 75% rh, 10.0 g carrots per week; K: 2.6 g water per week and 3.0 g carrots per day; L: 75% rh, 2.6 g water per week and 10.0 g carrots per day.
Table 3. Moisture and protein content of living mealworm larvae on a fresh weight (FW) basis (%). Values are given as mean ± standard deviation, n = 3.
GroupMoisture (%)Protein (% FW)
A62.7 ± 0.7 c22.1 ± 0.1 b
B72.6 ± 0.6 a16.5 ± 0.3 e
C60.8 ± 0.1 d23.5 ± 0.1 a
D71.5 ± 0.6 a17.6 ± 0.6 d
E67.3 ± 0.5 b19.2 ± 0.3 c
F72.6 ± 2.1 a19.4 ± 0.5 c
G66.5 ± 1.2 b18.9 ± 0.5 c
H71.6 ± 0.7 a16.0 ± 0.6 e
I72.9 ± 0.5 a16.5 ± 0.1 e
J69.2 ± 2.3 ab19.5 ± 0.2 c
K70.4 ± 0.6 a18.0 ± 0.2 d
L71.5 ± 1.2 a17.4 ± 0.4 d
a–e Superscripts denote significant differences. A: 75% rh, no water; B: 75% rh, 2.6 g water per day; C: 50% rh, no water; D: 50% rh, 2.6 g water per day; E: 50% rh, 3.0 g carrots per week; F: 75% rh, 2.6 g water every two days; G: 75% rh, 3.0 g carrots per week; H: 75% rh, 3.0 g carrots every two days; I: 75% rh, 3.0 g carrots per day; J: 75% rh, 10.0 g carrots per week; K: 2.6 g water per week and 3.0 g carrots per day; L: 75% rh, 2.6 g water per week and 10.0 g carrots per day.
Table 4. Moisture and protein content in living mealworm larvae (values given in % of wet weight) for calibration and validation sets.
StatisticsCalibration Set (%)Validation Set (%)
MoistureProteinMoistureProtein
n1201206060
Mean69.118.769.218.8
Minimum60.416.161.016.3
Maximum72.923.673.323.2
SD3.82.23.92.1
SD, standard deviation.
Table 5. Statistics of prediction models for moisture and protein content in living mealworm larvae by NIRS (1100–2100 nm).
ItemMathematical TreatmentNo. of Latent VariablesCalibration SetValidation Set
R2cRMSECR2pRMSEPRPD
MoistureNone70.9221.0840.9101.1713.33
MC70.8491.5390.8341.6182.41
MSC50.9660.7010.9660.7115.49
1D50.9880.4190.9860.4568.55
2D60.8651.4560.8671.4452.70
MC + 1D40.9530.8290.9530.8324.69
MSC + 1D40.9520.8370.9490.8684.49
ProteinNone70.9310.5650.8950.6883.05
MC70.8560.8210.8080.9322.25
MSC50.9440.5060.9150.6113.44
1D50.9780.3210.9430.5084.13
2D60.8980.6900.8710.7632.75
MC + 1D40.9400.5250.9160.6073.46
MSC + 1D40.9130.6310.8920.6833.08
MC: mean centering; MSC: multiple scatter correction; 1D and 2D: 1st and 2nd derivative; R2c: coefficient of determination for calibration; RMSEC: root mean square error of calibration; R2p: coefficient of determination for prediction; RMSEP: root mean square error of prediction; RPD: ratio of performance deviation.
Publisher’s Note: MDPI stays neutral with regard to jurisdictional claims in published maps and institutional affiliations.

