Article

Salt Stress Induces Non-CG Methylation in Coding Regions of Barley Seedlings (Hordeum vulgare)

by
Moumouni Konate
1,2,
Michael J. Wilkinson
3,*,
Benjamin T. Mayne
4,
Stephen M. Pederson
5,
Eileen S. Scott
2,
Bettina Berger
6 and
Carlos M. Rodriguez Lopez
2,7,*
1
Institut de l’Environnement et de Recherche Agricole (INERA), Station de Farako-Ba, 01 BP 910 Bobo-Dioulasso 01, Burkina Faso
2
School of Agriculture, Food and Wine, Waite Research Institute, The University of Adelaide, Waite Campus, PMB 1, Glen Osmond, SA 5064, Australia
3
Pwllpeiran Upland Research Centre, Institute of Biological, Environmental and Rural Sciences, Penglais Campus, Aberystwyth, Ceredigion SY23 3FG, UK
4
Robinson Research Institute, School of Medicine, The University of Adelaide, Adelaide, SA 5005, Australia
5
Bioinformatics Hub, School of Biological sciences, The University of Adelaide, Adelaide, SA 5005, Australia
6
The Plant Accelerator, Australian Plant Phenomics Facility, School of Agriculture, Food and Wine, Waite Research Institute, The University of Adelaide, Waite Campus, PMB 1, Glen Osmond, SA 5064, Australia
7
Environmental Epigenetics and Genetics Group, Department of Horticulture, College of Agriculture, Food and Environment, University of Kentucky, Lexington, KY 40546, USA
*
Authors to whom correspondence should be addressed.
Submission received: 24 April 2018 / Revised: 5 June 2018 / Accepted: 7 June 2018 / Published: 20 June 2018
(This article belongs to the Special Issue Plant Epigenome Dynamics)

Abstract

:
Salinity can negatively impact crop growth and yield. Changes in DNA methylation are known to occur when plants are challenged by stress and have been associated with the regulation of stress-response genes. However, the role of DNA-methylation in moderating gene expression in response to salt stress has been relatively poorly studied among crops such as barley. Here, we assessed the extent of salt-induced alterations of DNA methylation in barley and their putative role in perturbed gene expression. Using Next Generation Sequencing, we screened the leaf and root methylomes of five divergent barley varieties grown under control and three salt concentrations, to seek genotype independent salt-induced changes in DNA methylation. Salt stress caused increased methylation in leaves but diminished methylation in roots with a higher number of changes in leaves than in roots, indicating that salt induced changes to global methylation are organ specific. Differentially Methylated Markers (DMMs) were mostly located in close proximity to repeat elements, but also in 1094 genes, of which many possessed gene ontology (GO) terms associated with plant responses to stress. Identified markers have potential value as sentinels of salt stress and provide a starting point to allow understanding of the functional role of DNA methylation in facilitating barley’s response to this stressor.

Graphical Abstract

1. Introduction

Barley is an important crop for food, feed and brewing [1,2] and is used as a research model for temperate cereals [3,4]. Although considered relatively tolerant to salinity [5], barley grown under saline conditions often suffers substantial yield losses [6]. In recognition of a global increase in saline soils worldwide [5], there are continuing efforts to improve the salt tolerance of barley varieties to maintain current levels of production. As with other plant species, barley responds to salt stress through the coordination of processes that alleviate both osmotic stress and ion toxicity [7]. Acclimation to saline conditions requires the stimulation of multiple molecular networks, including stress sensing, signal transduction, and the expression of stress-specific genes and metabolites [3,7,8,9]. Modern genetic improvement strategies aimed at improving salt tolerance require the characterisation of genes activated in response to saline stress [10] and ideally, better understanding of their interactions and of any plasticity in their expression afforded by epigenetic regulation [11].
Epigenetic mechanisms that control gene regulation act independently of any changes to DNA sequences [12,13,14], although one, DNA methylation, does alter its chemistry. The term DNA methylation describes the addition of a methyl group to a specific cytosine base in DNA, and this change often plays a critical role in moderating gene expression [13,15,16]. Indeed, DNA methylation has been implicated in several critical aspects of plant development and in regulating a plant’s adaptation to stress [13,17,18,19,20]. Change in DNA methylation status can occur via de novo DNA methylation, which is generally associated with gene repression, or by demethylation, which usually enhances gene expression [16], although numerous exceptions to this rule are known [16,21,22]. There are several reasons for characterising changes to the global methylation status of the genome that occur in response to a stress such as excessively saline soil. At the simplest level, identifying salt-induced methylation changes to specific sites has the potential to diagnose the presence and level of salt stress experienced by roots, based solely on the methylation status of key epimarkers. Salt concentration in saline soils varies on both spatial and temporal scales [23,24] and so measuring the timing and extent of exposure of an individual plant can be difficult in field conditions. The possibility of being able to characterise fine scale salt exposure of individual (sentinel) plants based on changes to the methylome is therefore an attractive prospect, and one that may also facilitate ready identification of genotypes exhibiting differential responses (e.g., tolerance to osmotic stress, Na+ exclusion from leaf blades, tissue tolerance) [5]. At the same time, better identification of those genic regions most likely to be methylation-regulated in response to salt stress provides a useful starting point from which to identify candidate genes that may be implicated in plastic salt stress responses and to build broader understanding of the molecular mechanisms in play that confer plant resilience to saline stress, something that has the potential to open up new avenues for crop breeding [11].
Several studies have demonstrated that exposure to salt stress can significantly perturb plant methylation profiles [25,26,27,28]. Others have correlated stress-induced modifications to DNA methylation to changes in gene regulation across a range of species [14,18,29,30], although some controversy remains over the consistency of the DNA methylation sites described [28,31]. In general, most salt-induced changes to DNA methylation seem to occur within, or in proximity to, known stress response genes [7,25,32,33]. In maize, salinity induced de novo methylation to zmPP2C in roots but demethylation to zmGST in leaves, with both changes seemingly linked to altered expression levels [34]. De novo methylation significantly repressed the expression of zmPP2C in roots, whereas demethylation of zmGST enhanced its expression in leaves, implying that DNA methylation changes in response to salt stress might contribute to stress acclimation [34]. In barley, acute salt stress has been similarly shown to evoke methylation-modulated changes to the expression of several genes involved in metabolic and physiological processes implicated in the ability of plants to cope with stress [3,9,35]. However, to date, there has been a marked lack of reports linking salt-induced gene expression to global changes in DNA methylation or methylation-associated changes that apply across a representative sample of any crop species [36].
For food crops with large genomes, the use of genome-wide bisulfite sequencing to characterise genome-wide flux in methylation from a representative range of genotypes is effectively precluded by cost and the complexity of bioinformatics [37]. For this reason, most works on stress-induced methylome change have elected to either target particular loci [29,38] or else to survey only a subset of the genome. Of the many methods available, Methylation Sensitive Amplification Polymorphism (MSAP) analysis has proved particularly popular to study stress-induced changes to genome-wide methylation patterns [25,27,32], in part because of the reproducible reputation of the technique [39,40,41]. However, the MSAP method only generates relatively small numbers of anonymous markers [42,43] and so has limited utility for studies aiming to establish links between changes in methylation and altered gene expression. While some works have sought to overcome this limitation by targeted sequencing of MSAP amplicons [7,25,32,33], others have argued that this amendment of the method is still cumbersome, costly and time-consuming [44]. The ability of Next Generation Sequencing to analyse large numbers of loci in multiple methylomes in parallel provides the opportunity to overcome these limitations. The use of methylation-sensitive Genotyping-By-Sequencing (ms-GBS) provides workers with the possibility of identifying differentially methylated markers (DMMs) with a better depth and coverage of the genome [44,45]. By using methylation-sensitive restriction enzymes to reduce genome complexity during library preparation, differentially methylated fragments are produced that are appropriate for high throughput sequencing [44,45]. This approach presents the advantage of detecting methylated sites that are dispersed across the genome and is particularly appealing for species with large genomes such as barley [44].
In this study, we used ms-GBS to assess the level of salt-induced changes to methylation site distribution patterns in the roots and leaves of five diverse barley genotypes (Barque 73, Flagship, Hindmarsh, Schooner and Yarra) with a range of salinity tolerance levels, and matched these against the reference barley genome to characterize the genomic locations of changed loci. We then combined these results with publicly available data about the gene expression of barley roots under salt to postulate the possible functional implications of DNA methylation flux on gene regulation in barley under salt stress.

2. Results

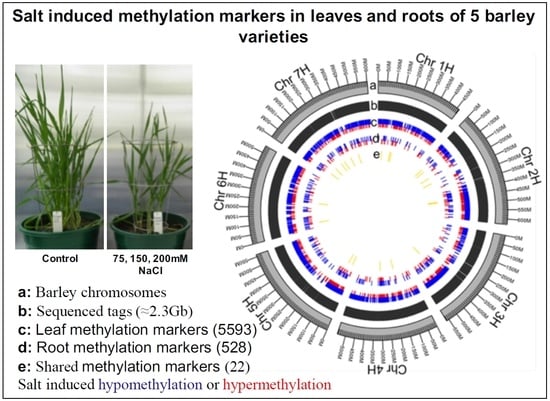
2.1. Methylation-Sensitive Genotyping-By-Sequencing (ms-GBS)

Overall, we generated in excess of 1 billion raw reads (1,015,703,602) from ms-GBS libraries, sequenced on a HiSeq 2500 (Illumina, San Diego, CA, USA). A high proportion of the raw reads passed the filter for the presence of the barcoded adapter, the MspI restriction product site and the EcoRI adapter (1,004,318,258; 98.87%). However, when these reads were filtered further to identify those that were uniquely mapped to the draft barley reference genome [4], the numbers fell substantially to 496,960,365 reads (i.e., 49.48% of raw reads). This yielded an average of 2,484,801 high quality reads per library and represented 892,859 unique sequence tags. Tags represented in this set amounted to 31.56% of the MspI recognition sites (5′-CCGG-3′) estimated for the barley reference genome (2,828,642; Table 1).

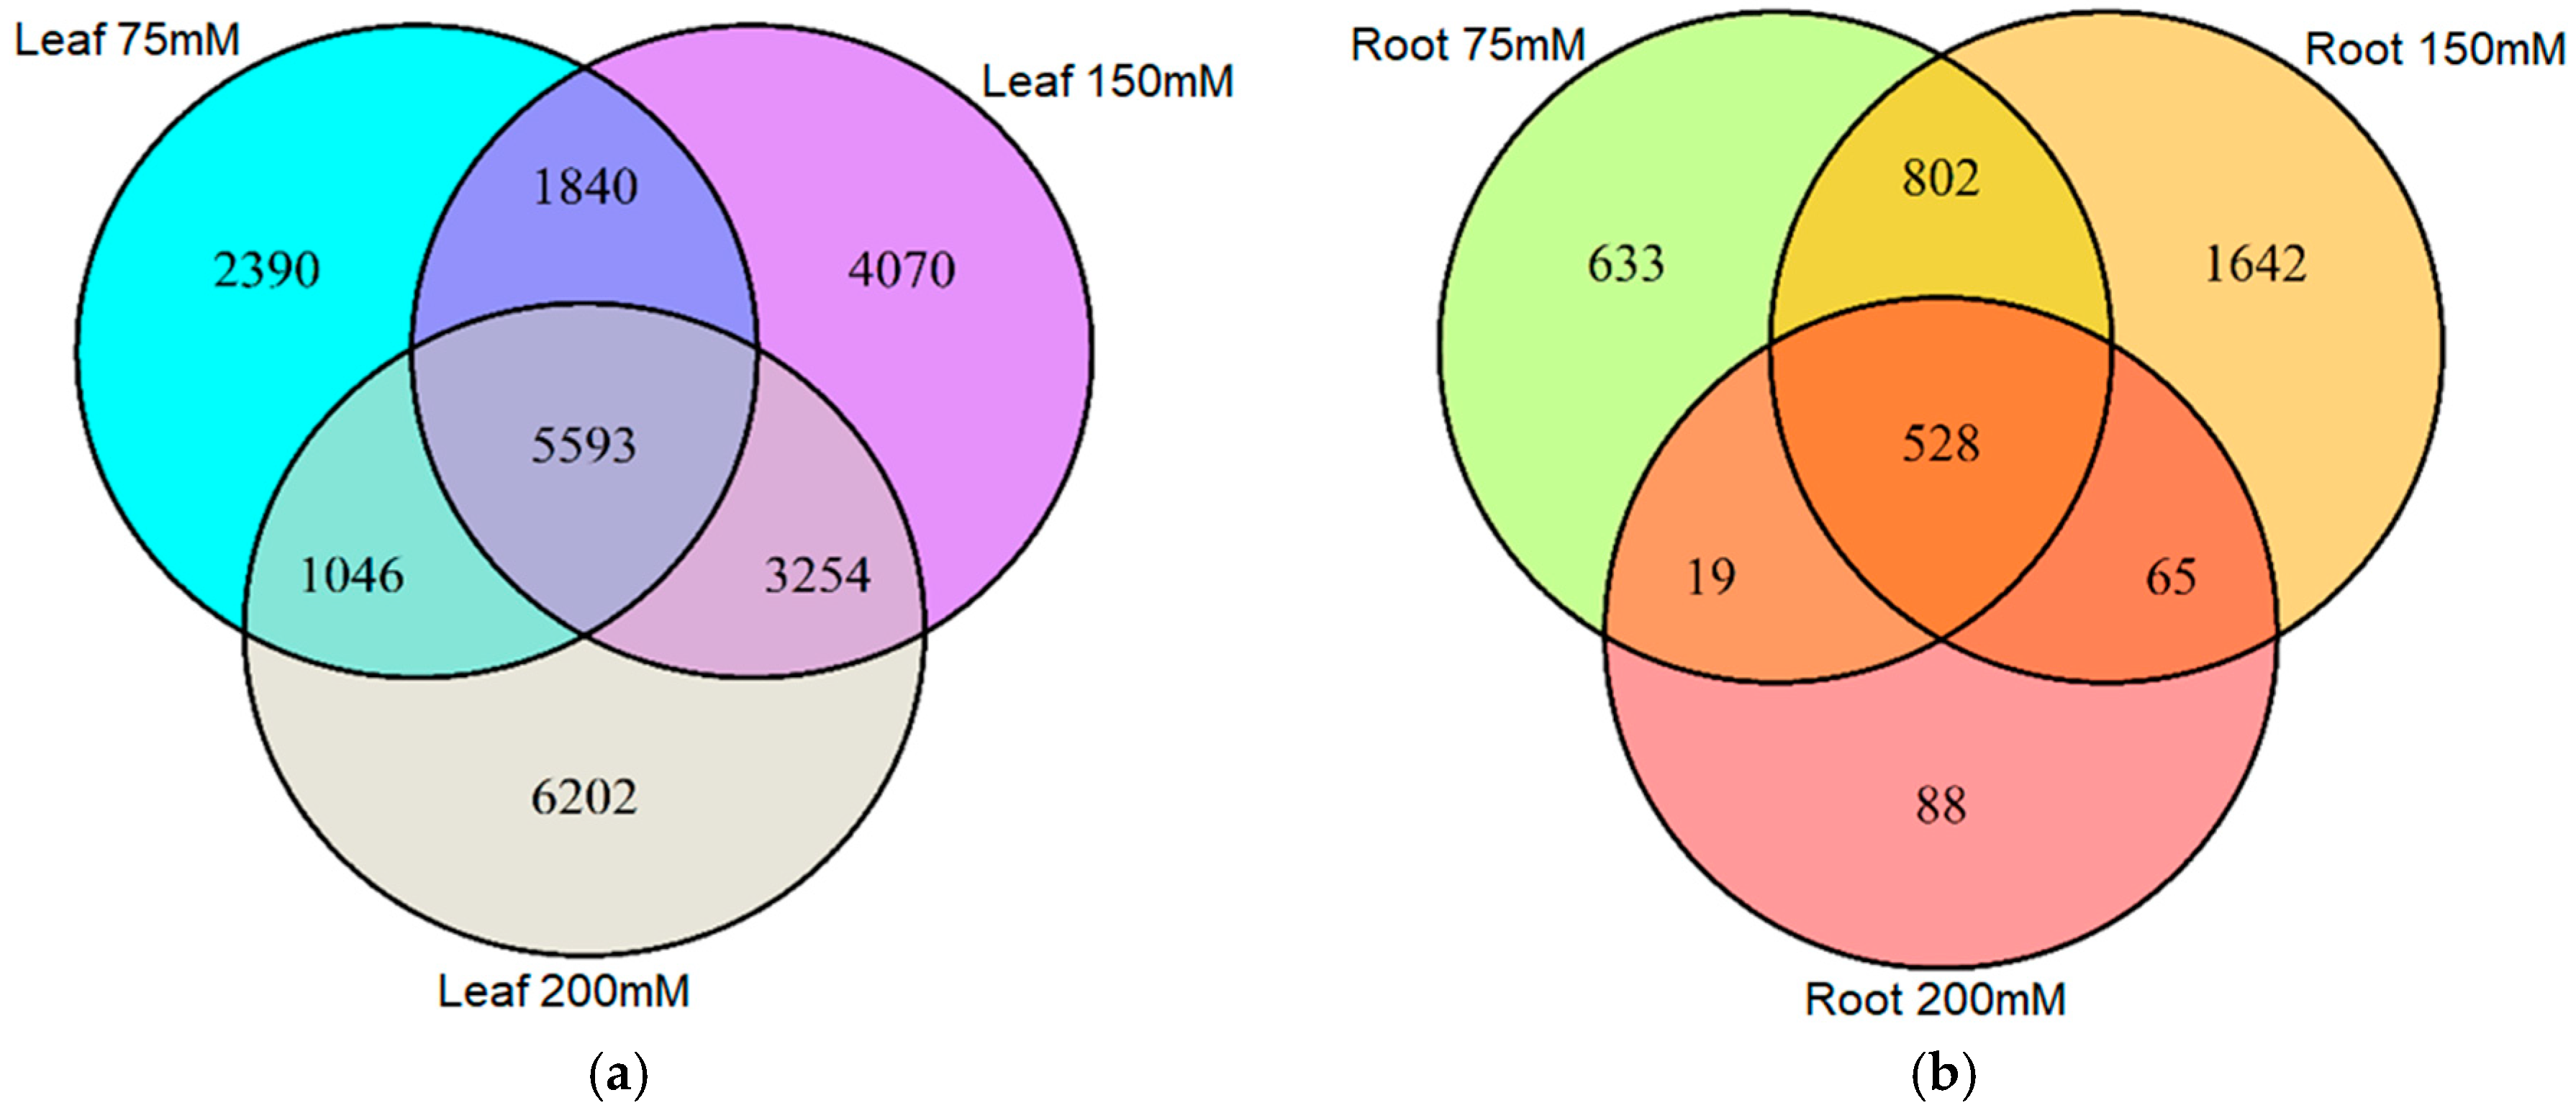
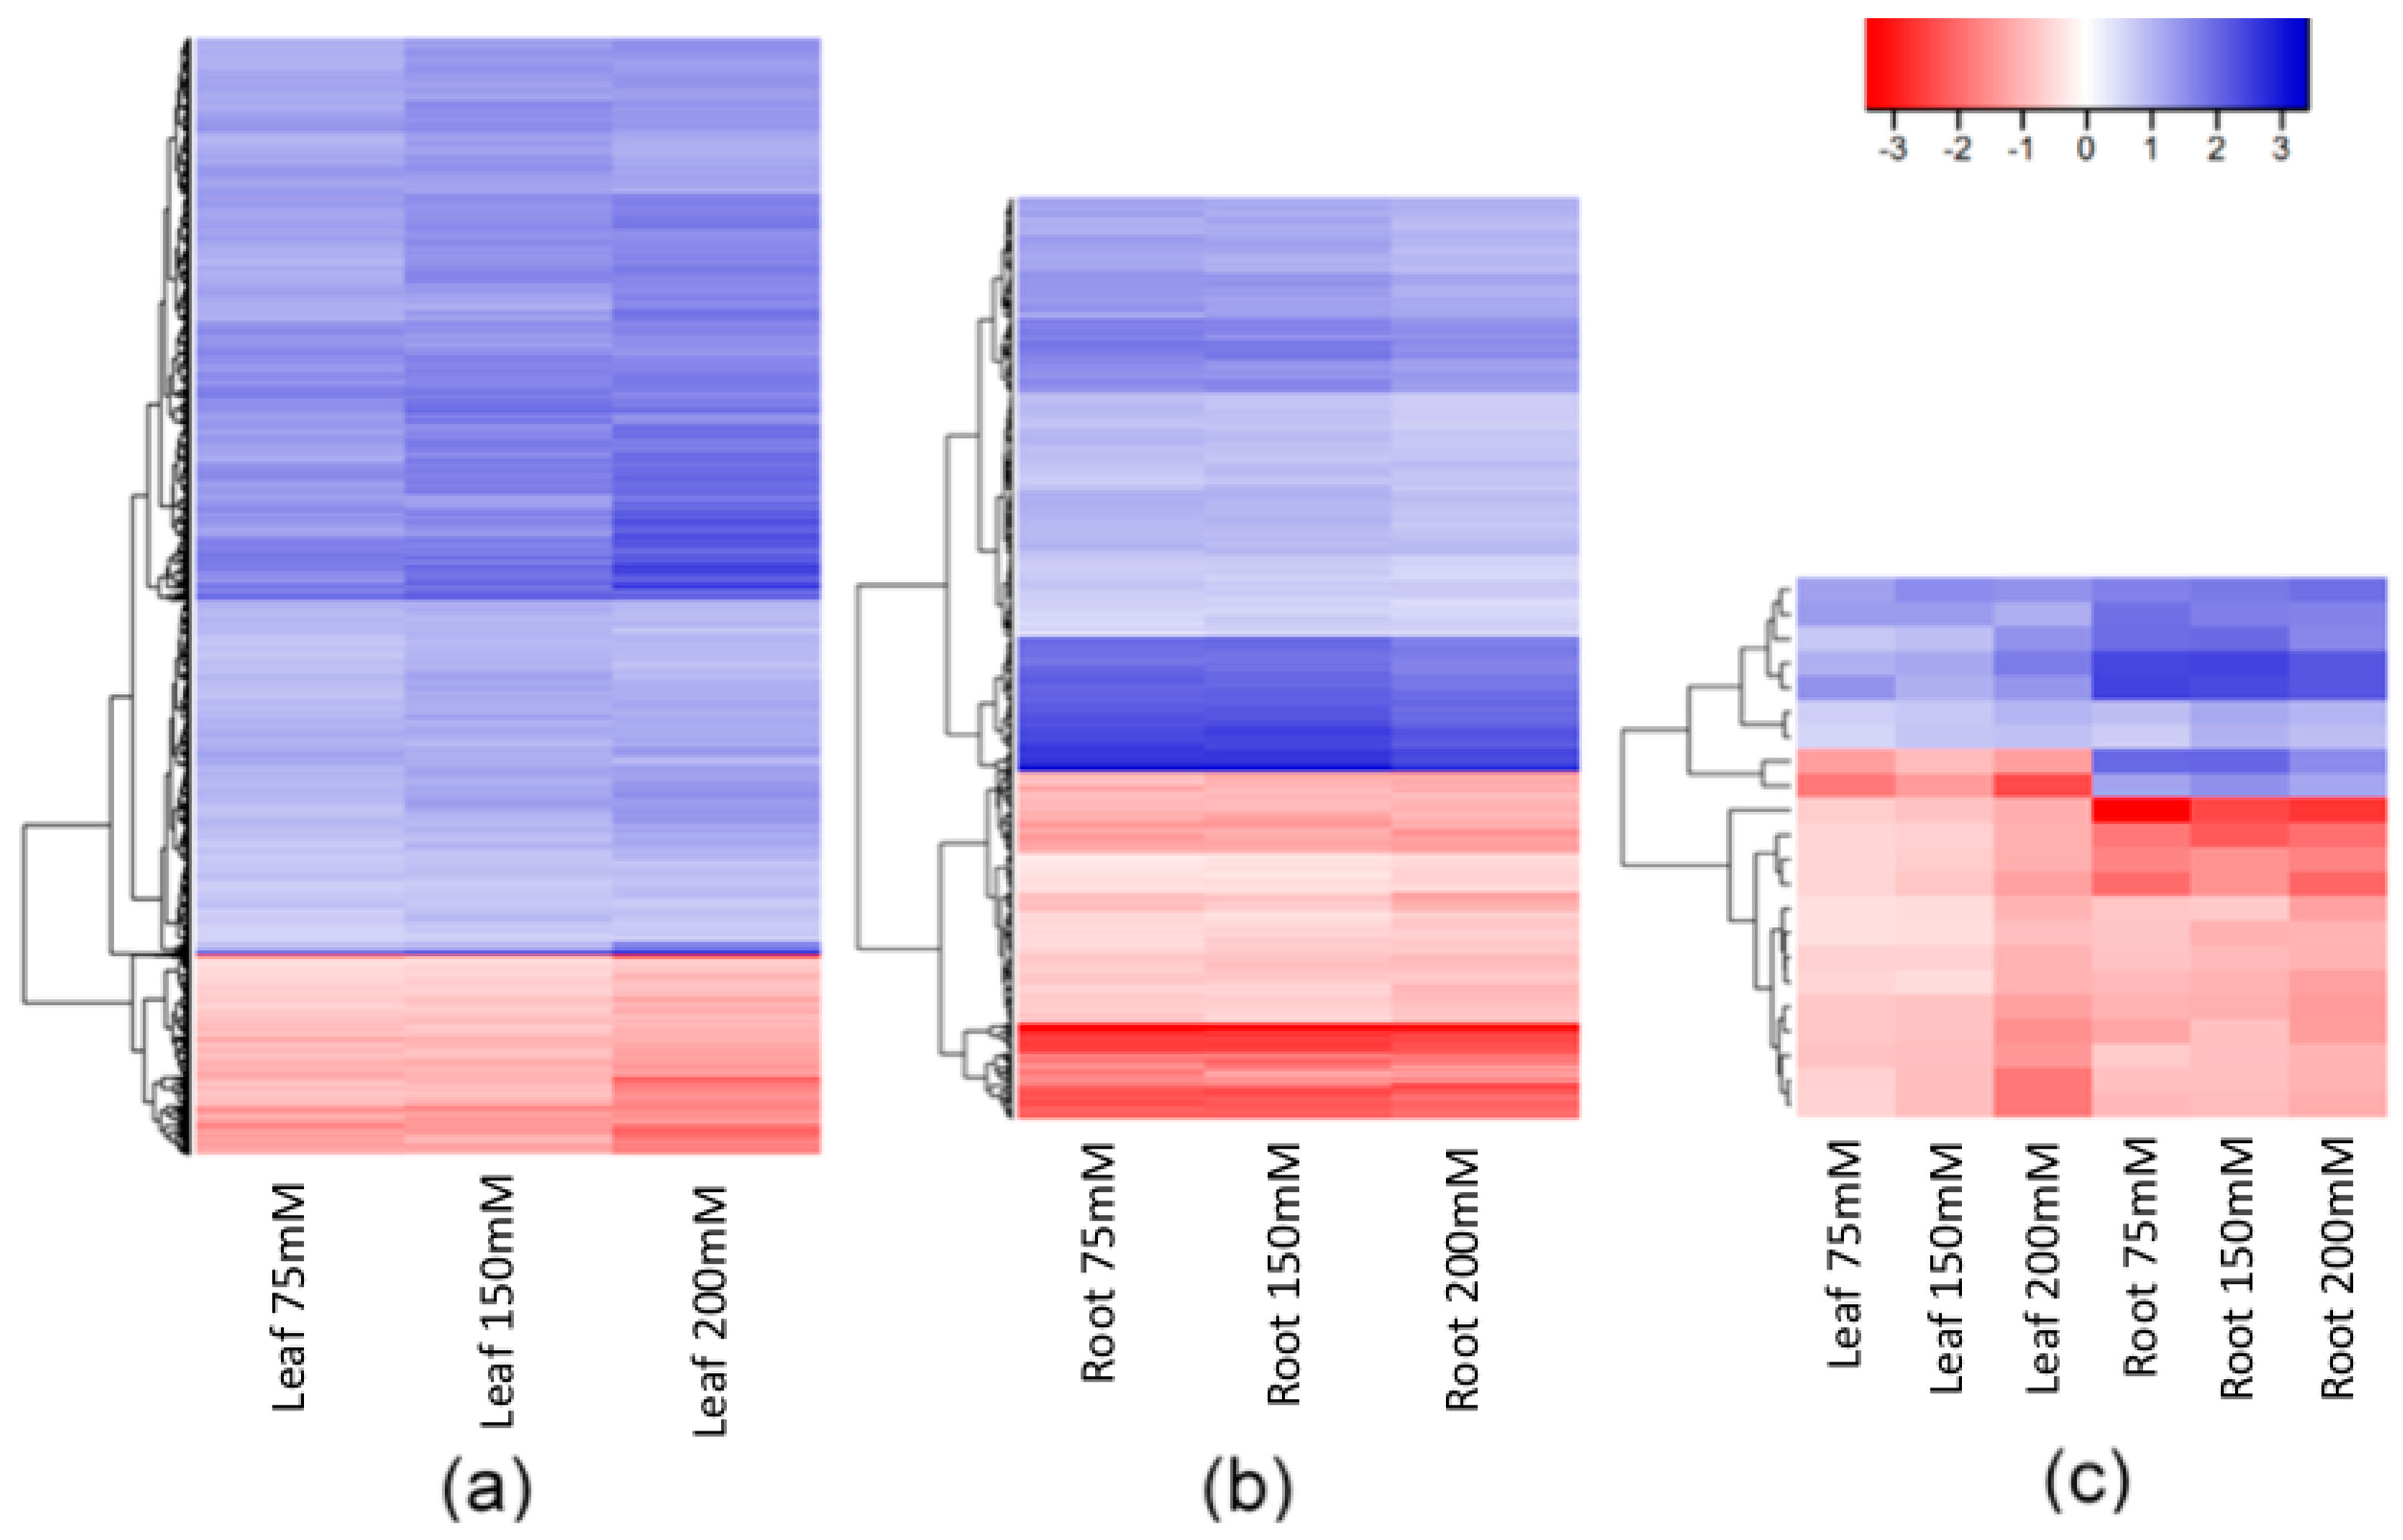
2.2. Salt-Induced DNA Methylation Changes Are Organ and Concentration Specific

In total, 24,395 and 3777 unique sequence tags were deemed “significant differentially methylated markers” (false discovery rate (FDR) < 0.01) in leaf and root samples respectively across all five varieties and salt treatments (Figure 1 and Figure 2a). Curiously, the overall number of leaf DMMs increased progressively with salt concentration (75, 150 and 200 mM NaCl), whereas there was no such pattern seen in the roots (Figure 1). Soil salinity was found to induce more hypomethylated DMMs than hypermethylated DMMs in both leaves and roots, regardless of concentration (Figure 1). Although the number of salt-induced DMMs was higher in leaves (24,395 DMMs) than roots (3777), the scale of the change evoked by salt stress was far higher in roots when measured by p-values (Figure 2a) and the fold-changes in read counts (Figure 2b,c). A comparison of the median fold-change in methylation across all markers in the two organs revealed that salt induced net hypomethylation in roots and hypermethylation in leaves (Figure 2a–c), even though the number of salt induced hypomethylated sites exceeded those of hypermethylated sites in both organs (Figure 1).

2.3. Stability of Salt-Induced DMMs across Treatments

We next surveyed the appearance of DMMs across treatments and organs. Only a small proportion of DMMs appeared across all salt concentrations (Figure 3a,b). Moreover, of the 24,395 salt-induced DMMs detected in leaf samples, 52% were specific to 75, 150 or 200 mM NaCl (2390, 4070 and 6202, respectively) (Figure 3a), implying a positive association between the salt concentration and the number of loci affected by methylation changes. In roots, there was no obvious relationship with salt concentration, with 633, 1642 and 88 salt concentration-specific DMMs for 75, 150 and 200 mM NaCl, respectively (Figure 3b) (62% of the total).
There were, nevertheless, many stable DMMs that appeared in all salt concentrations. These dose-insensitive DMMs accounted for 22.9% (5593 of 24,395) of all salt-induced DMMs recovered from leaves and 14% (528 of 3777) of those recovered from roots (Figure 3a,b, Supplemental Data Set S1). These dose-insensitive DMMs invariably presented the same directionality of methylation change across all concentrations (i.e., always hyper- or hypomethylated) (Figure 4a,b). The dose-insensitive DDMs followed the global trend (see above) and so, mostly became hypomethylated following salt exposure in both leaves (4744, 84.82%) and roots (329, 62.31%). Of these, just 22 were shared between leaf and root samples, most of which, again, became hypomethylated following salt exposure (Figure 4c). Of these, 20 markers shared the same directionality of methylation change following salt exposure between organs, but two markers (“2:1:467135271” and “6:1:259709553”) became hypermethylated in leaves and hypomethylated in roots following exposure to salt (Figure 4c).

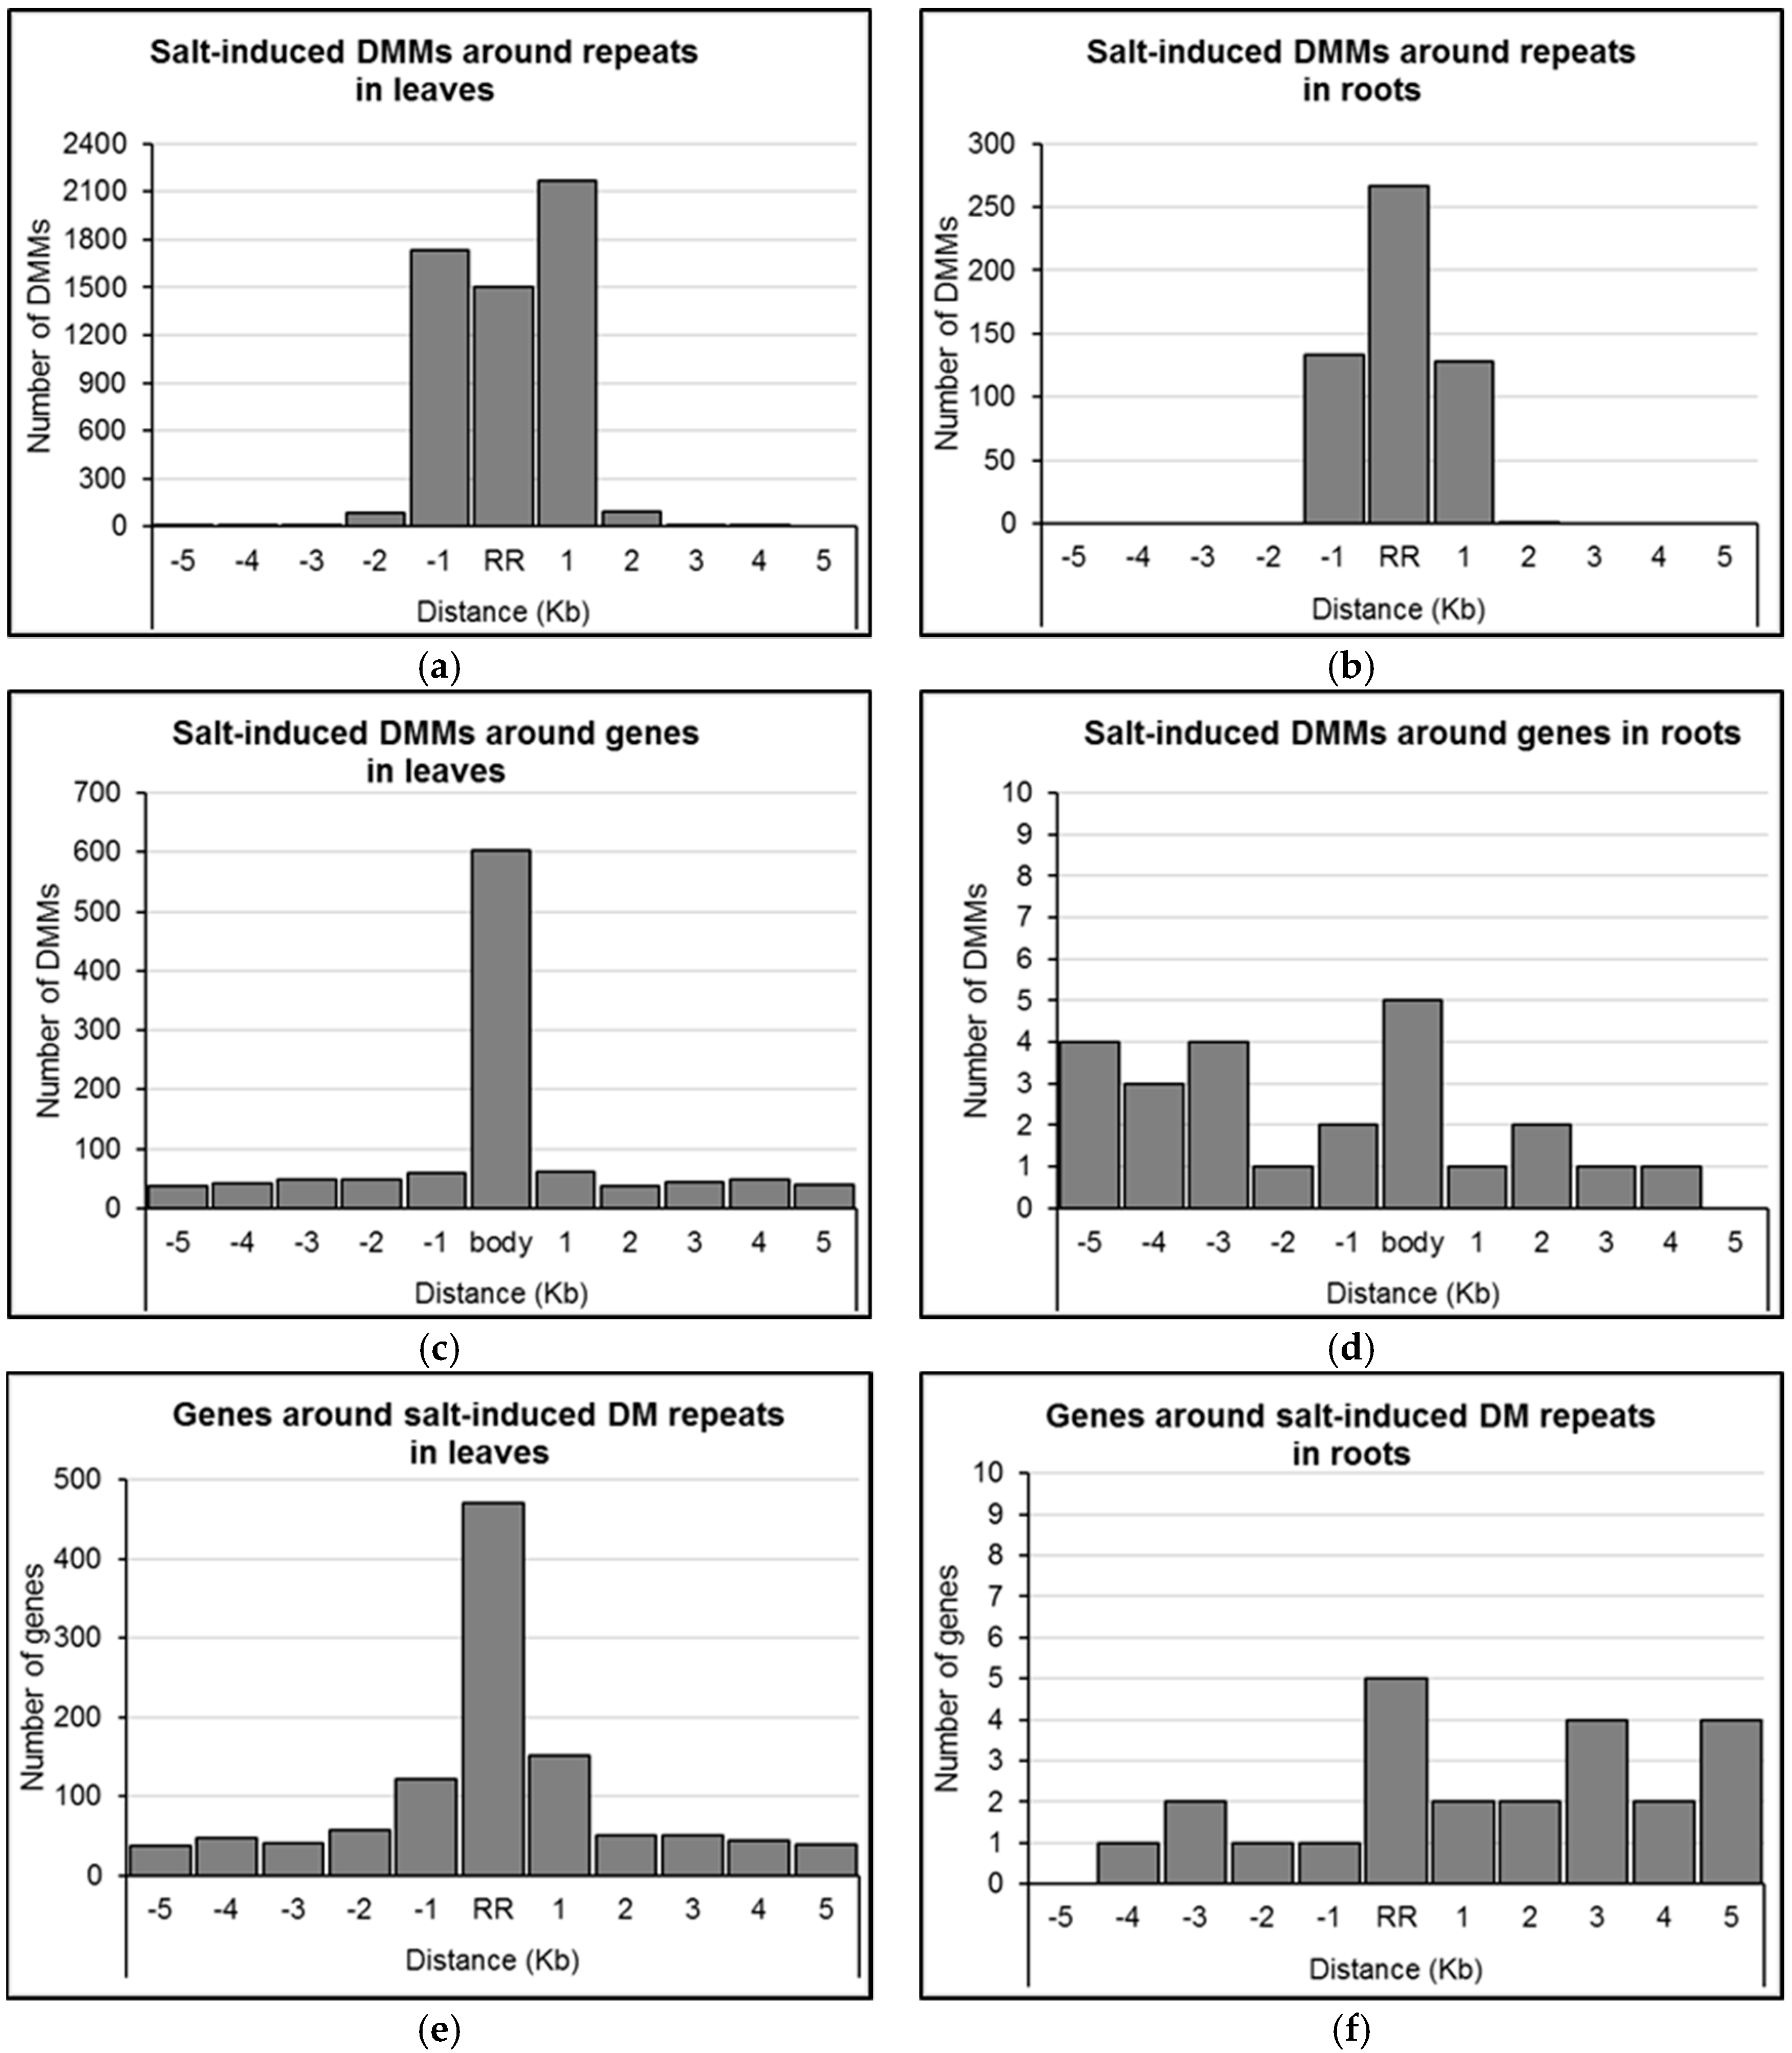
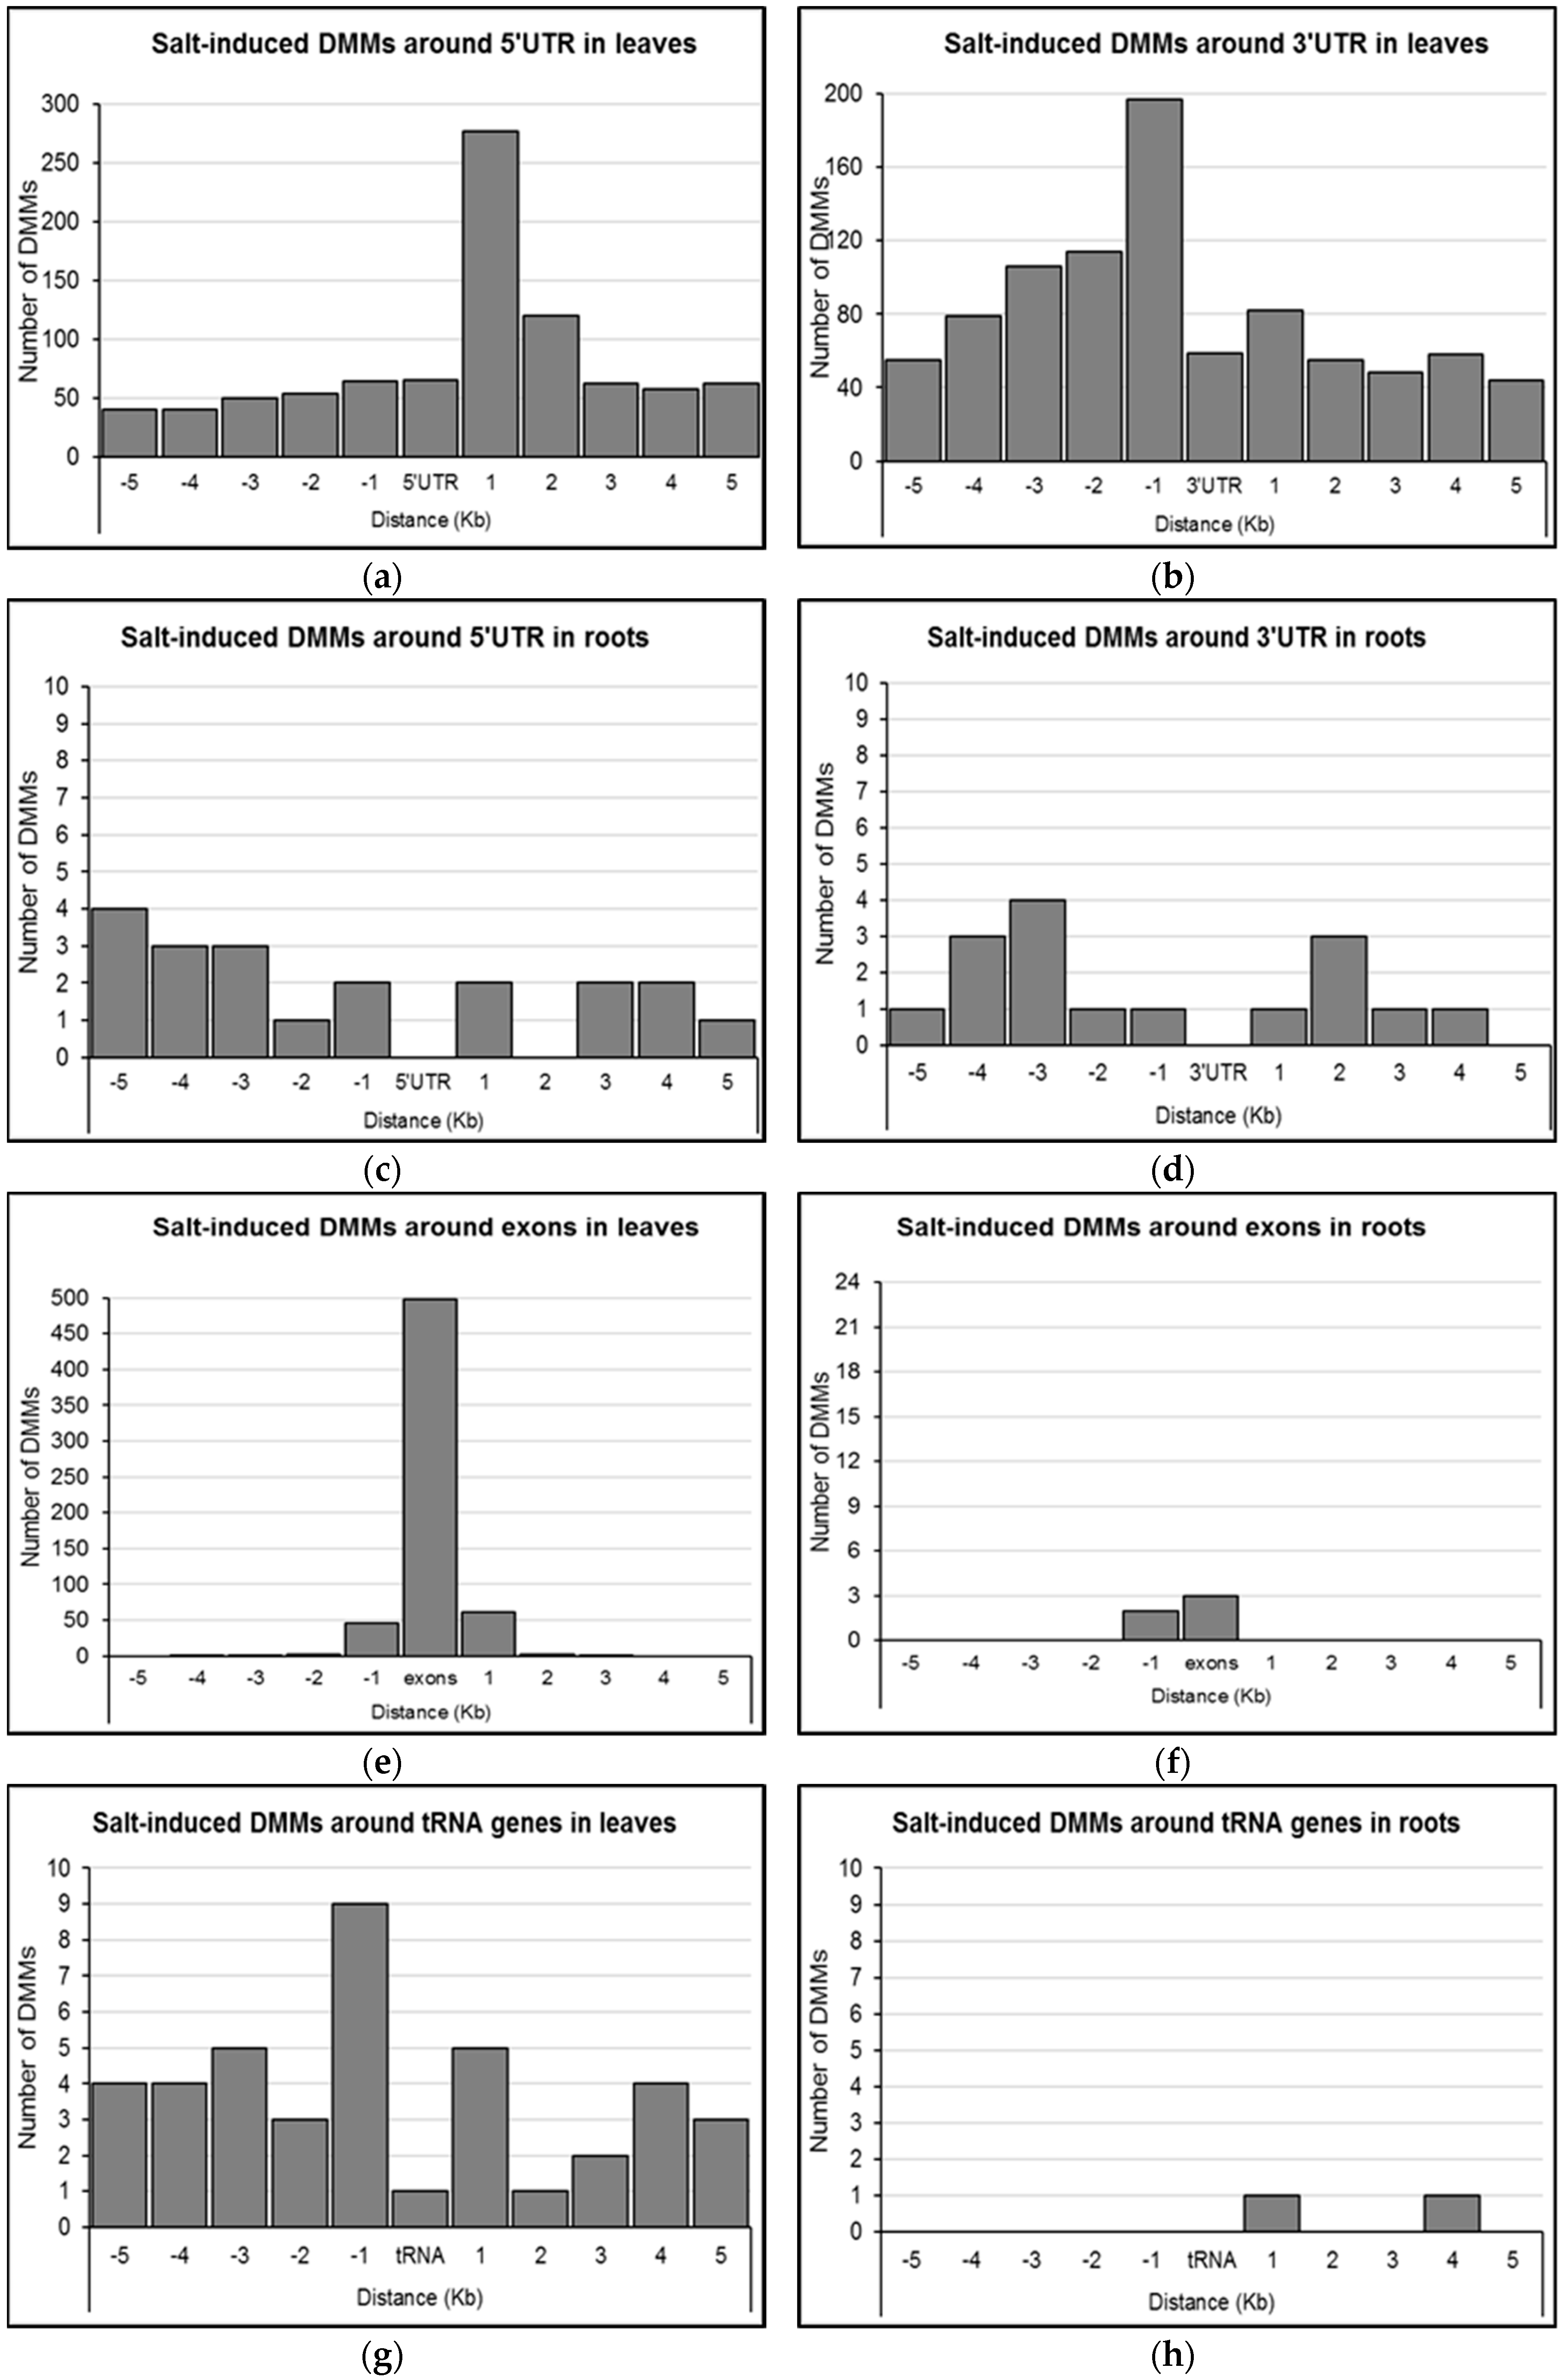
2.4. Distribution of Salt-Induced DMMs around Annotated Genomic Features

We assessed the distribution of concentration-independent, salt-induced DMMs relative to annotated features of the barley genome (e.g., protein coding genes, repeats, tRNAs, etc.). Proximity to a repeat sequence appeared to be a strong predictor of the location of DMMs induced by salt. Indeed, 96.5% of DMMs induced by salt in leaves and 99.8% in roots occurred either within the repeats themselves or within 1 Kb of them (Figure 5a,b).
We next sought to identify genes positioned within the proximity of the dose-insensitive, salt-induced DMMs. The expression of these genes was considered most likely to be consistently influenced by salt-induced methylation flux. In leaves, 19.1% (1070/5593) of dose-insensitive DMMs were located within 5 Kb of genes (Figure 5c; Supplemental Data Set S2), with the majority located within the gene body itself (56.4%, 603 DMMs; Figure 5c). In roots, just 24 (i.e., 4.5%) of the dose-insensitive DMMs lay within 5 Kb of a gene, five of which were located within the gene body, 14 were upstream and five were downstream (Figure 5d; Supplemental Data Set S2). Additionally, it is worth mentioning that of the 22 dose-insensitive DMMs shared in leaves and roots (Figure 4c), only one was positioned within 5 Kb of a gene (3994 bp upstream MLOC_63677 on chromosome 2H).
Given that the effect of DNA methylation on gene expression may depend on the position of the change relative to the transcribed sequences [16,46], we further investigated DMM distance to 5′UTRs, 3′UTRs, and exons of differentially methylated genes in leaves and roots. In leaves, it appeared that salt-induced DMMs near 5′UTRs were most abundant within 1 Kb (277 DMMs) of the 5′UTR in the downstream direction, with those falling between 1 and 2 Kb being the second most common (120 DMMs; Figure 6a). Outside these windows, DMMs occurred in the range of 40–65 DMMs per Kb (Figure 6a). DMMs were more common in the upstream direction of 3′UTRs, with the 1 Kb bin immediately upstream containing the highest number of DMMs (197 DMMs), decreasing gradually to reach background levels (50–70 DMMs per KB) after 4 Kb (Figure 6b). In comparison, there were insufficient gene-associated DMMs from root samples to provide strong evidence of clustering around either the 5′UTRs or 3′UTRs.
The majority of DMMs within gene bodies from leaf samples lay within exons (81.4%, 498 of 612; Figure 6e). The remaining DMMs were generally within 1 Kb of an exon (Figure 6e). Three out of the five gene body DMMs from roots were similarly exonic or within 1 Kb of the nearest exonic region (Figure 6f). Considered collectively, gene body DMMs were most commonly associated with the first exons (57.5%; 355/617), and included 296 overlaps, 45 downstream and 14 upstream (Figure 6e,f). Additionally, there were 41 DMMs from leaves and two DMMs from roots that clustered around tRNA genes (Figure 6g,h). While only one DMM overlapped with a tRNA in leaves, 14 out of the 41 DMMs were within 1 Kb upstream (nine DMMs) and downstream (five DMMs) of a tRNA gene (Figure 6g). The two DMMs nearest tRNA genes in roots were located within 1 and 4 Kb downstream of the gene respectively (Figure 6h).

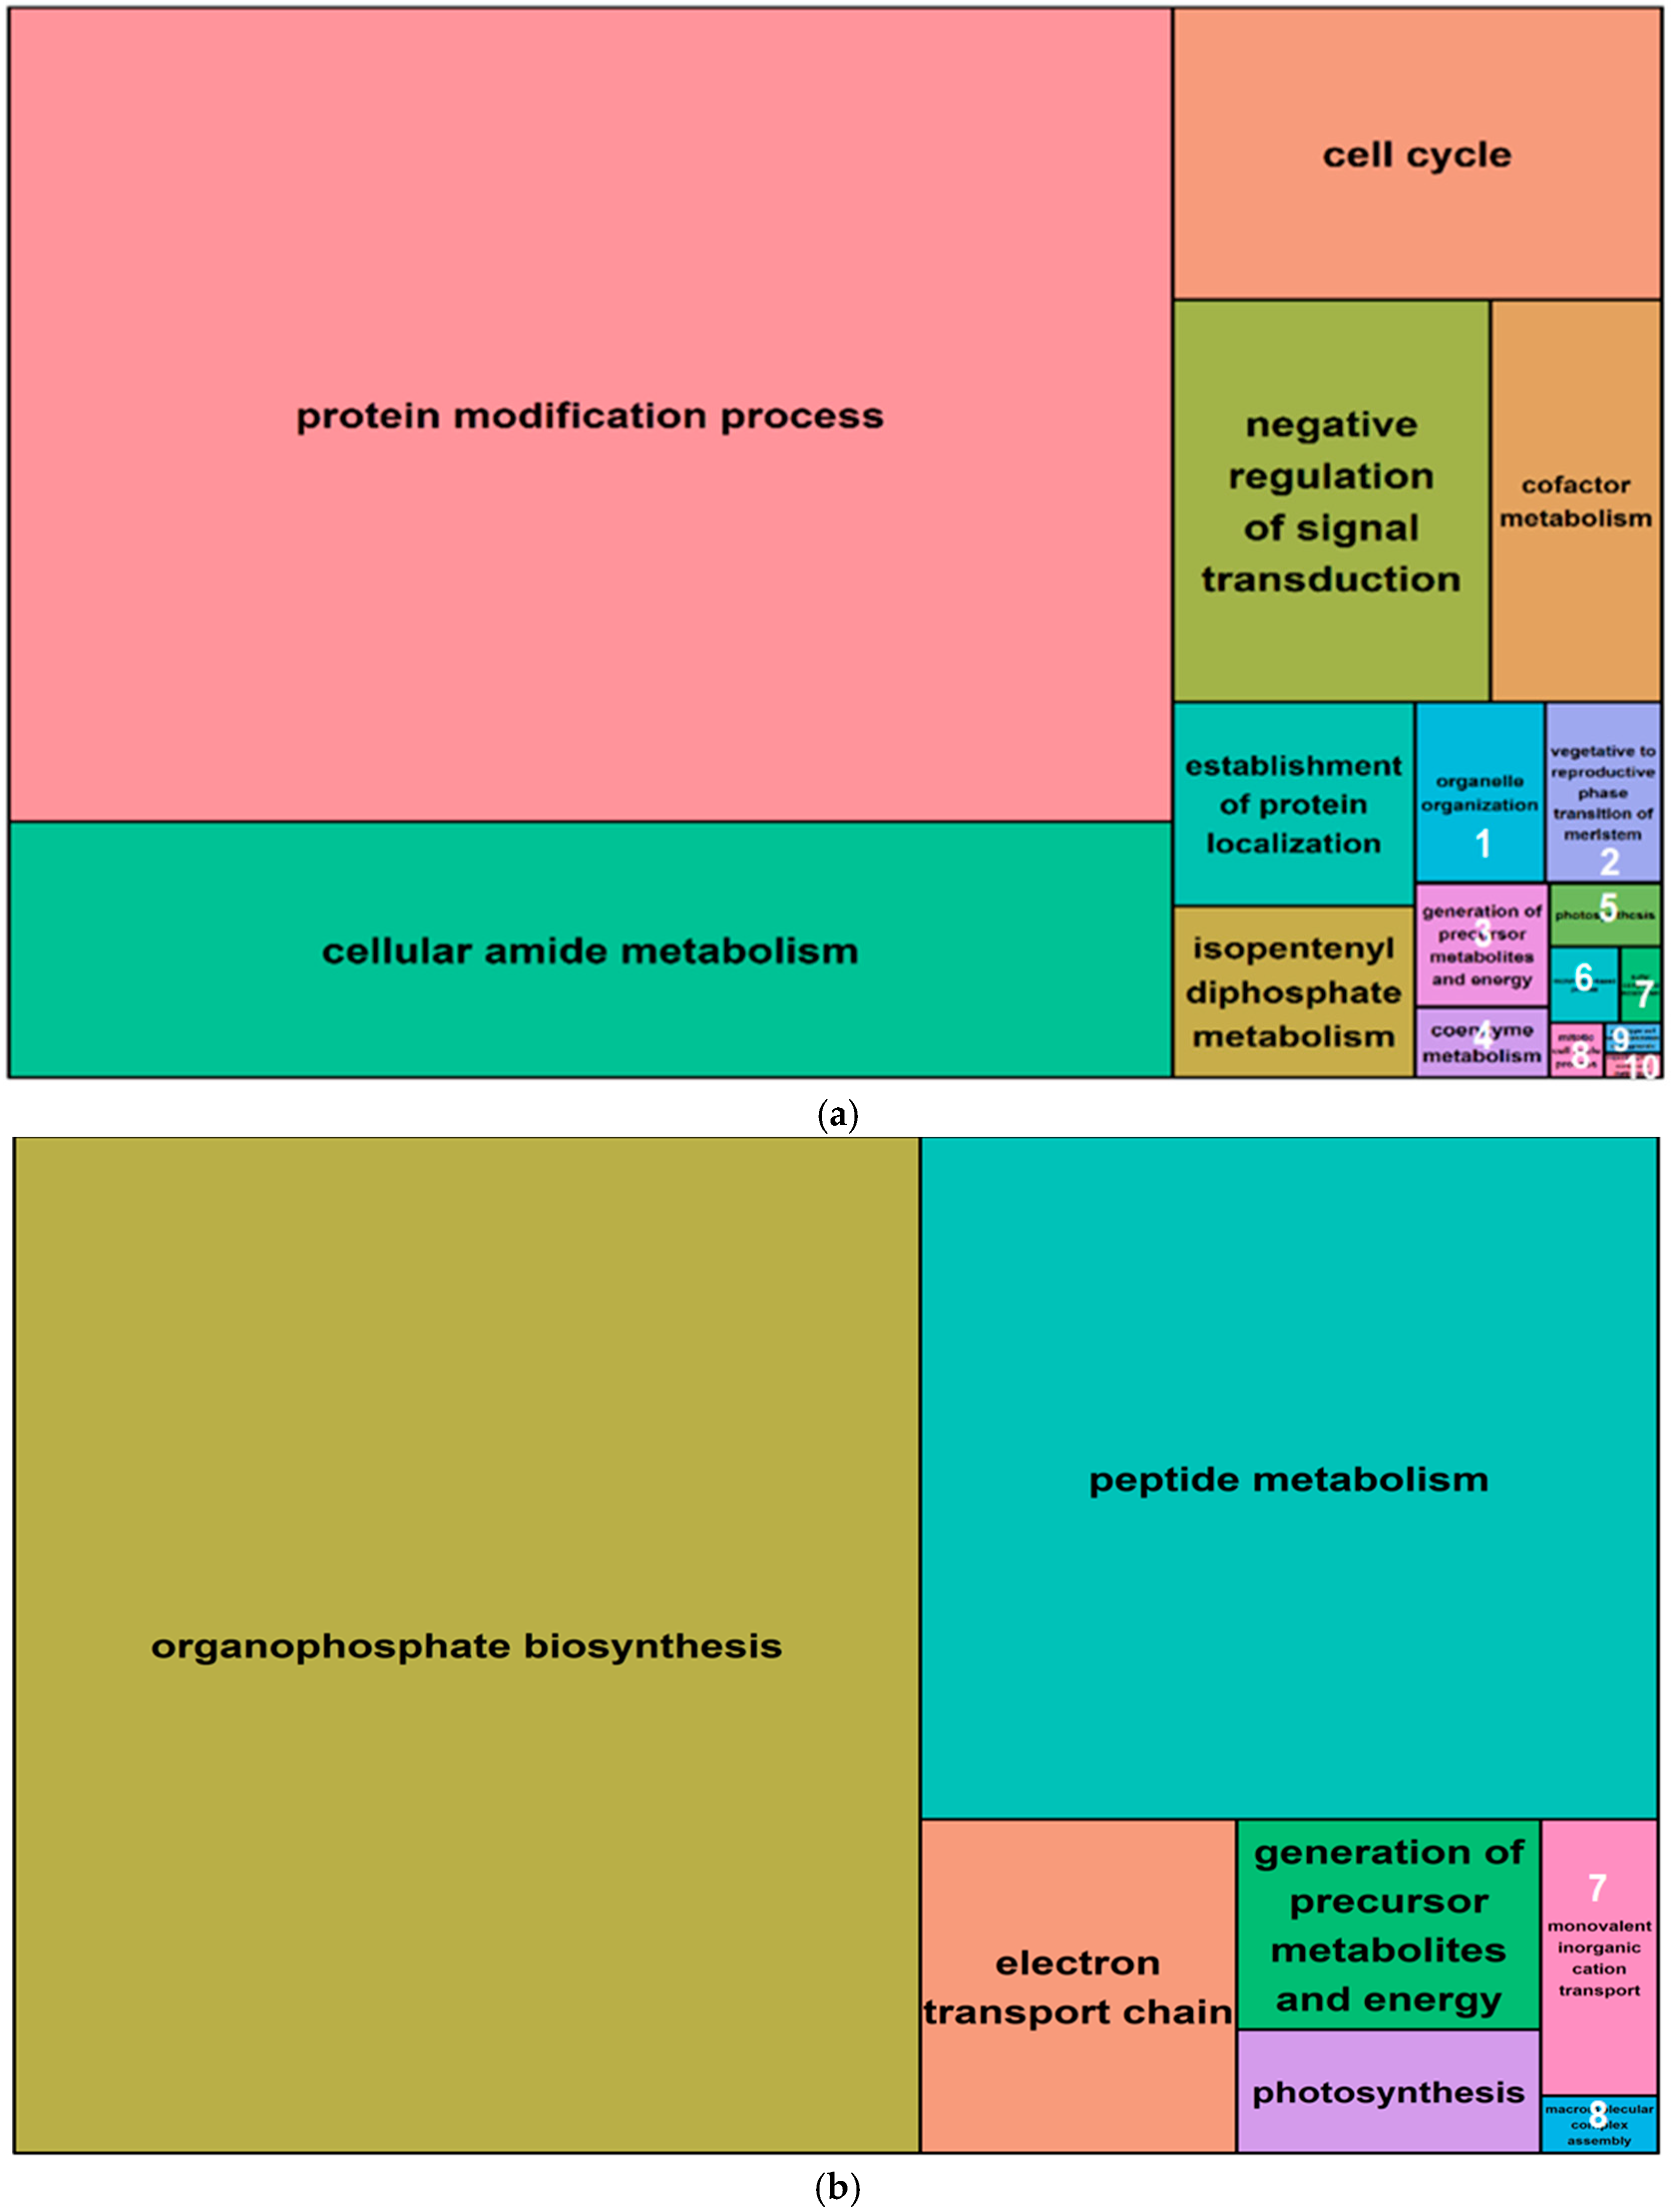
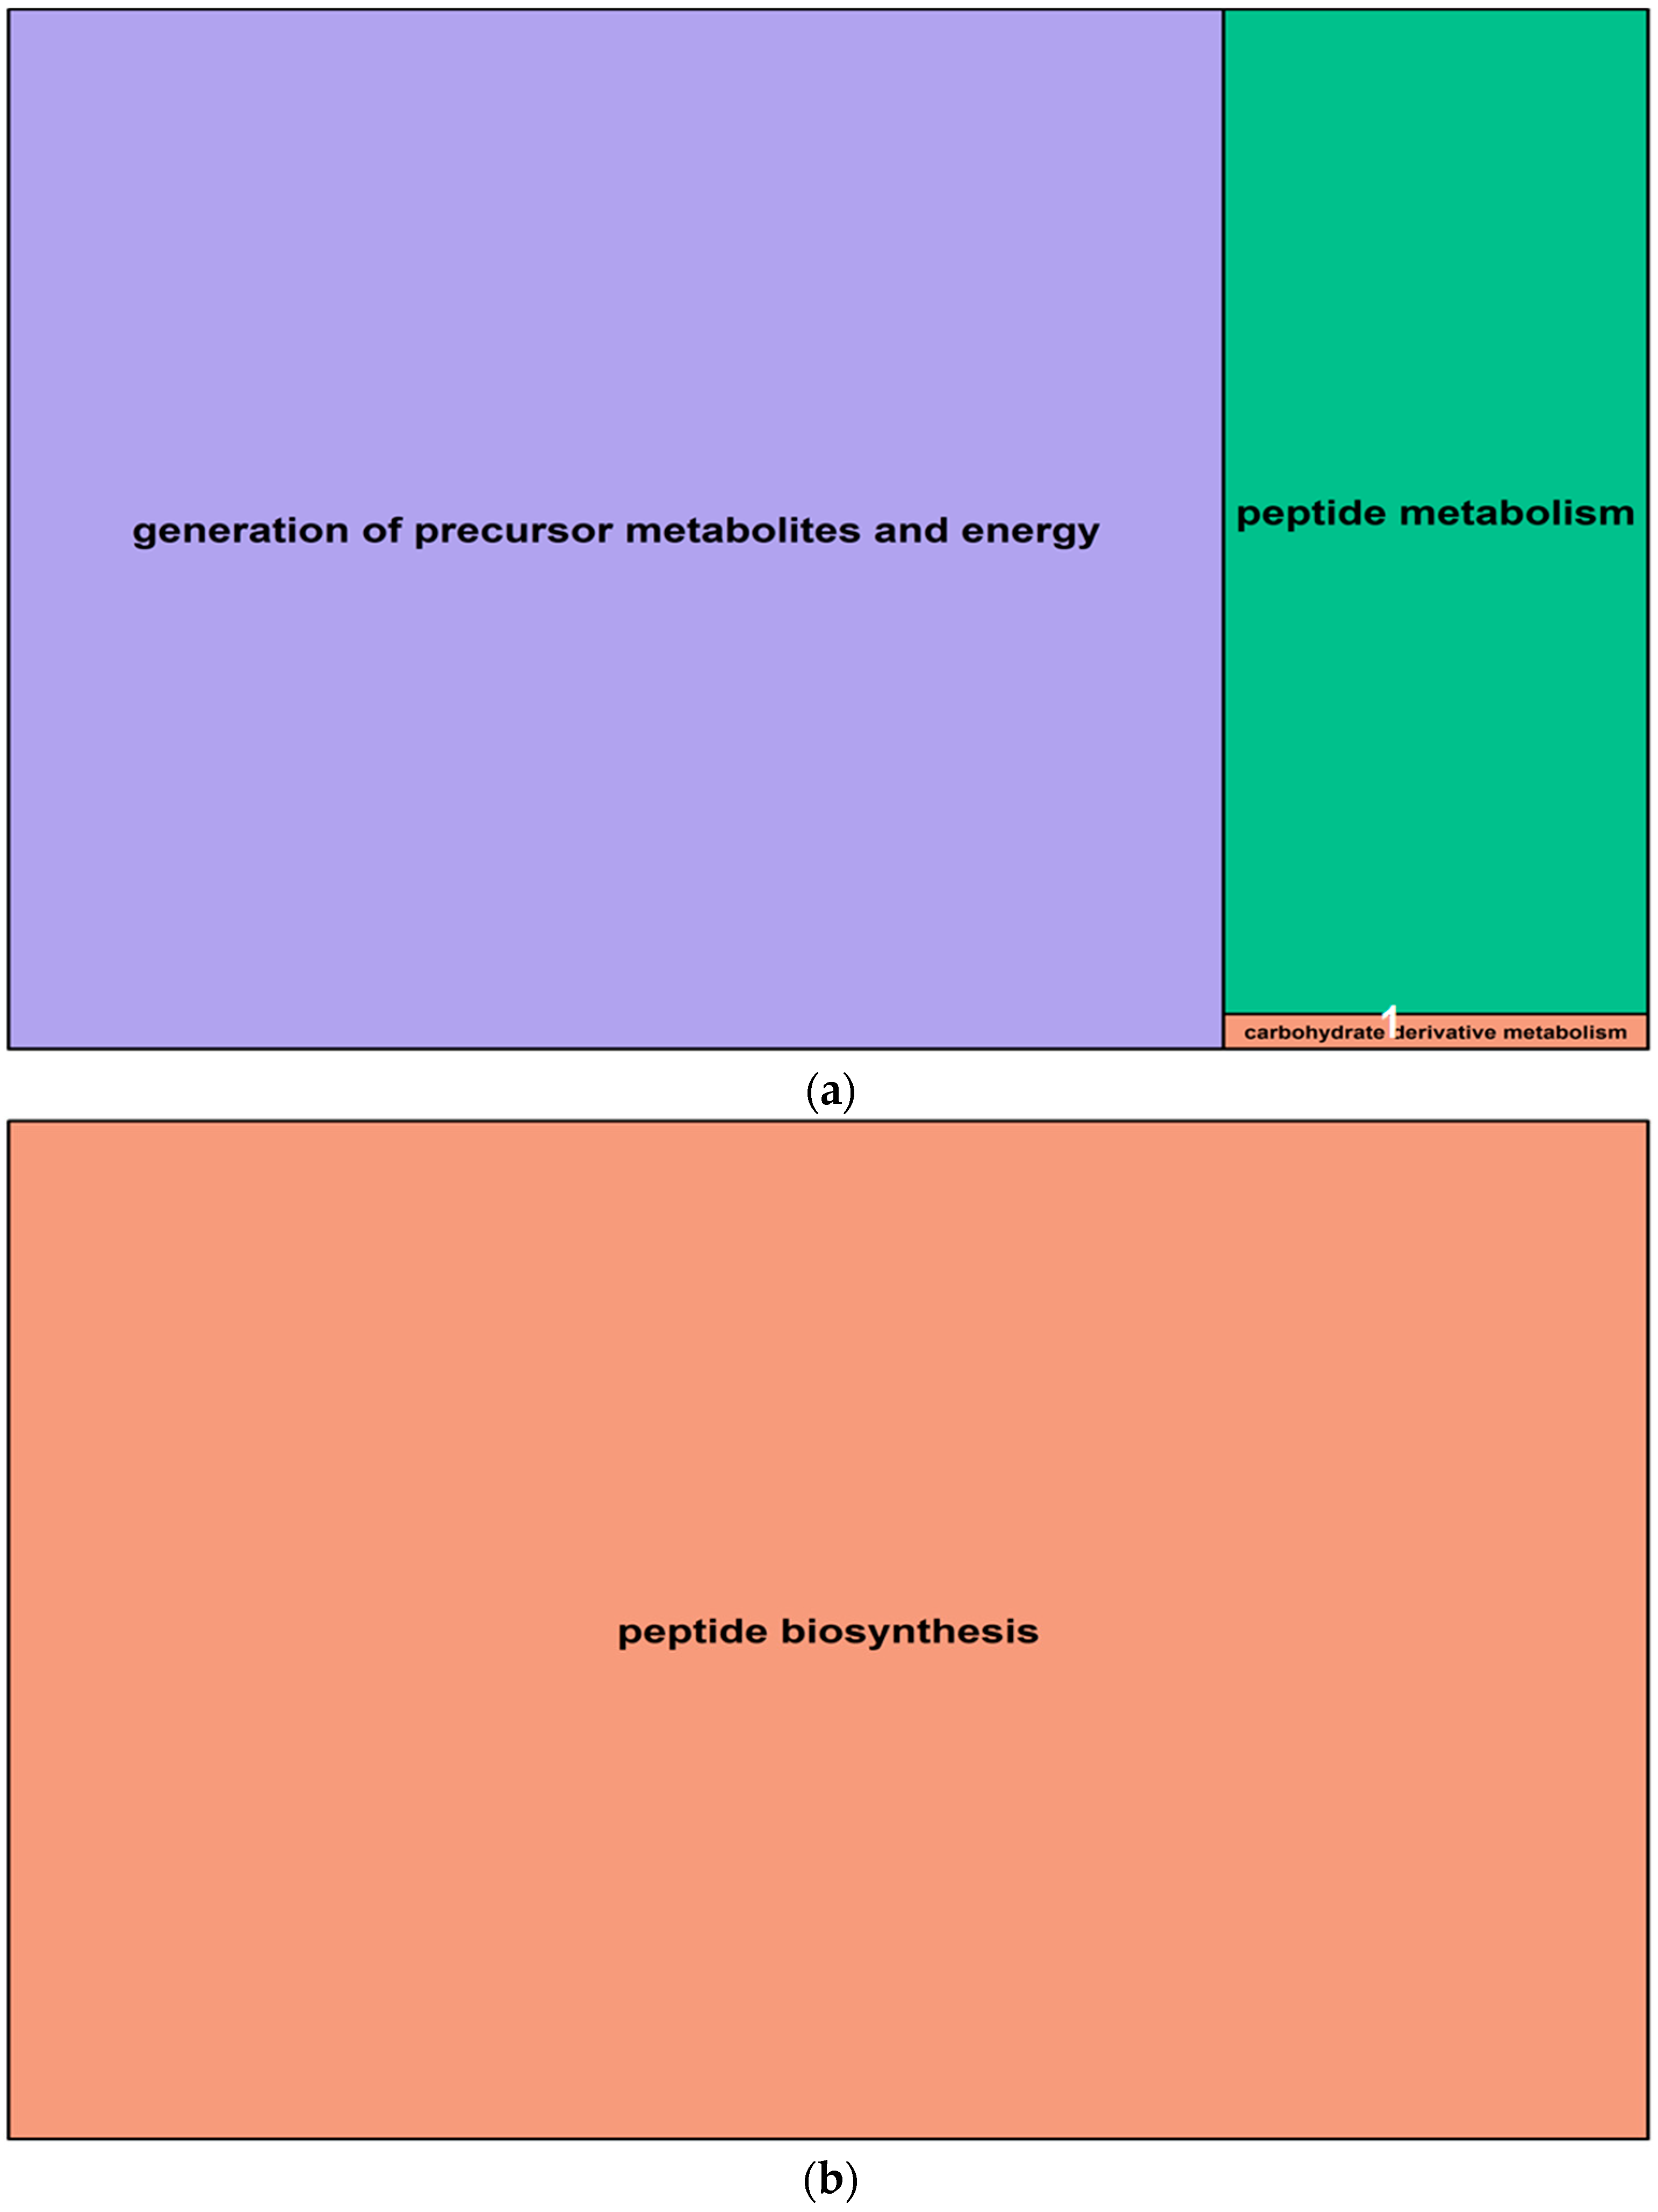
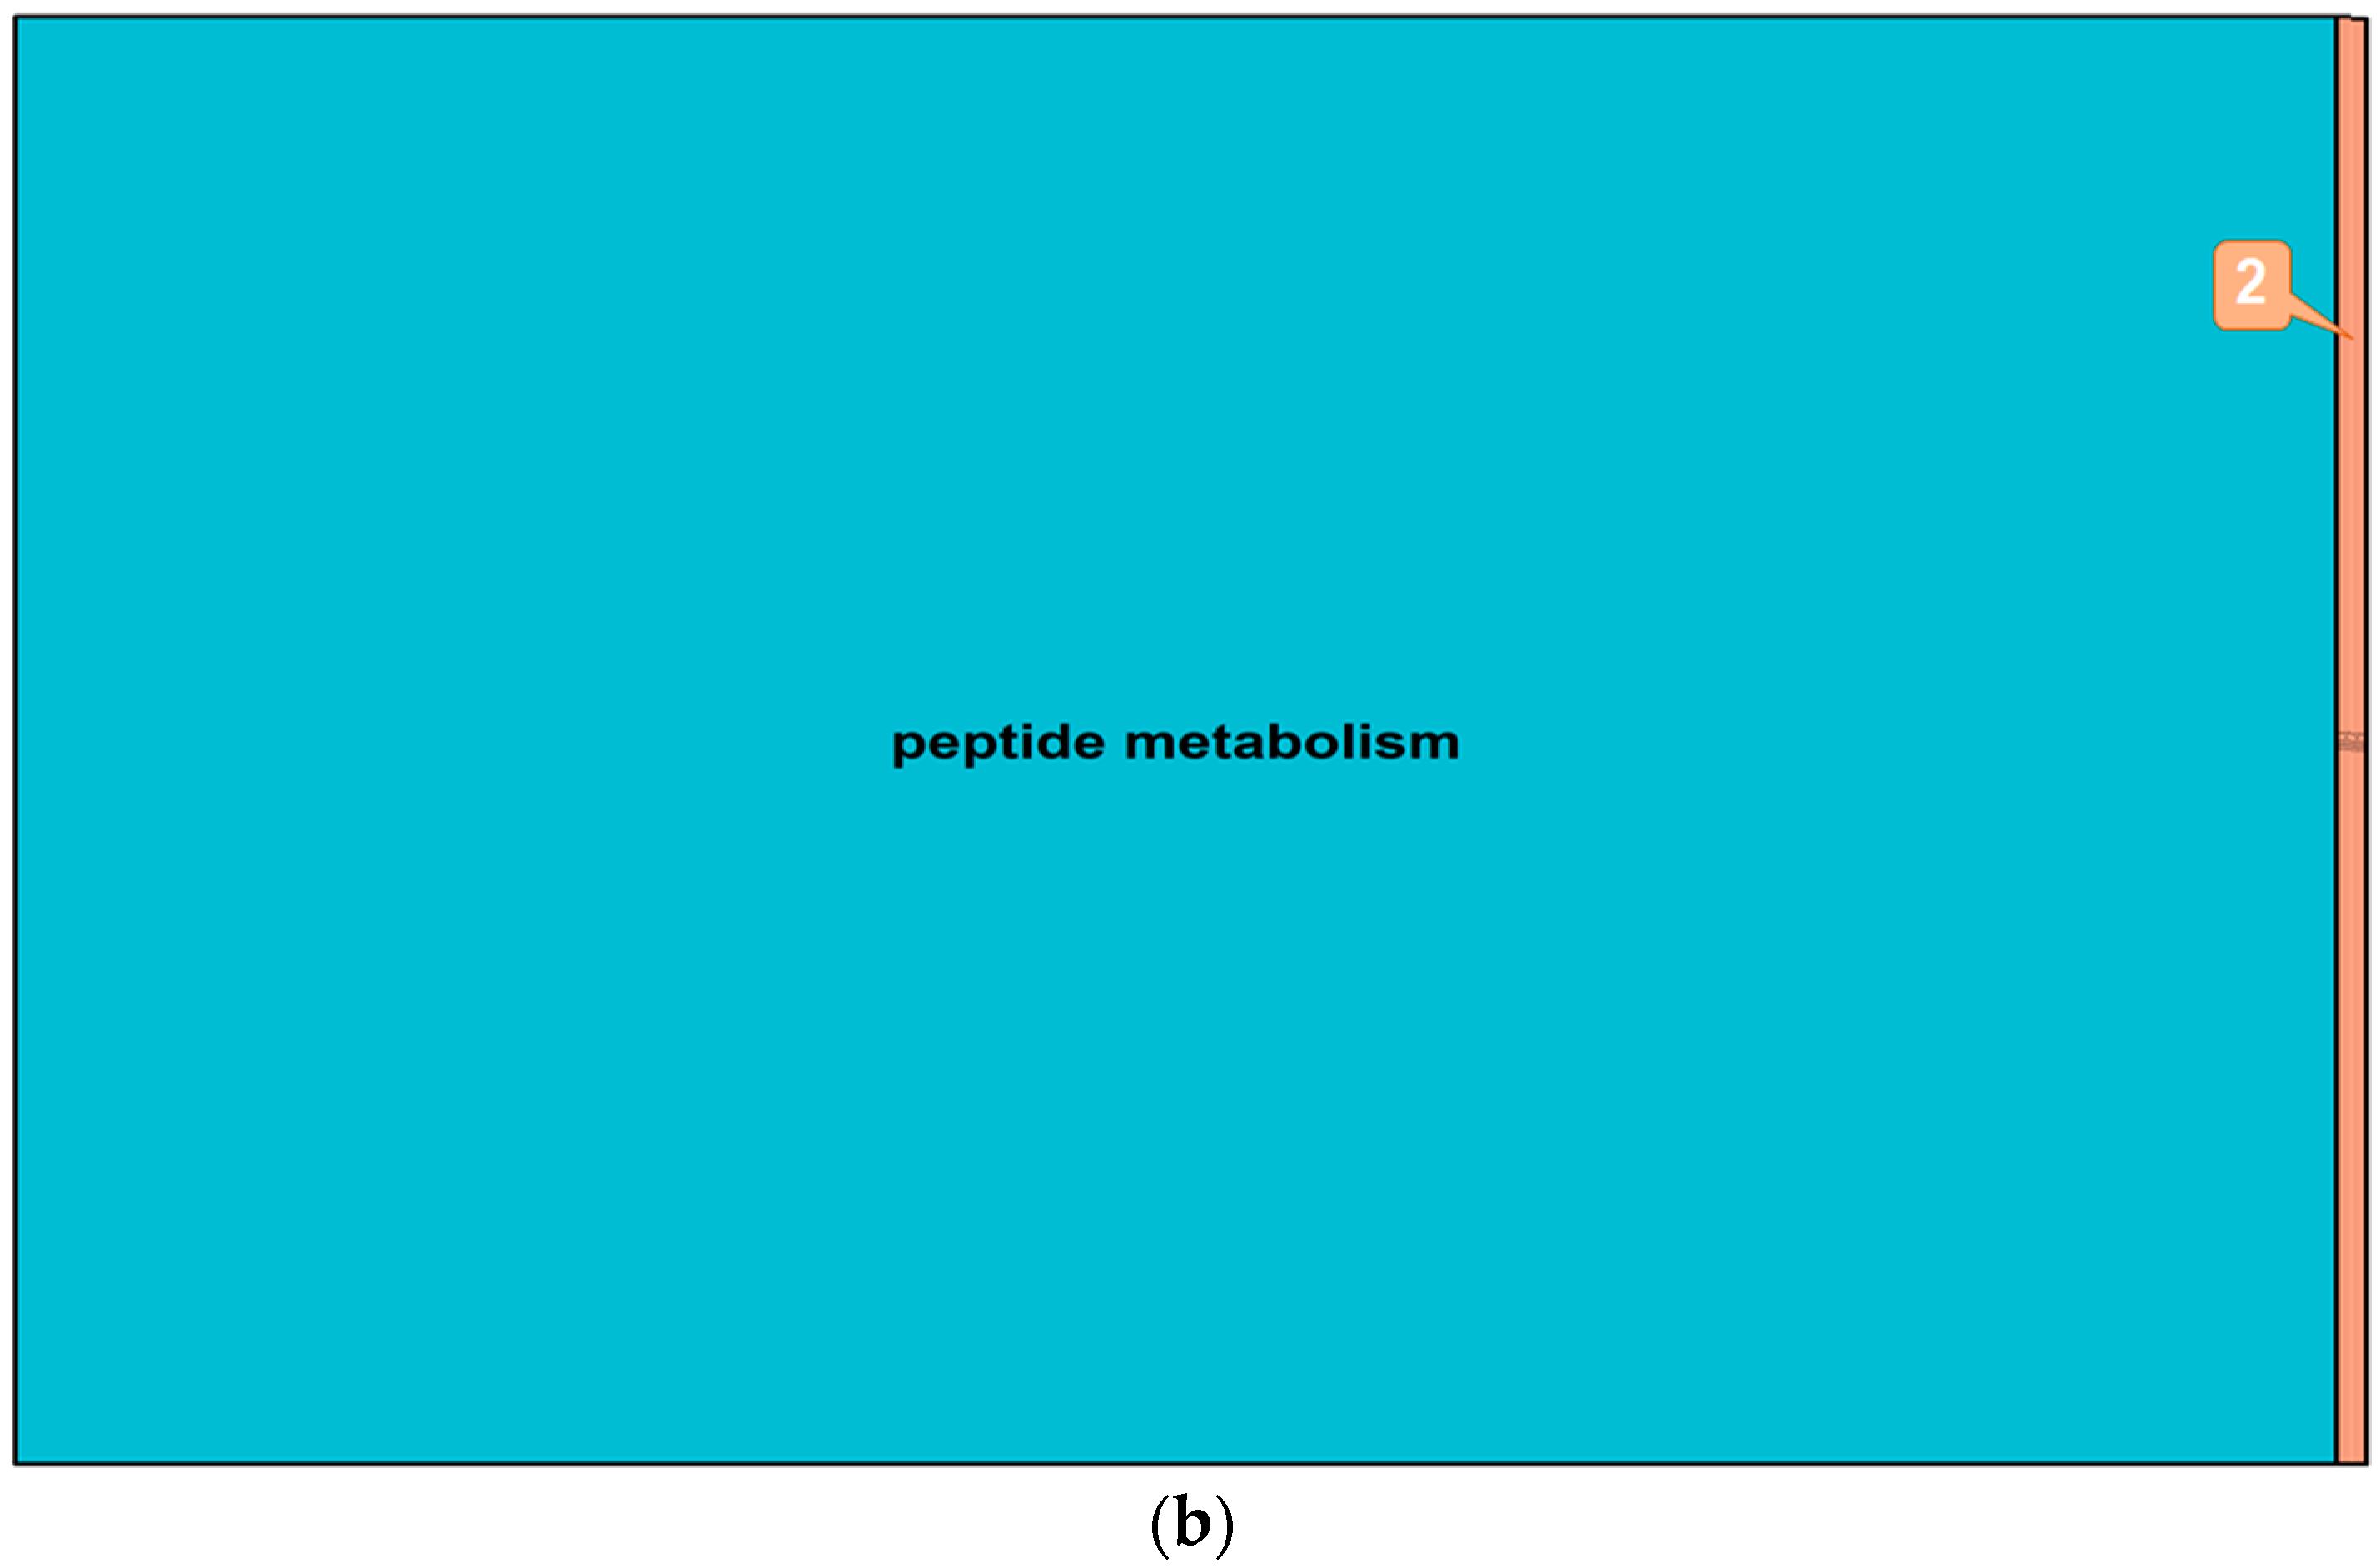
2.5. Gene Ontology Analysis of Salt-Induced DMMs

A gene ontology (GO) analysis was performed for all differentially methylated genes (i.e., within 5 Kb of a salt-induced DMM) from both leaves and roots. The 1070 differentially methylated (DM) genes identified from leaves included 1017 that were hypomethylated and 53 that were hypermethylated following salt exposure. These genes yielded 433 and 99 high level GO terms, for the hypomethylated and hypermethylated groups, respectively (Table 2). The top five functional groups retrieved from the hypomethylated genes in leaves were the “protein modification process”, “cellular amide metabolism”, “cell cycle” and “negative regulation of signal transduction” (Figure 7a, Supplemental Data Set S3). Hypermethylated genes were enriched with GO terms that were associated with “organophosphate biosynthesis”, “peptide metabolism”, “peptide metabolism transport chain”, “generation of precursor metabolites and energy”, and “photosynthesis” (Figure 7b, Supplemental Data Set S3).
In roots, salt-induced hypomethylated markers were associated with 15 genes, whereas hypermethylated DMMs were in, or were proximal to, nine genes. These genes were significantly enriched for 29 (hypomethylated) and 24 (hypermethylated) GO terms (Table 2). The GO terms derived from hypomethylated genes in roots fell into three main function groups, in this order: “generation of precursor metabolites and energy”, “peptide metabolism” and “carbohydrate derivative metabolism” (Figure 8a, Supplemental Data Set S3). Hypermethylated genes enriched GO terms that were related to one main biological function: “peptide biosynthesis”. The details concerning all GO terms enriched by differentially methylated genes in roots are listed in Supplemental Data Set S3.
These GO terms, enriched from differentially methylated genes, give an indication of the biological pathways in which activity might be modified in response to salinity. Some GO terms, although not dominant, are related to functions essential for plant responses to salt stress, such as “ion transmembrane transport”, “potassium ion transport”, “cation transmembrane transporter activity”, “response to osmotic stress, “response to chemical stimulus”, “oxidation–reduction process”, “regulation of innate immune response”, “cellular response to stress”, and “defence response”, among others (Supplemental Data Set S3).

2.6. Differentially Expressed Genes in Barley Roots

To investigate whether observed changes in DNA methylation could be associated with changes in gene expression, salt-induced DMMs were compared to publicly available gene expression responses to salt exposure. These datasets were related to two genotypes (Sahara and Clipper) and included four biological replicates of each variety (see Section 4). Differential gene expression between salt treatments revealed 124 upregulated and 34 downregulated transcripts (Table 3, Supplemental Data Set S4) among which, 76 and 18 transcripts, respectively, matched barley reference genes in the public database “Ensembl” (Available online: http://plants.ensembl.org/biomart/martview). The ontology of these annotated genes revealed many pathways that were regulated by salinity in barley roots. The top five gene representatives of significantly enriched GO terms in upregulated genes were “organophosphate biosynthesis”, “peptide metabolism”, “protein modification process”, “electron transport chain”, “monovalent inorganic cation transport” and “photosynthesis” (Figure 9, Supplemental Data Set S4). Downregulated genes enriched GO terms which clustered around the functional pathway “peptide metabolism” and to a small extent, around “generation of precursor metabolites and energy”.
We then cross-referenced the differentially expressed (DE) genes against the DMMs identified in the current study. This was achieved by searching for DE genes within 5 Kb of DMMs. There were no differentially methylated genes amongst DE genes, with a false discovery rate (FDR) below 5%, and so, we extended the gene list by reducing the stringency of the FDR cut-off to 10%. With this setting, seven DE genes were found to be differentially methylated, one of which contained two DMMs (MSTRG.43260, one hypo- and one hypermethylated) (Table 4). However, there was no correlation between gene methylation status and the direction of gene expression. Some hypomethylated genes were downregulated, whereas others were upregulated, and vice versa for hypermethylated genes (Table 4). Only four of these differentially methylated transcripts matched with annotated barley genes in public databases. The gene ontology analysis of these genes revealed that hypomethylated and hypermethylated genes enriched functionally close GO terms, which were all related to cellular components: plastid, cytoplasmic part and intracellular membrane-bounded (Supplemental Data Set S4).

3. Discussion

A growing number of studies are highlighting the role of DNA methylation in the coordination of the adaptive responses of plants to stress [14,30,31]. The primary challenge, particularly for crops with large genomes, resides in assembling a genome-wide picture of the role of methylation in orchestrating the molecular response to the stressor. As with the study of other stresses, works on methylation-based responses to salt stress have, therefore, largely relied on low throughput-targeted approaches, low genome coverage or anonymous markers applied to a low number of genotypes [7,25,26,27,33,47]. However, our use here of methylation sensitive Genotyping-By-Sequencing (ms-GBS) to study salt-induced changes in DNA methylation in mCCGG contexts has allowed us to survey methylome flux across a reasonably representative portion of the genome (Figure 2). The application of this approach allowed us to characterize genotype-independent, salinity-induced methylation flux in both leaf and root samples, and then to relate the pattern of differentially methylated markers to specific genomic features.

3.1. Consistency of Salt-Induced DMMs

The five barley varieties included in this study (Barque 73, Flagship, Hindmarsh, Schooner and Yarra) were selected based on the similarity in phenology. The lines varied however in their salinity tolerance, in terms of growth rates and sodium accumulation [48]. By comparing varieties that grow at similar pace we aimed to minimise epigenetic variability between samples associated with developmental differences. The high prevalence of concentration-specific DMMs in leaves (52%) and roots (62%) could be taken to imply that many or most are merely stochastic, statistical outliers, as suggested in previous studies [25,28]. However, it should be remembered that all DMMs described here were conserved across all five diverse barley genotypes and five biological replicates (per variety), with the direction of salt-induced methylation flux being conserved in all cases. This element of the experimental pipeline was introduced to minimize the effect of stochastic noise and was intended to strongly enrich conserved responses to salt stress. There are several aspects of the resulting data that suggest that this action did uncover at least some consistent and robust epimarks of salt exposure. At a simplistic level, the progressive increase in the number of leaf DMMs as the salt concentration increased could be taken as being suggestive of an incremental response as the salt concentration rose. This pattern would appear to be in accordance with the established theory that a large number of DMMs only become activated above a threshold concentration of salt, as hypothesized by Soen and co-workers [49]. Following this reasoning, as the salt concentration increases, more thresholds are exceeded and so, more DMMs become recruited into the global methylation flux. In this way, DMM abundance increases proportionally to the salt concentration. However, it is important to note that the use of only three concentration points in the titration series provides somewhat limited scope for confidence in this explanation. It is also pertinent to note that this pattern was not repeated among the root materials, and that DMMs were less frequent in roots, despite being exposed to higher levels of salt than leaf tissues [50]. However, the 22% (6121/28,172) of DMMs conserved across all salt concentrations are likely to be far more robust. The fact that these dose-insensitive DMMs invariably exhibited the same directionality of methylation change across all concentrations (i.e., always hyper- or hypomethylated) despite differing between DMMs is compelling evidence that most are truly salt-induced DMMs that appear across diverse genotypes and respond to salt exposure in a consistent manner.

3.2. Salt Induces Different Changes to the DNA Methylation of Leaves and Roots

The observation that the vast majority of salt-induced, dose-insensitive DMMs were also organ-specific warrants consideration. Roots and shoots respond differently to salinity, with roots playing a role in Na+ sequestration to reduce the amount of Na+ reaching the shoot where it can inhibit photosynthesis. As such, it is likely that different cellular processes are activated in the different organs. Another plausible explanation for the relative paucity of DMMs shared between roots and leaves can be taken from the fact that, although most research on crop tolerance to salt stress has focused on the effect of Na+ [51,52,53], it is now well stablished that the toxic effects and exclusion mechanisms of Na+ and Cl in barley are different and independent [54,55]. A parallel assessment of the barley epigenetic response to each independent ion (i.e., Na+ and Cl) is crucial in order to fully understand the contribution of DNA methylation to salt stress. Barley can effectively compartmentalize excess Na+ in the roots and inhibit its transport to the leaves [56]. This response gives rise to very different Na+ environments in the two organs, with Na+ concentrations being generally higher in the roots than the shoots [50,56]. We reason that the dose-insensitive DMMs identified in the present study are all likely to respond to low salt thresholds, and so, appear in all salt treatments across the titration. Even though Na+ levels differ between the roots and shoots [50], the levels in both organs are generally within the same order of magnitude, and a low induction threshold would be reached in both. However, the divergence between leaf and root DMMs is in accordance with the known physiological response of the species to saline exposure of the roots and implies that both sets of DMMs would, therefore, provide a robust indication of exposure to salt.
Certainly, it has been widely reported that salinity imposes extensive, genome-wide modification of DNA methylation patterns, with more methylation changes being reported in leaves when compared with roots [25,26,27,33,57,58,59,60], a trend that is clearly in accordance with our findings. Taken at face value, the greater abundance of salt-induced methylation changes in leaves than in roots appears counterintuitive, since roots are in direct contact with salt stress. That said, we found the scale of change in methylation was greater in roots than in leaves, suggesting that although salt evokes changes in fewer loci, the effects on these sites are greater. Provided these changes are associated with concurrent changes to expressions of key genes involved with responses to salt stress, these observations can accommodate root-specific epigenetic responses to saline environments while plants are undergoing osmotic stress and salt toxicity [8,61]. Should at least one of these processes be focused on repressed transport of Na+, then milder ion accumulation in the leaves will slowly increase stress [5,62] at a lower level because of ‘leakiness’ of the system, evoking a widespread, but more measured, response in the leaves.
Our results agree with many previous studies that have reported that the overall level and direction of methylation flux in response to salinity varies according to organ type, with a tendency towards hypomethylation in roots and hypermethylation in leaves [7,25,26,27,33,47]. However, we also noted that the proportion of de novo methylation and demethylation events varied in the same manner in both roots and leaves, with a prevalence of hypomethylated events in both organs, albeit at different frequencies. It is possible that divergence between our findings and those of previous studies [7,25,26,27,33,47] may simply be a feature of barley. However, it is also possible that the trend towards hypomethylation is a more general one and that our findings diverge because of methodological differences in the present work such as (1) the high-throughput sequencing used to generate methylation profiles; (2) the level of stringency in selecting DMMs (FDR < 0.01); and 3) the diversity of barley varieties used in this study to account for genotype-dependent DNA methylation [25,26,27]. Most studies of salt-induced DNA methylation have relied on MSAP analysis of a single variety to assess flux in DNA methylation [7,25,26,27,33,47]. However, MSAP generates anonymous markers, and it is difficult to interpret the gain or loss of markers as providing clear evidence of hypo- or hypermethylation [42].

3.3. Salt-Induced Changes in DNA Methylation May Influence Gene Regulation

DNA methylation is modulated in the genome in three ways: de novo methylation (hypermethylation), methylation maintenance, and methylation removal (hypomethylation) [63]. Modification of DNA methylation in response to stress is hypothesised to be at least partially directed to specific genomic regions where the DNA methylation status influences the expression of stress-response genes [18,30,64,65]. This is in accordance with our finding that dose-insensitive salt-induced DMMs appeared more commonly in sites that could facilitate perturbation in the expression of genes that hypothetically could be part of a molecular response to salinity, as reported elsewhere [65]. There is evidence from previous studies to suggest that salt-induced DMMs can play important roles in evoking metabolic differences between seedlings growing under control and saline conditions [25,26,29,34,64,66], although the markers found in these works were either few in number or else identified from a single genotype. The provision here of a robust list of consistent, salt-responsive DMMs therefore provides a useful starting point from which to gather a more holistic picture of DNA methylation-mediated regulation of molecular responses to salt exposure.
Proof of a functional link between the change in methylation status in these DMMs and associated alterations in the expression of proximal stress response genes is beyond the scope of the current study. Nevertheless, there are several grounds for reasoning that at least some of the markers identified here are indeed functionally important. Certainly, others have argued that the close proximity of DMMs relative to the target genes is at least one requirement for such a relationship [19,67,68,69]. Viewed in this context, our observed clustering of DMMs around untranslated regions (UTRs) and exons is at least consistent with salt-induced DMMs mediating a functional response to the stress. Others have shown that a high frequency of salt-induced DMMs in gene extremities (towards 5′UTR and 3′UTR) can influence gene regulation through 5′UTR’ and 3′UTR’ closed-loop regulation systems which generate inactive transcripts [70,71], or through independent gene regulation by each UTR type [72]. Karan et al. [25] similarly observed that salt-induced DNA methylation changes generally occur in exon and UTR regions and could affect diverse biological functions in plants. There is also a strong body of evidence to suggest that gene body methylation, in general, can affect gene expression [19,55,68] by enhancing or inhibiting transcription and translation processes [71,72].
It has been claimed that, of all cytosine contexts, only mCG methylation occurs within gene bodies [68,73,74,75]. Our findings and those of others [76] do not support this stance, with non-CG types of methylation, such as mCCGG, being found frequently in transcribed regions from DNA isolated from both leaves and roots of barley. It is, however, still open to question whether these markers, like mCG, play roles in regulating gene expression [77]. Our observation of salt-induced DMMs associated with tRNA genes is more surprising and perhaps in accordance with the suggestion of a role for methylation-dependent regulation to support the RNA quality control system and protein synthesis [78,79,80]. More work is clearly required to investigate this possibility.

3.4. Salt-Induced DMMs Correlate with Stress Related Genes

There is circumstantial support to argue that at least some of the DMMs identified here may play functional roles in the expression of salt-response genes. Salt stress in barley alters the expression patterns of genes involved in a diverse range of physiological and regulatory pathways [3,9]. Given that salt-induced DMMs have the potential to regulate gene expression, the functions of differentially methylated genes were explored for possible correlations with stress responsive genes. The correlation of DM genes with GO terms that are related to plant responses to stress, such as “negative regulation of signal transduction”, “photosynthesis”, “response to osmotic stress” and “ion transmembrane transport”, is at least consistent with the possibility that salt-induced DMMs targeted genes which could play active functions in a plant’s response to salt, in broad accordance with previously expression studies of salt response [29,81,82,83]. In addition, some of the DM genes identified here were enriched for GO terms, such as “hydrolase activity”, “oxidoreductase activity”, “nucleic acid binding”, and “translation factor activity”. This agrees with similar reports of differentially methylated genes associated with salt stress in rice [25,26].
The present study also revealed differential DNA methylation of genes implicated in “organophosphate biosynthesis”. Should the change in methylation state alter the expression of these genes, it would be in accordance with previous studies which have shown that salt stress induces an increase in the amount of intra-cellular organophosphate solutes, such as di-myo-inositol-phosphate, inositol (1,4,5) trisphosphate, b-mannosylglycerate, b-mannosylglycerate and glutamate [84,85]. Furthermore, it was reported that salinity induces inorganic phosphate toxicity when Pi exceeds 0.10 mM in the substrate [86,87]. This salt-induced phosphate toxicity may arise from an excess of phosphate, not only due to P uptake, but also due to salt-induced increases of intracellular organophosphate solutes [85,86]. However, it is important to recognise that although the presence of DMMs near a gene may be an indication of responsiveness to salt stress, it does not provide sufficient evidence of a functional role of DNA methylation in the regulation of that gene [21,68]. Gene expression analysis is required to assess the link between DNA methylation and gene activity under salt stress. Finally, our current understanding of plant epigenetic responses to the environment has predominantly arisen from the analysis of mixed populations of cells contained within plant organs. Recent works have identified tissue [77] and cell type-specific [88] patterns of DNA methylation associated with tissue specific gene expression [77]. In light of these results, it is clear that in order to achieve a better understanding of the role that DNA methylation plays in plant responses to environmental challenges, future studies should include approaches that independently interrogate the methylome and transcriptomes of different tissues and cell types.
The difficulty in extrapolating a functional link is highlighted by the fact that only seven of the genes previously reported to be differentially expressed in roots [3] were also differentially methylated under salt stress. This result may imply that few of the markers found here are functionally important or, alternatively, this may be attributable to the use of different biological samples for methylation profiling and gene expression analyses, different growing conditions [3], partial coverage of the barley reference genome used here [4] or to the possibility of bias due to salt-induced DNA degradation [33,54,89,90].

4. Materials and Methods

4.1. Plant Material and Stress Treatment

Five diverse spring barley varieties were used in this investigation: Barque 73, Flagship, Hindmarsh, Schooner and Yarra. Seeds were kindly provided by the Salt Focus Group at the Australian Centre for Plant Functional Genomics (ACPFG, Adelaide, Australia). The lines were chosen due to their similar phenology, but they had a range of salinity tolerance levels [48]. The experiment was designed in randomized blocks of five replicates and four salinity treatments: control (0), 75, 150 and 200 mM NaCl.
Seeds were germinated, and seedlings were grown in 3.3 L free-draining pots, placed on saucers containing 2915 g of growth substrate (50% UC (University of California at Davis, Davis, CA, USA) potting mix, 35% coco-peat, and 15% clay/loam (v/v)). The five barley varieties were sown in each pot and positions were randomized in each pot to minimize a block effect. Two seeds were sown per variety and thinned to one seedling at 8 days after sowing. Salinity treatments were applied 10 days after sowing in four increments over 4 consecutive days, to minimise osmotic shock [91]. The required amount of NaCl for each salt concentration was calculated based on the substrate soil’s dry weight and the target gravimetric water content of 16.8% (g/g) [91]. At the time of salt application, the water content reached 26.4% and dropped down to the final concentration through evapotranspiration. Pots were watered to weight every 2 days to maintain the target gravimetric water content (16.8% (g/g)) [91] until sampling.
This experiment was conducted from 30 January to 20 February 2015, in a greenhouse at the Waite Campus, University of Adelaide (Adelaide, Australia), (34°58′11″ S, 138°38′19″ E). The seedlings were grown under a natural photoperiod and the temperature was set at 22 °C/15 °C (day/night).

4.2. DNA Extraction

At day 11 after the first salt stress imposition to barley seedlings (21 days after sowing, three leaves stage), 50 mg samples were collected from the middle sections of the 3rd leaf blades and roots. In total, 200 samples were collected (five varieties, four treatments and two organs), and were snap-frozen in liquid nitrogen, and then stored in a −80 °C freezer until needed for DNA extraction. Prior to DNA extraction, frozen plant material was disrupted in a bead beater (2010-Geno/Grinder, SPEX SamplePrep®, Metuchen, NJ, USA). Genomic DNA was isolated using a Qiagen DNeasy kit (Qiagen, Dusseldorf, Germany), following the manufacturer’s instructions. DNA samples were then quantified in a NanoDrop® 1000 Spectrophotometer (V 3.8.1, ThermoFisher Scientific Inc., Waltham, MA, USA) and concentrations were standardised to 10 ng/µL for subsequent ms-GBS library preparation.

4.3. Methylation Sensitive Genotyping by Sequencing (ms-GBS)

ms-GBS was performed using a modified version [44,45] of the original GBS technique [92,93]. Genomic DNA was digested using the combination of a rare cutter, EcoRI (GAATTC), and a frequent, methylation sensitive cutter MspI (CCGG). Each sample of DNA was digested in a reaction volume of 20 µL, containing 2 µL of New England BioLabs Smartcut buffer, 8 U of HF-EcoRI (High-Fidelity) and 8 U of MspI (New England BioLabs Inc., Ipswich, MA, USA). The reaction was performed in a BioRad 100 thermocycler at 37 °C for 2 h, followed by enzyme inactivation at 65 °C for 10 min.
Then, the ligation of adapters to individual samples was achieved in the same plates by adding 0.1 pmol of the respective barcoded adapters with an MspI cut site overhang, 15 pmol of the common Y adapter with an EcoRI cut site overhang, 200 U of T4 Ligase and T4 Ligase buffer (NEB T4 DNA Ligase #M0202) in a total volume of 40 µL. Ligation was carried out at 24 °C for 2 h followed by an enzyme inactivation step at 65 °C for 10 min.
DNA samples were allocated to plates (81 samples each), including the negative control, water. Prior to pooling plate samples into a single 81-plex library, the ligation products were individually cleaned up to remove excess adapters using an Agencourt AMPure XP purification system (#A63880, Beckman Coulter, Brea, CA, USA) at a ratio of 0.85, following the manufacturer’s instructions. Individual GBS libraries were produced by pooling 25 ng of DNA from each sample. Each constructed library was then amplified in eight separate PCR reactions (25 μL each), containing 10 μL of library DNA, 5 μL of 5× Q5 high fidelity buffer, 0.25 µL of polymerase Q5 high fidelity, and 1 μL of each Forward and Reverse common primer at 10 μM, 0.5 µL of 10 μM dNTP and 7.25 µL of pure sterile water. PCR amplification was performed in a BioRad T100 thermocycler (BioRad, Hercules, CA, USA), consisting of DNA denaturation at 98 °C (30 s) and ten cycles of 98 °C (30 s), 62 °C (20 s) and 72 °C (30 s), followed by 72 °C for 5 min. PCR products were next pooled to reconstitute libraries. DNA fragments between 200 and 350 bp in size were captured using Agencourt AMPure XP magnetic beads following the manufacturer’s instructions. Bead-captured fragments were eluted in 35 μL of water, and 30 μL of the elution was collected in a new labelled microtube. Next, libraries were 125 bp paired-end sequenced in an Illumina HiSeq 2500 platform (Illumina Inc., San Diego, CA, USA) at the Australian Genome Research Facility (AGRF, Melbourne node, Australia). Sequencing results were deposited in the European Nucleotide Archive (ENA) (Study Accession Number: PRJEB27251) (See Supplemental Data Set S5 for sample sequencing information).

4.4. Data Analysis

The ms-GBS data was analysed following a workflow requiring bioinformatics tools in both Linux bash shell and R environments. Fastq files from the Illumina sequencing platform were first de-multiplexed and checked for read quality by the sequencing service provider, reporting read quality encoded in symbolic ASCII format as Phred-like quality score +33. Only fragments with at least 95% of the reads having Phred > 25 were retained. Reads that did not have a barcode were put into undetermined files and removed from any downstream analyses. Prior to demultiplexing, Illumina adaptor sequences, used for library construction, were also removed. The second step consisted of preparing the reads for alignment with the barley reference genome. As this was paired-end read sequencing data, both strands were merged together in a single read, using the module bbmap in bash. Merged reads were next aligned to the barley reference genome downloaded from the Ensembl database (Available online: http://plants.ensembl.org/Hordeum_vulgare/). This required the module bowtie/2-2.2.3 to build a bowtie2 index for the barley genome, and the module samtools/1.2 to perform alignments. As paired reads were merged into single reads, only those that overlapped were retained, to allow proper mapping. This alignment step yielded bam files containing only reads that matched with the reference genome. Next, a read count matrix was generated using only marker sequence tags that matched with MspI cut sites on known chromosomes (1H to 7H), and those on contigs were discarded. This count matrix was then used as data source for the performance of subsequent analyses using R packages.

4.5. Salinity Induced Differentially Methylated Markers in Barley

The alteration of DNA methylation in barley seedlings exposed to salinity was assessed in mCCGG contexts by the use of MspI during sample preparation. Differentially methylated markers (DMMs) were identified using the package msgbsR developed by Mayne et al. [94] (Available online: https://github.com/BenjaminAdelaide/msgbsR, accessed on 26 August 2016), in which a generalised linear model was fitted to the design with the trimmed mean of M-values normalisation option (TMM). Then, the Benjamini–Hochberg method was used to determine p-values. DMMs were selected based on FDR < 0.01 for differences in read counts per million between the salt-free control and salt treatments (75, 150 or 200 mM NaCl), with at least 1 count per million (CPM) reads. To obtain robust salt-induced markers, we selected DMMs that were conserved in all barley genotypes and present in at least 20 samples per treatment. The logFC (logarithm 2 of fold-change in CPM reads) was computed to evaluate the intensity of salt treatment-induced alteration of DNA methylation and to infer whether the change was a de novo methylation or demethylation event. This approach for determining the directionality of DNA methylation uses the fold change as an inverse proxy for changes in the methylation level. That is, higher methylation levels at a specific locus will reduce the number of restriction products for that locus [39] and therefore, reduce its number of CPM reads.

4.6. Distribution of Salt-Induced DMMs around Genomic Features

To determine whether there was a correlation between salt-induced DNA methylation and genomic features in barley, the distribution of DMMs was assessed around genes and repeat regions, as defined in the Ensembl database (Available online: http://plants.ensembl.org/biomart/martview/). This was done by mapping stable, salt-induced DMMs with repeats and genes in the barley reference genome. Then, we tallied the number of DMMs within genomic features (repeats, genes, exons) and per 1 Kb bins within 5 Kb flanking regions, both up- and downstream [47,95], using the shell module bedtools/2.22.0 [96]. The same procedure was repeated to estimate the number of DMMs around exons and UTRs of differentially methylated genes, and tRNA genes.

4.7. Gene Ontology of Differentially Methylated Genes

Genes within 5 Kb of a DMM were referred to as differentially methylated genes (DMGs). These genes were used for the gene ontology analysis, to investigate whether salt-induced changes in DNA methylation correlated with salt responsive genes. DM genes were grouped in hypermethylated and hypomethylated genes per organ (leaf or root), which were next used separately for GO term enrichment, using two R packages: GO.db and annotate [97,98]. Significant GO terms were selected based on Bonferroni adjusted p-values [99] at a significance threshold of 0.01 and a total GO enrichment of DM and non-DM genes equal to at least 10. The results of the GO analysis were visualized in treemaps generated in REVIGO [100].

4.8. Gene Expression and Ontology Analysis of Root Transcriptome

We further investigated whether differentially methylated genes were known to be differentially expressed in the plant. To do so, we used, as an example, a dataset of root transcriptomes of two barley varieties (Clipper and Sahara-3771) grown under salt stress (100 mM NaCl) and control conditions [3]. The raw data was downloaded from Available online: https://www.ebi.ac.uk/arrayexpress/experiments/E-MTAB-4634/, and samples from the root maturation zone, as defined by the authors [3], were used. The data contained four biological replicates of two varieties and two salt treatments (control and 100 mM NaCl), to give a total library size of over 390 million reads. Quality control was performed on these reads, which were then merged to form a single, large fastq file for each sample. Merged read pairs were trimmed using AdapterRemoval [101], followed by a second round of quality control.
After alignment using hisat2-2.0.4 in bash [102], a salt-induced differential gene expression analysis was performed, using a custom GTF file from Ensembl, created by the tool StringTie 1.3.1c [103]. This GFF file was restricted to transcripts on known chromosomes (1H to 7H). Read counts were assigned to genes in the GTF file using featureCounts v1.5.1 [104] and loaded as DGEList objects in R. As the data contained paired-end reads, the parameters were set to only count fragments (i.e., template molecules), instead of individual reads. This dataset was next filtered to keep only genes with CPM > 0.5 in at least four samples. Gene transcripts passing these conditions and present on chromosomes 1H to 7H were retained for differential expression analysis.
Before comparing treatments, the dataset was explored for sample variability using the MDS plot. Differential gene expression was then estimated using the lmFit function in limma::voom, a gene-wise linear model [105], and differentially expressed genes were defined as having an absolute fold-change > 2, with an FDR adjusted p-value < 0.05. Differentially expressed genes were first used “as is” for the gene ontology analysis as described above (previous section). Differentially expressed genes were then assessed for their proximity to salt-induced DMMs within 5 Kb in both directions. Genes found in this proximity with DMMs and referred to as differentially methylated DE genes, were used for another GO analysis. The results of these GO enrichments were visualized in treemaps produced in REVIGO [100] to show the main GO representatives.

5. Conclusions

To our knowledge, this study has provided the most comprehensive set of robust leaf and root epimarkers to indicate the exposure of barley to salt stress. These markers were conserved in both identity and direction across five diverse genotypes, biological replicates and all salt concentrations used. The leaf markers have potential value as epigenetic sentinels of the exposure of individual plants to soil salt stress. Viewed collectively, the root and leaf markers provide a useful starting point from which to assemble a more comprehensive picture of the functional role of DNA methylation in facilitating the plastic molecular responses of barley to this important stressor.

Supplementary Materials

The following are available online at https://0-www-mdpi-com.brum.beds.ac.uk/2075-4655/2/2/12/s1. Supplemental Data Set S1. List of stable salt-induced differentially methylated markers in leaves and roots. Supplemental Data Set S2. List of salt-induced differentially methylated genes. Supplemental Data Set S3. Annotation of salt-induced differentially methylated genes in barley leaves and roots. Supplemental Data Set S4. List and annotation of salt induced DE genes and differentially methylated DE genes in roots of Clipper and LR Sahara. Supplemental Data Set S5. Sample information includes: Sequencing sample IDs, variety tissue, salt treatment (NaCl mM), sequencing barcode and sequencing plate.

Author Contributions

M.K. conceived and performed the experiments, analysed the data and wrote the manuscript; B.T.M. performed ms-GBS data alignments; S.M.P. performed the bioinformatic analysis of publicly available RNA-Seq data; M.J.W., E.S.S., B.B. and C.M.R.L. conceived the experiments and supervised the work. All authors read and commented on the manuscript.

Funding

M.K. was financially supported by an Australian Awards Scholarship, offered by AusAID (Australian Agency for International Development). M.J.W. was partly supported by the Biotechnology and Biological Sciences Research Council (BBS/E/0012843C).

Conflicts of Interest

The authors declare no conflict of interest.

References

  1. FAO. Barley, Malt, Beer. In Agribusiness; FAO: Rome, Italy, 2009. [Google Scholar]
  2. Zhou, M.X. Barley production and consumption. In Genetics and Improvement of Barley Malt Quality; Zhang, G., Li, C., Eds.; Springer: Berlin/Heidelberg, Germany, 2010; pp. 1–17. [Google Scholar]
  3. Hill, C.B.; Cassin, A.; Keeble-Gagnère, G.; Doblin, M.S.; Bacic, A.; Roessner, U. De novo transcriptome assembly and analysis of differentially expressed genes of two barley genotypes reveal root-zone-specific responses to salt exposure. Sci. Rep. 2016, 6, 31558. [Google Scholar] [CrossRef] [PubMed] [Green Version]
  4. Mayer, K.F.X.; Nussbaumer, T.; Gundlach, H.; Martis, M.; Spannagl, M.; Pfeifer, M. A physical, genetic and functional sequence assembly of the barley genome. Nature 2012, 491, 711–716. [Google Scholar] [PubMed] [Green Version]
  5. Munns, R.; Tester, M. Mechanisms of salinity tolerance. Annu. Rev. Plant Biol. 2008, 59, 651–681. [Google Scholar] [CrossRef] [PubMed]
  6. Glenn, E.P.; Brown, J.J.; Blumwald, E. Salt tolerance and crop potential of halophytes. Crit. Rev. Plant Sci. 1999, 18, 227–255. [Google Scholar] [CrossRef]
  7. Wang, B.; Fu, R.; Zhang, M.; Ding, Z.; Chang, L.; Zhu, X.; Wang, Y.; Fan, B.; Ye, W.; Yuan, Y. Analysis of methylation-sensitive amplified polymorphism in different cotton accessions under salt stress based on capillary electrophoresis. Genes Genom. 2015, 37, 713–724. [Google Scholar] [CrossRef]
  8. Roy, S.J.; Negrão, S.; Tester, M. Salt resistant crop plants. Curr. Opin. Biotechnol. 2014, 26, 115–124. [Google Scholar] [CrossRef] [PubMed]
  9. Ziemann, M.; Kamboj, A.; Hove, R.M.; Loveridge, S.; El-Osta, A.; Bhave, M. Analysis of the barley leaf transcriptome under salinity stress using mRNA-Seq. Acta Physiol. Plant. 2013, 35, 1915–1924. [Google Scholar] [CrossRef]
  10. Moose, S.P.; Mumm, R.H. Molecular plant breeding as the foundation for 21st century crop improvement. Plant Physiol. 2008, 147, 969–977. [Google Scholar] [CrossRef] [PubMed]
  11. Rodriguez Lopez, C.M.; Wilkinson, M.J. Epi-fingerprinting and epi-interventions for improved crop production and food quality. Front. Plant Sci. 2015, 6, 1–14. [Google Scholar] [CrossRef] [PubMed]
  12. Bender, J. DNA methylation and epigenetics. Annu. Rev. Plant Biol. 2004, 55, 41–68. [Google Scholar] [CrossRef] [PubMed]
  13. Bossdorf, O.; Arcuri, D.; Richards, C.; Pigliucci, M. Experimental alteration of DNA methylation affects the phenotypic plasticity of ecologically relevant traits in Arabidopsis thaliana. Evol. Ecol. 2010, 24, 541–553. [Google Scholar] [CrossRef]
  14. Boyko, A.; Kovalchuk, I. Epigenetic control of plant stress response. Environ. Mol. Mutagen. 2008, 49, 61–72. [Google Scholar] [CrossRef] [PubMed] [Green Version]
  15. Wang, L.; Fu, X.W.; Peng, X.; Xiao, Z.; Li, Z.G.; Chen, G.J.; Wang, X.F. DNA methylation profiling reveals correlation of differential methylation patterns with gene expression in human epilepsy. J. Mol. Neurosci. 2016, 59, 68–77. [Google Scholar] [CrossRef] [PubMed]
  16. Zilberman, D.; Gehring, M.; Tran, R.K.; Ballinger, T.; Henikoff, S. Genome-wide analysis of Arabidopsis thaliana DNA methylation uncovers an interdependence between methylation and transcription. Nat. Genet. 2007, 39, 61–69. [Google Scholar] [CrossRef] [PubMed]
  17. Causevic, A.; Delaunay, A.; Ounnar, S.; Righezza, M.; Delmotte, F.; Brignolas, F.; Hagège, D.; Maury, S. DNA methylating and demethylating treatments modify phenotype and cell wall differentiation state in sugarbeet cell lines. Plant Physiol. Biochem. 2005, 43, 681–691. [Google Scholar] [CrossRef] [PubMed]
  18. Wada, Y.; Miyamoto, K.; Kusano, T.; Sano, H. Association between up-regulation of stress-responsive genes and hypomethylation of genomic DNA in tobacco plants. Mol. Genet. Genom. 2004, 271, 658–666. [Google Scholar] [CrossRef] [PubMed]
  19. Aceituno, F.; Moseyko, N.; Rhee, S.; Gutiérrez, R. The rules of gene expression in plants: Organ identity and gene body methylation are key factors for regulation of gene expression in Arabidopsis thaliana. BMC Genom. 2008, 9, 438. [Google Scholar] [CrossRef] [PubMed]
  20. Bird, A.; Jaenisch, R. Epigenetic regulation of gene expression: How the genome integrates intrinsic and environmental signals. Nat. Genet. 2003, 33, 245–254. [Google Scholar]
  21. Li, Q.; Song, J.; West, P.T.; Zynda, G.; Eichten, S.R.; Vaughn, M.W.; Springer, N.M. Examining the causes and consequences of context-specific differential DNA methylation in maize. Plant Physiol. 2015, 168, 1262–1274. [Google Scholar] [CrossRef] [PubMed] [Green Version]
  22. Jones, P.A. Functions of DNA methylation: Islands, start sites, gene bodies and beyond. Nat. Rev. Genet. 2012, 13, 484–492. [Google Scholar] [CrossRef] [PubMed]
  23. Zhang, W.T.; Hong-Qi, W.U.; Hai-Bin, G.U.; Guang-Long, F.E.N.G.; Ze, W.A.N.G.; Sheng, J.D. Variability of soil salinity at multiple spatio-temporal scales and the related driving factors in the oasis areas of Xinjiang, China. Pedosphere 2014, 24, 753–762. [Google Scholar] [CrossRef]
  24. Guo, Y.; Huang, J.; Shi, Z.; Li, H. Mapping spatial variability of soil salinity in a coastal paddy field based on electromagnetic sensors. PLoS ONE 2015, 10, e0127996. [Google Scholar] [CrossRef] [PubMed]
  25. Karan, R.; DeLeon, T.; Biradar, H.; Subudhi, P.K. Salt stress induced variation in DNA methylation pattern and its influence on gene expression in contrasting rice genotypes. PLoS ONE 2012, 7, e40203. [Google Scholar] [CrossRef] [PubMed]
  26. Wang, W.; Zhao, X.; Pan, Y.; Zhu, L.; Fu, B.; Li, Z. DNA methylation changes detected by methylation-sensitive amplified polymorphism in two contrasting rice genotypes under salt stress. J. Genet. Genom. 2011, 38, 419–424. [Google Scholar] [CrossRef] [PubMed]
  27. Zhong, L.; Xu, Y.H.; Wang, J.B. DNA-methylation changes induced by salt stress in wheat Triticum aestivum. Afr. J. Biotechnol. 2009, 8, 6201–6207. [Google Scholar]
  28. Vogt, G. Stochastic developmental variation, an epigenetic source of phenotypic diversity with far-reaching biological consequences. J. Biosci. 2015, 40, 159–204. [Google Scholar] [CrossRef] [PubMed]
  29. Baek, D.; Jiang, J.; Chung, J.-S.; Wang, B.; Chen, J.; Xin, Z.; Shi, H. Regulated AtHKT1 gene expression by a distal enhancer element and DNA methylation in the promoter plays an important role in salt tolerance. Plant Cell Physiol. 2011, 52, 149–161. [Google Scholar] [CrossRef] [PubMed]
  30. Kinoshita, T.; Seki, M. Epigenetic memory for stress response and adaptation in plants. Plant Cell Physiol. 2014, 55, 1859–1863. [Google Scholar] [CrossRef] [PubMed]
  31. Chinnusamy, V.; Zhu, J.-K. Epigenetic regulation of stress responses in plants. Curr. Opin. Plant Biol. 2009, 12, 133–139. [Google Scholar] [CrossRef] [PubMed] [Green Version]
  32. Wang, M.; Qin, L.; Xie, C.; Li, W.; Yuan, J.; Kong, L.; Yu, W.; Xia, G.; Liu, S. Induced and constitutive DNA methylation in a salinity-tolerant wheat introgression line. Plant Cell Physiol. 2014, 55, 1354–1365. [Google Scholar] [CrossRef] [PubMed]
  33. Lu, G.; Wu, X.; Chen, B.; Gao, G.; Xu, K. Evaluation of genetic and epigenetic modification in rapeseed (Brassica napus) induced by salt stress. J. Integr. Plant Biol. 2007, 49, 1599–1607. [Google Scholar]
  34. Tan, M.-P. Analysis of DNA methylation of maize in response to osmotic and salt stress based on methylation-sensitive amplified polymorphism. Plant Physiol. Biochem. 2010, 48, 21–26. [Google Scholar] [CrossRef] [PubMed]
  35. Karim, K.; Amani Ben, N.; M’Barek Ben, N. Transcriptional changes in salt-responsive genes of barley subjected to salt stress. Int. J. Innov. Appl. Stud. 2014, 7, 85–94. [Google Scholar]
  36. Kumar, S. Epigenomics of Plant Responses to Environmental Stress. Epigenomes 2018, 2, 6. [Google Scholar] [CrossRef]
  37. Laird, P.W. Principles and challenges of genome-wide DNA methylation analysis. Nat. Rev. Genet. 2010, 11, 191–203. [Google Scholar] [CrossRef] [PubMed]
  38. Tricker, P.J.; Gibbings, J.G.; Rodríguez López, C.M.; Hadley, P.; Wilkinson, M.J. Low relative humidity triggers RNA-directed de novo DNA methylation and suppression of genes controlling stomatal development. J. Exp. Bot. 2012, 63, 3799–3813. [Google Scholar] [CrossRef] [PubMed] [Green Version]
  39. Rodríguez López, C.M.; Morán, P.; Lago, F.; Espiñeira, M.; Beckmann, M.; Consuegra, S. Detection and quantification of tissue of origin in salmon and veal products using methylation sensitive AFLPs. Food Chem. 2012, 131, 1493–1498. [Google Scholar] [CrossRef]
  40. Rois, A.; Rodriguez Lopez, C.; Cortinhas, A.; Erben, M.; Espirito-Santo, D.; Wilkinson, M.; Caperta, A. Epigenetic rather than genetic factors may explain phenotypic divergence between coastal populations of diploid and tetraploid Limonium spp. (Plumbaginaceae) in Portugal. BMC Plant Biol. 2013, 13, 205. [Google Scholar] [CrossRef] [PubMed]
  41. Paun, O.; Schönswetter, P. Amplified fragment length polymorphism: An invaluable fingerprinting technique for genomic, transcriptomic, and epigenetic studies. In Plant DNA Fingerprinting and Barcoding; Sucher, N.J., Hennell, J.R., Carles, M.C., Eds.; Humana Press: New York, NY, USA, 2012; Volume 862, pp. 75–87. [Google Scholar]
  42. Fulnecek, J.; Kovarik, A. How to interpret methylation sensitive amplified polymorphism (MSAP) profiles? BMC Genet. 2014, 15, 2. [Google Scholar] [CrossRef] [PubMed]
  43. Walder, R.Y.; Langtimm, C.J.; Chatterjee, R.; Walder, J.A. Cloning of the MspI modification enzyme. The site of modification and its effects on cleavage by MspI and HpaII. J. Biol. Chem. 1983, 258, 1235–1241. [Google Scholar] [PubMed]
  44. Xia, Z.; Zou, M.; Zhang, S.; Feng, B.; Wang, W. AFSM sequencing approach: A simple and rapid method for genome-wide SNP and methylation site discovery and genetic mapping. Sci. Rep. 2014, 4, 7300. [Google Scholar] [CrossRef] [PubMed]
  45. Kitimu, S.R.; Taylor, J.; March, T.J.; Tairo, F.; Wilkinson, M.J.; Rodriguez Lopez, C.M. Meristem micropropagation of cassava (Manihot esculenta) evokes genome-wide changes in DNA methylation. Front. Plant Sci. 2015, 6, 1–12. [Google Scholar] [CrossRef] [PubMed]
  46. Choi, C.-S.; Sano, H. Abiotic-stress induces demethylation and transcriptional activation of a gene encoding a glycerophosphodiesterase-like protein in tobacco plants. Mol. Genet. Genom. 2007, 277, 589–600. [Google Scholar] [CrossRef] [PubMed]
  47. Walia, H.; Wilson, C.; Zeng, L.; Ismail, A.M.; Condamine, P.; Close, T.J. Genome-wide transcriptional analysis of salinity stressed japonica and indica rice genotypes during panicle initiation stage. Plant Mol. Biol. 2007, 63, 609–623. [Google Scholar] [CrossRef] [PubMed]
  48. Tilbrook, J.; Schilling, R.K.; Berger, B.; Garcia, A.F.; Trittermann, C.; Coventry, S.; Rabie, H.; Brien, C.; Nguyen, M.; Tester, M.; Roy, S.J. Variation in shoot tolerance mechanisms not related to ion toxicity in barley. Funct. Plant Biol. 2017, 44, 1194–1206. [Google Scholar] [CrossRef] [Green Version]
  49. Soen, Y.; Knafo, M.; Elgart, M. A principle of organization which facilitates broad Lamarckian-like adaptations by improvisation. Biol. Direct 2015, 10, 1–17. [Google Scholar] [CrossRef] [PubMed]
  50. Shelden, M.C.; Roessner, U.; Sharp, R.E.; Tester, M.; Bacic, A. Genetic variation in the root growth response of barley genotypes to salinity stress. Funct. Plant Biol. 2013, 40, 516–530. [Google Scholar] [CrossRef]
  51. Genc, Y.; McDonald, G.K.; Tester, M. Reassessment of tissue Na+ concentration as a criterion for salinity tolerance in bread wheat. Plant Cell Environ. 2007, 30, 1486–1498. [Google Scholar] [CrossRef] [PubMed]
  52. Baraket, M.; Sahli, A.; Amara, H.; Nasr, H.; Selmi, H.; Trifa, Y. Introduction and evaluation of salt-tolerant barley genotypes. Ann. Biol. Res. 2014, 5, 64–69. [Google Scholar]
  53. Zhu, M.; Zhou, M.; Shabala, L.; Shabala, S. Linking osmotic adjustment and stomatal characteristics with salinity stress tolerance in contrasting barley accessions. Funct. Plant Biol. 2015, 42, 252–263. [Google Scholar] [CrossRef]
  54. Boyko, A.; Golubov, A.; Bilichak, A.; Kovalchuk, I. Chlorine ions but not sodium ions alter genome stability of Arabidopsis thaliana. Plant Cell Physiol. 2010, 51, 1066–1078. [Google Scholar] [CrossRef] [PubMed]
  55. Genc, Y.; Oldach, K.; Taylor, J.; Lyons, G.H. Uncoupling of sodium and chloride to assist breeding for salinity tolerance in crops. New Phytol. 2016, 210, 145–156. [Google Scholar] [CrossRef] [PubMed]
  56. Zhu, H.; Ding, G.H.; Fang, K.; Zhao, F.G.; Qin, P. New perspectives on the mechanism of alleviating salt stress by spermidine in barley seedlings. Plant Growth Regul. 2006, 49, 147–156. [Google Scholar] [CrossRef]
  57. Gao, X.; Cao, D.; Liu, J.; Wang, X.; Geng, S.; Liu, B.; Shi, D. Tissue-specific and cation/anion-specific DNA methylation variations occurred in C. virgata in response to salinity stress. PLoS ONE 2013, 8, e78426. [Google Scholar] [CrossRef] [PubMed]
  58. Ferreira, L.J.; Azevedo, V.; Maroco, J.; Margarida Oliveira, M.; Santos, A.P. Salt tolerant and sensitive rice varieties display differential methylome flexibility under salt stress. PLoS ONE 2015, 10, e0124060. [Google Scholar] [CrossRef] [PubMed]
  59. Wang, W.; Huang, F.; Qin, Q.; Zhao, X.; Li, Z.; Fu, B. Comparative analysis of DNA methylation changes in two rice genotypes under salt stress and subsequent recovery. Biochem. Biophys. Res. Commun. 2015, 465, 790–796. [Google Scholar] [CrossRef] [PubMed] [Green Version]
  60. Demirkiran, A.; Marakli, S.; Temel, A.; Gozukirmizi, N. Genetic and epigenetic effects of salinity on in vitro growth of barley. Genet. Mol. Biol. 2013, 36, 566–570. [Google Scholar] [CrossRef] [PubMed] [Green Version]
  61. Munns, R.; Gilliham, M. Salinity tolerance of crops—What is the cost? New Phytol. 2015, 208, 668–673. [Google Scholar] [CrossRef] [PubMed]
  62. Tavakkoli, E.; Fatehi, F.; Coventry, S.; Rengasamy, P.; McDonald, G.K. Additive effects of Na(+) and Cl(−) ions on barley growth under salinity stress. J. Exp. Bot. 2011, 62, 2189–2203. [Google Scholar] [CrossRef] [PubMed] [Green Version]
  63. Liu, J.; Feng, L.; Li, J.; He, Z. Genetic and epigenetic control of plant heat responses. Front. Plant Sci. 2015, 6, 267. [Google Scholar] [CrossRef] [PubMed]
  64. Amoah, S.; Kurup, S.; Rodriguez Lopez, C.; Welham, S.; Powers, S.; Hopkins, C.; Wilkinson, M.; King, G. A hypomethylated population of Brassica rapa for forward and reverse Epi-genetics. BMC Plant Biol. 2012, 12, 193. [Google Scholar] [CrossRef] [PubMed]
  65. Lopez-Maury, L.; Marguerat, S.; Bahler, J. Tuning gene expression to changing environments: From rapid responses to evolutionary adaptation. Nat. Rev. Genet. 2008, 9, 583–593. [Google Scholar] [CrossRef] [PubMed]
  66. Xia, H.; Huang, W.; Xiong, J.; Yan, S.; Tao, T.; Li, J.; Wu, J.; Luo, L. Differentially methylated epiloci generated from numerous genotypes of contrasting tolerances are associated with osmotic-tolerance in rice seedlings. Front. Plant Sci. 2017, 8, 11. [Google Scholar] [CrossRef] [PubMed]
  67. Greaves, I.K.; Groszmann, M.; Ying, H.; Taylor, J.M.; Peacock, W.J.; Dennis, E.S. Trans chromosomal methylation in Arabidopsis hybrids. Proc. Natl. Acad. Sci. USA 2012, 109, 3570–3575. [Google Scholar] [CrossRef] [PubMed]
  68. Bewick, A.J.; Ji, L.; Niederhuth, C.E.; Willing, E.-M.; Hofmeister, B.T.; Shi, X.; Wang, L.; Lu, Z.; Rohr, N.A.; Hartwig, B.; et al. On the origin and evolutionary consequences of gene body DNA methylation. Proc. Natl. Acad. Sci. USA 2016, 113, 9111–9116. [Google Scholar] [CrossRef] [PubMed]
  69. Zhang, X.; Yazaki, J.; Sundaresan, A.; Cokus, S.; Chan, S.W.L.; Chen, H.; Henderson, I.R.; Shinn, P.; Pellegrini, M.; Jacobsen, S.E.; et al. Genome-wide high-resolution mapping and functional analysis of DNA methylation in Arabidopsis. Cell 2006, 126, 1189–1201. [Google Scholar] [CrossRef] [PubMed]
  70. Tomek, W.; Wollenhaupt, K. The “closed loop model” in controlling mRNA translation during development. Anim. Reprod. Sci. 2012, 134, 2–8. [Google Scholar] [CrossRef] [PubMed]
  71. Archer, S.K.; Shirokikh, N.E.; Hallwirth, C.V.; Beilharz, T.H.; Preiss, T. Probing the closed-loop model of mRNA translation in living cells. RNA Biol. 2015, 12, 248–254. [Google Scholar] [CrossRef] [PubMed] [Green Version]
  72. Bicknell, A.A.; Cenik, C.; Chua, H.N.; Roth, F.P.; Moore, M.J. Introns in UTRs: Why we should stop ignoring them. Bioessays 2012, 34, 1025–1034. [Google Scholar] [CrossRef] [PubMed] [Green Version]
  73. Illingworth, R.; Kerr, A.; DeSousa, D.; Jørgensen, H.; Ellis, P.; Stalker, J.; Jackson, D.; Clee, C.; Plumb, R.; Rogers, J.; et al. A novel CpG island set identifies tissue-specific methylation at developmental gene loci. PLoS Biol. 2008, 6, e22. [Google Scholar] [CrossRef] [PubMed]
  74. Deaton, A.M.; Bird, A. CpG islands and the regulation of transcription. Genes Dev. 2011, 25, 1010–1022. [Google Scholar] [CrossRef] [PubMed] [Green Version]
  75. Cokus, S.J.; Feng, S.; Zhang, X.; Chen, Z.; Merriman, B.; Haudenschild, C.D.; Pradhan, S.; Nelson, S.F.; Pellegrini, M.; Jacobsen, S.E. Shotgun bisulphite sequencing of the Arabidopsis genome reveals DNA methylation patterning. Nature 2008, 452, 215–219. [Google Scholar] [CrossRef] [PubMed]
  76. Xie, H.; Konate, M.; Sai, N.; Tesfamicael, K.G.; Cavagnaro, T.; Gilliham, M.; Breen, J.; Metcalfe, A.; Stephen, J.; DeBei, R.; et al. Global DNA Methylation Patterns Can Play a Role in Defining Terroir in Grapevine (Vitis vinifera cv. Shiraz). Front. Plant Sci. 2017, 8, 1860. [Google Scholar] [CrossRef] [PubMed]
  77. Zhang, M.; Xu, C.; von Wettstein, D.; Liu, B. Tissue-specific differences in cytosine methylation and their association with differential gene expression in sorghum. Plant Physiol. 2011, 156, 1955–1966. [Google Scholar] [CrossRef] [PubMed]
  78. Tuorto, F.; Liebers, R.; Musch, T.; Schaefer, M.; Hofmann, S.; Kellner, S.; Frye, M.; Helm, M.; Stoecklin, G.; Lyko, F. RNA cytosine methylation by Dnmt2 and NSun2 promotes tRNA stability and protein synthesis. Nat. Struct. Mol. Biol. 2012, 19, 900–905. [Google Scholar] [CrossRef] [PubMed]
  79. Besser, D.; Götz, F.; Schulze-Forster, K.; Wagner, H.; Kröger, H.; Simon, D. DNA methylation inhibits transcription by RNA polymerase III of a tRNA gene, but not of a 5S rRNA gene. FEBS Lett. 1990, 269, 358–362. [Google Scholar] [CrossRef] [Green Version]
  80. Hori, H. Methylated nucleosides in tRNA and tRNA methyltransferases. Front. Genet. 2014, 5, 144. [Google Scholar] [CrossRef] [PubMed]
  81. Munns, R.; James, R.A.; Xu, B.; Athman, A.; Conn, S.J.; Jordans, C.; Byrt, C.S.; Hare, R.A.; Tyerman, S.D.; Tester, M.; et al. Wheat grain yield on saline soils is improved by an ancestral Na+ transporter gene. Nat. Biotechnol. 2012, 30, 360–364. [Google Scholar] [CrossRef] [PubMed]
  82. Mian, A.; Oomen, R.J.F.J.; Isayenkov, S.; Sentenac, H.; Maathuis, F.J.M.; Véry, A.-A. Over-expression of an Na+- and K+-permeable HKT transporter in barley improves salt tolerance. Plant J. 2011, 68, 468–479. [Google Scholar] [CrossRef] [PubMed]
  83. Byrt, C.S.; Xu, B.; Krishnan, M.; Lightfoot, D.J.; Athman, A.; Jacobs, A.K.; Watson-Haigh, N.S.; Plett, D.; Munns, R.; Tester, M.; et al. The Na+ transporter, TaHKT1; 5-D, limits shoot Na+ accumulation in bread wheat. Plant J. 2014, 80, 516–526. [Google Scholar] [CrossRef] [PubMed]
  84. Drøbak, B.K.; Watkins, P.A.C. Inositol(1,4,5)trisphosphate production in plant cells: An early response to salinity and hyperosmotic stress. Fed. Eur. Biochem. Soc. Lett. 2000, 481, 240–244. [Google Scholar] [CrossRef]
  85. Raychaudhuri, A.; Majumder, A.L. Salinity-induced enhancement of L-myo-inositol 1-phosphate synthase in rice (Oryza sativa L.). Plant Cell Environ. 1996, 19, 1437–1442. [Google Scholar] [CrossRef]
  86. Grattan, S.R.; Maas, E.V. Effect of salinity on phosphate accumulation and injury in soybean. Plant Soil 1988, 109, 65–71. [Google Scholar] [CrossRef]
  87. Aslam, M.; Flowers, T.J.; Qureshi, R.H.; Yeo, A.R. Interaction of Phosphate and Salinity on the Growth and Yield of Rice (Oryza sativa L.). J. Agron. Crop Sci. 1996, 176, 249–258. [Google Scholar] [CrossRef]
  88. Kawakatsu, T.; Stuart, T.; Valdes, M.; Breakfield, N.; Schmitz, R.J.; Nery, J.R.; Urich, M.A.; Han, X.; Lister, R.; Benfey, P.N.; et al. Unique cell-type specific patterns of DNA methylation in the root meristem. Nat. Plants 2016, 2, 16058. [Google Scholar] [CrossRef] [PubMed]
  89. Chatterjee, J.; Majumder, A.L. Salt-induced abnormalities on root tip mitotic cells of Allium cepa: Prevention by inositol pretreatment. Protoplasma 2010, 245, 165–172. [Google Scholar] [CrossRef] [PubMed]
  90. Katsuhara, M.; Kawasaki, T. Salt stress induced nuclear and DNA degradation in meristematic cells of barley roots. Plant Cell Physiol. 1996, 37, 169–173. [Google Scholar] [CrossRef]
  91. Berger, B.; Regt, B.; Tester, M. Trait dissection of salinity tolerance with plant phenomics. In Plant Salt Tolerance; Shabala, S., Cuin, T.A., Eds.; Humana Press: New York, NY, USA, 2012; Volume 913, pp. 399–413. [Google Scholar]
  92. Elshire, R.J.; Glaubitz, J.C.; Sun, Q.; Poland, J.A.; Kawamoto, K.; Buckler, E.S.; Mitchell, S.E. A robust, simple Genotyping-by-Sequencing (GBS) approach for high diversity species. PLoS ONE 2011, 6, e19379. [Google Scholar] [CrossRef] [PubMed]
  93. Poland, J.; Endelman, J.; Dawson, J.; Rutkoski, J.; Wu, S.; Manes, Y.; Dreisigacker, S.; Crossa, J.; Sánchez-Villeda, H.; Sorrells, M.; et al. Genomic selection in wheat breeding using Genotyping-by-Sequencing. Plant Genome 2012, 5, 103–113. [Google Scholar] [CrossRef]
  94. Mayne, B.T.; Leemaqz, S.Y.; Buckberry, S.; Rodriguez Lopez, C.M.; Roberts, C.T.; Bianco-Miotto, T.; Breen, J. msgbsR: An R package for analysing methylation-sensitive restriction enzyme sequencing data. Sci. Rep. 2018, 8, 2190. [Google Scholar] [CrossRef] [PubMed] [Green Version]
  95. Eichten, S.R.; Vaughn, M.W.; Hermanson, P.J.; Springer, N.M. Variation in DNA methylation patterns is more common among maize inbreds than among tissues. Plant Genome 2013, 6, 1–10. [Google Scholar] [CrossRef]
  96. Quinlan, A.R.; Hall, I.M. BEDTools: A flexible suite of utilities for comparing genomic features. Bioinformatics 2010, 26, 841–842. [Google Scholar] [CrossRef] [PubMed]
  97. Carlson, M. GO.db: A Set of Annotation Maps Describing the Entire Gene Ontology. R Package Version 3.4.0. Available online: http://bioconductor.org/packages/release/data/annotation/html/GO.db.html (accessed on 4 March 2017).
  98. Gentleman, R. Annotate: Annotation for Microarrays. R Package Version 1.52.0. Available online: https://www.bioconductor.org/packages/release/bioc/html/annotate.html (accessed on 4 March 2017).
  99. Dunn, O.J. Multiple comparisons among means. J. Am. Stat. Assoc. 1961, 56, 52–64. [Google Scholar] [CrossRef]
  100. Supek, F.; Bošnjak, M.; Škunca, N.; Šmuc, T. REVIGO summarizes and visualizes long lists of gene ontology terms. PLoS ONE 2011, 6, e21800. [Google Scholar] [CrossRef] [PubMed]
  101. Schubert, M.; Lindgreen, S.; Orlando, L. AdapterRemoval v2: Rapid adapter trimming, identification, and read merging. BMC Res. Notes 2016, 9, 88. [Google Scholar] [CrossRef] [PubMed]
  102. Kim, D.; Langmead, B.; Salzberg, S.L. HISAT: A fast spliced aligner with low memory requirements. Nat. Meth. 2015, 12, 357–360. [Google Scholar] [CrossRef] [PubMed]
  103. Pertea, M.; Pertea, G.M.; Antonescu, C.M.; Chang, T.C.; Mendell, J.T.; Salzberg, S.L. StringTie enables improved reconstruction of a transcriptome from RNA-seq reads. Nat. Biotechnol. 2015, 33, 290–295. [Google Scholar] [CrossRef] [PubMed] [Green Version]
  104. Liao, Y.; Smyth, G.K.; Shi, W. FeatureCounts: An efficient general purpose program for assigning sequence reads to genomic features. Bioinformatics 2014, 30, 923–930. [Google Scholar] [CrossRef] [PubMed]
  105. Law, C.W.; Alhamdoosh, M.; Su, S.; Smyth, G.K.; Ritchie, M.E. RNA-seq analysis is easy as 1-2-3 with limma, Glimma and edgeR. F1000Research 2016, 5, 1408. [Google Scholar] [CrossRef] [PubMed] [Green Version]
Figure 1. Number of salt-induced differentially methylated markers (DMMs) in barley leaves and roots. Samples from barley plants exposed to 75, 150 and 200 mM NaCl were compared with salt-free control plant samples. The red and blue sections in the bar chart represent the proportions of salt-induced hypermethylated (red) and hypomethylated (blue) DMMs. DMMs were identified by comparing 25 samples per treatment, each composed of five replicates of five barley varieties (Barque 73, Flagship, Hindmarsh, Schooner and Yarra).
Epigenomes 02 00012 g001
Figure 2. Organ-specific response intensity and directionality of salt-induced DNA methylation changes. (a) Distribution of salt-induced epigenetic markers in the barley genome. Each point represents the genomic location (horizontal axis) of a marker and its associated negative log10 p-value (vertical axis), for the three salt treatments (75, 150 and 200 mM NaCl) in the leaf and root samples compared with the controls in each respective organ. The red line represents the genome-wide threshold (p = 0.000000050) and the blue line indicates the suggestive threshold (p = 0.00001). (b,c) The directionality of the methylation in salt-induced DNA methylation markers. The boxplots show the distribution of the intensity of changes in DNA methylation levels, represented here as the fold-change (2 power log2FC) in read counts between samples exposed to 75, 150 and 200 mM NaCl compared with those grown in the control conditions, in leaves and roots. (c) The enlarged area shows the direction of the methylation flux at a whole genome level in each organ/salt treatment combination (i.e., positive medians indicate global decreases in DNA methylation (hypomethylation) while negative medians indicate global increases in DNA methylation induced by salinity stress). The methylation changes were obtained from ms-GBS sequencing data in which 25 samples per salt treatment were compared with 25 control samples, and each treatment was composed of five replicates of five barley varieties (Barque 73, Flagship, Hindmarsh, Schooner and Yarra).
Epigenomes 02 00012 g002
Figure 3. Venn diagram showing the number of differentially methylated markers (DMMs) induced by different salt concentrations in barley leaves and roots. DMMs in leaves (a) and roots (b) were obtained from barley plants exposed to 75, 150 and 200 mM NaCl, compared with a non-saline control. DMMs (FDR < 0.01) were identified by comparing 25 samples per treatment, each composed of five replicates of five barley varieties. FDR, false discovery rate.
Epigenomes 02 00012 g003
Figure 4. Hierarchical clustering of the fold changes in read counts of DMMs stable across all salt concentrations (75, 150 and 200 mM NaCl) compared to control plants. Hypermethylated (red) and hypomethylated (blue) DMMs (a) in leaves (5593 DMMs); (b) roots (528 DMMs); and (c) shared by both leaf and root tissues (22 DMMs). The colour legend represents the fold-change (2 power log2FC) in read counts between samples exposed to 75, 150 and 200 mM NaCl compared with those grown in control conditions. DMMs (FDR < 0.01) were identified by comparing 25 samples per treatment, each composed of five replicates of five barley varieties (Barque 73, Flagship, Hindmarsh, Schooner, and Yarra).
Epigenomes 02 00012 g004
Figure 5. Distribution of salt-induced differentially methylated markers (DMMs) around repeat regions and genes. (a,b) Distribution of the distance of DMMs from the closest repeat in leaves and roots, respectively; (c,d) Distribution of the distance of DMMs from the closest gene in leaves and roots, respectively; (e,f) Distribution of the distance of genes from the closest differentially methylated (DM) repeats in leaves and roots, respectively. The distance of each DMM was calculated from the genomic feature, and DMMs were counted within repeats and genes, and five consecutive 1 Kb wide bins upstream and downstream. Concentration-independent, salt-induced DMMs were used to show the DMM distribution pattern around gene bodies (body) and repeat regions (RR).
Epigenomes 02 00012 g005
Figure 6. Distribution of salt-induced differentially methylated markers (DMMs) around UTRs, exons and tRNA genes. (a,b) 5′UTRs and 3′UTRs in leaves; (c,d) 5′UTRs and 3`UTRs in roots; (e) exons in leaves; (f) exons in roots; (g) tRNA genes in leaves; (h) tRNA genes in roots. The distance of each DMM was calculated from the genomic feature (respectively, 5′UTR 3′UTR, exons and tRNA genes), and the number of DMMs was counted within these genomic features, and in five consecutive 1 Kb wide bins upstream and downstream (Kb, kilo base. Concentration-independent salt-induced DMMs were used to show the DMM distribution patterns around genomic features.
Epigenomes 02 00012 g006
Figure 7. Summary treemaps of GO (gene ontology) term representatives for the category “biological process” obtained from salt-induced, differentially methylated genes in barley leaves. (a) Representatives of GO terms enriched by hypomethylated genes in leaves. Numbers represent GO term representatives with very small font size: 1 = organelle organization; 2 = vegetative to reproductive phase transition of meristem; 3 = generation of precursor metabolites and energy; 4 = coenzyme metabolism; 5 = photosynthesis; and 6 = microtubule-based process; 7 = sulfur compound metabolism; 8 = mitotic cell cycle process; 9 = plant-type cell wall organization or biogenesis; 10 = organic hydroxy compound metabolism; (b) Representatives of GO terms enriched by hypermethylated genes in leaves: 7 = monovalent inorganic cation transport; 8 = macromolecular complex assembly. Treemaps were constructed using R scripts produced by the REVIGO server (Available online: http://revigo.irb.hr/). The detailed list of terms in the background of GO representatives is provided in the Supplemental Data Set S3.
Epigenomes 02 00012 g007
Figure 8. Summary treemaps of GO (gene ontology) term representatives for the category “biological process” obtained from salt-induced, differentially methylated genes in barley roots. (a) Representatives of GO terms enriched by hypomethylated genes in roots: 1 = carbohydrate derivative metabolism; (b) Representative GO terms enriched by hypermethylated genes in roots. Treemaps were constructed using R scripts produced by the REVIGO server (Available online: http://revigo.irb.hr/). The detailed list of terms in the background of GO representatives is provided in the Supplemental Data Set S3.
Epigenomes 02 00012 g008
Figure 9. Summary treemaps of GO (gene ontology) term representatives for the category “biological process” obtained from salt-induced, differentially expressed genes in barley roots. (a) Representatives of GO terms enriched by upregulated genes in roots: 1 = monovalent inorganic cation transport; (b) Representatives of GO terms enriched by downregulated genes in roots: 2 = generation of precursor metabolites and energy. Treemaps were constructed using R scripts produced by the REVIGO server (Available online: http://revigo.irb.hr/). The detailed list of terms in the background of GO representatives is provided in the Supplemental Data Set S4.
Epigenomes 02 00012 g009aEpigenomes 02 00012 g009b
Table 1. Data yields of the methylation-sensitive Genotyping-By-Sequencing (ms-GBS), generated using the Illumina HiSeq 2500 platform.
Sequencing ResultsYield
Raw reads1,015,703,602
Reads that matched barcodes1,004,318,258
Reads aligned to barley reference genome496,960,365
Samples200
Average reads per sample2,484,801
Total unique tags892,859
Polymorphic tags645,297
Table 2. Number of differentially methylated genes (DMGs) and associated GO terms in barley leaves and roots. GO, gene ontology; hypo, hypomethylated genes; hyper, hypermethylated genes. GO groups were determined using REVIGO (Available online: http://revigo.irb.hr/).
Methylation ChangeDMGsGO Terms per GO GroupTotal GO Terms
Biological ProcessCellular ComponentMolecular Function
Leaf hypo10173154073433
Leaf hyper5364211499
Root hypo151910029
Root hyper91311024
Table 3. Number of differentially expressed (DE) genes and associated GO terms in barley roots. GO, gene ontology; GO groups were determined using REVIGO (Available online: http://revigo.irb.hr/).
Expression ChangeDE GenesGO Terms per GO GroupTotal GO Terms
Total TranscriptsAnnotatedBiological ProcessCellular ComponentMolecular Function
Upregulated12476942229145
Downregulated34182312053
Table 4. List of differentially methylated DE genes in barley roots. DE, differentially expressed gene; DMM, differentially methylated markers, Chrom, chromosome; FDR, false discovery rate; dist2Gene, DMM position relative to gene.
DE GenesDMMsStatisticsAnnotation
Gene IDRangeChromPositionMethylationlogFCp-ValueFDRdist2Gene
MSTRG.42461:435681474–4357318451H435,689,351hyper−1.760.0000.0530-
MSTRG.315255:507135444–5073974515H507,332,872hypo−1.470.0020.0830MLOC_2917
MSTRG.432607:427906474–4279745817H427,925,930hyper−1.050.0060.0930MLOC_73155
MSTRG.432617:427906474–4279745817H427,948,871hypo−1.050.0060.0930MLOC_73155
MSTRG.105722:543673444–5436741172H543,678,039hypo−1.050.0060.0953922-
MSTRG.64852:17425326–176245692H17,517,122hypo1.390.0070.0950-
MSTRG.64182:15418194–154199142H15,414,469hypo1.530.0040.0893725MLOC_24124
MSTRG.106442:545135370–5451359582H545,131,372hyper3.430.0030.0863998MLOC_48766

