
Change in BMI and Fitness among Primary School Children in Austria: A 24-Month Follow-Up Study of 303 Children Measured before and during the Ongoing COVID-19 Pandemic


Abstract
:1. Introduction
2. Materials and Methods
2.1. Design
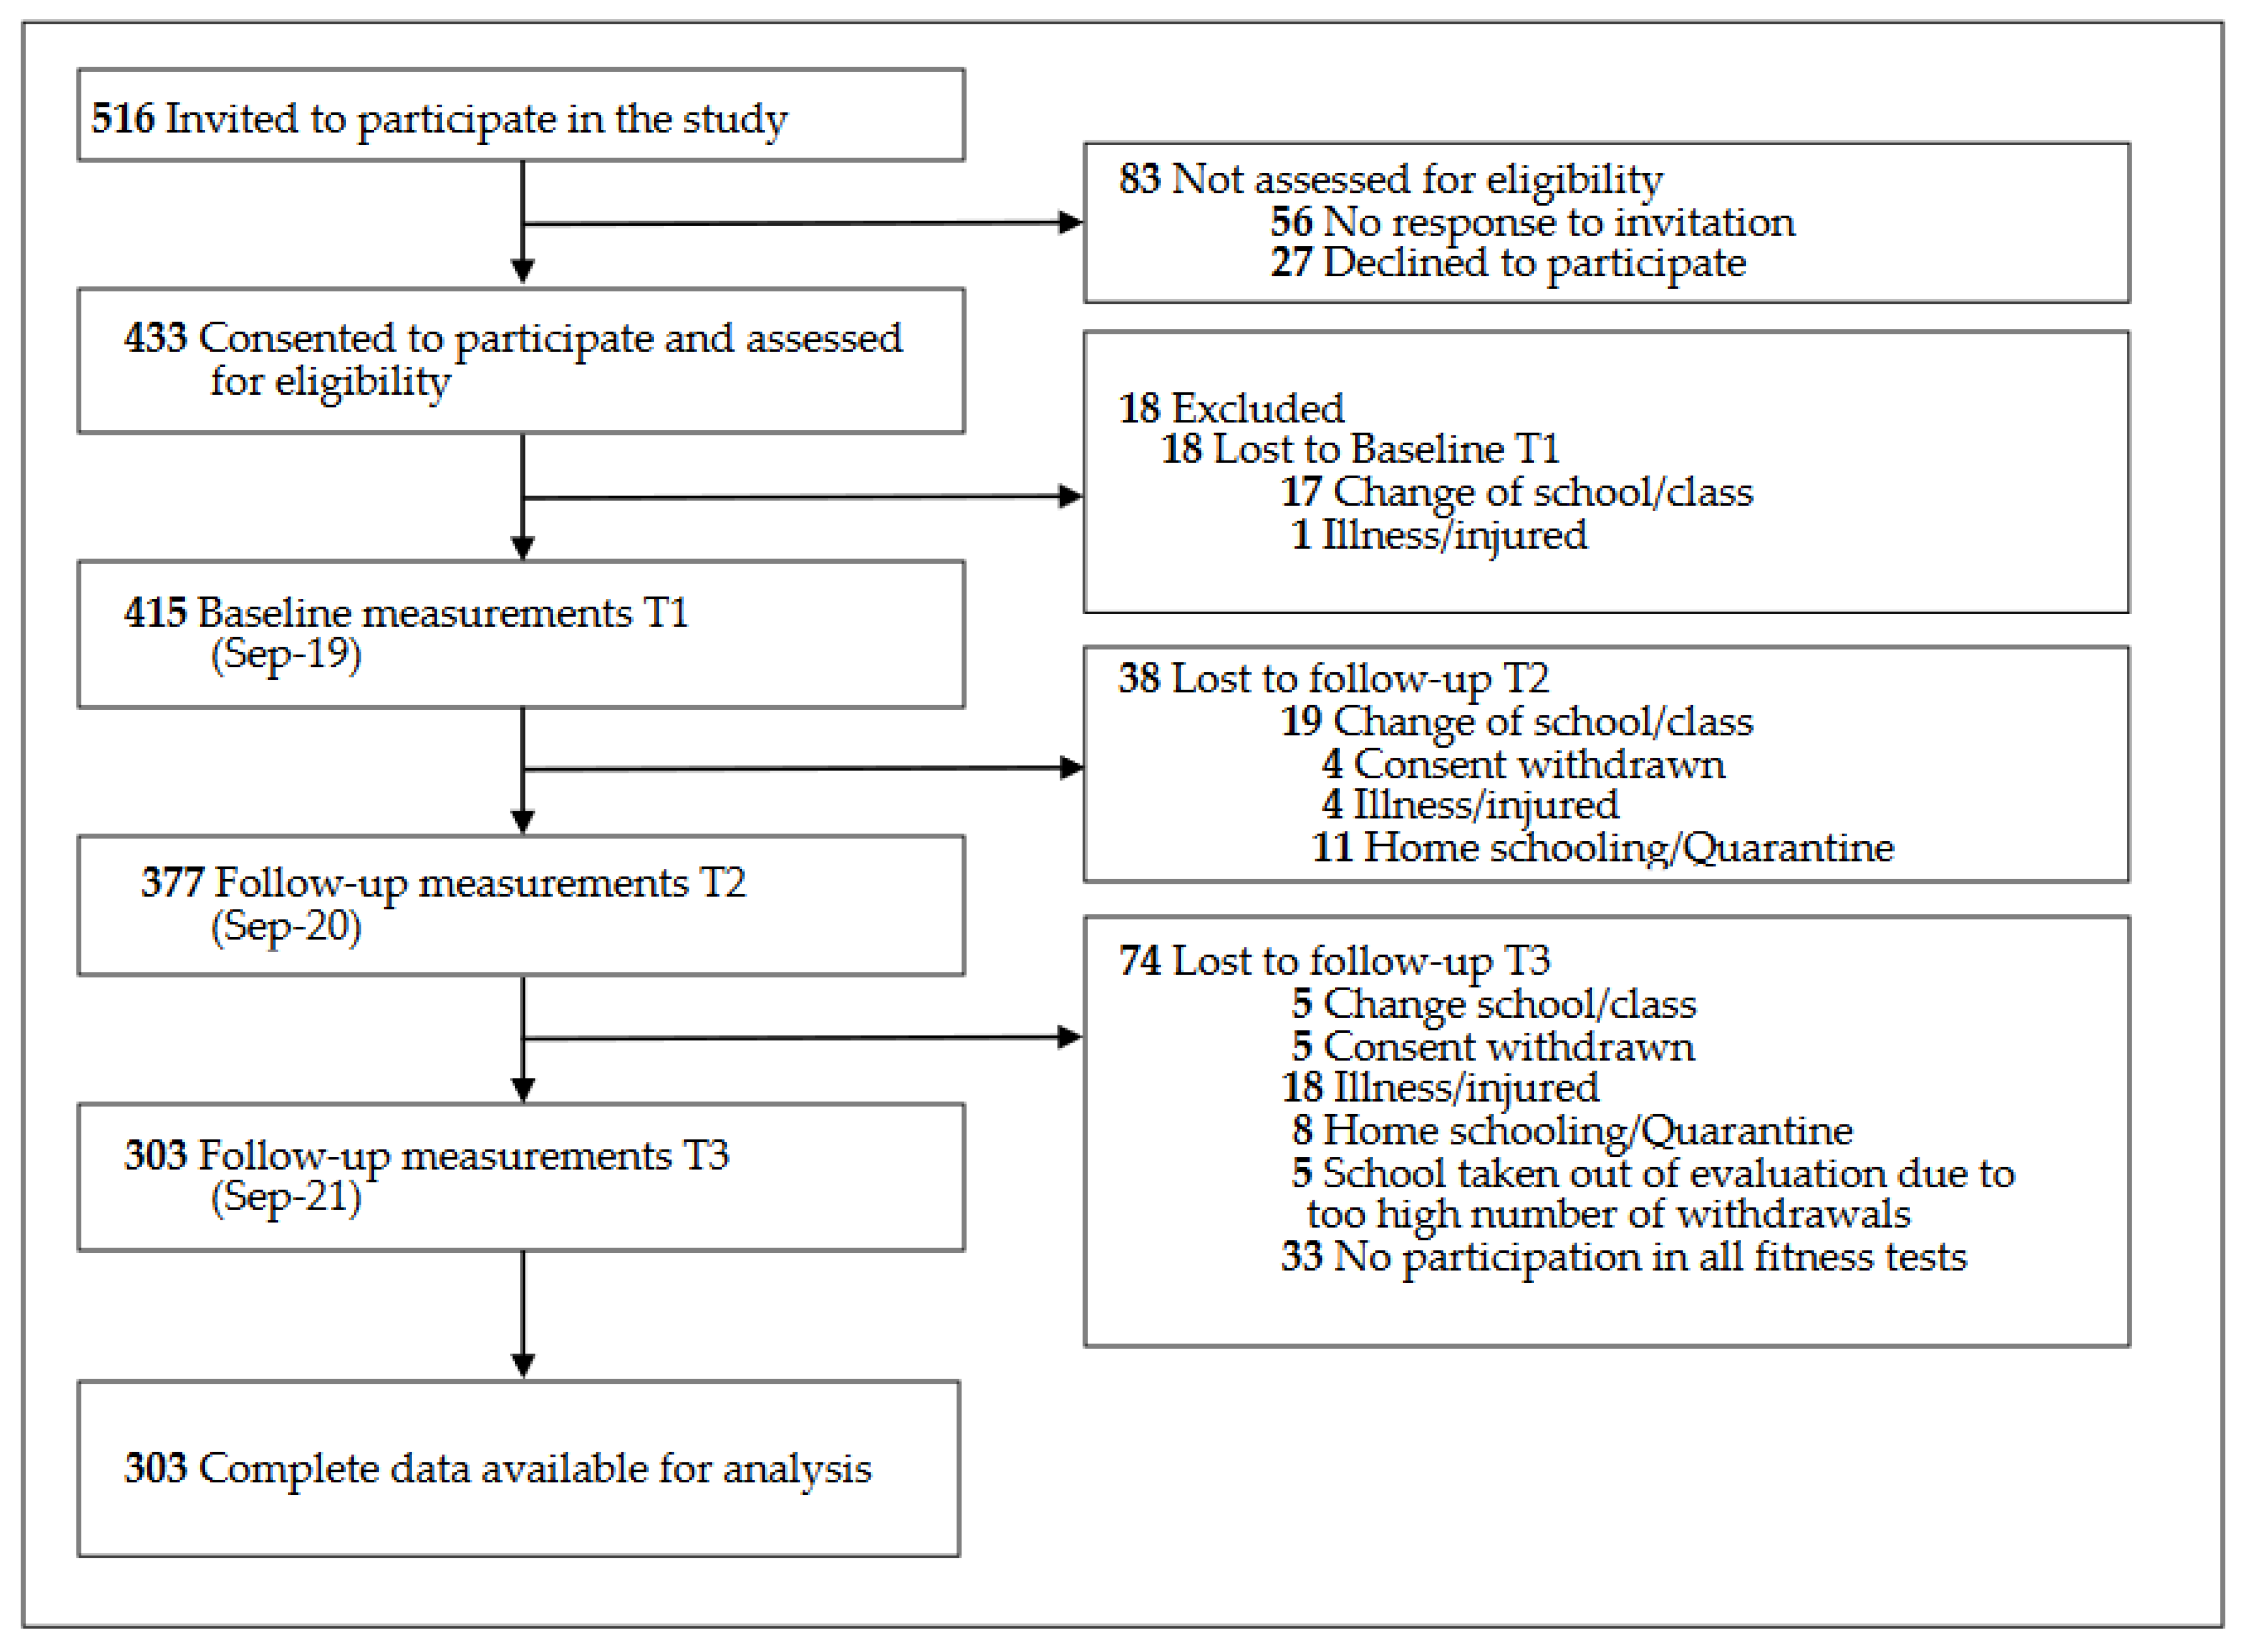
2.2. Selection of Schools and Participations
2.3. Procedures
2.4. Outcomes
2.4.1. Anthropometric Data
2.4.2. Physical Fitness
- -
- Cardiorespiratory Endurance
- -
- Strength (Legs and Arms)
- -
- Action Speed
- -
- Whole-Body Coordination
- -
- Flexibility
- -
- Reaction Speed
2.5. Standardization
2.5.1. Anthropometric Data
2.5.2. Physical Fitness
2.5.3. Changes over Time
3. Results
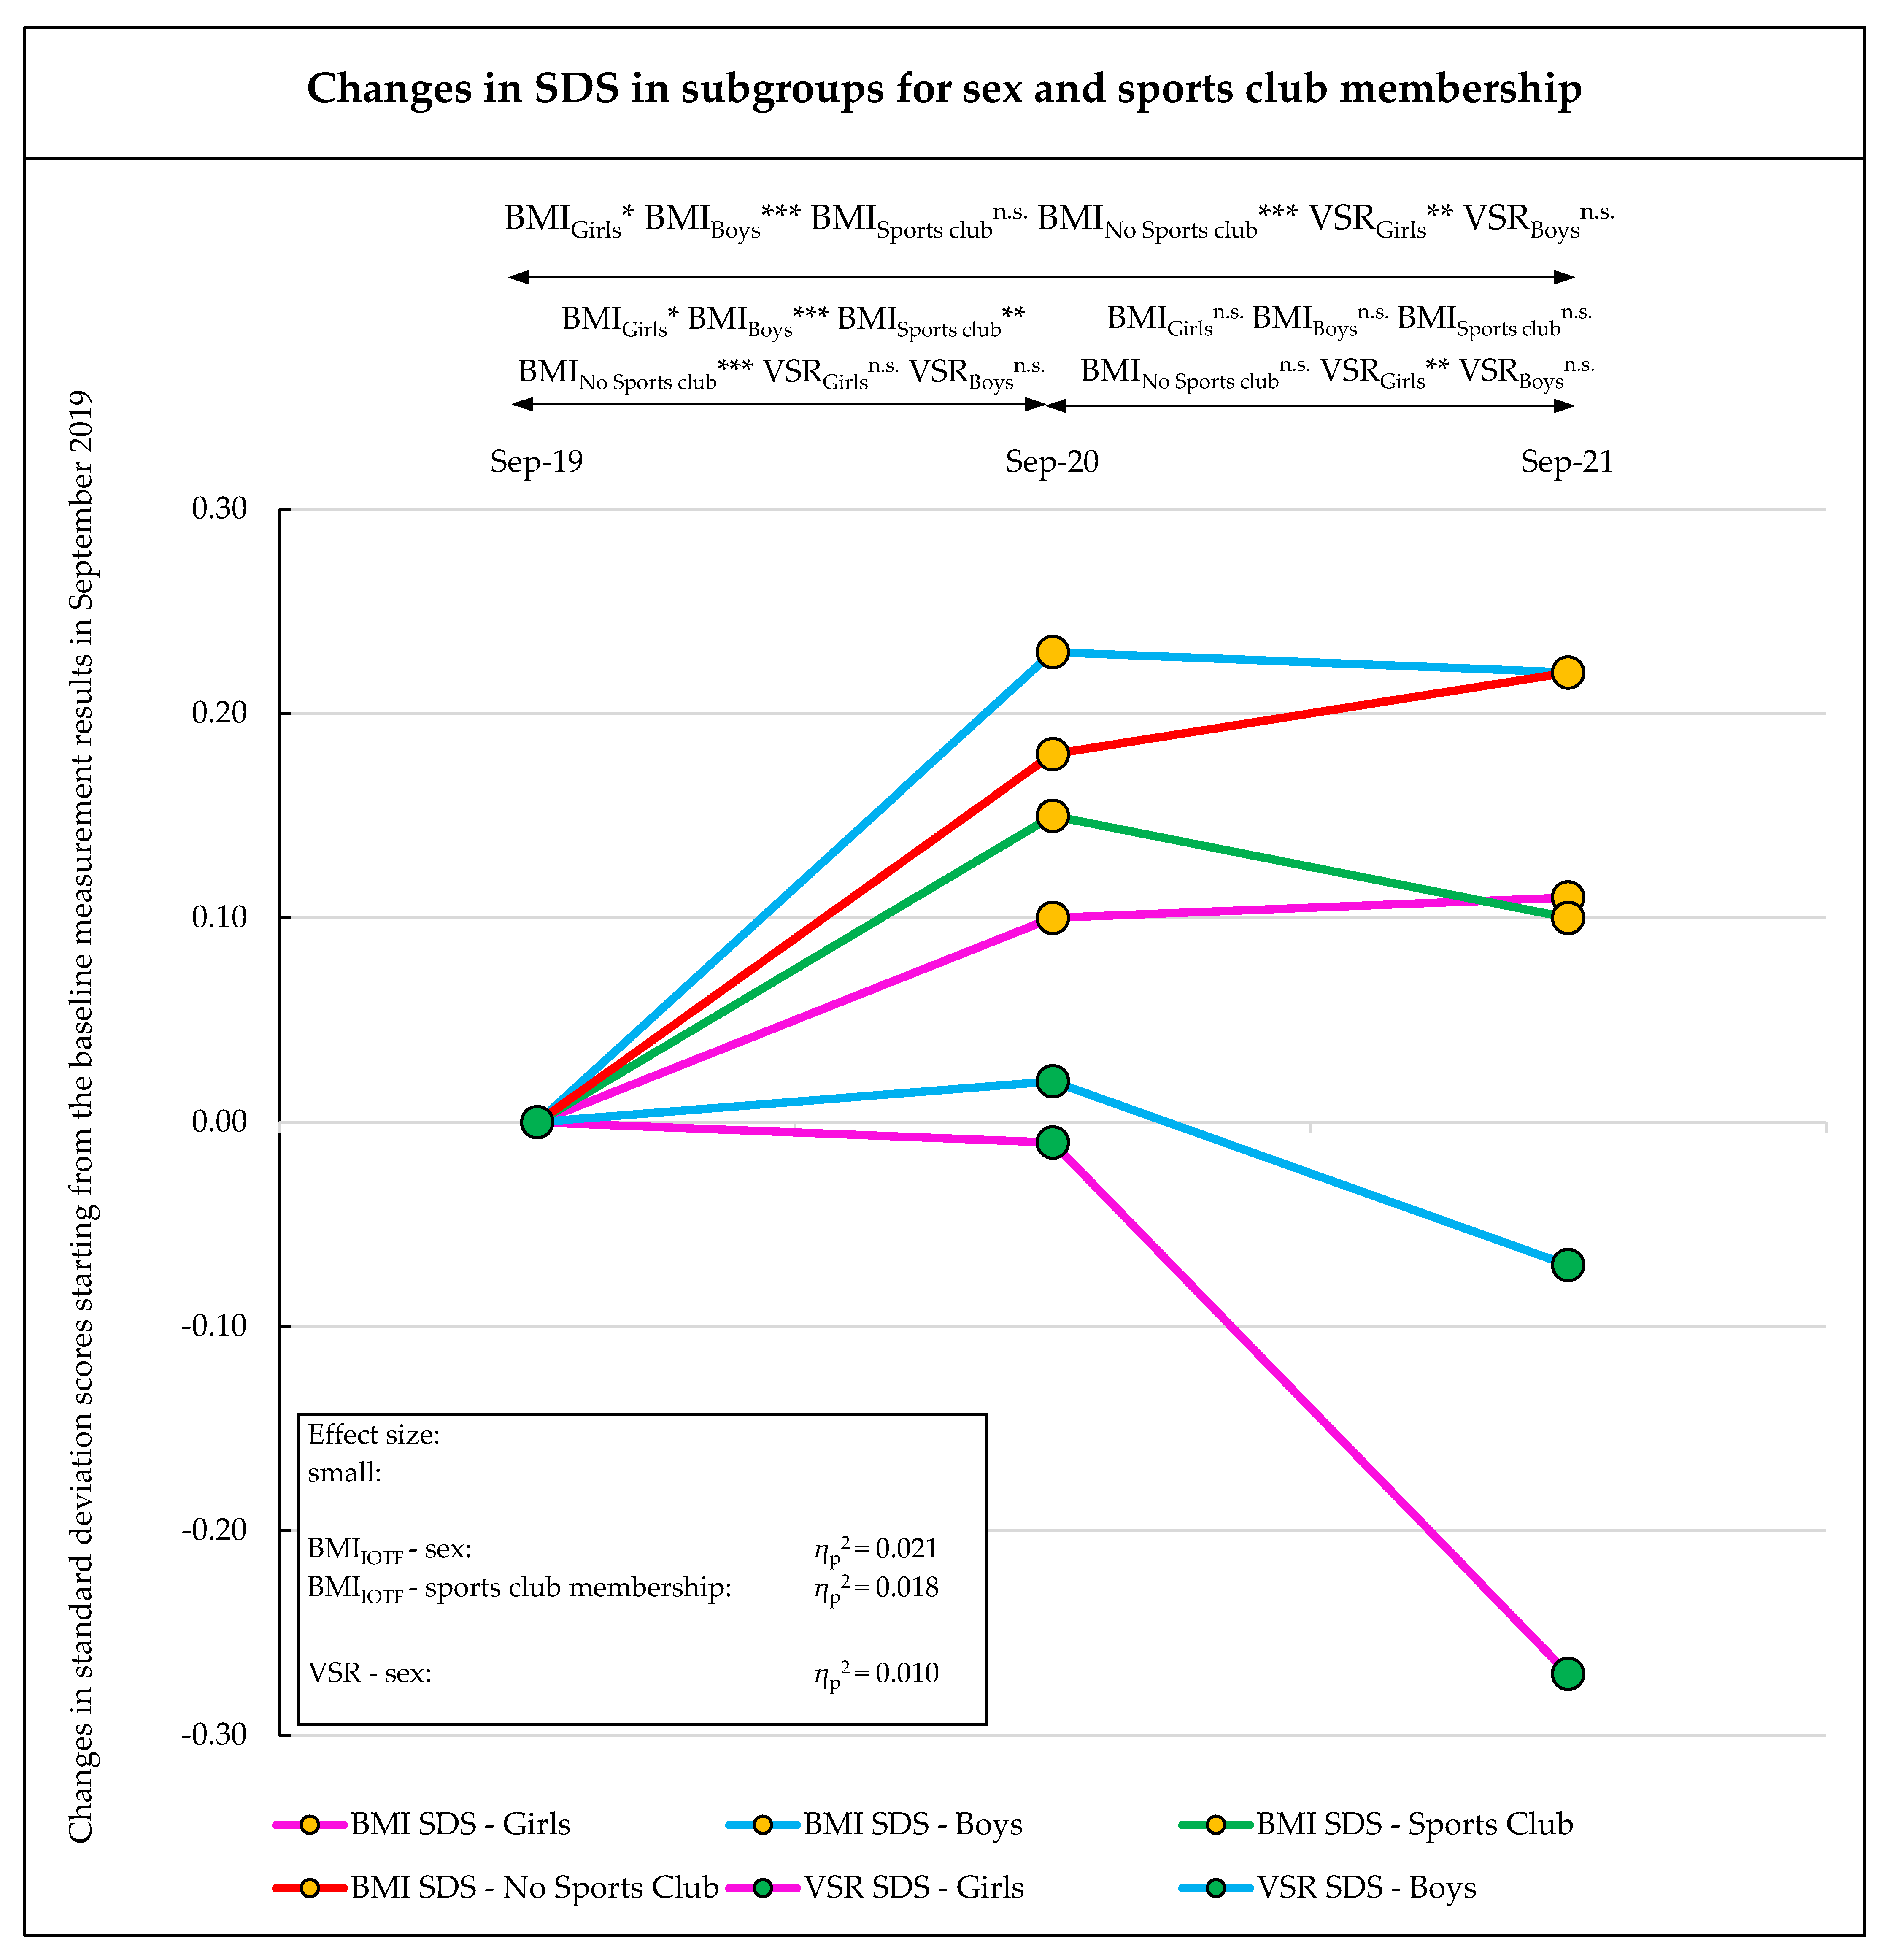
3.1. Change in BMI
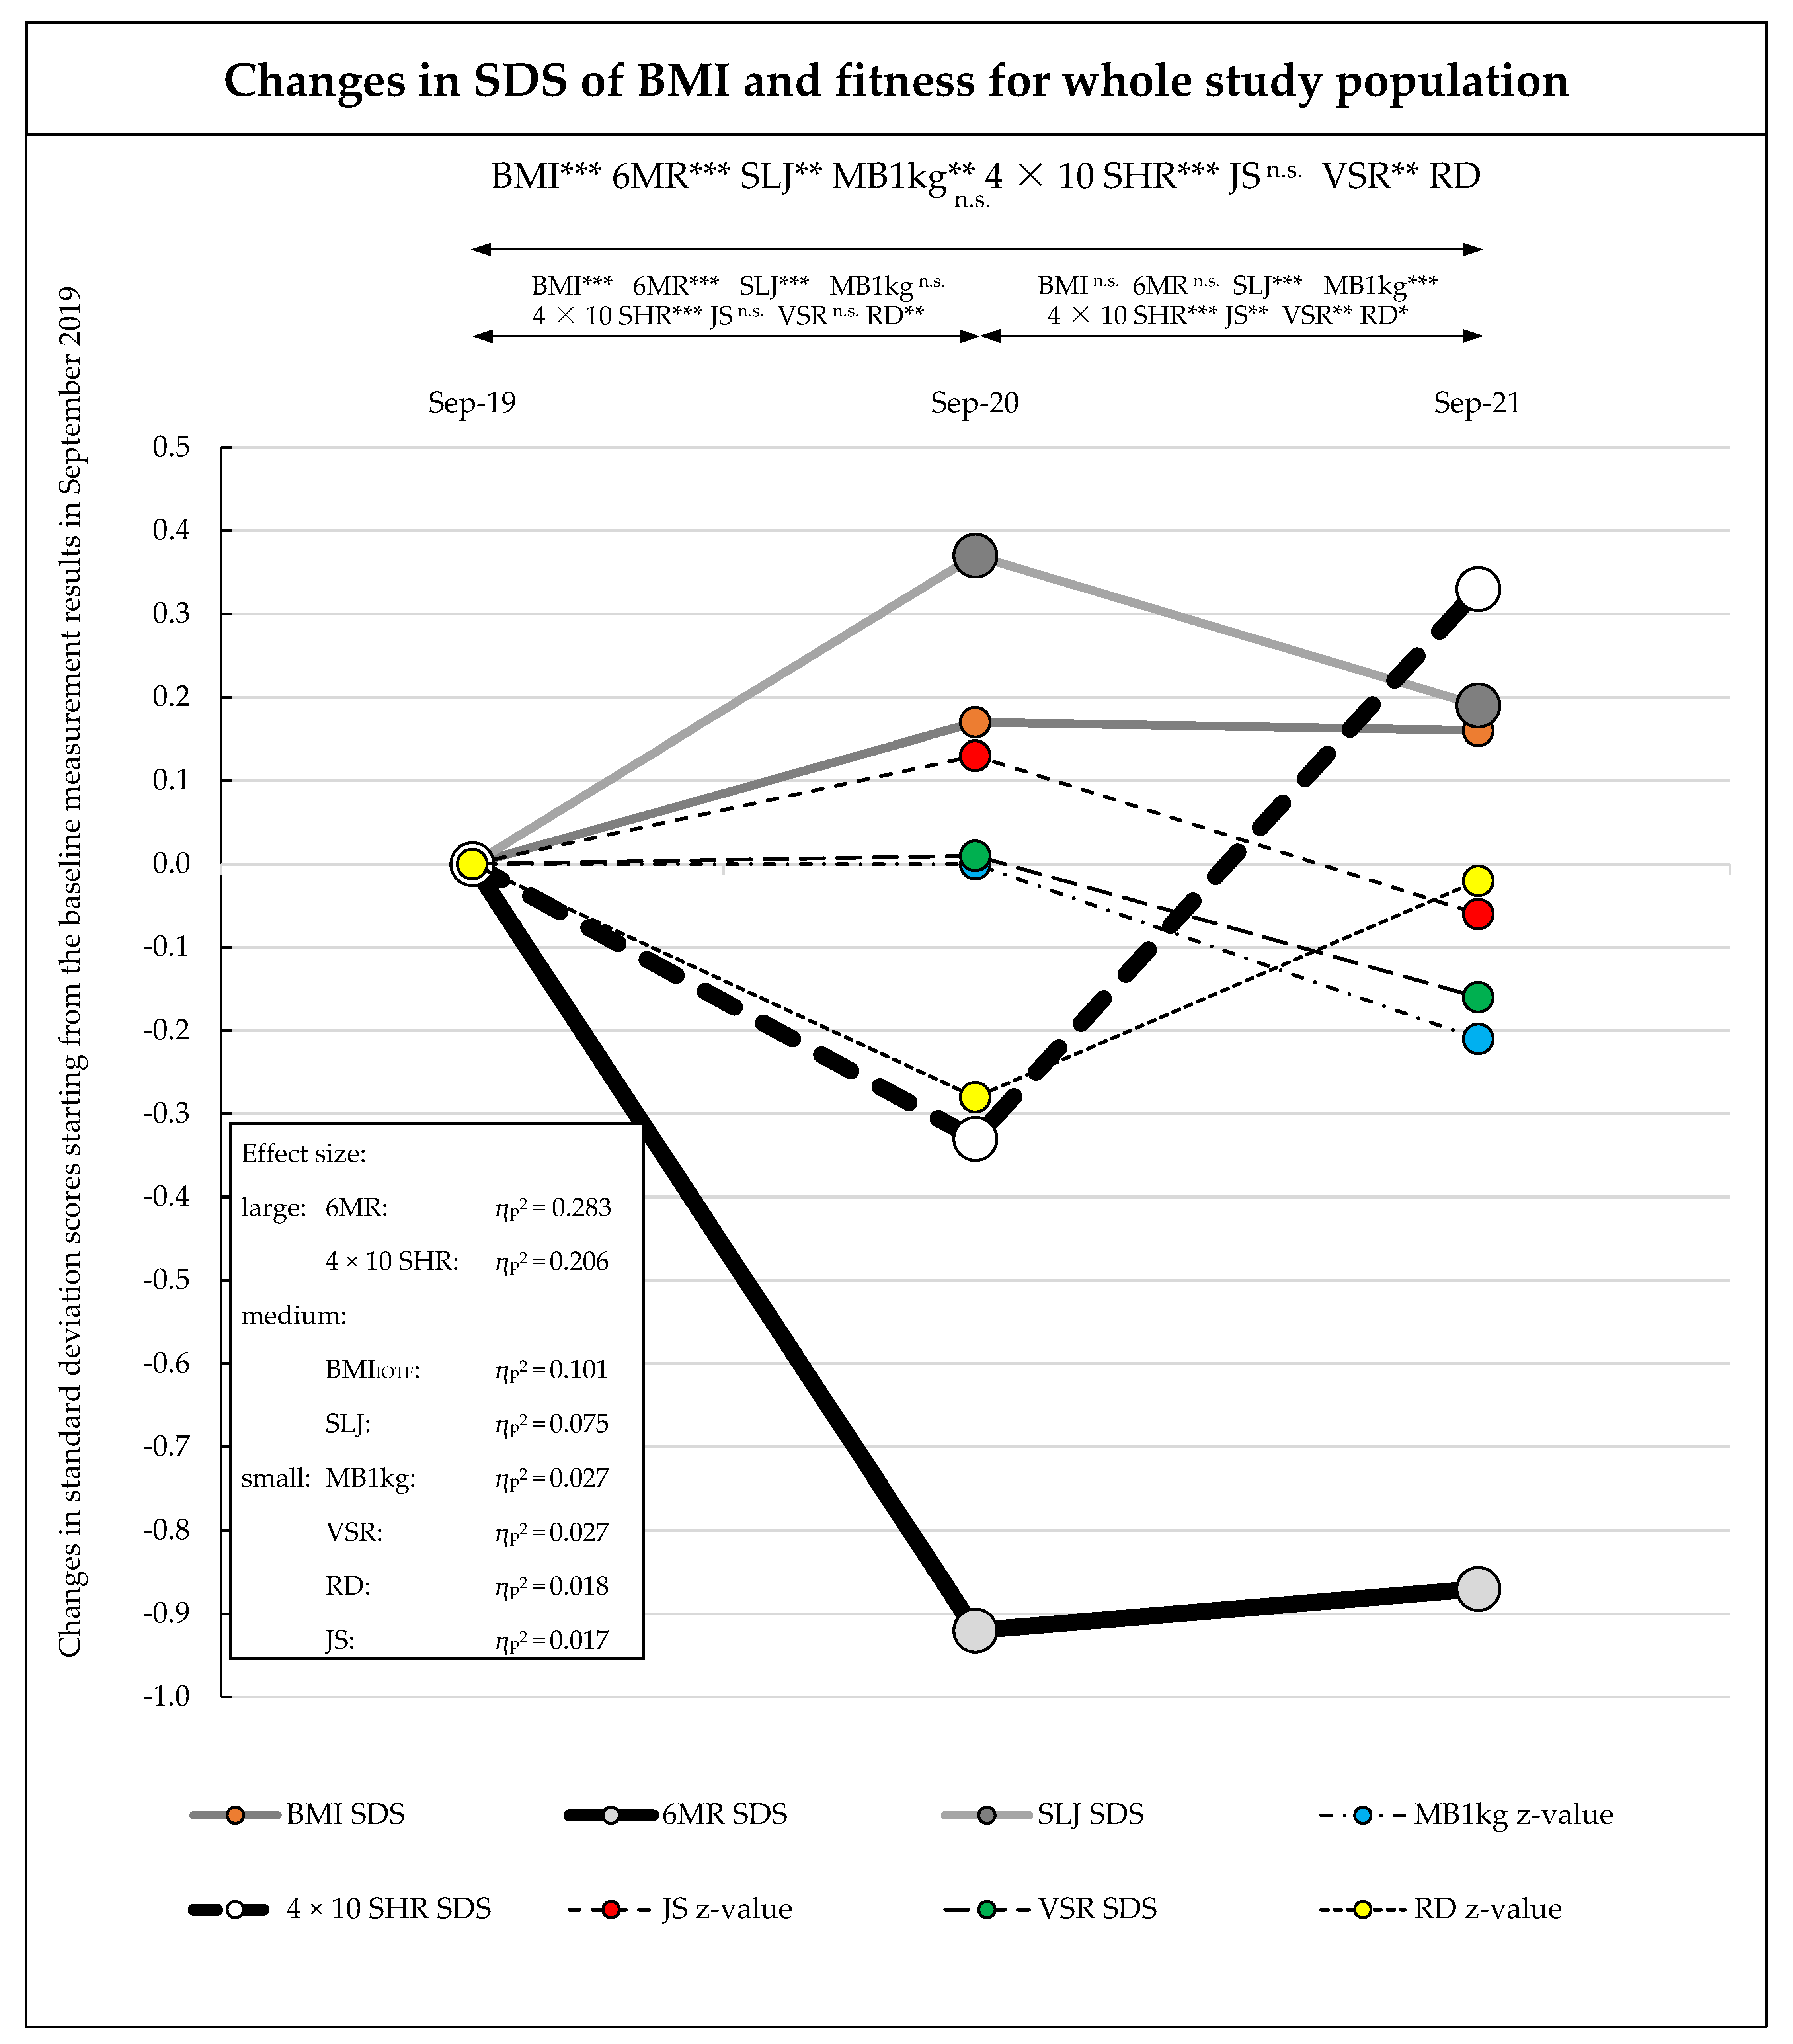
3.2. Change in Fitness
4. Discussion
5. Conclusions
Supplementary Materials
Author Contributions
Funding
Institutional Review Board Statement
Informed Consent Statement
Data Availability Statement
Acknowledgments
Conflicts of Interest
References
- Zhu, S.; Zhuang, Y.; Ip, P. Impacts on Children and Adolescents’ Lifestyle, Social Support and Their Association with Negative Impacts of the COVID-19 Pandemic. Int. J. Environ. Res. Public Health 2021, 18, 4780. [Google Scholar] [CrossRef] [PubMed]
- López-Bueno, R.; López-Sánchez, G.F.; Casajús, J.A.; Calatayud, J.; Gil-Salmerón, A.; Grabovac, I.; Tully, M.A.; Smith, L. Health-Related Behaviors Among School-Aged Children and Adolescents During the Spanish Covid-19 Confinement. Front. Pediatr. 2020, 8, 573. [Google Scholar] [CrossRef] [PubMed]
- Alonso-Martínez, A.M.; Ramírez-Vélez, R.; García-Alonso, Y.; Izquierdo, M.; García-Hermoso, A. Physical Activity, Sedentary Behavior, Sleep and Self-Regulation in Spanish Preschoolers during the COVID-19 Lockdown. Int. J. Environ. Res. Public Health 2021, 18, 693. [Google Scholar] [CrossRef] [PubMed]
- Dunton, G.F.; Do, B.; Wang, S.D. Early effects of the COVID-19 pandemic on physical activity and sedentary behavior in children living in the U.S. BMC Public Health 2020, 20, 1351. [Google Scholar] [CrossRef]
- Cocca, A.; Greier, K.; Drenowatz, C.; Ruedl, G. Relationship between Objectively and Subjectively Measured Physical Activity in Adolescents during and after COVID-19 Restrictions. Behav. Sci. 2021, 11, 177. [Google Scholar] [CrossRef]
- López-Bueno, R.; López-Sánchez, G.F.; Casajús, J.A.; Calatayud, J.; Tully, M.A.; Smith, L. Potential health-related behaviors for pre-school and school-aged children during COVID-19 lockdown: A narrative review. Prev. Med. 2021, 143, 106349. [Google Scholar] [CrossRef]
- Escobar-Córdoba, F.; Ramírez-Ortiz, J.; Fontecha-Hernández, J. Effects of social isolation on sleep during the COVID-19 pandemic. Sleep Sci. 2021, 14, 86–93. [Google Scholar] [CrossRef]
- Ruiz-Roso, M.B.; de Carvalho Padilha, P.; Mantilla-Escalante, D.C.; Ulloa, N.; Brun, P.; Acevedo-Correa, D.; Arantes Ferreira Peres, W.; Martorell, M.; Aires, M.T.; de Oliveira Cardoso, L.; et al. COVID-19 Confinement and Changes of Adolescent’s Dietary Trends in Italy, Spain, Chile, Colombia and Brazil. Nutrients 2020, 12, 1807. [Google Scholar] [CrossRef]
- Ruíz-Roso, M.B.; de Carvalho Padilha, P.; Matilla-Escalante, D.C.; Brun, P.; Ulloa, N.; Acevedo-Correa, D.; Arantes Ferreira Peres, W.; Martorell, M.; Rangel Bousquet Carrilho, T.; de Oliveira Cardoso, L.; et al. Changes of Physical Activity and Ultra-Processed Food Consumption in Adolescents from Different Countries during Covid-19 Pandemic: An Observational Study. Nutrients 2020, 12, 2289. [Google Scholar] [CrossRef]
- Zenic, N.; Taiar, R.; Gilic, B.; Blazevic, M.; Maric, D.; Pojskic, H.; Sekulic, D. Levels and Changes of Physical Activity in Adolescents during the COVID-19 Pandemic: Contextualizing Urban vs. Rural Living Environment. Appl. Sci. 2020, 10, 3997. [Google Scholar] [CrossRef]
- Robertson, M.; Duffy, F.; Newman, E.; Prieto Bravo, C.; Ates, H.H.; Sharpe, H. Exploring changes in body image, eating and exercise during the COVID-19 lockdown: A UK survey. Appetite 2021, 159, 105062. [Google Scholar] [CrossRef] [PubMed]
- Torales, J.; O’Higgins, M.; Castaldelli-Maia, J.M.; Ventriglio, A. The outbreak of COVID-19 coronavirus and its impact on global mental health. Int. J. Soc. Psychiatry 2020, 66, 317–320. [Google Scholar] [CrossRef]
- de Figueiredo, C.S.; Sandre, P.C.; Portugal, L.C.L.; Mázala-de-Oliveira, T.; Da Silva Chagas, L.; Raony, Í.; Ferreira, E.S.; Giestal-de-Araujo, E.; dos Santos, A.A.; Bomfim, P.O.-S. COVID-19 pandemic impact on children and adolescents’ mental health: Biological, environmental, and social factors. Prog. Neuro-Psychopharmacol. Biol. Psychiatry 2021, 106, 110171. [Google Scholar] [CrossRef] [PubMed]
- Fegert, J.M.; Vitiello, B.; Plener, P.L.; Clemens, V. Challenges and burden of the Coronavirus 2019 (COVID-19) pandemic for child and adolescent mental health: A narrative review to highlight clinical and research needs in the acute phase and the long return to normality. Child Adolesc. Psychiatry Ment. Health 2020, 14, 20. [Google Scholar] [CrossRef] [PubMed]
- López-Bueno, R.; Calatayud, J.; Andersen, L.L.; Casaña, J.; Ezzatvar, Y.; Casajús, J.A.; López-Sánchez, G.F.; Smith, L. Cardiorespiratory fitness in adolescents before and after the COVID-19 confinement: A prospective cohort study. Eur. J. Pediatr. 2021, 180, 2287–2293. [Google Scholar] [CrossRef]
- Chang, T.-H.; Chen, Y.-C.; Chen, W.-Y.; Chen, C.-Y.; Hsu, W.-Y.; Chou, Y.; Chang, Y.-H. Weight Gain Associated with COVID-19 Lockdown in Children and Adolescents: A Systematic Review and Meta-Analysis. Nutrients 2021, 13, 3668. [Google Scholar] [CrossRef]
- Jurak, G.; Morrison, S.A.; Kovač, M.; Leskošek, B.; Sember, V.; Strel, J.; Starc, G. A COVID-19 Crisis in Child Physical Fitness: Creating a Barometric Tool of Public Health Engagement for the Republic of Slovenia. Front. Public Health 2021, 9, 644235. [Google Scholar] [CrossRef]
- Ortega, F.B.; Ruiz, J.R.; Castillo, M.J.; Sjöström, M. Physical fitness in childhood and adolescence: A powerful marker of health. Int. J. Obes. 2008, 32, 1–11. [Google Scholar] [CrossRef]
- Jarnig, G.; Jaunig, J.; Kerbl, R.; Strenger, V.; Haeusler, G.; van Poppel, M.N.M. Acceleration in BMI gain following COVID-19 restrictions. A longitudinal study with 7- to 10-year-old primary school children. Pediatr. Obes. 2022, 17, e12890. [Google Scholar] [CrossRef]
- Lange, S.J.; Kompaniyets, L.; Freedman, D.S.; Kraus, E.M.; Porter, R.; Blanck, H.M.; Goodman, A.B. Longitudinal Trends in Body Mass Index Before and During the COVID-19 Pandemic Among Persons Aged 2–19 Years—United States, 2018–2020. Morb. Mortal. Wkly. Rep. 2021, 70, 1278–1283. [Google Scholar] [CrossRef]
- Brooks, C.G.; Spencer, J.R.; Sprafka, J.M.; Roehl, K.A.; Ma, J.; Londhe, A.A.; He, F.; Cheng, A.; Brown, C.A.; Page, J. Pediatric BMI changes during COVID-19 pandemic: An electronic health record-based retrospective cohort study. EClinicalMedicine 2021, 38, 101026. [Google Scholar] [CrossRef] [PubMed]
- Jarnig, G.; Jaunig, J.; van Poppel, M.N.M. Association of COVID-19 Mitigation Measures with Changes in Cardiorespiratory Fitness and Body Mass Index Among Children Aged 7 to 10 Years in Austria. JAMA Netw. Open 2021, 4, e2121675. [Google Scholar] [CrossRef] [PubMed]
- Jarnig, G.; Kerbl, R.; van Poppel, M.N.M. The Impact of COVID-19-Related Mitigation Measures on the Health and Fitness Status of Primary School Children in Austria: A Longitudinal Study with Data from 708 Children Measured before and during the Ongoing COVID-19 Pandemic. Sports 2022, 10, 43. [Google Scholar] [CrossRef] [PubMed]
- Zhou, T.; Zhai, X.; Wu, N.; Koriyama, S.; Wang, D.; Jin, Y.; Li, W.; Sawada, S.S.; Fan, X. Changes in Physical Fitness during COVID-19 Pandemic Lockdown among Adolescents: A Longitudinal Study. Healthcare 2022, 10, 351. [Google Scholar] [CrossRef]
- Sunda, M.; Gilic, B.; Peric, I.; Jurcev Savicevic, A.; Sekulic, D. Evidencing the Influence of the COVID-19 Pandemic and Imposed Lockdown Measures on Fitness Status in Adolescents: A Preliminary Report. Healthcare 2021, 9, 681. [Google Scholar] [CrossRef]
- Jarnig, G.; Jaunig, J.; Kerbl, R.; Lima, R.A.; van Poppel, M.N.M. A Novel Monitoring System (AUT FIT) for Anthropometrics and Physical Fitness in Primary School Children in Austria: A Cross-Sectional Pilot Study. Sports 2022, 10, 4. [Google Scholar] [CrossRef]
- Österreich, R. RIS—Rechtsinformationssytem des Bundes—Österreich—Bundesgesetzblatt und Verordnungen. Bundesgesetzblatt. Available online: https://www.ris.bka.gv.at/Bgbl-Auth/ (accessed on 3 September 2021).
- Stemper, T.; Bachmann, C.; Diehlmann, K.; Kemper, B. DüMo Düsseldorfer Modell der Bewegungs-, Sport- und Talentförderung: 2003–2018: Konzept, Normwerte, Untersuchungsergebnisse; LIT: Berlin, Germany, 2020; ISBN 9783643147783. [Google Scholar]
- Bös, K.; Opper, E.; Woll, A.; Liebisch, R.; Breithecker, D.; Kremer, B. Das Karlsruher Testsystem für Kinder (KATS-K)—Testmanual. Haltung Und Beweg. 2001, 21, 4. [Google Scholar]
- Rodrigues, L.P.; Luz, C.; Cordovil, R.; Bezerra, P.; Silva, B.; Camões, M.; Lima, R. Normative values of the motor competence assessment (MCA) from 3 to 23 years of age. J. Sci. Med. Sport 2019, 22, 1038–1043. [Google Scholar] [CrossRef]
- Bös, K. Deutscher Motorik-Test 6-18: (DMT 6-18): Manual und Internetbasierte Auswertungssoftware; 2. Auflage; Feldhaus, Edition Czwalina: Hamburg, Germany, 2016; ISBN 9783880206434. [Google Scholar]
- Hui, S.C.; Yuen, P.Y.; Morrow, J.R.; Jackson, A.W. Comparison of the Criterion-Related Validity of Sit-and-Reach Tests with and without Limb Length Adjustment in Asian Adults. Res. Q. Exerc. Sport 1999, 70, 401–406. [Google Scholar] [CrossRef]
- Hui, S.S.; Yuen, P.Y. Validity of the modified back-saver sit-and-reach test: A comparison with other protocols. Med. Sci. Sports Exerc. 2000, 32, 1655–1659. [Google Scholar] [CrossRef]
- Castro-Piñero, J.; Chillón, P.; Ortega, F.B.; Montesinos, J.L.; Sjöström, M.; Ruiz, J.R. Criterion-related validity of sit-and-reach and modified sit-and-reach test for estimating hamstring flexibility in children and adolescents aged 6–17 years. Int. J. Sports Med. 2009, 30, 658–662. [Google Scholar] [CrossRef] [PubMed]
- Fetz, F.; Kornexl, E. Sportmotorische Tests: Praktische Anleitung zu sportmotorischen Tests in Schule und Verein; 2. überarb u. erw. Aufl.; Österr. Bundesverl.: Wien, Austria, 1978; ISBN 387039028X. [Google Scholar]
- Mayer, M.; Gleiss, A.; Häusler, G.; Borkenstein, M.; Kapelari, K.; Köstl, G.; Lassi, M.; Schemper, M.; Schmitt, K.; Blümel, P. Weight and body mass index (BMI): Current data for Austrian boys and girls aged 4 to under 19 years. Ann. Hum. Biol. 2015, 42, 45–55. [Google Scholar] [CrossRef] [PubMed]
- Gontarev, S.; Kalac, R.; Velickovska, L.A.; Zivkovic, V. Estándares de referencia de aptitud física en niños y adolescentes de Macedonia: El estudio MAKFIT. Nutr. Hosp. 2018, 35, 1275–1286. [Google Scholar] [CrossRef] [PubMed]
- Cole, T.J.; Lobstein, T. Extended international (IOTF) body mass index cut-offs for thinness, overweight and obesity. Pediatr. Obes. 2012, 7, 284–294. [Google Scholar] [CrossRef] [PubMed]
- Cole, T.J.; Green, P.J. Smoothing reference centile curves: The LMS method and penalized likelihood. Stat. Med. 1992, 11, 1305–1319. [Google Scholar] [CrossRef] [PubMed]
- Bös, K.; Worth, A.; Heel, J.; Opper, E.; Romahn, N.; Tittlbach, S.; Wank, V.; Woll, A. Testmanual des Motorik-Moduls im Rahmen des Kinder-und Jugendgesundheitssurveys des Robert Koch Instituts. Haltung Und Beweg. 2004, 24, 6–41. [Google Scholar]
- Cohen, J. Statistical Power Analysis for the Behavioral Sciences, 2nd ed.; Routledge: New York, NY, USA, 1988; ISBN 0805802835. [Google Scholar]
- Fühner, T.; Kliegl, R.; Arntz, F.; Kriemler, S.; Granacher, U. An Update on Secular Trends in Physical Fitness of Children and Adolescents from 1972 to 2015: A Systematic Review. Sports Med. 2021, 51, 303–320. [Google Scholar] [CrossRef]
- Fröhlich, M.; Gießing, J.; Strack, A. Krafttraining bei Kindern und Jugendlichen: Hintergründe, Trainingspläne, Übungen, 3; updated and expanded edition; Tectum Verlag: Baden-Baden, Germany, 2019; ISBN 9783828843271. [Google Scholar]
- Weaver, R.G.; Hunt, E.T.; Armstrong, B.; Beets, M.W.; Brazendale, K.; Turner-McGrievy, G.; Pate, R.R.; Youngstedt, S.D.; Dugger, R.; Parker, H.; et al. COVID-19 Leads to Accelerated Increases in Children’s BMI z-Score Gain: An Interrupted Time-Series Study. Am. J. Prev. Med. 2021, 61, e161–e169. [Google Scholar] [CrossRef]
- Stavridou, A.; Kapsali, E.; Panagouli, E.; Thirios, A.; Polychronis, K.; Bacopoulou, F.; Psaltopoulou, T.; Tsolia, M.; Sergentanis, T.N.; Tsitsika, A. Obesity in Children and Adolescents during COVID-19 Pandemic. Children 2021, 8, 135. [Google Scholar] [CrossRef]
- Woolford, S.J.; Sidell, M.; Li, X.; Else, V.; Young, D.R.; Resnicow, K.; Koebnick, C. Changes in Body Mass Index Among Children and Adolescents During the COVID-19 Pandemic. JAMA 2021, 326, 1434–1436. [Google Scholar] [CrossRef]
- Sirico, F.; Fernando, F.; Bianco, A.; Loiacono, C.; Nuccio, F.; Gambardella, F.; Palermi, S.; Montagnani, S.; Biffi, A. Parental Perception of Children’s Weight Status: Love Overpasses Scientific Evidence! A Cross-Sectional Observational Study. High Blood Press. Cardiovasc. Prev. 2020, 27, 29–34. [Google Scholar] [CrossRef] [PubMed]


| Variable | Sep-19 | Sep-20 | Sep-21 |
|---|---|---|---|
| Age (years), Mean (SD) | 7.7 (0.4) | 8.7 (0.4) | 9.7 (0.4) |
| Female sex, no. (%) | 147 (48.5) | ||
| Sports club, no. (%) | 133 (43.9) | ||
| BMI, mean (SD) in kg/m2 | 16.49 (2.41) | 17.36 (2.90) | 17.95 (3.23) |
| 6MR, mean (SD) in m | 906 (137) | 815 (126) | 860 (172) |
| SLJ, mean (SD) in cm | 120.5 (18.1) | 132.1 (19.7) | 138.4 (20.1) |
| MB1kg, mean (SD) in cm | 316.8 (66.5) | 375.4 (67.3) | 420.2 (74.7) |
| 4 × 10 SHR, mean (SD) in s | 15.18 (1.37) | 14.97 (1.52) | 13.45 (1.15) |
| JS, mean (SD) in no. | 29.6 (6.5) | 35.2 (6.8) | 38.4 (6.4) |
| VSR, mean (SD) in cm | 17.8 (8.3) | 17.5 (8.7) | 16.3 (8.6) |
| RD, mean (SD) in cm | 19.3 (9.3) | 19.2 (7.0) | 16.4 (6.0) |
| ∆ Sep-19 to Sep-20 | ∆ Sep-20 to Sep-21 | ||||||
|---|---|---|---|---|---|---|---|
| Variable | Sep-19 | Sep-20 | Sep-21 | Mean ∆ | 95% CI | Mean ∆ | 95% CI |
| BMI SDS, mean (SD) | 0.32 (1.02) | 0.49 (1.04) | 0.48 (1.04) | 0.17 (0.38) | 0.12 to 0.21 | −0.01 (0.34) | −0.04 to 0.04 |
| 6MR SDS, mean (SD) | 0.49 (1.12) | −0.43 (0.93) | −0.38 (1.21) | −0.92 (0.95) | −1.02 to −0.81 | 0.05 (1.12) | −0.08 to 0.18 |
| SLJ SDS, mean (SD) | 0.11 (1.00) | 0.47 (1.07) | 0.29 (1.02) | 0.36 (0.90) | 0.26 to 0.46 | −0.18 (0.74) | −0.26 to −0.10 |
| MB1kg z-value, mean (SD) | 0.09 (1.00) | 0.09 (0.93) | −0.12 (0.92) | 0.00 (0.89) | −0.10 to 0.10 | −0.21 (0.75) | −0.30 to −0.13 |
| 4 × 10 SHR SDS, mean (SD) | −0.31 (0.85) | −0.64 (0.96) | 0.02 (0.93) | −0.33 (0.88) | −0.42 to −0.22 | 0.66 (0.86) | 0.56 to 0.76 |
| JS z-value, mean (SD) | 2.24 (1.40) | 2.37 (1.26) | 2.18 (1.06) | 0.14 (1.27) | −0.01 to 0.28 | −0.19 (0.98) | −0.30 to −0.08 |
| VSR SDS, mean (SD) | 0.35 (1.43) | 0.36 (1.46) | 0.19 (1.42) | 0.01 (0.85) | −0.09 to 0.10 | −0.17 (0.86) | −0.27 to −0.07 |
| RD z-value, mean (SD) | 1.09 (1.28) | 0.81 (1.10) | 1.07 (1.06) | −0.28 (1.49) | −0.45 to −0.11 | 0.26 (1.31) | 0.11 to 0.40 |
| Variable | Effects | Time and Subgroups | df | F | p-Value | ηp2 | Power a |
|---|---|---|---|---|---|---|---|
| BMI SDS | Between-subjects effects | Sex | 1 | 1.946 | 0.164 | 0.006 | 0.285 |
| Sports Club | 1 | 0.892 | 0.346 | 0.003 | 0.156 | ||
| Sex × Sports Club | 1 | 1.260 | 0.263 | 0.004 | 0.201 | ||
| Error | 299 | ||||||
| Within-subjects effects | Time (T1, T2, and T3) | 1.895 | 33.759 | <0.001 | 0.101 | 1.000 | |
| Time × Sex | 1.895 | 6.258 | 0.002 | 0.021 | 0.882 | ||
| Time × Sports Club | 1.895 | 5.571 | 0.005 | 0.018 | 0.841 | ||
| Time × Sex × Sports Club | 1.895 | 3.139 | 0.047 | 0.010 | 0.586 | ||
| Error (Time) | 566.515 | ||||||
| 6MR SDS | Between-subjects effects | Sex | 1 | 6.272 | 0.013 | 0.021 | 0.704 |
| Sports Club | 1 | 16.129 | <0.001 | 0.051 | 0.979 | ||
| Sex × Sports Club | 1 | 0.989 | 0.321 | 0.003 | 0.168 | ||
| Error | 299 | ||||||
| Within-subjects effects | Time (T1, T2, and T3) | 1.903 | 118.204 | <0.001 | 0.283 | 1.000 | |
| Time × Sex | 1.903 | 1.487 | 0.228 | 0.005 | 0.310 | ||
| Time × Sports Club | 1.903 | 0.557 | 0.565 | 0.002 | 0.140 | ||
| Time × Sex × Sports Club | 1.903 | 0.821 | 0.435 | 0.003 | 0.187 | ||
| Error (Time) | 568.960 | ||||||
| SLJ SDS | Between-subjects effects | Sex | 1 | 1.033 | 0.310 | 0.003 | 0.173 |
| Sports Club | 1 | 4.052 | 0.045 | 0.013 | 0.519 | ||
| Sex × Sports Club | 1 | 1.004 | 0.317 | 0.003 | 0.170 | ||
| Error | 299 | ||||||
| Within-subjects effects | Time (T1, T2, andT3) | 1.904 | 24.110 | <0.001 | 0.075 | 1.000 | |
| Time × Sex | 1.904 | 1.873 | 0.157 | 0.006 | 0.380 | ||
| Time × Sports Club | 1.904 | 0.109 | 0.888 | 0.000 | 0.066 | ||
| Time × Sex × Sports Club | 1.904 | 1.204 | 0.300 | 0.004 | 0.257 | ||
| Error (Time) | 569.303 | ||||||
| MB1kg z-value | Between-subjects effects | Sex | 1 | 2.564 | 0.110 | 0.009 | 0.358 |
| Sports Club | 1 | 4.528 | 0.034 | 0.015 | 0.564 | ||
| Sex × Sports Club | 1 | 5.310 | 0.022 | 0.017 | 0.632 | ||
| Error | 299 | ||||||
| Within-subjects effects | Time (T1, T2, and T3) | 1.922 | 8.229 | <0.001 | 0.027 | 0.955 | |
| Time × Sex | 1.922 | 2.633 | 0.075 | 0.009 | 0.513 | ||
| Time × Sports Club | 1.922 | 0.934 | 0.391 | 0.003 | 0.208 | ||
| Time × Sex × Sports Club | 1.922 | 2.060 | 0.130 | 0.007 | 0.416 | ||
| Error (Time) | 574.679 | ||||||
| 4 × 10 SHR SDS | Between-subjects effects | Sex | 1 | 2.552 | 0.111 | 0.008 | 0.357 |
| Sports Club | 1 | 13.197 | <0.001 | 0.042 | 0.952 | ||
| Sex × Sports Club | 1 | 0.004 | 0.953 | 0.000 | 0.050 | ||
| Error | 299 | ||||||
| Within-subjects effects | Time (T1, T2, and T3) | 2 | 77.420 | <0.001 | 0.206 | 1.000 | |
| Time × Sex | 2 | 1.013 | 0.364 | 0.003 | 0.227 | ||
| Time × Sports Club | 2 | 1.716 | 0.181 | 0.006 | 0.361 | ||
| Time × Sex × Sports Club | 2 | 1.181 | 0.308 | 0.004 | 0.259 | ||
| Error (Time) | 598 | ||||||
| JS z-value | Between-subjects effects | Sex | 1 | 7.805 | 0.006 | 0.025 | 0.795 |
| Sports Club | 1 | 8.923 | 0.003 | 0.029 | 0.846 | ||
| Sex × Sports Club | 1 | 4.586 | 0.033 | 0.015 | 0.569 | ||
| Error | 299 | ||||||
| Within-subjects effects | Time (T1, T2, and T3) | 1.828 | 5.107 | 0.008 | 0.017 | 0.796 | |
| Time × Sex | 1.828 | 1.625 | 0.200 | 0.005 | 0.328 | ||
| Time × Sports Club | 1.828 | 2.411 | 0.096 | 0.008 | 0.464 | ||
| Time × Sex × Sports Club | 1.828 | 0.149 | 0.843 | 0.000 | 0.072 | ||
| Error (Time) | 546.628 | ||||||
| VSR SDS | Between-subjects effects | Sex | 1 | 25.714 | <0.001 | 0.079 | 0.999 |
| Sports Club | 1 | 2.871 | 0.091 | 0.010 | 0.393 | ||
| Sex × Sports Club | 1 | 0.108 | 0.743 | 0.000 | 0.062 | ||
| Error | 299 | ||||||
| Within-subjects effects | Time (T1, T2, and T3) | 2 | 8.343 | <0.001 | 0.027 | 0.963 | |
| Time × Sex | 2 | 3.063 | 0.047 | 0.010 | 0.591 | ||
| Time × Sports Club | 2 | 0.587 | 0.557 | 0.002 | 0.148 | ||
| Time × Sex × Sports Club | 2 | 0.256 | 0.774 | 0.001 | 0.090 | ||
| Error (Time) | 598 | ||||||
| RD z-value | Between-subjects effects | Sex | 1 | 5.010 | 0.026 | 0.016 | 0.607 |
| Sports Club | 1 | 2.088 | 0.149 | 0.007 | 0.302 | ||
| Sex × Sports Club | 1 | 0.368 | 0.545 | 0.001 | 0.093 | ||
| Error | 299 | ||||||
| Within-subjects effects | Time (T1, T2, and T3) | 1.941 | 5.525 | 0.005 | 0.018 | 0.844 | |
| Time × Sex | 1.941 | 0.313 | 0.725 | 0.001 | 0.099 | ||
| Time × Sports Club | 1.941 | 1.604 | 0.203 | 0.005 | 0.335 | ||
| Time × Sex × Sports Club | 1.941 | 0.642 | 0.522 | 0.002 | 0.156 | ||
| Error (Time) | 580.445 |
Publisher’s Note: MDPI stays neutral with regard to jurisdictional claims in published maps and institutional affiliations. |
© 2022 by the authors. Licensee MDPI, Basel, Switzerland. This article is an open access article distributed under the terms and conditions of the Creative Commons Attribution (CC BY) license (https://creativecommons.org/licenses/by/4.0/).
Share and Cite
Jarnig, G.; Kerbl, R.; van Poppel, M.N.M. Change in BMI and Fitness among Primary School Children in Austria: A 24-Month Follow-Up Study of 303 Children Measured before and during the Ongoing COVID-19 Pandemic. Sports 2022, 10, 78. https://0-doi-org.brum.beds.ac.uk/10.3390/sports10050078
Jarnig G, Kerbl R, van Poppel MNM. Change in BMI and Fitness among Primary School Children in Austria: A 24-Month Follow-Up Study of 303 Children Measured before and during the Ongoing COVID-19 Pandemic. Sports. 2022; 10(5):78. https://0-doi-org.brum.beds.ac.uk/10.3390/sports10050078
Chicago/Turabian StyleJarnig, Gerald, Reinhold Kerbl, and Mireille N. M. van Poppel. 2022. "Change in BMI and Fitness among Primary School Children in Austria: A 24-Month Follow-Up Study of 303 Children Measured before and during the Ongoing COVID-19 Pandemic" Sports 10, no. 5: 78. https://0-doi-org.brum.beds.ac.uk/10.3390/sports10050078