Article

A Preliminary Kinematic Gait Analysis of a Strongman Event: The Farmers Walk

1
Faculty of Health Sciences and Medicine, Bond University, 14 University Drive, Robina QLD 4226, Australia
2
Sports Performance Research Institute New Zealand, AUT University, 17 Antares Place, Mairangi Bay, North Shore City, Auckland 1020, New Zealand
3
Cluster for Health Improvement, Faculty of Science, Health, Education and Engineering, University of the Sunshine Coast, 90 Sippy Downs Drive, Sippy Downs, Queensland 4556, Australia
4
High Performance Sport New Zealand, 17 Antares Place, Mairangi Bay, Auckland 0632, New Zealand
*
Author to whom correspondence should be addressed.
Submission received: 21 October 2013 / Revised: 31 December 2013 / Accepted: 6 January 2014 / Published: 14 January 2014

Abstract

:
This study sought to obtain some preliminary sagittal plane kinematic data on a common strongman event (and conditioning exercise) ‘the farmers walk’ and gain some insight into its kinematic determinants. Five experienced resistance trained males performed three, 20 m farmers walks at maximal speed while carrying 90.5 kg in each hand. Farmers walk average velocity was significantly greater in the middle (8.5–11.5 m) and latter (17–20 m) than initial stage (0–3 m), with this also associated with significant increases in stride length and stride rate and reductions in ground contact time. Comparisons between each subject’s fastest and slowest trials revealed virtually no significant differences. In contrast, the fastest three trials (irrespective of subject) had significantly greater stride length, stride rate and reduced ground contact time than the slowest three trials. Based on the impulse-momentum relationship, the production of high anterior-posterior and vertical impulses over short ground contact times may be crucial for farmers walk performance. Future studies should utilise larger samples and investigate the ground reaction and joint kinetics of the farmers walk and compare these values to other forms of bipedal gait and resistance training exercises to get a more complete understanding of the biomechanics of this exercise.

1. Introduction

The farmers walk is a frequently performed event in strongman competitions [1]. It involves picking up and carrying heavy loads in each hand a set distance of between 20–50 m as quickly as possible. Kinesiological analysis would indicate that the farmers walk requires great dynamic balance, grip and core strength and utilises forceful ankle, knee, hip and back extension to pick the bars off the ground (like a deadlift) and to cover the set distance as quickly as possible. As strongman competitions become increasingly popular internationally through their signature event the World’s Strongest Man and the qualifying series such as Giants Live and Strongman Champions League, many strength and conditioning coaches are including strongman exercises like the farmers walk, zercher carries, sled pushing/pulling and the tire flip in their athletes conditioning programs [2,3].
At this stage, relatively little biomechanical research has examined any of the strongman events. Frost et al. [4] and West et al. [5] have both examined some of the biomechanical aspects of a number of versions of the sled drag with loads that while quite heavy, have not approached what would be used in strongman competitions. Keogh and colleagues [6,7] have conducted 2-dimensional, sagittal plane kinematic analyses of the tire flip and heavy, sprint-style sled pull with loads similar to that used in strongman competitions. Observation of the video files led Keogh, Payne et al. [6] to categorise the tire flip as a four-part movement comprising the first pull, second pull, transition and push phases. Based on the between- and within-athlete comparisons of the fastest and slowest flips, it appeared that the strongest determinant of tire flip performance was the second pull duration. Keogh, Newlands et al. [7] examined the differences in the kinematics at three phases of a 20 m sled pull. Similar to findings for unresisted sprinting [11], Keogh, Newlands et al. [7] reported that the maximum velocity phase had greater stride lengths and stride rates as well as reduced ground contact times than the acceleration phase. Further, the fastest sled pull trials were generally characterised by significantly greater stride lengths, stride rates and shorter ground contact times than the slower trials. The most comprehensive study of any strongman events was conducted by McGill et al. [8] who examined the lower back and hip abductor joint loads of a variety of strongman exercises including the farmers walk, yoke walk, tire flip, log press and stone lifts. High to very high (but somewhat event-specific) spinal compression and shear forces, joint torques and hip and trunk muscle activity were observed in all three participants across these exercises. McGill et al. [8] therefore proposed that some of these exercises could form the final part of lower back rehabilitation and be important specific core stability exercises for athletic populations as long as appropriate technique and gradual progressions in load are incorporated.
Since the farmers walk is a timed event, the characteristics and determinants of its performance may be best demonstrated by common gait analysis variables such as average velocity, stride rate, stride length, ground contact time and swing time. A basic analysis of the angular kinematics of the relevant lower body joint and segments was also performed, although such data was of secondary importance due to issues associated with the placement of markers on clothing and shoes. This study was therefore conducted to: (1) obtain some preliminary kinematic characteristics of the farmers walk at various stages of the 20 m event (e.g., initial, middle and latter stages); and (2) compare the kinematics of the within- and between-subject fastest and slowest walks so to gain further insight into the kinematic determinants of performance. It was hypothesised that a significantly greater stride length and stride rate and reduced ground contact time would characterise the: (1) middle and latter stages of the farmers walk compared to the initial stage; and (2) the fastest compared to the slowest trials.

2. Context

2.1. Research Design

In order to perform the first kinematic analysis of the farmers walk, the present study used a cross-sectional design in which resistance trained athletes experienced with the farmers walk and other total body strength/power exercises were requested to complete three farmers walks as quickly as possible over a 20 m course while carrying 90.5 kg in each hand. Two-dimensional video analysis of the sagittal plane movements were obtained with three Sony video cameras operating at 50 Hz. These cameras were positioned so to provide fields of view between 0–3 m, 8.5–11.5 m and 17–20 m, which were referred to as the initial, middle and latter stages, respectively. Silicon Coach Pro7 (Dunedin, New Zealand) software was used for all analyses. The reliability [9,10] and validity [10] of Silicon Coach has been demonstrated in other studies examining movements performed primarily in the sagittal plane.

2.2. Participants

Five male strength and power athletes (27 ± 4 years, mass 93 ± 7 kg, and height 1.76 ± 0.10 m) gave informed consent to participate in this study. All were highly experienced in resistance training and familiar with commonly utilised exercises including the squat, deadlift, power clean, push press and bench press. Four of the five subjects had also competed in at least one strongman competition in which the farmers walk involving loads of ~80–115 kg each hand was a contested event.

3. Method, Results, Discussion

3.1. Method

Subjects completed a warm-up and familiarization session consisting of sub-maximal deadlifts and farmers walks for ~15–20 min. At the completion of the warm-up, each athlete performed three trials of the farmers walk with 90.5 kg in each hand over a distance of 20 m with three minutes rest between each trial, as is commonly done in training [1,2]. All trials were timed by stopwatch, starting with the point at which all of the plates left the ground and finishing when the front of both of the farmer’s bars crossed the finish line. The athletes were aware that the aim of each trial was to complete the 20 m course as quickly as possible, an aim consistent with strongman training and competition practices. As allowed in strongman competitions, the athletes could wear a weightlifting belt and use weightlifting chalk during this study. All athletes selected to use chalk but none used a belt.
Kinematic variables were recorded in the sagittal plane using three digital video cameras (Sony, PAL, 50 Hz, shutter speed 1/1000 s) that were positioned 0.8 m above the ground. The cameras were positioned at the start, middle and finish of the 20 m course to have a field of view of 3 m, meaning they covered the 0–3 m, 8.5–11.5 m and 17–20 m portions of the course, respectively.
Figure 1. Pictorial representation of the three angles measured in the farmers walk. From left to right, the top row depicts the ankle, knee and thigh angles at foot-strike. The bottom row depicts the same angles at toe-off.
Sports 02 00024 g001
Two linear kinematic (average velocity and stride length), three temporal (stride rate, ground contact time and swing time) and three joint/segment angle (thigh, knee and ankle) variables were calculated for all full steps recorded in each camera’s field of view. Markers were placed on the head of greater trochanter (hip), inter condylar groove (knee), lateral malleolus (ankle) and the base of the fifth metatarsal (toe). Angles measured included the thigh in relation to the vertical axis as well as the knee and ankle joint angles. All angles were recorded at Foot-Strike (first frame in which the foot contacted the ground) and at Toe-off (first frame in which the foot leaves the ground) (see Figure 1). Range of motion (ROM) of these joint/segments was estimated as the difference in the angle at toe-off and foot-strike. In order to calculate stride length, a calibration process was first performed. This involved using the Silicon Coach Set Distance calibration tool for the 3 m between the two closest cones in each camera’s field of view. A definition for all the kinematic and temporal variables is given below.
  • Average Velocity (m.s−1): The total length of all steps within the 3 m divided by the time taken.
  • Stride length (m): Horizontal distance from toe off of the first foot contact in the 3 m area to the next contact of the same foot.
  • Stride rate (Hz): The inverse of the time for each stride (stride time).
  • Ground contact time (s): Time from heel strike to toe off of the same foot.
  • Swing time (s): Time from toe off to heel strike of the same foot.
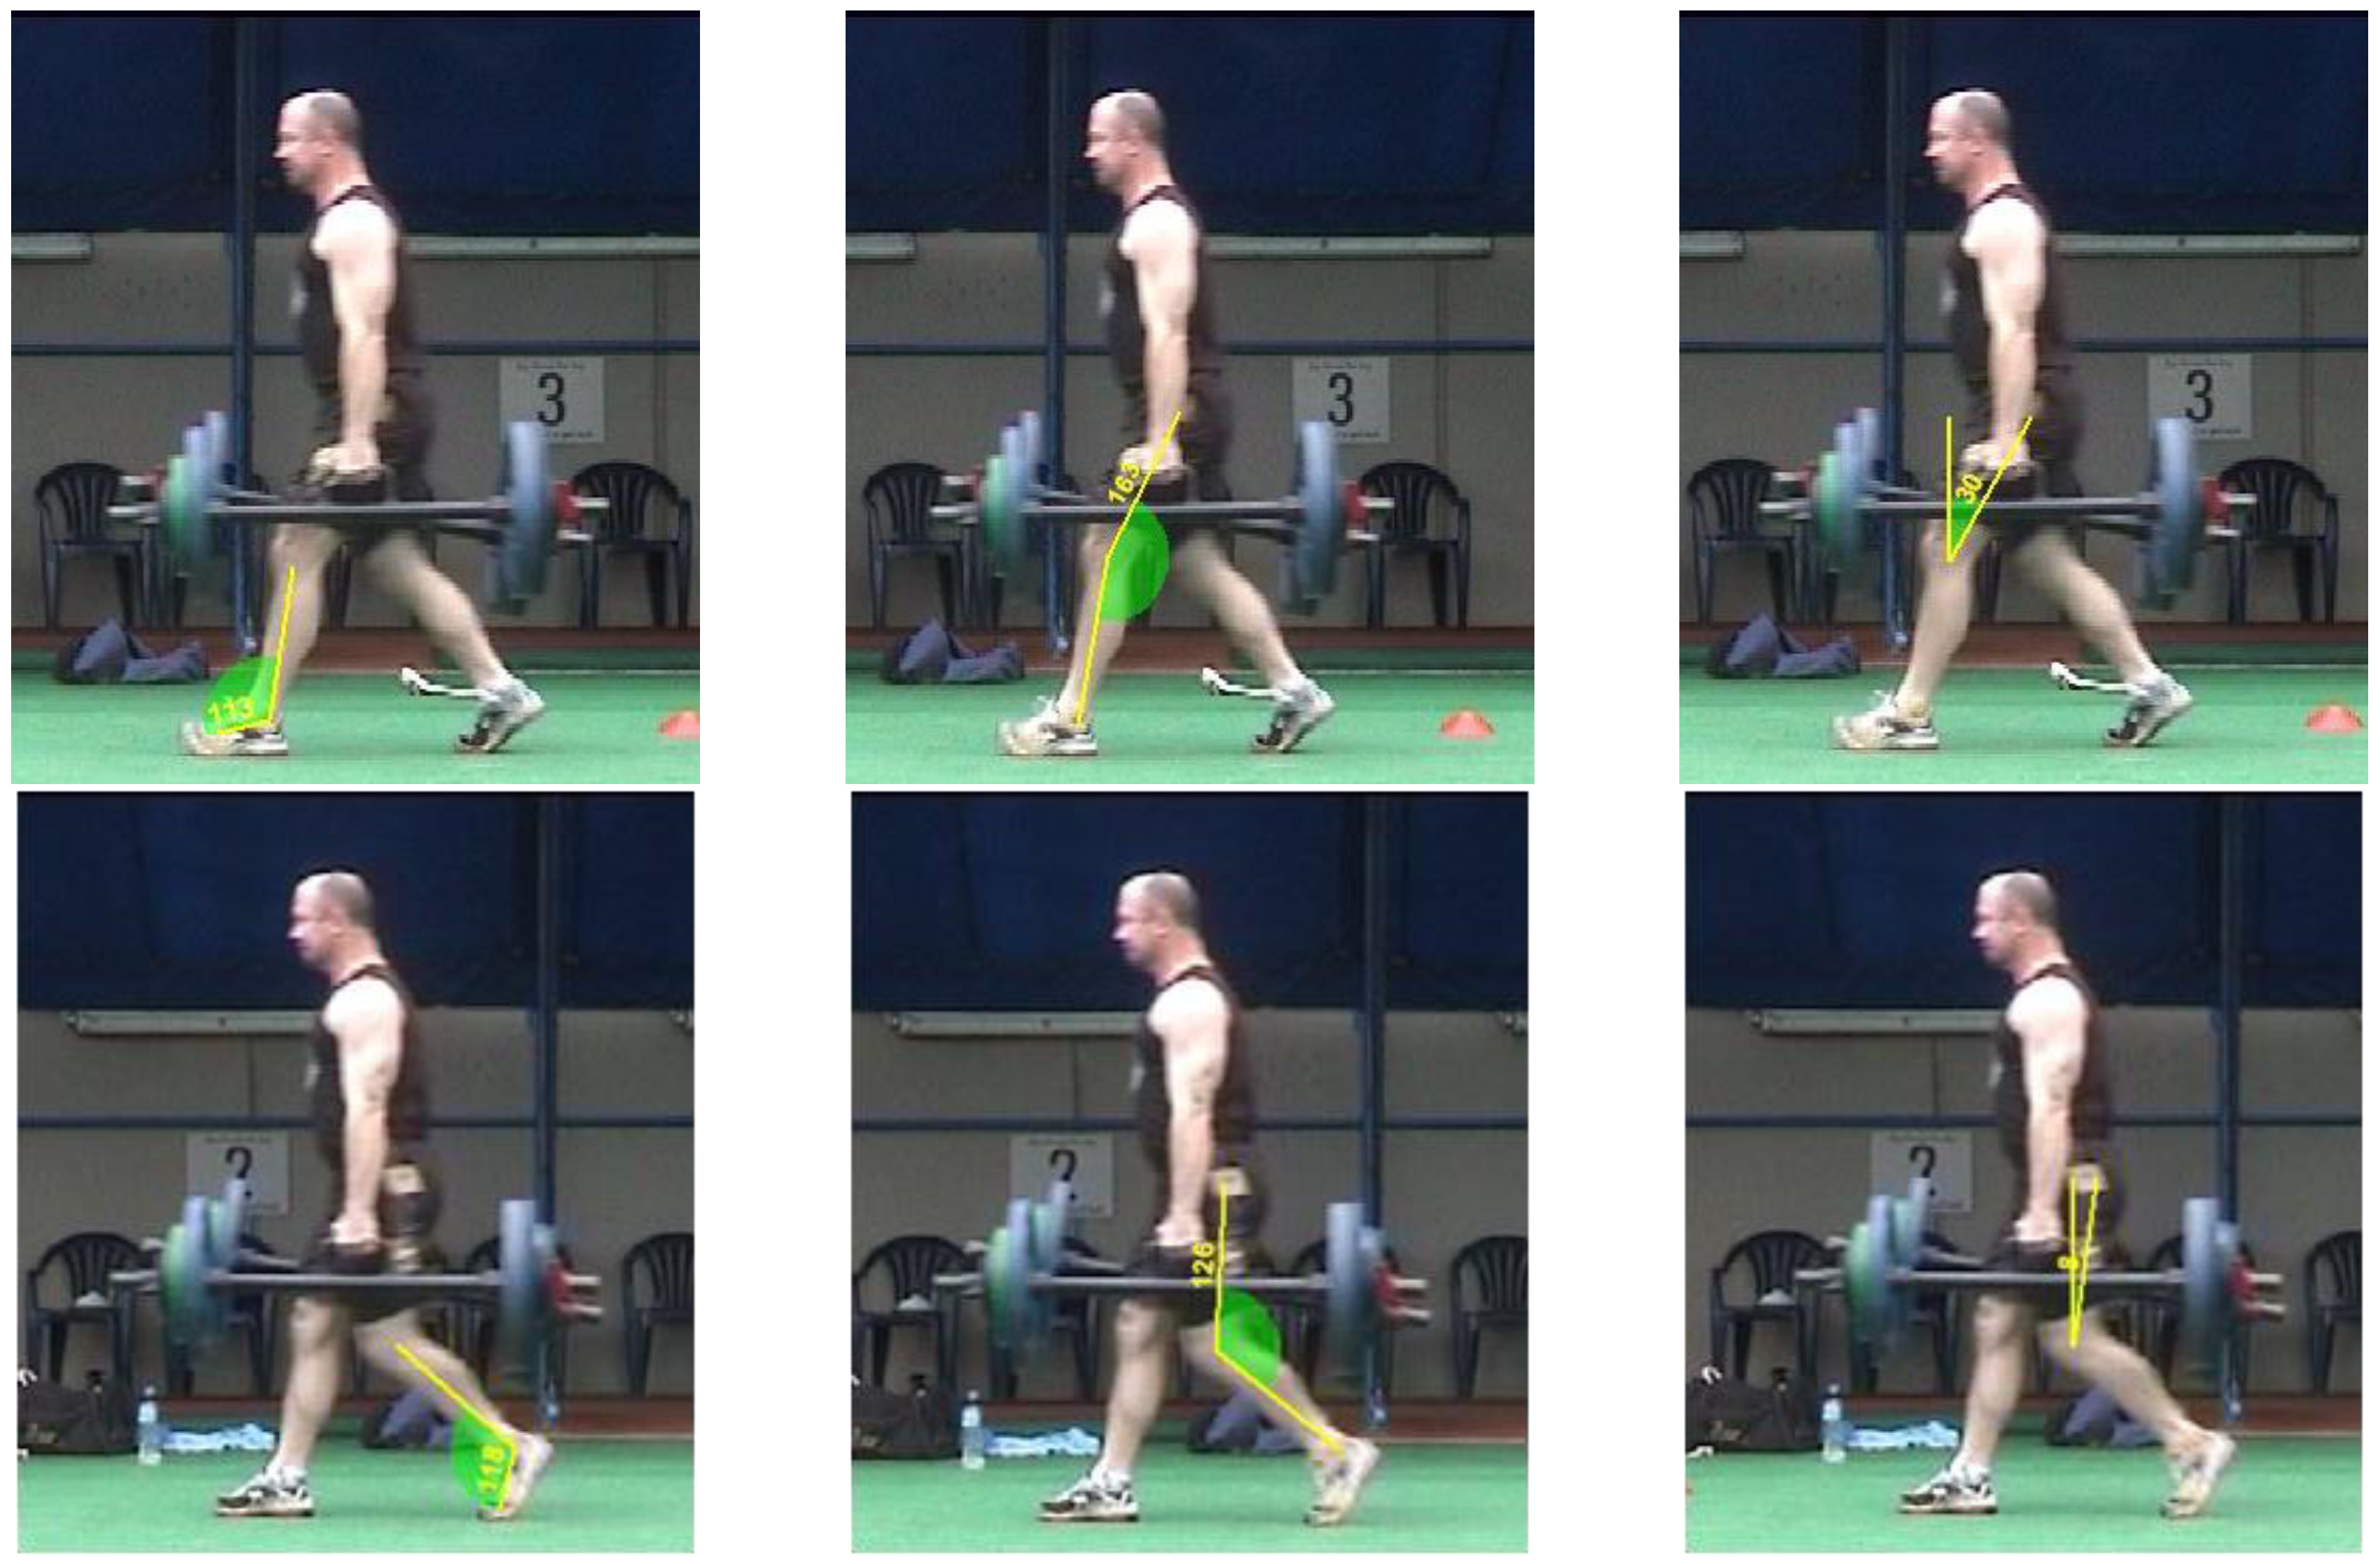
  • Thigh angle (°): The internal angle subtended from knee and hip to the vertical axis, with positive values indicating that the thigh was anterior to the hip.
  • Knee angle (°): The internal angle subtended from the hip, knee and ankle markers, with 180° indicating full knee extension.
  • Ankle angle (°): The internal angle subtended from the knee, ankle and toe, with increasing values indicating plantarflexion.

3.2. Statistical Analysis

Means and standard deviations were calculated for all variables at each of the three stages and for the within- and between-subject comparison of the fastest and slowest trials. One-way ANOVAs were used to compare the kinematics at each of the three stages: (1) across all trials for all participants; (2) for each athlete’s fastest vs. slowest trial (within-subject analysis); (3) and for the three fastest vs. slowest trials, irrespective of participants (between-subject analysis). Gabriel post-hoc tests were used (when necessary) to determine where the significant differences occurred. All statistical analyses were performed with SPSS ver 18.0, with statistical significance set at p < 0.05.

3.3. Results

Table 1 highlights the differences in the kinematic variables across the three stages of the 20 m farmers walk. These 20 m farmers walks took a mean of 8.25 ± 1.05 s to complete. Average velocity, stride length and stride rate was significantly greater and ground contact time significantly less in the latter two stages (8.5–11.5 m and 17–20 m) compared to the initial (0–3 m) stage. Several significant differences in the joint and segment angles were also observed across these stages.
Table 1. Differences in the kinematics of the farmers walk across the three stages.
Stage 1 (0–3 m)Stage 2 (8.5–11.5 m)Stage 3 (17–20 m)
Average velocity (m.s−1)2.41 ± 0.32 a, b3.29 ± 0.383.15 ± 0.32
Stride Length (m)1.35 ± 0.12 a, b1.67 ± 0.101.62 ± 0.16
Stride rate (Hz) 1.79 ± 0.14 a, b1.97 ± 0.131.93 ± 0.12
Ground contact time (s)0.36 ± 0.04 a, b0.30 ± 0.030.30 ± 0.04
Swing time (s)0.20 ± 0.020.21 ± 0.010.21 ± 0.02
Thigh Angle @ FS (°)32 ± 334 ± 333 ± 5
Thigh Angle @ TO (°)5 ± 4 a–4 ± 30 ± 13
Thigh ROM (°)–27 ± 5 a, b–38 ± 4–33 ± 14
Knee Angle @ FS (°)150 ± 6 a, b155 ± 6 b161 ± 10
Knee Angle @ TO (°)124 ± 7 a130 ± 8 b123 ± 11
Knee ROM (°)–24 ± 8 b–25 ± 10 b–38 ± 17
Ankle Angle @ FS (°)100 ± 8 b110 ± 9117 ± 9
Ankle Angle @ TO (°)111 ± 5114 ± 6117 ± 8
Ankle ROM (°)–12 ± 8 a, b–4 ± 70 ± 11
All data are mean ± SD. a = Significant difference to Stage 2; b = Significant difference to Stage 3; FS = foot-strike; TO = toe-off; ROM = range of motion.
Table 2. Within-subject differences in the kinematics of the fastest and slowest farmers walks’ trial for each participant at each of the three stages.
Stage 1 (0–3 m)Stage 2 (8.5–11.5 m)Stage 3 (17–20 m)
SlowestFastestSlowestFastestSlowestFastest
Average velocity (m.s−1)2.39 ± 0.292.52 ± 0.343.20 ± 0.483.33 ± 0.423.00 ± 0.493.29 ± 0.0.36
Stride Length (m)1.34 ± 0.131.38 ± 0.131.64 ± 0.111.67 ± 0.131.55 ± 0.201.71 ± 0.13
Stride rate (Hz) 1.78 ± 0.141.80 ± 0.131.94 ± 0.191.99 ± 0.101.92 ± 0.121.91 ± 0.14
Ground contact time (s)0.36 ± 0.04 *0.35 ± 0.040.30 ± 0.030.30 ± 0.030.31 ± 0.020.29 ± 0.03
Swing time (s)0.19 ± 0.020.20 ± 0.020.22 ± 0.020.20 ± 0.020.21 ± 0.020.22 ± 0.02
Thigh Angle @ FS (°)32 ± 432 ± 334 ± 434 ± 430 ± 4 *36 ± 5
Thigh Angle @ TO (°)5 ± 44 ± 5−3 ± 4−3 ± 2−2 ± 105 ± 20
Thigh ROM (°)−26 ± 4−27 ± 4−37 ± 5−37 ± 5−32 ± 10−31 ± 20
Knee Angle @ FS (°)150 ± 6150 ± 7155 ± 6155 ± 6164 ± 13159 ± 10
Knee Angle @ TO (°)124 ± 7124 ± 6128 ± 9130 ± 4124 ± 8118 ± 15
Knee ROM (°)−25 ± 8−23 ± 9−27 ± 11−25 ± 10−40 ± 18−41 ± 17
Ankle Angle @ FS (°)100 ± 8100 ± 8111 ± 7111 ± 10115 ± 10116 ± 10
Ankle Angle @ TO (°)113± 5 *108 ± 5116 ± 5113 ± 6118 ± 7114 ± 10
Ankle ROM (°)−15 ± 7−8 ± 8−5 ± 6−2 ± 6−3 ± 112 ± 14
All data are mean ± SD. * = Significant difference between slowest to fastest trials; FS = foot-strike; TO = toe-off; ROM = range of motion.
Table 3. Between-subject differences in the kinematics of the three fastest and three slowest farmers walks (irrespective of participant) at each of the three stages.
Stage 1 (0–3 m)Stage 2 (8.5–11.5 m)Stage 3 (17–20 m)
SlowestFastestSlowestFastestSlowestFastest
Average velocity (m.s−1)2.19 ± 0.272.61 ± 0.382.83 ± 0.36 *3.64 ± 0.152.56 ± 0.28 *3.66 ± 0.17
Stride Length (m)1.33 ± 0.091.38 ± 0.161.57 ± 0.12 *1.77 ± 0.031.40 ± 0.17 *1.83 ± 0.04
Stride rate (Hz) 1.64 ± 0.12 *1.88 ± 0.101.79 ± 0.10 *2.05 ± 0.051.83 ± 0.04 *2.01 ± 0.13
Ground contact time (s)0.39 ± 0.04 *0.32 ± 0.030.33 ± 0.02 *0.28 ± 0.010.34 ± 0.03 *0.29 ± 0.02
Swing time (s)0.21 ± 0.010.19 ± 0.020.22 ± 0.020.20 ± 0.000.20 ± 0.030.21 ± 0.02
Thigh Angle @ FS (°)36 ± 3 *30 ± 333 ± 437 ± 231 ± 4 *38 ± 3
Thigh Angle @ TO (°)7 ± 22 ± 5−3 ± 5−5 ± 1−4 ± 2−6 ± 3
Thigh ROM (°)−30 ± 4−27 ± 6−36 ± 4 *−42 ± 3−35 ± 6 *−44 ± 4
Knee Angle @ FS (°)151 ± 5147 ± 7159 ± 8151 ± 5166 ± 16156 ± 6
Knee Angle @ TO (°)122 ± 3124 ± 6130 ± 9127 ± 7122 ± 7128 ± 9
Knee ROM (°)−26 ± 4−21 ± 6−30 ± 9−24 ± 11−44 ± 21−28 ± 12
Ankle Angle @ FS (°)106 ± 699 ± 8113 ± 5 *101 ± 6110 ± 4113 ± 8
Ankle Angle @ TO (°)114± 3 *108 ± 4113 ± 5111 ± 7118 ± 5117 ± 7
Ankle ROM (°)−8 ± 6−10 ± 101 ± 5 *−10 ± 4−7 ± 8−3 ± 4
All data are mean ± SD. * = Significant difference between slowest to fastest trials; FS = foot-strike; TO = toe-off; ROM = range of motion.
Table 2 compares the fastest (7.71 ± 0.79 s) and slowest (8.57 ± 1.22 s) 20 m farmers walk trials from each participant so to examine the potential within-subject changes that may occur across three sets of this exercise. Very few significant differences were observed in this comparison. The only significant differences were seen with the slowest trials having more plantarflexion at toe-off in Stage 1 and the fastest trials having a greater degree of hip flexion at foot-strike in Stage 3.
Table 3 compares the three fastest (7.08 ± 0.19 s) and three slowest (9.94 ± 0.15 s) of all 15 trials, irrespective of who performed them. The slowest three trials came from the two slowest participants, with the fastest three trials from the fastest two participants. The fastest trials were generally characterised by a significantly greater average velocity, stride length and stride rate and reduced ground contact time. Fewer significant differences were observed for the joint and segment angles between the fastest and slowest trials, with these only occurring at the thigh and ankle.

4. Discussion

The current study was performed to obtain some preliminary kinematic data on the farmers walk and to gain some insight into the kinematic determinants of performance. An initial observation made was how fast the athletes performed these farmers walks while carrying a total additional load of 181 kg, a load almost twice their mean bodyweight. The average time for all 20 m farmers walks was ~8 s, with the average velocity of the middle and latter 3 m stages being ~3.6 m.s−1 (13 km.h−1). The ability of these athletes to carry such heavy loads so rapidly suggests that strength and conditioning coaches and physical rehabilitation specialists should examine the training practices of strongmen athletes to see how these principles and approaches could be applied in their specific context. Of particular interest would be how strongman training approaches could be used to improve performance, reduce injury risk and/or rehabilitate injuries for individuals in the armed forces, police and emergency fields e.g., fire-fighters, paramedics etc. This would appear of some value as members of the armed forces, police and emergency services may need to routinely carry heavy loads similar to the farmers walk or drag heavy objects such as patients in movements similar to that of the reverse sled pull [4,5]. The ability of these professionals to move such heavy loads quickly in farmers walk and reverse sled drag type movements could be the difference between the life and death of themselves or the people they are trying to rescue.
Similar to the results for resisted [7] and bodyweight sprinting [11], the middle and latter stages had significantly greater average velocities, stride lengths and stride rates and reduced ground contact time than the initial acceleration stage. Significant differences in many joint and segment angles at foot-strike and toe-off were also observed across these stages, with these characterised by a greater ROM for the thigh and knee during the middle and latter compared to the initial stages.
The within-subject analysis of each participants’ slowest vs. fastest trial generally resulted in no significant differences for any of the higher order determinants of velocity (i.e., stride length, stride rate, ground contact time, swing time) for any of the three stages. This was a little surprising as it was initially thought that some fatigue may have occurred across the three sets which would have resulted in a reduced average velocity and associated changes in stride length, stride rate, ground contact time and/or swing time. Such results therefore suggest that few kinematic changes are likely to occur in farmers walk performance when amateur strongman athletes use moderately-heavy loads over 20 m with 3 min rest periods. This may be why strongman athletes commonly perform similar numbers of sets and rest periods to what was done this study [1].
When examining the between-subject results for the three fastest and three slowest of all 15 trials (irrespective of participant), it was observed that the faster trials had significantly greater stride lengths and rates and shorter ground contact times. However, relatively few significant differences were found in the joint and segment angles at foot-strike and toe-off between the fastest and slowest trials. Based on these results and the impulse-momentum relationship, it would appear that success in the farmers walk might be related to the ability to produce high levels of anterio-posterior and vertical propulsive impulses during relatively short ground contact times. While this view would need to be supported by the results of kinetic studies, if it was found to be correct, it would suggest that the kinetic determinants of the farmers walk may be similar to sprinting, where both horizontal [11] and vertical [12] ground reaction forces/impulses appear important. While both stride length and rate appeared important in this study, one question that cannot be answered by our study is the relative importance of these two gait analysis parameters if the parameters such as the load and distance covered in the farmers walk were to differ [11].
This study was not without its limitations. One limitation was the small sample size of amateur strongman athletes, even though the total number of steps analysed was much greater due to each athlete having several steps in each of the 3 m stages. Larger sample sizes of strongman athletes of varying levels of performance (novice, amateur and professional) may also need to be employed in these studies as a variety of individual characteristics such as lower body segment lengths, range of motion and force-power-velocity characteristics as well as environmental conditions such as surface stiffness and friction may all influence the optimal interaction between stride length and rate for farmers walk performance. The placement of markers on the shoe and shorts for the toe and hip markers, respectively, was also a limitation due to the potential additional movement artefact that this may have caused.

5. Conclusions

The results of this study add to the emerging field of research examining the sport of strongman by providing the first kinematic description of various phases of a 20 m farmers walk. By also comparing the within- and between-subject fastest and slowest trials, this study also was able to provide some insight into its kinematic determinants and to the likely kinematic changes that may occur over multiple sets commonly performed by strongman athletes [1]. These results may have applications to the training emphasis of strongman athletes looking to improve their performance in this event, as well as to strength and conditioning coaches and rehabilitation specialists who may wish to use this exercise in their clients’ conditioning and/or rehabilitation programmes. For example, strongman athletes could use this data to alter their farmers walk strategy if they feel that their stride lengths or stride rates are too far from the preliminary normative data we have presented. This may be achieved by deliberately trying to change the gait pattern or by altering the task constraints, such as the distance walked, load carried, or by using subtle changes in surface incline. With respect to rehabilitation, McGill et al. [8] proposed that due to the high and varied spinal and hip abduction loads strongman exercises like the farmers walk impose on the system, that they might be very useful latter stage exercises for individuals recovering from lower back injury. Therefore, a greater understanding of the kinematics of the farmers walk will assist rehabilitation specialists better prescribe and monitor technique in these exercises. Additional studies should examine the angular kinematics, ground reaction forces, muscle activity and joint moments and powers of strongman events like the farmers walk across a larger spectrum of novice to elite performers using cross-sectional and longitudinal research designs. These studies would add much to our understanding of the acute stress that strongman exercises such as the farmers walk apply to the musculoskeletal system, their likely risk of injury [13], and their ability to promote positive adaptations in muscular hypertrophy, strength, power and endurance [14].

Acknowledgments

We would like to thank the five athletes who gave up their time to participate in this study.

Conflicts of Interest

The authors declare no conflict of interest.

References

  1. Winwood, P.W.; Keogh, J.W.L.; Harris, N.K. The strength and conditioning practices of strongman competitors. J. Strength Cond. Res. 2011, 25, 3118–3128. [Google Scholar] [CrossRef]
  2. Winwood, P.; Cronin, J.; Keogh, J.W.L.; Dudson, M.; Gill, N.D. Strongman implement use in strength and conditioning practice. Int. J. Sports Sci. Coach. 2014, in press. [Google Scholar]
  3. Zemke, B.; Wright, G. The use of strongman type implements and training to increase sport performance in collegiate athletes. Strength Cond. J. 2011, 33, 1–7. [Google Scholar] [CrossRef]
  4. Frost, D.M.; Beach, T.; Fenwick, C.; Callaghan, J.; McGill, S. Is there a low-back cost to hip-centric exercise? Quantifying the lumbar spine joint compression and shear forces during movements used to overload the hips. J. Sports Sci. 2012, 30, 859–870. [Google Scholar] [CrossRef]
  5. West, D.J.; Cunningham, D.J.; Finn, C.; Scott, P.; Crewther, B.T.; Cook, C.J.; Kilduff, L.P. The metabolic, hormonal, biochemical and neuromuscular function responses to a backward sled drag training session. J. Strength Cond. Res. 2014, 28, 265–272. [Google Scholar] [CrossRef]
  6. Keogh, J.W.L.; Payne, A.; Anderson, B.; Atkins, P. A brief description of the biomechanics and physiology of a strongman event: The tire flip. J. Strength Cond. Res. 2010, 24, 1223–1228. [Google Scholar] [CrossRef]
  7. Keogh, J.W.L.; Newlands, C.; Blewett, S.; Chun, E.-L.; Payne, A. A kinematic analysis of a strongman-type event: The heavy sprint-style sled pull. J. Strength Cond. Res. 2010, 24, 3088–3097. [Google Scholar] [CrossRef]
  8. McGill, S.M.; McDermott, A.; Fenwick, C.M.J. Comparison of different strongman events: Trunk muscle activation and lumbar spine motion, load, and stiffness. J. Strength Cond. Res. 2009, 23, 1148–1161. [Google Scholar] [CrossRef]
  9. Crowther, R.G.; Spinks, W.L.; Leicht, A.S.; Quigley, F.; Golledge, J. Relationship between temporal-spatial gait parameters, gait kinematics, walking performance, exercise capacity, and physical activity level in peripheral arterial disease. J. Vasc. Surg. 2007, 45, 1172–1178. [Google Scholar] [CrossRef]
  10. McDonald, D.A.; Delgadillo, J.Q.; Fredericson, M.; McConnell, J.; Hodgins, M.; Besier, T.F. Reliability and accuracy of a video analysis protocol to assess core ability. PMR 2011, 3, 204–211. [Google Scholar]
  11. Hunter, J.P.; Marshall, R.N.; McNair, P.J. Interaction of step length and step rate during sprint running. Med. Sci. Sports Exerc. 2004, 36, 261–271. [Google Scholar] [CrossRef]
  12. Weyand, P.G.; Sternlight, D.B.; Bellizzi, M.J.; Wright, S. Faster top running speeds are achieved with greater ground forces not more rapid leg movements. J. Appl. Physiol. 2000, 89, 1991–1999. [Google Scholar]
  13. Winwood, P.; Hume, P.A.; Keogh, J.W.L.; Cronin, J. Retrospective injury epidemiology of strongman competitors. J. Strength Cond. Res. 2014, 28, 28–42. [Google Scholar] [CrossRef]
  14. Crewther, B.; Cronin, J.; Keogh, J. Possible stimuli for strength and power adaptation: Acute mechanical responses. Sports Med. 2005, 35, 967–989. [Google Scholar] [CrossRef]

