
A Description and Comparison of Cardiorespiratory Fitness Measures in Relation to Pitching Performance Among Professional Baseball Pitchers

Abstract
:1. Introduction
2. Method, Results, Discussion
2.1. Methods
2.1.1. Experimental Approach to the Problem
2.1.2. Subjects
2.1.3. Procedures
2.1.4. Statistical Analyses
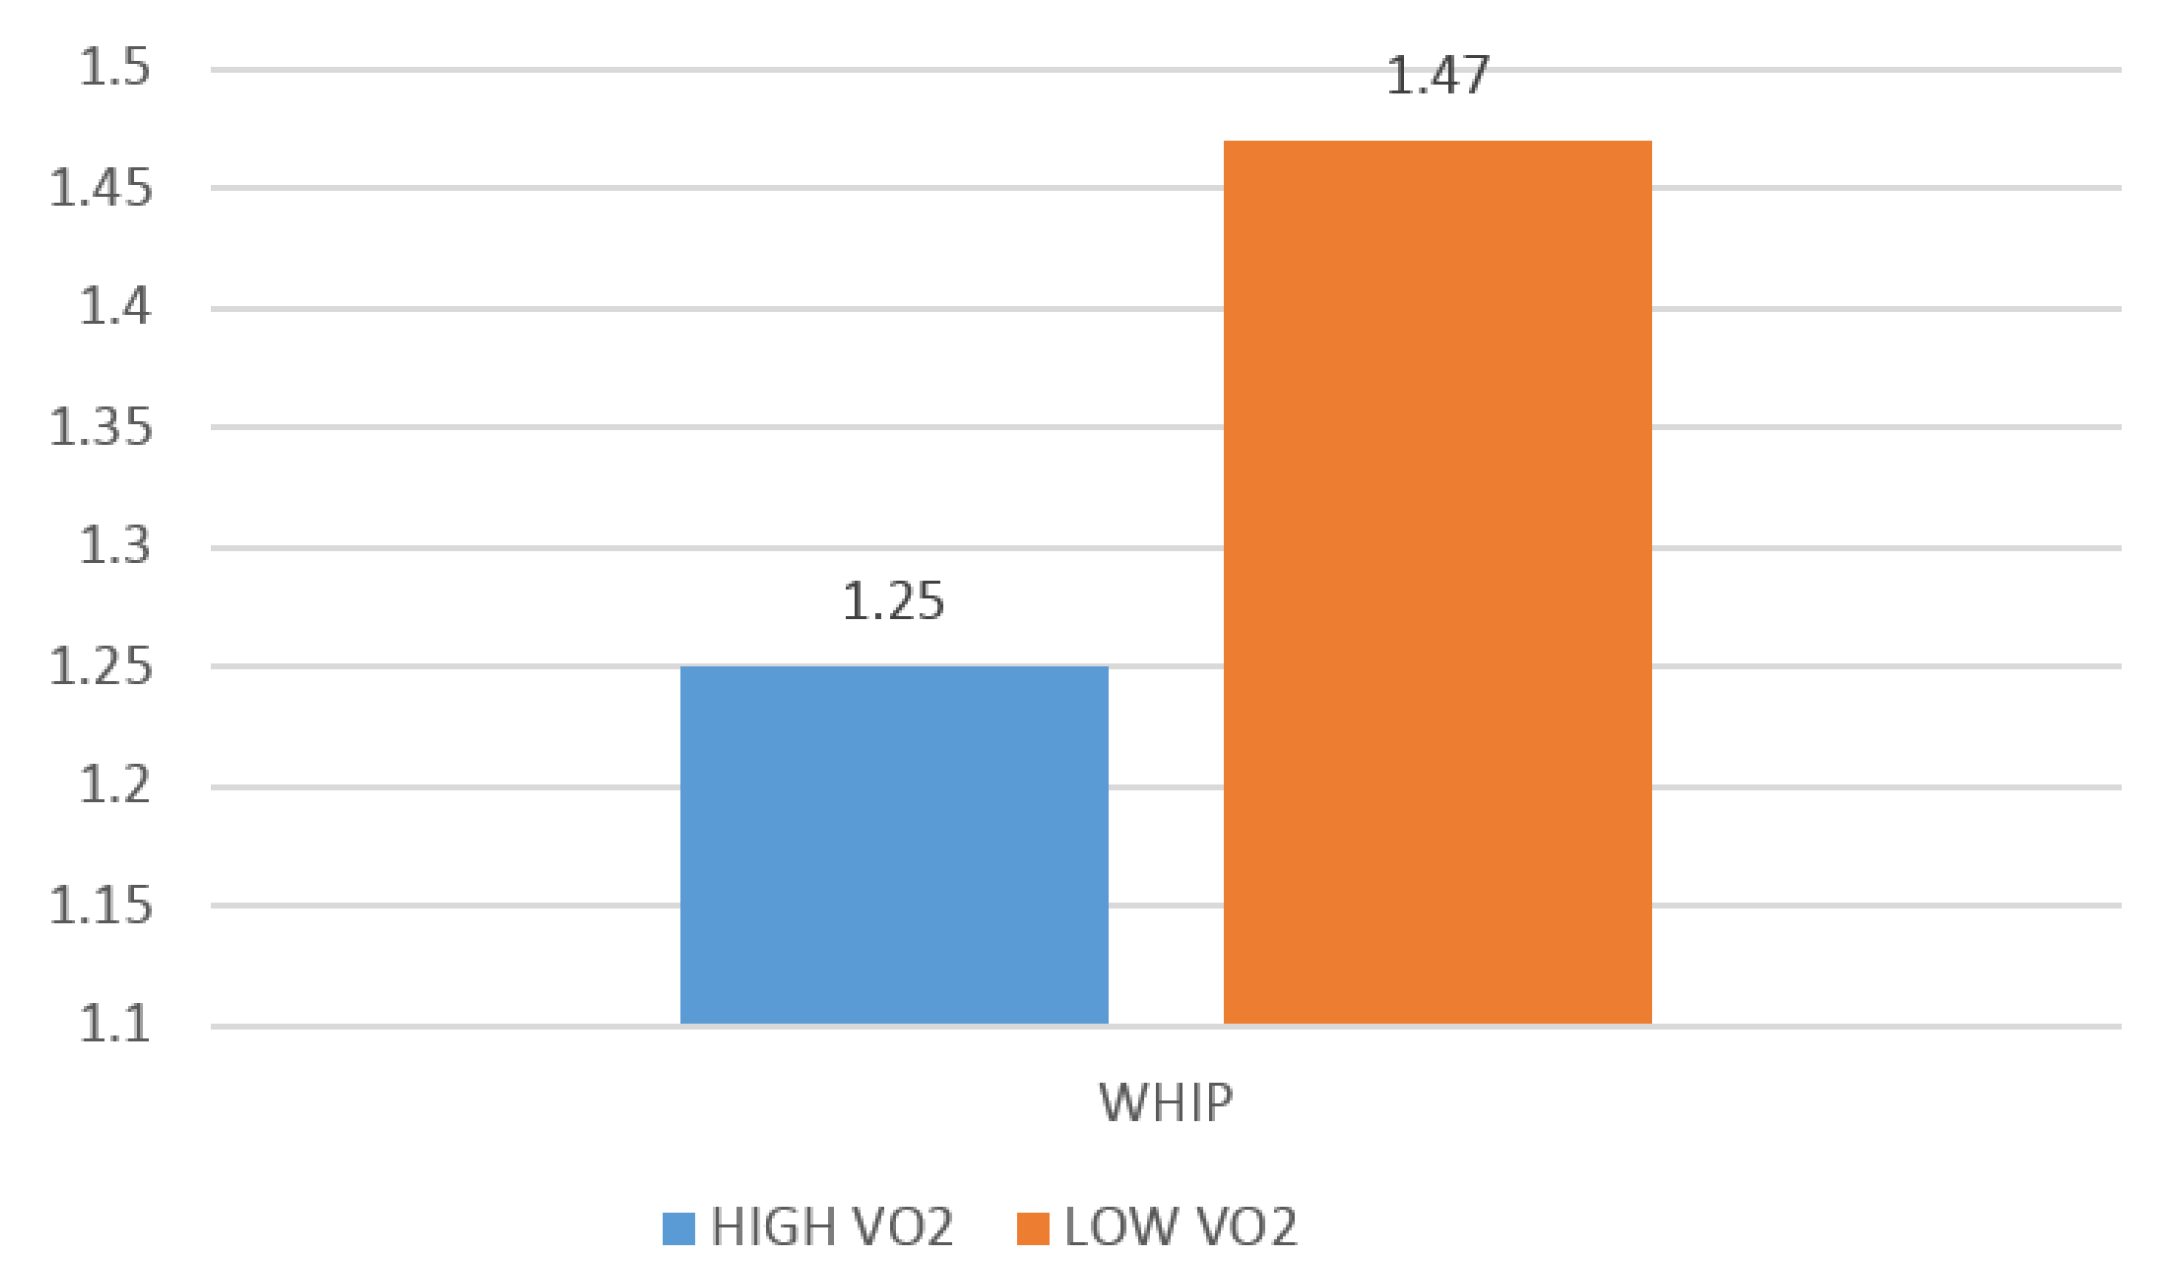
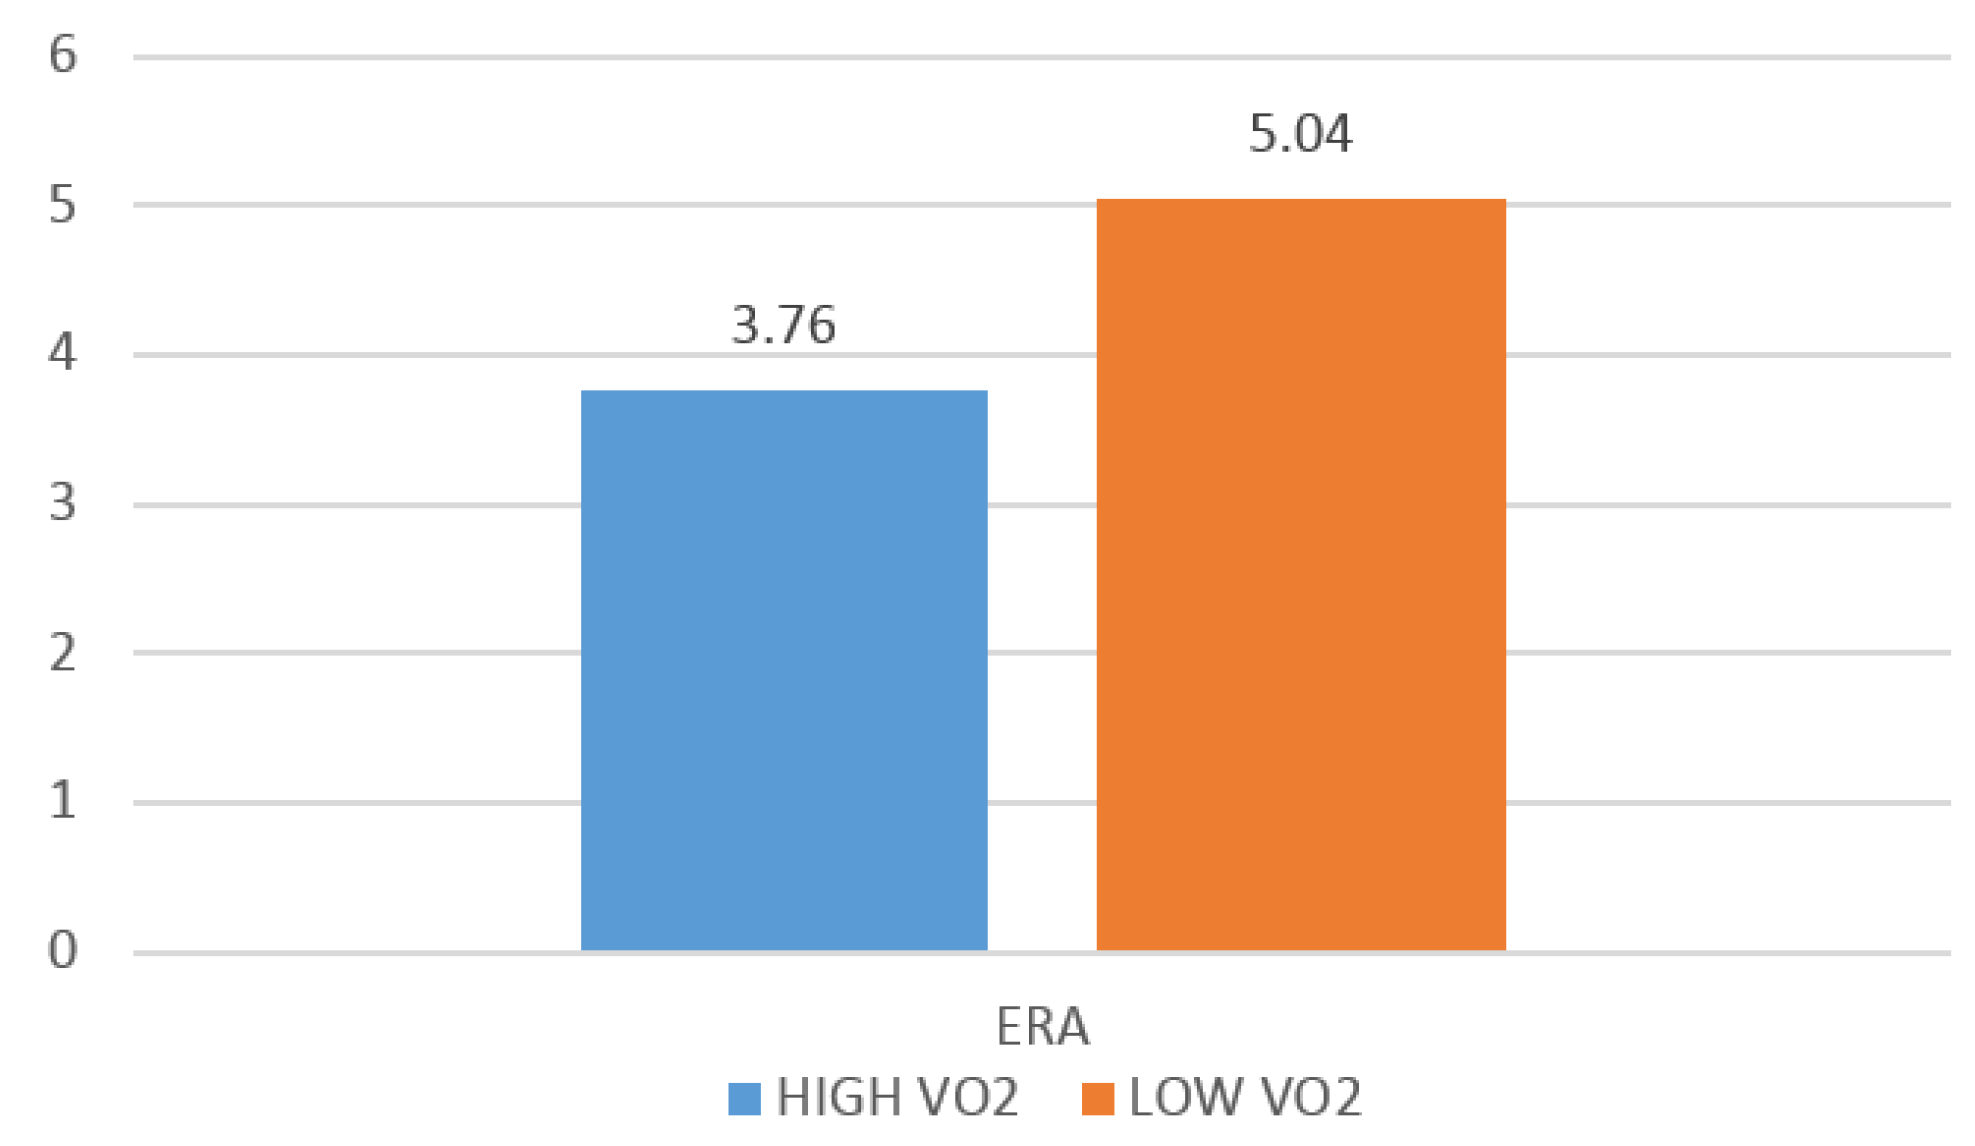
2.2. Results
2.3. Discussion
3. Conclusions
Practical Applications
Author Contributions
Conflicts of Interest
References
- Baseball Prospectus. Available online: http://www.baseballprospectus.com/sortable/index.php?cid=1667158 (accessed on 6 May 2015).
- Bradbury, J.C.; Forman, S.L. The impact of pitch counts and days of rest on performance among major-league baseball pitchers. J. Strength Cond. Res. 2012, 26, 1181–1187. [Google Scholar] [CrossRef] [PubMed]
- Szymanski, D.J.; Fredrick, G.A. College baseball/softball periodized torso program. Strength Cond. J. 1999, 22, 42–47. [Google Scholar] [CrossRef]
- Potteiger, J.; Blessing, D.; Wilson, G.D. The physiological responses to a single game of baseball pitching. J. Strength Cond. Res. 1992, 6, 11–18. [Google Scholar]
- Stockholm, A.; Morris, H. A pitcher’s heart rate during actual competition. Res. Q. Am. Assoc. Health Phys. Educ. Recreat. 1969, 40, 645–649. [Google Scholar]
- Szymanski, D.J.; Myres, R.L. Heart rate responses of collegiate baseball pitchers while pitching and conditioning. J. Strength Cond. Res. 2007, 21, e28. [Google Scholar]
- Syzmanski, D. Collegiate baseball in-season training. Strength Cond. J. 2007, 29, 68–80. [Google Scholar] [CrossRef]
- Szymanski, D. Physiology of baseball pitching dictates specific exercise intensity for conditioning. Strength Cond. J. 2009, 31, 41–47. [Google Scholar] [CrossRef]
- Tomlin, D.L.; Wenger, H. The relationship between aerobic fitness and recovery from high intensity intermittent exercise. Sports Med. 2001, 31, 1–11. [Google Scholar] [CrossRef] [PubMed]
- Tripp, B.; Boswell, L.; Gansneder, B.; Shultz, S. Functional fatigue decreases 3-dimensional multi-joint position reproduction acuity in the overhead-throwing athlete. J. Athl. Train. 2004, 39, 316–320. [Google Scholar] [PubMed]
- Tripp, B.L.; Yochem, E.M.; Uhl, T.L. Functional fatigue and upper extremity sensorimotor system acuity in baseball athletes. J. Athl. Train. 2007, 42, 90–98. [Google Scholar] [PubMed]
- Van Wessel, T.; de Haan, A.; Van der Laarse, W.; Jaspers, R. The muscle fiber type–fiber size paradox: Hypertrophy or oxidative metabolism? Eur. J. Appl. Physiol. 2010, 110, 665–694. [Google Scholar] [CrossRef] [PubMed] [Green Version]
- Yang, S.W. Assessment of professional baseball players aerobic exercise performance depending on their positions. J. Strength Cond. Res. 2014, 28, 3289–3292. [Google Scholar] [CrossRef] [PubMed]
- Ebben, W.; Hintz, M.; Simenz, C. Strength and conditioning practices of major league baseball strength and conditioning coaches. J. Strength Cond. Res. 2005, 19, 538–546. [Google Scholar] [PubMed]
- Dieli-Conwright, C.M.; Jensky, N.E.; Battaglia, G.; McCauley, S.; Schroeder, E.T. Validation of the CardioCoachCO2 for submaximal and maximal metabolic exercise testing. J. Strength Cond. Res. 2009, 23, 1316–1320. [Google Scholar] [CrossRef] [PubMed]
- Yuhasz, M.S. Physical Fitness Manual; University of Western Ontario: London, Canada, 1974. [Google Scholar]
- Sports Reference, LLC, 2013. Available online: www.baseball-reference.com (accessed on 6 May 2015).
- ESPN MLB. Available online: http://espn.go.com/mlb/ (accessed on 6 May 2015).
- FanGraphs. Available online: www.fangraphs.com or http://www.espn.go.com/mlb/stats/pitching/_/league/nl/sort/pitches/type/expanded-2 (accessed on 6 May 2015).
- Rhea, M.; Bunker, D. Baseball-specific conditioning. Int. J. Sports Physiol. Perform. 2009, 4, 402–407. [Google Scholar] [PubMed]
- Rhea, M.; Oliverson, J.; Kenn, J.; Naclerio, F. Non-compatibility of power and endurance training among college baseball players. J Strength Cond. Res. 2008, 22, 230–234. [Google Scholar] [CrossRef] [PubMed]


| Anthropometric and Fitness Variables | All Pitchers (n = 40) Mean ± SD | S Pitchers (n = 27) Mean ± SD | R Pitchers (n = 13) Mean ± SD |
|---|---|---|---|
| Age (YEARS) | 28.03 ± 5.17 | 27.33 ± 5.46 | 29.46 ± 4.31 |
| Weight (KG) | 100.06 ± 6.80 | 99.27 ± 5.75 | 101.75 ± 8.59 |
| Height (CM) | 191.19 ± 5.11 | 192.28 ± 5.00 | 188.92 ± 4.80 |
| Estimated Percent Body fat (%BF) | 15.28 ± 3.45 | 14.21 ± 2.45 | 17.5 ± 4.2 |
| Lean BODY mass (lBM) (KG) | 84.63 ± 4.54 | 85.07 ± 3.85 | 83.72 ± 5.79 |
| Estimated Max. Heart Rate (HR) | 191.98 ± 5.16 | 192.66 ± 5.46 | 190.53 ± 4.31 |
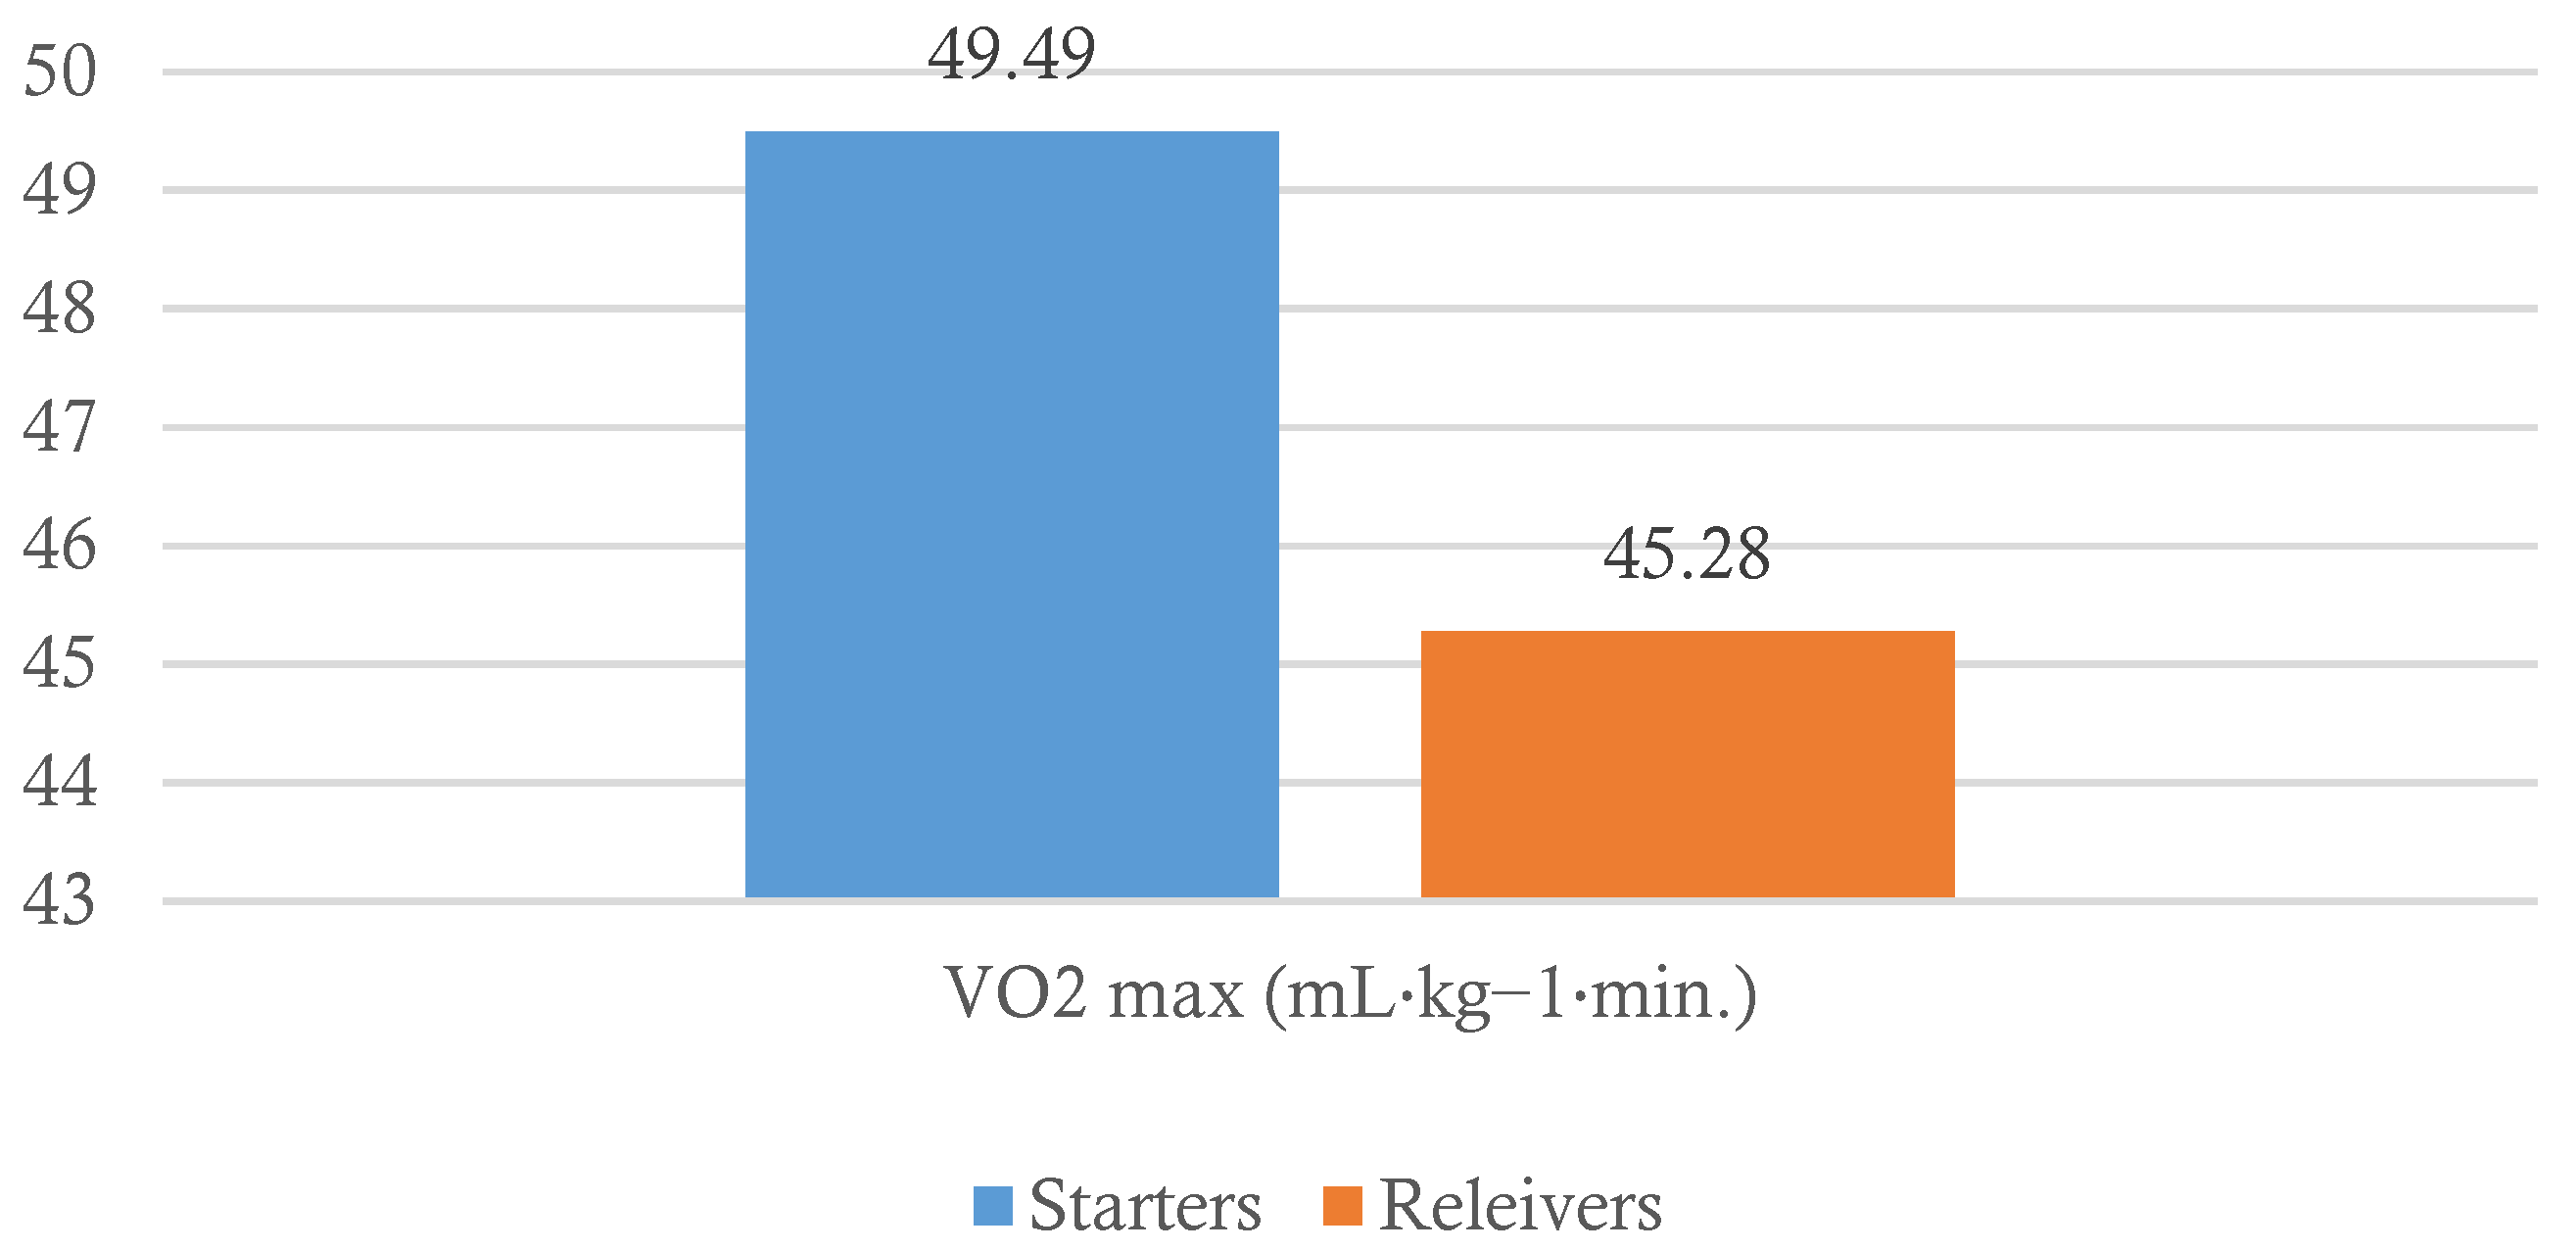
| VO2 max (mL·kg−1·min.) | 48.13 ± 5.30 | 49.49 ± 4.59 | 45.28 ± 5.71 |
| Anaerobic threshold (AT) | 37.31 ± 7.87 | 38.63 ± 7.03 | 34.57 ± 9.06 |
| HR at VO2 max | 184.28 ± 9.70 | 182.33 ± 9.06 | 188.31 ± 10.09 |
| HR at Anaerobic Threshold | 162.72 ± 13.83 | 161.11 ± 11.97 | 166.08 ± 17.13 |
© 2016 by the authors; licensee MDPI, Basel, Switzerland. This article is an open access article distributed under the terms and conditions of the Creative Commons by Attribution (CC-BY) license (http://creativecommons.org/licenses/by/4.0/).
Share and Cite
Gillett, J.S.; Dawes, J.J.; Spaniol, F.J.; Rhea, M.R.; Rogowski, J.P.; Magrini, M.A.; Simao, R.; Bunker, D.J. A Description and Comparison of Cardiorespiratory Fitness Measures in Relation to Pitching Performance Among Professional Baseball Pitchers. Sports 2016, 4, 14. https://0-doi-org.brum.beds.ac.uk/10.3390/sports4010014
Gillett JS, Dawes JJ, Spaniol FJ, Rhea MR, Rogowski JP, Magrini MA, Simao R, Bunker DJ. A Description and Comparison of Cardiorespiratory Fitness Measures in Relation to Pitching Performance Among Professional Baseball Pitchers. Sports. 2016; 4(1):14. https://0-doi-org.brum.beds.ac.uk/10.3390/sports4010014
Chicago/Turabian StyleGillett, Javair S., J. Jay Dawes, Frank J. Spaniol, Matthew R. Rhea, Joe P. Rogowski, Mitchel A. Magrini, Roberto Simao, and Derek J. Bunker. 2016. "A Description and Comparison of Cardiorespiratory Fitness Measures in Relation to Pitching Performance Among Professional Baseball Pitchers" Sports 4, no. 1: 14. https://0-doi-org.brum.beds.ac.uk/10.3390/sports4010014