
Offseason Body Composition Changes Detected by Dual-Energy X-ray Absorptiometry versus Multifrequency Bioelectrical Impedance Analysis in Collegiate American Football Athletes

 , ,
, ,
Abstract
:1. Introduction
2. Materials and Methods
2.1. Subjects
2.2. Procedures
2.3. Offseason Program
2.4. Body Composition Assessment
2.5. Performance Assessment
2.6. Statistical Analysis
3. Results
4. Discussion
5. Conclusions
Author Contributions
Funding
Institutional Review Board Statement
Informed Consent Statement
Data Availability Statement
Acknowledgments
Conflicts of Interest
References
- Binkley, T.L.; Daughters, S.W.; Weidauer, L.A.; Vukovich, M.D. Changes in Body Composition in Division I Football Players Over a Competitive Season and Recovery in Off-Season. J. Strength Cond. Res. 2015, 29, 2503–2512. [Google Scholar] [CrossRef]
- Kim, J.; Delisle-Houde, P.; Reid, R.E.R.; Andersen, R.E. Longitudinal Changes in Body Composition Throughout Successive Seasonal Phases among Canadian University Football Players. J. Strength Cond. Res. 2018, 32, 2284–2293. [Google Scholar] [CrossRef]
- Trexler, E.T.; Smith-Ryan, A.E.; Blue, M.N.M.; Schumacher, R.M.; Mayhew, J.L.; Mann, J.B.; Ivey, P.A.; Hirsch, K.R.; Mock, M.G. Fat-Free Mass Index in NCAA Division I and II Collegiate American Football Players. J. Strength Cond. Res. 2017, 31, 2719–2727. [Google Scholar] [CrossRef] [PubMed]
- Fry, A.C.; Kraemer, W.J. Physical Performance Characteristics of American Collegiate Football Players. J. Strength Cond. Res. 1991, 5, 126–138. [Google Scholar]
- Hoffman, J.R. The Applied Physiology of American Football. Int. J. Sports Physiol. Perform. 2008, 3, 387–392. [Google Scholar] [CrossRef] [PubMed] [Green Version]
- Byrd, M.T.; Switalla, J.R.; Eastman, J.E.; Wallace, B.J.; Clasey, J.L.; Bergstrom, H.C. Contributions of Body-Composition Characteristics to Critical Power and Anaerobic Work Capacity. Int. J. Sports Physiol. Perform. 2018, 13, 189–193. [Google Scholar] [CrossRef] [PubMed]
- Suarez-Arrones, L.; Saez de Villarreal, E.; Núñez, F.J.; Di Salvo, V.; Petri, C.; Buccolini, A.; Maldonado, R.A.; Torreno, N.; Mendez-Villanueva, A. In-Season Eccentric-Overload Training in Elite Soccer Players: Effects on Body Composition, Strength and Sprint Performance. PLoS ONE 2018, 13, e0205332. [Google Scholar] [CrossRef]
- Garstecki, M.A.; Latin, R.W.; Cuppett, M.M. Comparison of Selected Physical Fitness and Performance Variables between NCAA Division I and II Football Players. J. Strength Cond. Res. 2004, 18, 292. [Google Scholar]
- Black, W.; Roundy, E. Comparisons of Size, Strength, Speed, and Power in NCAA Division 1-A Football Players. J. Strength Cond. Res. 1994, 8, 80. [Google Scholar]
- Gupta, N.; Balasekaran, G.; Victor Govindaswamy, V.; Hwa, C.Y.; Shun, L.M. Comparison of Body Composition with Bioelectric Impedance (BIA) and Dual Energy X-ray Absorptiometry (DEXA) among Singapore Chinese. J. Sci. Med. Sport 2011, 14, 33–35. [Google Scholar] [CrossRef]
- Jebb, S.A.; Siervo, M.; Murgatroyd, P.R.; Evans, S.; Frühbeck, G.; Prentice, A.M. Validity of the Leg-to-Leg Bioimpedance to Estimate Changes in Body Fat during Weight Loss and Regain in Overweight Women: A Comparison with Multi-Compartment Models. Int. J. Obes. 2007, 31, 756–762. [Google Scholar] [CrossRef] [Green Version]
- Thomson, R.; Brinkworth, G.D.; Buckley, J.D.; Noakes, M.; Clifton, P.M. Good Agreement between Bioelectrical Impedance and Dual-Energy X-ray Absorptiometry for Estimating Changes in Body Composition during Weight Loss in Overweight Young Women. Clin. Nutr. 2007, 26, 771–777. [Google Scholar] [CrossRef]
- Frisard, M.I.; Greenway, F.L.; DeLany, J.P. Comparison of Methods to Assess Body Composition Changes during a Period of Weight Loss. Obes. Res. 2005, 13, 845–854. [Google Scholar] [CrossRef] [PubMed] [Green Version]
- Hendel, H.W.; Gotfredsen, A.; Højgaard, L.; Andersen, T.; Hilsted, J. Change in Fat-Free Mass Assessed by Bioelectrical Impedance, Total Body Potassium and Dual Energy X-ray Absorptiometry during Prolonged Weight Loss. Scand. J. Clin. Lab. Investig. 1996, 56, 671–679. [Google Scholar] [CrossRef] [PubMed]
- Verdich, C.; Barbe, P.; Petersen, M.; Grau, K.; Ward, L.; Macdonald, I.; Sørensen, T.I.A.; Oppert, J.-M. Changes in Body Composition during Weight Loss in Obese Subjects in the NUGENOB Study: Comparison of Bioelectrical Impedance vs. Dual-energy X-ray Absorptiometry. Diabetes Metab. 2011, 37, 222–229. [Google Scholar] [CrossRef] [PubMed]
- Schoenfeld, B.J.; Nickerson, B.S.; Wilborn, C.D.; Urbina, S.L.; Hayward, S.B.; Krieger, J.; Aragon, A.A.; Tinsley, G.M. Comparison of Multifrequency Bioelectrical Impedance vs. Dual-Energy X-ray Absorptiometry for Assessing Body Composition Changes After Participation in a 10-Week Resistance Training Program. J. Strength Cond. Res. 2020, 34, 678–688. [Google Scholar] [CrossRef]
- Tinsley, G.M.; Moore, M.L. Body Fat Gain and Loss Differentially Influence Validity of Dual-Energy X-ray Absorptiometry and Multifrequency Bioelectrical Impedance Analysis during Simultaneous Fat-Free Mass Accretion. Nutr. Res. 2020, 75, 44–55. [Google Scholar] [CrossRef] [PubMed]
- Trexler, E.T.; Smith-Ryan, A.E.; Mann, J.B.; Ivey, P.A.; Hirsch, K.R.; Mock, M.G. Longitudinal Body Composition Changes in NCAA Division I College Football Players. J. Strength Cond. Res. 2017, 31, 1–8. [Google Scholar] [CrossRef] [Green Version]
- Hartmann Nunes, R.F.; de Souza Bezerra, E.; Orssatto, L.B.; Moreno, Y.M.; Loturco, I.; Duffield, R.; Silva, D.A.; Guglielmo, L.G. Assessing Body Composition in Rugby Players: Agreement between Different Methods and Association with Physical Performance. J. Sports Med. Phys. Fit. 2020, 60, 733–742. [Google Scholar] [CrossRef]
- Weir, J.P. Quantifying Test-Retest Reliability Using the Intraclass Correlation Coefficient and the Sem. J. Strength Cond. Res. 2005, 19, 231–240. [Google Scholar] [PubMed]
- Singmann, H.; Bolker, B.; Westfall, J.; Aust, F.; Ben-Shachar, M.S. afex: Analysis of Factorial Experiments. Available online: https://CRAN. R-project. org/package= afex (accessed on 4 June 2020).
- Peterson, R.A.; Cavanaugh, J.E. Ordered Quantile Normalization: A Semiparametric Transformation Built for the Cross-Validation Era. J. Appl. Stat. 2019, 47, 2312–2327. [Google Scholar] [CrossRef]
- Lenth, R. emmeans: Estimated Marginal Means, aka Least-Squares Means. Available online: https://CRAN.R-project.org/package=emmeans (accessed on 8 July 2020).
- Lawrence, I.K.L. A Concordance Correlation Coefficient to Evaluate Reproducibility. Biometrics 1989, 45, 255–268. [Google Scholar] [CrossRef]
- Signorell, A.; Aho, K.; Alfons, A.; Anderegg, N.; Aragon, T.; Arachchige, C.; Arppe, A.; Baddeley, A.; Barton, K.; Bolker, B.; et al. DescTools: Tools for Descriptive Statistics. Available online: https://cran.r-project.org/package=DescTools (accessed on 17 June 2021).
- Bland, J.M.; Altman, D.G. Statistical Methods for Assessing Agreement between Two Methods of Clinical Measurement. Lancet 1986, 1, 307–310. [Google Scholar] [CrossRef]
- Wickham, H. ggplot2: Elegant Graphics for Data Analysis; Springer: New York, NY, USA, 2016. [Google Scholar]
- Currier, B.S.; Harty, P.S.; Zabriskie, H.A.; Stecker, R.A.; Moon, J.M.; Jagim, A.R.; Kerksick, C.M. Fat-Free Mass Index in a Diverse Sample of Male Collegiate Athletes. J. Strength Cond Res. 2019, 33, 1474–1479. [Google Scholar] [CrossRef]
- Kouri, E.M.; Pope, H.G., Jr.; Katz, D.L.; Oliva, P. Fat-Free Mass Index in Users and Nonusers of Anabolic-Androgenic Steroids. Clin. J. Sport Med. 1995, 5, 223–228. [Google Scholar] [CrossRef] [PubMed]
- Cousineau, D.; O’Brien, F. Error Bars in within-Subject Designs: A Comment on Baguley (2012). Behav. Res. Methods 2014, 46, 1149–1151. [Google Scholar] [CrossRef] [PubMed]
- Raymond, C.J.; Dengel, D.R.; Bosch, T.A. Total and Segmental Body Composition Examination in Collegiate Football Players Using Multifrequency Bioelectrical Impedance Analysis and Dual X-ray Absorptiometry. J. Strength Cond. Res. 2018, 32, 772–782. [Google Scholar] [CrossRef] [PubMed]
- Shepherd, J.A.; Fan, B.; Lu, Y.; Wu, X.P.; Wacker, W.K.; Ergun, D.L.; Levine, M.A. A Multinational Study to Develop Universal Standardization of Whole-Body Bone Density and Composition Using GE Healthcare Lunar and Hologic DXA Systems. J. Bone Mineral. Res. 2012, 27, 2208–2216. [Google Scholar] [CrossRef]
- Shields, C.L., Jr.; Whitney, F.E.; Zomar, V.D. Exercise Performance of Professional Football Players. Am. J. Sports Med. 1984, 12, 455–459. [Google Scholar] [CrossRef] [PubMed]
- Miller, T.A.; White, E.D.; Kinley, K.A.; Congleton, J.J.; Clark, M.J. The Effects of Training History, Player Position, and Body Composition on Exercise Performance in Collegiate Football Players. J. Strength Cond Res. 2002, 16, 44–49. [Google Scholar] [PubMed]
- Tinsley, G.M. Five-Component Model Validation of Reference, Laboratory, and Field Methods of Body Composition Assessment. Br. J. Nutr 2020. [Google Scholar] [CrossRef]
- Shepherd, J.A.; Ng, B.K.; Sommer, M.J.; Heymsfield, S.B. Body Composition by DXA. Bone 2017, 104, 101–105. [Google Scholar] [CrossRef] [PubMed]
- Kyle, U.G.; Bosaeus, I.; De Lorenzo, A.D.; Deurenberg, P.; Elia, M.; Gómez, J.M.; Heitmann, B.L.; Kent-Smith, L.; Melchior, J.C.; Pirlich, M.; et al. Bioelectrical Impedance Analysis—Part I: Review of Principles and Methods. Clin. Nutr 2004, 23, 1226–1243. [Google Scholar] [CrossRef]
- Brewer, G.J.; Blue, M.N.M.; Hirsch, K.R.; Peterjohn, A.M.; Smith-Ryan, A.E. Appendicular Body Composition Analysis: Validity of Bioelectrical Impedance Analysis Compared With Dual-Energy X-Ray Absorptiometry in Division I College Athletes. J. Strength Cond Res. 2019, 33, 2920–2925. [Google Scholar] [CrossRef] [PubMed]
- Wingo, B.C.; Barry, V.G.; Ellis, A.C.; Gower, B.A. Comparison of Segmental Body Composition Estimated by Bioelectrical Impedance Analysis and Dual-Energy X-ray Absorptiometry. Clin. Nutr. ESPEN 2018, 28, 141–147. [Google Scholar] [CrossRef] [PubMed]
- Esco, M.R.; Snarr, R.L.; Leatherwood, M.D.; Chamberlain, N.A.; Redding, M.L.; Flatt, A.A.; Moon, J.R.; Williford, H.N. Comparison of Total and Segmental Body Composition Using DXA and Multifrequency Bioimpedance in Collegiate Female Athletes. J. Strength Cond Res. 2015, 29, 918–925. [Google Scholar] [CrossRef]
- Nickerson, B.S. Agreement between Single-Frequency Bioimpedance Analysis and Dual Energy X-ray Absorptiometry Varies Based on Sex and Segmental Mass. Nutr Res. 2018, 54, 33–39. [Google Scholar] [CrossRef]
- Stratton, M.T.; Smith, R.W.; Harty, P.S.; Rodriguez, C.; Johnson, B.A.; Dellinger, J.R.; Williams, A.D.; White, S.J.; Benavides, M.L.; Tinsley, G.M. Longitudinal Agreement of Four Bioimpedance Analyzers for Detecting Changes in Raw Bioimpedance during Purposeful Weight Gain with Resistance Training. Eur. J. Clin. Nutr. 2021, 75, 1060–1068. [Google Scholar] [CrossRef] [PubMed]
- Tinsley, G.M.; Moore, M.L.; Silva, A.M.; Sardinha, L.B. Cross-Sectional and Longitudinal Agreement between Two Multifrequency Bioimpedance Devices for Resistance, Reactance, and Phase Angle Values. Eur. J. Clin. Nutr 2020, 74, 900–911. [Google Scholar] [CrossRef] [PubMed]
- Smith, R.W.; Harty, P.S.; Stratton, M.T.; Rafi, Z.; Rodriguez, C.; Dellinger, J.R.; Benavides, M.L.; Johnson, B.A.; White, S.J.; Williams, A.D.; et al. Predicting Adaptations to Resistance Training Plus Overfeeding Using Bayesian Regression: A Preliminary Investigation. J. Funct. Morphol. Kinesiol. 2021, 6, 36. [Google Scholar] [CrossRef] [PubMed]
- Dhurandhar, N.V.; Schoeller, D.; Brown, A.W.; Heymsfield, S.B.; Thomas, D.; Sørensen, T.I.; Speakman, J.R.; Jeansonne, M.; Allison, D.B. Energy Balance Measurement: When Something Is Not Better Than Nothing. Int. J. Obes. (Lond.) 2015, 39, 1109–1113. [Google Scholar] [CrossRef] [PubMed] [Green Version]


| n | Base | Post | Δ | p | |
|---|---|---|---|---|---|
| Bench Press 1 RM (kg) | 19 | 119.3 ± 18.6 | 125.5 ± 19.8 | 6.2 ± 4.5 | <0.001 * |
| Bench Press Reps @ 225 | 17 | 6.4 ± 6.3 | 9.3 ± 7.1 | 2.9 ± 2.5 | <0.001 * |
| Incline Bench Press 1 RM (kg) | 18 | 100.0 ± 16.2 | 105.6 ± 14.0 | 5.6 ± 6.7 | 0.003 * |
| Back Squat 1 RM (kg) | 17 | 177.7 ± 34.5 | 191.4 ± 33.5 | 13.8 ± 11.9 | <0.001 * |
| Front Squat 1 RM (kg) | 18 | 141.0 ± 22.5 | 154.4 ± 25.3 | 13.4 ± 7.4 | <0.001 * |
| Hang Clean 3 RM (kg) | 16 | 99.6 ± 10.9 | 103.1 ± 10.9 | 3.6 ± 4.2 | 0.004 * |
| 40 Yard Dash (s) | 19 | 5.0 ± 0.3 | 4.8 ± 0.2 | −0.2 ± 0.2 | <0.001 * |
| Broad Jump (m) | 17 | 2.6 ± 0.2 | 2.6 ± 0.2 | 0.0 ± 0.11 | 0.42 |
| Vertical Jump (cm) | 17 | 54.6 ± 13.6 | 63.1 ± 7.3 | 8.4 ± 12.6 | 0.01 * |
| Pro Agility Shuttle (s) | 18 | 4.6 ± 0.3 | 4.6 ± 0.3 | 0.0 ± 0.2 | 0.74 |
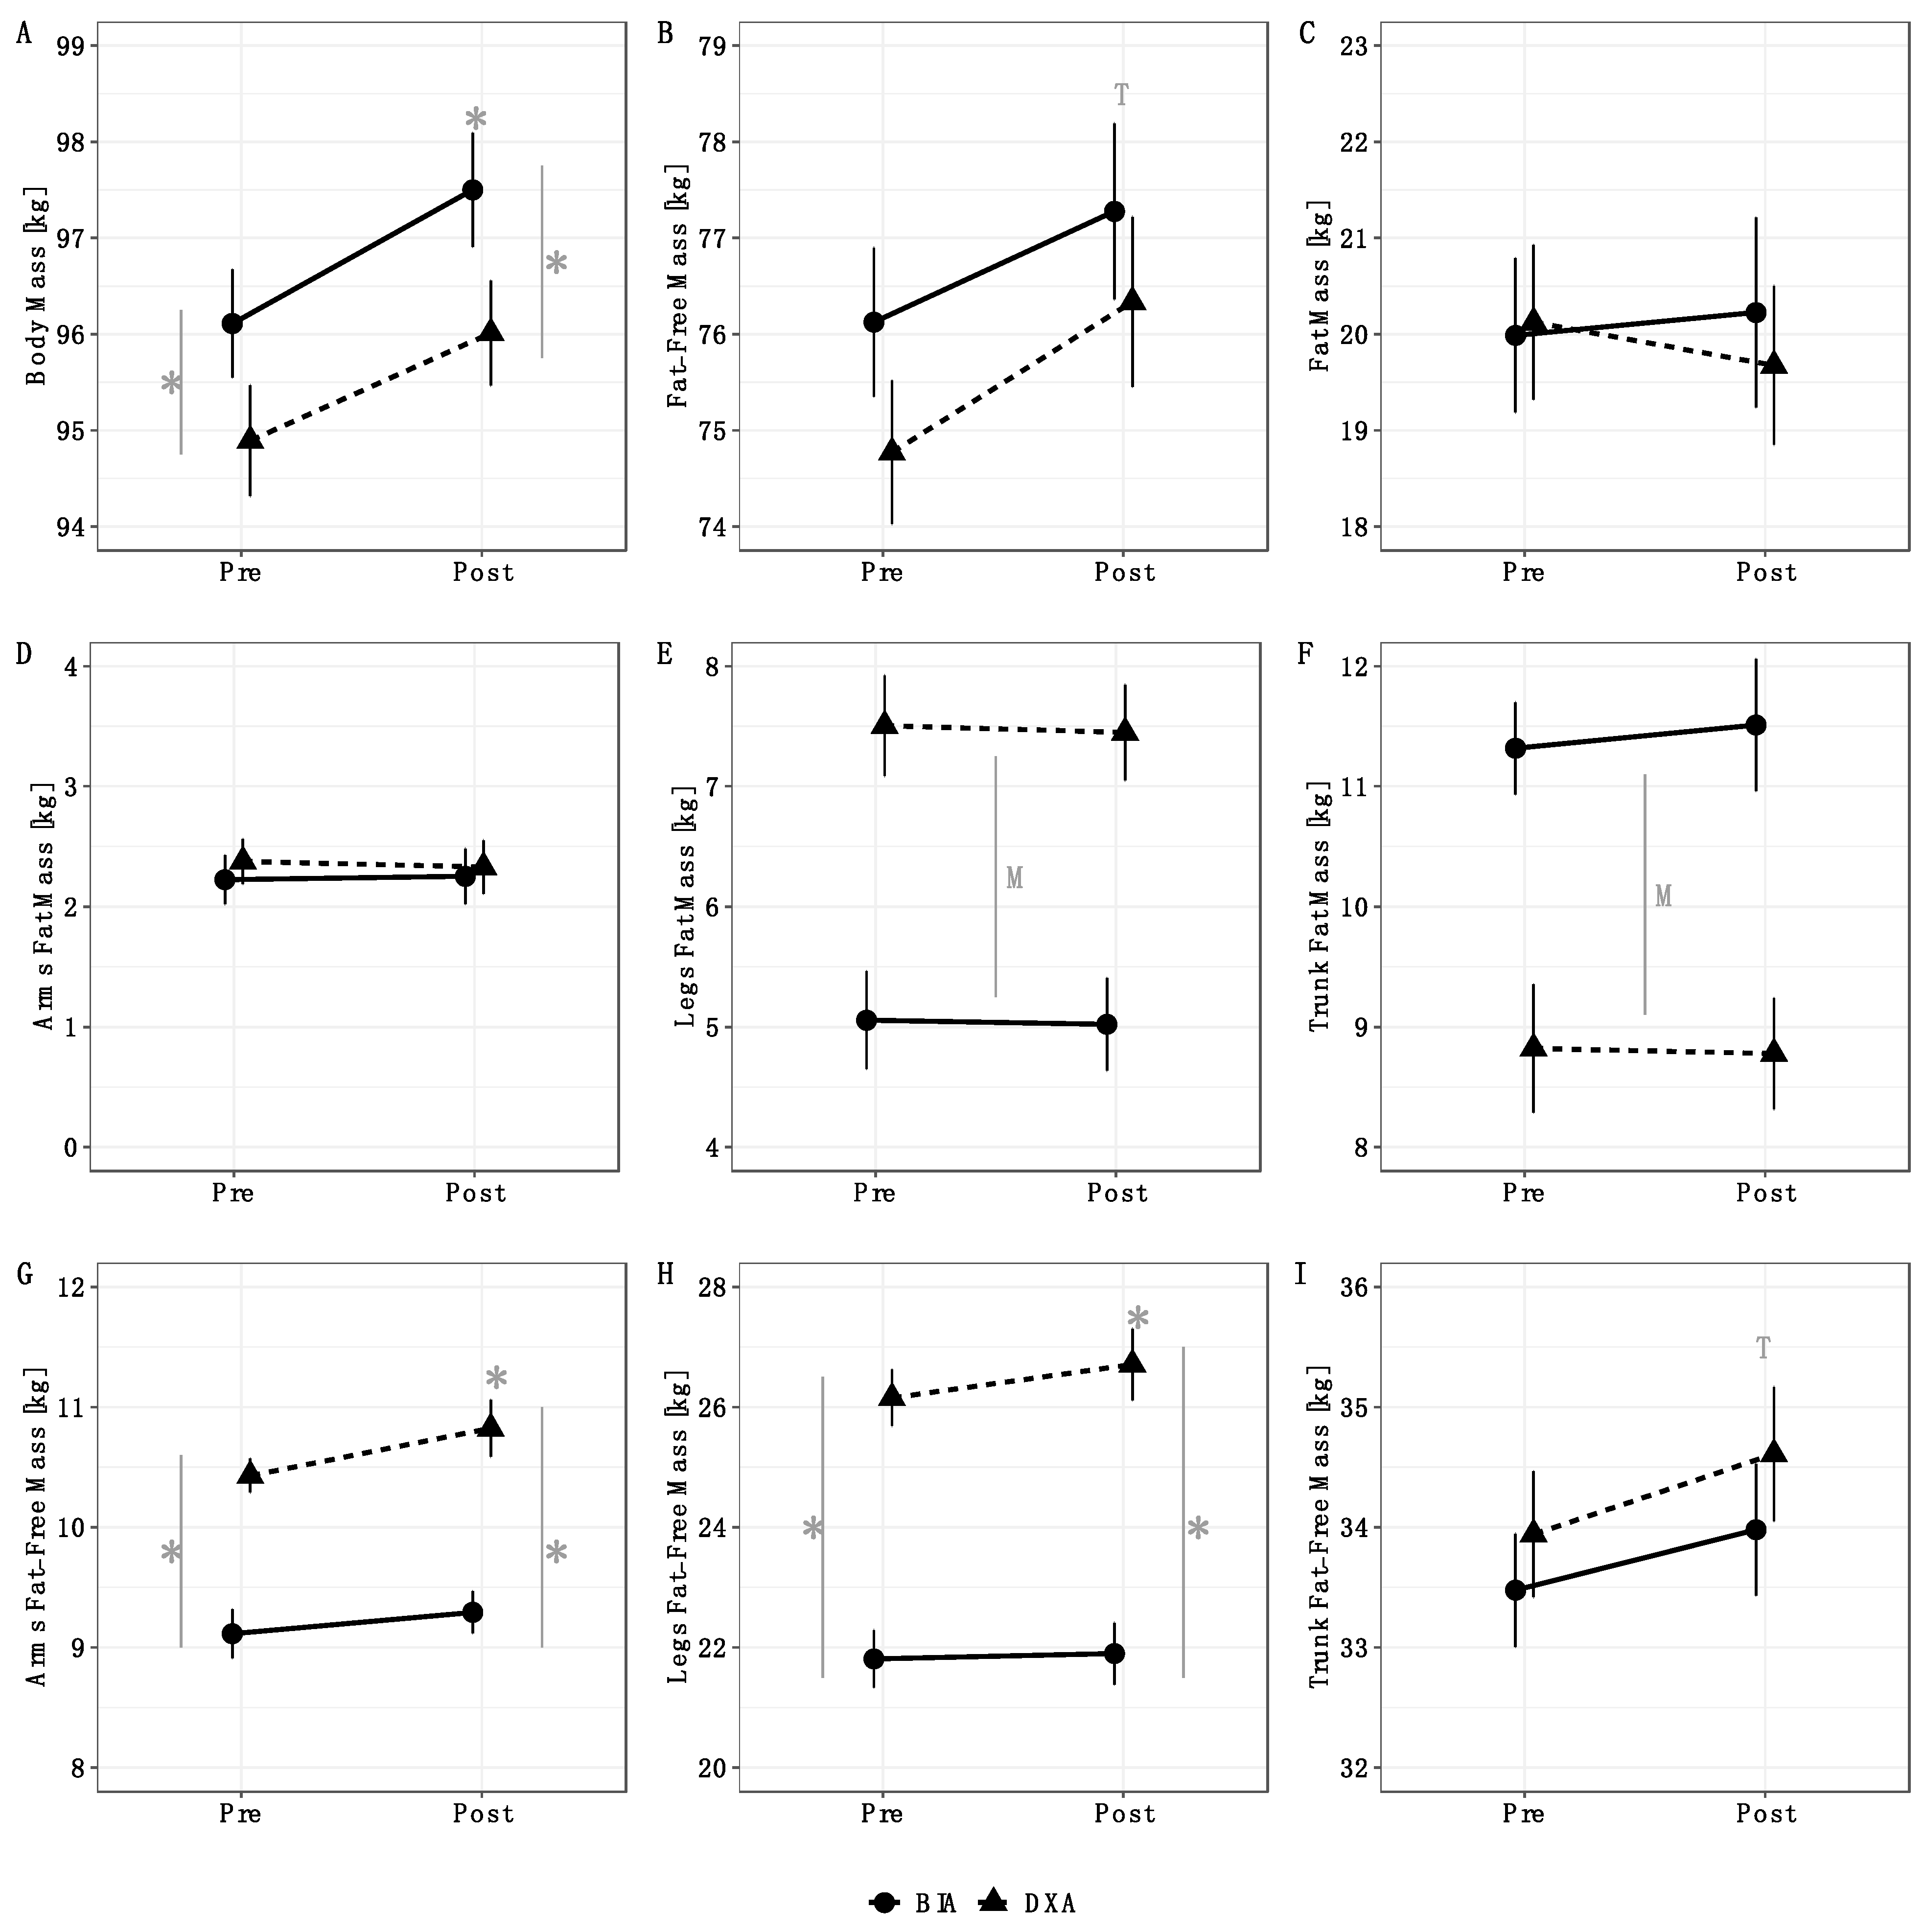
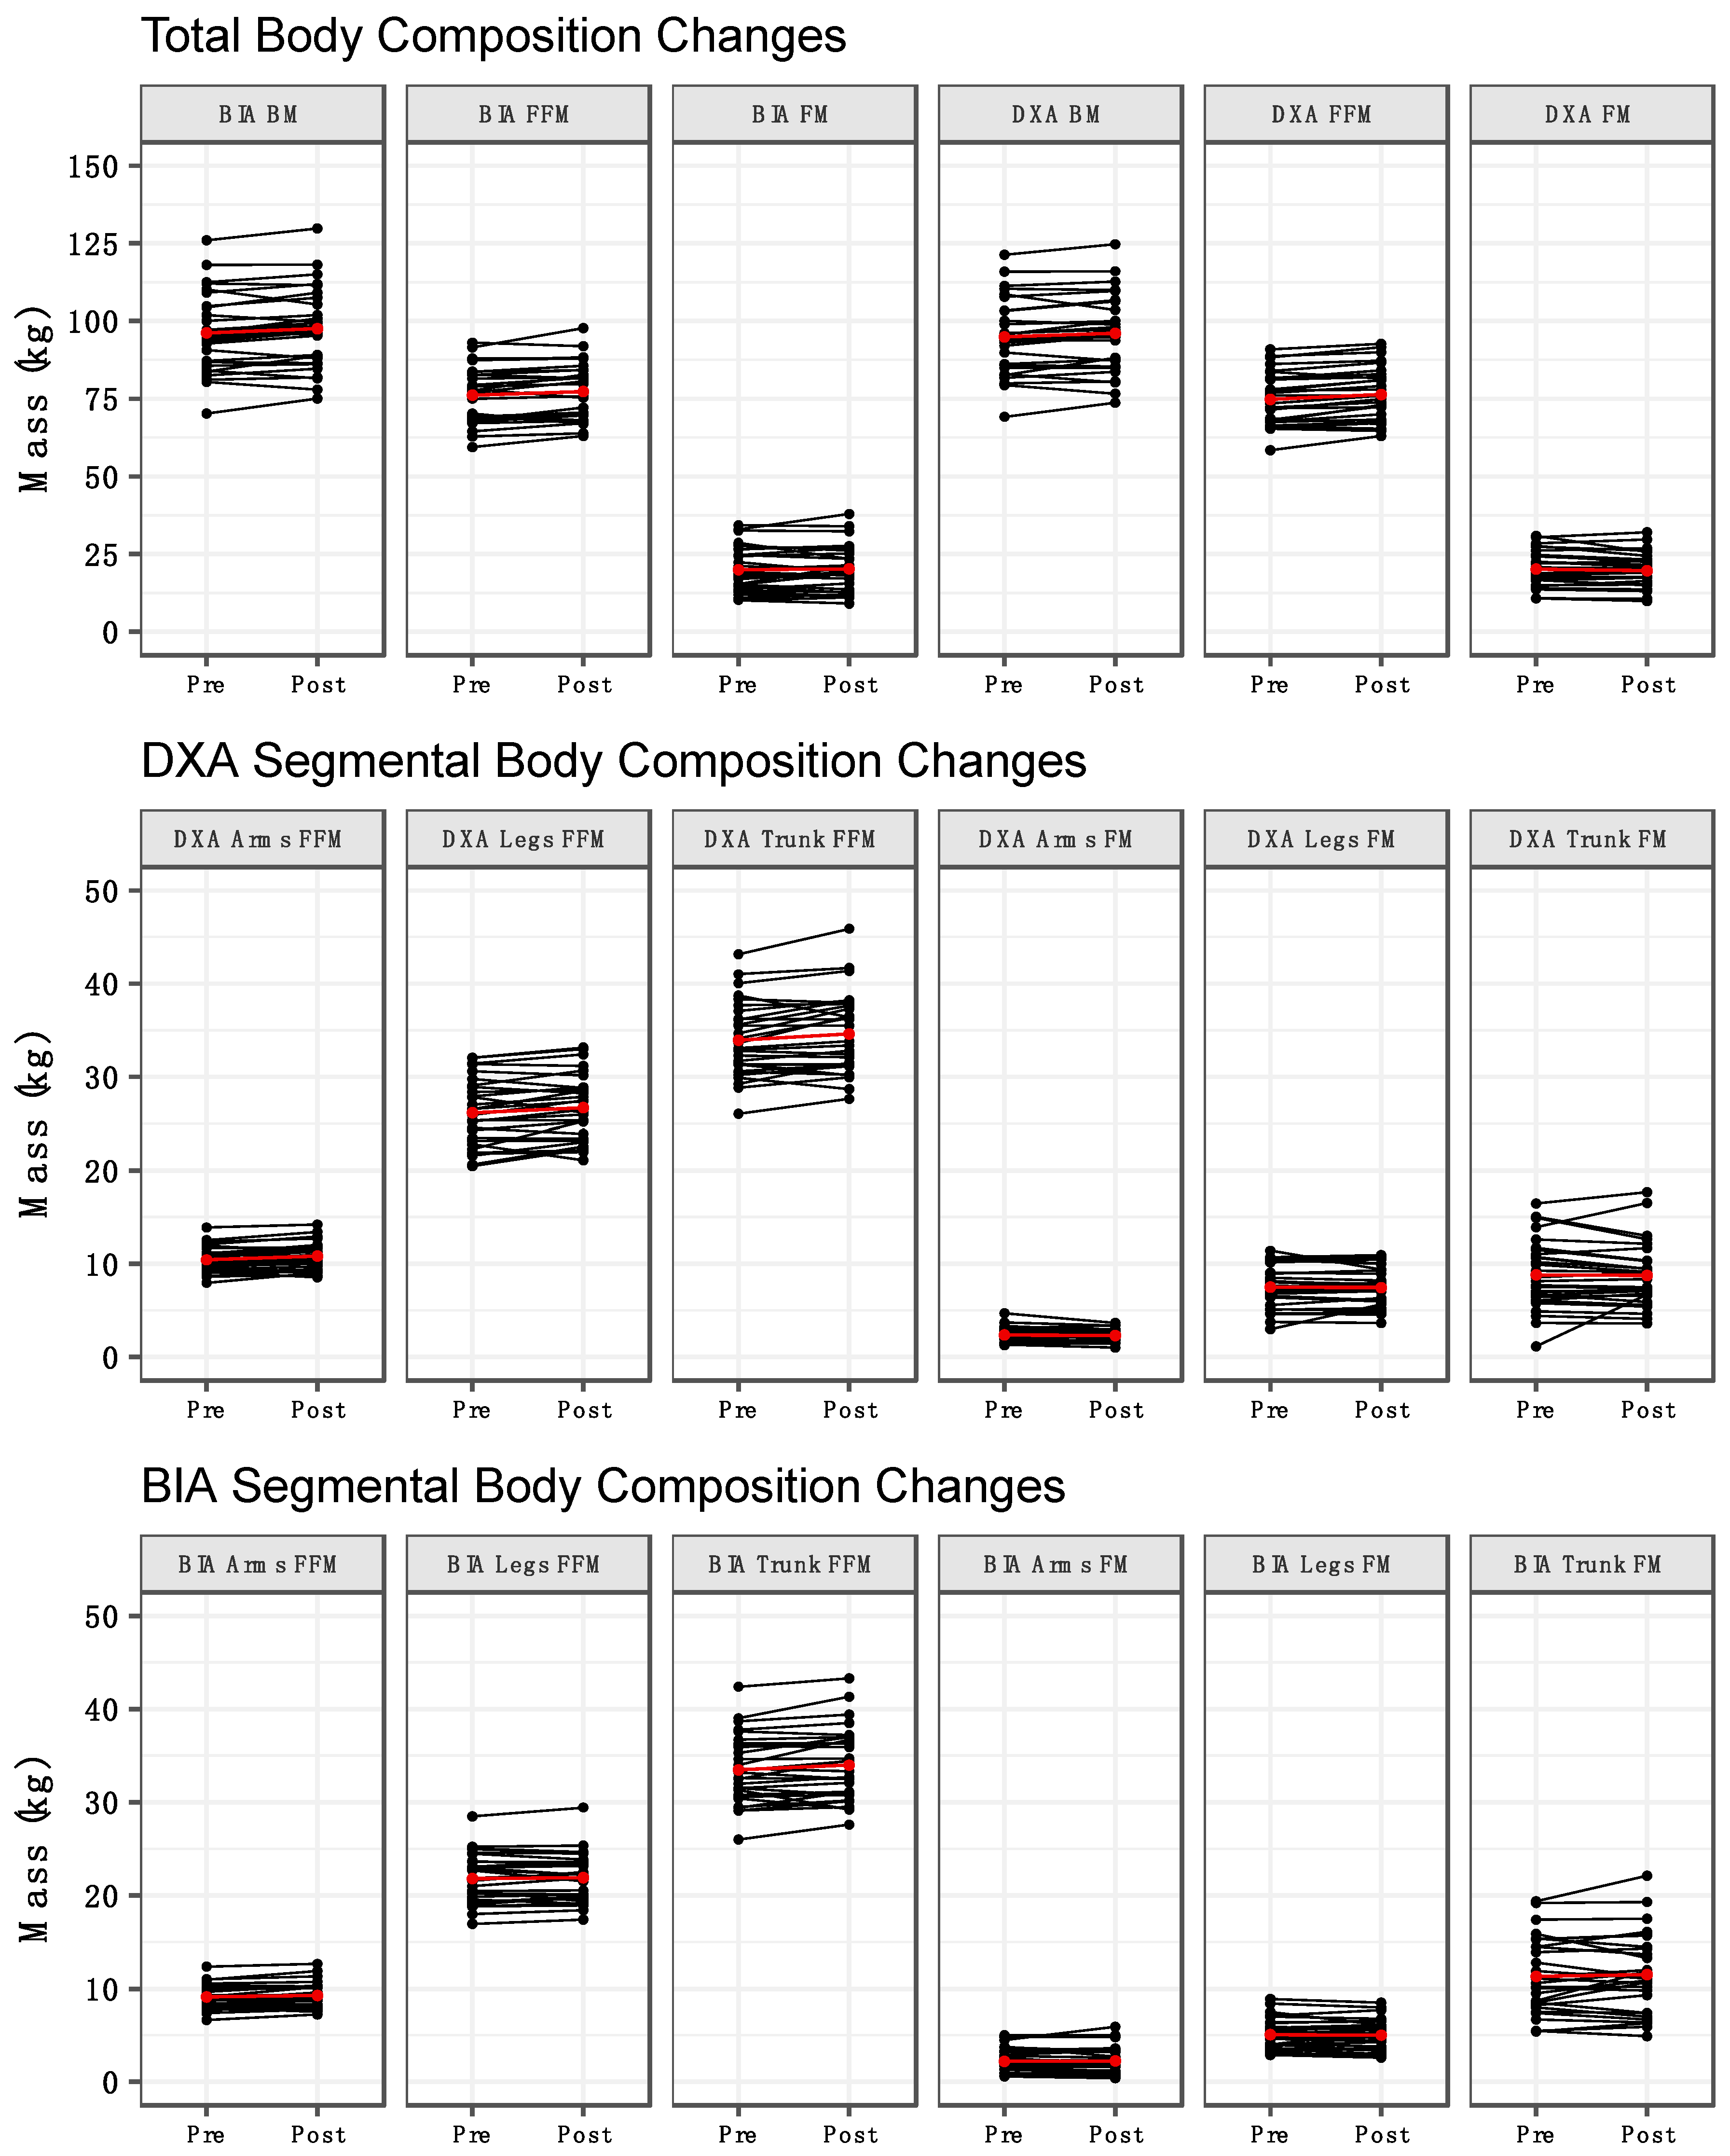
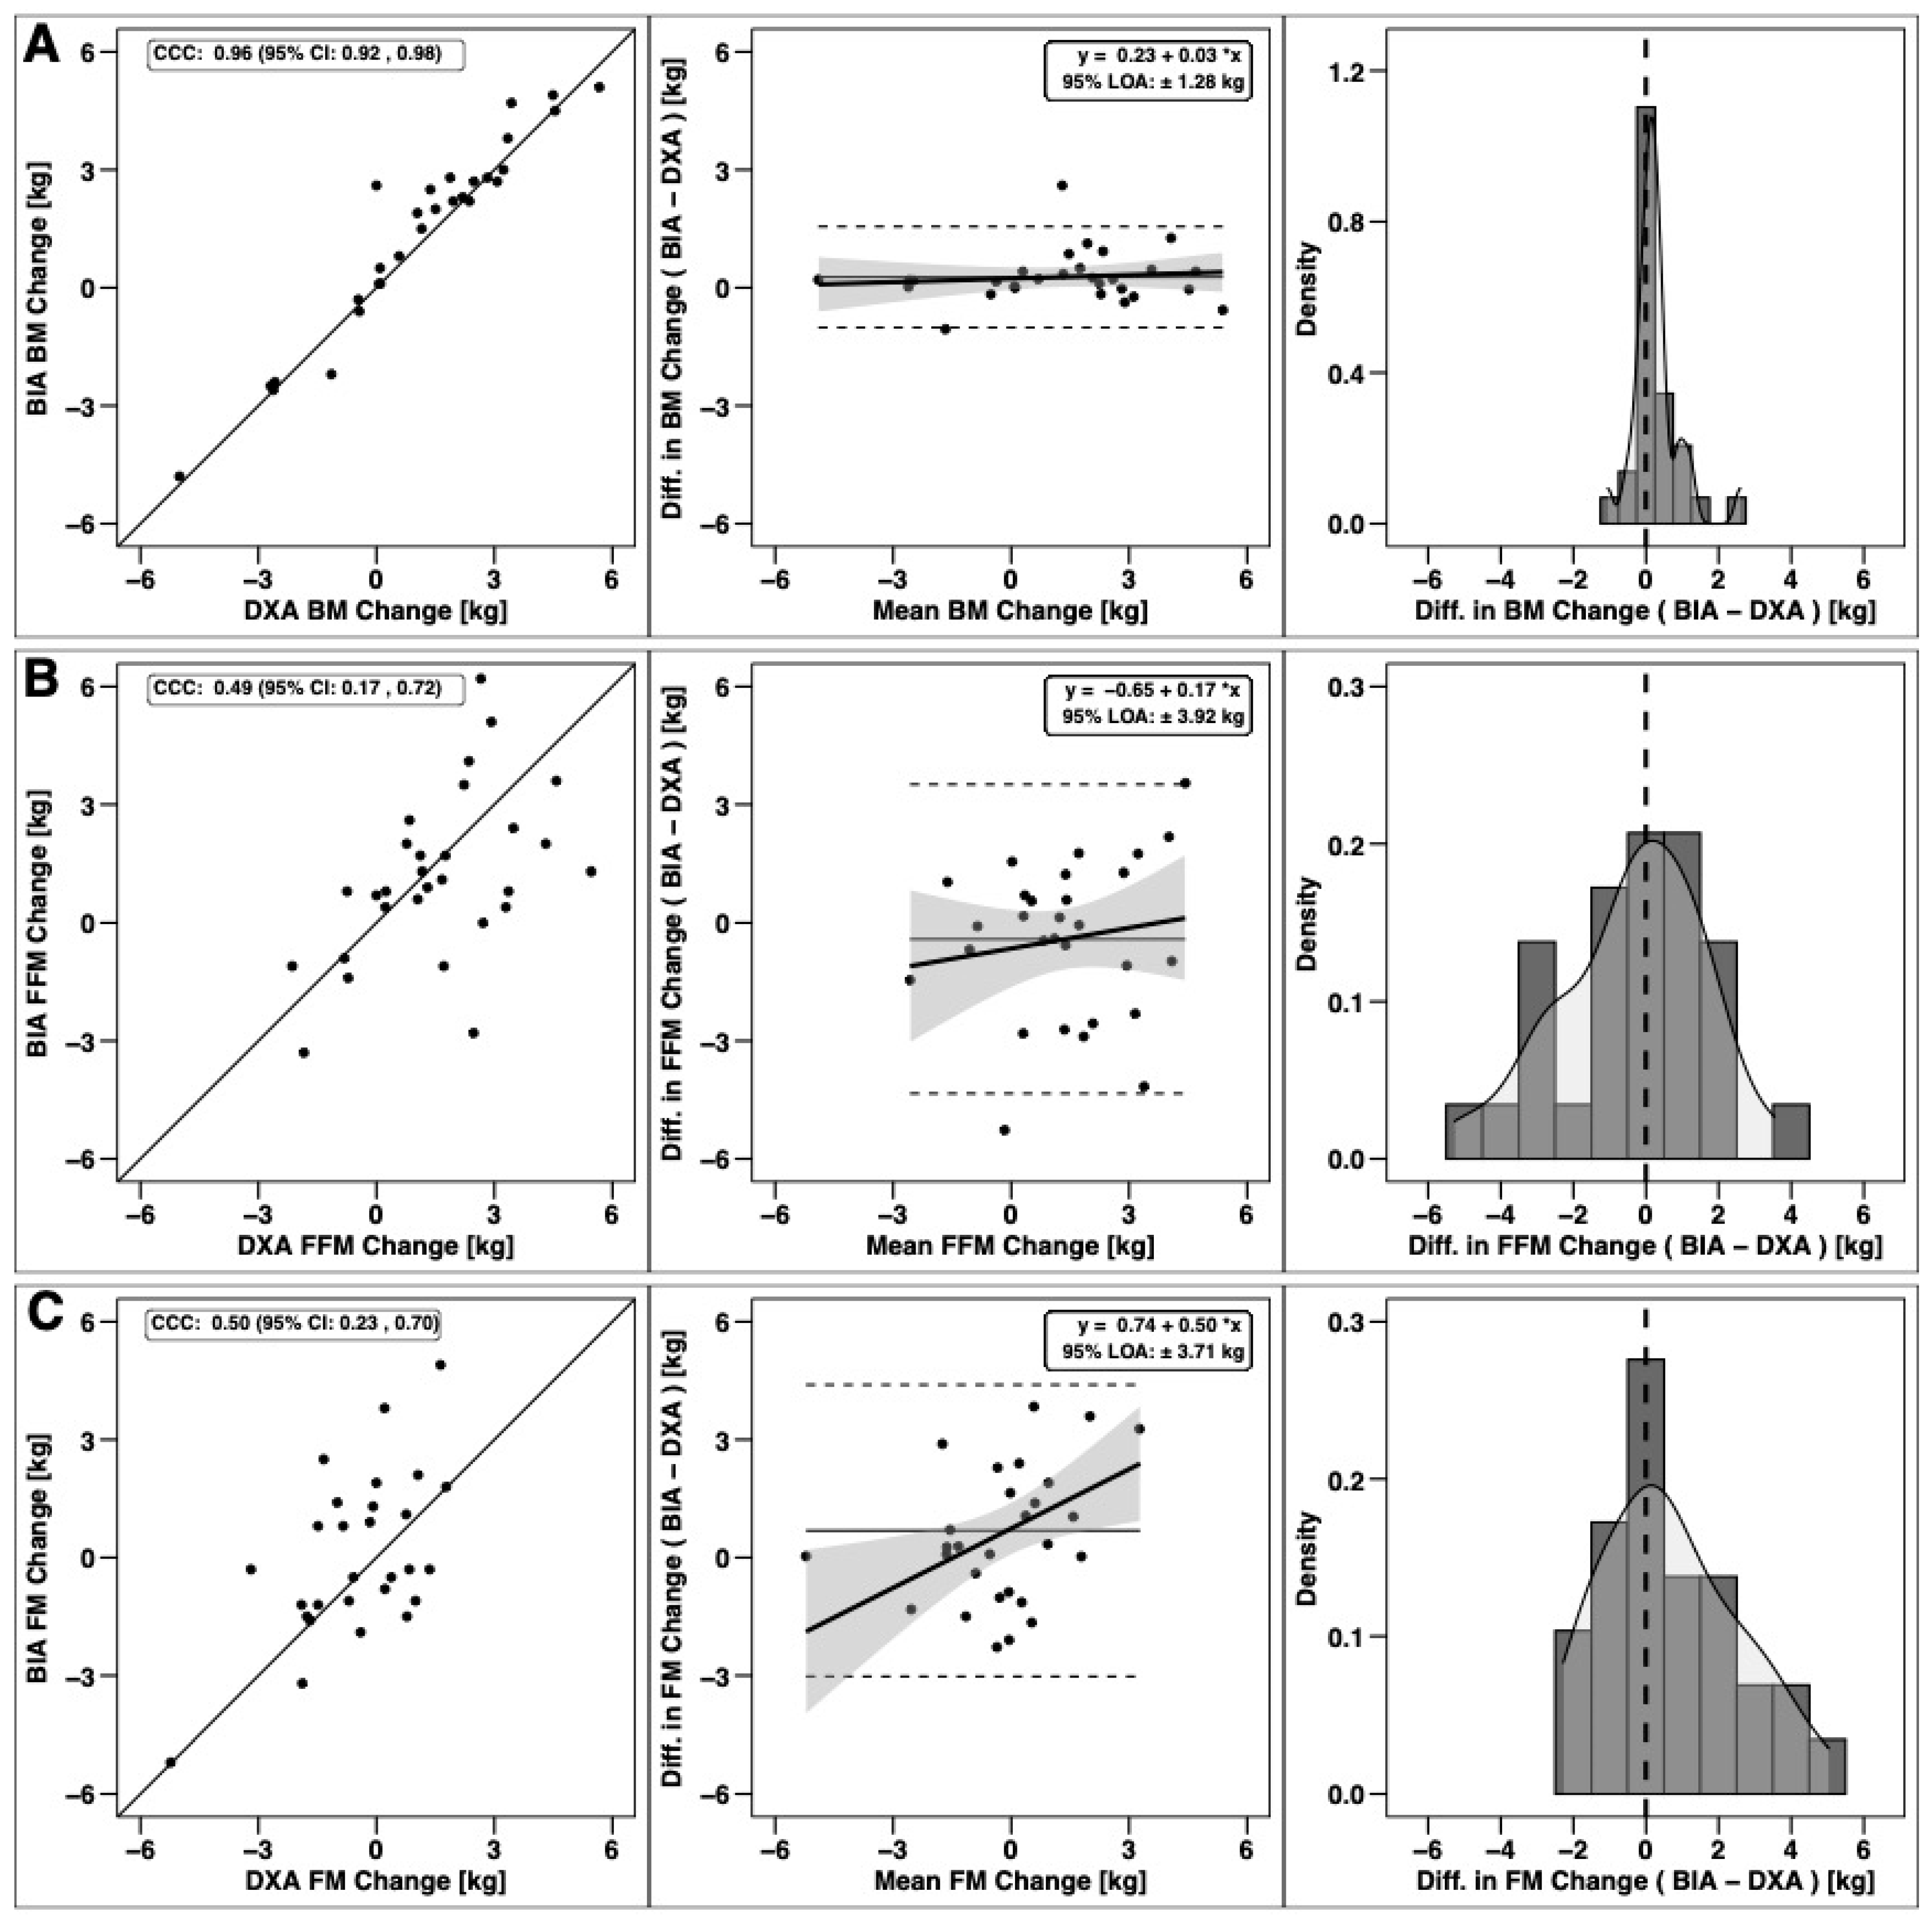
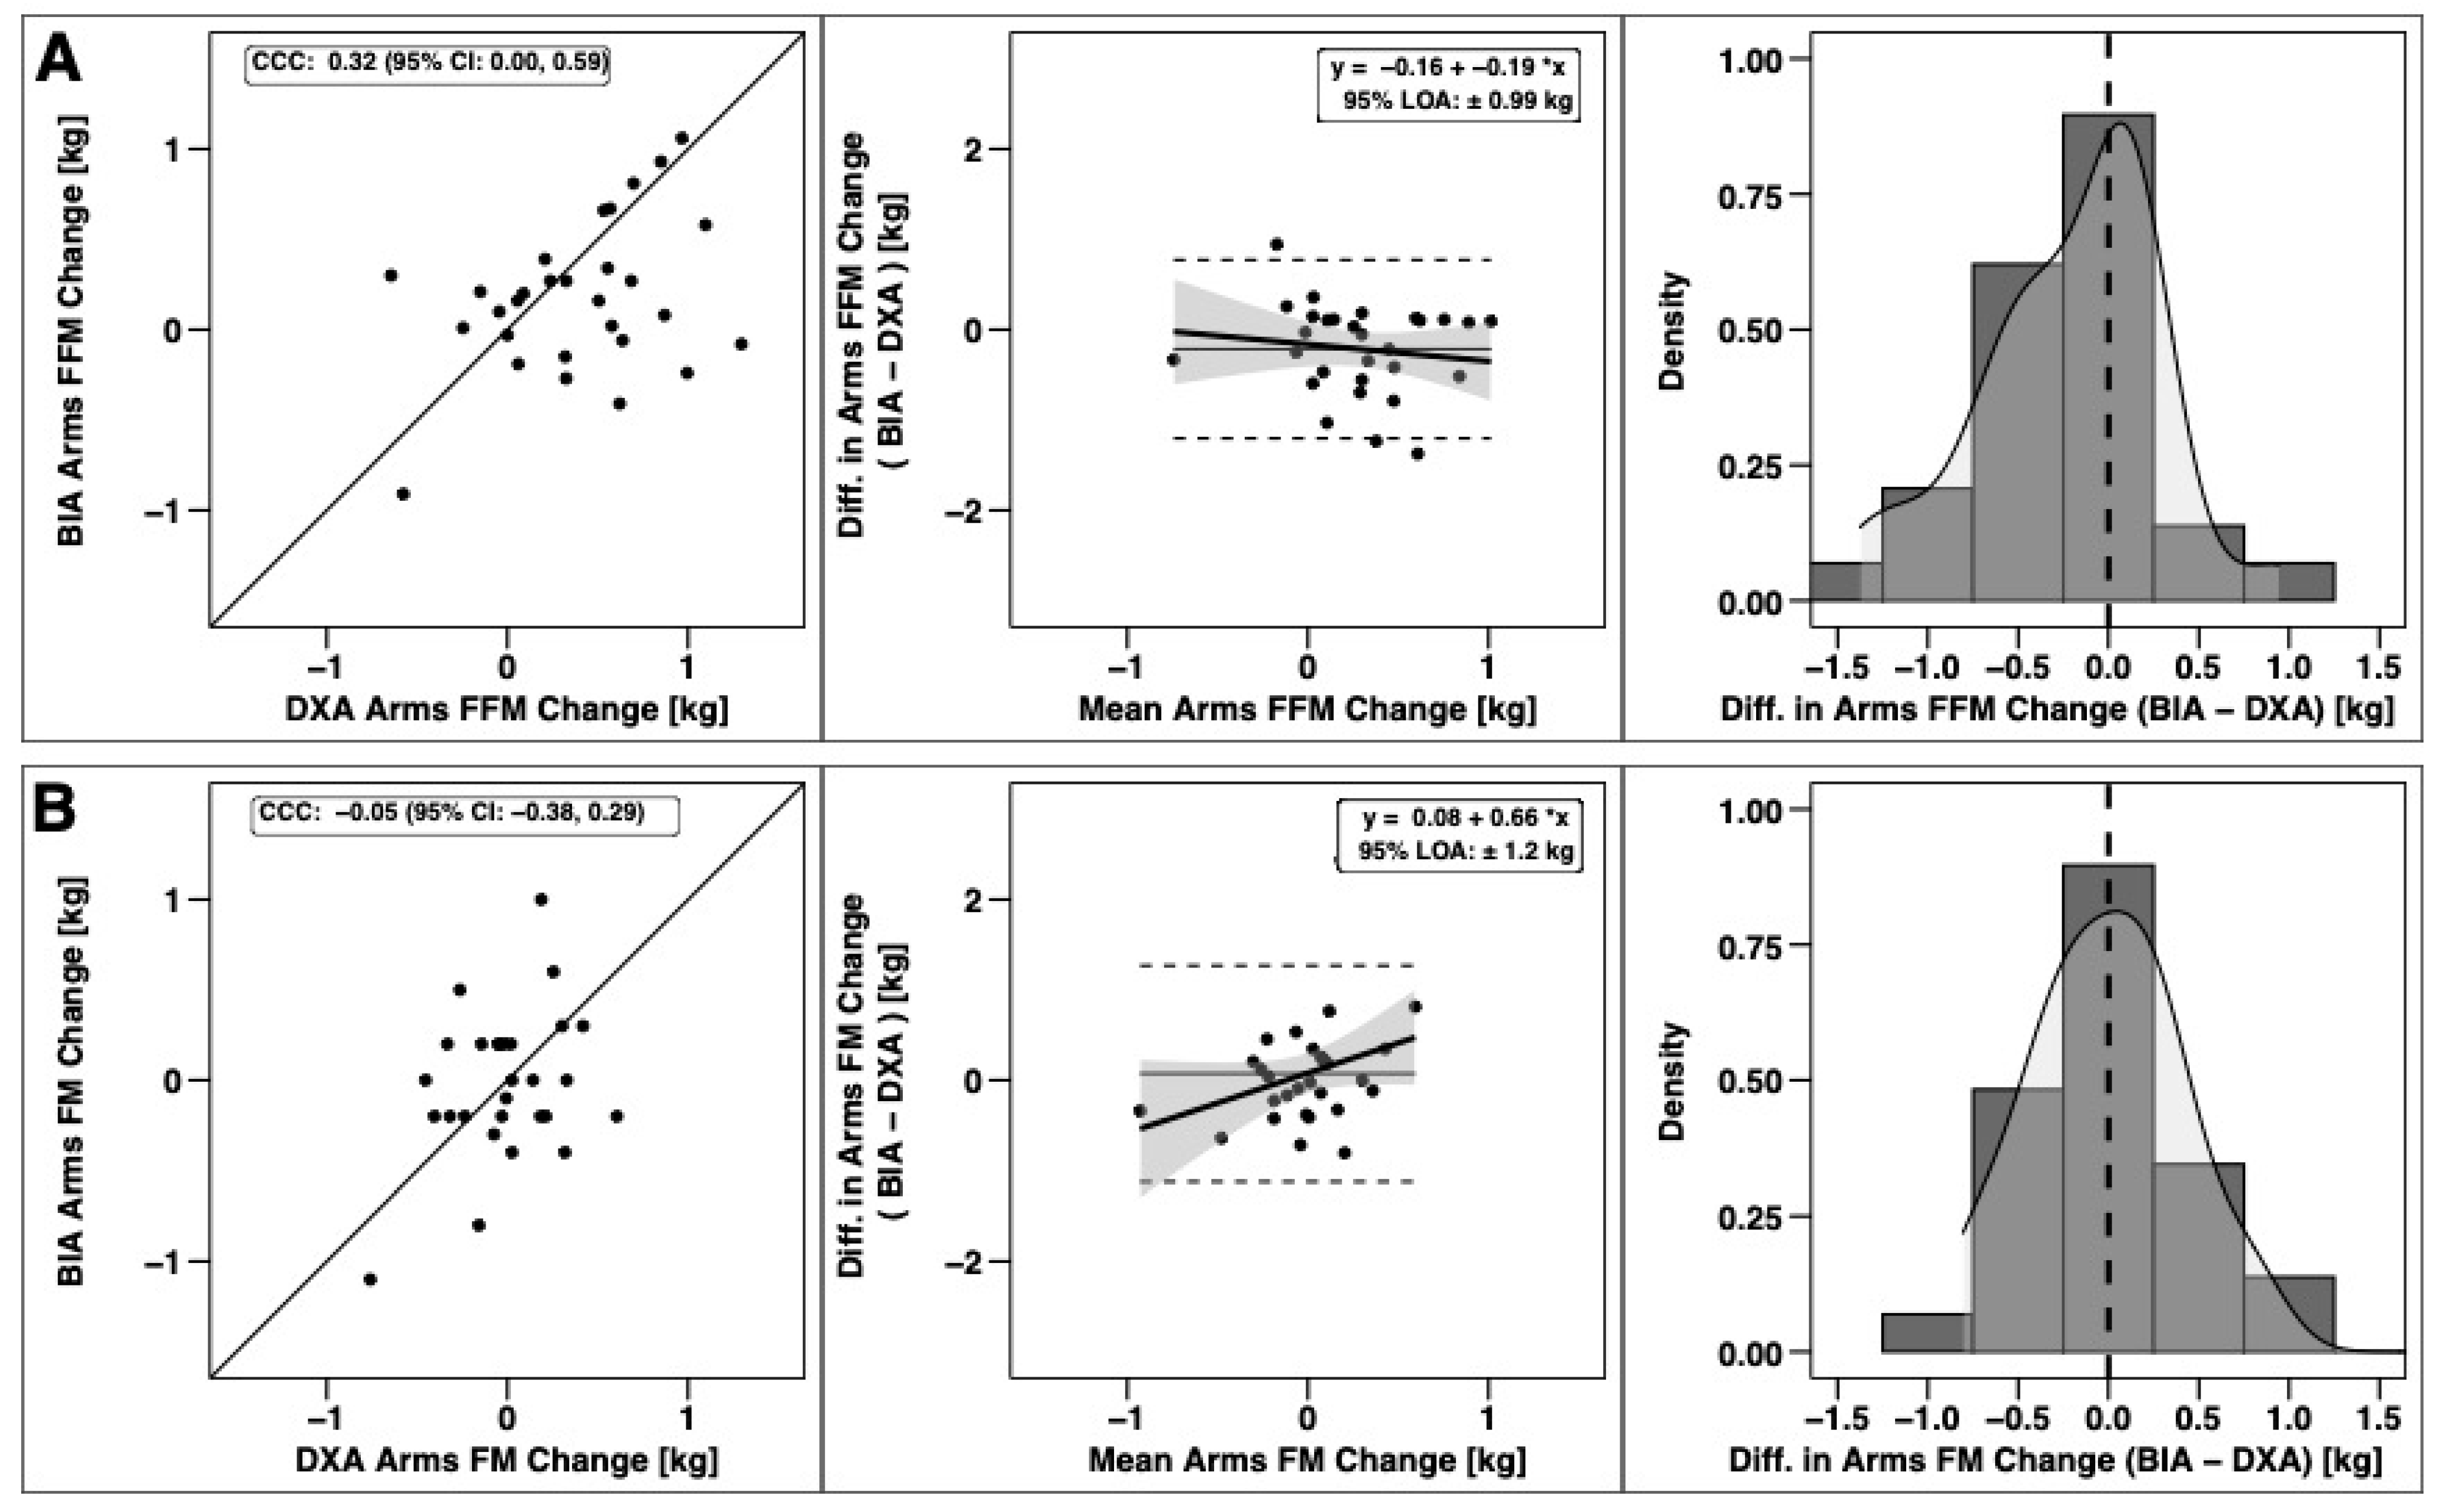
| ANOVA (Raw Data) | |||||||
|---|---|---|---|---|---|---|---|
| Variable | DXA Δ (Mean ± SD) | BIA Δ (Mean ± SD) | MD ± SD | TE | p (Method) | p (Time) | p (Method by Time) |
| BM | 1.11 ± 2.43 | 1.39 ± 2.51 | 0.27 ± 0.65 | 0.70 | <0.001 * | 0.01 * | 0.03 * |
| FM | −0.45 ± 1.54 | 0.24 ± 2.31 | 0.69 ± 1.89 | 1.98 | 0.92 | 0.55 | 0.13 |
| FFM | 1.57 ± 1.86 | 1.15 ± 2.13 | −0.41 ± 2.00 | 2.01 | 0.07 | 0.004 * | 0.62 |
| Arms FM | −0.05 ± 0.35 | 0.03 ± 0.48 | 0.07 ± 0.61 | 0.60 | 0.13 | 0.88 | 0.99 |
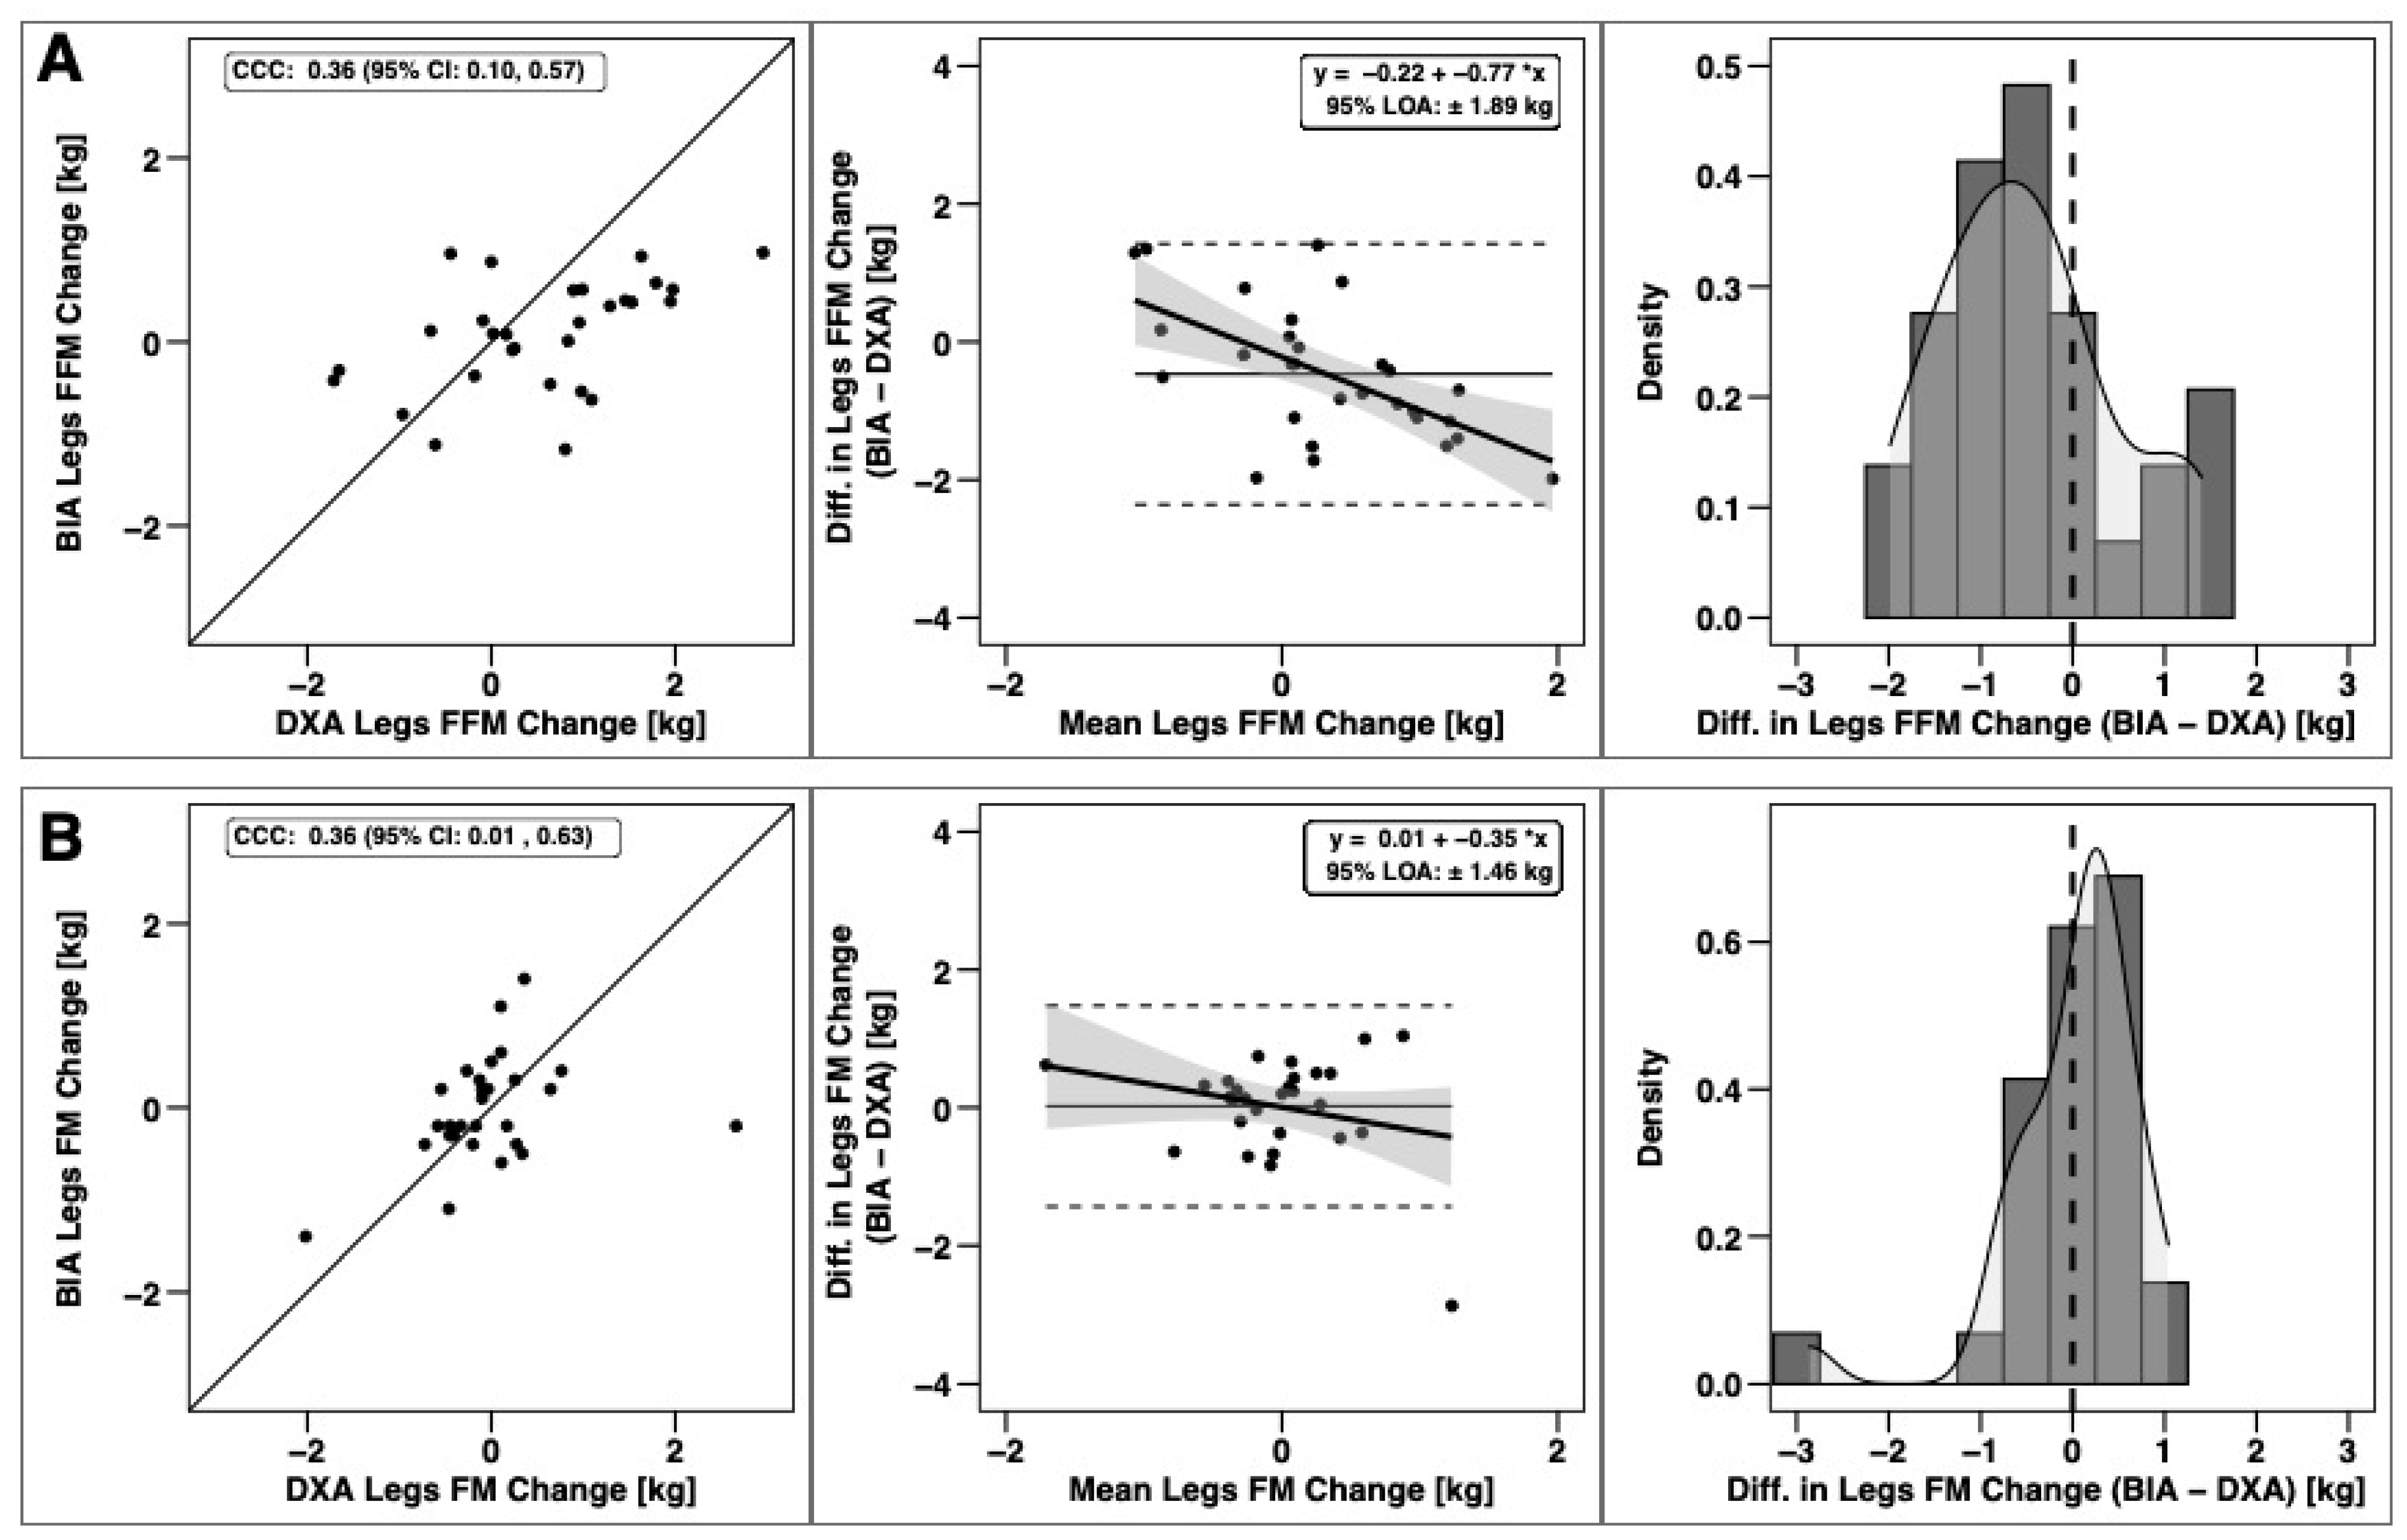
| Legs FM | −0.06 ± 0.73 | −0.03 ± 0.57 | 0.02 ± 0.74 | 0.73 | <0.001 * | 0.66 | 0.88 |
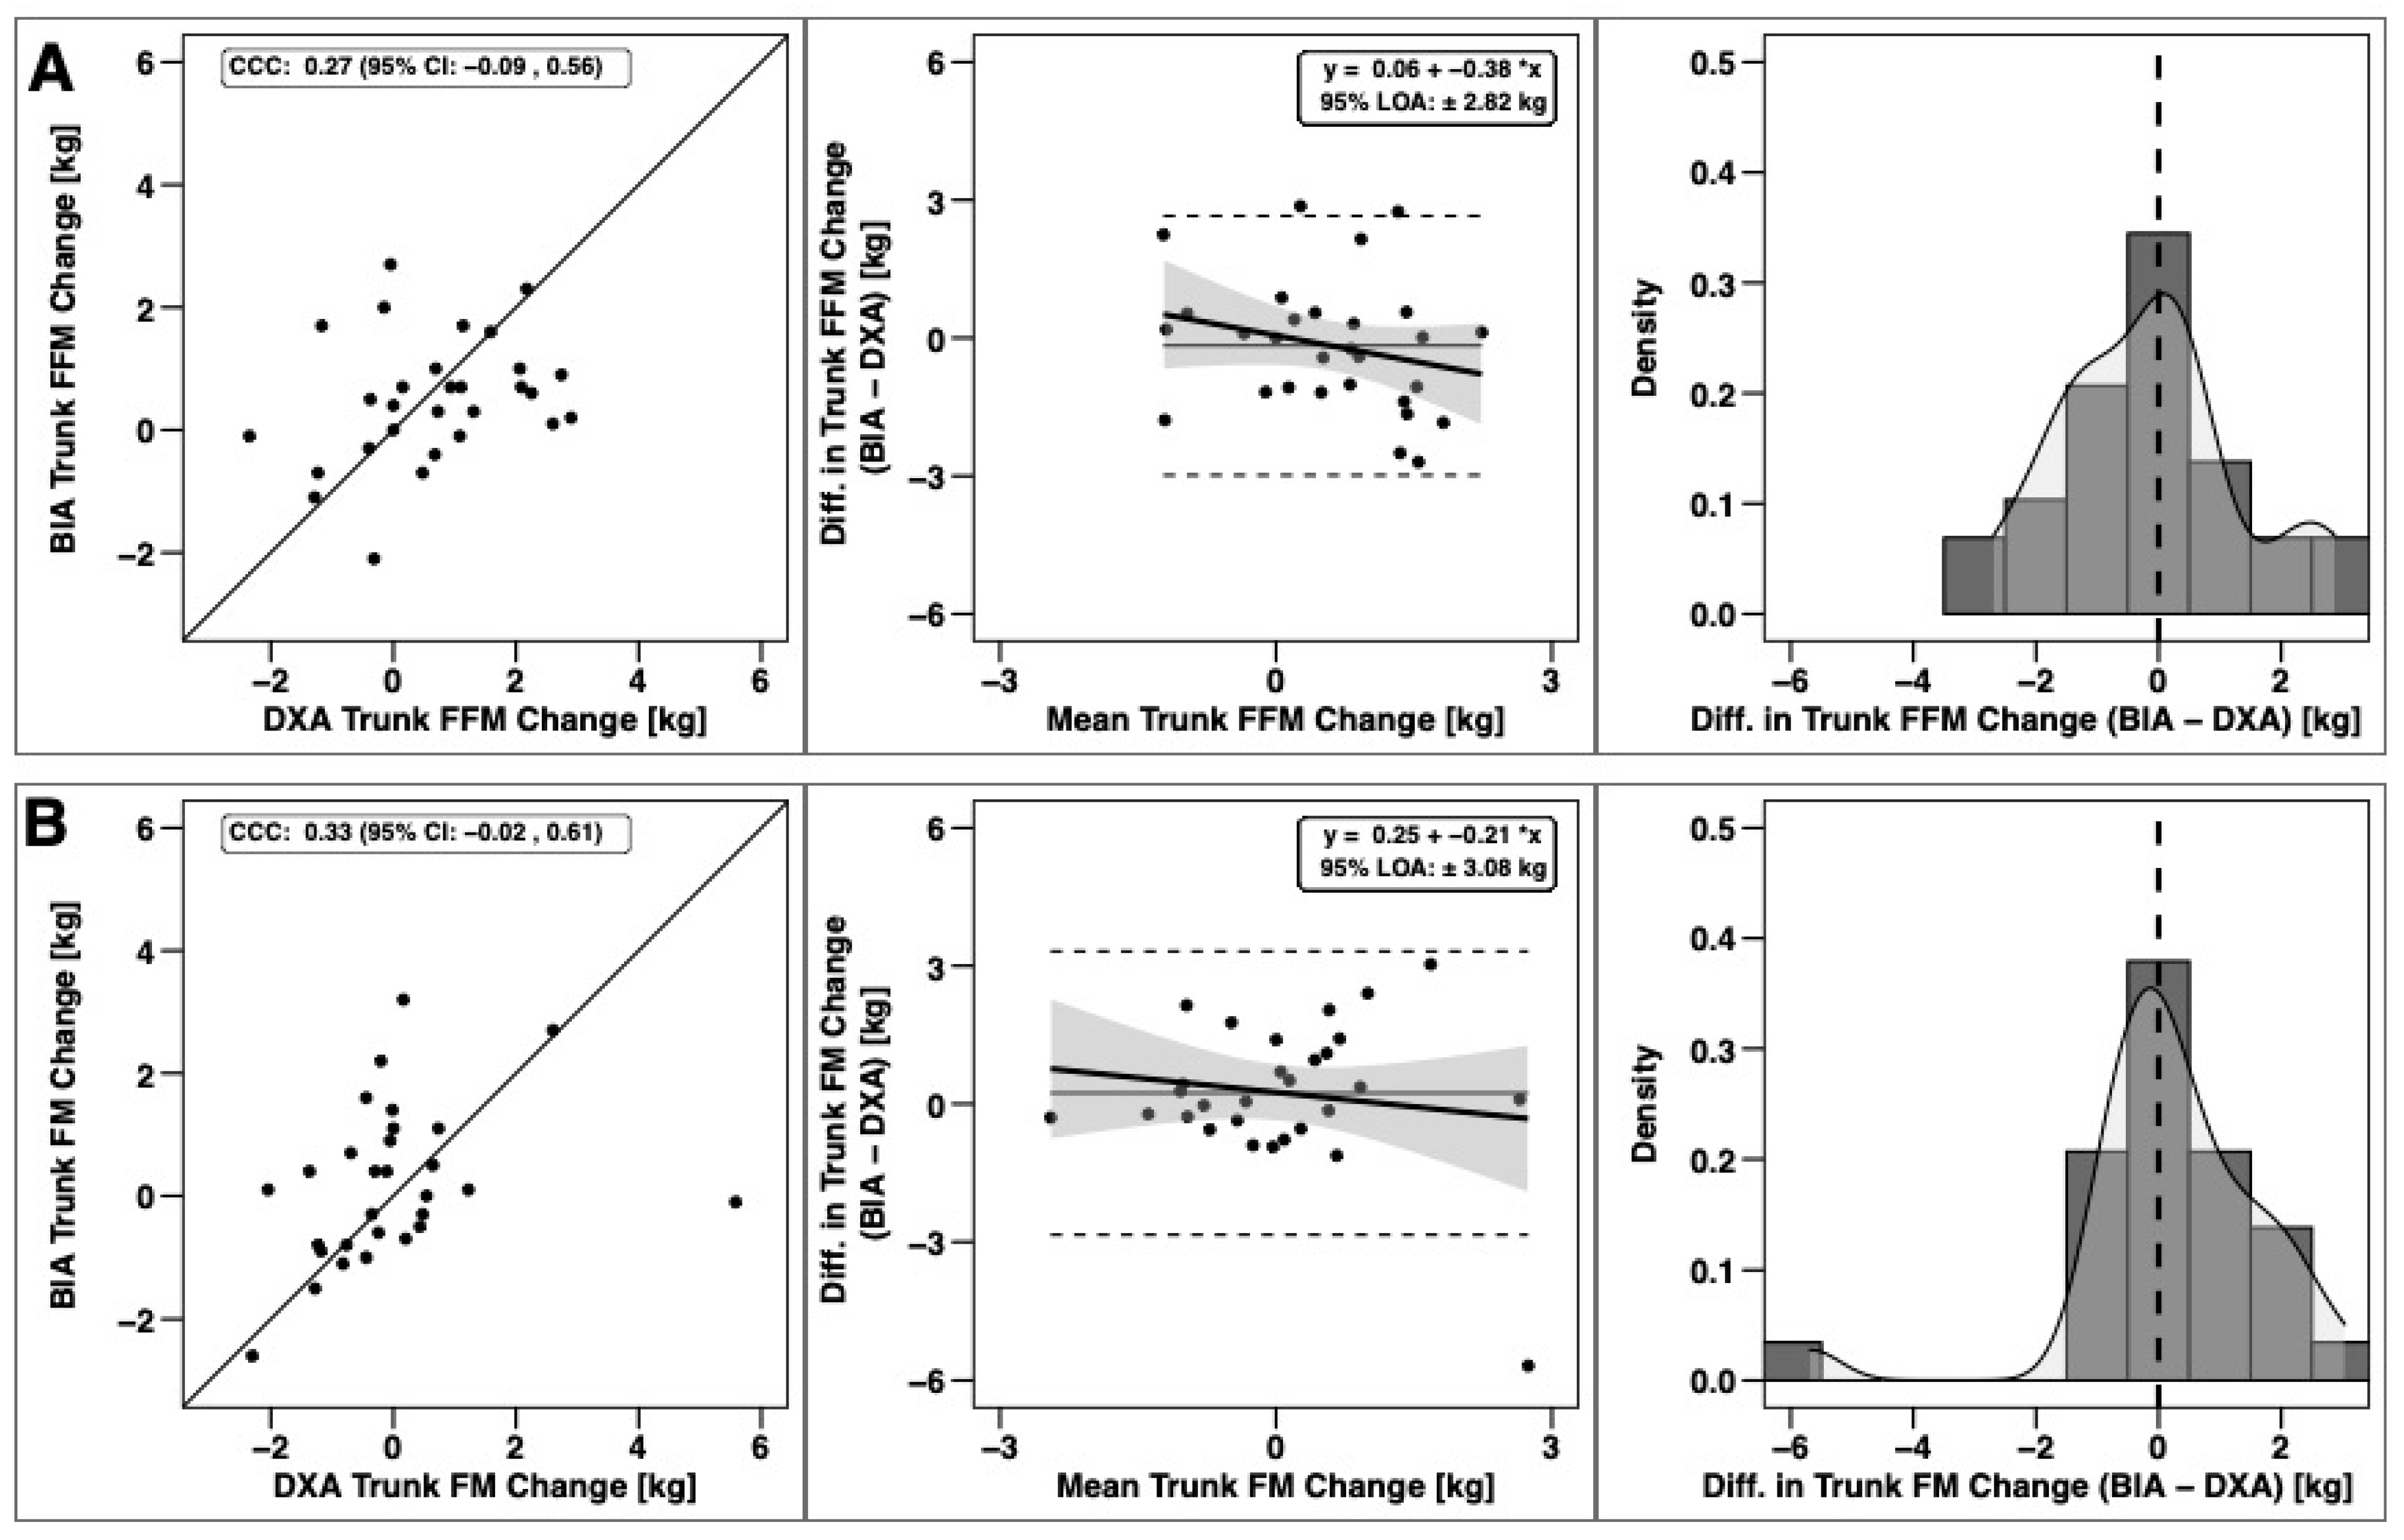
| Trunk FM | −0.04 ± 1.46 | 0.19 ± 1.27 | 0.24 ± 1.57 | 1.56 | <0.001 * | 0.64 | 0.69 |
| Arms FFM | 0.39 ± 0.47 | 0.18 ± 0.42 | −0.22 ± 0.50 | 0.54 | <0.001 * | <0.001 * | 0.03 * |
| Legs FFM | 0.56 ± 1.10 | 0.09 ± 0.60 | −0.47 ± 0.96 | 1.06 | <0.001 * | 0.03 * | 0.01 * |
| Trunk FFM | 0.67 ± 1.32 | 0.50 ± 1.04 | −0.16 ± 1.44 | 1.42 | 0.21 | 0.02 * | 0.74 |
Publisher’s Note: MDPI stays neutral with regard to jurisdictional claims in published maps and institutional affiliations. |
© 2021 by the authors. Licensee MDPI, Basel, Switzerland. This article is an open access article distributed under the terms and conditions of the Creative Commons Attribution (CC BY) license (https://creativecommons.org/licenses/by/4.0/).
Share and Cite
Boykin, J.R.; Tinsley, G.M.; Harrison, C.M.; Prather, J.; Zaragoza, J.; Tinnin, M.; Smith, S.; Wilson, C.; Taylor, L.W. Offseason Body Composition Changes Detected by Dual-Energy X-ray Absorptiometry versus Multifrequency Bioelectrical Impedance Analysis in Collegiate American Football Athletes. Sports 2021, 9, 112. https://0-doi-org.brum.beds.ac.uk/10.3390/sports9080112
Boykin JR, Tinsley GM, Harrison CM, Prather J, Zaragoza J, Tinnin M, Smith S, Wilson C, Taylor LW. Offseason Body Composition Changes Detected by Dual-Energy X-ray Absorptiometry versus Multifrequency Bioelectrical Impedance Analysis in Collegiate American Football Athletes. Sports. 2021; 9(8):112. https://0-doi-org.brum.beds.ac.uk/10.3390/sports9080112
Chicago/Turabian StyleBoykin, Jake R., Grant M. Tinsley, Christine M. Harrison, Jessica Prather, Javier Zaragoza, Matthias Tinnin, Shay Smith, Camden Wilson, and Lem W. Taylor. 2021. "Offseason Body Composition Changes Detected by Dual-Energy X-ray Absorptiometry versus Multifrequency Bioelectrical Impedance Analysis in Collegiate American Football Athletes" Sports 9, no. 8: 112. https://0-doi-org.brum.beds.ac.uk/10.3390/sports9080112