
Relationship between Biological, Training, and Physical Fitness Variables in the Expression of Performance in Non-Professional Runners


Abstract
:1. Introduction
2. Materials and Methods
2.1. Design and Sample
2.2. Data Collection and Procedures
2.3. Training Variables
2.4. Anthropometric and Body Composition Variables
2.5. Physical Fitness Variables
2.6. Data Quality Control
2.7. Statistical Analysis
3. Results
4. Discussion
5. Conclusions
Author Contributions
Funding
Institutional Review Board Statement
Informed Consent Statement
Data Availability Statement
Conflicts of Interest
References
- RunRepeat. Marathon Statistics 2019 Worldwide. Available online: https://runrepeat.com/research-marathon-performance-across-nations (accessed on 7 March 2020).
- Gómez-Molina, J.; Ogueta-Alday, A.; Camara, J.; Stickley, C.; Rodríguez-Marroyo, J.A.; García-López, J. Predictive variables of half-marathon performance for male runners. J. Sports Sci. Med. 2017, 16, 187–194. [Google Scholar]
- Esteve-Lanao, J.; Rosso, S.D.; Larumbe-Zabala, E.; Cardona, C.; Alcocer-Gamboa, A.; Boullosa, D.A. Predicting recreational runners’ marathon performance time during their training preparation. J. Strength Cond. Res. 2019, 1, 1–7. [Google Scholar] [CrossRef]
- Joyner, M.J.; Coyle, E.F. Endurance exercise performance: The physiology of champions. J. Physiol. 2008, 586, 35–44. [Google Scholar] [CrossRef]
- Joyner, M.J. Physiological limits to endurance exercise performance: Influence of sex. J. Physiol. 2017, 595, 2949–2954. [Google Scholar] [CrossRef] [Green Version]
- Moore, I.S. Is there an economical running technique? A review of modifiable biomechanical factors affecting running economy. Sports Med. 2016, 46, 793–807. [Google Scholar] [CrossRef] [Green Version]
- Oliveira-Rosado, J.; Duarte, J.P.; Sousa-e-Silva, P.; Costa, D.C.; Martinho, D.V.; Sarmento, H.; Valente-dos-Santos, J.; Rama, L.M.; Tavares, Ó.M.; Conde, J.; et al. Perfil fisiológico de corredores de trilhas de longa distância adultos do sexo masculino: Variações segundo o nível competitivo (nacional ou regional). Einstein 2020, 18, 1–7. [Google Scholar] [CrossRef]
- Moosesab, M.; Moosesab, K.; Hailebcd, D.W.; Durusselb, J.; Kaasika, P.; Pitsiladisb, Y.P. Dissociation between running economy and running performance in elite Kenyan distance runners. J. Sports Sci. 2015, 33, 136–144. [Google Scholar] [CrossRef]
- Barnes, K.R.; Kilding, A.E. Running economy: Measurement, norms, and determining factors. Sports Med. Open 2015, 1, 8. [Google Scholar] [CrossRef] [Green Version]
- Nikolaidis, P.T.; Coso, J.D.; Knechtle, B. Muscle strength and flexibility in male marathon runners: The role of age, running speed and anthropometry. Front. Physiol. 2019, 10, 1301. [Google Scholar] [CrossRef]
- Stavridis, I.; Paradisis, G. Association between sprinting performance and force-velocity mechanical profile of men’s and women’s world-class sprinters. Proceedings 2019, 25, 33. [Google Scholar] [CrossRef] [Green Version]
- Hudgins, B.; Scharfenberg, J.; Triplett, N.T.; McBride, J.M. Relatioship between jumping ability and running performance in events of varyng distance. J. Strength Cond. Res. 2013, 27, 563–567. [Google Scholar] [CrossRef]
- Nikolaidis, P.T.; Rosemann, T.; Knechtle, B. Force-velocity characteristics, muscle strength, and flexibility in female recreational marathon runners. Front. Physiol. 2018, 9, 1563. [Google Scholar] [CrossRef] [PubMed]
- Boullosa, D.; Esteve-Lanao, J.; Casado, A.; Peyré-Tartaruga, L.A.; Rosa, R.G.d.; Coso, J.D. Factors affecting training and physical performance in recreational endurance runners. Sports 2020, 8, 35. [Google Scholar] [CrossRef] [Green Version]
- Blagrove, R.C.; Howatson, G.; Hayes, P.R. Effects of strength training on the physiological determinants of middle- and long-distance running performance: A systematic review. Sports Med. 2018, 48, 1117–1149. [Google Scholar] [CrossRef] [PubMed] [Green Version]
- Lum, D.; Tan, F.; Pang, J.; Barbosa, T.M. Effects of intermittent sprint and plyometric training on endurance running performance. J. Sport Health Sci. 2019, 8, 471–477. [Google Scholar] [CrossRef] [Green Version]
- Alves, M.D.J.; Mendes, R.R.; Santos, D.F.C.; Souza, R.F.; Rica, R.L.; Pereira, P.E.; Barbosa, W.A.; Souza, A.S.; Bocalini, D.S.; Gomes, J.H. Diferentes tipos de aquecimento promovem mudanças no desempenho de corredores amadores? RBFex 2019, 18, 162–168. [Google Scholar] [CrossRef] [Green Version]
- Gottschall, J.S.; Hastings, B. An integrated core training program improves joint symmetry and metabolic economy in trained runners. J. Sports Med. Phys. Fitness 2019, 59, 2003–2008. [Google Scholar] [CrossRef]
- Thompson, M.A. Physiological and biomechanical mechanisms of distance specific human running performance. Integr. Comp. Biol. 2017, 57, 293–300. [Google Scholar] [CrossRef]
- Casado, A.; Hanley, B.; Santos-Concejero, J.; Ruiz-Perez, L.M. World-class long-distance running performances are best predicted by volume of easy runs and deliberate practice of short-interval and tempo runs. J. Strength Cond. Res. 2019, 1–7. [Google Scholar] [CrossRef]
- Doherty, C.; Keogh, A.; Davenport, J.; Lawlor, A.; Smyth, B.; Caulfield, B. An evaluation of the training determinants of marathon performance: A meta-analysis with meta-regression. J. Sci. Med. Sport 2020, 23, 182–188. [Google Scholar] [CrossRef] [PubMed]
- InTrack. InTrack Project. Available online: https://intrackproject.wixsite.com/website (accessed on 7 March 2021).
- Thuany, M.; Gomes, T.N.; Almeida, M.B. Validação de um instrumento para caracterização e verificação de fatores associados ao desempenho de corredores de rua. Sci. Plena 2020, 16, 1–7. [Google Scholar] [CrossRef] [Green Version]
- International Society for the Advancement of Kinanthropometry ISAK). International Standards for Anthropometric Assessment; The International Society for the Advancement of Kinanthropometry: Underdale, SA, Australia, 2001; p. 131. [Google Scholar]
- Petroski, E.L. Desenvolvimento e Validação de Equações Generalizadas Para a Estimativa da Densidade Corporal em Adultos. Ph.D. Thesis, Federal University of Santa Maria, Santa Maria, Rio Grande do Sul, Brazil, June 1995. [Google Scholar]
- We, S. Body composition from fluid spaces and density: Analysis of methods. Nutrition 1961, 9, 480–492. [Google Scholar]
- McGuigan, M. Principles of Test Selection and Administration. In Essential of Strength Trainig and Conditioning/National Strength and Conditioning Association, 4th ed.; Haff, G.G., Triplett, N.T., Eds.; Human Kinetics: Champaign, IL, USA, 2016; pp. 249–258. [Google Scholar]
- McGuigan, M. Administration, Scoring, and Interpretation of Selected Tests. In National Strength and Conditioning Association/National Strength and Conditioning Association, 4th ed.; Haff, G.G., Triplett, N.T., Eds.; Human Kinetics: Champaign, IL, USA, 2016; pp. 259–316. [Google Scholar]
- Fernandes, A.A.; Marins, J.C.B. Teste de força de preensão manual: Análise metodológica e dados normativos em atletas. Fisioter Mov. 2011, 24, 567–578. [Google Scholar] [CrossRef] [Green Version]
- Fess, L.; Moran, C. American Society of Hand Therapists Clinical Assessment Recommendations; American Society of Hand Therapists: St. Louis, MI, USA, 1981. [Google Scholar]
- Lockie, R.G.; Dawes, J.; Kornhauser, C.L.; Holmes, R.J. Cross-sectional and retrospective cohort analysis of the effects of age on flexibility, strength endurance, lower-body power, and aerobic fitness in law enforcement officers. J. Strength Cond. Res. 2019, 33, 451–458. [Google Scholar] [CrossRef] [PubMed]
- Santander, M.; García, G.C.; Secchi, J.D.; Zuñiga, M.; Gutiérrez, M.; Salas, N.; Arcuri, C. Physical fitness standards in students from province of Neuquen, Argentina. Physical Fitness Assessment Plan study. Arch. Argent. Pediatr. 2019, 117, e568–e575. [Google Scholar] [CrossRef]
- Weltman, A.; Snead, D.; Seip, R.; Schurrer, R.; Levine, S.; Rutt, R.; Reilly, T.; Weltman, J.; Rogol, A. Prediction of lactate threshold and fixed blood lactate concentrations from 3200-rn running performance in male runners. Int. J. Sports Med. 1987, 8, 401–406. [Google Scholar] [CrossRef]
- Silva, A.M. Structural and functional body components in athletic health and performance phenotypes. Eur. J. Clin. Nutr. 2019, 73, 215–224. [Google Scholar] [CrossRef] [PubMed]
- Hooren, B.V.; Goudsmit, J.; Restrepo, J.; Vos, S. Real-time feedback by wearables in running: Current approaches, challenges and suggestions for improvements. J. Sports Sci. 2020, 38, 214–230. [Google Scholar] [CrossRef]
- Nikolaidis, P.T.; Rosemann, T.J.; Knechtle, B. Skinfold Thickness Distribution in Recreational Marathon Runners. Int. J. Environ. Res. Public Health 2020, 17, 2978. [Google Scholar] [CrossRef] [PubMed]
- Maciejczyk, M.; Wiecek, M.; Szymura, J.; Szyguła, Z.; Wiecha, S.; Cempla, J. The influence of increased body fat or lean body mass on aerobic performance. PLoS ONE 2014, 9, e95797. [Google Scholar] [CrossRef]
- Ghiani, G.; Marongiu, E.; Melis, F.; Angioni, G.; Sanna, I.; Loi, A.; Pusceddu, M.; Pinna, V.; Crisafulli, A.; Tocco, F. Body composition changes affect energy cost of running during 12 months of specific diet and training in amateur athletes. Appl. Physiol. Nutr. Metab. 2015, 40, 938–944. [Google Scholar] [CrossRef] [Green Version]
- Longman, D.P.; Murray, A.M.; Roberts, R.; Oakley, S.; Wells, J.C.K.; Stock, J.T. Ultra-endurance athletic performance suggests that energetics drive human morphological thermal adaptation. Evol. Hum. Sci. 2019, 1. [Google Scholar] [CrossRef] [Green Version]
- Willy, R.W.; Paquette, M.R. The Physiology and Biomechanics of the Master Runner. Sports Med. Arthrosc. Rev. 2019, 27, 15–21. [Google Scholar] [CrossRef] [PubMed]
- Dahl, J.; Degens, H.; Hildebrand, F.; Ganse, B. Do changes in middle-distance running kinematics contribute to the age-related decline in performance? J. Musculoskelet Neuronal Interact. 2020, 20, 94–100. [Google Scholar] [PubMed]
- Coso, J.D.; Moreno, V.; Gutiérrez-Hellín, J.; Ruíz-Moreno, C.; Aguilar-Navarro, M.; Baltazar-Martins, G.; Lara, B.; Lucía, A. ACTN3 R577X genotype and exercise phenotypes in recreational marathon runners. Genes 2019, 10, 413. [Google Scholar] [CrossRef] [PubMed] [Green Version]
- Pereira, R.H.F.A.; Lima, W.P. Influência do treinamento de força na economia de corrida em corredores de endurance. RBPFEX 2010, 4, 116–135. [Google Scholar]
- Giovanelli, N.; Taboga, P.; Rejc, E.; Lazzer, S. Effects of strength, explosive and plyometric training on energy cost of running in ultra-endurance athletes. Eur. J. Sport Sci. 2017, 17, 805–813. [Google Scholar] [CrossRef]
- Hung, K.-C.; Chung, H.-W.; Yu, C.C.-W.; Lai, H.-C.; Sun, F. Effects of 8-week core training on core endurance and running economy. PLoS ONE 2019, 14, e0213158. [Google Scholar] [CrossRef] [Green Version]
- Gomez-Molina, J.; Ogueta-Alday, A.; Stickley, C.; Camara, J.; Cabrejas-Ugartondo, J.; Lopez, J.G. Differences in spatiotemporal parameters between trained runners and untrained participants. J. Strength Cond. Res. 2017, 31, 2169–2175. [Google Scholar] [CrossRef] [Green Version]
- Moore, I.S.; Ashford, K.J.; Cross, C.; Hope, J.; Jones, H.S.R.; McCarthy-Ryan, M. Humans optimize ground contact time and leg stiffness to minimize the metabolic cost of running. Front. Sports Act. Living 2019, 1, 53. [Google Scholar] [CrossRef] [Green Version]
- Hunter, I.; Smith, G. Preferred and optimal stride frequency, stiffness and economy: Changes with fatigue during a 1-h high-intensity run. Eur. J. Appl. Physiol. 2007, 100, 653–661. [Google Scholar] [CrossRef]
- Ogueta-Alday, A.; Morante, J.C.; Gomez-Molina, J.; Garcia-Lopez, J. Similarities and differences among half-marathon runners according to their performance level. PLoS ONE 2018, 13, e0191688. [Google Scholar] [CrossRef] [Green Version]
- Moore, I.S.; Jones, A.M.; Dixon, S. Mechanisms for improved running economy in beginner runners. Med. Sci. Sports Exerc. 2012, 44, 1756–1763. [Google Scholar] [CrossRef] [Green Version]
- Schubert, A.G.; Kempf, E.; Heiderscheit, B.C. Influence of stride frequency and length on running mechanics: A systematic review. Sports Health 2014, 6, 210–217. [Google Scholar] [CrossRef] [Green Version]
- Ferrauti, A.; Bergermann, M.; Fernandez-Fernandez, J. Effects of a concurrent strength and endurance training on running performance and running economy in recreational marathon runners. J. Strength Cond. Res. 2010, 24, 2770–2778. [Google Scholar] [CrossRef] [Green Version]
- Legaz-Arrese, A.; Munguía-Izquierdo, D.; Carranza-García, L.E.; Torres-Dávila, C.G. Validity of the wingate anaerobic test for the evaluation of elite runners. J. Strength Cond. Res. 2011, 25, 819–824. [Google Scholar] [CrossRef]
- Santos, M.A.M.; Costa, M.C.; Brito-Gomes, J.L.; Perrier-Melo, R.J.; Oliveira, S.F.M.; Farah, B.Q. Fatores associados ao desempenho em uma corrida de 10.000 metros em corredores amadores. J. Phys. Educ. 2017, 28, 2836. [Google Scholar] [CrossRef] [Green Version]
- Cortez, A.C.L.; Neto, A.F.S.; Rodrigues, F.H.A.; Gomes, A.C.; Rêgo, A.R.O.N. Potência muscular de membros inferiores de ciclistas e corredores de rua da cidade de Teresina/PI. RBFex 2018, 17, 141–147. [Google Scholar] [CrossRef]
- Festa, L.; Tarperi, C.; Skroce, K.; Torre, A.L.; Schena, F. Effects of Different Training Intensity Distribution in Recreational Runners. Front. Sports Act. Living 2020, 1, 70. [Google Scholar] [CrossRef] [Green Version]
- Deelen, I.; Janssen, M.; Vos, S.; Kamphuis, C.B.M.; Ettema, D. Attractive running environments for all? A cross-sectional study on physical environmental characteristics and runners’ motives and attitudes, in relation to the experience of the running environment. BMC Public Health 2019, 19, 1–15. [Google Scholar] [CrossRef]
- Ettema, D. Runnable Cities. Environ. Behav. 2016, 48, 1127–1147. [Google Scholar] [CrossRef]
- Casado, A.; Hanley, B.; Jimenez-Reyes, P.; Renfree, A. Pacing profiles and tactical behaviors of elite runners. J. Sport Health Sci. 2020. [Google Scholar] [CrossRef]
- Nikolaidis, P.T.; Knechtle, B. Effect of age and performance on pacing of marathon runners. J. Sports Med. 2017, 8, 171–180. [Google Scholar] [CrossRef] [Green Version]
- Alvero-Cruz, J.R.; Carnero, E.A.; Alacid, F.; Rosemann, T.; García, M.A.G.; Nikolaidis, P.T.; Knechtle, B. Cooper test provides better half-marathon performance prediction in recreational runners than laboratory tests. Front. Physiol. 2019, 10, 1349. [Google Scholar] [CrossRef] [PubMed] [Green Version]
- Souza, K.M.; Lucas, R.D.; Grossl, T.; Costa, V.P.; Guglielmo, L.G.A.; Denadai, B.S. Predição da performance de corredores de endurance por meio de testes de laboratório e pista. Rev. Bras. Cineantropom. Desempenho. Hum. 2014, 16, 465–474. [Google Scholar] [CrossRef]


| Semi-Professional Runners | Amateur Runners | Recreational Runners | Semi-Professional Runners | Amateur Runners | Recreational Runners | |
|---|---|---|---|---|---|---|
| Variables | Mean (Standard Deviation) | Median (Interquartile Range) | ||||
| Biological variables | ||||||
| Age (years) | 30 (9.3) | 35. (8.7) | 46 (14.1) | 29 (13) | 34 (6) | 49 (36) † |
| Body mass (kg) | 65.2 (8.7) | 74.6 (5.2) | 78.5 (13.3) | 71.3 (17.1) | 74.1 (11.3) | 79 (24.5) † |
| Body fat (%G) | 14.3 (5) | 19.2 (4.2) | 24.9 (3.9) | 14.89 (11.0) | 18.75 (8.51) | 23.8 (5.9) † |
| Physical fitness | ||||||
| VO2Peak (mL·kg−1·min−1) | 58.51 (7.0) | 46.4 (3.2) | 33.0 (15) | 55.7 (10.6) | 47.4 (6.1) † | 35.3 (19.8) † |
| Agility (s) | 10.9 (1) | 10.8 (0.8) | 12.3 (0.9) | 10.84 (1.0) | 10.7 (1.0) | 12.2 (2) †,* |
| Muscular power (cm) | 181.2 (39.8) | 199.1 (30.9) | 151.5 (25.4) | 191 (34.6) | 197.5 (43.4) | 148.6 (43.8) †,* |
| Upper-body muscular endurance (rep) | 32.3 (12.6) | 35.08 (10.0) | 29.2 (10.4) | 31 (17) | 35.5 (20) | 27.5 (21) |
| Abdominal muscular endurance (rep) | 35.5 (10.2) | 32.8 (6.2) | 23.7 (12.4) | 32 (18) | 30 (7) | 26 (17) |
| Isometric strength (kg) | 0.60 (0.11) | 0.58 (0.89) | 0.53 (0.86) | 0.62 (0.15) | 0.59 (0.16) | 0.53 (0.14) |
| Stride frequency (steps/min) | 173.7 (7.0) | 177.2 (9.2) | 167.4 (10.6) | 176 (11.43) | 177 (11.62) | 168.7 (19.9) |
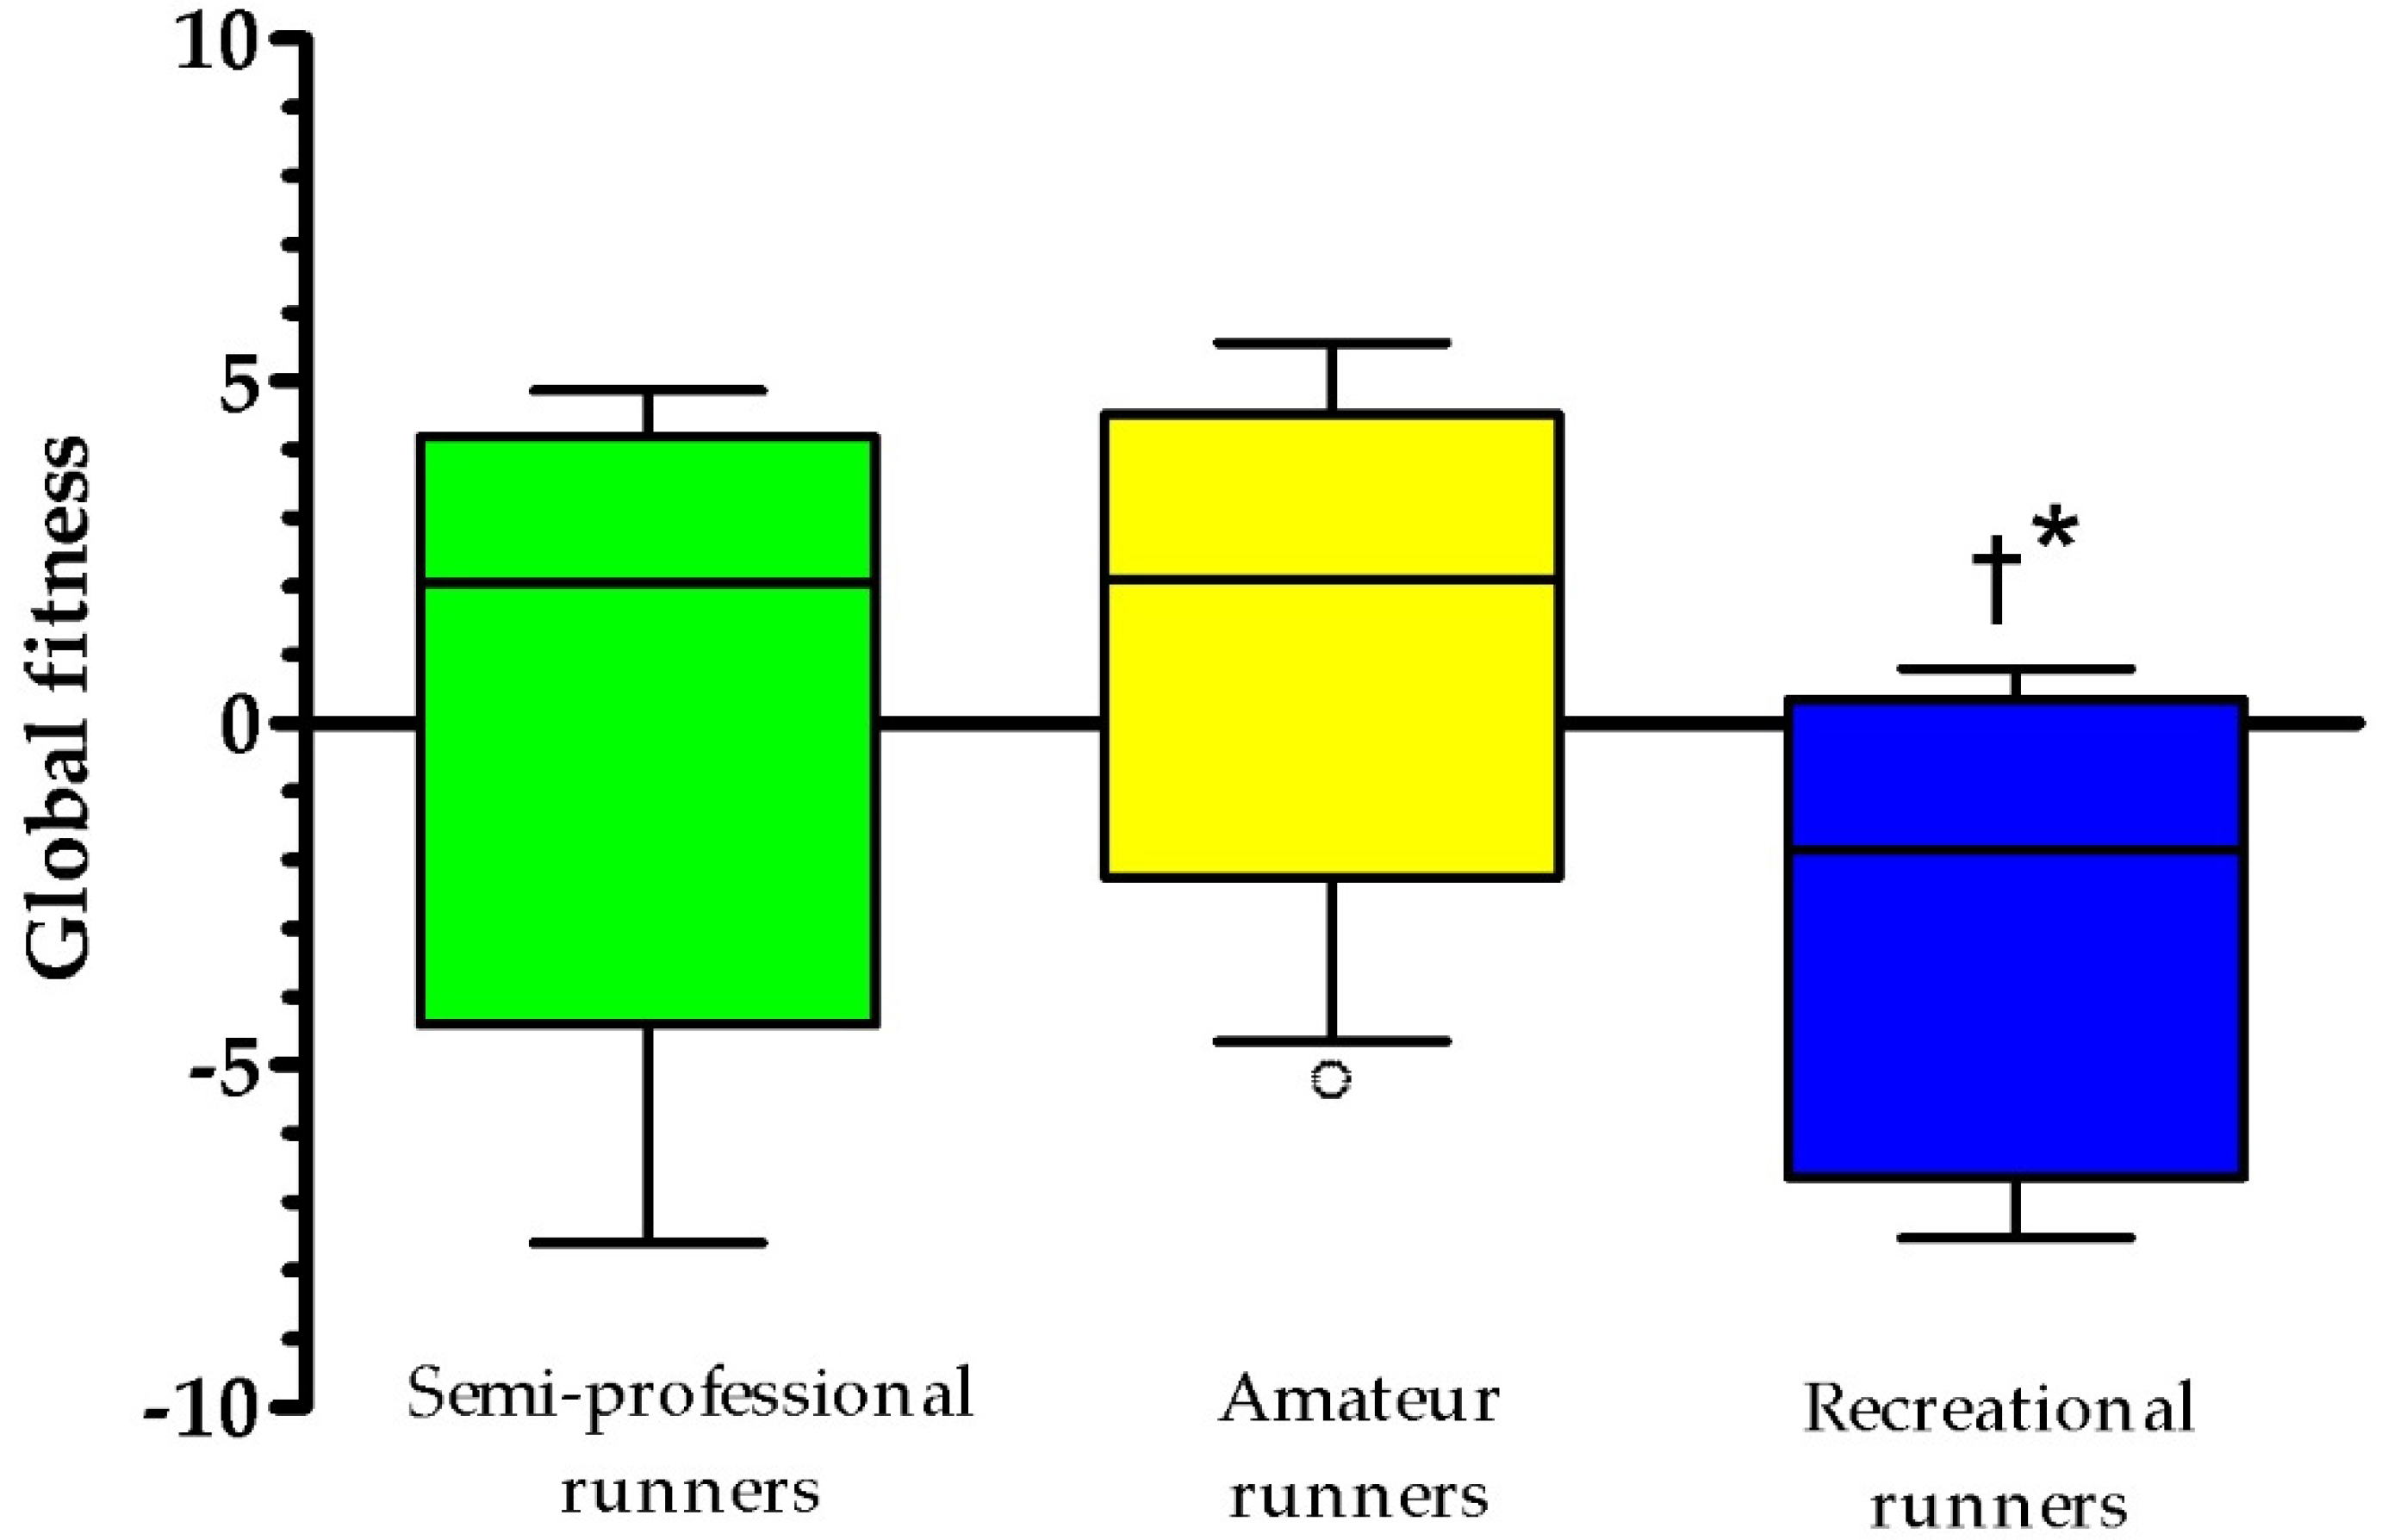
| Global fitness | 0.66 (4.0) | 1.49 (2.7) | −2.8 (3.0) | 1.90 (4.24) | 1.76 (2.85) | −1.85 (5.64) †,* |
| Training variables | ||||||
| Practice time (months) | 82.7 (68.9) | 68.4 (44.9) | 83.09 (93.3) | 84 (71) | 60 (87) | 48 (60) |
| Running pace (s) | 235.5 (27.6) | 283.8 (12.3) | 355.5 (50.2) | 247 (42) | 279 (19) | 343 (57) |
| Volume/week (km) | 46.7 (35.6) | 33.3 (18.3) | 24.3 (13.3) | 30 (48) | 37.5 (31) | 22 (10) |
| Training frequency | Frequency (%) | |||||
| ≤3 sessions/week | 4 (33.3%) | 5 (41.7%) | 10 (90.9%) | |||
| >3 sessions/week | 5 (41.70%) | 6 (41.7%) | 1 (9.10%) | |||
| Missing information ¥ | 3 (25%) | 2 (16.7%) | 2 (16.7%) | |||
| Variables | Model 1 Biological Variables | Model 2 Physical Fitness | Model 3 Training Variables | |||
|---|---|---|---|---|---|---|
| β | 95% CI (Lower–Upper) | β | 95% CI (Lower–Upper) | β | 95% CI (Lower–Upper) | |
| Constant | 175.06 | 110.07–240.06 | 1212.87 | 810.29–1615.43 | 1191.94 | 774.11–1609.76 |
| Age (years) | −0.66 | (−2.30)–0.99 | 1.79 * | 0.22–3.35 | 1.56 | (−0.08)–3.20 |
| Body fat% | 7.27 * | 4.00–10.55 | 2.90 | (−0.13)–5.94 | 2.16 | (−1.18)–5.51 |
| Agility (s) | 7.12 | (−17.25)–1.48 | 8.90 | (−16.86)–34.66 | ||
| Muscular power (cm) Isometric strength | −1.13 * −380.80 * | (−1.72)–(−0.52) (−617.05)–(−144.54) | −1.02 * −422.95 * | (−1.69)–(−0.35) (−689.65)–(−156.25) | ||
| Abdominal muscle endurance (rep) | −5.00 * | (−7.40)–(−2.59) | −4.81 * | (−7.52)–(−2.10) | ||
| Global Fitness | 28.43 * | 12.76–44.09 | 27.14 * | 9.52–45.03 | ||
| Stride frequency | −3.14 * | (−4.38)–(−1.89) | −2.99 * | (−4.29)–(−1.69) | ||
| Time practice (months) | 0.13 | (−0.08)–0.33 | ||||
| Frequency/week | −0.18 | (−16.31)–15.95 | ||||
| Volume (km/week) | −0.29 | (−1.41)–0.83 | ||||
| R2 | 0.47 | 0.84 | 0.86 | |||
Publisher’s Note: MDPI stays neutral with regard to jurisdictional claims in published maps and institutional affiliations. |
© 2021 by the authors. Licensee MDPI, Basel, Switzerland. This article is an open access article distributed under the terms and conditions of the Creative Commons Attribution (CC BY) license (https://creativecommons.org/licenses/by/4.0/).
Share and Cite
Thuany, M.; Gomes, T.N.; Almeida, M.B. Relationship between Biological, Training, and Physical Fitness Variables in the Expression of Performance in Non-Professional Runners. Sports 2021, 9, 114. https://0-doi-org.brum.beds.ac.uk/10.3390/sports9080114
Thuany M, Gomes TN, Almeida MB. Relationship between Biological, Training, and Physical Fitness Variables in the Expression of Performance in Non-Professional Runners. Sports. 2021; 9(8):114. https://0-doi-org.brum.beds.ac.uk/10.3390/sports9080114
Chicago/Turabian StyleThuany, Mabliny, Thayse Natacha Gomes, and Marcos B. Almeida. 2021. "Relationship between Biological, Training, and Physical Fitness Variables in the Expression of Performance in Non-Professional Runners" Sports 9, no. 8: 114. https://0-doi-org.brum.beds.ac.uk/10.3390/sports9080114