The Importance of Sport Event on Hotel Performance for Restarting Tourism After COVID-19


1
Faculty of Tourism and Hospitality Management, Singidunum University, 11000 Belgrade, Serbia
2
Faculty of Physical Education and Sports Management, Singidunum University, 11000 Belgrade, Serbia
3
Department for Sustainable Destination Development, Faculty of Tourism Studies Turistica, University of Primorska, 6320 Portorose, Slovenia
*
Author to whom correspondence should be addressed.
Societies 2020, 10(4), 90; https://0-doi-org.brum.beds.ac.uk/10.3390/soc10040090
Submission received: 3 November 2020
/
Revised: 20 November 2020
/
Accepted: 21 November 2020
/
Published: 25 November 2020
(This article belongs to the Special Issue Leisure, Sport and Tourism in Unpredictable Times—Issues, Challenges and Future Visions)
Abstract
:The aim of this study was to illustrate the importance of major sports events, such as marathons, and their economic impact on hotel performance during these unpredictable times for the events and tourism industry. The analysis was focused on the economic impact of the marathon event on hotel performance in the area hosting the race. For that purpose, we selected the Vienna City Marathon, held yearly in April, as a case. We hypothesized that there will be a higher impact of hotel performance a day prior to the marathon in regard to the hotel performance in multiple nonmarathon occasions. As indicators for hotel performance we have chosen hotel occupancy, revenue per available room, average daily rate and total revenue recorded for: day (always Saturday) prior to the marathon, year average, April average and average Saturday in April. Results from this study revealed significant effects of a marathon on three major hotel performance indicators (i.e., hotel occupancy, revenue per available room and total revenue). Findings from this study could serve the local government or event planners after the current crisis to justify financial investments in hosting a marathon or similar sports events for restarting tourism.
1. Introduction
Sports events and tourism are closely linked. Unfortunately, tourism and sports were, and still are among, the heavily impacted industries due to the current crisis caused by the new coronavirus (COVID-19). The recent pandemic showed that sporting events, i.e., a football match, were even identified as a propeller for the spread of the disease in northern Italy, one of the heavily impacted countries [1,2,3]. Although it is still hard to make precise estimates, it is clear that the year 2020 will result in a significant drop in tourism arrivals, number of hosted events, employment and revenue and value generated from these industries. Already 11 months in 2020 and it is clear that the virus will remain in the world population until the vaccine or an efficient medical treatment is found. When most of the work is moved online, and while the discussion of hosting big international events into the online world is taking place, it is argued that this might be the right moment to remember and reinforce the significance of sports events and economic impact they can have on tourism and hospitality. This is important since the “tourism restart” must eventually take place, and events in general and sporting events, in particular, are perceived as the drivers of this recovery.
This case study discovers the economic importance and impact of sport events such as marathons on the hotel industry in the area hosting the race during the unpredictable times for events industry, tourism and hospitality. In general, this research adds to the scope of knowledge of economic impact of sport events. In particular, the contribution of this case study is a precisely measured economic impact of marathons on hotel performance indicators before the event, during the event and in other multiple nonmarathon occasions. The study is based on data received by Smith Travel Research (STR) for research purposes for the period from 2007 to 2018. Although the research was conducted on a dataset from a prepandemic period, the largescale dataset included a significant time frame and also periods before and after the financial and economic crisis which could possibly demonstrate the fragility of the impact measured. The conclusions drawn from this research should be of practical use for sport event planners, event managers, but also destination management organizations (DMOs) and local and national tourism offices after this crisis is over within the context of the decision-making on whether to host a sport event or not.
1.1. Tourism and Sports Events in Unpredictable Times
The first official alert after several suspected cases on the, until then, strange pneumonia with unknown cause (today widely referred as COVID-19 or SARS CoV 2 or coronavirus) was reported on December 31st of 2019 [4]. Subsequently, 2 days after, 41 cases had already been confirmed from 59 suspected cases [5]. The virus started to spread quickly throughout the world due to the easiness of its transmission and the incredible connectivity of the modern world. It was March 11th when the World Health Organisation decided to declare a global pandemic. At the time, the virus had already been registered in more than 100 countries (114) with more than 4000 casualties [4]. Some argued that this notice from WHO came with a delay [6,7], while others claim that the absence of the worldwide accepted definition of a pandemic, and previous criticism of WHO were among the reasons why WHO was more restrained this time [8,9]. Nevertheless, after realizing the potential threat of the new crisis, countries around the globe started implementing different, but at the same time similar, measures to combat the pandemic in the absence of a vaccine or efficient medical treatment. There was a rising pressure to understand the outreach of the new situation, and thus this global outbreak quickly boosted the research in many areas, in order to find solutions to fight the consequences of the pandemic.
Previous research on pandemics already concluded that travel is absolutely central to epidemiology and disease surveillance [10]. Therefore, it should not be surprising that one of the very common measures to tackle the virus spread was the restrictions on travel. The UNWTO reported that by April 28th, 100% of countries and destinations had implemented travel-related restrictions ([11], p. 19). It was the time when for 4 weeks already 180 destinations (i.e., 83%) had these measures in place. Of course, it was clear at the time already that these measures will have significant effects on the economy in general and tourism and hospitality in particular. The most recent data by UNWTO show that we should expect a drop in international tourism arrivals close to 70% in 2020, while the recovery to the prepandemic levels from 2019 will not happen before 2023 [12]. All parts of the tourism and hospitality value chain have been affected and the UNWTO confidence index remains at the record lows [12]. There is still a rising pressure to understand the effects of this crisis, although the evidence suggests that this pandemic could not be compared in its effects with any of the previous pandemics, with exception of global influenza from 100 years ago [13]. However, the world is extremely different today than it was 100 years ago in many aspects.
Although some sports events and competitions restarted in several countries most of the industry remains on hold. Sports and events tourism will be restricted in some way until a vaccine is developed and widely deployed—a timeline that is estimated to be 12–18 months [14]. However, after the vaccine is developed, most countries will try to focus on industries that can arguably create the most positive impacts on the economy, society and environment. These are the aspects where, so far, sports events in general, and running events in particular, proved to be beneficial for a hosting area.
1.2. The Impact of Sport Events
Event impact studies are used as a support in the decision-making process for the purposes of understanding the extent to which an event will have an impact on the destinations image, local economy and local residents, environment etc. So far, sports events have proved to stimulate visiting intentions of potential tourists which are interested in the host nation [15] which will be significant for reinforcing interest and trust after the crisis. Sports events in a prepandemic period played a significant role in the marketing strategies of particular tourist destinations attracting significant attention from the media [16]. When the restart of tourism starts taking place, governments, and regulatory bodies will be significantly interested to stimulate activities that could rapidly produce benefits with their economic impact, social impact, environmental impact etc. So far, governments have widely used impact studies to make a decision on whether to host an event or not.
Most of the event impact studies are focused on economic impact, even though there were significant efforts made to assess the social impact [17,18,19,20,21,22,23,24] and environmental impact [25,26] of sports events. More recently, we are witnessing a growing number of studies estimating the perception of local residents towards the event ([20,21,27,28], p. 1), [29,30], yet some of them come with conflicting conclusions. This could be due to the fact that the resident’s perception can change over time, which is why this type of studies is often avoided by researchers [31]. Therefore, the decision to host a sporting event is a complex decision as it can cause short-term and long-term effects on the destination and the local community. Currently, the triple bottom line (TBL) is a commonly referred form of assessing the overall event impact, as it moves from a unidimensional paradigm to tripartite (economic, social and environmental) [32].
However, the economic impact has widely become, and still is, one of the most cited and most used techniques to decide on whether to host an event or not [22,33]. In addition, the economic impact assessment is also about to maintain as the most popular means to evaluate the public expenditure about the hosting of a sporting event [34]. Economic impact studies are often used for better estimation and understanding of the potential effects, but also to add an economic context in the decision-making process or to advocate and ask for support for some undertaking projects [35]. Sometimes economic impact studies may even have a political mission, to legitimize the political position to host the event, rather than to reveal the truth about the economic impact [36]. There is no consensus among researchers on the time, type or the size of the event that are always having a positive impact on the destination, local communities and environment. Sports events, especially mega-events, were proven to have an ambiguous economic impact on the destination. Yet, countries and cities are still competing heavily, allocating and committing financially significantly during the selection process [37].
This should not be a surprise as there is a significant portion of the research that questions the economic impact, especially long-term economic impact of mega-events on the destination [38,39,40]. The group of authors indicate that measuring all economic impact is an impossible task, however, they demonstrated a relevant starting point in measuring the impact of major or mega sports events, singling out the visitors who came to South Korea directly for the purposes of the World Cup, indirectly for the World Cup and who visited South Korea regardless of the World Cup [41]. In this study, they found a positive impact of a sports event on the macroeconomic figures of the destination. Another evidence from a study that analyzed the economic impact of hosting a more recent major sport event i.e., FIFA World Cup in 2010 in South Africa, also showed positive effects. The most significant impact has been reported in industries such as transportation and construction, however, the overall macroeconomic figures such as GDP and employment have also shown a significant increase [42]. Several attempts have been recorded trying to measure the average and the aggregate economic impact of sports events on the hosting destination i.e., city or a country. For example, Los Angeles Sports and Entertainment Commission found that the average economic impact of a major event is USD 32.2 million while Canadian Sport Tourism Alliance estimated the effect of USD 2 billion per year by sports tourism [43,44]). However, as sports events differ very much in size and in type, we argue that these estimations might lead decision-makers sometimes to a wrong conclusion.
More recently, the attention of the research community has shifted from mega-events to small events [45]. In general, they require fewer resources and it is more likely that nonmega events, would generate a more positive economic impact [46]. There is no, however, unique way researchers approach the topic of estimation of economic impact [47,48].
1.3. Estimating the Economic Impact
Within the most widely used methods for the assessment of economic impact, direct spending and the effect of economic multipliers stand out in particular. Direct spending is the most used method in the economic impact evaluation, yet it is also the one that could be miscalculated most easily [49]. Conversely, multiplier effect varies significantly between different areas and different events, and it depends on the calibration and decision rule [47,50]. There were several attempts of developing multiple models that could estimate the economic income effect of sports events [51]. However, as shown in the study, they showed significant differences in their estimates and thus could not be accepted for future evaluation. There is also a strong call to use cost-benefit analysis as it shows net benefits to the communities [46]. However, the cost-benefit analysis goes beyond the purely economic impact.
As shown, much of the research so far has largely focused on the benefits on the destination in general, as well as economic and social benefits to the community in particular. One study conducted by Lavoie and Rodriguez reported somewhat ambiguous results on whether a professional sports team can have a significant impact on hotel occupancy [52]. However, serious limitations were found in this study, especially since occupancy is not the best performance indicators, and is not exclusive to tourism and hospitality. The majority of recent studies reported a positive economic impact of sports events. There is little empirical evidence, however, on whether sports events, such as a marathon, can have a significant impact on the hotel industry and hotel performance indicators in specific.
If there is, however, a strong connection between hosting a running event such as a marathon on hotel performance, then we would also like to determine whether this impact is an effect somehow different from different types of events or multiple nonmarathon occasions (e.g., Easter weekend, Christmas days, etc.).
1.4. Running Events–Marathons
Running events such as marathons, long-distance and trail races have recorded considerable growth over the last years in terms of participants who join the race, as well as in the number of events that are being organized around the globe [50]. However, within the current literature of the economic impact of sports events, marathons are somewhat present. Yet, these events can attract more than 40,000 or 50,000 participants which mostly makes them unique among other sports events that attract more spectators rather than participants in terms of scale [53]. Not only can marathons attract a lot of participants according to some, but they can also generate a significant level of revenue. For example, the Boston Marathon, one of the six world’s major marathons, is estimated to generate almost USD 200 million [54]. Moreover, they tend to leave a long term impact on a destination increasing the opportunity for export and direct investments [55]. With limitations in attendance and impact measurement demonstrated by [48], in this study we focused on the difference made on hotel performance indicators in hotels in the area hosting the race due to the sport event i.e., the marathon that was held.
2. Materials and Methods
In this paper, a case study of the Vienna city marathon was used. It is a race staged regularly since 1984 [56]. In terms of scale, it would be hard to classify it either as major, mega, giga or small event as there is a serious ambiguity of what each of these categories is [57]. Vienna city marathon is, in fact, a series of sports events and races held in April, with the regular marathon distance race (42,125 m) as a major attraction. In 2018 it attracted over 40,000 participants from more than 125 countries [56].
Our focus for this study was to look at the impact that this event has on top-line performance indicators of hotels in Vienna and to investigate if this sport event has a somewhat different economic impact on hotels then other events multiple nonmarathon occasions. We used a similar methodology as presented in the study conducted by Depken and Fore. Although they focused on full-service restaurants, as dependent variables they chose total sales/revenue, number of customers served and revenue per customer, which corresponds with the variables we selected for our research that relate to hotel performance (total revenue, numbers of rooms sold/occupancy, revenue per available room and average daily rate) [58].
We hypothesized a higher impact of hotel performance a day prior to the marathon in regard to the hotel performance on multiple nonmarathon occasions. In order to not overestimate or miscalculate the effect of the marathon on hotel performance, we looked at the daily data for hotel performance during the last 12 years when the Vienna city marathon occurred.
Data for 4 different variables of hotel performance from 112 hotels in Vienna, Austria, for the last 12 years (2007–2018), were provided by a global leader in gathering data on hotels [59]. The average number of rooms for a hotel in the sample was 164, while all together 112 hotels operate with 18,423 rooms in total, which represents more than one-quarter of all hotel properties in Vienna and over 54% of room supply of Vienna [60]. All scales according to the STR scale classification has been included in the sample.
As indicators for hotel performance we have chosen hotel occupancy (OCC), total revenue (TRev), revenue per available room (RevPAR) and average daily rate (ADR) recorded on: day (always Saturday) prior to the marathon (SatM), year average (AvgY), April average (AvgA) and average Saturday in April ((AvgSatA) including Easter days). These variables have already been used as hotel performance indicators in numerous studies [61,62,63].
Descriptive statistics were calculated as mean, standard deviation, minimum and maximum value. Prior to all statistical analyses, data distribution normality was tested by a Kolmogorov–Smirnov test as well as by inspecting histograms, QQ plots and normality plots. Consecutively, 4 one-way analyses of variance (ANOVAs) were applied, to test the differences in SatM, AvgY, AvgA and AvgSatA, separately for OCC, RevPAR, ADR and Trev. In case of a significant main effect, further analysis consisted of a Bonfferoni post-hoc test. Eta squared (ŋ2) was also calculated together with ANOVAs, where the values of the effect sizes 0.01, 0.06 and above 0.14 were considered small, medium, and large, respectively. All statistical tests were analyzed using SPSS 20.0 software (SPSS Inc. Chicago, IL, USA). Alpha was set at 0.05.
3. Results
The descriptive statistics of observed variables, as well as the results of the Kolmogorov–Smirnov test for the same variables are presented in Table 1. The Kolmogorov–Smirnov test, as well as visual inspection of histograms, QQ plots and normality plots, showed no deviation from the normal data distribution. Moreover, Levene’s test for equality of variance was also performed, whereas Welch correction was used when variance was unequal.
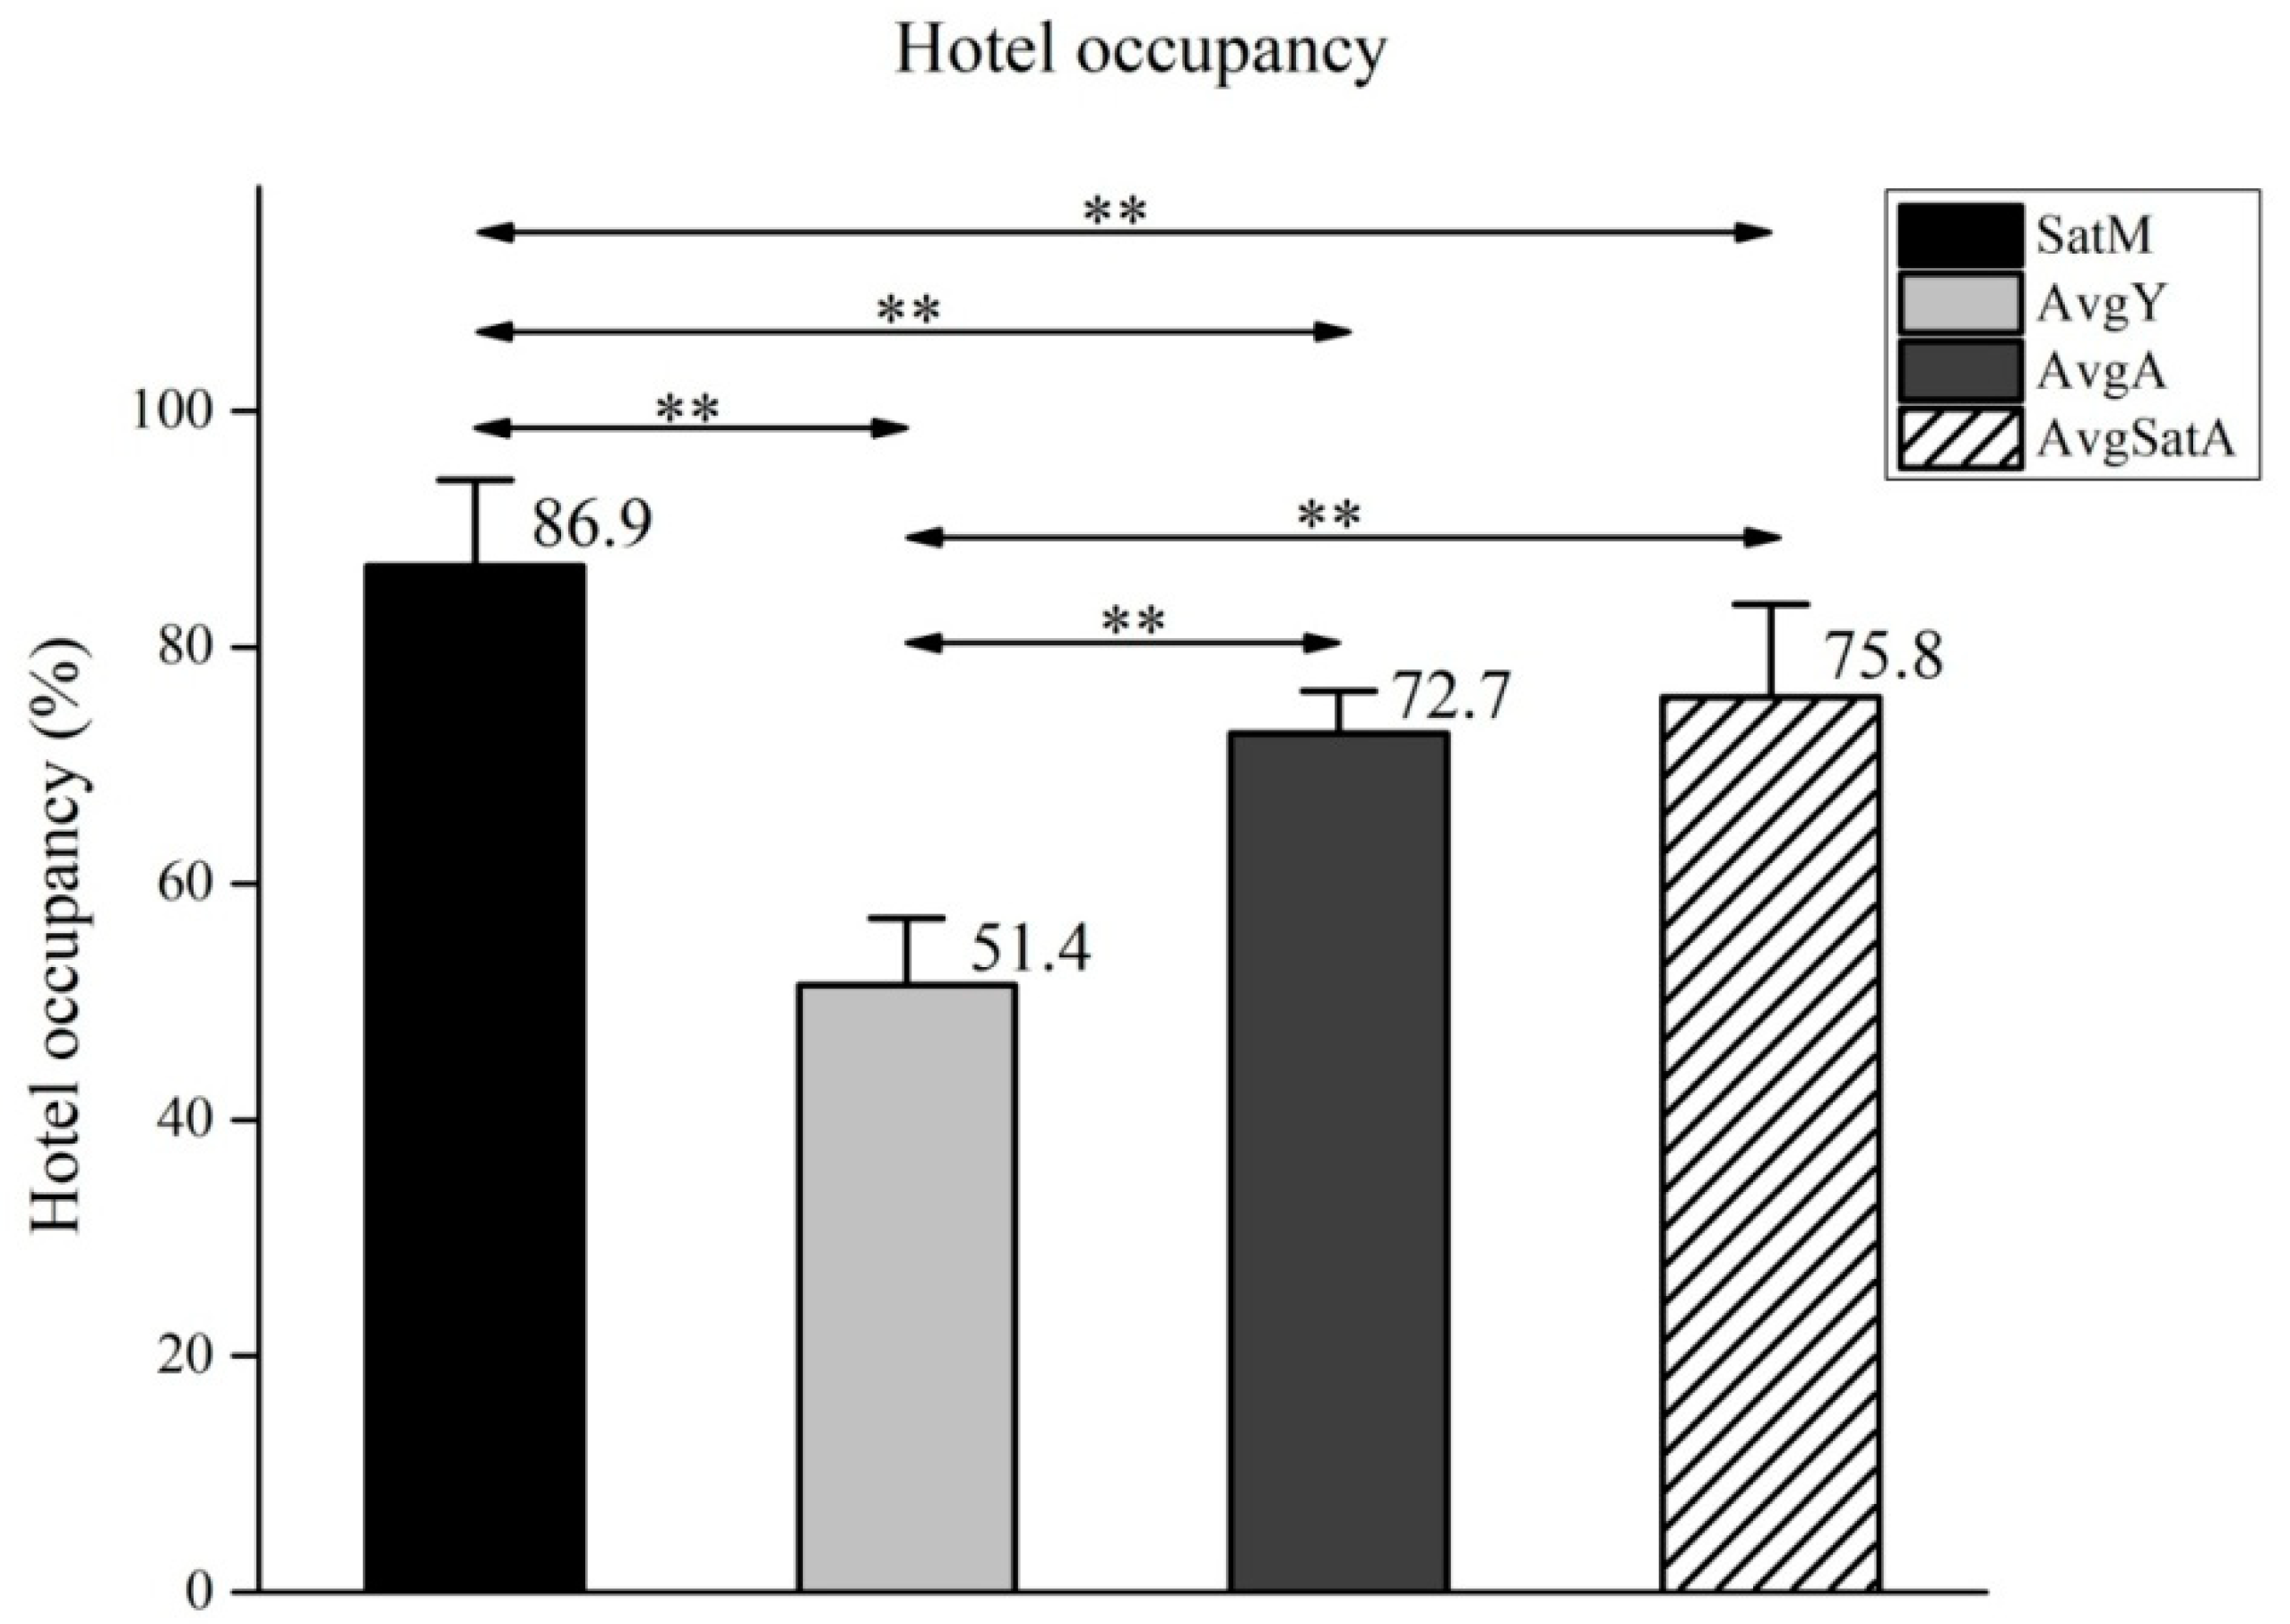
Figure 1 illustrates the percentage of hotel occupancy in Vienna, on SatM, AvgY, AvgA and AvgSatA. One way ANOVA showed a significant main effect for variable OCC (F(3,44) = 66.65, ŋ2 = 0.82, p < 0.01). Occupancy percentage observed in SatM, showed highest results when compared to the other variables. Moreover, SatM was significantly higher that all other variables examined at the level of p < 0.01 (Figure 1). Moreover, all other variables depicting occupancy in April (i.e., AvgSatA and AvgA), showed significantly higher occupancy than AvgY, also at the level of p < 0.01.
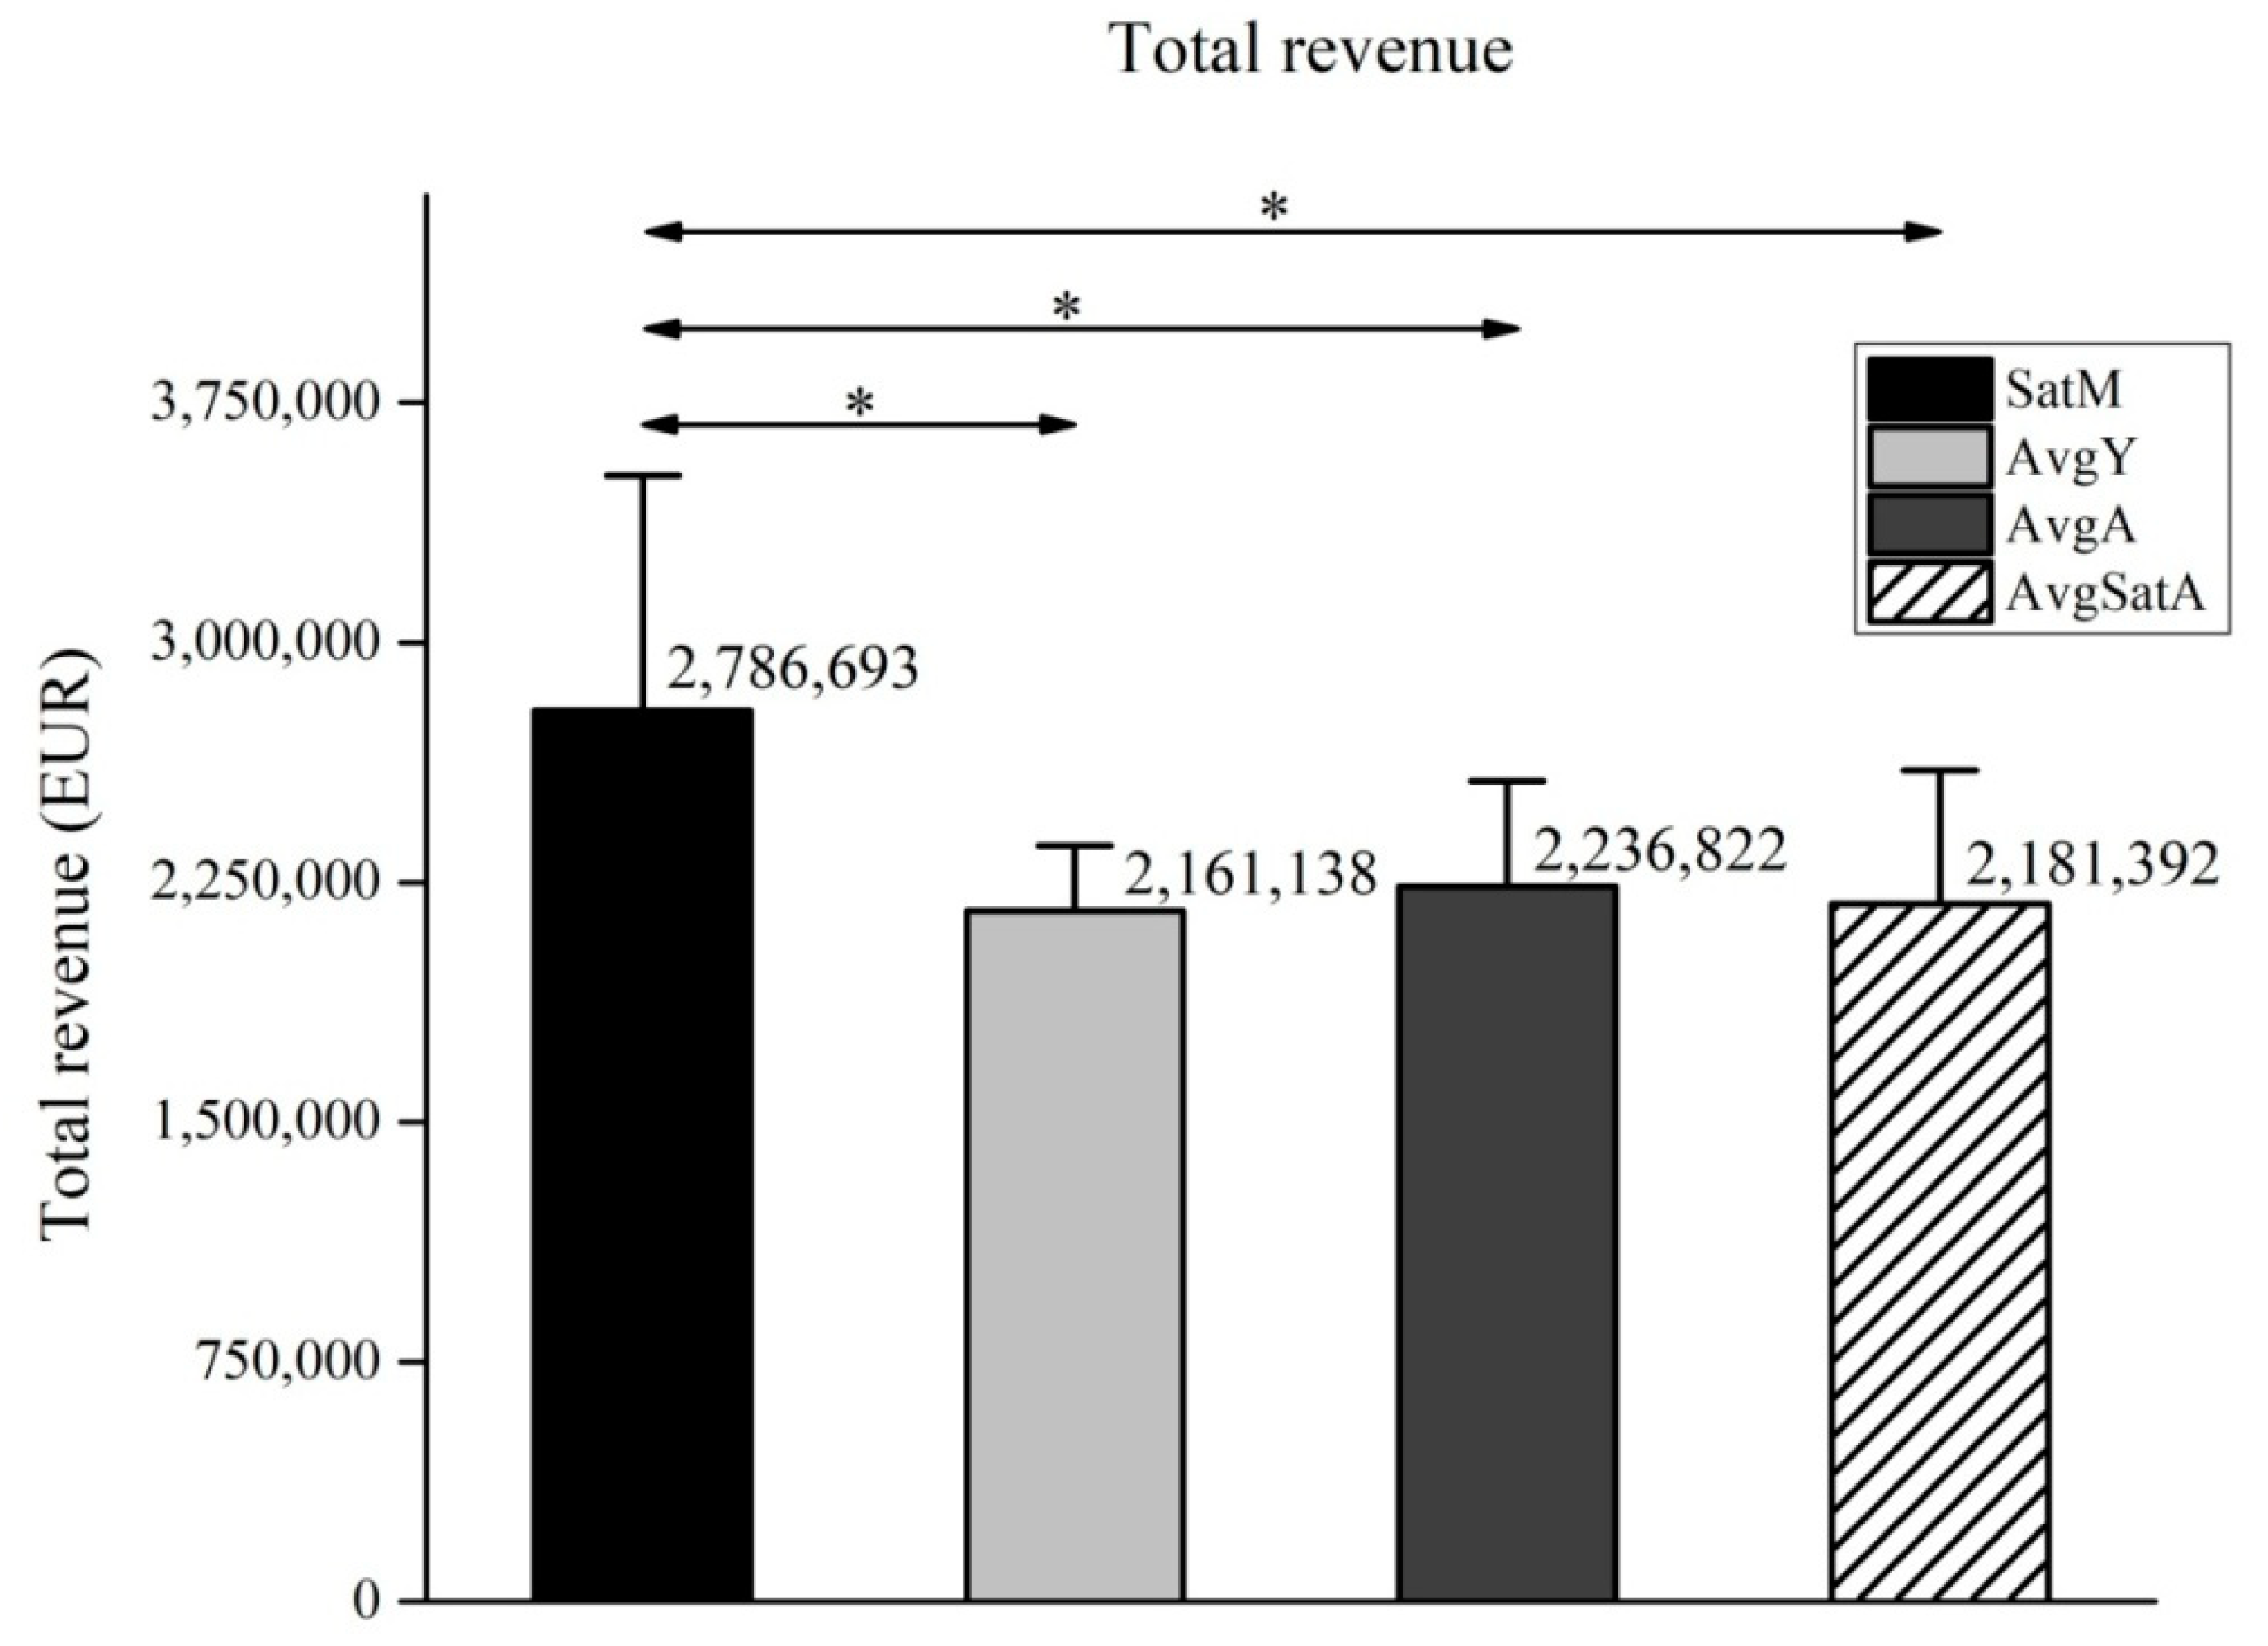
Figure 2 illustrates total revenue in Vienna hotels, on SatM, AvgY, AvgA and AvgSatA. One way ANOVA showed a significant main effect for variable Trev (F(3,44) = 4.93, ŋ2 = 0.25, p < 0.01). Furthermore, total revenue observed in SatM, showed the highest results when compared to the other variables, and consecutively was significantly higher than all other variables examined, at the level of p < 0.05 (Figure 2). There were no additional statistical differences between other variables regarding total revenue.
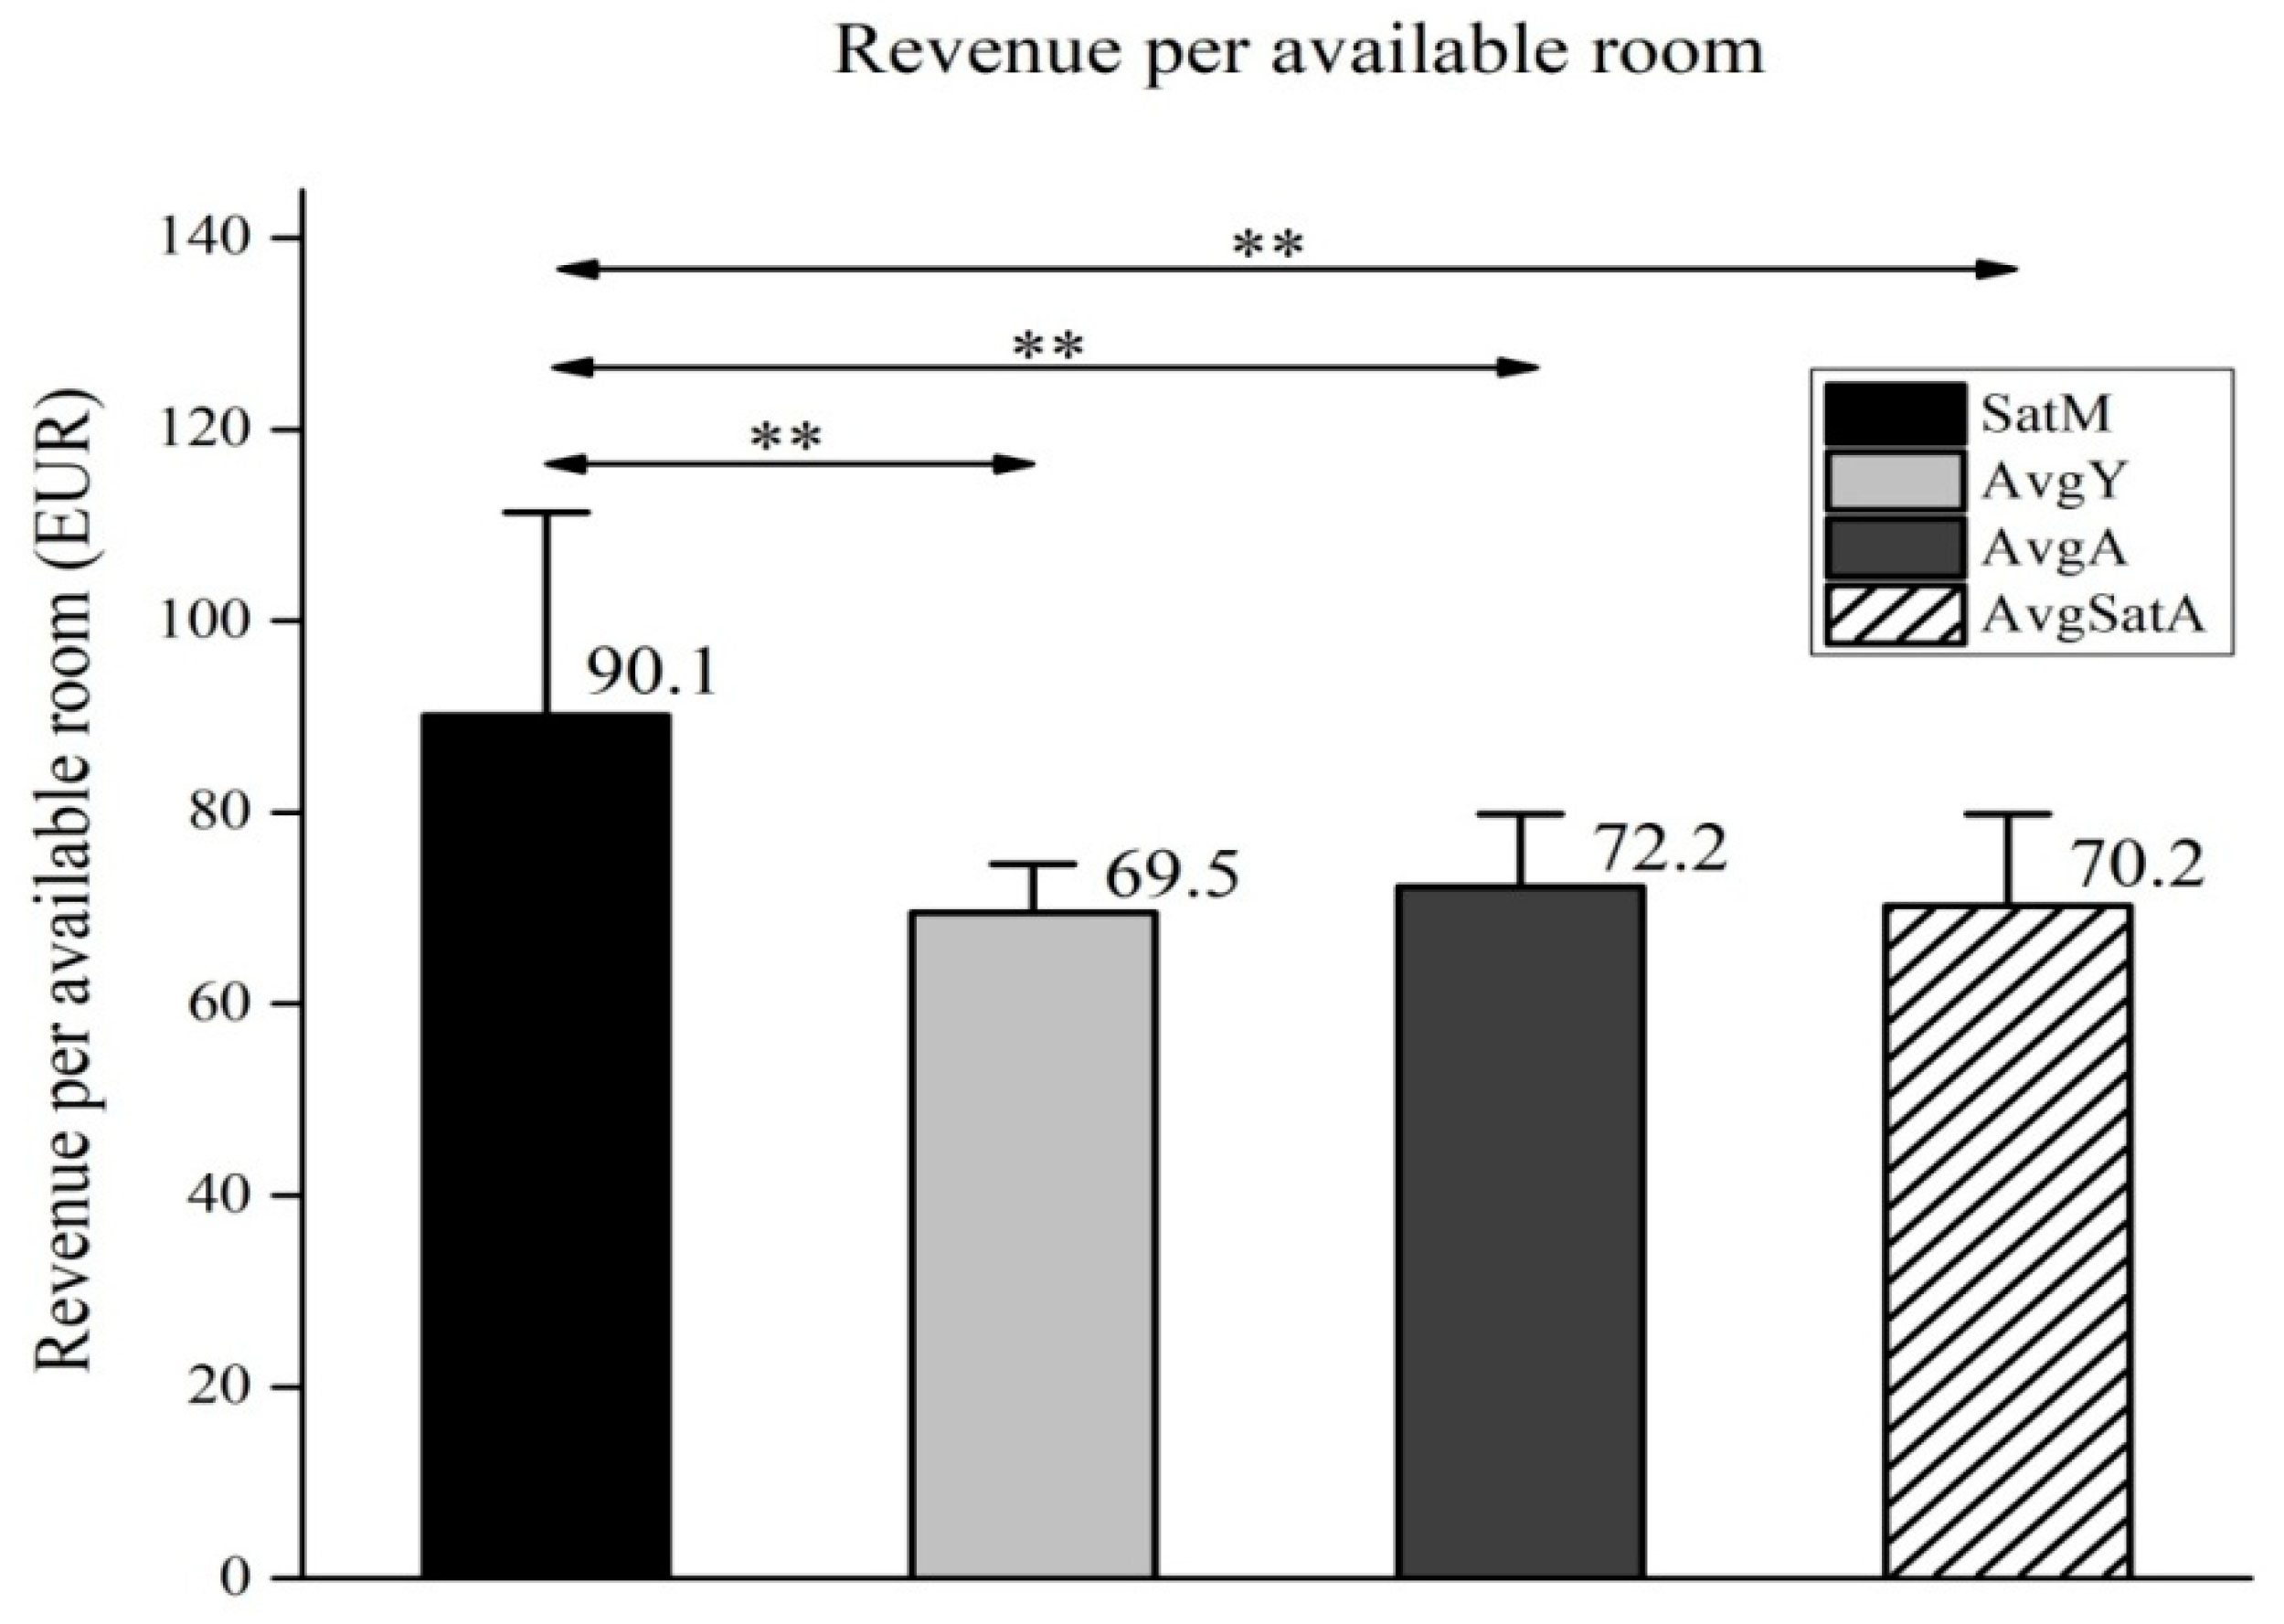
Figure 3 illustrates revenue per available room in Vienna hotels, on SatM, AvgY, AvgA and AvgSatA. One way ANOVA showed a significant main effect (F(3,44) = 7.31, ŋ2 = 0.33, p < 0.01). Comparable to the total revenue, revenue per available room observed in SatM also showed the highest results when compared to the other variables, and consecutively showed significantly higher revenue that all other variables examined (Figure 3). In this instance, level of p was < 0.01.
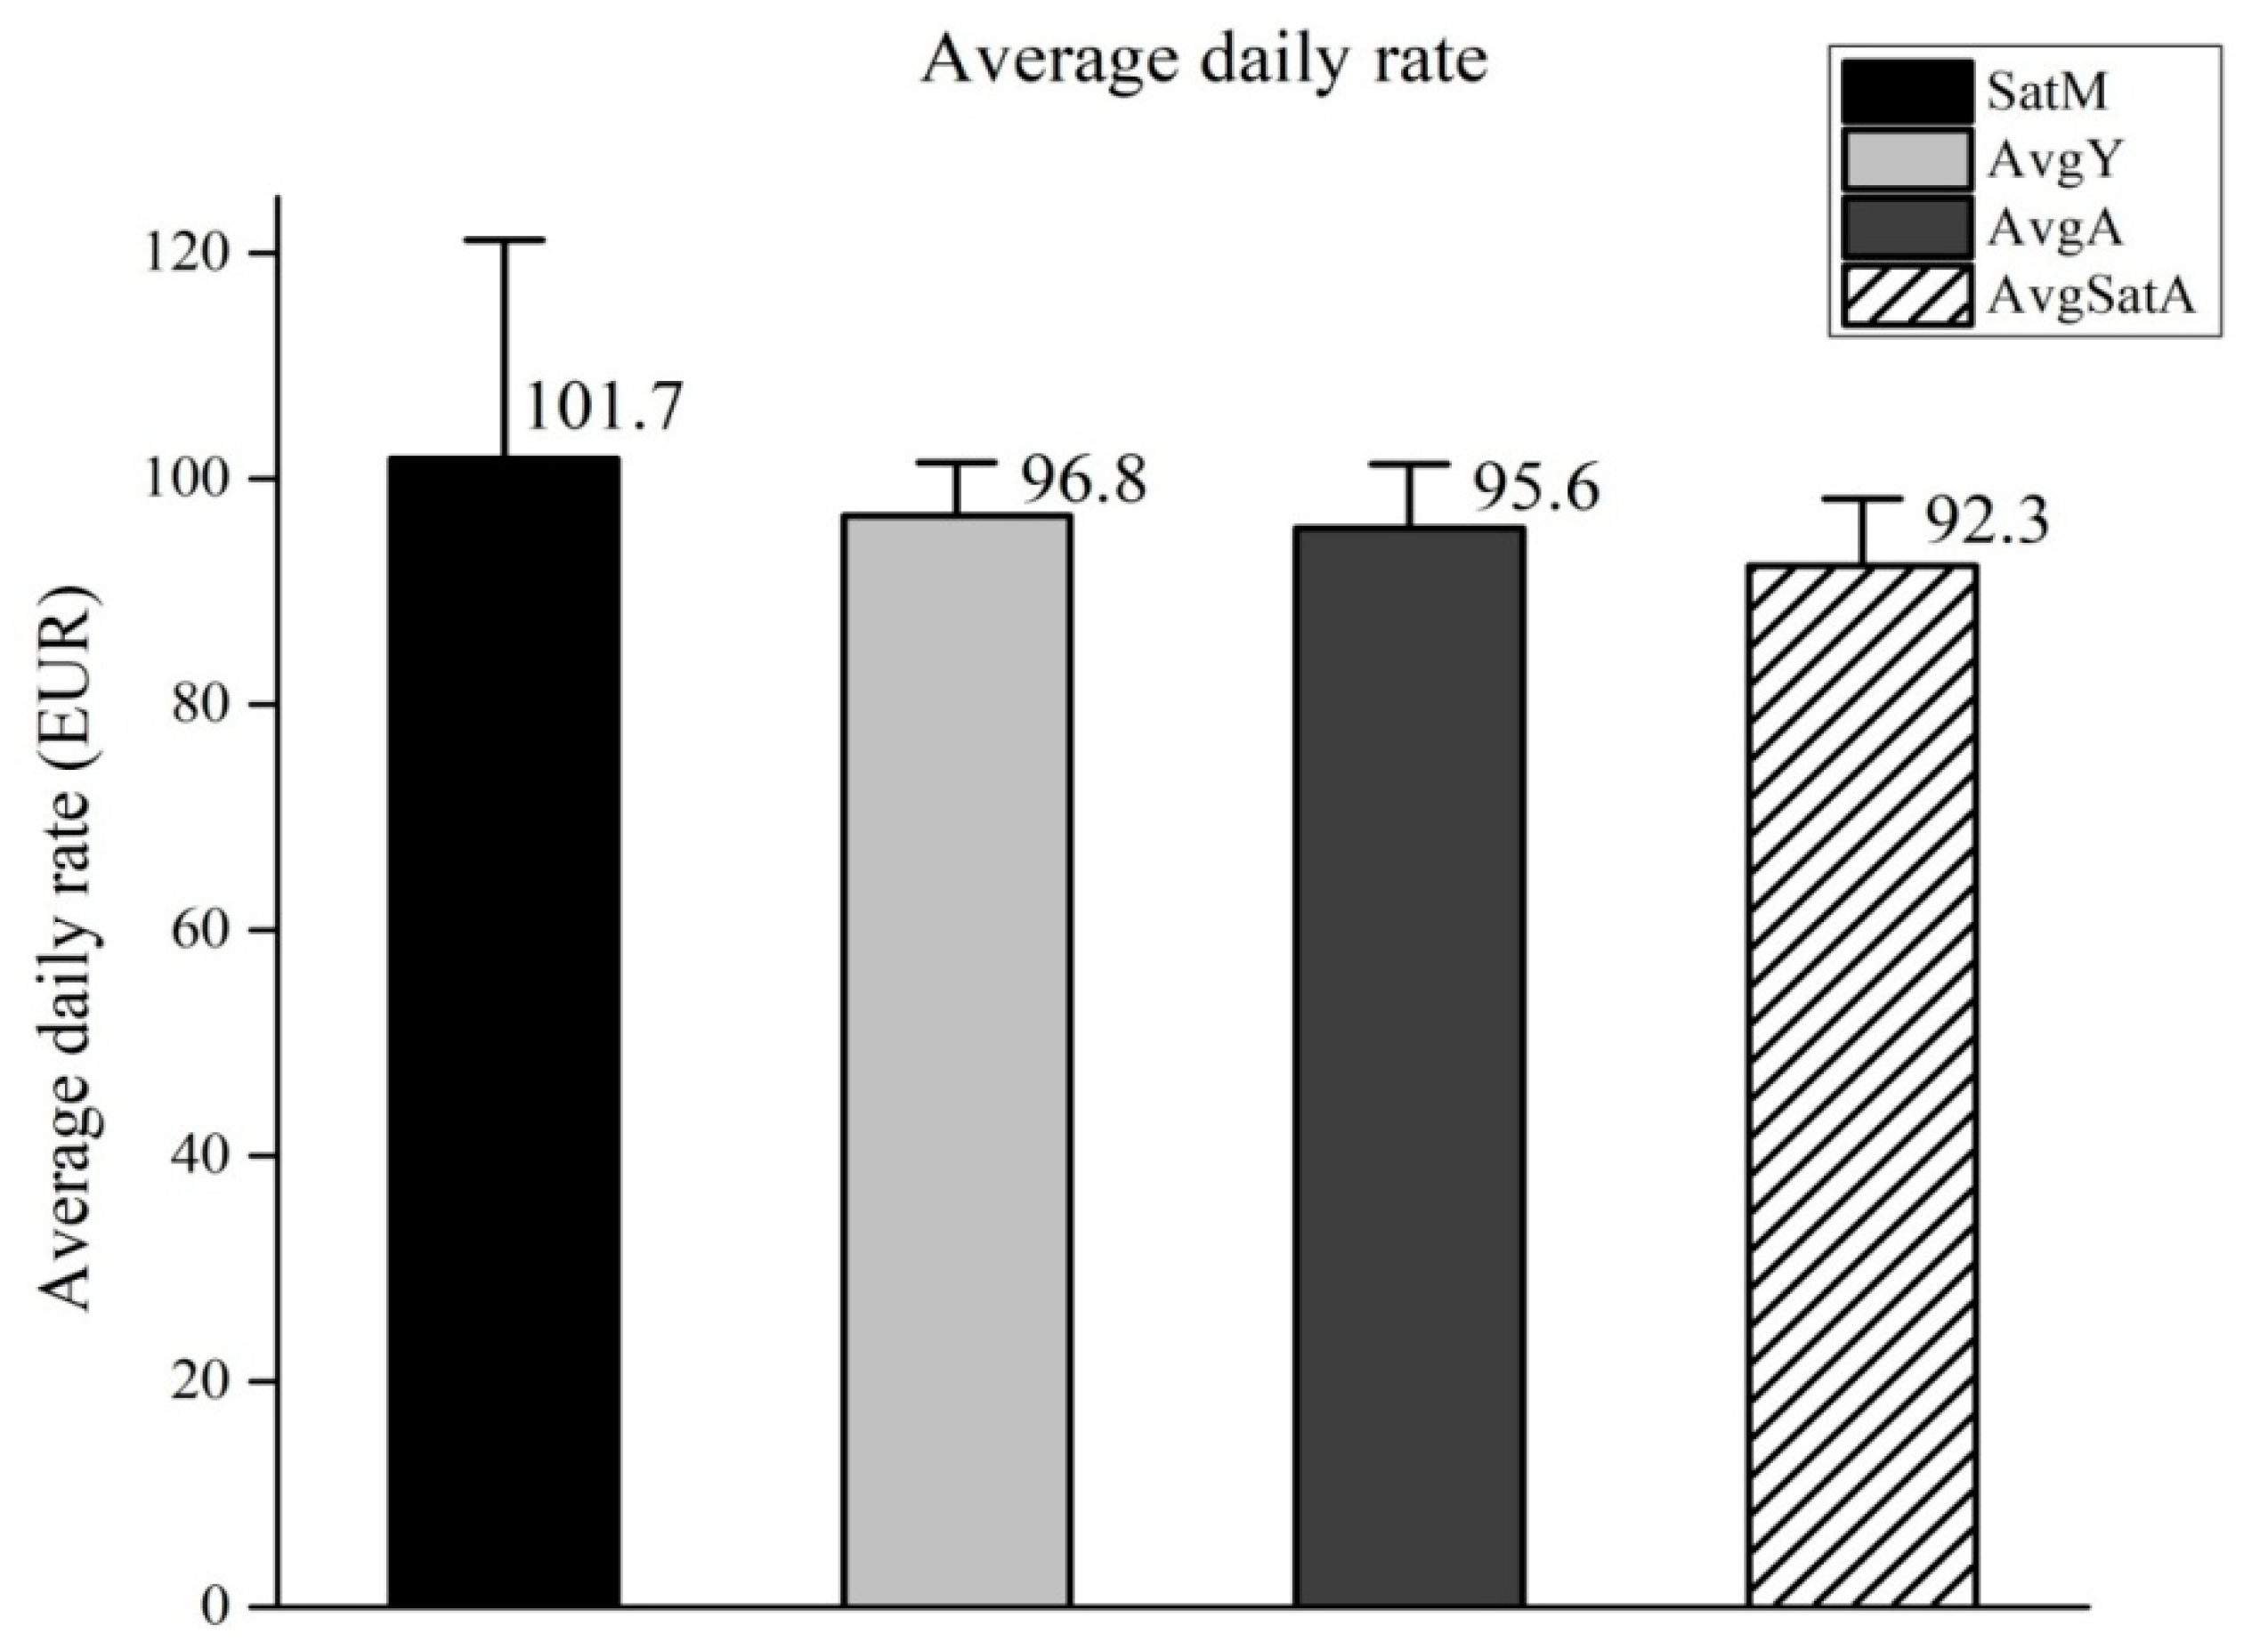
Finally, average daily rate in Vienna hotels, on SatM, AvgY, AvgA and AvgSatA is presented in Figure 4. Although mean results of SatM showed highest results, one-way ANOVA failed to prove a significant main effect for variable ADR (F(3,44) = 1.58, ŋ2 = 0.10, p = 0.21). As a result, further analysis of this variable (i.e., post-hoc analysis) was not performed.
4. Discussion
The main aim of the present study was to investigate the economic impact that marathons have on hotels found in the area hosting the event since it is estimated that sports events could be the driver to the recovery of destinations after the current crisis. Although the time frame in this particular study included a prepandemic period, the study reported results from a sample of 12 years with information before and after the big financial and economic crises in 2008 and 2009. Moreover, this study contributed to the recent body of knowledge about wider positive socio-economic impacts of sport tourism events which will be ultimately significant after the current crisis [20]. In order to maximize the positive impacts of running events after crisis events, planners are advised to adopt the adequate participants segmentation as argued by the group of authors [64].
To highlight the importance of running events, several studies so far demonstrated the significant impact of marathons on the local economy with the increased level of expenditure spent during the marathon in regard to single sporting events [65,66]. Since hospitality was one of the most severely affected industries, in the present study we aimed to focus on hotels and see if a sporting event such as marathon has a higher or different economic impact on hotel performance. Results from this study, using Vienna city marathon as a case, revealed a significant effect of the marathon on hotel performance, specifically on hotel occupancy, total revenue and revenue per available room. Therefore, we argue that sport events in general, and running events in particular should be reinforced after the current crisis resolves.
Results from our study showed that hotels recorded a significant increase in occupancy due to the marathon in regard to multiple non marathon occasions when hotels generally record high occupancy. As shown in Figure 1, the city of Vienna is, in general, more occupied during the month of April and on Saturdays in April, compared to the other days of the week. However, a day prior to the marathon, hotels recorded a higher occupancy than during the whole year on average. They also recorded higher OCC than the average Saturday in April and higher than the month of April on average. It is notable that Easter weekend normally occurs during the month of April and that we decided to include those days comparing them with a marathon. However, it was never the case in our study that the Easter holiday overlapped with the marathon. This goes to prove how effective running events and marathons are in attracting people to the destination. Marathoners that are running for recreational purposes are generally loyal to the races that are well organized and show high service quality [67]. Therefore, having a regularly staged running event in a period of the year that is not generally highly occupied might be a solid recommendation for event organizers having in mind how significantly marathons affect hotel occupancy. Furthermore, low season periods can be even more attractive for visitors, including runners, as they are not usually characterized by high prices [68].
The current pandemic has caused most marathons to be cancelled, while some race organizers managed to organize the race “virtually” or “online”. Although virtual races were managed to keep the morale of runners and event planners at the forefront, it is clear that most of the benefits that these races produce is missing. For instance, as presented in our study, Vienna City Marathon also affected the total revenue of the hotels included in the sample. Total revenue can be increased either by the increase in occupancy or the increase of average daily rate while maintaining the same occupancy. This indicator shows a significant effect of the marathon that surpasses the effect only on hotels. As shown in Figure 2, hotels recorded the increase in revenue which is significantly higher than the average daily revenue of hotels during the year, also higher than the average daily revenue during the month of April and also higher than every other Saturday in April. This confirms findings from several studies that used a different methodology [65,66].
Marathons as sports events generally attract not only runners (event participants) but also coaches, media representatives, runners’ companions and spectators. Therefore, it is important to underline that the increase in total revenue for hotels is beneficial for all stakeholders on the destination for numerous reasons. Visitors that are not participating in the marathon as runners, also contribute to the revenue of hotels, but not exclusively as they are consuming products and services on the destination before, during and after the event, i.e., the induced economic impact. Thus, the impact of the marathon is far bigger and could be of interest for the local authorities and people engaged in destination management as well.
Furthermore, RevPAR, which is one of the often-used performance indicators in hospitality also showed a significant increase because of the Vienna City Marathon (Figure 3). RevPAR is an indicator that is used to compare hotels of different sizes and is the one on which industry relies heavily [69]. This means that irrespective of hotel size, the marathon has a significant effect on the increase in hotel revenue. It is beneficial for hotel properties of different size and shows that runners and other visitors have little preference for the accommodation type regarding its size. These findings are quite significant for local authorities that should decide on actions they must take after the current crisis is over. We argue that the recovery of destinations after the current pandemic should be fairly balanced and not skewed towards luxury hotels or economy and budget hotels. In that sense, results from our study demonstrate that running events have a positive but also fair and balanced impact of hotels regardless of their scale. We argue that these findings could be of significant interest to hotel managers as well.
Finally, our results show that there was no significant increase in ADR day prior to the marathon, compared to the year average, April average, and average Saturday in April. Figure 4 showed that the average ADR a day prior to the marathon is higher than other compared occasions. Even though there was no significant increase in ADR, as shown before, the rise in occupancy is the one that leads to the increased revenue and may explain the decision of hoteliers to keep the prices at the same level and earn more recording a higher occupancy. However, we suggest the use of dynamic pricing policy for hotel managers during the highly occupied events, like a marathon, since it was shown that it can increase the revenue by 4–9% [70].
5. Conclusions
This study added to the scope of knowledge about the effects of sports events such as marathons to the local economy and should be of use to the hotel managers and local authorities that consider hosting sports event such as a marathon. These conclusions should underline the economic importance and impact of sport events after the current COVID-19 pandemic is over. Contrary to business meetings and events, sport events are hardly possible to produce online. Therefore, as soon as the local and international situation with coronavirus is put under control, sport, and running events such as marathons, are argued to be a perfect stimulus for the economic recovery of hotel industry in the areas that were seriously affected.
The results within the present study showed that sports events such as marathons can have a significant economic effect on hotel performance in the area hosting the event. Results from this study revealed significant effects on three major hotel performance indicators: hotel occupancy revenue per available room and total revenue. It did not show, however, significant effect on the average daily rate.
These findings are to some extent in line with previous research that indicated positive economic impacts of marathons on the destination and on the local community. However, we focused solely on hotels and their performance, using empirical evidence, rather than effects of a multiplier or the use of direct expenditure. It is argued that sports events in general and running events like marathons, in particular, could be the driver of the recovery after the pandemic is put under control.
Several limitations of this study should be attributed. First, this study is a case study, meaning it included only one city and one event (i.e., Vienna City Marathon). Although a period of 12 years was included in the analysis and that the dataset included results before and after the economic and financial crisis it is still hard to predict how marathon runners that are traveling for the purposes of participation in running events will behave after the current crisis is over. Furthermore, we emphasized the day before the marathon as a day on hotel performance. However, future studies should research the impact of long-term effects of a marathon on hotel performance, as well as on other economic and non-economic indicators.
Author Contributions
Conceptualization, D.B. and I.C.; Formal analysis, I.C.; Methodology, D.B. and M.L.; Resources, D.B.; Supervision, M.L. and E.J.; Validation, I.C.; Writing–original draft, D.B. and I.C.; Writing–review & editing, M.L. All authors have read and agreed to the published version of the manuscript.
Funding
This research received no external funding.
Acknowledgments
The authors would like to thank Smith Travel Research (STR) for providing us with valuable datasets for this study.
Conflicts of Interest
The authors declare no conflict of interest.
References
- Bengel, C. Coronavirus: How a Champions League Match Contributed to Italy’s COVID-19 Outbreak. 26 March 2020. Available online: https://www.cbssports.com/soccer/news/coronavirus-how-a-champions-league-match-contributed-to-italys-covid-19-outbreak/ (accessed on 18 July 2020).
- Robinson, J. The Soccer Match that Kicked off Italy’s Coronavirus Disaster. The Wall Street Journal, 1 April 2020. Available online: https://www.wsj.com/articles/the-soccer-match-that-kicked-off-italys-coronavirus-disaster-11585752012 (accessed on 10 November 2020).
- Rudan, I. A cascade of causes that led to the COVID-19 tragedy in Italy and in other European Union countries. J. Glob. Health 2020, 10, 010335. [Google Scholar] [CrossRef] [PubMed]
- World Health Organization. Coronavirus Disease (COVID-19) Pandemic. 2020. Available online: https://www.euro.who.int/en/health-topics/health-emergencies/coronavirus-covid-19/novel-coronavirus-2019-ncov (accessed on 17 July 2020).
- Huang, C.; Wang, Y.; Li, X.; Ren, L.; Zhao, J.; Hu, Y.; Zhang, L.; Fan, G.; Xu, J.; Gu, X.; et al. Clinical features of patients infected with 2019 novel coronavirus in Wuhan, China. Lancet 2020, 395, 497–506. [Google Scholar] [CrossRef] [Green Version]
- Eemerald Insight. The WHO’s COVID-19 pandemic declaration may be late. Emerald Expert Brief. 2020. [Google Scholar] [CrossRef]
- Mackenzie, D. Covid-19: Why Won’t the WHO Officially Declare a Coronavirus Pandemic? New Scientist, 26 February 2020. Available online: https://www.newscientist.com/article/2235342-covid-19-why-wont-the-who-officially-declare-a-coronavirus-pandemic/ (accessed on 18 July 2020).
- Buranyi, S. The WHO v coronavirus: Why it can’t handle the pandemic. Guardian, 10 April 2020. Available online: https://www.theguardian.com/news/2020/apr/10/world-health-organization-who-v-coronavirus-why-it-cant-handle-pandemic (accessed on 10 November 2020).
- Hall, C.M.; Scott, D.; Gössling, S. Pandemics, transformations and tourism: Be careful what you wish for. Tour. Geogr. 2020, 22, 577–598. [Google Scholar] [CrossRef]
- Khan, K.; Arino, J.; Hu, W.; Raposo, P.; Sears, J.; Calderon, F.; Heidebrecht, C.; Macdonald, M.; Liauw, J.; Chan, A.; et al. Spread of a Novel Influenza A (H1N1) Virus via Global Airline Transportation. N. Engl. J. Med. 2009, 361, 212–214. [Google Scholar] [CrossRef] [PubMed]
- UNWTO. COVID—19 Related Travel Restrictions a Global Review for Tourism; UNWTO: Madrid, Spain, 2020; Available online: https://webunwto.s3.eu-west-1.amazonaws.com/s3fs-public/2020-04/TravelRestrictions%20-%2028%20April.pdf (accessed on 10 November 2020).
- World Tourism Organization. UNWTO World Tourism Barometer and Statistical Annex. UNWTO World Tour. Barom. 2020, 18, 1–36. [Google Scholar] [CrossRef]
- Fernandes, N. Economic Effects of Coronavirus Outbreak (COVID-19) on the World Economy. SSRN Electron. J. 2020. [Google Scholar] [CrossRef]
- Liu, C.; Zhou, Q.; Li, Y.; Garner, L.V.; Watkins, S.P.; Carter, L.J.; Smoot, J.; Gregg, A.C.; Daniels, A.D.; Jervey, S.; et al. Research and Development on Therapeutic Agents and Vaccines for COVID-19 and Related Human Coronavirus Diseases. ACS Cent. Sci. 2020, 6, 315–331. [Google Scholar] [CrossRef]
- Ulvnes, A.M.; Solberg, H.A. Can major sport events attract tourists? A study of media information and explicit memory. Scand. J. Hosp. Tour. 2016, 16, 143–157. [Google Scholar] [CrossRef]
- Hede, A.-M. Sports-events, tourism and destination marketing strategies: An Australian case study of Athens 2004 and its media telecast. J. Sport Tour. 2005, 10, 187–200. [Google Scholar] [CrossRef]
- Doherty, A. The volunteer legacy of a major sport event. J. Policy Res. Tour. Leis. Events 2009, 1, 185–207. [Google Scholar] [CrossRef] [Green Version]
- Inoue, Y.; Havard, C.T. Determinants and Consequences of the Perceived Social Impact of a Sport Event. J. Sport Manag. 2014, 28, 295–310. [Google Scholar] [CrossRef]
- Lee, S.P.; Cornwell, T.B.; Babiak, K. Developing an Instrument to Measure the Social Impact of Sport: Social Capital, Collective Identities, Health Literacy, Well-Being and Human Capital. J. Sport Manag. 2013, 27, 24–42. [Google Scholar] [CrossRef]
- Perić, M. Estimating the Perceived Socio-Economic Impacts of Hosting Large-Scale Sport Tourism Events. Soc. Sci. 2018, 7, 176. [Google Scholar] [CrossRef] [Green Version]
- Poczta, J.; Dąbrowska, A.; Kazimierczak, M.; Gravelle, F.; Malchrowicz-Mośko, E. Overtourism and Medium Scale Sporting Events Organisations—The Perception of Negative Externalities by Host Residents. Sustainability 2020, 12, 2827. [Google Scholar] [CrossRef] [Green Version]
- Kersulić, A.; Perić, M.; Wise, N. Assessing and Considering the Wider Impacts of Sport-Tourism Events: A Research Agenda Review of Sustainability and Strategic Planning Elements. Sustainability 2020, 12, 4473. [Google Scholar] [CrossRef]
- Lesjak, M.; Axelsson, E.; Mekinc, J. Sports Spectators Tourism Reason When Attending Major Sporting Events: Euro Basket 2013, Koper, Slovenia. Eur. J. Tour. Res. 2017, 16, 74–91. [Google Scholar]
- Lesjak, M.; Axelsson, E.P.; Uran, M. The Perceived Social Impacts of the EuroBasket 2013 on Koper Residents. Acad. Tur. Tour. Innov. 2014, 7, 53–68. [Google Scholar]
- Han, J.H.; Nelson, C.M.; Kim, C. Pro-environmental behavior in sport event tourism: Roles of event attendees and destinations. Tour. Geogr. 2015, 17, 719–737. [Google Scholar] [CrossRef]
- Mallen, C.; Stevens, J.; Adams, L.; McRoberts, S. The Assessment of the Environmental Performance of an International Multi-Sport Event. Eur. Sport Manag. Q. 2010, 10, 97–122. [Google Scholar] [CrossRef]
- Balduck, A.L.; Maes, M.; Buelens, M. The Social Impact of the Tour de France: Comparisons of Residents’ Pre- and Post-event Perceptions. Eur. Sport Manag. Q. 2011, 11, 91–113. [Google Scholar] [CrossRef]
- Cheng, E.; Jarvis, N. Residents’ Perception of the Social-Cultural Impacts of the 2008 Formula 1 Singtel Singapore Grand Prix. Event Manag. 2010, 14, 91–106. [Google Scholar] [CrossRef] [Green Version]
- Li, X.; Hsu, C.H.C.; Lawton, L.J. Understanding Residents’ Perception Changes toward a Mega-Event through a Dual-Theory Lens. J. Travel Res. 2014, 54, 396–410. [Google Scholar] [CrossRef]
- Ma, S.C.; Wu, J.H.; Rotherham, I.D. Host residents’ perception changes on major sport events. Eur. Sport Manag. Q. 2013, 13, 511–536. [Google Scholar] [CrossRef]
- Jönsson, C.; Lewis, C.C. Impacts of Hosting a Sport Event in Tourism High Season. Recreat. Soc. Afr. Asia Lat. Am. 2014, 5, 1. [Google Scholar]
- Hede, A.-M. Managing Special Events in the New Era of the Triple Bottom Line. Event Manag. 2007, 11, 13–22. [Google Scholar] [CrossRef]
- Maennig, W. Major Sports Events: Economic Impact. SSRN Electron. J. 2017. [Google Scholar] [CrossRef] [Green Version]
- Dwyer, L.; Forsyth, P.; Spurr, R. Economic Impact of Sport Events: A Reassessment. Tour. Rev. Int. 2006, 10, 207–216. [Google Scholar] [CrossRef]
- Dobner, M.; Mancini, J. Interpreting Economic Impact Studies in Regulatory and Tribunal Settings—Avoiding Common Pitfalls; Lexology: London, UK, 2015; Available online: https://www.lexology.com/library/detail.aspx?g=9c9e0e71-34c2-4289-ad7b-1733a21fd112 (accessed on 10 November 2020).
- Crompton, J.L. Economic Impact Studies: Instruments for Political Shenanigans? J. Travel Res. 2006, 45, 67–82. [Google Scholar] [CrossRef]
- Karakaya, E.; Devecioglu, S. An evaluation of the economic commitments by Istanbul and Tokyo, two candidate cities for the Summer Olympics of 2020. Sci. J. Educ. Sports Health 2015, 16, 216. [Google Scholar]
- Baade, R.A.; Matheson, V.A. The Quest for the Cup: Assessing the Economic Impact of the World Cup. Reg. Stud. 2004, 38, 343–354. [Google Scholar] [CrossRef]
- Maennig, W.; Zimbalist, A. International Handbook on the Economics of Mega Sporting Events; Edward Elgar Publishing: Cheltenham, UK, 2012. [Google Scholar]
- Tien, C.; Lo, H.-C.; Lin, H.-W. The Economic Benefits of Mega Events: A Myth or a Reality? A Longitudinal Study on the Olympic Games. J. Sport Manag. 2011, 25, 11–23. [Google Scholar] [CrossRef]
- Lee, C.-K.; Taylor, T. Critical reflections on the economic impact assessment of a mega-event: The case of 2002 FIFA World Cup. Tour. Manag. 2005, 26, 595–603. [Google Scholar] [CrossRef]
- Bohlmann, H.R.; Van Heerden, M.J. The Impact of Hosting a Major Sport Event on the South African Economy. J. Tour. 2005, 26, 595–603. [Google Scholar]
- Canadian Sport Tourism Alliance. Sample EIA Reports|Canadian Sport Tourism Alliance. 2020. Available online: https://canadiansporttourism.com/industry-tools/sample-eia-reports.html (accessed on 16 February 2020).
- Los Angeles Sports & Entertainment Commission. Media Room|LosAngeles|Sports & Entertainment Commission. 2020. Available online: http://lasec.net/economic-impact-reports/ (accessed on 6 February 2020).
- Agha, N.; Taks, M. A theoretical comparison of the economic impact of large and small events. Int. J. Sport Financ. 2015, 10, 103–121. [Google Scholar]
- Taks, M.; Chalip, L.; Green, B.C. Impacts and strategic outcomes from non-mega sport events for local communities. Eur. Sport Manag. Q. 2015, 15, 1–6. [Google Scholar] [CrossRef] [Green Version]
- Crompton, J.L. Economic Impact Analysis of Sports Facilities and Events: Eleven Sources of Misapplication. J. Sport Manag. 1995, 9, 14–35. [Google Scholar] [CrossRef] [Green Version]
- Davies, L.; Coleman, R.; Ramchandani, G. Measuring attendance: Issues and implications for estimating the impact of free-to-view sports events. Int. J. Sports Mark. Spons. 2010, 12, 6–18. [Google Scholar] [CrossRef] [Green Version]
- Mondello, M.J.; Rishe, P. Comparative Economic Impact Analyses: Differences Across Cities, Events, and Demographics. Econ. Dev. Q. 2004, 18, 331–342. [Google Scholar] [CrossRef]
- Cobb, S.; Olberding, D.J. The Importance of Import Substitution in Marathon Economic Impact Analysis. Int. J. Sport Financ. 2007, 2, 13. [Google Scholar]
- Daniels, M.J.; Norman, W.C.; Henry, M.S. Estimating income effects of a sport tourism event. Ann. Tour. Res. 2004, 31, 180–199. [Google Scholar] [CrossRef]
- Lavoie, M.; Rodríguez, G. The Economic Impact of Professional Teams on Monthly Hotel Occupancy Rates of Canadian Cities. J. Sports Econ. 2005, 6, 314–324. [Google Scholar] [CrossRef]
- Badenhausen, K. NYC Marathon 2018: By The Numbers. Forbes, 3 November 2018. Available online: https://www.forbes.com/sites/kurtbadenhausen/2018/11/03/nyc-marathon-2018-by-the-numbers/ (accessed on 24 May 2019).
- Boston Athletic Association. 2017. Available online: https://www.baa.org/2017-boston-marathon-will-mean-1922-million-greater-boston-economy (accessed on 24 May 2019).
- Papanikos, G.T. The Economic Effects of a Marathon as a Sport Tourism Event. Athens J. Sports 2015, 2, 225–239. [Google Scholar] [CrossRef]
- Vienna City Marathon. 2019. Available online: https://www.vienna-marathon.com/ (accessed on 24 May 2019).
- Muller, M.W. What makes an event a mega-event? Definitions and sizes. Leis. Stud. 2015, 34, 627–642. [Google Scholar] [CrossRef] [Green Version]
- Ii, C.A.D.; Fore, B.L. Firm-Level Economic Activity Before, During, and After Local Events: A Case Study. J. Sports Econ. 2020, 21, 327–334. [Google Scholar] [CrossRef]
- STR Global. 2019. Available online: https://www.strglobal.com/ (accessed on 24 May 2019).
- B2B Vienna. Vienna’s B2B Service for the Tourism Industry. 2018. Available online: https://b2b.wien.info/en/statistics/data (accessed on 24 May 2019).
- Assaf, A.G.; Magnini, V.P. Accounting for customer satisfaction in measuring hotel efficiency: Evidence from the US hotel industry. Int. J. Hosp. Manag. 2012, 31, 642–647. [Google Scholar] [CrossRef]
- Barros, C.A.P.; Santos, C.A. The Measurement of Efficiency in Portuguese Hotels Using Data Envelopment Analysis. J. Hosp. Tour. Res. 2006, 30, 378–400. [Google Scholar] [CrossRef]
- Perrigot, R.; Cliquet, G.; Piot-Lepetit, I. Plural form chain and efficiency: Insights from the French hotel chains and the DEA methodology. Eur. Manag. J. 2009, 27, 268–280. [Google Scholar] [CrossRef]
- Valek, N.S.; Lesjak, M.; Bednarik, J.; Gorjanc, M.; Podovšovnik, E. Identifying the runners at 1st istrian marathon using chaid analyses. Kinesiol. Slov. 2015, 21, 51–62. [Google Scholar]
- Carvalho, M.J.; Sousa, M.; Paipe, G.; Bavaresco, G.; Felipe, J.L. Economic Impact of the 11th Douro Valley Half Marathon. Phys. Cult. Sport. Stud. Res. 2018, 78, 41–49. [Google Scholar] [CrossRef] [Green Version]
- Liu, C.-C.; Wu, M.-H. Economic Impact Analysis of 2014 Taroko Gorge Marathon.pdf. J. Glob. Bus. Manag. 2017, 13, 16–26. [Google Scholar]
- Park, S.H.; Hsieh, C.-M.; Miller, J.C. Moderating effects of recreation specialization on the quality-value-loyalty chain: A case of the Taroko Gorge Marathon. Int. J. Tour. Sci. 2018, 18, 29–42. [Google Scholar] [CrossRef]
- Pan, C.-M. Market demand variations, room capacity, and optimal hotel room rates. Int. J. Hosp. Manag. 2007, 26, 748–753. [Google Scholar] [CrossRef]
- Ismail, B.A.; Dalbor, M.C.; Mills, A.E. The higher the RevPAR, the greater the volatility in a hotel investment—But there’s also more money to be made. Cornell Hotel Restaur. Adm. Q. 2002, 43, 73–80. [Google Scholar] [CrossRef]
- Courty, P.; Davey, L. The Impact of Variable Pricing, Dynamic Pricing, and Sponsored Secondary Markets in Major League Baseball. J. Sports Econ. 2020, 21, 115–138. [Google Scholar] [CrossRef]
Figure 1.
Percentage of hotel occupancy in Vienna, on the day prior to the marathon, year average, April average and average Saturday in April. Note: SatM, day prior to the marathon (Saturday); AvgY, year average; AvgA, April average; AvgSatA, average Saturday in April; ** p < 0.01. Data were presented as mean ± standard deviation.

Figure 2.
Total revenue in Vienna hotels, on the day prior to the marathon, year average, April average and average Saturday in April. Note: SatM, day prior to the marathon (Saturday); AvgY, year average; AvgA, April average; AvgSatA, average Saturday in April; * p < 0.05. Data were presented as mean ± standard deviation.

Figure 3.
Revenue per available room in Vienna hotels, on the day prior to the marathon, year average, April average and average Saturday in April. Note: SatM, day prior to the marathon (Saturday); AvgY, year average; AvgA, April average; AvgSatA, average Saturday in April; ** p < 0.01. Data were presented as mean ± standard deviation.

Figure 4.
Average daily rate in Vienna hotels, on the day prior to the marathon, year average, April average and average Saturday in April. Note: SatM, day prior to the marathon (Saturday); AvgY, year average; AvgA, April average; AvgSatA, average Saturday in April. Data were presented as mean ± standard deviation.


Table 1.
Descriptive data and Kolmogorov-Smirnov test data for OCC, RevPAR, ADR and Trev.
| Variable | N | Mean | St. Dev. | Minimum | Maximum | K-S Test | K-S sig. |
|---|---|---|---|---|---|---|---|
| OCC | 48 | 71.70 | 14.35 | 46.81 | 98.86 | 1.041 | 0.229 |
| Trev | 48 | 2,341,512 | 520,770 | 1,465,014 | 4,751,776 | 0.939 | 0.341 |
| RevPAR | 48 | 75.52 | 14.83 | 50.17 | 141.00 | 1.356 | 0.050 |
| ADR | 48 | 96.61 | 11.00 | 72.55 | 149.82 | 1.094 | 0.182 |
OCC-hotel occupancy; RevPAR-revenue per available room; ADR-average daily rate; TRev-total revenue; St. Dev., standard deviation; K-S sig., Kolmogorov–Smirnov significance; N, number.
Publisher’s Note: MDPI stays neutral with regard to jurisdictional claims in published maps and institutional affiliations. |
© 2020 by the authors. Licensee MDPI, Basel, Switzerland. This article is an open access article distributed under the terms and conditions of the Creative Commons Attribution (CC BY) license (http://creativecommons.org/licenses/by/4.0/).
Share and Cite
MDPI and ACS Style
Borovcanin, D.; Cuk, I.; Lesjak, M.; Juvan, E. The Importance of Sport Event on Hotel Performance for Restarting Tourism After COVID-19. Societies 2020, 10, 90. https://0-doi-org.brum.beds.ac.uk/10.3390/soc10040090
AMA Style
Borovcanin D, Cuk I, Lesjak M, Juvan E. The Importance of Sport Event on Hotel Performance for Restarting Tourism After COVID-19. Societies. 2020; 10(4):90. https://0-doi-org.brum.beds.ac.uk/10.3390/soc10040090
Chicago/Turabian StyleBorovcanin, Dusan, Ivan Cuk, Miha Lesjak, and Emil Juvan. 2020. "The Importance of Sport Event on Hotel Performance for Restarting Tourism After COVID-19" Societies 10, no. 4: 90. https://0-doi-org.brum.beds.ac.uk/10.3390/soc10040090
Note that from the first issue of 2016, this journal uses article numbers instead of page numbers. See further details here.