
Are Energy-Vulnerable Households More Prone to Informative, Market, and Behavioral Biases?


Lab of Mining and Environmental Technology, School of Mining and metallurgical Engineering, Zografou Campus, National Technical University of Athens, 15780 Athens, Greece
*
Author to whom correspondence should be addressed.
Societies 2021, 11(4), 126; https://0-doi-org.brum.beds.ac.uk/10.3390/soc11040126
Submission received: 9 September 2021
/
Revised: 10 October 2021
/
Accepted: 11 October 2021
/
Published: 14 October 2021
Abstract
:The present paper focuses primarily on investigating whether energy-vulnerable households are more prone to informative, market, and behavioral biases. In this direction, a stated preference approach was used to elicit information about human behavior and cognitive barriers in the context of energy poverty based on both subjective and objective indicators. For the purposes of the survey, a questionnaire was developed that included around 40 questions about housing conditions and information, market, and behavioral barriers related to energy efficiency, energy vulnerability, etc., and specific survey hypotheses were tested employing non-parametric tests. The survey was carried out between November 2020 and January 2021 involving residents of Metsovo, a mountain settlement in Greece. In total, 303 participants took place in the survey through personal interviews, which were conducted remotely due to the COVID-19 pandemic-related distancing measures, using a video platform. The analysis shows that households that face thermal discomfort or are in arrears on energy bills seem to be more prone to certain behavioral and other biases. This conclusion is not confirmed for households that face condensation, mold and damp problems or are classified as energy-poor under the “ten percent rule”. The main conclusion drawn is that the income status of the household plays a greater role compared to its classification as energy vulnerable. Nevertheless, the findings of the study need to be confirmed by future research, because the research specifically on how energy poverty affects people’s decision making is extremely limited. In any case, the results are worrisome and illustrate the need for more effective energy poverty policies that will take into account the effects of scarcity on household decision making.
1. Introduction
Energy poverty (EP) is a crucial socio-economic problem of the current society, as it deprives people of a basic standard of living and quality of life. Access to clean energy services remains a problem for huge parts of the population in developing countries. Over 2.5 billion people do not have access to clean cooking services, and 750 million people do not have access to power [1]. The problem is crucial in developed countries, as well, though mainly related to affordability of energy rather than access to energy, and is mainly connected with three causes: high energy costs, low household income and energy-inefficient buildings [2,3,4]. In general, the problem expresses the inability of households to meet their energy needs at an adequate level and an affordable cost.
As a multidimensional social issue, energy poverty cannot be approached by a single indicator. For this reason, the EU Energy Poverty Observatory (EPOV) recommends the combination of subjective and objective indicators. Indicatively, the main objective indicators suggested by the EPOV are the 2M indicator “high share of energy expenditure in income”, i.e., the percentage of the population whose share of energy expenditure in income exceeds twice the national median share, and the M/2 indicator “low absolute energy expenditure”, i.e., the percentage of the population whose energy expenditure (absolute) is below the national median [5]. The main subjective indicators suggested by the EPOV are the “inability to keep home adequately warm” and “arrears on utility bills”, which have been widely used by the scientific community (e.g., [6,7,8]).
There are numerous other approaches for measuring energy poverty, among which the objective 10% indicator [9], i.e., the percentage of households that are required to spend more than 10% of their income on all domestic energy needs, can be characterized as the most popular one. Other subjective indicators include the “total population living in a dwelling with a leaking roof, damp walls, floors or foundation, or rot in window frames or floor” introduced by [10], the “restriction of other essential needs” introduced by [11], and so on. According to the latest available data for energy poverty across Europe, 37.4 million European citizens could not afford to adequately heat their homes (7.3% of EU28 households). Moreover, 83.2% million citizens (16.2% of EU28 households) spent a significantly high percentage of their income on energy costs, while, on the other hand, 74.2 million (14.6% of EU28 households) presented abnormally low energy expenditure, as a result of their low incomes [12].
Based on the above, there are two main categories of households found as energy poor. The first one includes middle-income (or even high-income) households with high rates of energy consumption and thus high energy costs. Although these households may have the financial ability to take measures that will reduce their energy consumption, their decisions most times do not maximize their benefits. The second category includes households with no financial means to adequately cover even their basic energy needs; these households face several adverse effects on human health and well-being, resulting in chronic psychological, social and economic stress, which decisively affects their everyday lives.
Although around 7.3% of the European Union’s households are affected by energy poverty. Most EU countries still do not have sufficiently effective measures to tackle the “energy paradox”, which refers to consumers’ inability to fill the gap between optimal and actual investment decisions concerning energy usage [13]. Policymakers are concerned about the contradiction of the slow diffusion of ostensibly cost-effective and energy-efficient technologies and are attempting to bring energy conservation into the spotlight. The traditional economic literature, based on Expected Utility Theory (EUT), presumes consumers’ failure in making optimal decisions to be a result of information deficiencies and market failure. However, it has been systematically observed that people exhibit predictable patterns of decision making that deviate from the EUT’s assumptions [14].
The energy paradox, according to the past three decades of research, has been linked to market failures (e.g., imperfect information, split incentives, fuel price distortions, and a lack of capital), time and risk preferences, behavioral aspects (e.g., rational inattention, bounded rationality, biased beliefs, and heuristic decision making), and socio-demographic characteristics. The behavioral barriers are known as cognitive biases and tend to lead to bounded rationality [15,16,17]. These biases may be magnified in the case of vulnerable households, provided that their cognitive ability is significantly affected by scarcity conditions, as it is highly related to stress and negative emotions [18]. For example, debt mental accounting creates bandwidth taxes that impair cognitive processes [19]. Furthermore, it is argued that people who live in poverty have poor economic preferences, which may constitute a critical factor in the persistence of poverty [20,21]. In line with these findings, studies have shown that individuals do not make optimal decisions when they feel that it is impossible to bridge the gap between their needs and the resources available to meet them [13].
Much research has been carried out to date on the factors that influence the energy paradox, as well as on the relationship between poverty and irrational decision making (this issue is discussed in more detail in Section 2). However, it has not been specifically studied whether energy-vulnerable households are more prone to cognitive, behavioral or other biases and, consequently, to the energy paradox. So far, the related literature includes a study on the impact of cognitive biases on energy-vulnerable households [13], which analyzes recent findings from behavioral sciences, and a quantitative survey on the decision making of vulnerable households linked to energy efficiency, without focusing on behavioral barriers [22]. Aiming to fill this gap, this study uses a stated preference approach to elicit information about human behavior and cognitive barriers in the context of energy poverty. Specifically, the main research question examined is whether energy-vulnerable households are more prone to cognitive and other barriers compared to non-vulnerable households. The answer to this question is not only of research interest. Studying the cognitive and other barriers that lead to unorthodox behaviors is crucial in shaping a more effective policy framework for economically vulnerable households, which are called to make energy-related decisions under scarcity in their everyday lives.
The rest of the paper is structured as follows. Section 2 provides a short review of the literature regarding the main cognitive barriers involved in decision making under poverty. Section 3 describes the methodological approach of the study and Section 4 discusses the results of the analysis. Finally, Section 5 concludes with the main findings of the study and some thoughts for further research.
2. A Concise Literature Review on Decision Making under Poverty
Besides the cultural, social and environmental causes, the failure to escape from poverty or, in this particular case, energy poverty, may be influenced by psychological aspects that may well be addressed at the individual level, since a person’s financial condition is regulated to some extent by the economic decisions that they make [20].
Regarding decision making under poverty, there is a paradox that in the international literature is described as the Irony of Poverty [23]. This phenomenon refers to the condition in which people living under poverty are called upon to make the most “right” decisions, as the slightest mistake is going to have a crucial effect on their living conditions. In previous studies, poverty has been linked to factors such as stress [24], cognitive load [25], worsened cognitive functions [26], and present-oriented behavior [27]. Hence, these people are the ones who are in the toughest position to make “right”—in the way that they are most beneficial for them—decisions.
Cognitive tax due to scarcity by any means does not imply declined mental capacity. Both people living in conditions of economic prosperity and those living in conditions of scarcity or poverty can make optimal decisions. In fact, in Mani et al. study’s [26], in the absence of the financially stressful topic, the cognitive performance of rich and poor participants was identical. According to Shah et al. [28] and Haushofer and Fehr [24], from the perspective of poverty studies, a growth in cognitive load has been reported to be linked with unpleasant experiences attributed to long-term poverty [18]. In times of intense stress and mental or emotional pressure, cognitive functions can very easily be affected and degraded. The impact of stress on cognitive abilities is well documented [29,30,31,32,33].
Extensive research in behavioral economics highlights that delaying gratification and exercising self-control [34,35] as well as paying attention [36,37,38] can be seen as costly mental processes [39]. The various cognitive limitations may force the human brain to use simplification strategies, known as heuristics, to lighten the cognitive load when making decisions. Heuristics are mental shortcuts that can assist problem solving and probability decisions [15]. These empirical rules or rules-of-thumb lessen the cognitive load and can be useful for making quick decisions. However, they frequently lead to unreasonable or incorrect conclusions. Cognitive decision-making processes are mainly influenced by cognitive biases. Cognitive biases can be basically defined as “cases in which human cognition reliably produces representations that are systematically distorted compared to some aspect of objective reality” [40] and they are said to prevent individuals from making optimal trade-offs between short- and long-term utility [41].
Risk-based decision making is also affected by chronic stress exposure [30]. According to Simonovic et al. [42], stress reduces risky decision-making performance by interfering with concentration and knowledge of task variables. However, Dalton et al. [43] suggest that changes in cognitive performance do not explain the impact of financial stress on risk preferences. It has also been reported that the interacting mechanisms of poverty, cognitive load, and intuitive decision making might contribute to the poor’s tendency to risk less for a probable profit while risking more in the case of a possible loss [20,24].
Moving on to time preferences, individuals often show a strong attachment to the present. Present bias describes the tendency to more often assess a smaller but immediate reward, versus a larger, future reward, degrading or completely ignoring the long-term adverse effects of current choices or decisions [15,44]. In particular, economically vulnerable households’ willingness to delay gratification is claimed to be lower [27,45] as they seem to prefer to experience an immediate improvement, leaving any consequences for later. Due to higher cognitive load, lesser self-control (increased impulsivity), and an inclination to use intuitive decision-making processes, those living in poverty are more likely to seek smaller, early rewards that bring short-term satisfaction [18]. In literature, this behavior is characterized as “Time Myopia” (Myopia or Tunnel Vision) and usually describes an inconsistent behavior in time (time inconsistency) [46]. This inconsistency lies in the fact that short-term preferences tend to contradict the long-term ones, creating a “preferential dimension” between the present and the future self. The impact of present bias on vulnerable households does not imply that poor individuals have different hardwired time preferences than the rich, but it underlines the fact their impulsive self may more easily affect behavior due to a cognitive load associated with poverty [39]. For instance, Carvalho et al. [47] showed that financial stability is linked to a willingness to wait for a better payout and enhanced self-control.
In terms of status quo bias, financially vulnerable households, due to a strong fear that a change might deteriorate their living standards, tend to prefer the current situation despite its problems, and to the detriment of alternatives. Another factor that contributes to procrastination is a sense of futility that nothing is going to change decisively despite the taken actions, as documented by Skeffington and Rea [48]. Finally, the aforementioned phenomenon of “Irony of Poverty” contributes in favor of status quo bias, as under the constant fear that a wrong decision may lead to worse living standards, financially vulnerable households feel more pressure to make the right decision [13,28,48].
A factor that is taken into consideration when studying bounded rationality is rational inattention. In terms of energy efficiency, consumers’ limited attention may allow them to undervalue the potential savings from a more energy-efficient product [15,49]. Regarding the effect of rational inattention on decision making under poverty, systematic research has been recently conducted with significant findings. In economics, the theory of rational “inattention” deals with the effects of the cost of obtaining information in decision making. When the information needed for a decision requires much effort to obtain, people tend to make decisions based on incomplete information. Another aspect of rational “inattention” is related to the tendency of individuals to become informed and to devote time to aspects that are a priority for them and to neglect others [15,49]. Basic expenses and utility bills do not require much attention or effort to handle when financial resources are sufficient. Yet, in times of financial hardship, these costs may seem more immediate, pressing, and difficult to manage. The most determining contributor to the loss of cognitive performance is the mechanism of highly focused attentional capture due to scarcity conditions [20]. Surprisingly, scarcity-induced attention appears to have certain advantages. It may improve resource or performance efficiency, a concept known as the “focus dividend” [26]. When pressing needs are associated with control and restriction, restricted focus can lead to enhanced self-control, with strong working memory capacity also increasing self-regulation, according to several findings [18,50]. While some of this attention is purposeful and profitable, according to Mani et al. [26], much of it is not. As cognitive capacity is finite, and money-related thoughts consume some of it, mental “bandwidth” available for other tasks is lowered. As a result, it is argued that poverty impairs poor people’s cognitive function, affecting decision-making quality and decreasing productivity [19].
Individuals who are aware of the effects of scarcity on their decision making could opt to make crucial decisions when they are cash-rich, thereby reducing the effects of scarcity. There is currently no evidence that people are aware of the effects of scarcity on their cognitive function [19]. A factor that could prevent individuals from impulsive behaviors when making financial or energy-related decisions is financial literacy. Financial literacy is characterized as the ability to process economic data and make well-informed financial planning decisions. It is composed of certain skills, attitudes, and behaviors that are linked to economic aspects of living [18]. Although financial literacy has a direct impact on economic decisions [51] and people with better financial literacy experience better financial conditions [52], financial literacy education is frequently overlooked [18,51,53].
3. Survey Design and Statistical Analysis
To answer the main research question, the conceptual framework illustrated in Figure 1 was implemented.
In particular, a questionnaire survey, which is detailed hereinafter, was designed to investigate whether several biases are differentiated with energy vulnerability. The survey was carried out between November 2020 and January 2021 within the framework of the EU’s Horizon 2020 research and innovation program’s “STEP-IN—Using Living Labs to roll out Sustainable Strategies for Energy Poor Individuals” initiative. One of the project’s three Living Labs is located in Metsovo, a mountain settlement in which the survey was conducted. Metsovo was selected as a typical mountainous settlement of Greece, located in the mountainous range of Pindus, at 1100 m altitude. Mountainous societies have proved to be some of the most vulnerable population groups of the country in terms of energy poverty, having encountered considerably increased energy costs compared to lowlands—at least the past 11 years of the financial crisis of the country—along with lower incomes at the same time [54,55]. Indicatively, the annual energy costs of a residence lying at 1000 m altitude are 85% higher compared to the respective costs at sea level in Greece [56]. In this context, the case of Metsovo stands as a representative case study for exploring energy vulnerability. The settlement of Metsovo has a total of 2503 residents, or else 888 households, according to the last census of the Hellenic Statistical Authority that took place in 2011 [57]. In particular, 303 households participated in the survey through personal interviews, which were conducted using a video platform due to the COVID-19 pandemic-related distancing measures.
The questionnaire of the survey included around 40 questions aiming to measure the energy vulnerability risk of the participants and evaluate their susceptibility to informative, market, and behavioral biases related to energy efficiency. In addition, the questionnaire collected information about housing conditions, type of heating systems, quantitative data about energy usage and expenditure, the impact of the COVID-19 pandemic on households’ energy consumption, and typical sociodemographic data. Finally, the questionnaire included a choice experiment to reveal the preferences of households regarding energy efficiency investments. The latter, however, is beyond the scope of this paper.
The energy vulnerability risk was measured using both subjective and objective indicators. As far as the subjective indicators are concerned, survey participants were faced with three commonly used questions [4,58], which are also included in the pan-European Survey on Income and Living Conditions (EU-SILC):
- Inability to keep home adequately warm;
- Arrears in energy bills (electricity and heating bills) over the last 24 months; and
- Dwellings with leakages and damp/mold problems.
The three questions were asked in a binary “yes” or “no” format.
Regarding the objective indicators, the so-called “ten percent rule” [9] was estimated. Data about households’ income and energy bills were gathered on a monthly or annual basis, including electricity and space heating. Using the collected information, the ratio of actual energy expenses to household income was calculated.
To explore the informative, market, and behavioral barriers to energy efficiency, the survey included a series of statements that have been also used in similar surveys (e.g., [59,60,61], as follows:
- I do not have the financial means to take energy-saving actions (financial barrier).
- Lack of financial incentives (tax exemption, interest-free installments, subsidies, etc.) prevents me from taking energy-saving measures (financial barrier).
- I keep a systematic file and carefully check the electricity and heating fuel bills (rational inattention).
- I systematically monitor the temperature of my house with a thermometer (rational inattention).
- Every year—or more often, if needed—I take care of the heating system’s maintenance (rational inattention).
- I am aware of my home appliances’ electricity consumption (incomplete/inadequate information).
- I am informed about the prices of electricity and heating fuel (incomplete/inadequate information).
- Among different providers’ offers, it is really difficult for me to distinguish the most advantageous one (incomplete/inadequate information).
- I am more likely to take energy-saving actions if my friends, neighbors, or colleagues do the same (social norms)
- Saving energy reduces the environmental impact caused by my household (pro-environmental behavior).
Respondents were asked to indicate whether they “strongly agree”, “agree”, “disagree”, or “strongly disagree” with each of the above statements. The answering options “don’t know” or “won’t tell” were also available.
The survey also included two questions aiming to measure the participants’ present bias and energy-related financial literacy. In particular, the first question was formulated as follows:
“Suppose an electricity provider offers two options for a 24-month (2 years) contract. Option A offers the first two months free while option B offers a 10% discount for the next 2 years. Which of the two offers would you choose?”
The participants were asked to choose between the two options. The first option offers an 8.3% discount in advance and the second one offers a 10% discount for the next 2 years. Therefore, the first option will be selected by respondents who tend to opt for immediate rewards than higher ones in the future.
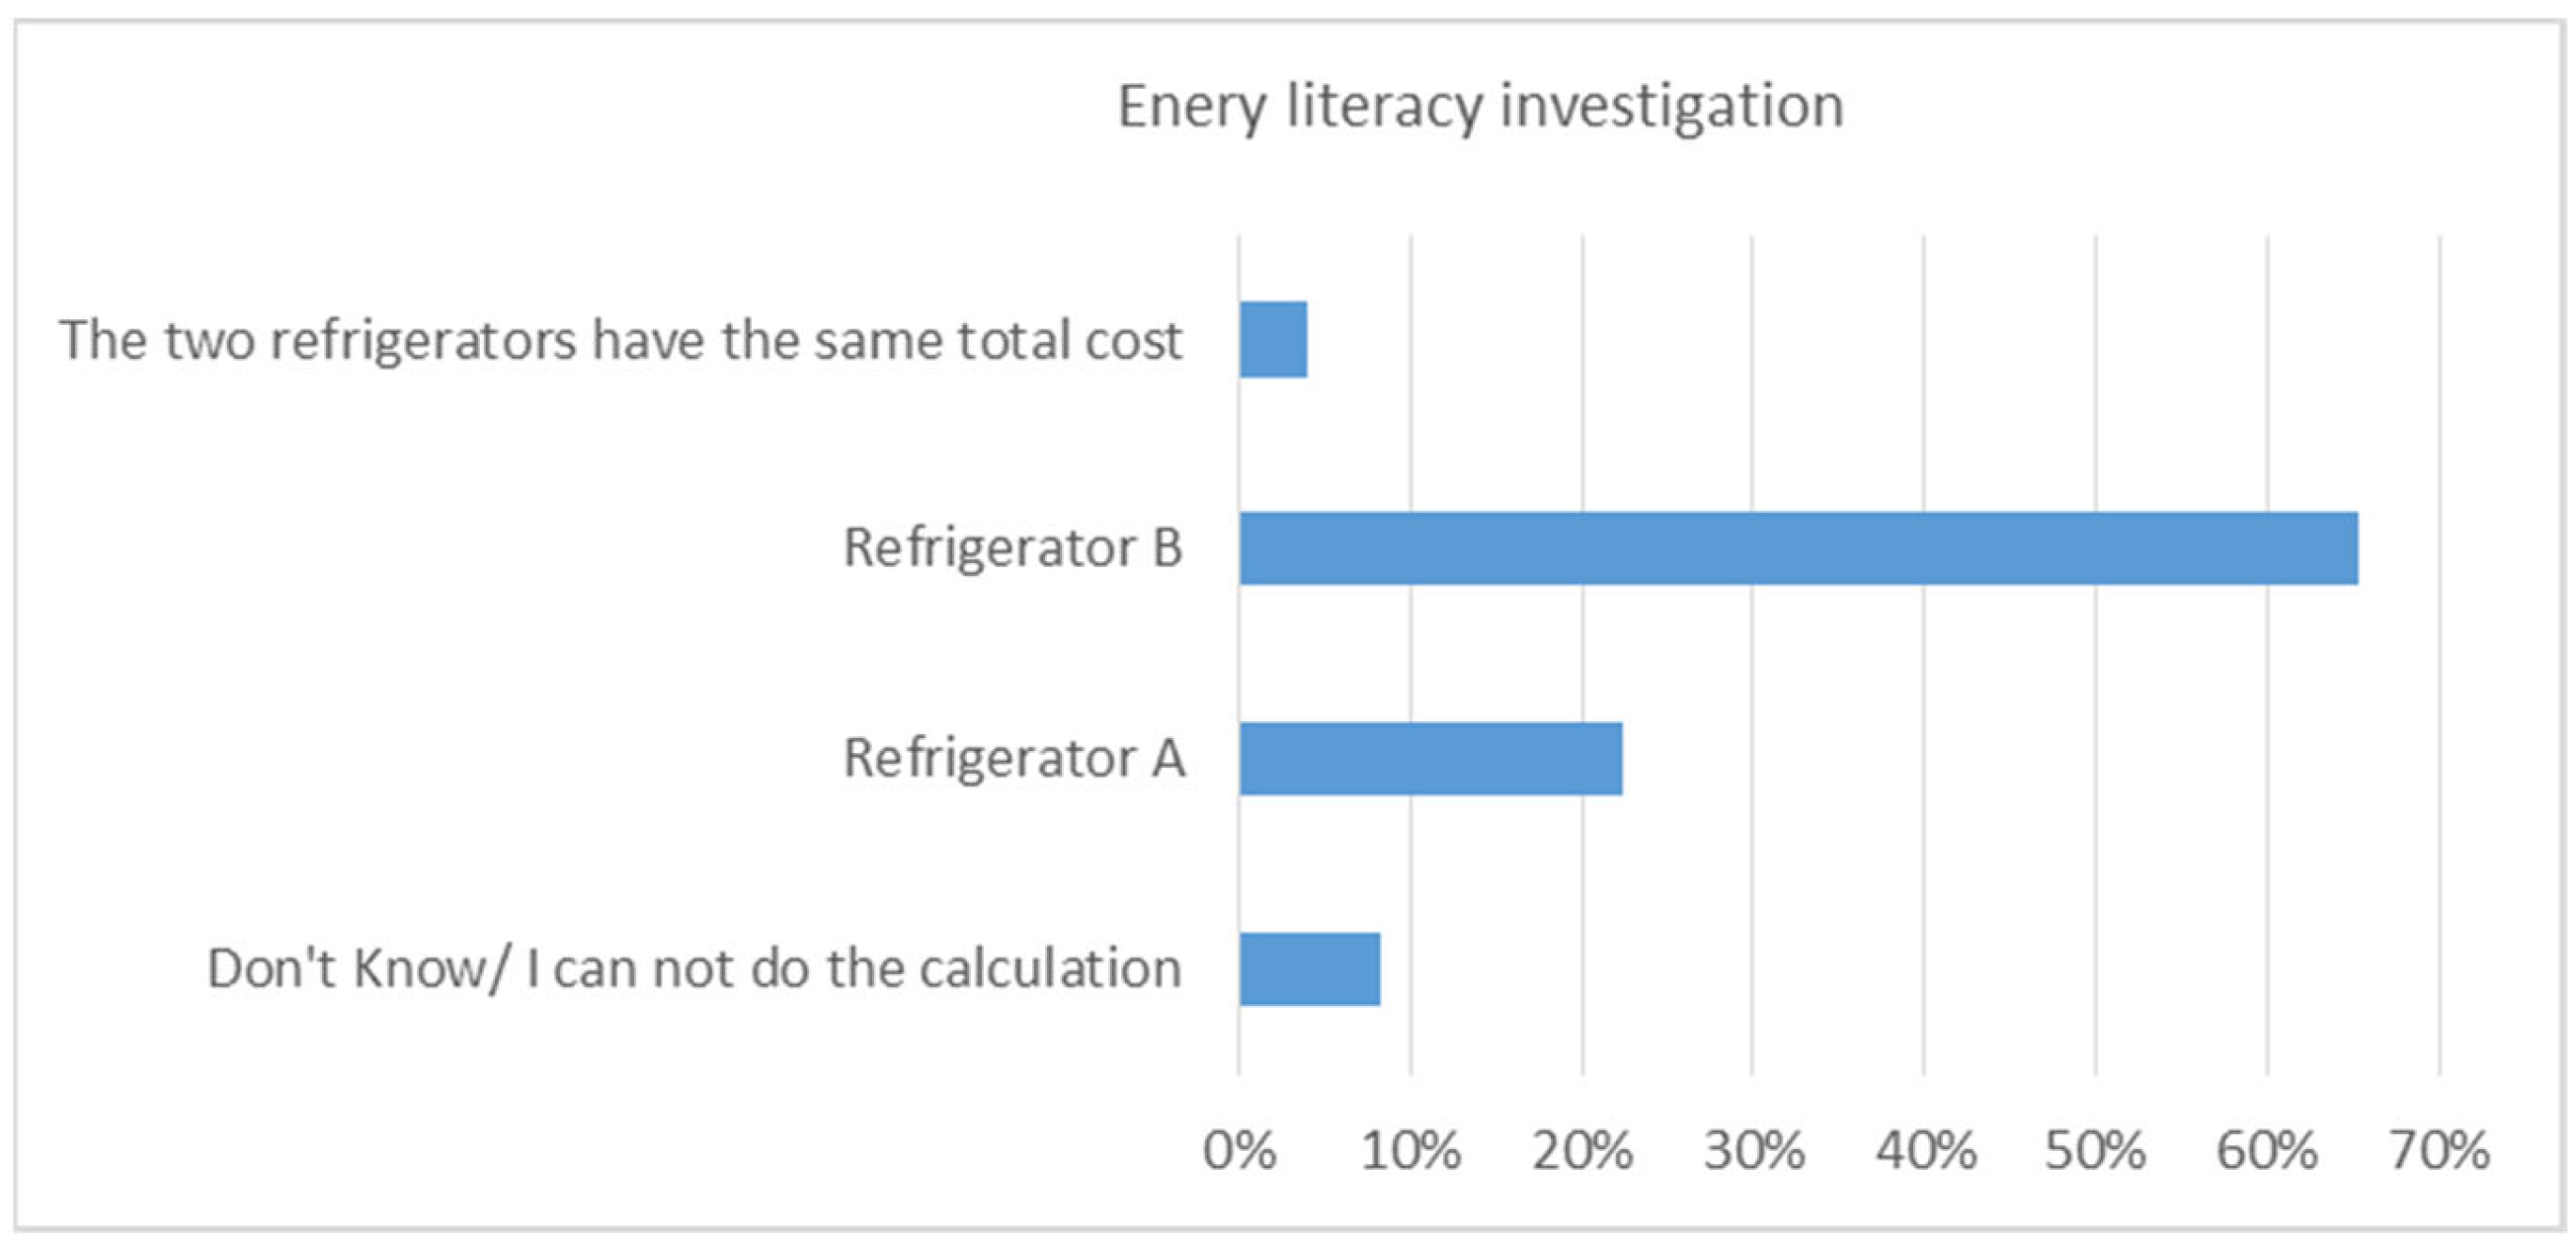
The second question was based on [62]. More specifically, respondents are presented with two choices (in this case, refrigerators) that differ in the purchase cost and the annual electricity consumption. The question examines whether the respondents can identify the appliance that has the lowest total purchase and operating cost during its lifetime and is framed, as follows:
“Suppose you need to replace your refrigerator. As a replacement, you can choose between two alternatives that are identical in terms of design, capacity, and cooling system efficiency. Refrigerator A sells for EUR 400 and consumes 300 kWh per year, while Refrigerator B sells for EUR 500 and consumes 260 kWh per year. Assuming that the electricity cost is 0.2 EUR/kWh and that both refrigerators have a lifespan of 10 years, which of the two refrigerators has the lowest total purchase and operating cost during its lifetime, in your opinion?
In this case, the option that presents the lowest total costs is Refrigerator A.
Towards investigating whether energy-vulnerable households are more prone to informative, market, and behavioral biases, the following statistical hypotheses were tested:
Hypothesis 1 (H1).
Energy-vulnerable and non-vulnerable people face the same financial barriers.
Hypothesis 2 (H2).
Energy-vulnerable and non-vulnerable people suffer equally from rational inattention.
Hypothesis 3 (H3).
Energy-vulnerable and non-vulnerable people are equally prone to information bias.
Hypothesis 4 (H4).
Energy-vulnerable people and non-vulnerable are affected the same by social norms.
Hypothesis 5 (H5).
Energy-vulnerable and non-vulnerable people demonstrate a similar pro-environmental attitude.
Hypothesis 6 (H6).
Energy-vulnerable and non-vulnerable people are equally exposed to present bias.
Hypothesis 7 (H7).
Energy-vulnerable and non-vulnerable people are equally energy-related financial illiterate.
It is noted that the above statements represent the null hypothesis (H0), i.e., that there is no difference between energy-vulnerable and non-vulnerable people. To investigate the survey hypotheses, i.e., whether a connection between energy vulnerability and certain market, and behavioral biases exists, non-parametric tests were conducted. Specifically, hypotheses H1 to H5 were tested using the Mann–Whitney [63,64] and Kruskal–Wallis [65] tests, and the remaining hypotheses (i.e., H6 and H7) were examined using Pearson’s Chi-square Test of Independence [66]. The Mann–Whitney test (also known as Wilcoxon rank-sum test) investigates the hypothesis that two independent samples are from populations with the same distribution. The Kruskal–Wallis test is a generalization of the Mann–Whitney test for more than two independent samples. The Pearson’s Chi-square test of independence is used to test whether two categorical or nominal variables are associated or not.
4. Results
4.1. Household, Housing, Heating System Characteristics and Energy Costs
A total of 303 houses took part in the socio-economic survey, with the majority (59.3%) consisting of three or more people, 24.5% consisting of two people, and 12.6% consisting of single-person families. Men make up 65% of the sample, while women make up 35%. The elderly (those over 65 years old) account for 21.6% of the population. Around 67% of the population is between the ages of 30 and 64, with the rest between 18 and 29 years old. As regards to marital status, the majority (62.6%) are married or cohabitate with a partner, 23.8% are unmarried, 8.6% are widowed, and the rest declare separated, divorced, or living with a friend/relative. Approximately half of the participants (44.9%) had access to post-secondary education. Roughly 15% have not completed high school, 26% interrupted their education before graduating from senior high school, 14.5% have completed a 2-year vocational degree, 37% have a three-, four-, or five-year degree, and about 10% have an MSc or Ph.D. degree. In terms of employment, 64.4% are employed (31.9% are full-time and 32.5% are part-time employees) and 32.5% are retired. The average annual income per household is EUR 16,560 (std. dev.: 8600). According to the responses given, 54.5% of the participants manage to make ends meet on current income, 15.5% live comfortably, and 9.4%, on the other hand, are struggling to make ends meet.
The majority of residences (around 55%) are apartments, 37% are detached houses, and the rest are maisonettes. Regarding the total floor area, about 87% of the residences are less than 120 m2, 10.3% of the residences are between 121–160 m2, and the rest (2.07%) are over 160 m2. Nearly 6% have two rooms or less, 13% have three rooms, 60.9% have four to five rooms, and the rest have more than five rooms, except bathrooms and storage rooms. Finally, the vast majority of houses (91.7%) have up to two floors and 63.3% of the participants live on the first floor.
Approximately 60% of the residences were built before 1980, 22% between 1980 and 1990, and the remaining after 1990 (about 6% during the past 20 years). Considering that the first Insulation Regulation in Greece was enacted in 1980, it appears that the lack of fundamental building insulation criteria is a major issue in the municipality of Metsovo (almost 60% of the dwellings were built before 1980).
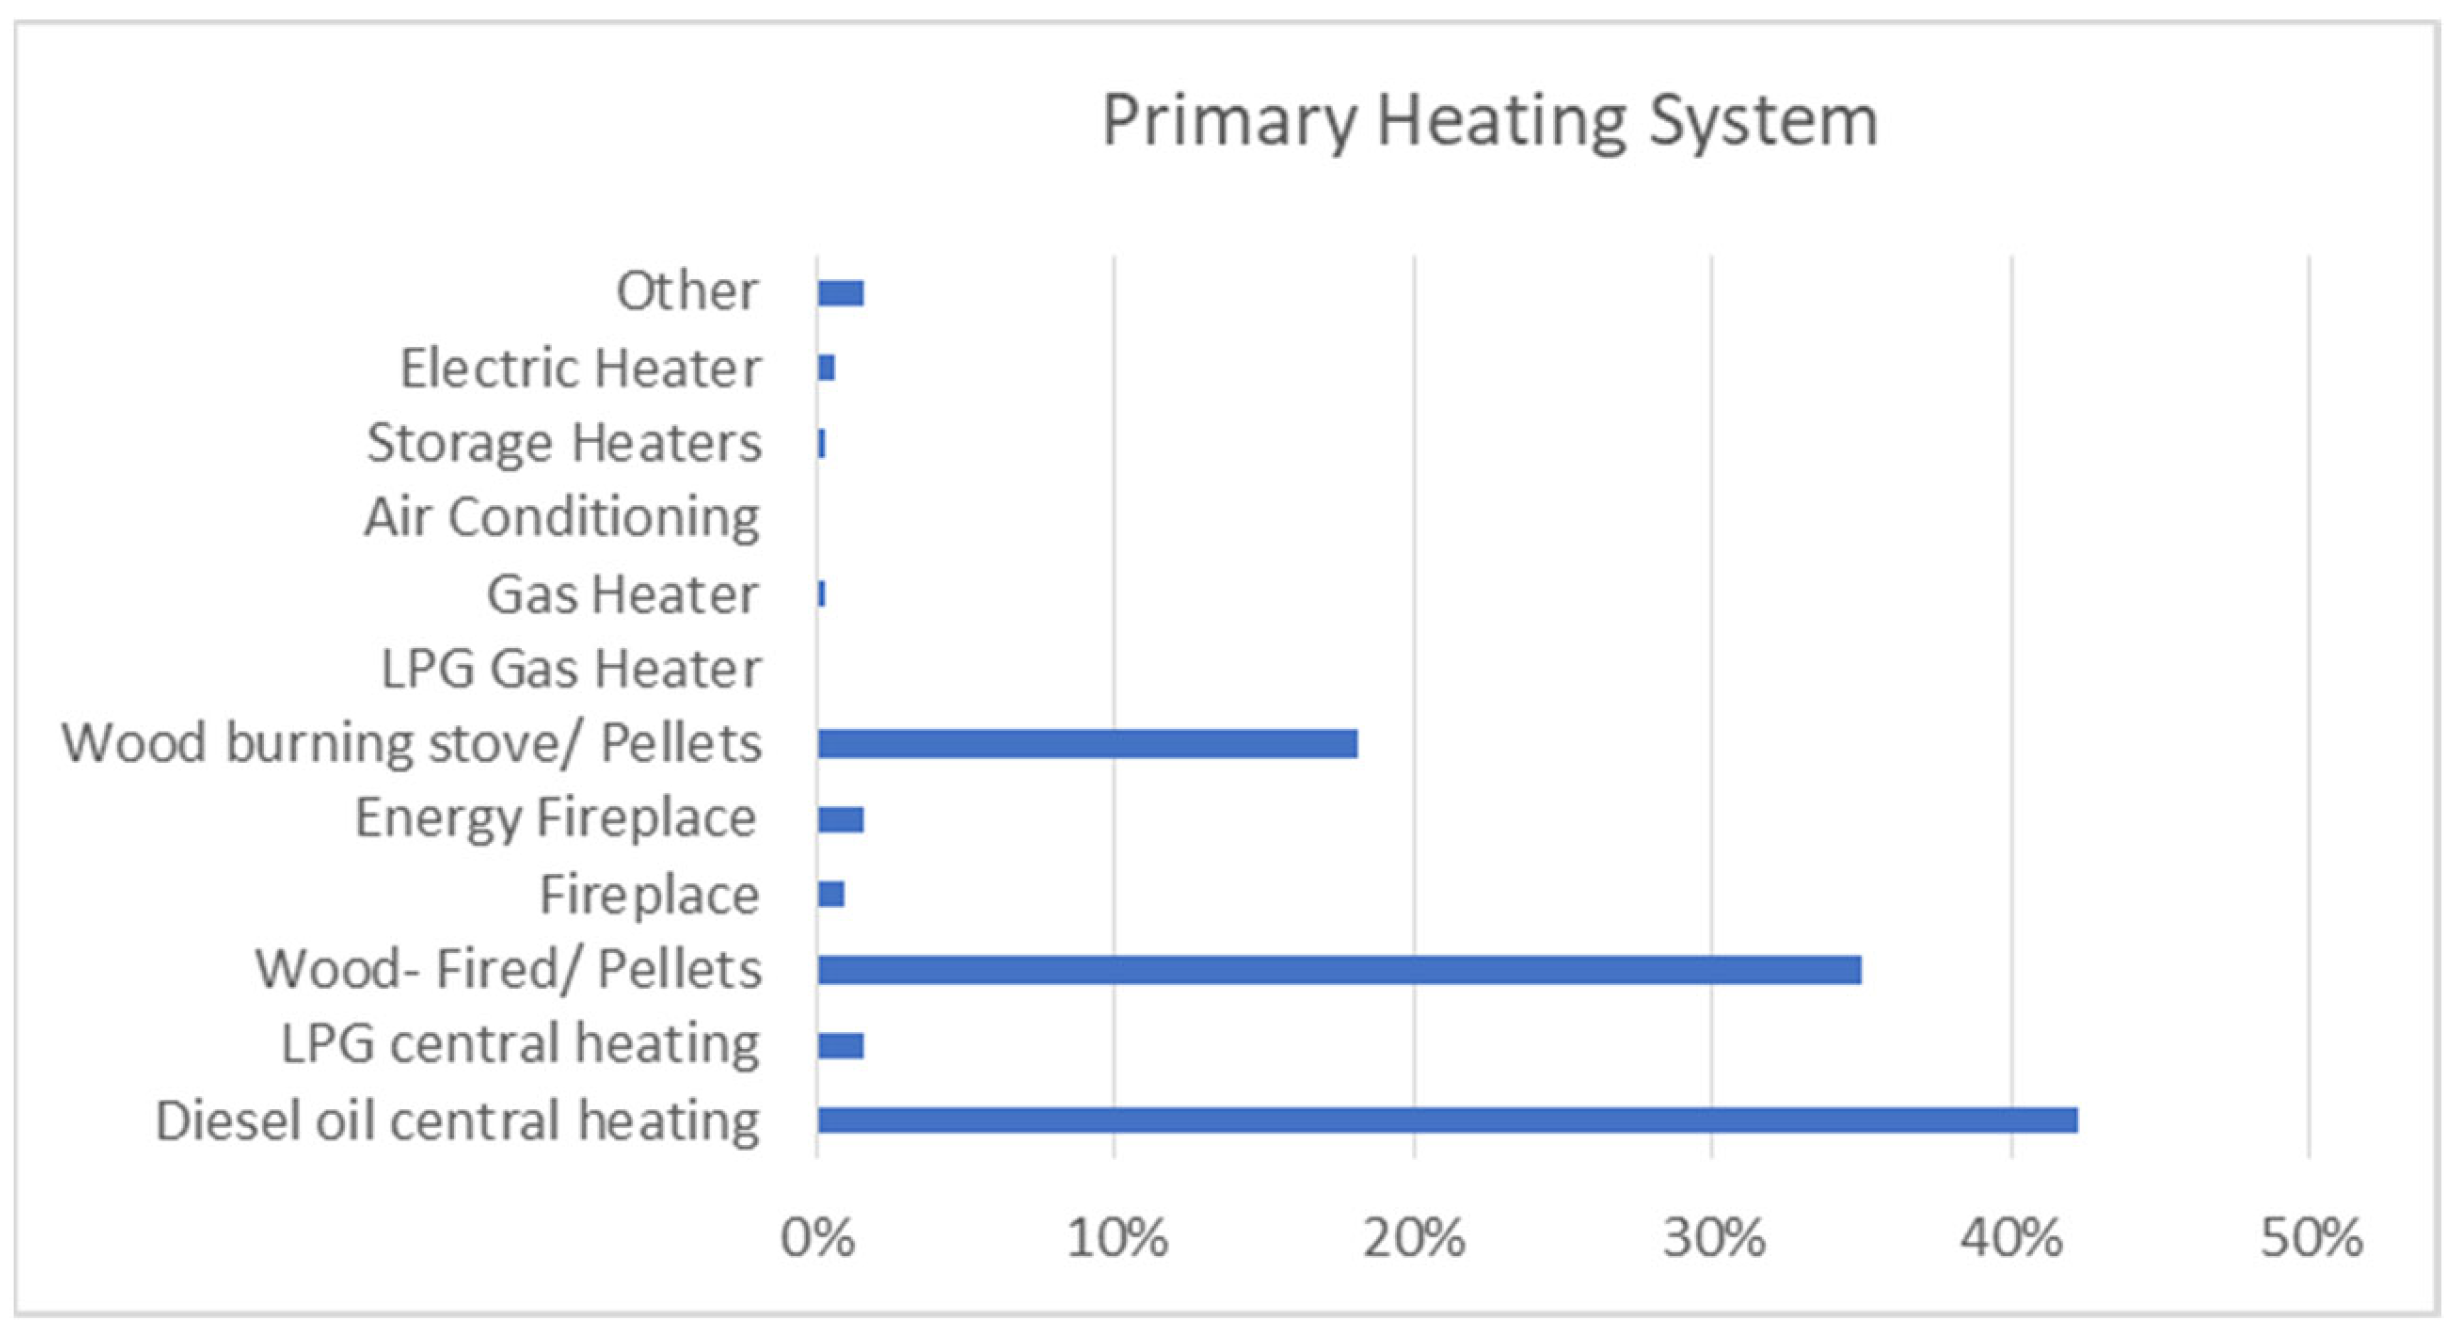
Diesel oil and woods/pellets (42% and 35%, respectively) are the most common heating fuels among the residences that participated in the study (Figure 2). In detail, oil-fired central heating systems are used by 42% of houses, firewood and pellets central heating systems are used by 35%, wood or pellet-fired stoves are used by 18%, and other systems (e.g., air conditioning units, heat accumulators and fireplaces) are used by the remaining households (Figure 1). Another drawback with Metsovo’s heating systems is that the energy systems (mostly diesel oil central heating systems) are outdated. The average age is 20.5 years. This element has a negative impact on energy efficiency and fuel consumption. The respondents, on the other hand, said that they maintain their heating systems regularly.
The survey provided findings regarding energy expenditure. Due to the general harsh climatic conditions, thermal energy accounts for the majority of energy costs. Heating expenditures account for approximately 69.5% of yearly energy costs, with electricity accounting for the remaining 30.5%. The average energy costs per home are mentioned below:
- Average annual energy cost for heating per household: around EUR 2000.
- Average annual energy cost for electricity per household: around EUR 890.
In total, the average yearly energy cost for heating and electricity per home is roughly EUR 2860.
More specifically, 51% spend between EUR 1000 and EUR 2000 per year on heating, 29% spend between EUR 2000 and EUR 3000 per year, and smaller portions invest less (less than EUR 1000 per year) or more (more than EUR 3000 per year), i.e., 9% and 11%, respectively.
Another useful finding has to do with the category of energy expenses depending on the kind of fuel used for heating. Diesel oil remains the most expensive heating fuel due to high taxes:
- Average annual expenses for oil-fired central heating system: EUR 3300.
- Average annual expenses for wood-fired central heating system/pellets: EUR 2700.
- Average annual expenses for LPG central heating system: EUR 2500.
- Average annual expenses for wood-burning stove/pellets: EUR 2100.
- Average annual expenses for electric heater: EUR 4800.
- Average annual expenses for accumulators: EUR 6500.
- Average annual expenses for fireplace: EUR 900.
- Average annual expenses for energy fireplace: EUR 2650.
4.2. Energy Vulnerability
The answers provided by the households that participated in the survey are illustrated in Figure 3. Nearly 30% of the households stated that they are unable to keep their homes warm enough in the winter, exceeding by far the Greek average at the country level (16.7%) according to EU-SILC survey 2019 data [67]. Moisture/mold problems are reported by 34% of the households, which again exceeds by far the Greek average at the country level (12.3%). The percentage of households that reported arrears in energy bills is rather low, i.e., 10%, and lower than the country’s average. This is attributed to the fact that heating fuels (diesel, wood, LPG) are always paid in cash; otherwise, suppliers will refuse to supply fuel.
Finally, using the “ten percent rule”, approximately 83.5% of the households (based on 236 valid observations) are characterized as energy poor. The mean energy cost-to-income ratio is 21.3% (5% trimmed mean: 20.7%; std. dev.: 12.3%) and the median 18.9%. Figure 4 presents the Kernel density estimate of the energy cost-to-income ratio.
4.3. Behavioral Perspectives
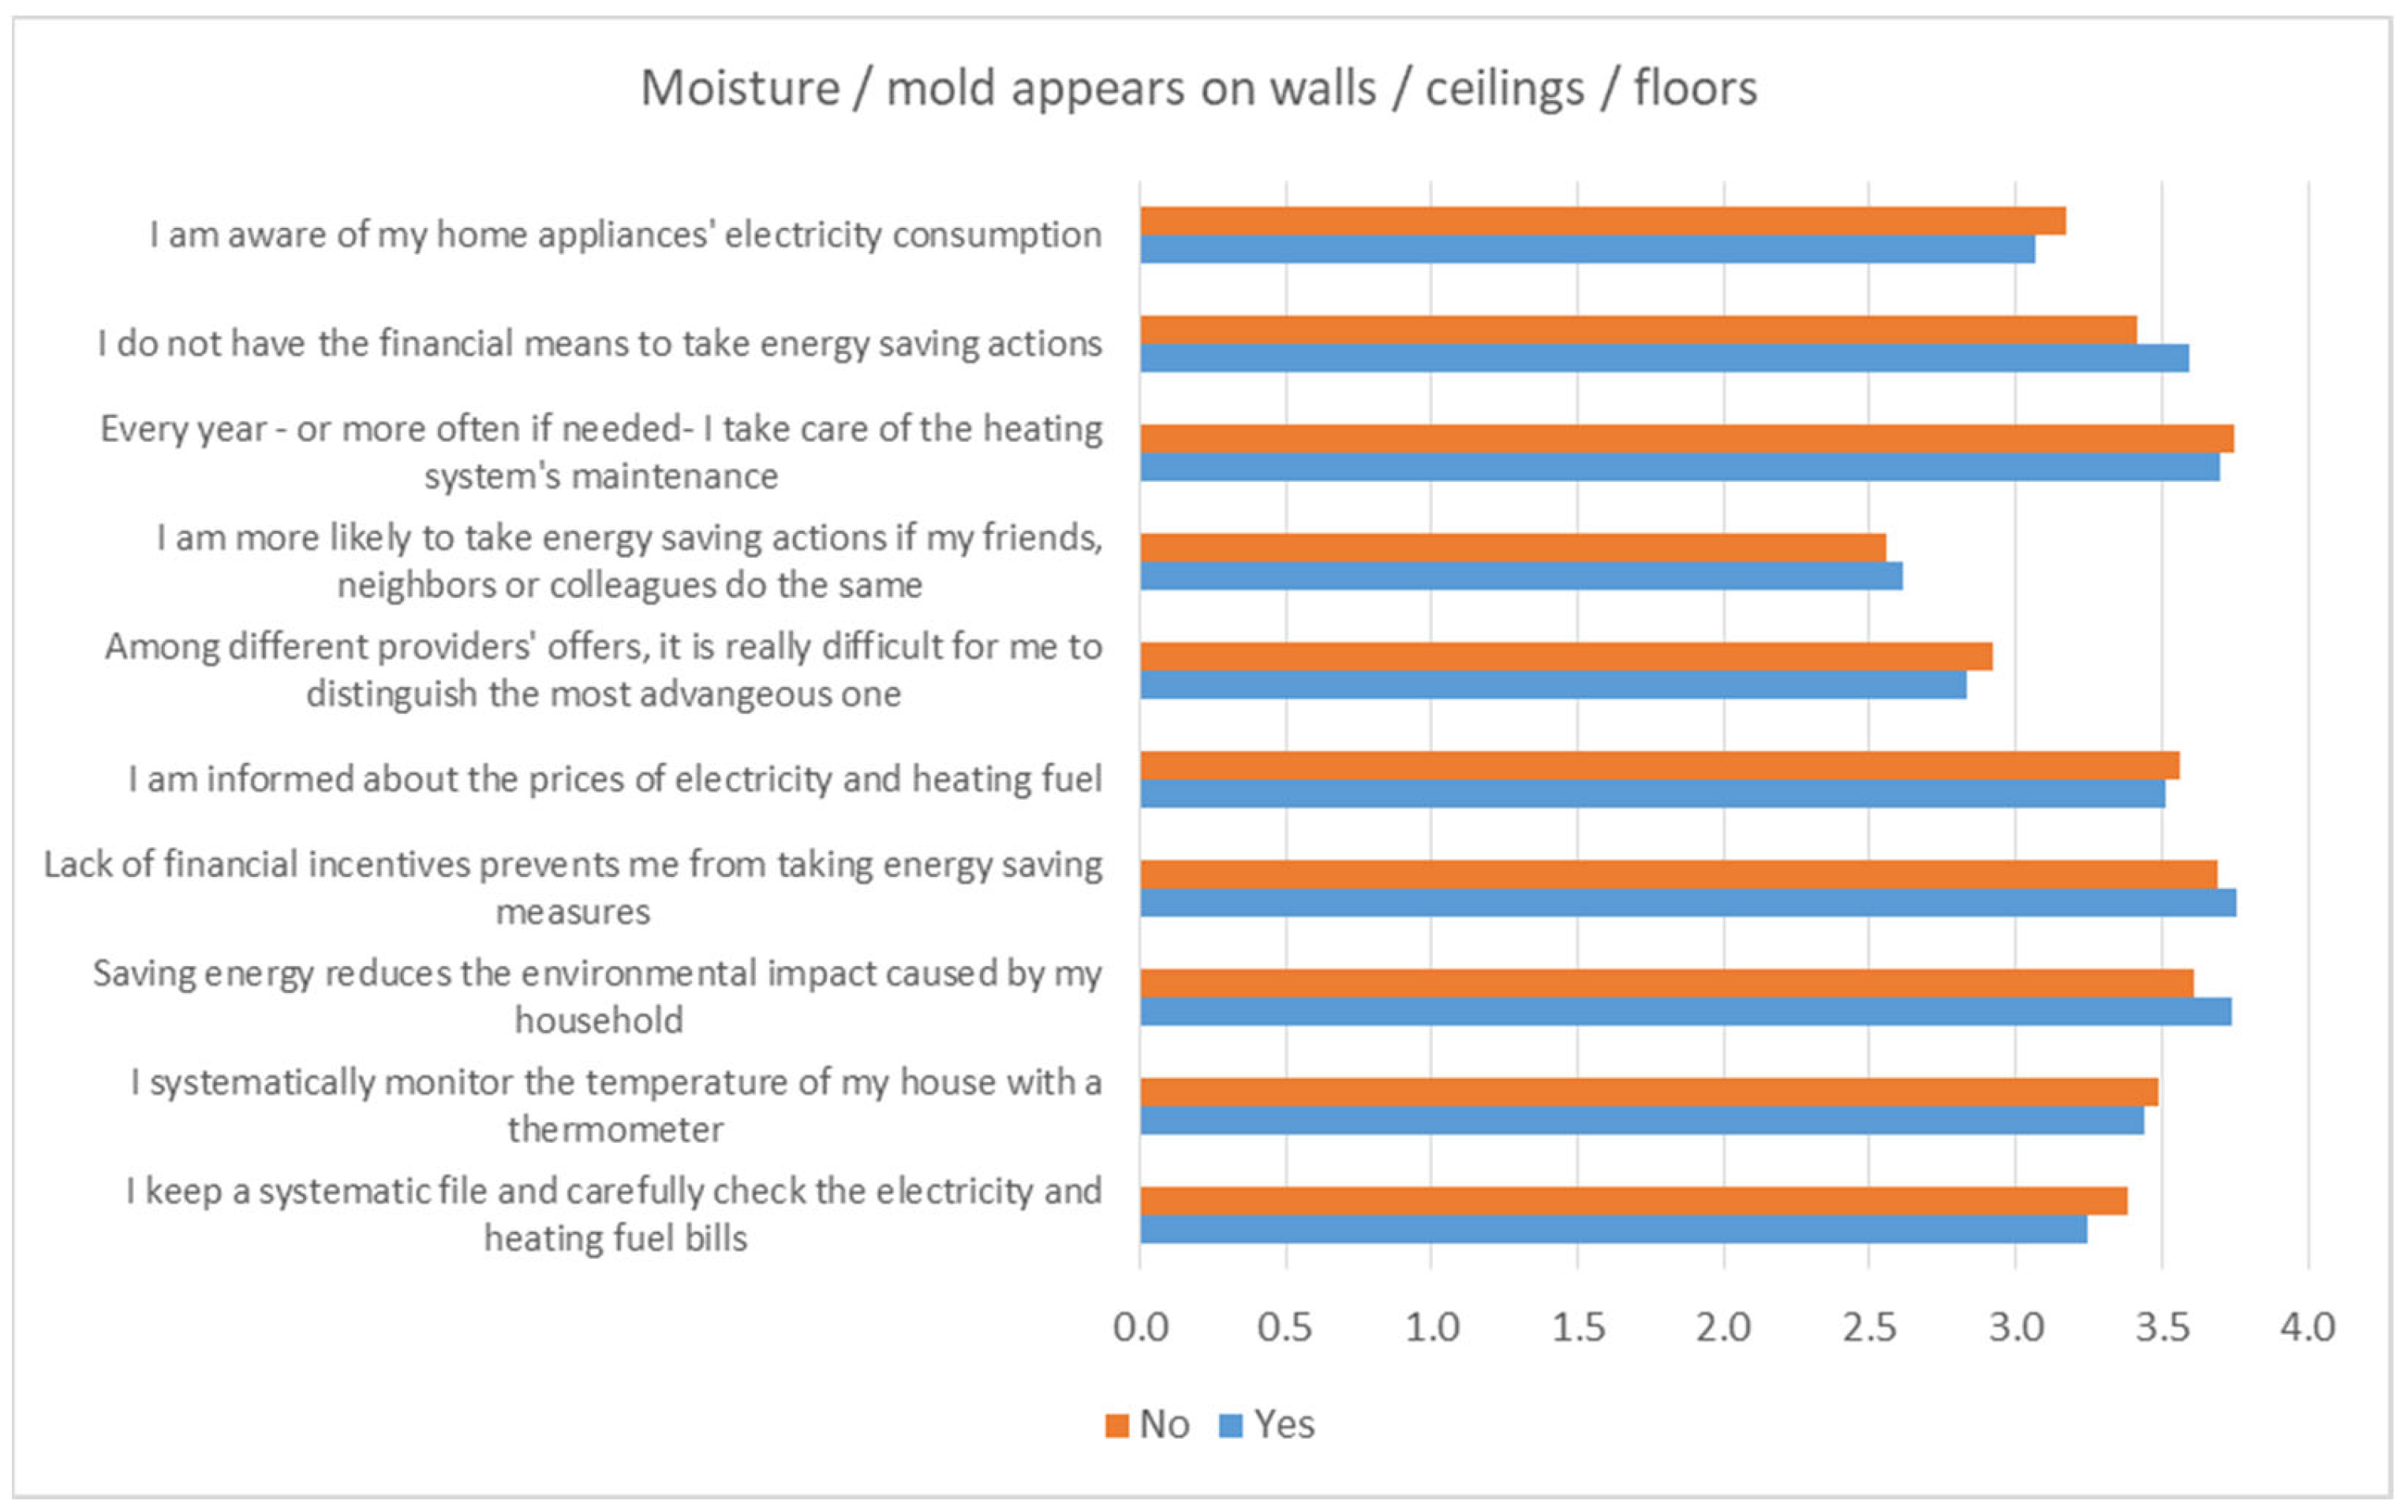
The overall responses regarding the behavioral statements are presented in Figure 5. As regards to financial barriers, more than 80% of the participants state that they do not have the means to proceed to energy efficiency interventions and the vast majority (more than 90%) claim that the state should better help financially vulnerable households take energy-saving actions, reporting the lack of financial incentives.
As mentioned, consumers tend towards rational inattention if an action requires time, effort, or both [14]. This tendency can often be observed in the way households keep track of their energy bills and in their lack of commitment to taking energy-saving actions. When asked, in total, 82% of the households claim to keep a systematic file and carefully check the energy bills. In addition, about 87% claim to systematically monitor the temperature of their house by using a thermometer, and a rather high number, 93%, claim to take care of their heating system’s maintenance once a year, or even more often if needed.
In the case of vulnerable households, chronic stress in combination with limited free time may allocate attention to other matters of a seemingly higher priority and may inhibit obtaining information and gaining knowledge for energy-related matters. Among the households that participated in the survey, about 80% declare being aware of their home appliances’ electricity consumption and, in total, about 90% declare being informed about the price of electricity and heating fuel. Finally, about 60% state that it is difficult for them to distinguish the most advantageous one among different providers’ offers.
Social norms also form a powerful cognitive shortcut. Extensive evidence shows that, given the limited cognitive capacity, decisions are affected by what others do. Obtaining this kind of information provides a reference point against which people can compare options when they are unsure about what to do [13,15]. In total, above half (about 55%) of the participants stated that are more likely to proceed to an energy-saving investment if their friends, neighbors, or colleagues do the same, while around 30% claim not to be affected by what others do.
Similarly, pro-environmental beliefs also affect energy-efficient decisions [14,59]. The more environmentally conscious the consumer is, the more likely she/he is willing to take energy-saving actions. In general, it is argued that socio-economic status is positively correlated with pro-environmental behavior [68]. Yet, it is not always easy to separate self-efficacy and income restrictions when examining the pro-environmental behavior of low-income households [69]. In this survey, about 90% of the respondents agree that saving energy contributes to the reduction in the environmental impact.
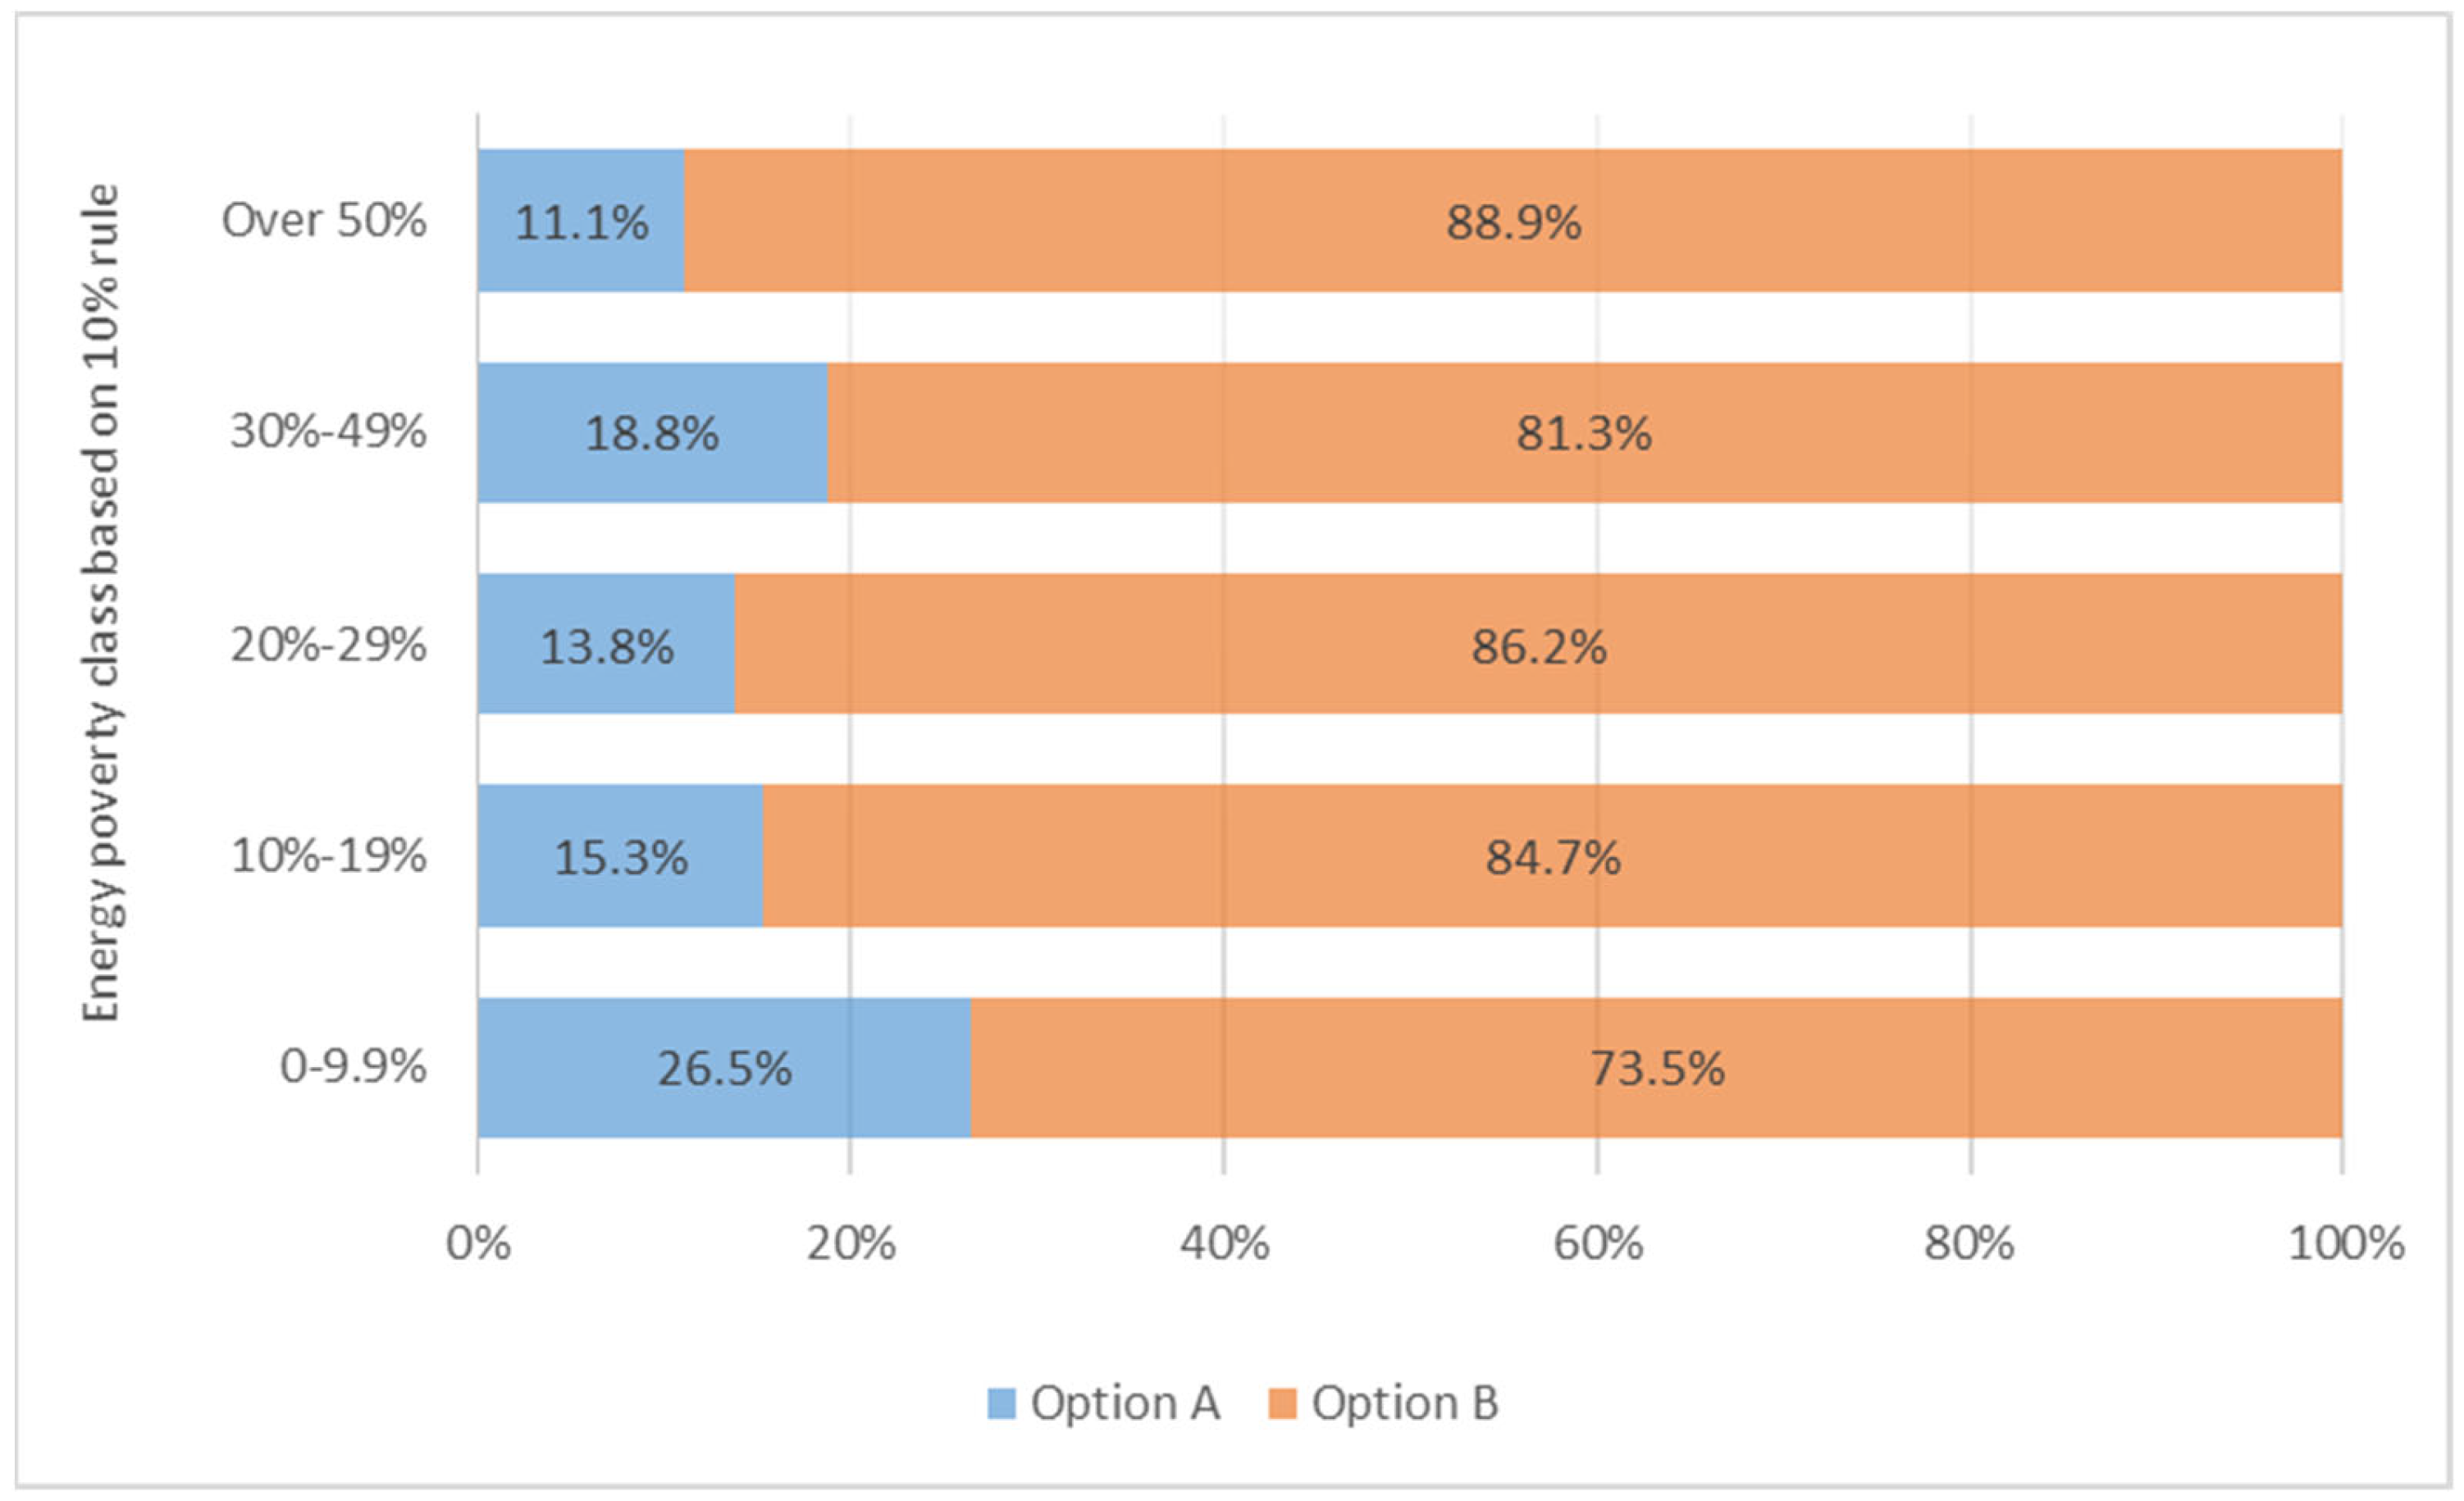
Regarding the present bias, as illustrated in Figure 6, a rather small number of the respondents (18%) tend to systematically overvalue the present compared to the future, by choosing option A (option A offers immediate financial benefit, while option B provides higher benefits in the future).
A rather high number of participants (65.3%) chose refrigerator B, probably because of the lower operational cost (Figure 7). However, the total purchase and operating cost for refrigerator A are lower than that of refrigerator B, providing evidence of energy-related financial illiteracy. In total, only 22.4% of the participants responded correctly to the question, considering also that 4% said that the two refrigerators have the same total cost and 8.3% claimed that they did not know how to calculate the total cost (Figure 7).
4.4. Energy Vulnerability and Behavioral Biases
The following figures (Figure 8, Figure 9, Figure 10, Figure 11, Figure 12, Figure 13, Figure 14 and Figure 15) summarize the responses given in the “bias” questions by energy vulnerability for each of the subjective and objective indicators.
For conciseness reasons, only the findings of the statistical tests are discussed hereinafter. The analysis is presented by statistical hypothesis to facilitate the drawing of conclusions.
4.4.1. Energy Vulnerability and Financial Barriers
According to the Mann–Whitney test, those who cannot keep their houses adequately warm (U = 6796, p = 0.000) and have arrears on energy bills (U = 3109, p = 0.025) face a lack of financial means that prevents them from taking energy-saving actions compared to those who do not have these difficulties. On the contrary, there is no statistically significant difference at the 5% level between those reporting and not reporting moisture or mold problems (U = 8961, p = 0.081).
Furthermore, energy vulnerability determined by the “ten percent rule” also seems to be connected with the existence of financial barriers to improving energy efficiency. The null hypothesis of the Kruskal–Wallis test (i.e., the samples originate from the same distribution) is rejected (χ2 = 27.481, df = 4, p = 0.000). As expected, the higher the mean energy cost-to-income ratio the higher the median value for the financial barriers statement.
Considering both the subjective and objective indicators, the results show that there is no statistically significant difference across energy-vulnerable and non-vulnerable households as far as the role of financial incentives to energy-saving measures is concerned.
Based on the above results, H1 is partially established.
4.4.2. Energy Vulnerability and Rational Inattention
Energy vulnerability measured through the “dwellings with leakages and damp/mold problems” indicator is not associated with rational inattention (the null hypothesis for the Mann–Whitney test could not be rejected). On the other hand, rational inattention differs between those who report or do not report the inability to keep their house adequately warm. More specifically, those who live in a house that is not warm enough are less likely to keep a systematic file and carefully check the electricity and heating fuel bills (U = 6502, p = 0.000) or monitor the temperature inside their house (U = 7451.5, p = 0.001). Nevertheless, no statistically significant difference exists in the maintenance of the heating system. Those who are in arrears on energy bills do not differ from those who do not face such difficulty, as regards to the monitoring of the energy bills or the temperature of the house. However, there is a statistically significant difference (U = 3145, p = 0.028) when examining the heating system’s maintenance. Households in arrears on energy bills are less careful in maintaining their heating system. Yet, this finding should be seen with caution because the size of the “arrears on energy bills” group is relatively small (about 30 observations).
The null hypothesis for the Kruskal–Wallis test is rejected when testing the “ten percent rule” against the systematic filing of energy bills (χ2 = 30.031, df = 4, p = 0.000) and the monitoring of the indoor temperature (χ2 = 19.71, df = 4, p = 0.001). Those who spend a larger share of their income to cover their energy needs suffer more from rational inattention. However, rational inattention does not affect the maintenance of heating systems (χ2 = 1.942, df = 4, p = 0.746).
All in all, H2 is also partially confirmed.
4.4.3. Energy Vulnerability and Information Bias
The hypothesis that households’ awareness about the electricity consumption of household appliances and the prices of electricity and heating fuels and the ability to compare offers from different energy providers, is affected by the energy vulnerability is not confirmed for the “dwellings with leakages and damp/mold problems” indicator (the null hypothesis of the Mann–Whitney test cannot be rejected). As regards to the “inability to keep home adequately warm” indicator, the results show that vulnerable households suffer more from information bias. More analytically, the null hypothesis for the Mann–Whitney test is rejected when exploring the awareness about the electricity consumption of household appliances (U = 7764.5, p = 0.050) and the prices of electricity (U = 7620, p = 0.020). It cannot be rejected, however, when investigating the ability to compare alternative offers (U = 6517.5, p = 0.600). Households who are in arrears on their energy payments are less aware of household appliances’ energy consumption (U = 3094.5, p = 0.046). Yet, they are as aware as other households of the prices of electricity and heating fuels and capable of comparing alternative offers from energy providers.
Concerning the “ten percent rule”, the null hypothesis for the Kruskal–Wallis test cannot be rejected for any of the three statements.
In general, H3 is valid only for households that may not be able to keep their homes warm enough.
4.4.4. Energy Vulnerability and Social Norms
Social norms seem to be completely unrelated to energy vulnerability. The null hypothesis that the beliefs of energy-vulnerable and non-vulnerable households are from populations with the same distributions cannot be rejected for any of the subjective indicators or the objective indicator (i.e., the “ten percent rule”).
Therefore, H4 cannot be validated.
4.4.5. Energy Vulnerability and Pro-Environmental Attitude
The hypothesis that energy-vulnerable people demonstrate a less pro-environmental attitude is validated (i.e., the null hypothesis for the Mann–Whitney test is rejected) only for the “inability to keep home adequately warm” indicator (U = 6830, p = 0.004).
Thus, it could be argued that the findings do not support H5.
4.4.6. Energy Vulnerability and Present Bias
As regards to the “dwellings with leakages and damp/mold problems” indicator, the null hypothesis (i.e., there is no relationship between energy vulnerability captured through this specific indicator and present bias) for the Pearson’s Chi-square Test of Independence cannot be rejected (χ2 = 0.503, df = 1, p = 0.478). Yet, the null hypothesis is rejected for the other two subjective indicators (“inability to keep home adequately warm”: χ2 = 5.192, df = 1, p = 0.023; “arrears on energy bills”: χ2 = 16.626, df = 1, p = 0.000), suggesting that there is a significant relationship between two factors, namely energy vulnerability and present bias. More specifically, energy-vulnerable people (according to these specific indicators) more frequently select Option A, which offers an immediate but lower reward, confirming that they are more susceptible to present bias.
Turning to the “ten percent rule” indicator, the statistical test is in favor of the null hypothesis, i.e., there is no relationship between energy vulnerability and present bias (χ2 = 3.10, df = 4, p = 0.541).
Again, the results are mixed and, therefore, H6 is only partially established.
4.4.7. Energy Vulnerability and Energy-Related Financial Illiteracy
Similar to the case of present bias, the results show that there is no relationship between energy vulnerability and energy-related financial illiteracy regarding the “dwellings with leakages and damp/mold problems” indicator (χ2 = 1.179, df = 3, p = 0.758) and the “ten percent rule” indicator (χ2 = 16.617, df = 12, p = 0.075). The null hypothesis for the Pearson’s Chi-square Test of Independence is rejected again for the “inability to keep home adequately warm” (χ2 = 9.984, df = 3, p = 0.019) and “arrears on energy bills” indicators (χ2 = 15.510, df = 3, p = 0.001). The percentage of energy-vulnerable people who opted for Refrigerator B was lower than that of the non-vulnerable (59.1% against 68.1% and 43.3%, against 68.4%, for the “inability to keep home adequately warm” and “arrears on energy bills” indicators, respectively).
Hence, H7 is also partially confirmed.
5. Discussion and Conclusions
The present study aimed to investigate whether energy-vulnerable households are more prone to informative, market, and behavioral biases, and to the authors’ best knowledge, this is the first attempt to investigate these issues through a primary survey. More specifically, the survey was designed to test the following hypotheses:
Hypothesis 1 (H1). Energy-vulnerable and non-vulnerable people face the same financial barriers.
Hypothesis 2 (H2). Energy-vulnerable and non-vulnerable people suffer equally from rational inattention.
Hypothesis 3 (H3). Energy-vulnerable and non-vulnerable people are equally prone to information bias.
Hypothesis 4 (H4). Energy-vulnerable people and non-vulnerable are affected the same by social norms.
Hypothesis 5 (H5). Energy-vulnerable and non-vulnerable people demonstrate a similar pro-environmental attitude.
Hypothesis 6 (H6). Energy-vulnerable and non-vulnerable people are equally exposed to present bias.
Hypothesis 7 (H7). Energy-vulnerable and non-vulnerable people are equally energy-related financial illiterate.
According to previous research efforts linked to the effect of different barriers on decision making related to energy efficiency investments, many factors influence households’ energy use behavior, from demographics to cognitive skills to understand the information received [70]. As far as financial barriers are concerned (H1), many households claim that they lack the capital to invest in new energy-efficient technology as the upfront cost is too high, or that they have limited access to loans [71,72,73,74,75,76]. In line with these findings, a negative correlation was found between the inability to afford energy-efficient appliances and high performance in energy-related decision making [71]. Moreover, in accordance with hypothesis statements H2–H6, there are many behavioral barriers affecting decision making that have been identified in the literature. Firstly, concerning rational inattention and information bias (H2 and H3), house owners may be unaware of the need for energy efficiency, not care about their electricity bills [77], or are just unwilling to make changes [73,76,78]. Furthermore, when it comes to information bias, it is claimed that information previously assessed as relevant for one’s worries is prioritized in memory, having a greater influence on current decision making [79]. Moving on to the impact of social norms (H4) on energy-related decision making, individuals are reported to weigh the actions of their social peers when investing in a new energy technology [76,78]. Nevertheless, when it comes to buying energy-efficient appliances, the findings reveal that the peer impact is not that strong [59] or is negatively correlated with high-performance decision making [71]. One of the social norms that households tend to avoid violating is that of pro-environmental behavior [79], which leads to the next hypothesis. In a recent study on energy-efficient investments, the regression models showed that pro-environmental behavior is positively connected with higher performance in energy decision making [71]. Consistent with the abovementioned finding, strong evidence is reported that households consider the environmental externalities of energy use, which may lead to a preference for more ecologically friendly energy options [59]. Concerning H6, many surveys have been previously conducted in order to measure the impact of time preferences on energy use behavior. According to related studies, the high initial cost of energy-efficient equipment mitigates efforts to promote energy efficiency [77]. In addition, households tend to weigh more the losses of an energy-efficient investment in the present than the future electricity savings [80,81,82]. Finally, in terms of energy literacy, findings from previous research have shown that more than 60% of the survey respondents were unable to estimate the exact amount they spend each year on the electricity utility for the operation of their appliances [71].
According to the present study, hypotheses H4 and H5 cannot be validated, whereas all other hypotheses are partially validated. In almost all statistical hypotheses tested, the subjective indicator “dwellings with leakages and damp/mold problems” does not seem to affect the results. This is probably because most of the houses in the study area are old, not well insulated and, in addition, the local climate is conducive to the presence of moisture and mold problems inside the houses. The same applies, more or less, to those households identified as energy vulnerable under the “ten percent rule”. The proportion of households considered to be in energy poverty under the “ten percent rule” is particularly high in the survey area (83.5%) due to the high heating costs. Therefore, this objective indicator does not facilitate the separation of households into vulnerable and non-vulnerable for this survey.
Those who live in a house that is not warm enough seem to face greater financial barriers are less careful in maintaining their heating system and are more susceptible to information bias, present bias, and energy-related financial illiteracy. In other words, these households seem to be more prone to informative, market, and behavioral biases. This finding is probably related to the fact that households that are unable to keep their home sufficiently warm are, in general, in the low-income bracket in the study area. The same behavior is observed, more or less, in households that have fallen behind on their energy bills. Yet, these findings should be seen with caution because the size of the “arrears on energy bills” group is relatively small (about 30 observations).
Based on the above remarks, a conclusion that emerges from the present study is that the income status of the household seems to play a greater role in behavioral and other biases compared to its classification as energy vulnerable, but this conclusion is not universal. As mentioned, some commonly used indicators, such as the “ten percent rule”, cannot satisfactorily distinguish between energy-vulnerable and non-energy-vulnerable households in the study area. However, these conclusions need to be confirmed by future research. To date, there are a plethora of studies on how poverty affects people’s decision making, but the research specifically on energy poverty is extremely limited. In this direction, future research should investigate the role of market, behavioral, and other biases through appropriately designed choice experiments, extending the research of [71]. Additionally, this research focused on a mountainous settlement since, as mentioned, mountainous areas are particularly vulnerable to energy poverty. Thus, the findings of the survey should be tested through complementary research in urban populations. Finally, future research may focus on cognitive domains that were not thoroughly addressed in this research, such as loss and risk aversion.
In any case, however, the findings are worrisome. In general, energy-vulnerable households are low-income households (or under poverty) and, therefore, without tailor-made support, they may face greater difficulties in making the right decisions towards reducing their energy costs or improving their quality of life (e.g., their thermal comfort). The current policy measures do not help households in this direction. Indicatively, as regards to the heating allowance policy applied by 2012, and despite the new and more reasonable methodology introduced for quantifying subsidies during the last heating period (2020–2021), the amounts of fuels subsidized are considered inadequate and the beneficiaries’ income and property criteria are restrictive. For example, a household dwelling in Metsovo spends about EUR 2000 annually on heating; given that this household has to spend on fuel at least double the amount of the subsidy to finally obtain it, a great economic burden remains. Hence, households with increased thermal energy needs and low-income households should be encouraged to purchase home heating fuels at lower prices, irrespective of their consumption or property criteria.
In addition, a large part of the electricity bill is composed of taxes, levies, and charges related to sources other than energy, i.e., municipal taxes and duties, the real estate tax, and the countervailing duty for the Hellenic Broadcasting Corporation ERT S.A. (the state-owned public television and radio broadcaster for Greece). These kinds of charges included within the electricity bill create great confusion to consumers, especially energy-vulnerable ones, affecting their susceptibility to informative and behavioral biases. Hence, the subtraction of these charges is considered another essential direction.
Moreover, effective motivation for improving the energy efficiency of residences is considered a key policy measure, since energy efficiency is one of the most decisive factors for reducing energy costs. Even more, low-income households are usually unable to invest in energy efficiency. However, the energy efficiency program for new buildings adopted by the government during the past year failed to effectively support households, as the online application system with a very strict submission timeframe—along with the priority time order adopted—excluded thousands of households from the very first moments of registering to the program. All in all, there is a need to design more targeted and more effective policies to support energy-vulnerable households, taking into account the difficulties in making rational decisions due to market, information, or behavioral barriers.
Author Contributions
Conceptualization, D.D. and C.K.; Data curation, C.K. and D.D.; Formal analysis, D.D.; Methodology, D.D., C.K., and L.P.; Project administration, D.D.; Writing—original draft, C.K., L.P., and D.D.; Writing—review and editing, L.P. All authors have read and agreed to the published version of the manuscript. The manuscript solely reflects author’ views.
Funding
This work was supported by the STEP-IN Project (Using Living Labs to roll out Sustainable Strategies for Energy Poor Individuals) funded from the European Union’s Horizon 2020 research and innovation programme (contract no. 785125).
Institutional Review Board Statement
The study was conducted according to the General Data Protection Regulation (Regulation No. 2016/679) and approved by the Research Ethics Committee of the National Technical University of Athens (accessed on 18 April 2019).
Informed Consent Statement
Informed consent was obtained from all subjects involved in the study.
Data Availability Statement
Data are not publicly available due to the privacy of respondents.
Conflicts of Interest
The authors declare no conflict of interest.
References
- International Energy Agency. SDG7: Data and Projections. Available online: https://www.iea.org/reports/sdg7-data-and-projections (accessed on 14 July 2021).
- Palmer, G.; MacInnes, T.; Kenway, T. Cold and Poor: An Analysis of the Link Between Fuel Poverty and Low Income; New Policy Institute: London, UK, 2008; p. 90. [Google Scholar]
- International Energy Agency. Evaluating the Co-Benefits of Low-Incomes Energy-Efficiency Programmes; International Energy Agency (IEA): Paris, France, 2011. [Google Scholar]
- Atanasiu, B.; Kontonasiou, E.; Mariottini, F. Alleviating Fuel Poverty in the EU. Investing in Home Renovation, A Sustainable and Inclusive Solution; Buildings Performance Institute Europe (BPIE): Brussels, Belgium, 2014; ISBN 978-94-91143-09-0. [Google Scholar]
- EU Energy Poverty. Observatory Indicators & Data. Available online: https://www.energypoverty.eu/indicators-data (accessed on 25 June 2021).
- Llorca, M.; Rodriguez-Alvarez, A.; Jamasb, T. Objective vs subjective fuel poverty and self-assessed health. Energy Econ. 2020, 87, 104736. [Google Scholar] [CrossRef] [Green Version]
- Herrero, S.T. Energy poverty indicators: A critical review of methods. Indoor Built Environ. 2017, 26, 1018–1031. [Google Scholar] [CrossRef]
- Longhurst, N.; Hargreaves, T. Emotions and fuel poverty: The lived experience of social housing tenants in the United Kingdom. Energy Res. Soc. Sci. 2019, 56, 101207. [Google Scholar] [CrossRef]
- Department of Energy and Climate Chance (DECC). Annual Fuel Poverty Statistics Report 2015; Annual Fuel Poverty Statistics Report; Department of Energy & Climate Change: London, UK, 2015; p. 116.
- Eurostat EU Statistics on Income and Living Conditions (EU-SILC). Methodology—Economic Strain. Available online: https://ec.europa.eu/eurostat/web/income-and-living-conditions/data/database (accessed on 22 July 2021).
- Papada, L.; Kaliampakos, D. Measuring energy poverty in Greece. Energy Policy 2016, 94, 157–165. [Google Scholar] [CrossRef]
- Bouzarovski, S.; Thomson, H.; Cornelis, M.; Varo, A.; Guyet, R. Towards an Inclusive Energy Transition in the European Union: Confronting Energy Poverty amidst a Global Crisis; EU Energy Poverty Observatory: Luxembourg, 2020. [Google Scholar]
- DellaValle, N. People’s Decisions Matter: Understanding and Addressing Energy Poverty with Behavioral Economics. Energy Build. 2019, 204, 109515. [Google Scholar] [CrossRef]
- Abrardi, L. Behavioral barriers and the energy efficiency gap: A Survey of the literature. Econ. Politica Ind. J. Ind. Bus. Econ. 2019, 46, 25–43. [Google Scholar] [CrossRef]
- Kahneman, D. Thinking Fast and Thinking Slow; Penguin Random House: London, UK, 2011; ISBN 978-0-374-27563-1. [Google Scholar]
- Huijsmans, I.; Ma, I.; Rettore Micheli, L.; Civai, C.; Stallen, M.; Sanfey, A. A scarcity mindset alters neural processing underlying consumer decision making. Proc. Natl. Acad. Sci. USA 2019, 116, 201818572. [Google Scholar] [CrossRef] [Green Version]
- Mani, A.; Mullainathan, S.; Shafir, E.; Zhao, J. Scarcity and cognitive function around payday: A conceptual and empirical analysis. J. Assoc. Consum. Res. 2020, 5, 365–376. [Google Scholar] [CrossRef]
- Adamkovič, M.; Martončik, M. A review of consequences of poverty on economic decision-making: A hypothesized model of a cognitive mechanism. Front. Psychol. 2017, 8, 1784. [Google Scholar] [CrossRef]
- Ong, Q.; Theseira, W.; Ng, I.Y.H. Reducing debt improves psychological functioning and changes decision-making in the poor. Proc. Natl. Acad. Sci. USA 2019, 116, 7244–7249. [Google Scholar] [CrossRef] [Green Version]
- Adamkovič, M. Consequences of poverty on economic decision-making: Assessing the verisimilitude of the cognitive mechanism. Front. Psychol. 2020, 11, 171. [Google Scholar] [CrossRef] [PubMed]
- Kraay, A.; McKenzie, D. Do poverty traps exist? Assessing the evidence. J. Econ. Perspect. 2014, 28, 127–148. [Google Scholar] [CrossRef] [Green Version]
- Damigos, D.; Kaliampakou, C.; Balaskas, A.; Papada, L. Does energy poverty affect energy efficiency investment decisions? First evidence from a stated choice experiment. Energies 2021, 14, 1698. [Google Scholar] [CrossRef]
- Mullainathan, S. The Irony of Poverty. In A Short Course in Behavioural Economics. Edge Master Class; (Class 5); Thaler, R., Mullainathan, S., Kahneman, D., Eds.; Edge Foundation: London, UK, 2008. [Google Scholar]
- Haushofer, J.; Fehr, E. On the psychology of poverty. Science 2014, 344, 862–867. [Google Scholar] [CrossRef]
- Schilbach, F.; Schofield, H.; Mullainathan, S. The psychological lives of the poor. Am. Econ. Rev. 2016, 106, 435–440. [Google Scholar] [CrossRef] [PubMed] [Green Version]
- Mani, A.; Mullainathan, S.; Shafir, E.; Zhao, J. Poverty impedes cognitive function. Science 2013, 341, 976–980. [Google Scholar] [CrossRef] [Green Version]
- Griskevicius, V.; Tybur, J.M.; Delton, A.W.; Robertson, T.E. The influence of mortality and socioeconomic status on risk and delayed rewards: A life history theory approach. J. Pers. Soc. Psychol. 2011, 100, 1015–1026. [Google Scholar] [CrossRef] [Green Version]
- Shah, A.K.; Shafir, E.; Mullainathan, S. Scarcity frames value. Psychol. Sci. 2015, 26, 402–412. [Google Scholar] [CrossRef]
- Robinson, O.J.; Vytal, K.; Cornwell, B.R.; Grillon, C. The impact of anxiety upon cognition: Perspectives from human threat of shock studies. Front. Hum. Neurosci. 2013, 7, 203. [Google Scholar] [CrossRef] [Green Version]
- Morgado, P.; Cerqueira, J.J. Editorial: The impact of stress on cognition and motivation. Front. Behav. Neurosci. 2018, 12, 326. [Google Scholar] [CrossRef]
- Diamond, A. Executive functions. Ann. Rev. Psychol. 2013, 64, 135–168. [Google Scholar] [CrossRef] [Green Version]
- Shields, G.S.; Sazma, M.A.; Yonelinas, A.P. The effects of acute stress on core executive functions: A meta-analysis and comparison with cortisol. Neurosci. Biobehav. Rev. 2016, 68, 651–668. [Google Scholar] [CrossRef] [Green Version]
- Roos, L.E.; Knight, E.L.; Beauchamp, K.G.; Giuliano, R.J.; Fisher, P.A.; Berkman, E.T. Conceptual precision is key in acute stress research: A commentary on shields, sazma, & yonelinas, 2016. Neurosci. Biobehav. Rev. 2017, 83, 140–144. [Google Scholar] [CrossRef] [Green Version]
- Fudenberg, D.; Levine, D.K. A dual-self model of impulse control. Am. Econ. Rev. 2006, 96, 1449–1476. [Google Scholar] [CrossRef] [PubMed] [Green Version]
- Baumeister, R.; Muraven, M.; Tice, D. Ego depletion: A resource model of volition, self-regulation, and controlled processing. Soc. Cogn. 2000, 18, 130–150. [Google Scholar] [CrossRef]
- Sims, C.A. Rational inattention: Beyond the linear-quadratic Case. Am. Econ. Rev. 2006, 96, 158–163. [Google Scholar] [CrossRef]
- Karlan, D.; McConnell, M.; Mullainathan, S.; Zinman, J. Getting to the top of mind: How reminders increase saving. Manag. Sci. 2016, 62, 3393–3411. [Google Scholar] [CrossRef] [Green Version]
- Matějka, F.; McKay, A. Rational inattention to discrete choices: A new foundation for the multinomial logit model. Am. Econ. Rev. 2015, 105, 272–298. [Google Scholar] [CrossRef] [Green Version]
- Bartos, V.; Bauer, M.; Chytilová, J.; Levely, I. Effects of poverty on impatience: Preferences or inattention? SSRN Electron. J. 2018. [Google Scholar] [CrossRef] [Green Version]
- Haselton, M.G.; Nettle, D.; Murray, D.R. The Evolution of Cognitive Bias. In The Handbook of Evolutionary Psychology; American Cancer Society: Atlanta, GA, USA, 2015; pp. 1–20. ISBN 978-1-119-12556-3. [Google Scholar]
- Bahaddin, B.; Weinberg, S.; Luna-Reyes, L.F.; Andersen, D. Building a bridge to behavioral economics: Countervailing cognitive biases in lifetime saving decisions. Syst. Dyn. Rev. 2019, 35, 187–207. [Google Scholar] [CrossRef]
- Simonovic, B.; Stupple, E.J.N.; Gale, M.; Sheffield, D. Performance under stress: An eye-tracking investigation of the Iowa gambling task (IGT). Front. Behav. Neurosci. 2018, 12, 217. [Google Scholar] [CrossRef]
- Dalton, P.S.; Rüschenpöhler, J.; Uras, B.; Zia, B. Curating local knowledge: Experimental evidence from small retailers in Indonesia. J. Eur. Econ. Assoc. 2021. [Google Scholar] [CrossRef]
- Cohen, J.; Ericson, K.M.; Laibson, D.; White, J.M. Measuring time preferences. J. Econ. Lit. 2020, 58, 299–347. [Google Scholar] [CrossRef]
- Brown, J.R.; Ivković, Z.; Weisbenner, S. Empirical determinants of intertemporal choice. J. Financ. Econ. 2015, 116, 473–486. [Google Scholar] [CrossRef]
- Gabaix, X.; Laibson, D. Myopia and Discounting; Working Paper Series; National Bureau of Economic Research: Cambridge, MA, USA, 2017. [Google Scholar]
- Carvalho, L.S.; Meier, S.; Wang, S.W. Poverty and economic decision-making: Evidence from changes in financial resources at payday. Am. Econ. Rev. 2016, 106, 260–284. [Google Scholar] [CrossRef] [Green Version]
- Sheehy-Skeffington, J.; Rea, J. How Poverty Affects People’s Decision-Making Processes. Available online: https://www.jrf.org.uk/report/how-poverty-affects-peoples-decision-making-processes (accessed on 11 July 2021).
- Gillingham, K.; Palmer, K. Bridging the energy efficiency gap: Policy insights from economic theory and empirical evidence. Rev. Environ. Econ. Policy 2014, 8, 18–38. [Google Scholar] [CrossRef] [Green Version]
- Kremer, M.; Rao, G.; Schilbach, F. Chapter 5—Behavioral Development Economics. In Handbook of Behavioral Economics: Applications and Foundations 1; Bernheim, B.D., DellaVigna, S., Laibson, D., Eds.; North-Holland: Amsterdam, The Netherlands, 2019; Volume 2, pp. 345–458. ISBN 2352-2399. [Google Scholar]
- Lusardi, A.; Mitchell, O.S. Financial literacy around the world: An overview. J. Pension Econ. Financ. 2011, 10, 497–508. [Google Scholar] [CrossRef] [Green Version]
- Meier, S.; Sprenger, C.D. Discounting financial literacy: Time preferences and participation in financial education programs. J. Econ. Behav. Organ. 2013, 95, 159–174. [Google Scholar] [CrossRef] [Green Version]
- French, D.; McKillop, D. Financial literacy and over-indebtedness in low-income households. Int. Rev. Financ. Anal. 2016, 48, 1–11. [Google Scholar] [CrossRef] [Green Version]
- Papada, L.; Kaliampakos, D. Energy poverty in Greek mountainous areas: A comparative study. J. Mt. Sci. 2017, 14, 1229–1240. [Google Scholar] [CrossRef]
- Papada, L.; Kaliampakos, D. Being forced to skimp on energy needs: A new look at energy poverty in Greece. Energy Res. Soc. Sci. 2020, 64, 101450. [Google Scholar] [CrossRef]
- Katsoulakos, N.M.; Kaliampakos, D.C. What is the impact of altitude on energy demand? A step towards developing specialized energy policy for mountainous areas. Energy Policy 2014, 71, 130–138. [Google Scholar] [CrossRef]
- Hellenic Statistical Authority. National Population and Housing Census. 2011. Available online: https://www.statistics.gr/el/2011-census-pop-hous (accessed on 19 July 2021).
- Bouzarovski, S. Energy poverty in the European union: Landscapes of vulnerability. WIREs Energy Environ. 2014, 3, 276–289. [Google Scholar] [CrossRef]
- Damigos, D.; Kontogianni, A.; Tourkolias, C.; Skourtos, M. Behind the Scenes: Why are energy efficient home appliances such a hard sell? Resour. Conserv. Recycl. 2020, 158, 104761. [Google Scholar] [CrossRef]
- Orlov, A.; Kallbekken, S. The impact of consumer attitudes towards energy efficiency on car choice: Survey results from Norway. J. Clean. Prod. 2019, 214, 816–822. [Google Scholar] [CrossRef]
- López-Bernabé, E.; Foudi, S.; Linares, P.; Galarraga, I. Factors affecting energy-efficiency investment in the hotel industry: Survey results from Spain. Energy Effic. 2021, 14, 41. [Google Scholar] [CrossRef]
- Brounen, D.; Kok, N.; Quigley, J.M. Energy literacy, awareness, and conservation behavior of residential households. Energy Econ. 2013, 38, 42–50. [Google Scholar] [CrossRef]
- Wilcoxon, F. Individual comparisons by ranking methods. Biom. Bull. 1945, 1, 80–83. [Google Scholar] [CrossRef]
- Mann, H.B.; Whitney, D.R. On a test of whether one of two random variables is stochastically larger than the other. Ann. Math. Stat. 1947, 18, 50–60. [Google Scholar] [CrossRef]
- Kruskal, W.H.; Wallis, W.A. Use of ranks in one-criterion variance analysis. J. Am. Stat. Assoc. 1952, 47, 583–621. [Google Scholar] [CrossRef]
- Karl Pearson, F.R.S. X. On the criterion that a given system of deviations from the probable in the case of a correlated system of variables is such that it can be reasonably supposed to have arisen from random sampling. Lond. Edinb. Dublin Philos. Mag. J. Sci. 1900, 50, 157–175. [Google Scholar] [CrossRef] [Green Version]
- Hellenic Statistical Authority. Material Deprivation and Living Conditions 2020; Survey on Income and Living Conditions (SILC); ELSTAT: Piraeus, Greece, 2021.
- Grandin, A.; Guillou, L.; Abdel Sater, R.; Foucault, M.; Chevallier, C. Socioeconomic Status, Time Preferences and Pro-Environmentalism. 2021. Available online: file:///C:/Users/Admin/Downloads/Article_Discounting_Environment.pdf (accessed on 24 July 2021).
- Ferreira, M.A.; Santana, S. Low-income people and pro-environmental behavior: Beyond money issues, a literature review. Millenium 2021, 14, 71–78. [Google Scholar]
- Gupta, A.K.; Roach, D.C.; Rinehart, S.M.; Best, L.A. Decision-making impacts on energy consumption display design. Energy Technol. Policy 2015, 2, 133–142. [Google Scholar] [CrossRef] [Green Version]
- Damigos, D.; Kontogianni, A.; Tourkolias, C.; Skourtos, M. Dissecting subjective discount rates and investment literacy for energy-efficient investments. Energy Effic. 2021, 14, 31. [Google Scholar] [CrossRef]
- Pelenur, M.J.; Cruickshank, H.J. Closing the energy efficiency gap: A study linking demographics with barriers to adopting energy efficiency measures in the home. Energy 2012, 47, 348–357. [Google Scholar] [CrossRef]
- Schleich, J.; Gassmann, X.; Faure, C.; Meissner, T. Making the implicit explicit: A look inside the implicit discount rate. Energy Policy 2016, 97, 321–331. [Google Scholar] [CrossRef]
- Hirst, E.; Brown, M. Closing the efficiency gap: Barriers to the efficient use of energy. Resour. Conserv. Recycl. 1990, 3, 267–281. [Google Scholar] [CrossRef]
- Cagno, E.; Worrell, E.; Trianni, A.; Pugliese, G. A novel approach for barriers to industrial energy efficiency. Renew. Sustain. Energy Rev. 2013, 19, 290–308. [Google Scholar] [CrossRef]
- Hesselink, L.X.W.; Chappin, E.J.L. Adoption of energy efficient technologies by households—Barriers, policies and agent-based modelling studies. Renew. Sustain. Energy Rev. 2019, 99, 29–41. [Google Scholar] [CrossRef]
- Dianshu, F.; Sovacool, B.K.; Vu, K.M. The barriers to energy efficiency in China: Assessing household electricity savings and consumer behavior in Liaoning province. Energy Policy 2010, 38, 1202–1209. [Google Scholar] [CrossRef]
- Moglia, M.; Cook, S.; McGregor, J. A review of agent-based modelling of technology diffusion with special reference to residential energy efficiency. Sustain. Cities Soc. 2017, 31, 173–182. [Google Scholar] [CrossRef]
- Brosch, T.; Patel, M.; Sander, D. Affective influences on energy-related decisions and behaviors. Front. Energy Res. 2014, 2, 11. [Google Scholar] [CrossRef] [Green Version]
- Bradford, D.; Courtemanche, C.; Heutel, G.; McAlvanah, P.; Ruhm, C. Time preferences and consumer behavior. J. Risk Uncertain. 2017, 55, 119–145. [Google Scholar] [CrossRef] [Green Version]
- Allcott, H.; Taubinsky, D. Evaluating behaviorally motivated policy: Experimental evidence from the lightbulb market. Am. Econ. Rev. 2015, 105, 2501–2538. [Google Scholar] [CrossRef] [Green Version]
- Schleich, J.; Gassmann, X.; Meissner, T.; Faure, C. A large-scale test of the effects of time discounting, risk aversion, loss aversion, and present bias on household adoption of energy-efficient technologies. Energy Econ. 2019, 80, 377–393. [Google Scholar] [CrossRef] [Green Version]
Figure 1.
Conceptual framework of the study.
Figure 2.
Primary heating systems used in Metsovo.

Figure 3.
Energy poverty qualitative indicators in Metsovo.
Figure 4.
Kernel density histogram of energy expenditure to income ratio.
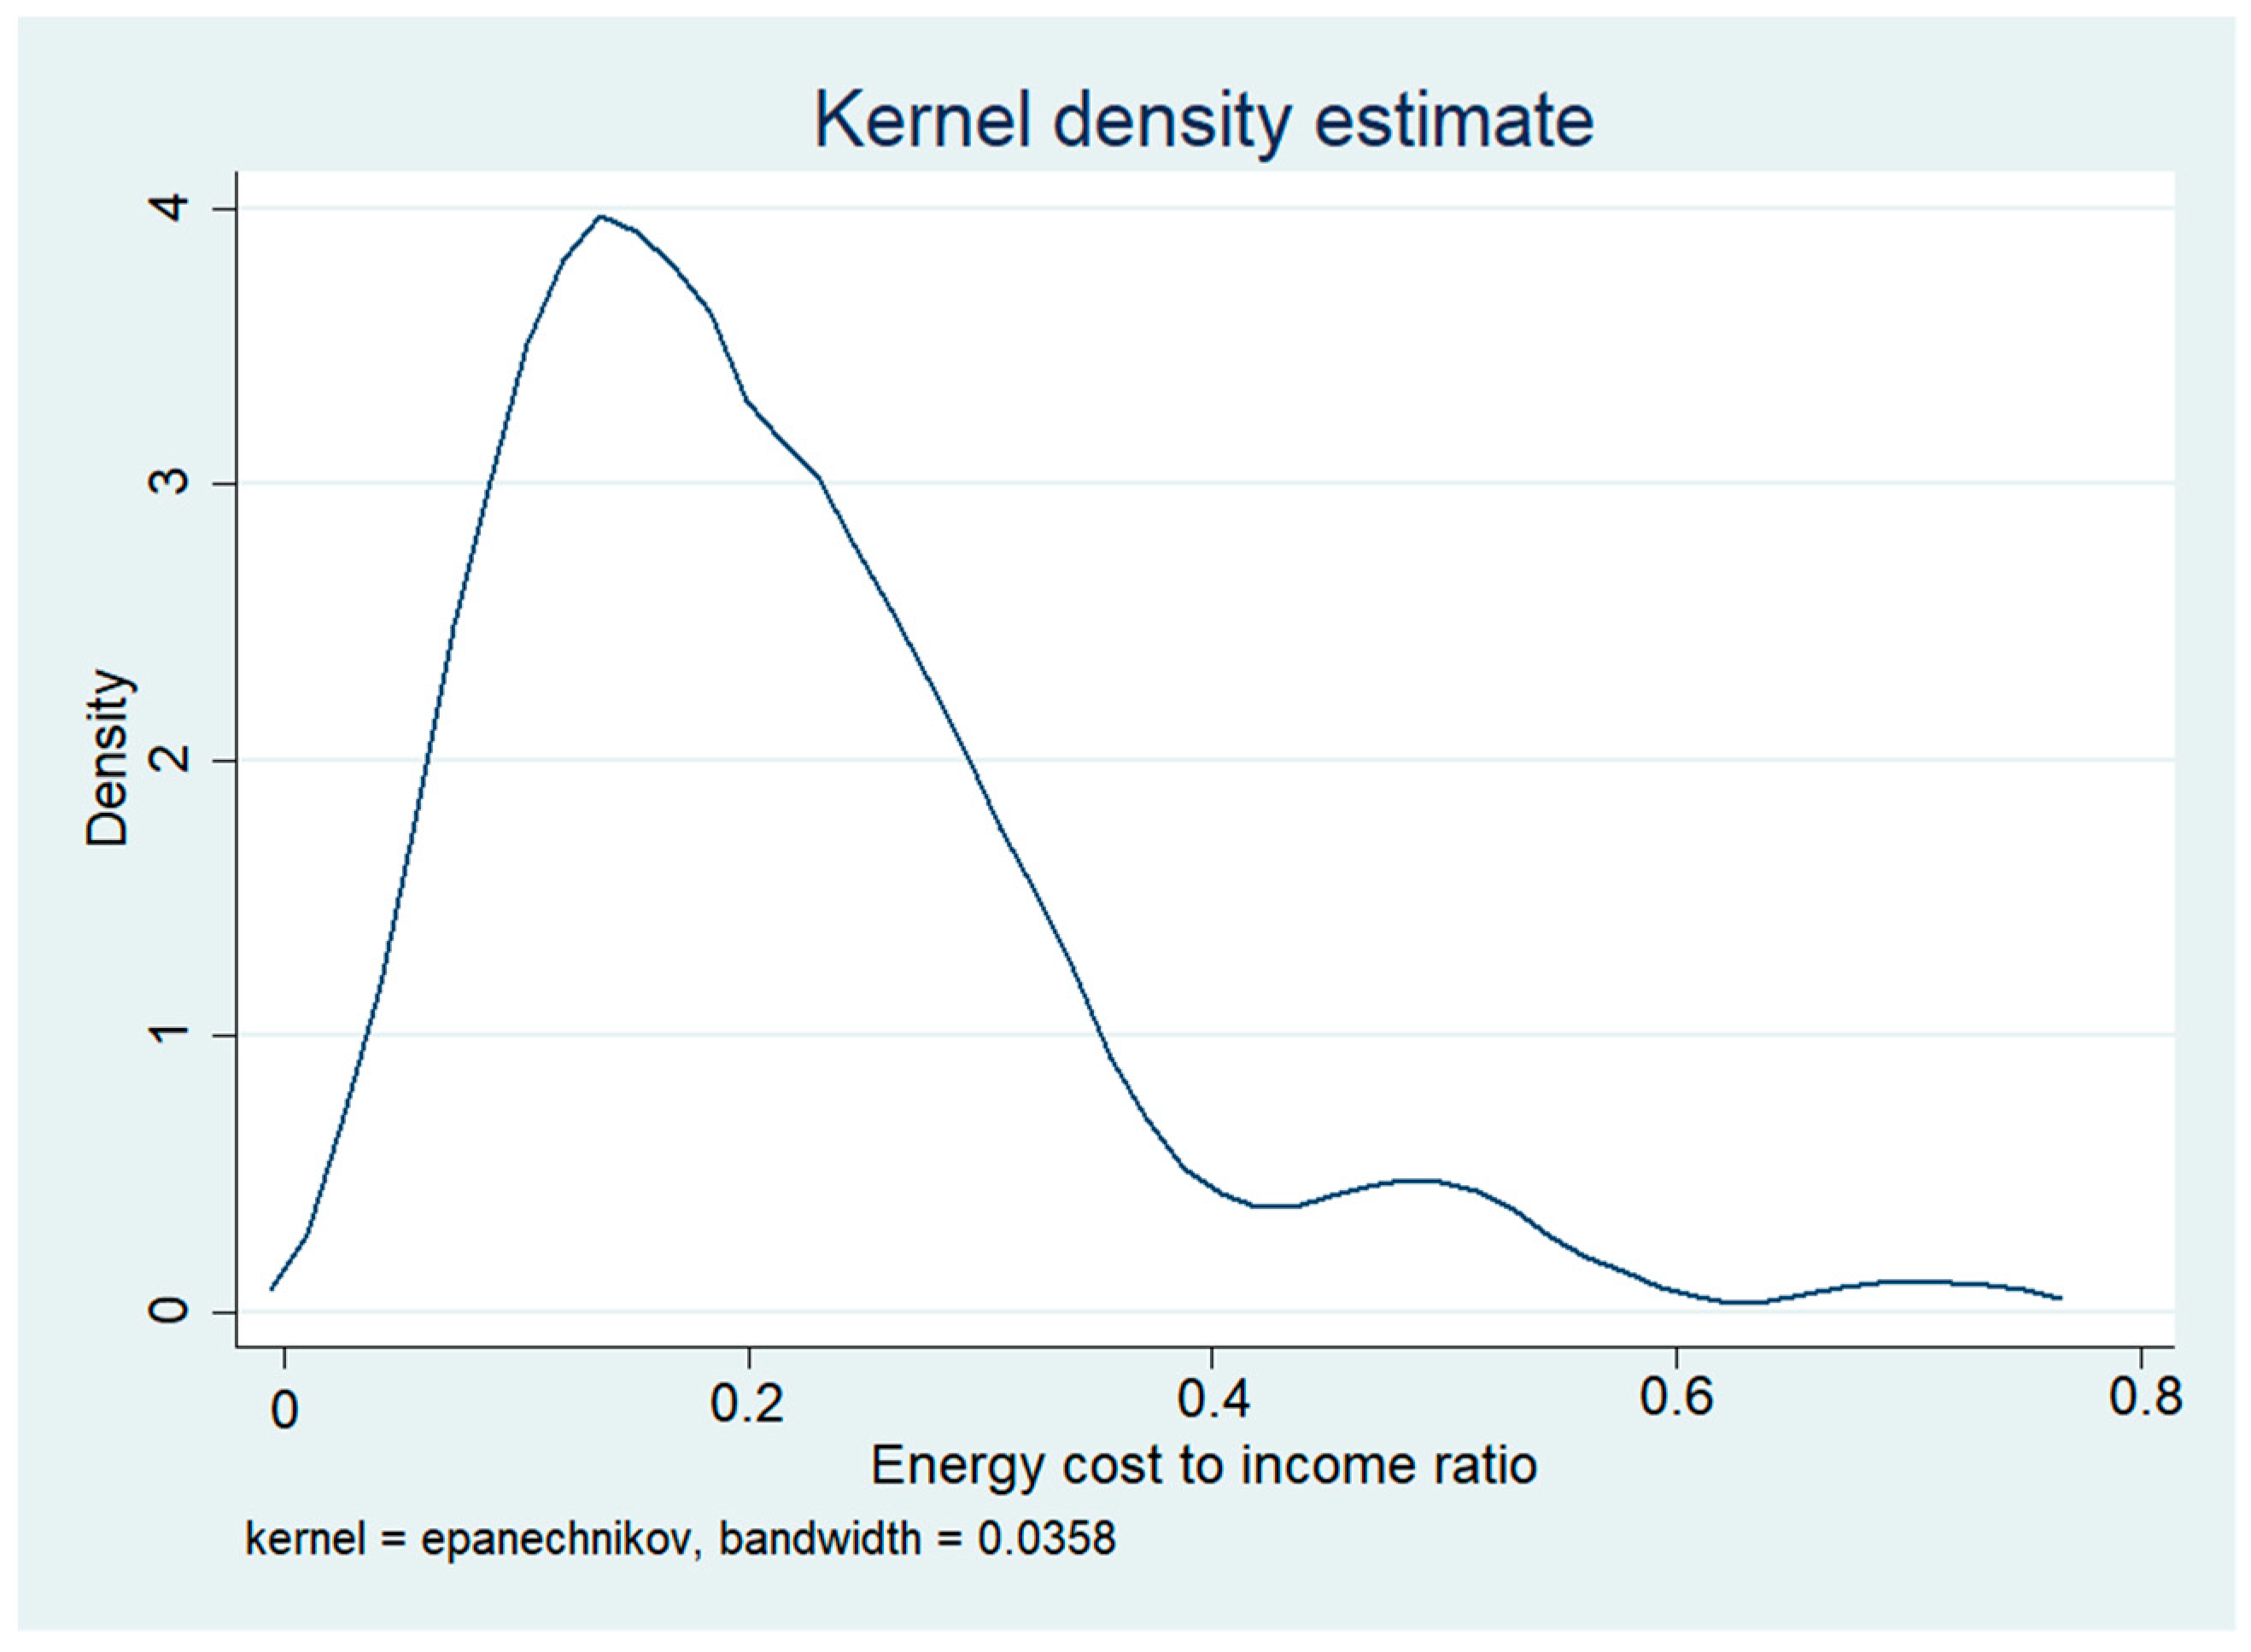
Figure 5.
Behavioral statement responses.
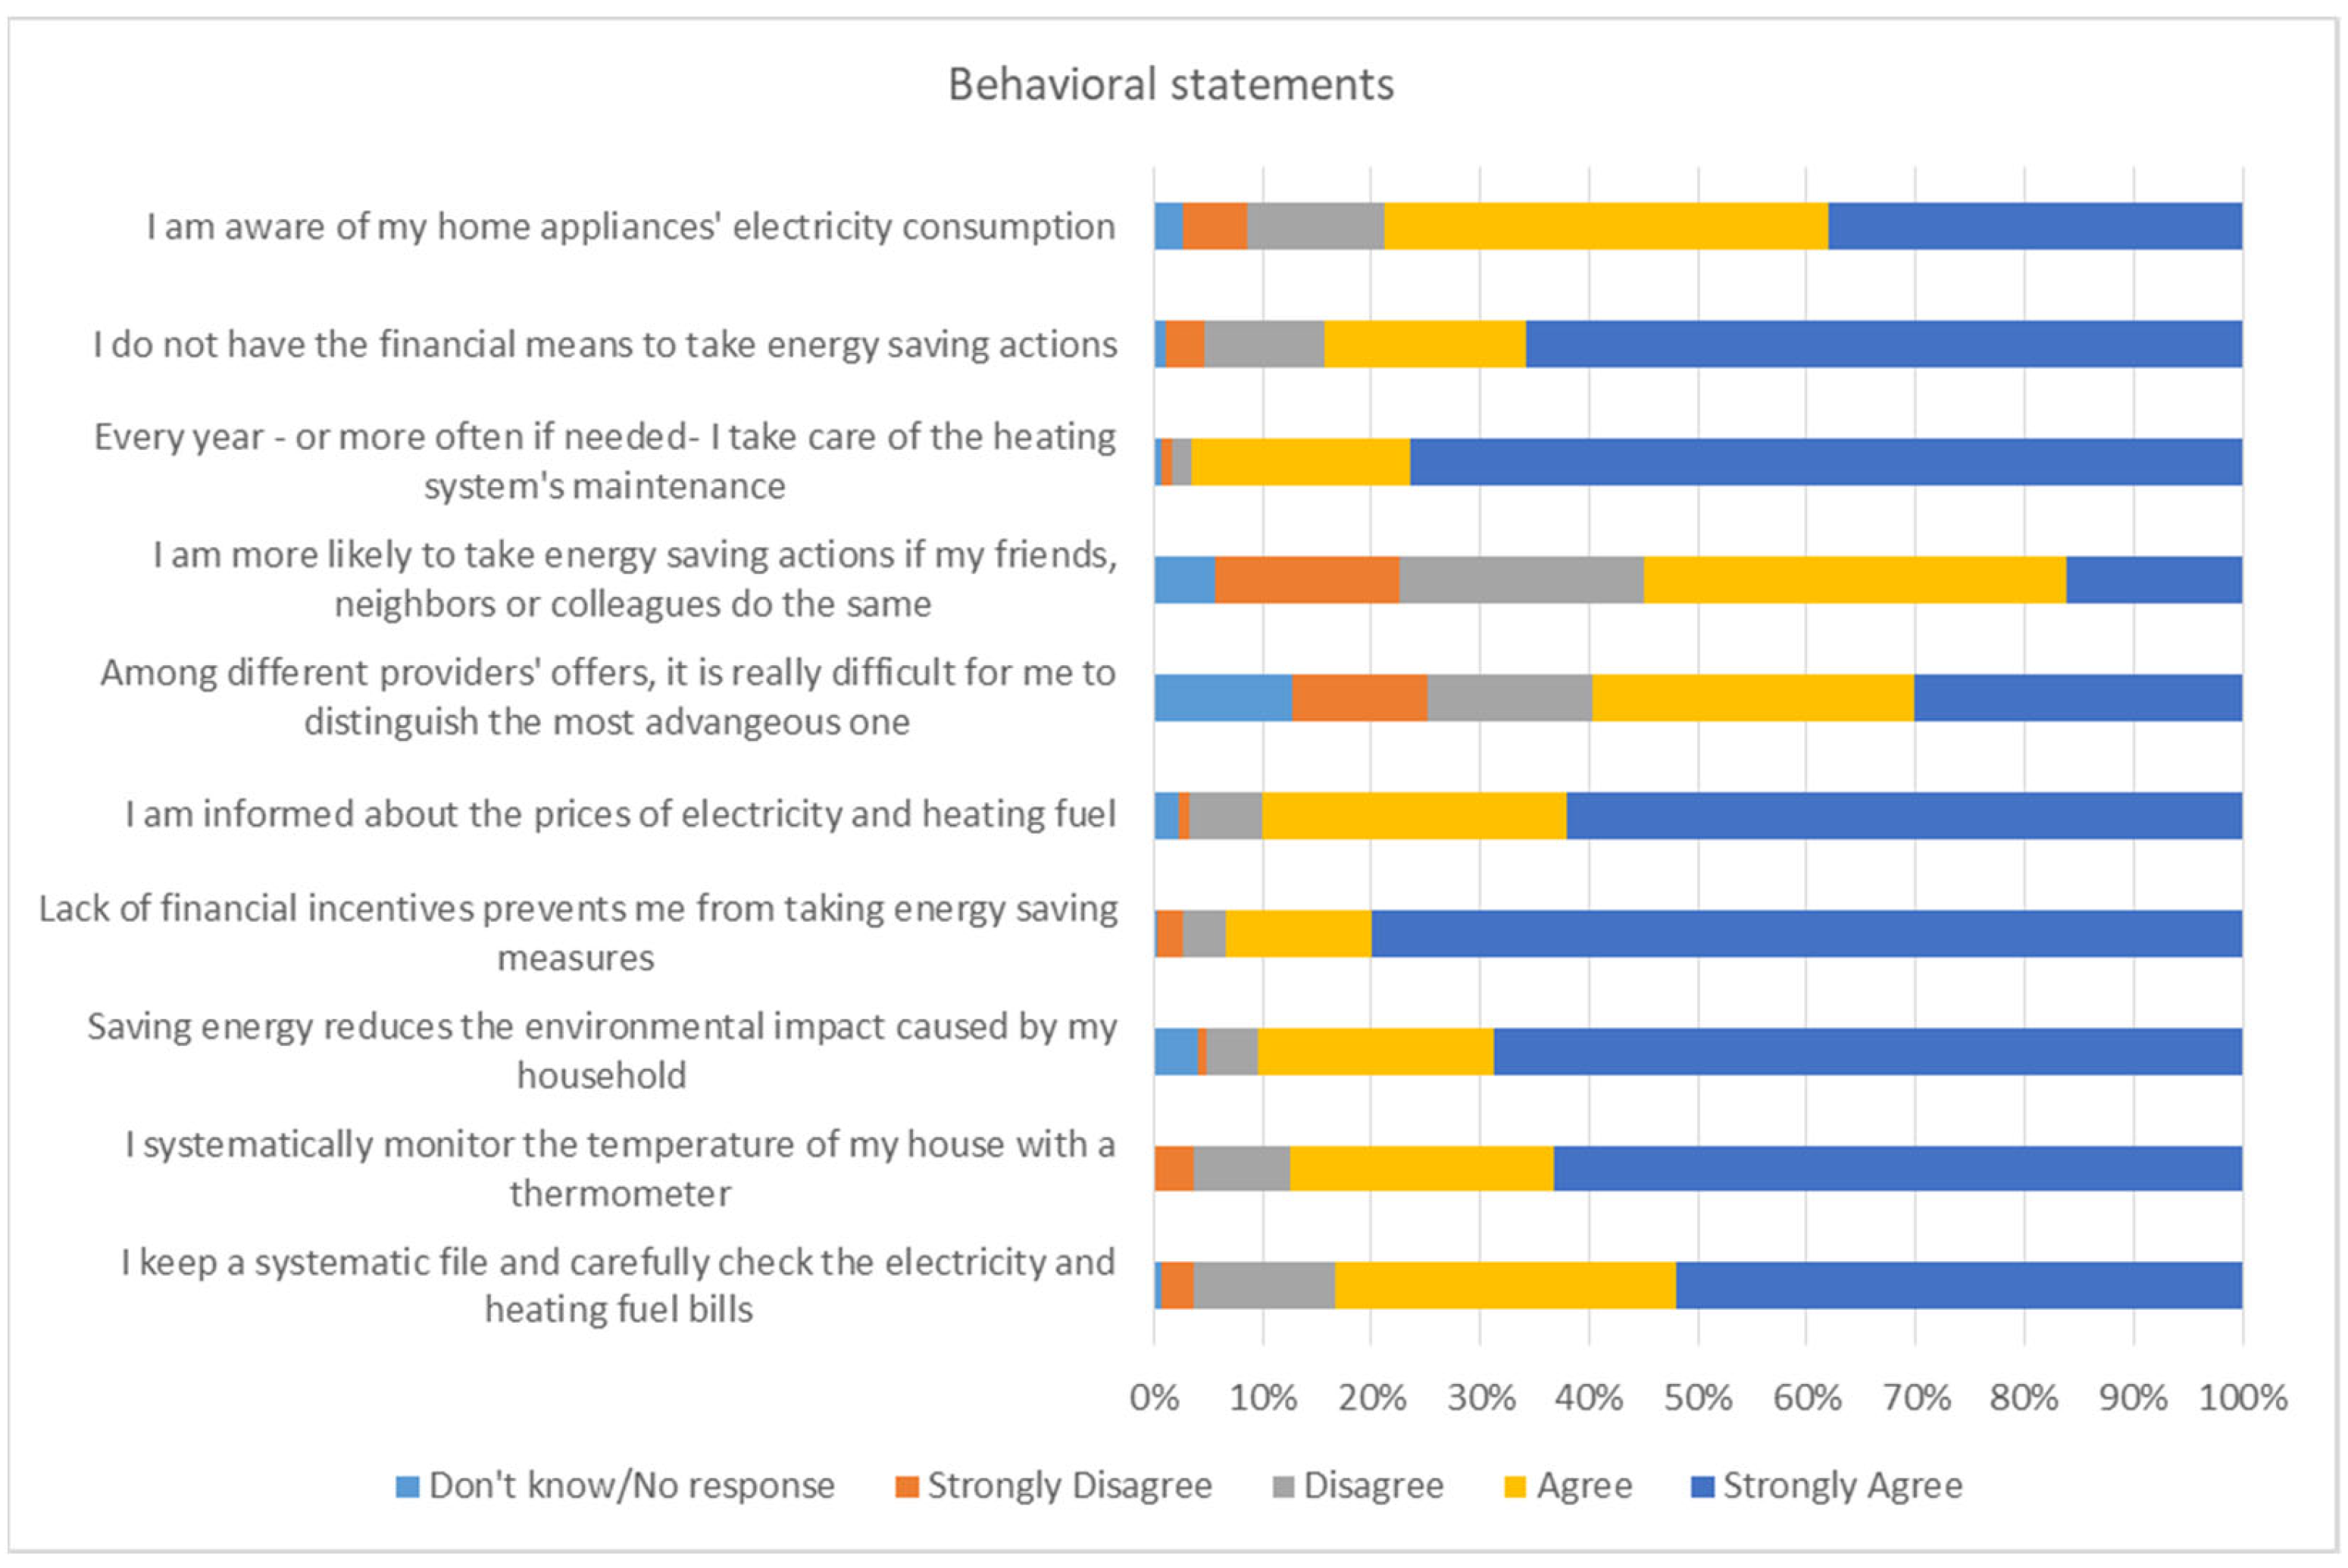
Figure 6.
Investigating present bias among respondents.
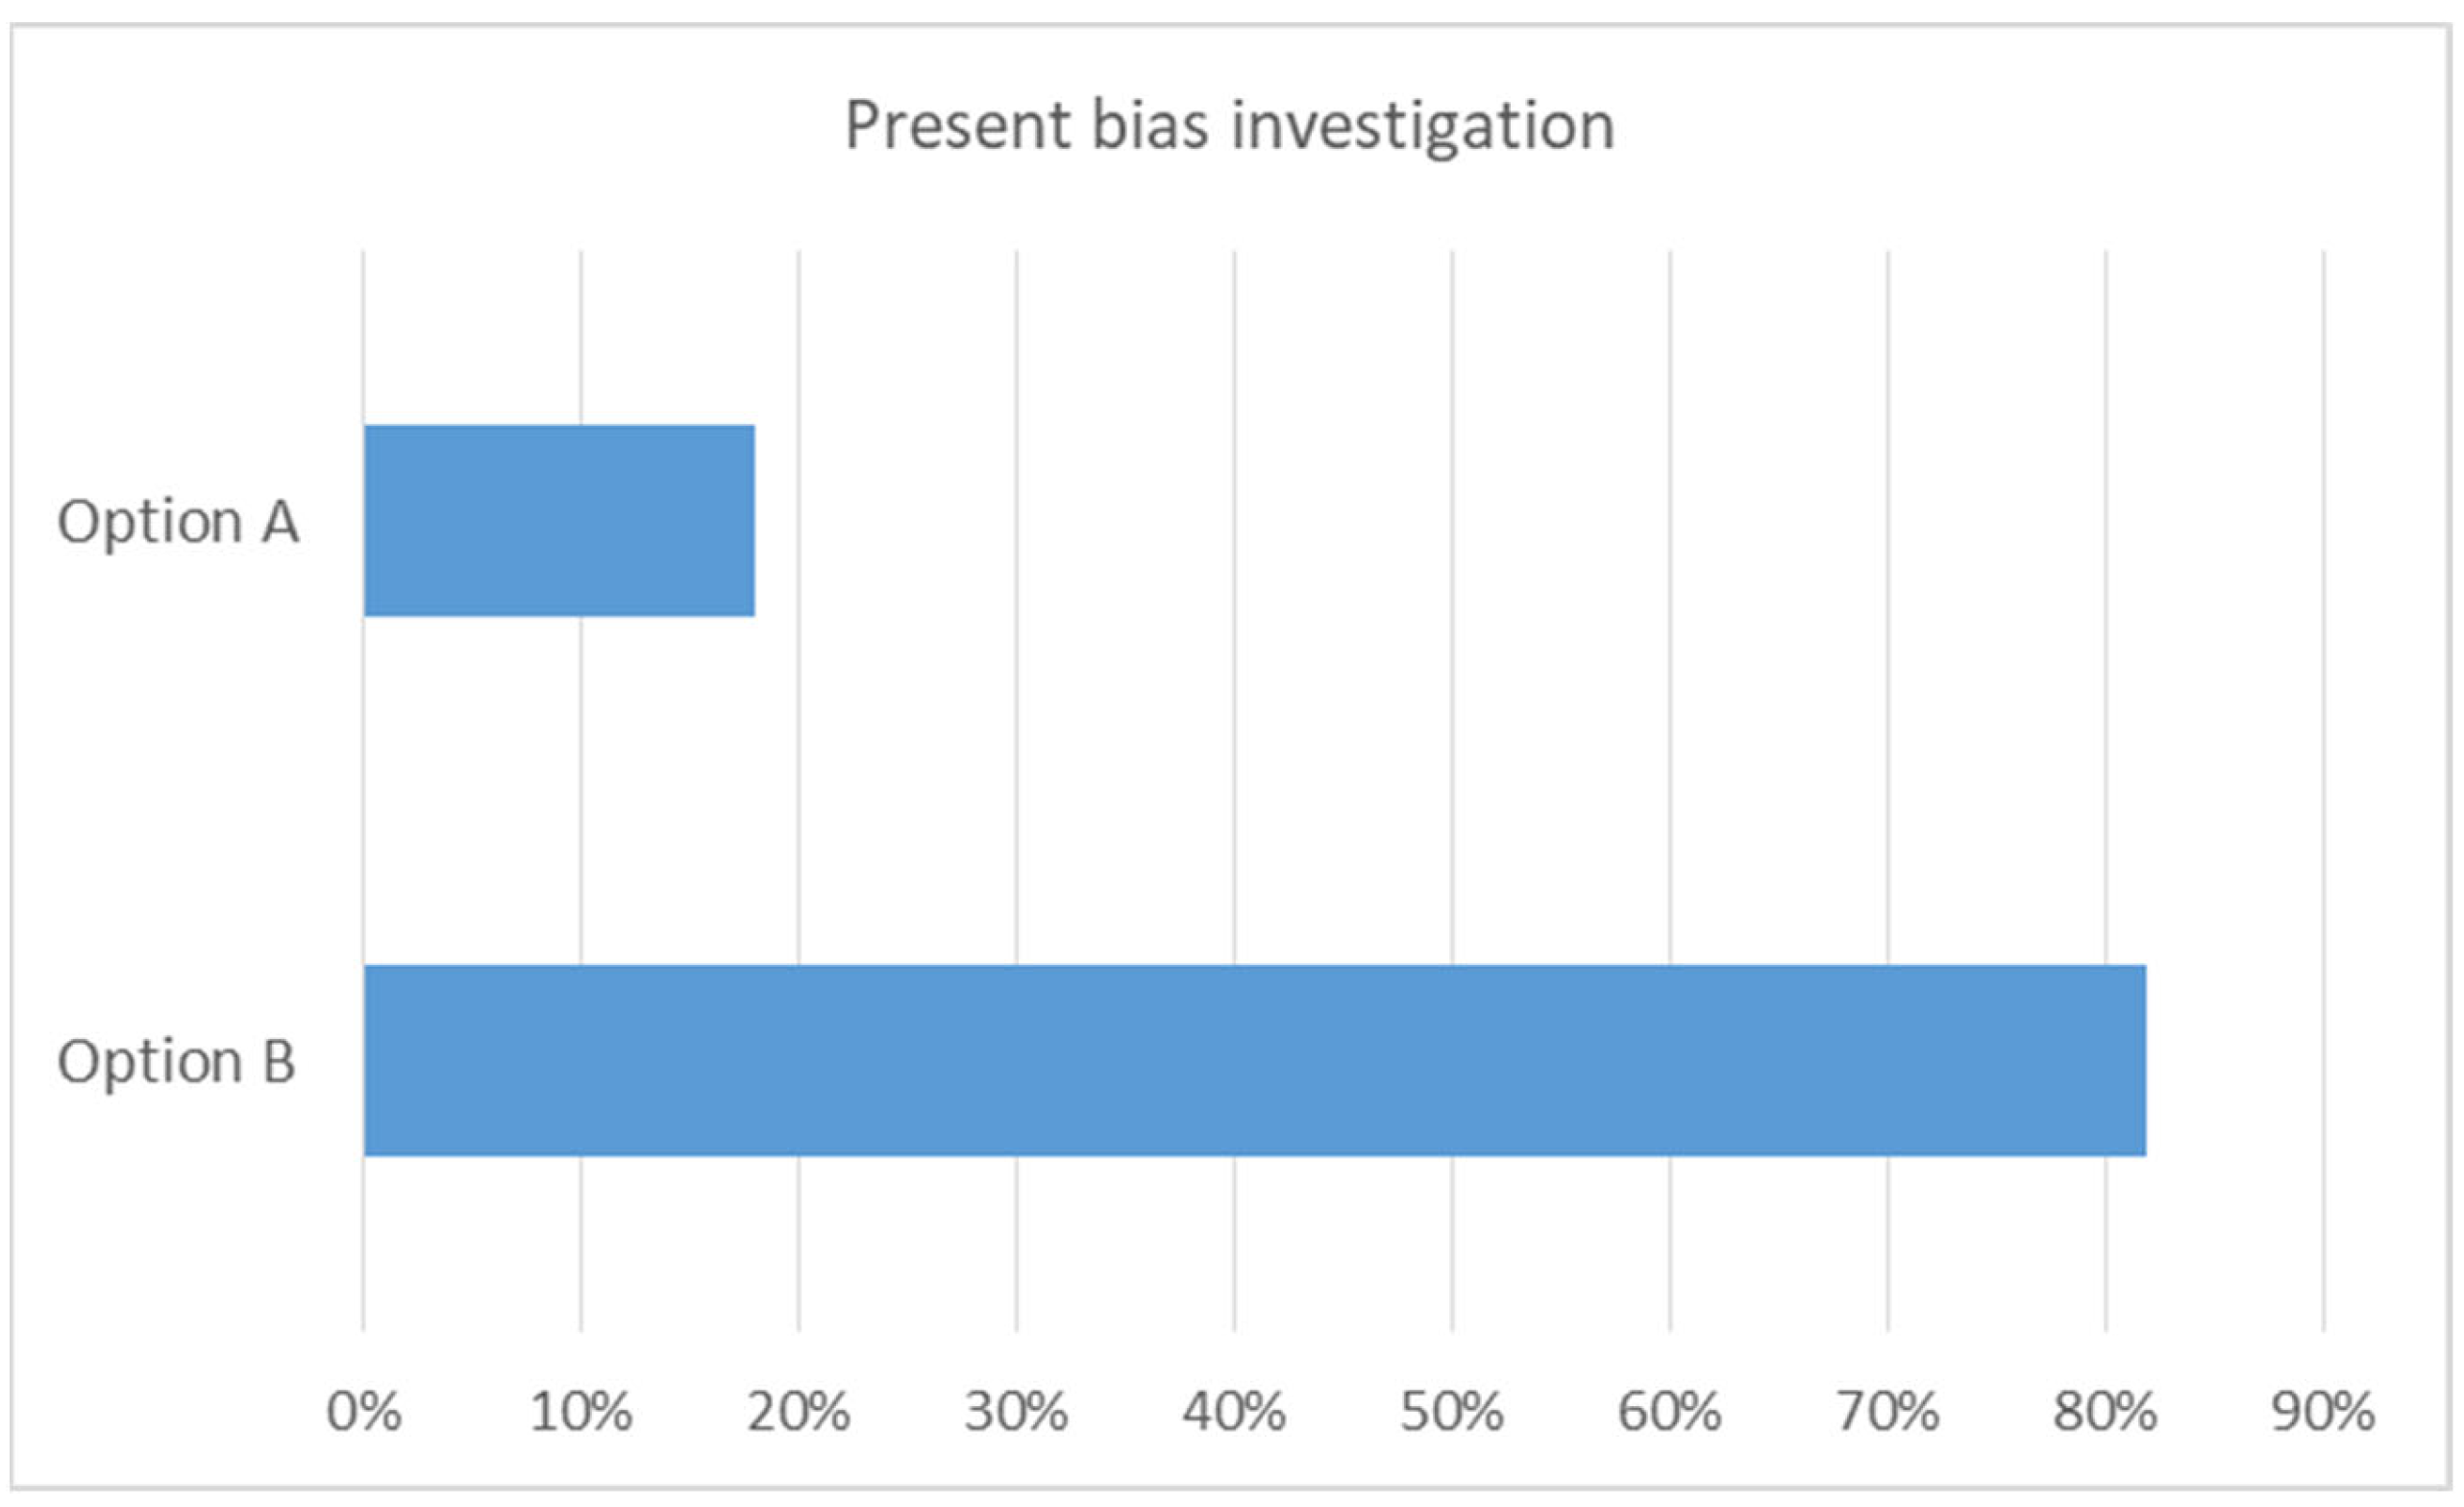
Figure 7.
Investigating energy-related financial literacy among respondents.

Figure 8.
Behavioral statements by energy-vulnerable and non-vulnerable households—“inability to keep house adequately warm” indicator.
Figure 8.
Behavioral statements by energy-vulnerable and non-vulnerable households—“inability to keep house adequately warm” indicator.

Figure 9.
Behavioral statements by energy-vulnerable and non-vulnerable households—“arrears in energy bills” indicator.
Figure 9.
Behavioral statements by energy-vulnerable and non-vulnerable households—“arrears in energy bills” indicator.
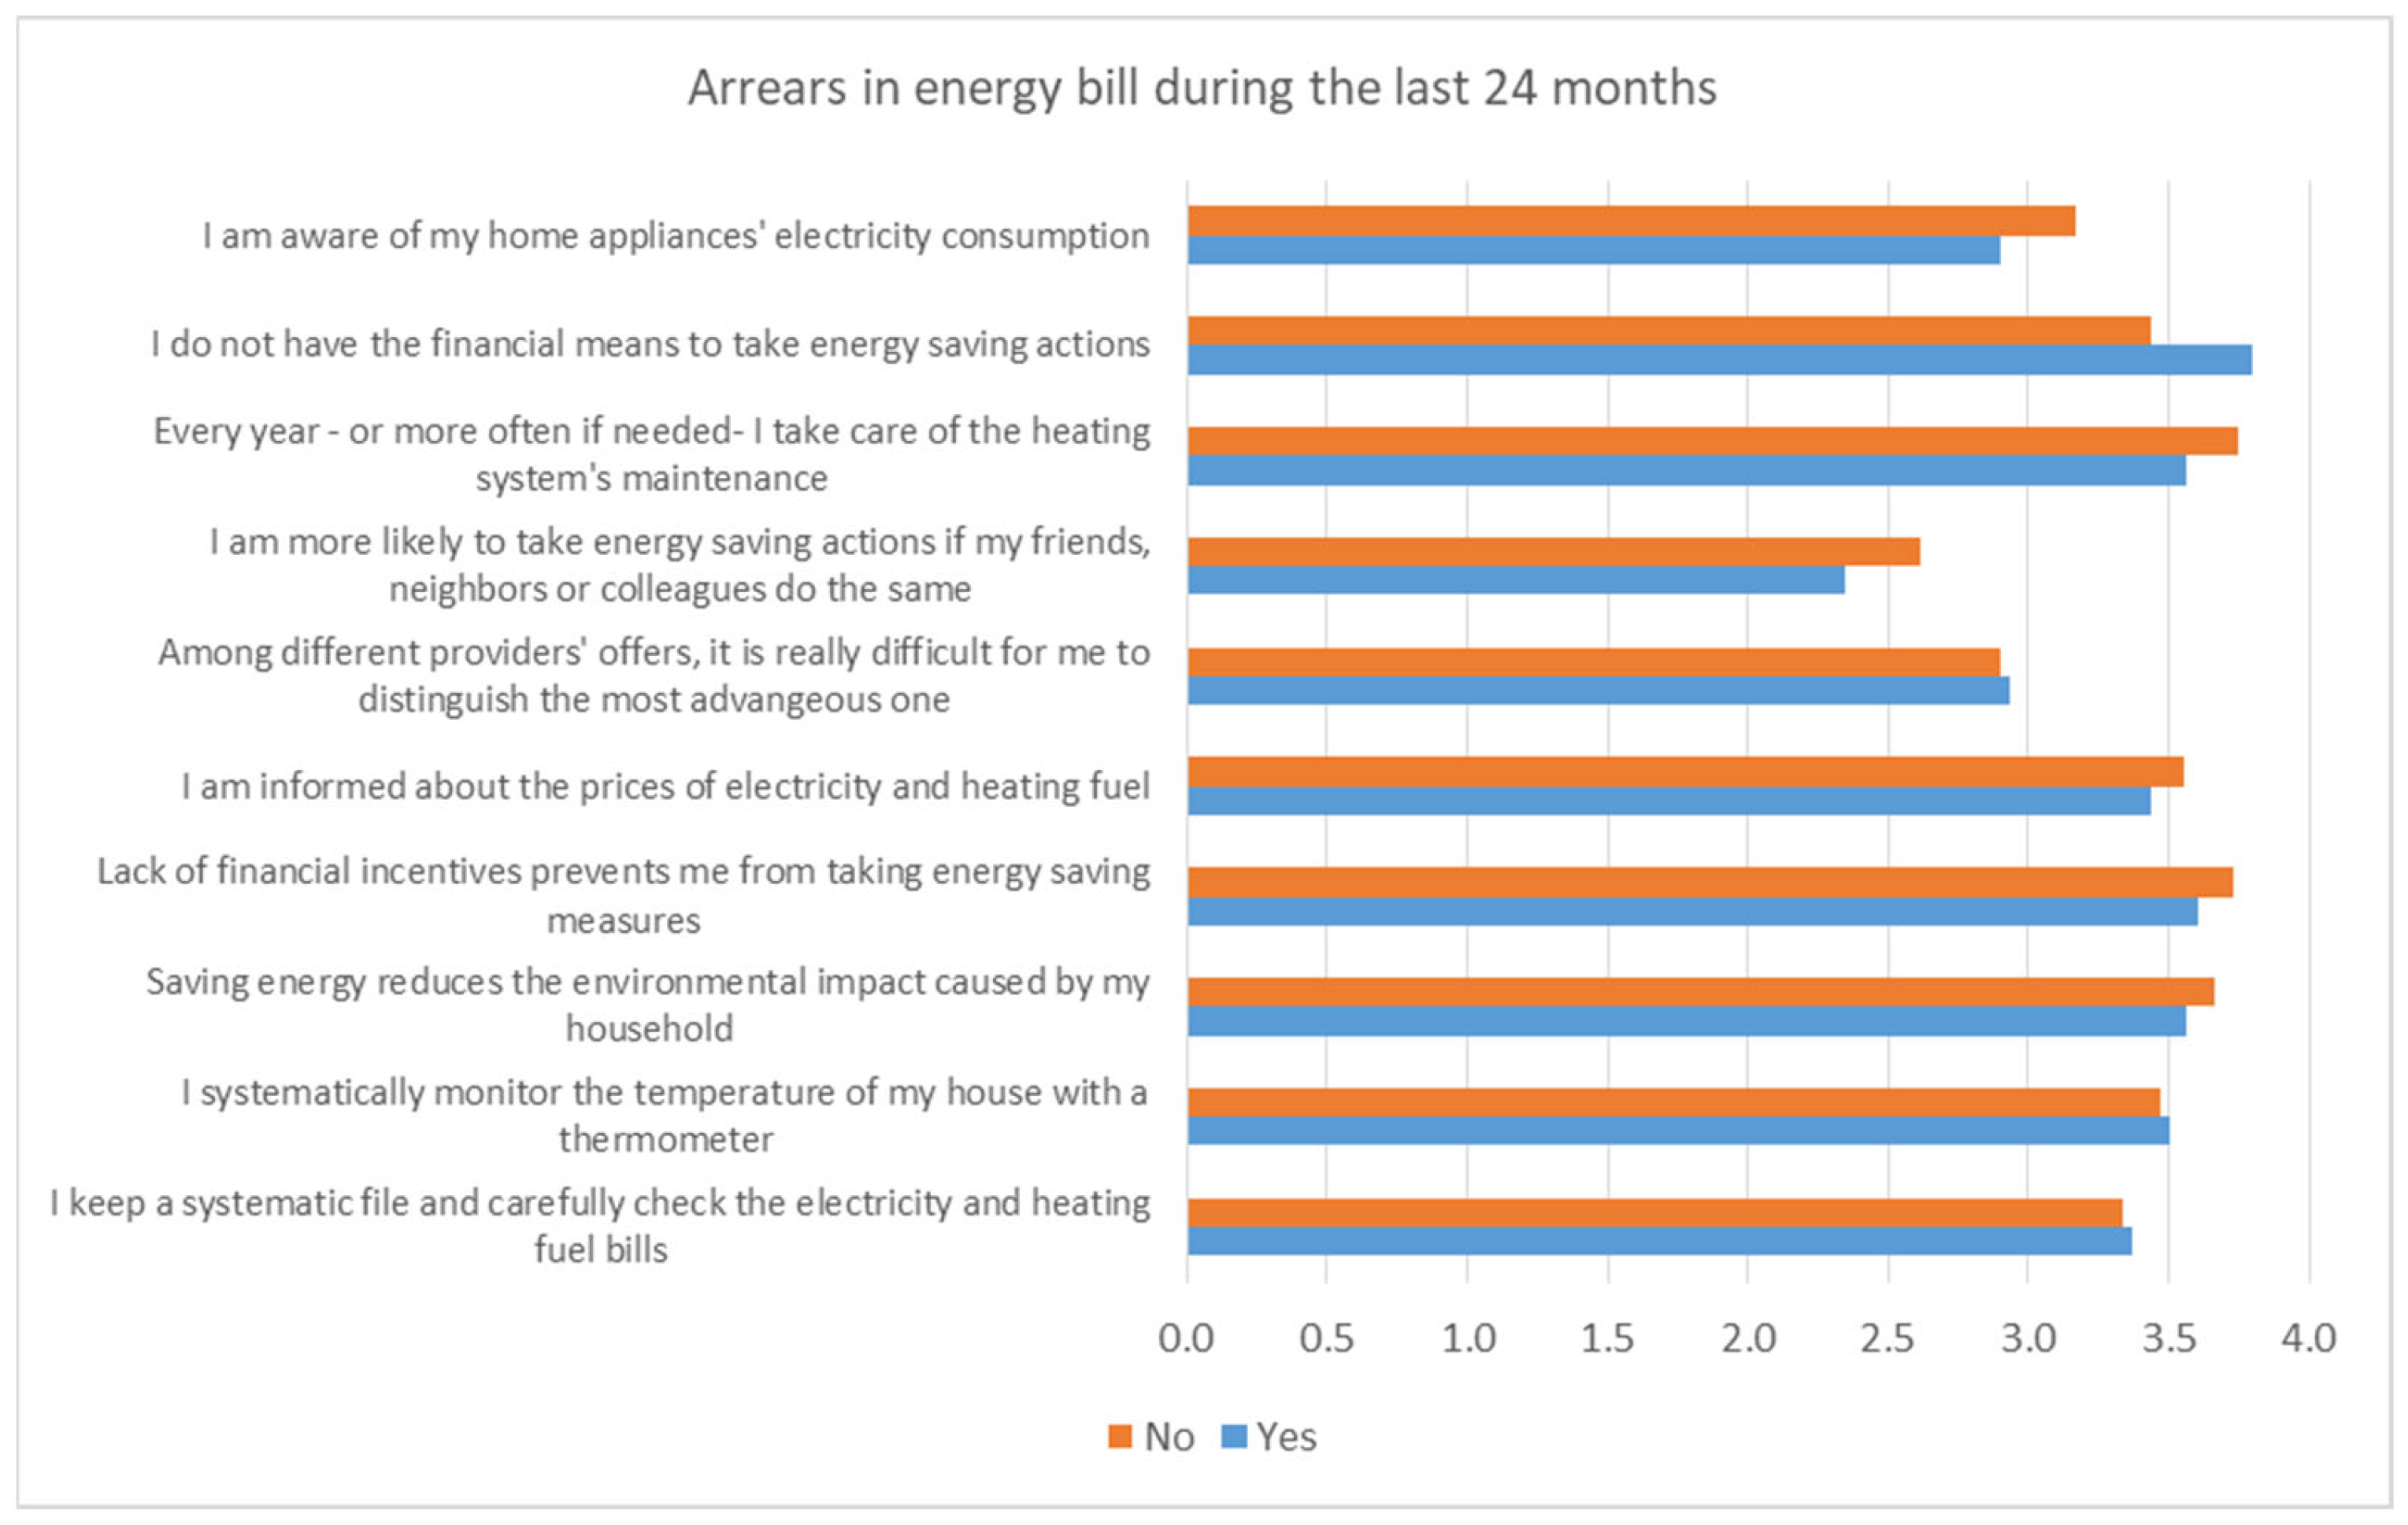
Figure 10.
Behavioral statements by energy-vulnerable and non-vulnerable households—“dwellings with leakages and damp/mold problems” indicator.
Figure 10.
Behavioral statements by energy-vulnerable and non-vulnerable households—“dwellings with leakages and damp/mold problems” indicator.

Figure 11.
Behavioral statements by energy-vulnerable and non-vulnerable households—“ten percent rule” indicator.
Figure 11.
Behavioral statements by energy-vulnerable and non-vulnerable households—“ten percent rule” indicator.
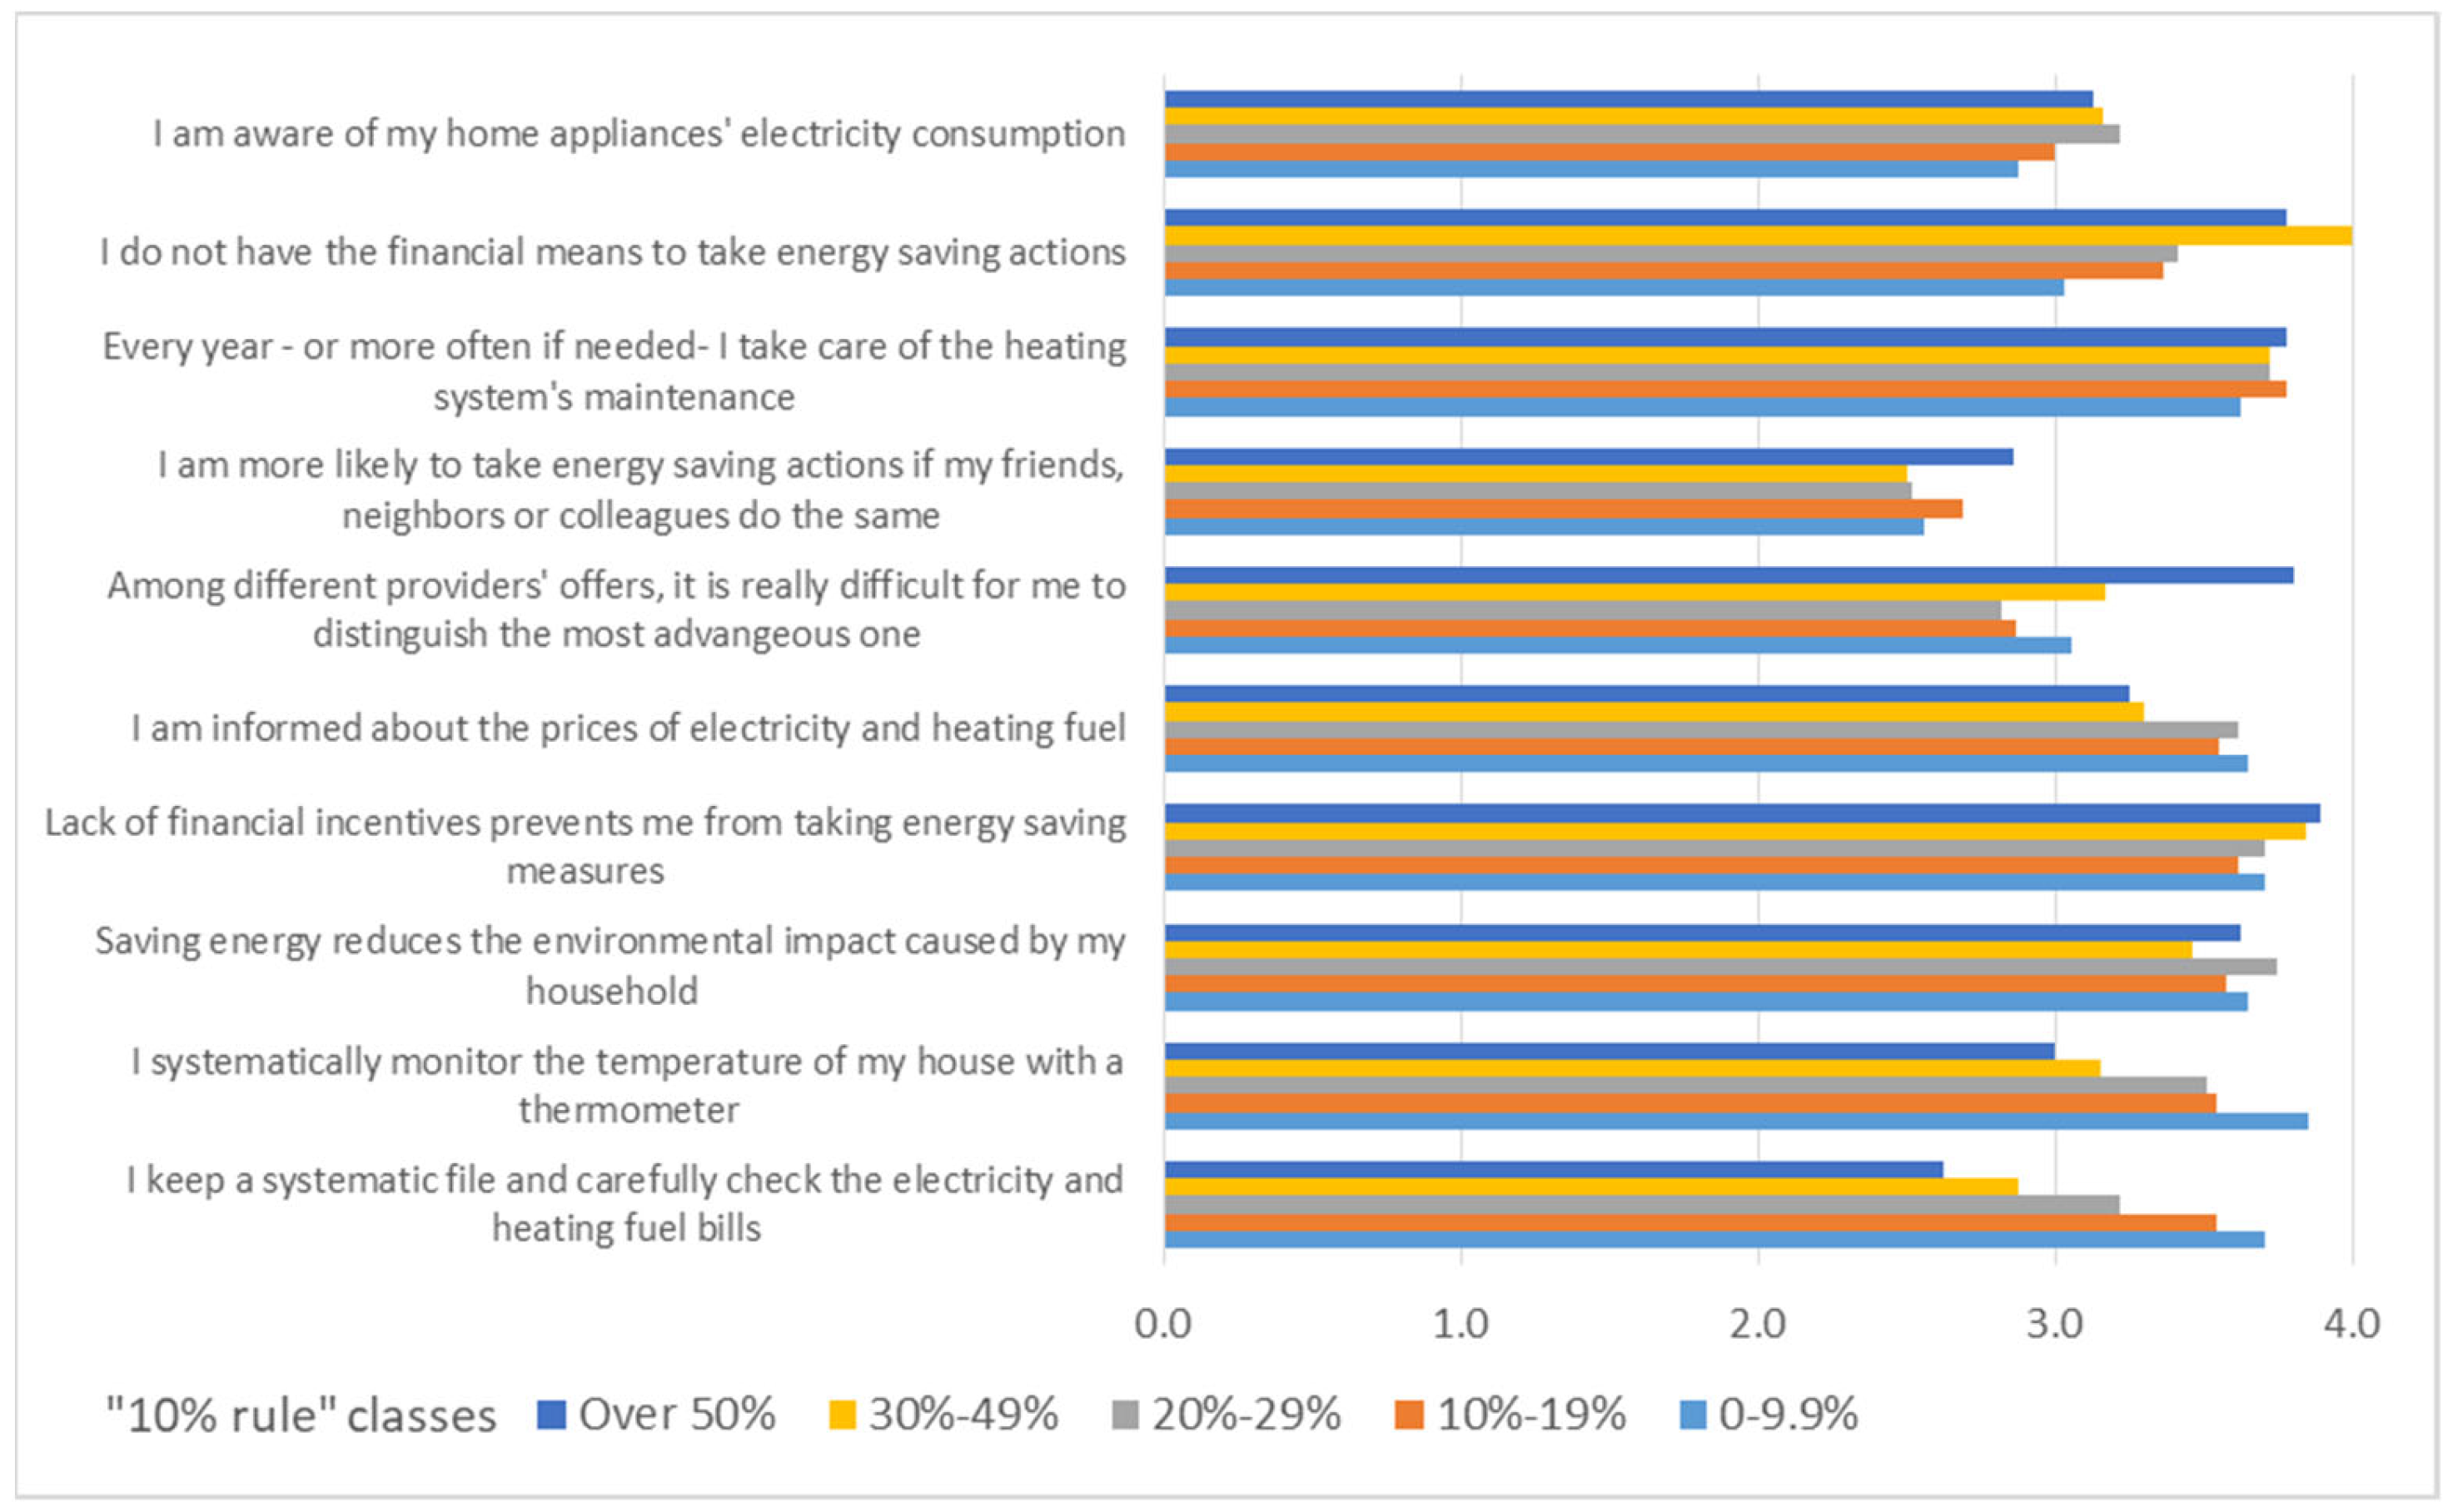
Figure 12.
Present bias investigation by energy-vulnerable and non-vulnerable households—subjective indicators.
Figure 12.
Present bias investigation by energy-vulnerable and non-vulnerable households—subjective indicators.
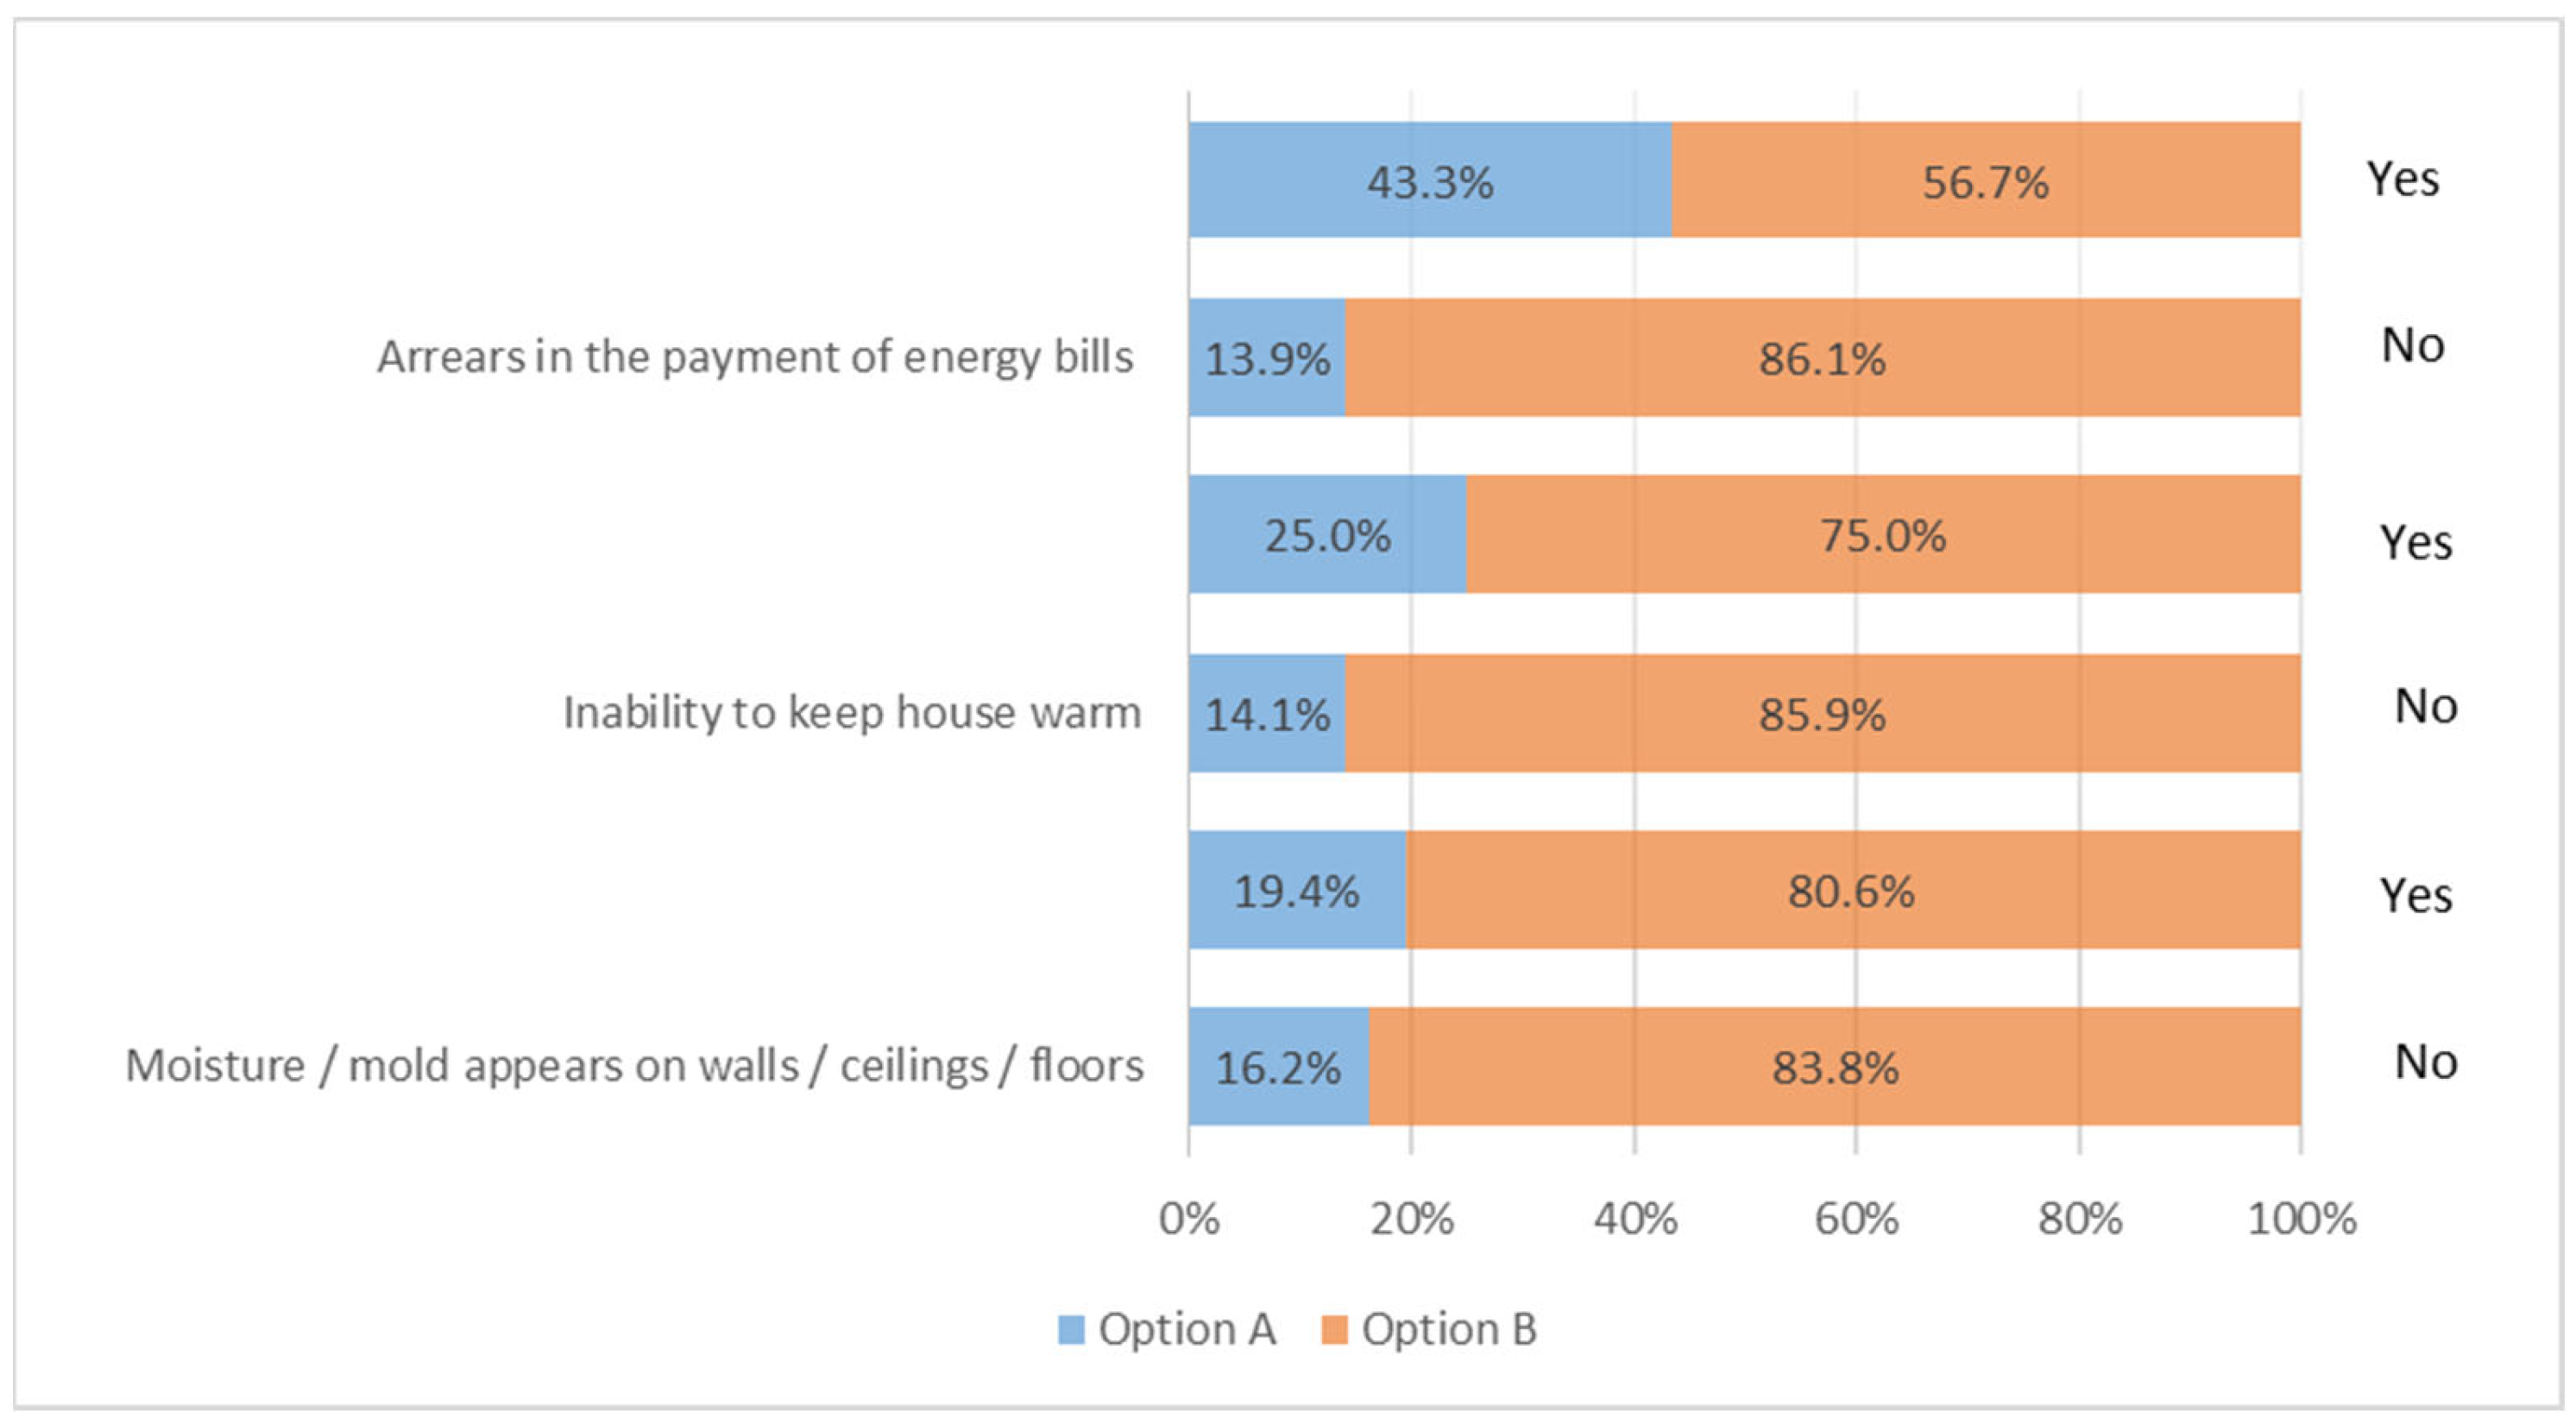
Figure 13.
Present bias investigation by energy-vulnerable and non-vulnerable households—“ten percent rule” indicator.
Figure 13.
Present bias investigation by energy-vulnerable and non-vulnerable households—“ten percent rule” indicator.

Figure 14.
Energy-related financial literacy investigation by energy-vulnerable and non-vulnerable households—subjective indicators.
Figure 14.
Energy-related financial literacy investigation by energy-vulnerable and non-vulnerable households—subjective indicators.

Figure 15.
Energy-related financial literacy investigation by energy-vulnerable and non-vulnerable households—“ten percent rule” indicator.
Figure 15.
Energy-related financial literacy investigation by energy-vulnerable and non-vulnerable households—“ten percent rule” indicator.

Publisher’s Note: MDPI stays neutral with regard to jurisdictional claims in published maps and institutional affiliations. |
© 2021 by the authors. Licensee MDPI, Basel, Switzerland. This article is an open access article distributed under the terms and conditions of the Creative Commons Attribution (CC BY) license (https://creativecommons.org/licenses/by/4.0/).
Share and Cite
MDPI and ACS Style
Kaliampakou, C.; Papada, L.; Damigos, D. Are Energy-Vulnerable Households More Prone to Informative, Market, and Behavioral Biases? Societies 2021, 11, 126. https://0-doi-org.brum.beds.ac.uk/10.3390/soc11040126
AMA Style
Kaliampakou C, Papada L, Damigos D. Are Energy-Vulnerable Households More Prone to Informative, Market, and Behavioral Biases? Societies. 2021; 11(4):126. https://0-doi-org.brum.beds.ac.uk/10.3390/soc11040126
Chicago/Turabian StyleKaliampakou, Christina, Lefkothea Papada, and Dimitris Damigos. 2021. "Are Energy-Vulnerable Households More Prone to Informative, Market, and Behavioral Biases?" Societies 11, no. 4: 126. https://0-doi-org.brum.beds.ac.uk/10.3390/soc11040126
Note that from the first issue of 2016, this journal uses article numbers instead of page numbers. See further details here.