
Family Structure through the Adolescent Eyes: A Comparative Study of Current Status and Time Trends over Three Decades of HBSC Study

 ,
,  and
and
Abstract
:1. Introduction
2. Materials and Methods
2.1. Study Population
2.2. Ethics
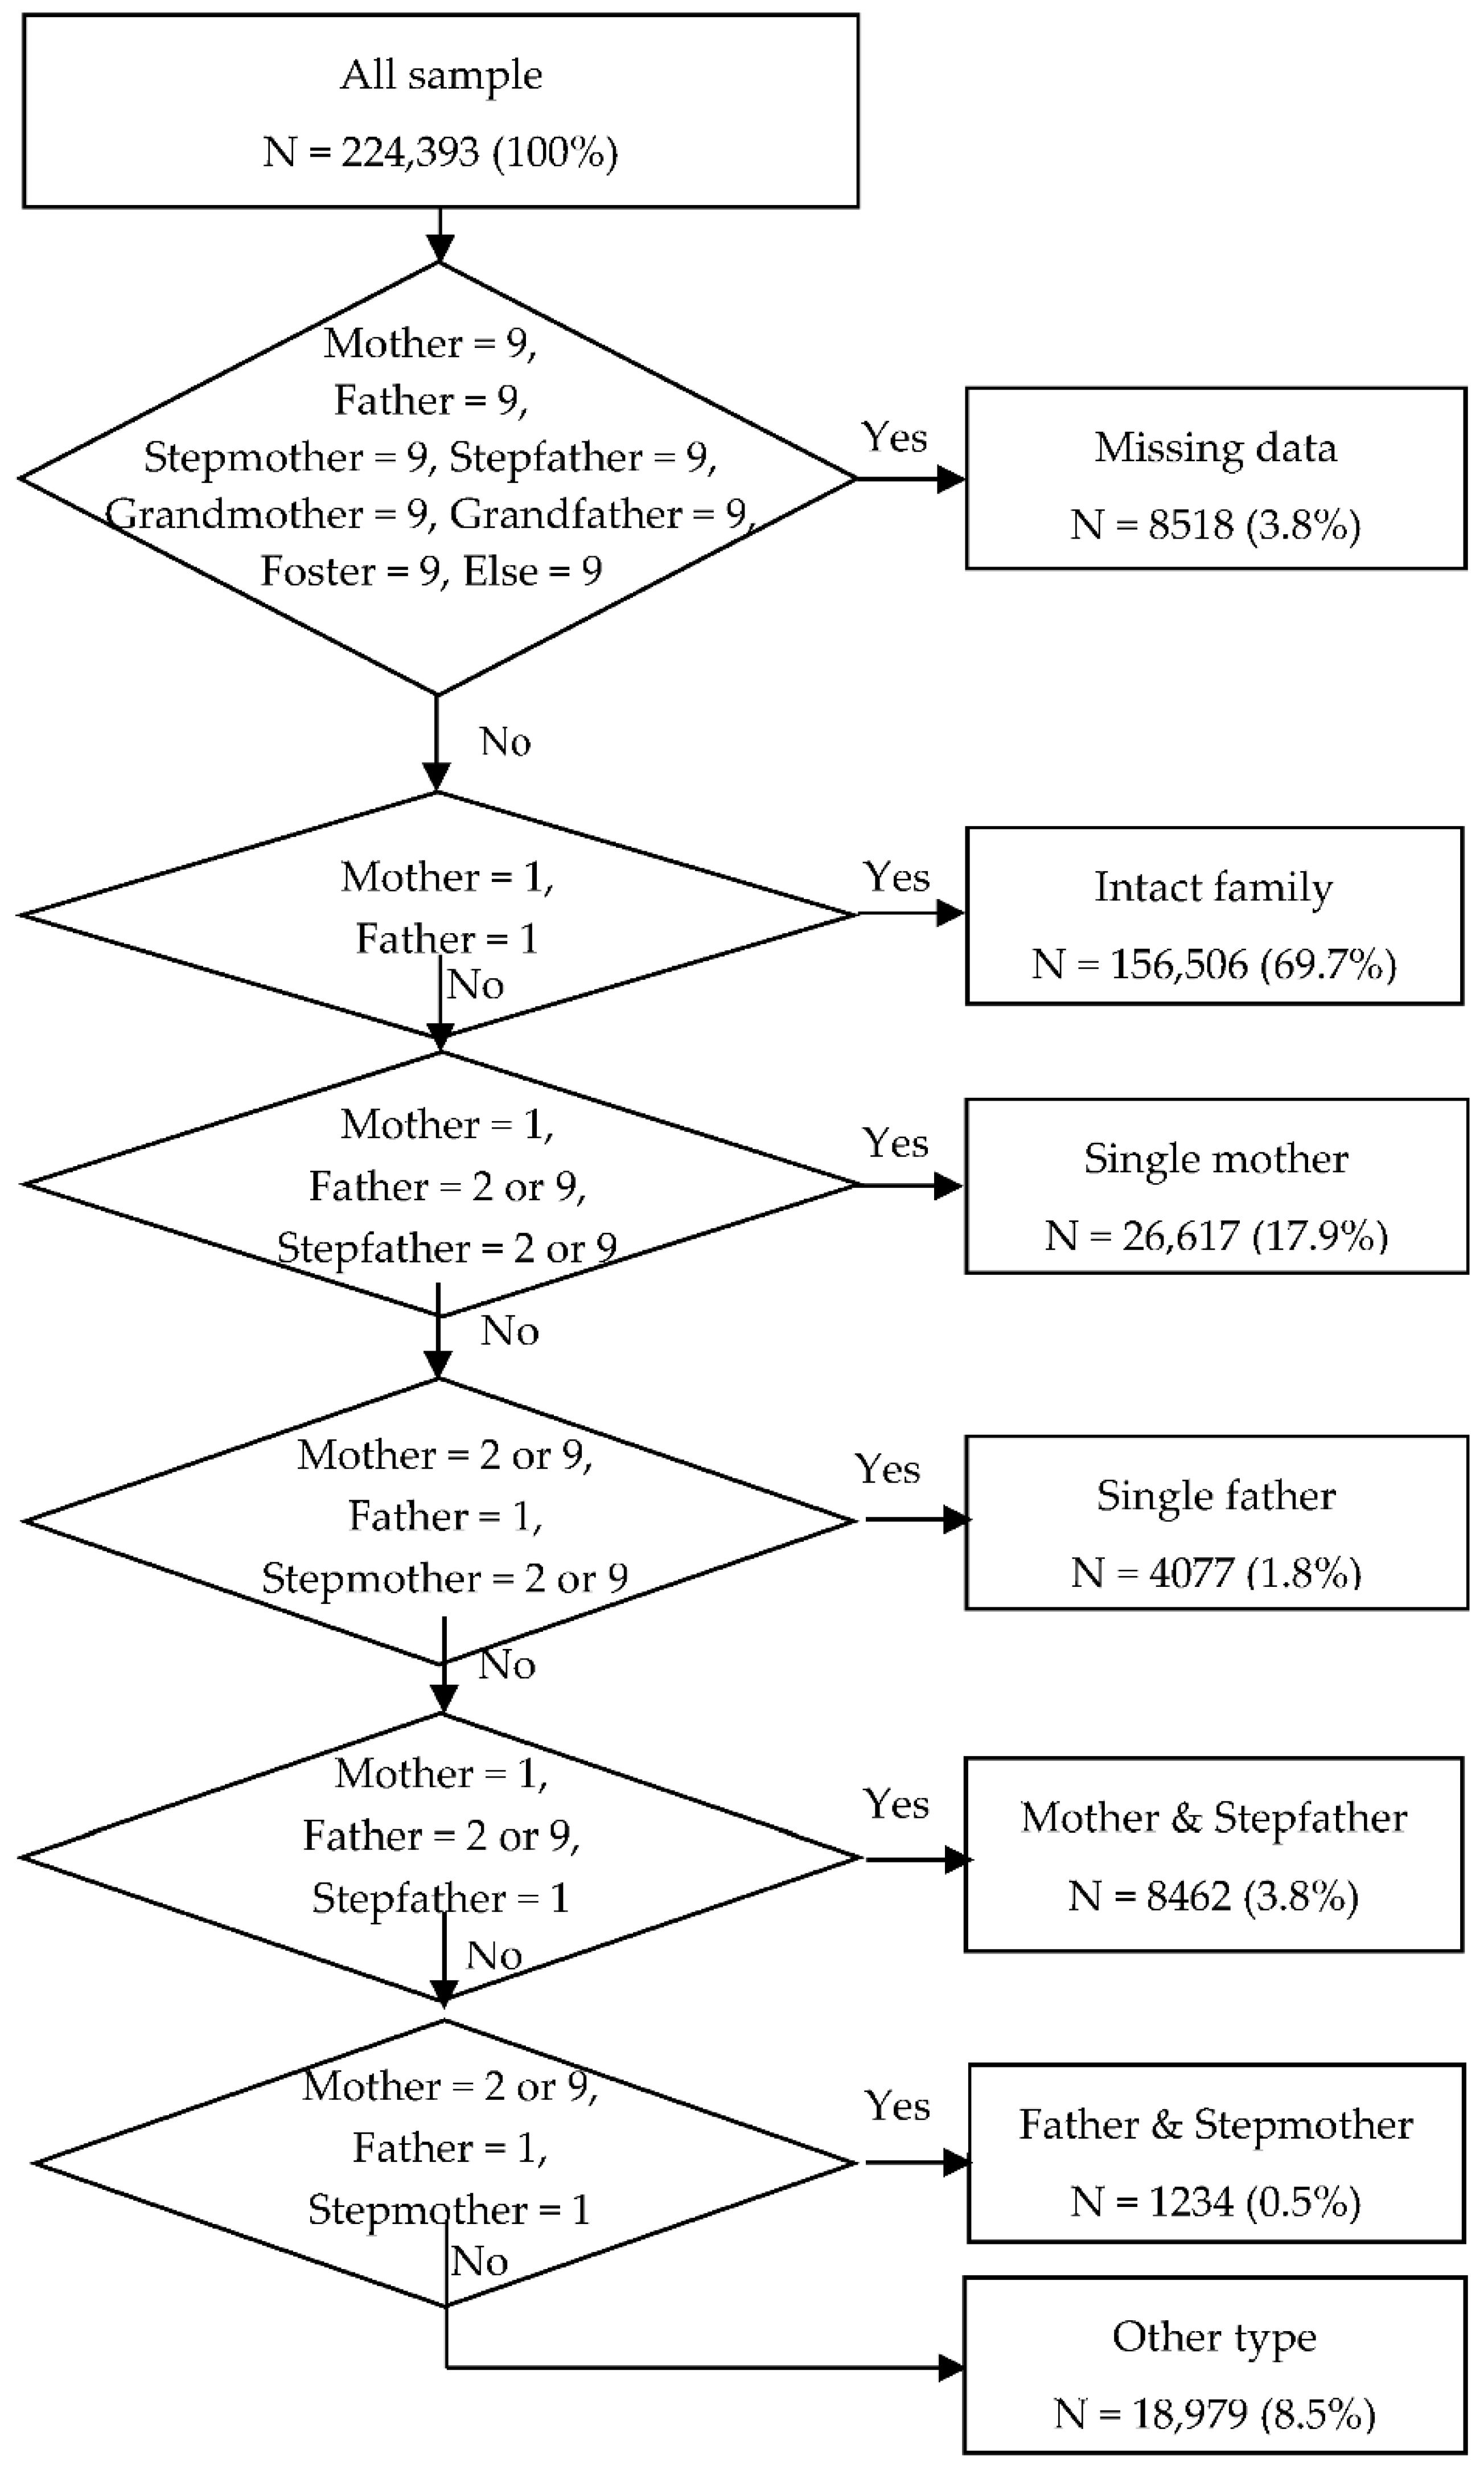
2.3. Measurements
2.4. Statistical Analysis
3. Results
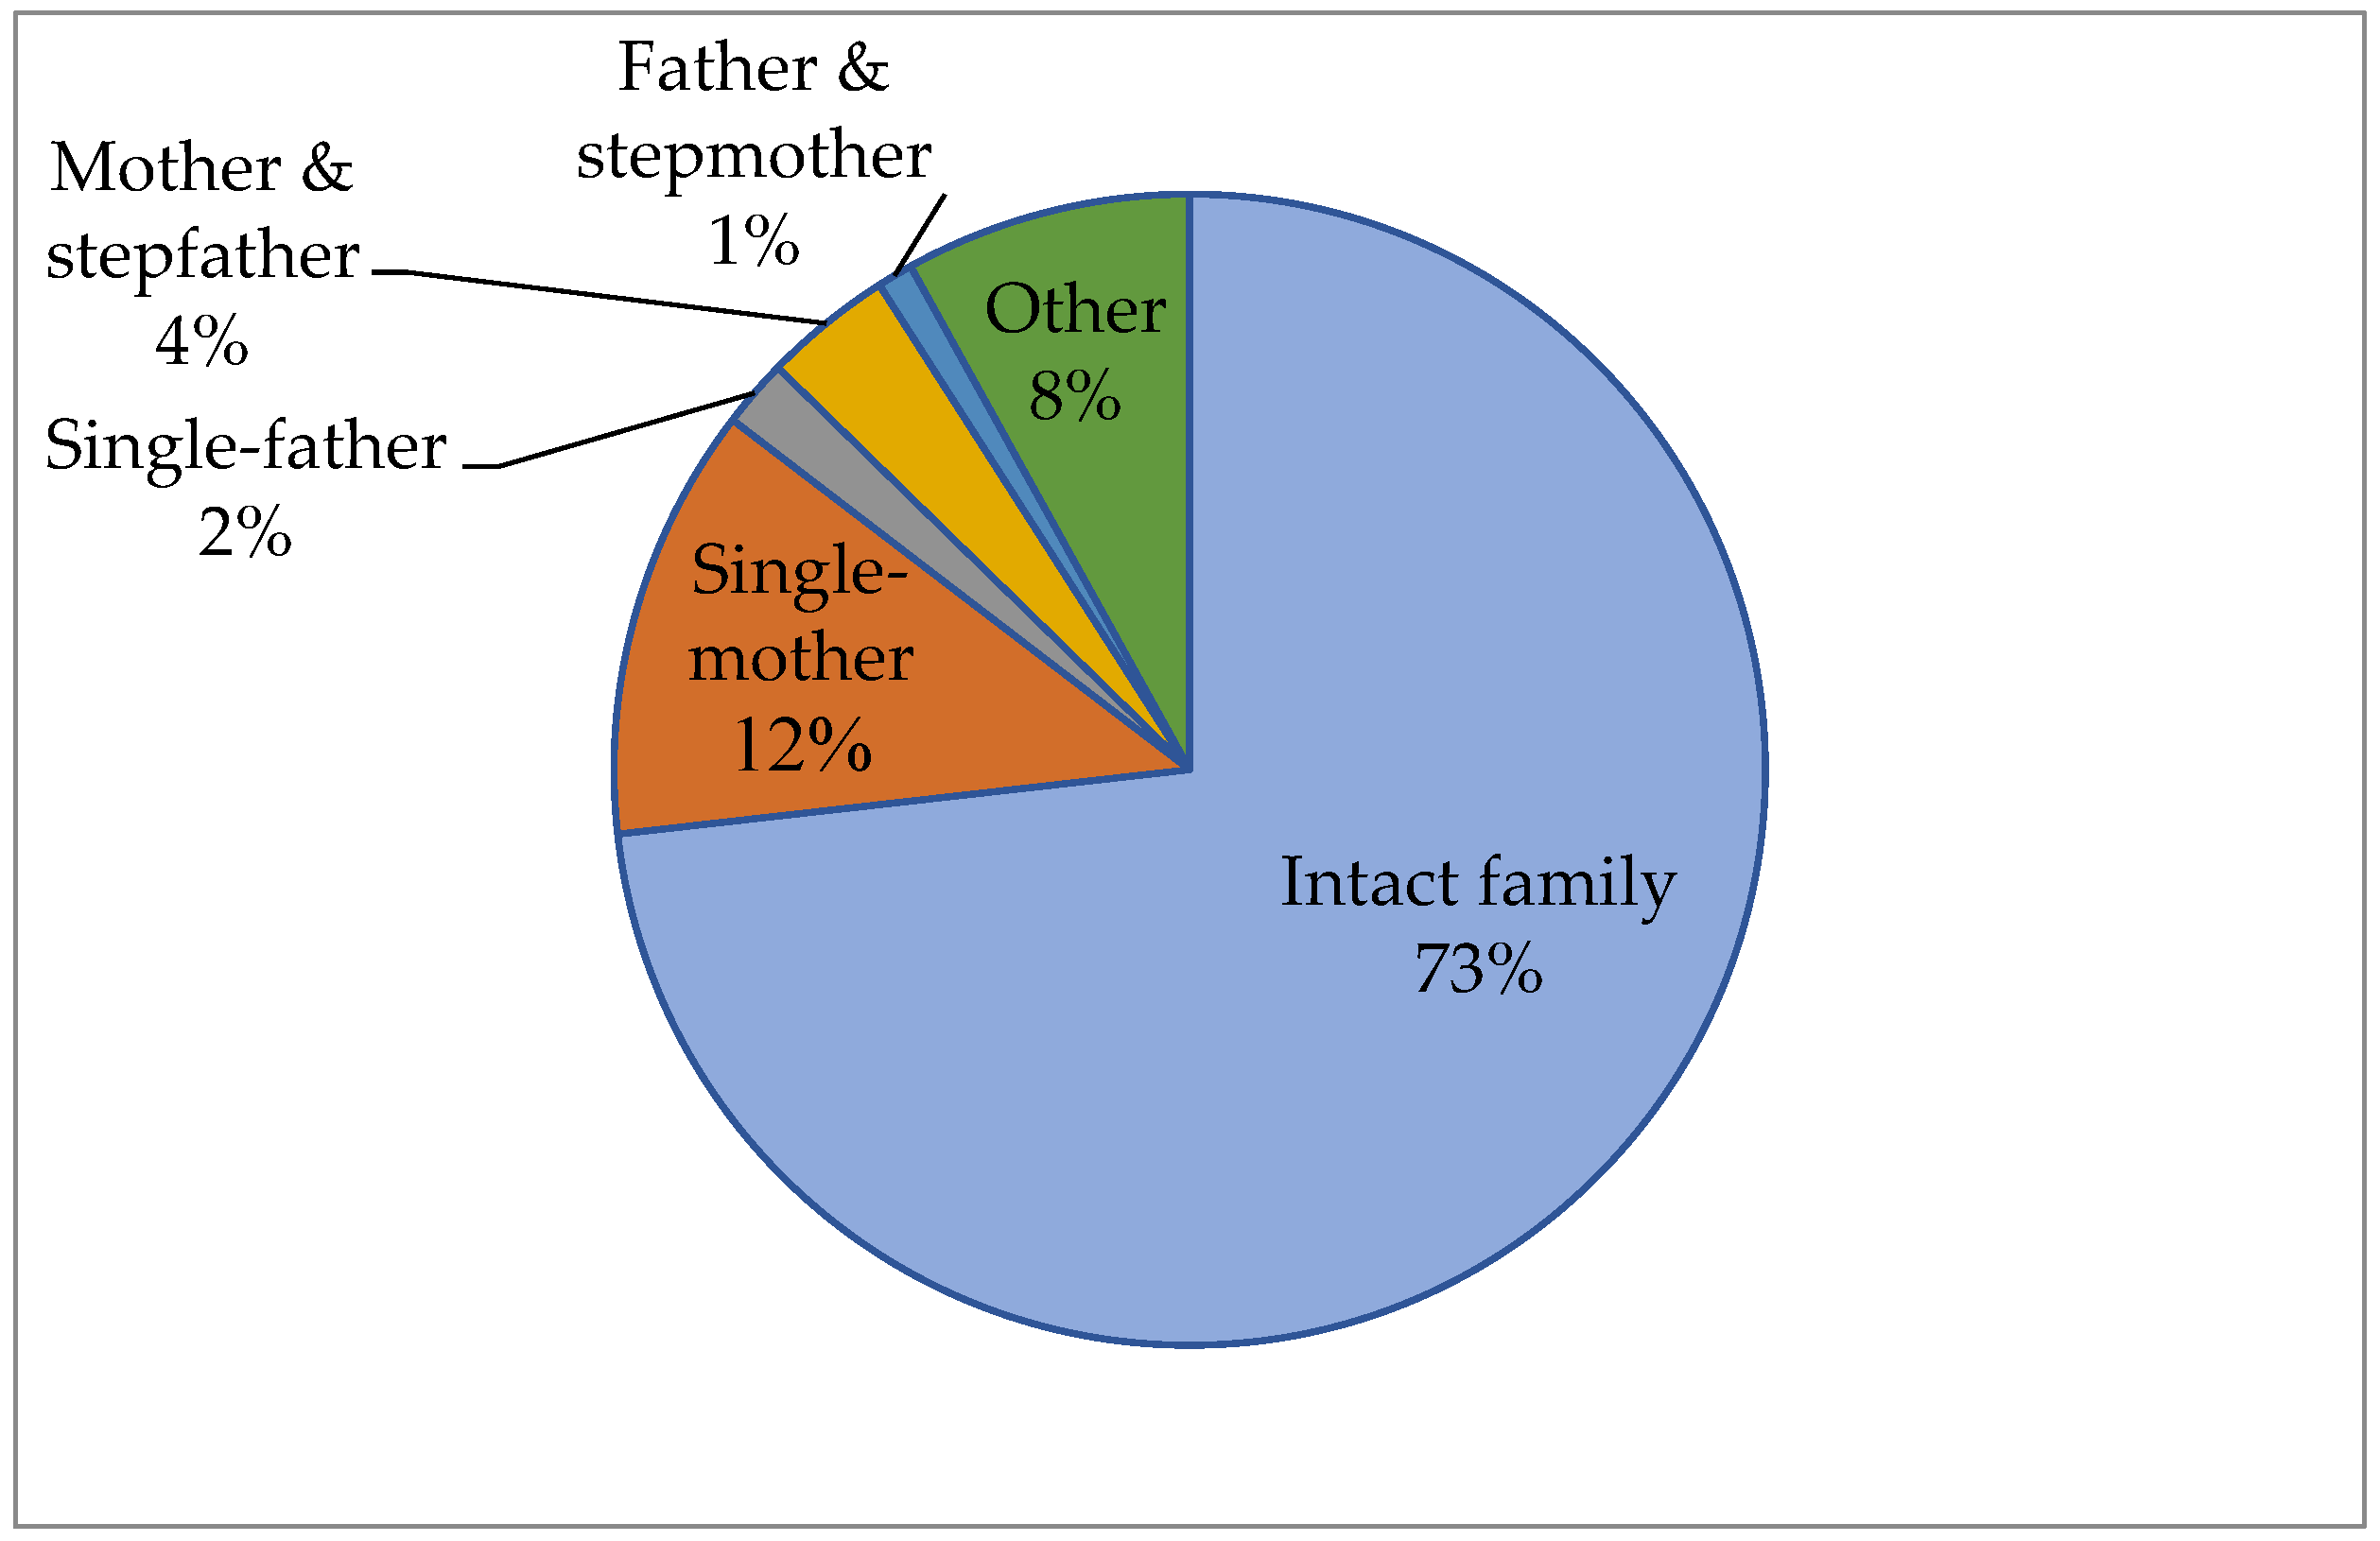
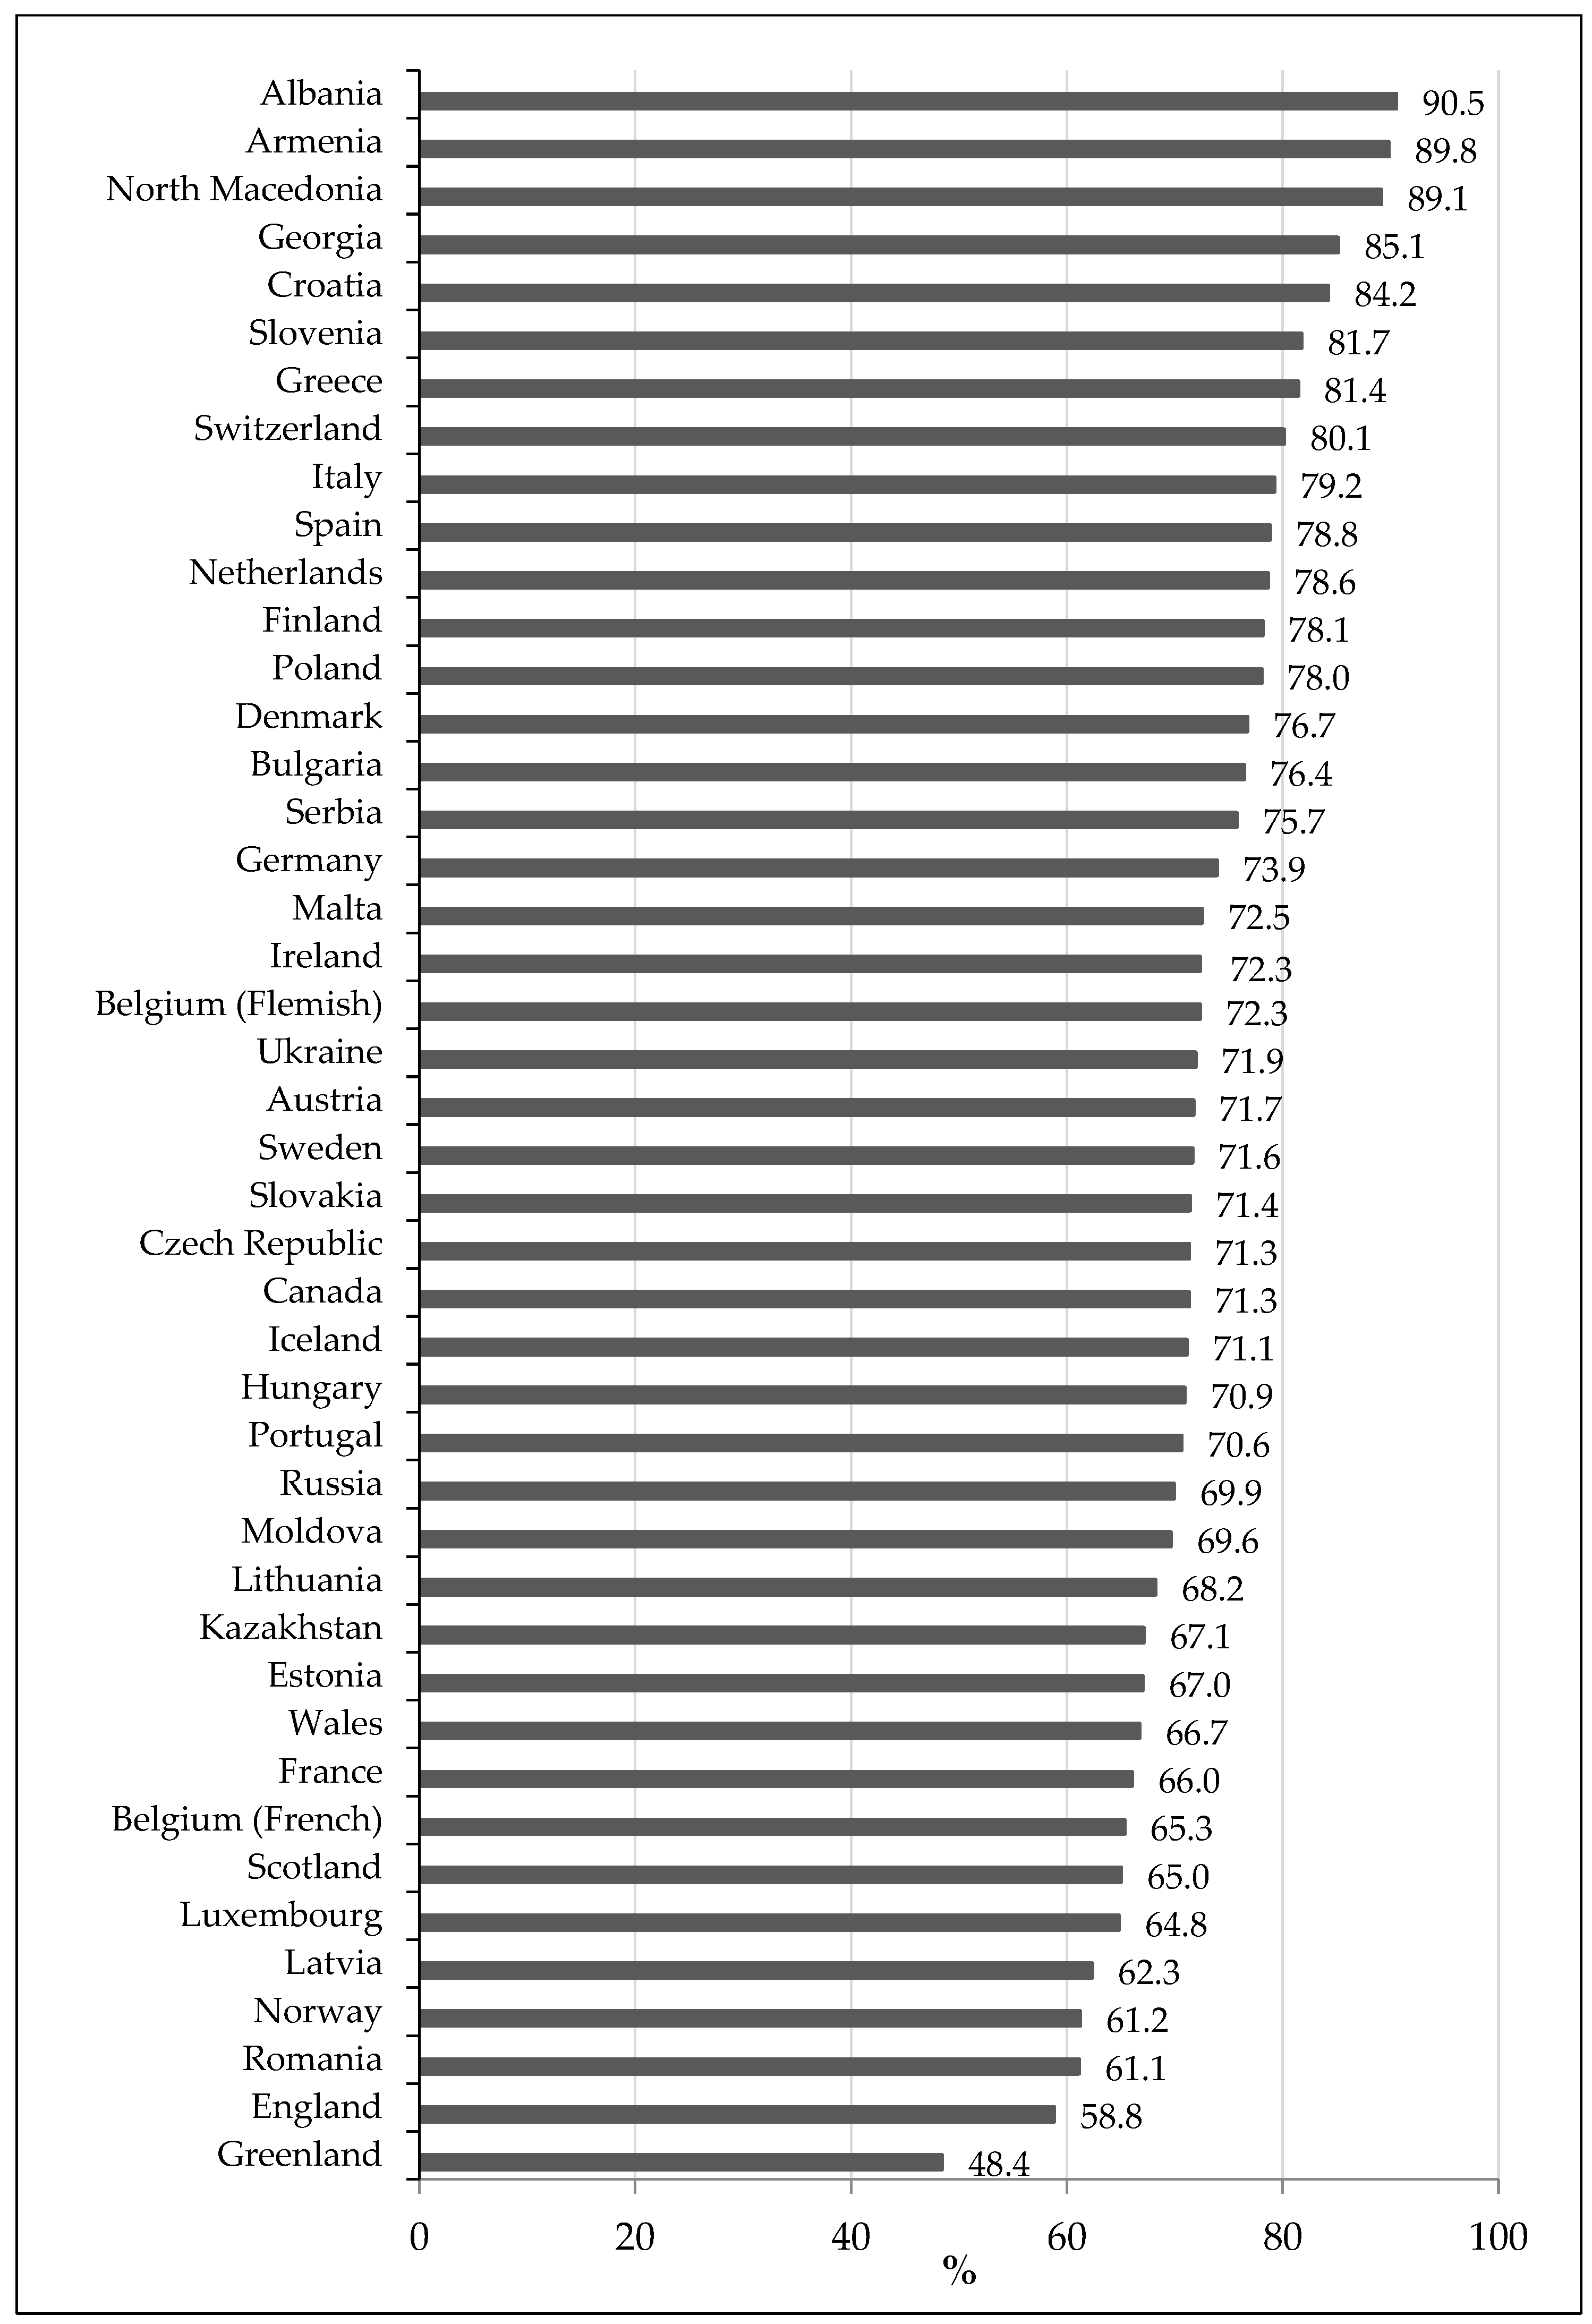
3.1. Family Structure in HBSC Countries in 2018
3.2. Reasons for a Non-Intact Family Structure
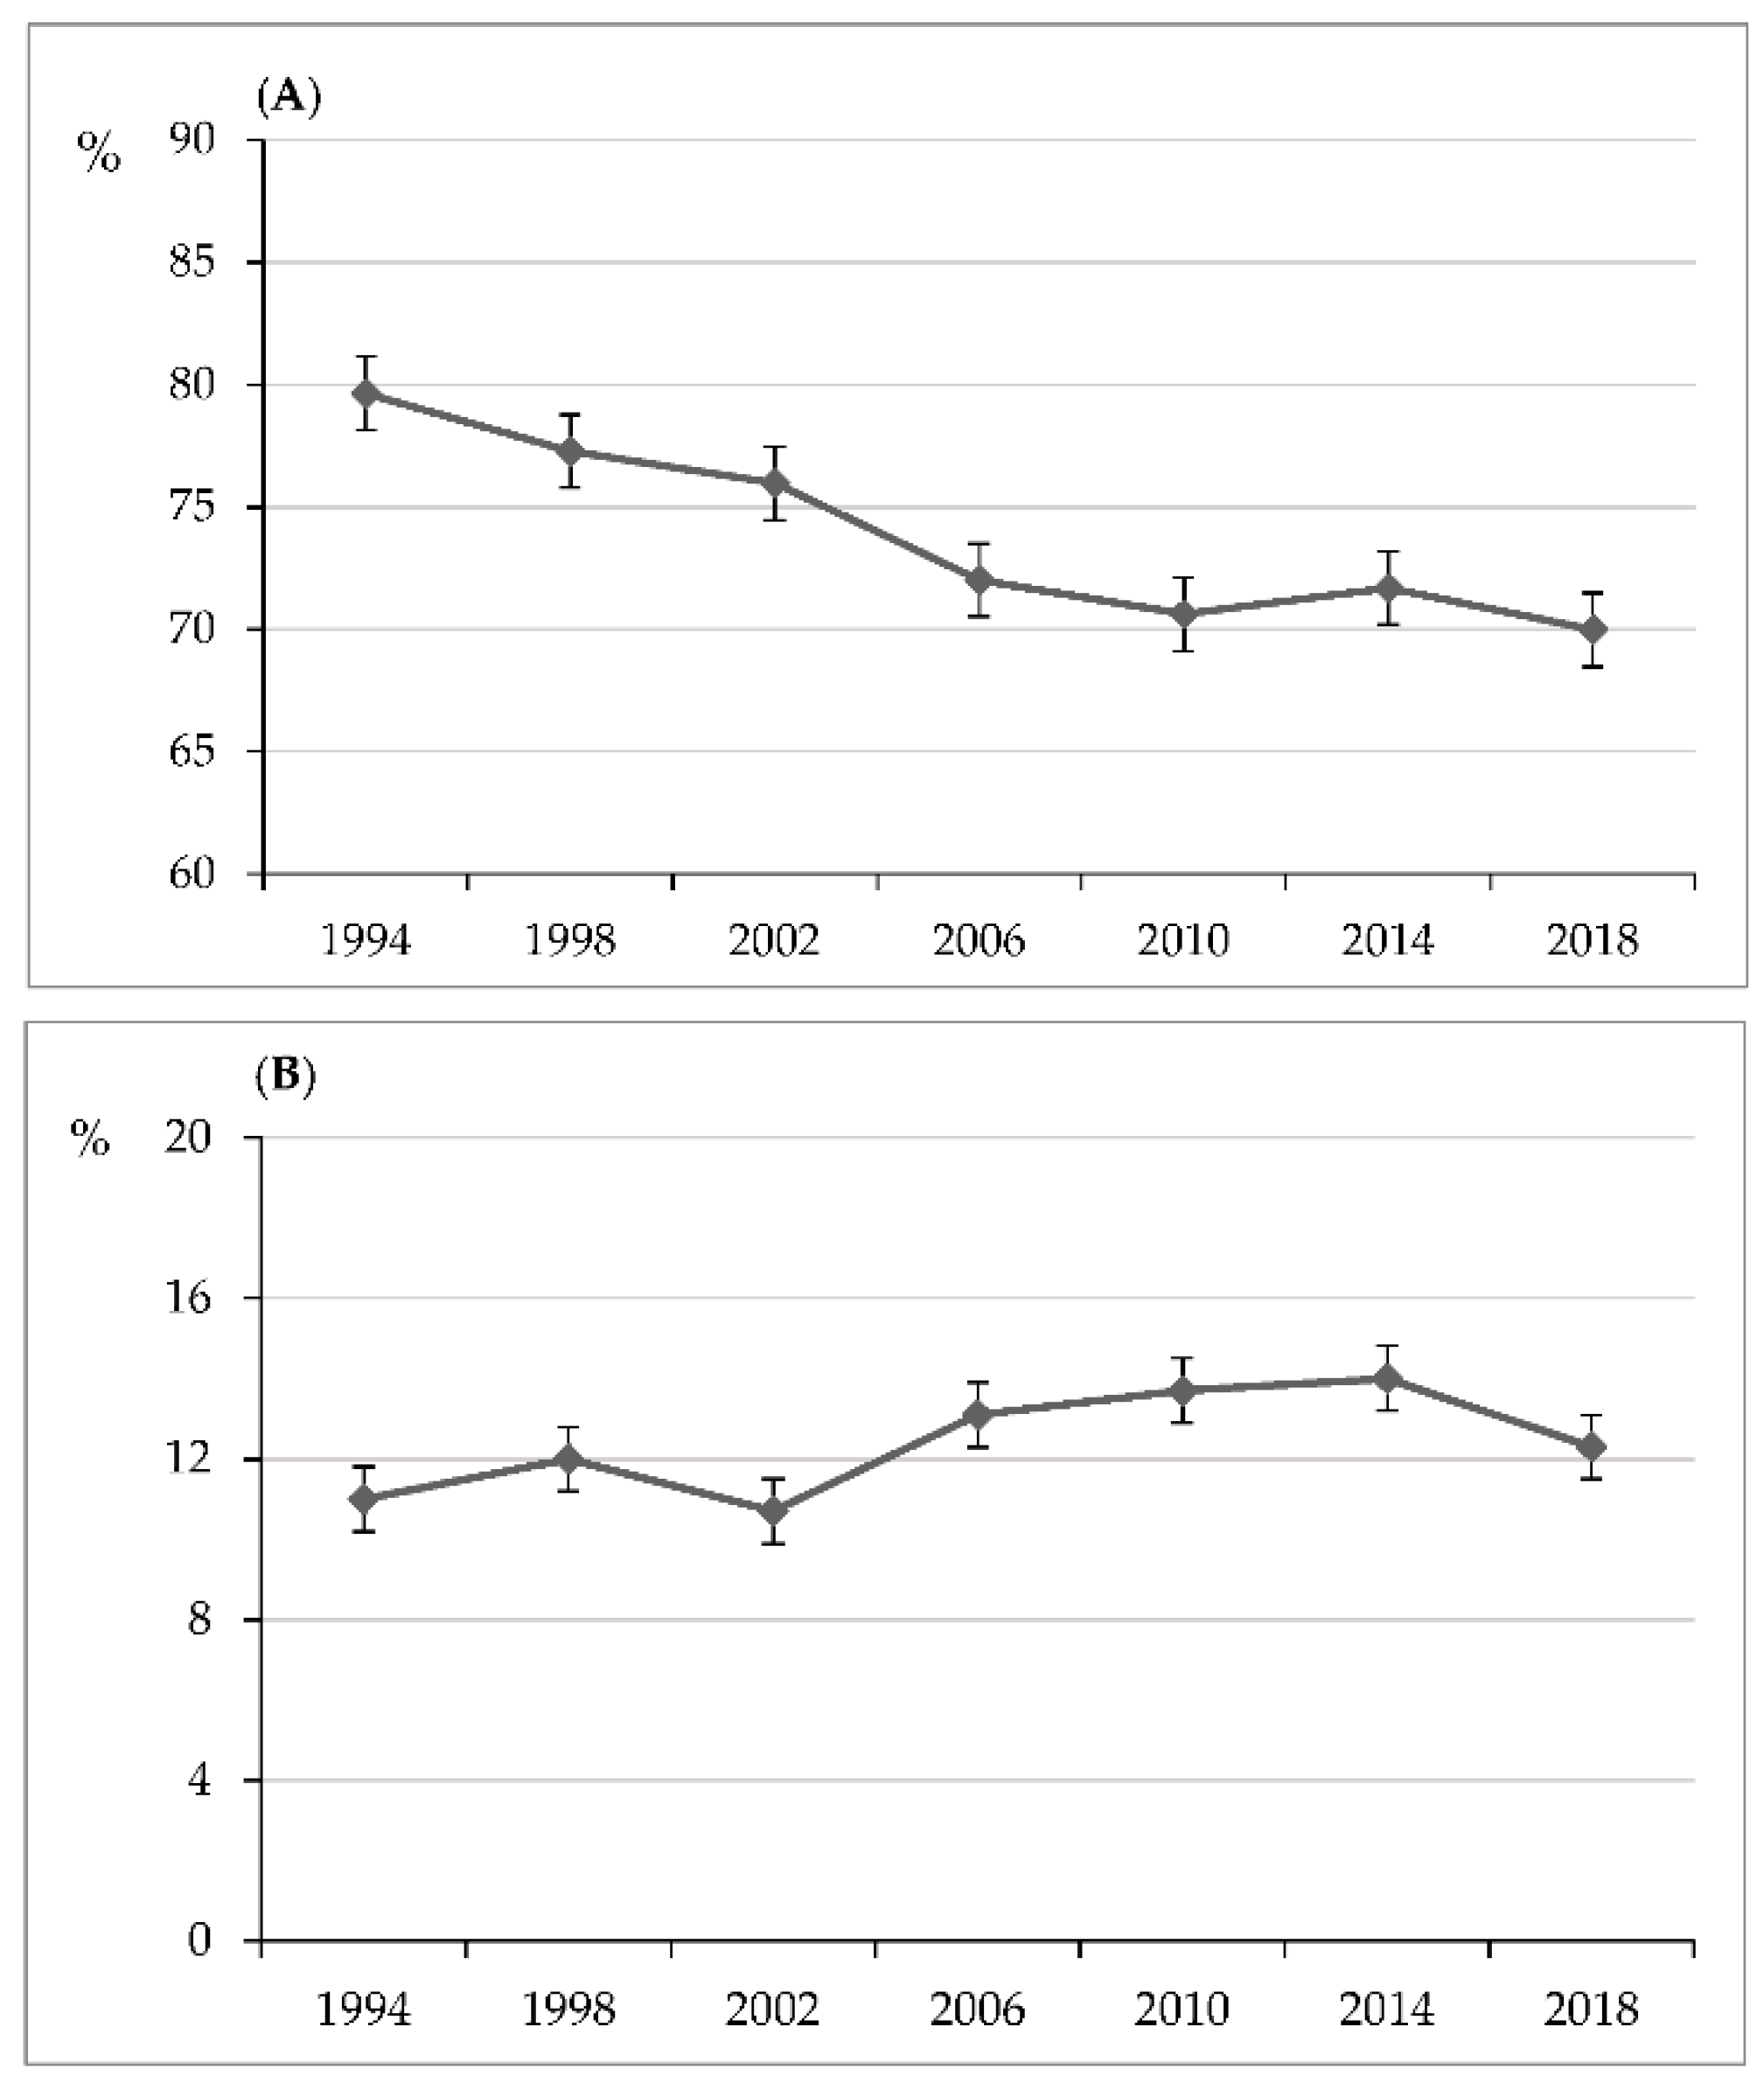
3.3. Time Trend of Family Structures over 1994–2018
4. Discussion
Strengths and Limitations
5. Conclusions
Author Contributions
Funding
Institutional Review Board Statement
Informed Consent Statement
Data Availability Statement
Acknowledgments
Conflicts of Interest
References
- Gerhardt, C.E. Chapter 1. Family Dynamics: Setting Families in Motion. In Families in Motion: Dynamics in Diverse Contexts, 1st ed.; SAGE Publications, Inc.: New York, NY, USA, 2020; pp. 3–23. Available online: https://0-us-sagepub-com.brum.beds.ac.uk/sites/default/files/upm-assets/109149_book_item_109149.pdf (accessed on 1 April 2022).
- Benokraitis, N.; Buehler, C. Marriages and Families: Changes, Choices, and Constraints, 9th ed.; Pearson Education, Inc.: Boston, MA, USA, 2019. [Google Scholar]
- Blackwell, D.L. Family structure and children’s health in the United States: Findings from the National Health Interview Survey, 2001–2007. In Vital and Health Statistics; Series 10; National Health Survey: Singapore, 2010; Volume 246, pp. 1–166. [Google Scholar]
- Anderson, J. The impact of family structure on the health of children: Effects of divorce. Linacre Q. 2014, 81, 378–387. [Google Scholar] [CrossRef] [PubMed] [Green Version]
- Oláh, L.S. Changing families in the European Union: Trends and Policy implications. Families and Societies. Working Paper Series. 2015. Available online: http://www.familiesandsocieties.eu/wp-content/uploads/2015/09/WP44Olah2015.pdf (accessed on 1 April 2022).
- Farris, D.N.; Bourque, A.J.J. (Eds.) International Handbook on the Demography of Marriage and the Family; Springer Nature Switzerland AG: Cham, Switzerland, 2020. [Google Scholar]
- Jensen, T.; Sanner, C. A scoping review of research on well-being across diverse family structures: Rethinking approaches for understanding contemporary families. J. Fam. Theory Rev. 2021, 13, 463–495. [Google Scholar] [CrossRef]
- Carlson, M.J.; Corcoran, M.E. Family structure and children’s behavioral and cognitive outcomes. J. Marriage Fam. 2001, 63, 779–792. [Google Scholar] [CrossRef] [Green Version]
- Jeynes, W. Divorce, Family Structure, and the Academic Success of Children; Routledge, Taylor & Francis Group: London, UK; New York, NY, USA, 2002. [Google Scholar]
- Låftman, S.B. Family Structure and Children’s Living Conditions. A Comparative Study of 24 Countries. Child Indic. Res. 2010, 3, 127–147. [Google Scholar] [CrossRef]
- Sun, Y.; Li, Y. Effects of Family Structure Type and Stability on Children’s Academic Performance Trajectories. J. Marriage Fam. 2011, 73, 541–556. [Google Scholar] [CrossRef]
- Langton, C.E.; Berger, L.M. Family Structure and Adolescent Physical Health, Behavior, and Emotional Well-Being. Soc. Serv. Rev. 2011, 85, 323–357. [Google Scholar] [CrossRef] [Green Version]
- Hadfield, K.; Amos, M.; Gosselin, J.; Unger, M.; Gosselin, J.; Ganong, L.H. Do Changes to Family Structure Affect Child and Family Outcomes? A Systematic Review of the Instability Hypothesis. J. Fam. Theory Rev. 2018, 10, 87–110. [Google Scholar] [CrossRef]
- Granado Alcón, M.C.; Pedersen, J.M. Family as a child development context and smoking behaviour among schoolchildren in Greenland. Int. J. Circumpolar Health 2001, 60, 52–63. [Google Scholar] [CrossRef]
- del Carmen, M.; Alcón, G.; Pedersen, J.M.; María, A.; González, C. Greenlandic family structure and communications with parents: Influences on schoolchildren’s drinking behaviour. Int. J. Circumpolar Health 2002, 61, 319–331. [Google Scholar] [CrossRef]
- Hetherington, E.M. Social Support and the Adjustment of Children in Divorced and Remarried Families. Childhood 2003, 10, 217–236. [Google Scholar] [CrossRef]
- Amato, P.R. The impact of family formation changes the cognitive, social, and emotional well-being of the next generation. Future Child Fall 2005, 15, 75–96. [Google Scholar] [CrossRef] [PubMed]
- Lenciauskiene, I.; Zaborskis, A. The effects of family structure, parent–child relationship and parental monitoring on early sexual behaviour among adolescents in nine European countries. Scand. J. Public Health 2008, 36, 607–618. [Google Scholar] [CrossRef] [PubMed]
- Zaborskis, A.; Sirvyte, D.; Zemaitiene, N. Prevalence and familial predictors of suicidal behaviour among adolescents in Lithuania: A cross-sectional survey 2014. BMC Public Health 2016, 16, 554. [Google Scholar] [CrossRef] [PubMed] [Green Version]
- Susukida, R.; Wilcox, H.C.; Mendelson, T. The association of lifetime suicidal ideation with perceived parental love and family structure in childhood in a nationally representative adult sample. Psychiatry Res. 2016, 237, 246–251. [Google Scholar] [CrossRef] [PubMed]
- Zaborskis, A.; Sirvyte, D. Familial determinants of current smoking among adolescents of Lithuania: A cross-sectional survey 2014. BMC Public Health 2015, 15, 889. [Google Scholar] [CrossRef] [Green Version]
- Šumskas, L.; Zaborskis, A. Family Social Environment and Parenting Predictors of Alcohol Use among Adolescents in Lithuania. Int. J. Environ. Res. Public Health 2017, 14, 1037. [Google Scholar] [CrossRef] [Green Version]
- Park, H.; Lee, K.S. The association of family structure with health behavior, mental health, and perceived academic achievement among adolescents: A 2018 Korean nationally representative survey. BMC Public Health 2020, 20, 510. [Google Scholar] [CrossRef]
- Langøy, A.; Smith, O.R.F.; Wold, B.; Samdal, O.; Haug, E.M. Associations between family structure and young people’s physical activity and screen time behaviors. BMC Public Health 2019, 19, 433. [Google Scholar] [CrossRef]
- Zaborskis, A.; Grincaitė, M.; Kavaliauskienė, A.; Tesler, R. Family structure and affluence in adolescent eating behaviour: A cross-national study in forty-one countries. Public Health Nutr. 2021, 24, 2521–2532. [Google Scholar] [CrossRef]
- Fismen, A.S.; Smith, O.R.F.; Samdal, O.; Helleve, A.; Haug, E. Associations between family structure and adolescents’ food habits. Public Health Nutr. 2022, 25, 702–709. [Google Scholar] [CrossRef]
- Chen, A.Y.; Escarce, J.J. Family structure and childhood obesity: An analysis through 8th grade. Matern Child Health J. 2014, 18, 1772–1777. [Google Scholar] [CrossRef] [PubMed]
- Duriancik, D.M.; Goff, C.R. Children of single-parent households are at a higher risk of obesity: A systematic review. J. Child Health Care 2019, 23, 358–369. [Google Scholar] [CrossRef] [PubMed]
- Levin, K.A.; Currie, C. Family structure, mother–child communication, father–child communication, and adolescent life satisfaction: A cross-sectional multilevel analysis. Health Educ. 2010, 110, 152–168. [Google Scholar] [CrossRef]
- Levin, K.A.; Dallago, L.; Currie, C. The association between adolescent life satisfaction, family structure, family affluence and gender differences in parent–child communication. Soc. Indic. Res. 2012, 106, 287–305. [Google Scholar] [CrossRef] [Green Version]
- Bjarnason, T.; Arnarsson, A.M. Joint physical custody and communication with parents: A cross-national study of children in 36 Western countries. J. Comp. Fam. Stud. 2011, 42, 871–890. [Google Scholar] [CrossRef] [Green Version]
- Chapple, S. Child Well-Being and Sole-Parent Family Structure in the OECD: An Analysis, OECD Social, Employment and Migration Working Papers; No. 82; OECD Publishing: Paris, France, 2009; Available online: https://library.bsl.org.au/jspui/bitstream/1/1061/1/Child%20well-being%20and%20sole%20parent%20family%20structure.pdf (accessed on 1 April 2022).
- Paclikova, K.; Dankulincova Veselska, Z.; Filakovska Bobakova, D.; Palfiova, M.; Madarasova Geckova, A. What role do family composition and functioning play in emotional and behavioral problems among adolescent boys and girls? Int. J. Public Health 2019, 64, 209–221. [Google Scholar] [CrossRef] [PubMed]
- Rattay, P.; von der Lippe, E.; Mauz, E.; Richter, F.; Hölling, H.; Lange, C.; Lampert, T. Health and health risk behaviour of adolescents-Differences according to family structure. Results of the German KiGGS cohort study. PLoS ONE 2018, 13, e0192968. [Google Scholar] [CrossRef]
- Hagquist, C. Family residency and psychosomatic problems among adolescents in Sweden: The impact of child-parent relations. Scand. J. Public Health 2016, 44, 36–46. [Google Scholar] [CrossRef]
- Carlsund, Å.; Eriksson, U.; Sellström, E. Shared physical custody after family split-up: Implications for health and well-being in Swedish schoolchildren. Acta Paediatr. 2013, 102, 318–323. [Google Scholar] [CrossRef]
- Steinbach, A. Children’s and Parents’ Well-Being in Joint Physical Custody: A Literature Review. Fam. Process 2019, 58, 353–369. [Google Scholar] [CrossRef]
- Yang, F.; Tan, K.-A.; Cheng, W.J.Y. The effects of connectedness on health-promoting and health-compromising behaviors in adolescents: Evidence from a statewide survey. J. Prim. Prev. 2013, 35, 33–46. [Google Scholar] [CrossRef] [PubMed]
- Barnett, M.A. Economic disadvantage in complex family systems: Expansion of family stress models. Clin. Child Fam. Psychol. Rev. 2008, 11, 145–161. [Google Scholar] [CrossRef] [PubMed]
- LIS. Luxembourg Income Study. Key Figures. 2022. Available online: https://www.lisdatacenter.org/lis-ikf-webapp/app/search-ikf-figures (accessed on 1 April 2022).
- World Family Map 2017. Mapping Family Changes and Child Well-Being Outcomes. Essay: The Cohabitation-Go-Round: Cohabitation and Family Instability Across the Globe. An International Report from Institute for Family Studies and Weatley Institution. New York, Barcelona. 2017. Available online: https://worldfamilymap.ifstudies.org/2017/files/WFM-2017-FullReport.pdf (accessed on 1 April 2022).
- World Family Map 2019. Mapping Family Changes and Child Well-Being Outcomes. Essay: The Ties That Bind: Is Faith a Global Force for Good or Ill in the Family? An International Report from Institute for Family Studies and Weatley Institution. New York, Barcelona. 2019. Available online: https://ifstudies.org/ifs-admin/resources/reports/worldfamilymap-2019-051819final.pdf (accessed on 1 April 2022).
- OECD Family Database. SF1.2: Children in Families. OECD-Social Policy Division-Directorate of Employment, Labour and Social Affairs. Website, Updated on February 2020. Available online: https://www.oecd.org/els/soc/SF_1_2_Children_in_families.pdf (accessed on 1 April 2022).
- Andersson, G. Children’s experience of family disruption and family formation: Evidence from 16 FFS countries. Demogr. Res. 2002, 7, 343–363. [Google Scholar] [CrossRef]
- Roberts, C.; Currie, C.; Samdal, O.; Currie, D.; Smith, R.; Maes, L. Measuring the health and health behaviours of adolescents through cross-national survey research: Recent developments in the Health Behaviour in School-aged Children (HBSC) Study. J. Public Health 2007, 15, 179–186. [Google Scholar] [CrossRef]
- Moor, I.; Winter, K.; Bilz, L.; Bucksch, J.; Finne, E.; John, N.; Kolip, P.; Paulsen, L.; Ravens-Sieberer, U.; Schlattmann, M.; et al. The 2017/18 Health Behaviour in School-aged Children (HBSC) study–Methodology of the World Health Organization’s child and adolescent health study. J. Health Monit. 2020, 5, 88–102. [Google Scholar] [CrossRef]
- King, A.; Wold, B.; Tudor-Smith, C.; Harel, Y. (Eds.) The Health of Youth: A Cross-National Survey; European Series No. 69; WHO Regional Publications: Copenhagen, Denmark, 1996; Available online: http://www.hbsc.org/documents/The%20Health%20of%20Youth%20A%20cross-national%20survey.pdf (accessed on 1 April 2022).
- Currie, C.; Hurrelmann, K.; Settertobulte, W.; Smith, R.; Todd, J. (Eds.) Health and Health Behaviour among Young People (Health Policy for Children and Adolescents, Issue 1, International Report); WHO Regional Office for Europe: Copenhagen, Denmark, 2000; Available online: https://www.euro.who.int/__data/assets/pdf_file/0006/119571/E67880.pdf (accessed on 1 April 2022).
- Currie, C.; Roberts, C.; Morgan, A.; Smith, R.; Settertobulte, W.; Samdal, O.; Barnekow Rasmussen, V. (Eds.) Young People’s Health in Context; International Report from the HBSC 2001/02 Survey, (Health Policy for Children and Adolescents, No. 4); WHO Regional Office for Europe: Copenhagen, Denmark, 2004; Available online: https://www.euro.who.int/__data/assets/pdf_file/0008/110231/e82923.pdf (accessed on 1 April 2022).
- Currie, C.; Nic Gabhainn, S.; Godeau, E.; Roberts, C.; Smith, R.; Currie, D.; Pickett, W.; Richter, M.; Morgan, A.; Barnekow, V. (Eds.) Inequalities in Young People’s Health; HBSC International Report from the 2005/06 Survey; Health Policy for Children and Adolescents, No. 5; WHO Regional Office for Europe: Copenhagen, Denmark, 2008; Available online: https://www.euro.who.int/__data/assets/pdf_file/0005/53852/E91416.pdf (accessed on 1 April 2022).
- Currie, C.; Zanotti, C.; Morgan, A.; Currie, D.; de Looze, M.; Roberts, C.; Samdal, O.; Smith, O.R.F.; Barnekow, V. (Eds.) Social Determinants of Health and Well-Being among Young People; Health Behaviour in School-Aged Children (HBSC) Study: International Report from the 2009/2010 Survey, (Health Policy for Children and Adolescents, No. 6); WHO Regional Office for Europe: Copenhagen, Denmark, 2012; Available online: https://www.euro.who.int/__data/assets/pdf_file/0003/163857/Social-determinants-of-health-and-well-being-among-young-people.pdf (accessed on 1 April 2022).
- Inchley, J.; Currie, D.; Young, T.; Samdal, O.; Torsheim, T.; Augustson, L.; Mathison, F.; Aleman-Diaz, A.; Molcho, M.; Weber, M.; et al. (Eds.) Growing Up Unequal: Gender and Socioeconomic Differences in Young People’s Health and Well-Being; Health Behaviour in School-Aged Children (HBSC) Study: International Report from the 2013/2014 Survey, (Health Policy for Children and Adolescents, No. 7); WHO Regional Office for Europe: Copenhagen, Denmark, 2016; Available online: https://www.euro.who.int/__data/assets/pdf_file/0003/303438/HSBC-No.7-Growing-up-unequal-Full-Report.pdf (accessed on 1 April 2022).
- Inchley, J.; Currie, D.; Budisavljevic, S.; Torsheim, T.; Jåstad, A.; Cosma, A.; Kelly, C.; Arnarsson, A.M. (Eds.) Spotlight on Adolescent Health and Well-Being; Findings from the 2017/2018 Health Behaviour in School-Aged Children (HBSC) Survey in Europe and Canada. International Report. Volume 1. Key Findings, Licence: CC BY-NC-SA 3.0 IGO; WHO Regional Office for Europe: Copenhagen, Denmark, 2020; Available online: https://apps.who.int/iris/bitstream/handle/10665/332091/9789289055000-eng.pdf (accessed on 1 April 2022).
- Currie, C.; Inchley, J.; Molcho, M.; Lenzi, M.; Veselska, Z.; Wild, F. Health Behaviour in School-Aged Children (HBSC) Study Protocol: Background, Methodology, and Mandatory Items for the 2013/14 Survey. St Andrews: CAHRU. 2014. Available online: https://drive.google.com/file/d/1FZ8c2Xa_FcZ5Yx5gPXkPtlbV545NKhnx/view (accessed on 1 April 2022).
- United Nation. Convention of the Rights of the Child. 1989. Available online: https://www.ohchr.org/en/instruments-mechanisms/instruments/convention-rights-child (accessed on 1 April 2022).
- OECD. Doing Better for Families; OECD Publishing: Paris, France, 2011; Available online: https://www.oecd.org/social/soc/doingbetterforfamilies.htm (accessed on 1 April 2022).
- Cowan, P.A.; Hetherington, M. (Eds.) Family Transitions; Laurence Erlbaum Associates: Hillsdale, NJ, USA, 1991. [Google Scholar]
- Steinberg, L. The family at adolescence: Transition and transformation. J. Adolesc. Health 2000, 27, 170–178. [Google Scholar] [CrossRef]
- Lamanna, M.A.; Riedmann, A.; Stewwart, S. Marriages, Families, and Relationships: Making Choices in a Diverse Society, 13th ed.; Cengage Learning: Boston, MA, USA, 2018. [Google Scholar]
- Eurostat. People in the EU: Who Are We and How Do We live? 2015th ed.; Eurostat Statistical Books: Luxembourg, 2015; Available online: https://0-doi-org.brum.beds.ac.uk/10.2785/406462 (accessed on 1 April 2022).
- U.S. Census Bureau. Single Mother Statistics. 2021. Available online: https://singlemotherguide.com/single-mother-statistics/ (accessed on 1 April 2022).
- Heine, S. The Rise of Single Motherhood in the EU: Analysis and Propositions. European Policy Brief. EGMONT Royal Institute for International Relations, No. 42. 2016. Available online: https://aei.pitt.edu/74547/1/42.pdf (accessed on 1 April 2022).
- Yanovich, L. Children Left Behind: The Impact of Labor Migration in Moldova and Ukraine. Migration Information Source. 2015. Available online: https://www.migrationpolicy.org/article/children-left-behind-impact-labor-migration-moldova-and-ukraine (accessed on 1 April 2022).
- Brooks, F.; Zaborskis, A.; Tabak, I.; Alcón, M.D.; Zemaitiene, N.; de Roos, S.; Klemera, E. Trends in adolescents’ perceived parental communication across 32 countries in Europe and North America from 2002 to 2010. Eur. J. Public Health 2015, 25 (Suppl. 2), 46–50. [Google Scholar] [CrossRef] [Green Version]
- Rebicova, M.L.; Veselska, Z.D.; Husarova, D.; Klein, D.; Geckova, A.M.; van Dijk, J.P.; Reijneveld, S.A. Does family communication moderate the association between adverse childhood experiences and emotional and behavioural problems? BMC Public Health 2020, 20, 1–7. [Google Scholar] [CrossRef]
- Botezat, A. Parental Migration and the Children Left Behind; Bold: Jacobs Fundation: Zürich, Switzerland, 2018; Available online: https://bold.expert/parental-migration-and-the-children-left-behind/ (accessed on 1 April 2022).


| Country | Year | N | Parents Are Divorced | Mother/Father Is Dead | Mother/Father Is Living/Working Far Away | Never Seen Father/Mother | Other Reasons |
|---|---|---|---|---|---|---|---|
| Lithuania | 2014 | 1875 | 58.6 | 14.9 | 13.4 | 3.9 | 9.2 |
| Armenia | 2018 | 647 | 27.4 | 16.8 | 22.9 | 8.0 | 24.9 |
| Moldova | 2018 | 1078 | 50.0 | 12.1 | 18.6 | 3.6 | 15.7 |
| Ukraine | 2018 | 1762 | 63.4 | 16.6 | 3.1 | 4.7 | 12.2 |
| Country or Region | Survey in 1994 (or 1998) | Survey in 2018 (or 2014) | ||||||||||
|---|---|---|---|---|---|---|---|---|---|---|---|---|
| Year | N | Both Parents | Single Mother | Mother and Stepfather | Other | Year | N | Both Parents | Single Mother | Mother and Stepfather | Other | |
| Austria | 1994 | 5349 | 85.2 | 8.0 | 3.0 | 1.8 | 2018 | 4032 | 71.7 * | 13.5 * | 2.7 | 10.2 * |
| Belgium (Flemish) | 1994 | 4476 | 86.0 | 6.8 | 4.0 | 0.6 | 2018 | 4034 | 72.3 * | 15.1 * | 4.0 | 4.8 * |
| Belgium (French) | 1994 | 5196 | 75.5 | 10.3 | 6.3 | 4.8 | 2018 | 4020 | 65.3 * | 14.0 * | 5.3 | 11.9 * |
| Canada | 1994 | 6699 | 77.1 | 11.8 | 6.3 | 0.8 | 2018 | 12707 | 71.3 * | 14.6 * | 5.0 * | 5.2 * |
| Czech Republic | 1994 | 3584 | 83.8 | 8.1 | 5.7 | 0.7 | 2018 | 11070 | 71.3 * | 9.6 * | 4.7 * | 12.7 * |
| Denmark | 1994 | 3867 | 74.8 | 12.6 | 8.2 | 1.1 | 2018 | 3073 | 76.7 | 6.3 * | 1.2 * | 14.0 * |
| England | 1998 | 6373 | 68.2 | 14.4 | 11.0 | 2.9 | 2018 | 3397 | 58.8 * | 14.1 | 3.8 * | 21.2 * |
| Estonia | 1994 | 3516 | 76.2 | 15.1 | 6.1 | 1.1 | 2018 | 4725 | 67.0 * | 8.1 * | 3.9 * | 19.4 * |
| Finland | 1994 | 4181 | 76.6 | 12.4 | 5.8 | 1.9 | 2018 | 3100 | 78.1 | 8.8 * | 5.8 | 4.5 * |
| France | 1994 | 3971 | 81.6 | 10.0 | 4.9 | 1.0 | 2018 | 9170 | 66.0 * | 13.5 * | 5.8 * | 11.4 * |
| Germany | 1998 | 4770 | 81.1 | 9.7 | 5.3 | 1.4 | 2018 | 4061 | 73.9 * | 13.1 * | 5.1 | 5.8 * |
| Greece | 1998 | 4285 | 91.1 | 5.6 | 1.0 | 1.4 | 2018 | 3863 | 81.4 * | 10.3 * | 1.4 | 4.9 * |
| Greenland | 1994 | 1238 | 57.7 | 17.9 | 7.3 | 11.6 | 2018 | 1168 | 48.4 * | 17.6 | 6.2 | 21.6 * |
| Hungary | 1994 | 5775 | 78.5 | 10.8 | 5.7 | 2.9 | 2018 | 3748 | 70.9 * | 12.5 * | 8.2 * | 5.5 * |
| Ireland | 1998 | 4352 | 86.1 | 8.1 | 0.9 | 3.2 | 2018 | 3833 | 72.3 * | 14.0 * | 4.1 * | 7.9 * |
| Israel | 1994 | 4103 | 91.5 | 5.5 | 1.4 | 1.0 | 2014 | 6104 | 86.1 * | 9.8 * | 1.8 | 0.9 |
| Latvia | 1994 | 3774 | 74.1 | 15.6 | 6.7 | 2.1 | 2018 | 4412 | 62.3 * | 14.8 | 4.3 * | 15.7 * |
| Lithuania | 1994 | 5425 | 82.7 | 10.9 | 4.4 | 1.0 | 2018 | 3797 | 68.2 * | 11.1 | 5.6 * | 13.6 * |
| Norway | 1994 | 4920 | 78.3 | 10.8 | 6.6 | 0.9 | 2018 | 3127 | 61.2 * | 11.4 | 4.5 * | 19.3 * |
| Poland | 1994 | 4519 | 88.4 | 7.1 | 2.2 | 1.1 | 2018 | 5164 | 78.0 * | 8.8 * | 1.7 | 10.2 * |
| Portugal | 1998 | 3720 | 85.4 | 7.9 | 2.6 | 2.5 | 2018 | 5655 | 70.6 * | 10.4 * | 3.3 | 13.8 * |
| Russian Federation | 1994 | 4001 | 75.7 | 16.6 | 5.2 | 1.6 | 2018 | 4260 | 69.9 * | 8.3 * | 5.0 | 15.9 * |
| Scotland | 1994 | 4770 | 75.8 | 14.6 | 4.9 | 1.7 | 2018 | 4773 | 65.0 * | 20.2 * | 5.2 | 7.3 * |
| Slovakia | 1994 | 3402 | 88.5 | 7.6 | 1.9 | 0.6 | 2018 | 3911 | 71.4 * | 12.2 * | 4.3 * | 9.9 * |
| Spain | 1994 | 4431 | 90.8 | 6.2 | 1.3 | 0.7 | 2018 | 4320 | 78.8 * | 11.8 * | 2.2 * | 5.6 * |
| Sweden | 1994 | 3570 | 76.0 | 11.3 | 6.5 | 2.4 | 2018 | 4185 | 71.6 * | 12.5 | 5.1 * | 6.5 * |
| Switzerland | 1998 | 3997 | 83.3 | 10.4 | 3.6 | 1.1 | 2018 | 7375 | 80.1 * | 7.1 * | 3.6 | 7.9 * |
| Wales | 1994 | 3851 | 77.2 | 12.3 | 6.3 | 1.3 | 2018 | 13039 | 66.7 * | 18.7 * | 8.2 * | 3.3 * |
Publisher’s Note: MDPI stays neutral with regard to jurisdictional claims in published maps and institutional affiliations. |
© 2022 by the authors. Licensee MDPI, Basel, Switzerland. This article is an open access article distributed under the terms and conditions of the Creative Commons Attribution (CC BY) license (https://creativecommons.org/licenses/by/4.0/).
Share and Cite
Zaborskis, A.; Kavaliauskienė, A.; Eriksson, C.; Dimitrova, E.; Makari, J. Family Structure through the Adolescent Eyes: A Comparative Study of Current Status and Time Trends over Three Decades of HBSC Study. Societies 2022, 12, 88. https://0-doi-org.brum.beds.ac.uk/10.3390/soc12030088
Zaborskis A, Kavaliauskienė A, Eriksson C, Dimitrova E, Makari J. Family Structure through the Adolescent Eyes: A Comparative Study of Current Status and Time Trends over Three Decades of HBSC Study. Societies. 2022; 12(3):88. https://0-doi-org.brum.beds.ac.uk/10.3390/soc12030088
Chicago/Turabian StyleZaborskis, Apolinaras, Aistė Kavaliauskienė, Charli Eriksson, Elitsa Dimitrova, and Joana Makari. 2022. "Family Structure through the Adolescent Eyes: A Comparative Study of Current Status and Time Trends over Three Decades of HBSC Study" Societies 12, no. 3: 88. https://0-doi-org.brum.beds.ac.uk/10.3390/soc12030088