1. Introduction
One of the most important strategies of automobile manufacturers is nowadays the weight reduction of every vehicle component to lower the fuel consumption and satisfy the international rules concerning the CO
2 emissions [
1]. Concerning, the body in white (BIW) vehicle structure, for a lot of years, there was a wide debate in the scientific, as well as in the production community, about the possibility of using lighter metallic sheets or higher performances steel ones. In 2012, an average aluminum content of about 140 kg was registered for European cars, 26 kg of which in the car body (hoods, doors, fenders, bumpers, and interiors) [
2]. The use of Al-alloys for BIW is more and more investigated for the production of lighter vehicles [
3] and the increasing interest in the use of aluminum alloy in this field is confirmed by recent reviews on forming [
4] and joining [
5] of Al-alloys for automotive applications. Lightweight aluminum sheets are being used for automotive applications due to a number of benefits: they offer high potential weight saving, improve vehicle fuel efficiency, and reduce the total greenhouse gas emission throughout the life of the vehicle [
6]. Moreover, aluminum alloy sheets can meet important requirements of the BIW such as strength (e.g., structural stability and durability, dent resistance, crashworthiness), good formability, joining suitability (e.g., welding and brazing), recyclability, together with sustainable costs [
7]. In general, both AlMgSi and AlMg (AA 6000 and 5000 series) alloys are used to produce in part or totally the BIW structure [
8]. Furthermore, they can be processed with the same technology of steel sheets, allowing a relatively easy material substitution to be carried out in the production of a conventional vehicle structure with approximately 40% mass reduction when compared to steel use [
9].
In many applications of mechanical engineering, load agents are often dynamic or impulsive; that is why all components must be designed to operate on a wide range of strain rates. In particular, strength requirements of BIW structure are both static (e.g., structural stability and durability) and dynamic (e.g., crash tests) [
10]. Conventional mechanical tests can consider strain rates up to 10 s
−1, while dynamic ones (e.g., the split Hopkinson pressure bar setup) can reach range values of 10
3–10
4 s
−1 [
10]. The improper estimation (not correct) of material dynamic behavior in crashworthiness design, on the one side may reduce the structure energy absorption capability, increasing the occupant’s body accelerations and resulting in more injuries, on the other side can produce a heavier structure [
11]. In order to guarantee reliable results from the simulations, an appropriate set of experimental data needs to be collected and an appropriate elastic-plastic constitutive model needs to be chosen [
12]. The engineering and the true stress–strain curves, describing the strain hardening behavior up to large strain, are the fundamental information among the elastic-plastic parameters [
13].
Few studies were conducted by Vilamosa et al. [
14] about the thermo-mechanical behavior in tension of three as-cast and homogenized Al-Mg-Si alloys (6060 and 6082 aluminum alloys) in a wide range of strain rates (0.01–750 s
−1) and temperatures (20–350 °C). The authors evidence a slightly positive strain rates effect on flow stress at room temperature, and a more significant effect at temperatures higher than 250 °C. In addition, other authors investigated the mechanical properties of various aluminum wrought alloys at different strain rate conditions [
15,
16,
17,
18]. This body of published works shows that the strain rate sensitivity of aluminum alloys can depend on the alloy type and, in some cases, on the heat treatment.
In the present research, the static (strain rate about 10−3 s−1) and dynamic (strain rate about 5 × 10² s−1) mechanical behavior of AA6016 alloy sheets (of interest for car body applications), in T4 and T6 temper conditions, were investigated by means of standard static tensile test and the modified Hopkinson bar device. The data were fitted by using the Swift-Voce hardening model. The fracture morphology is also presented.
2. Materials and Methods
Samples of a sheet of the AA6016 alloy, 1 mm thick, supplied in the T4 state (solution heat treated, quenched, and natural aged) were analyzed with optical emission spectroscopy (OES) to detect the chemical composition. The results are shown in
Table 1. The obtained composition is in accordance with standard EN 573-3 for this alloy.
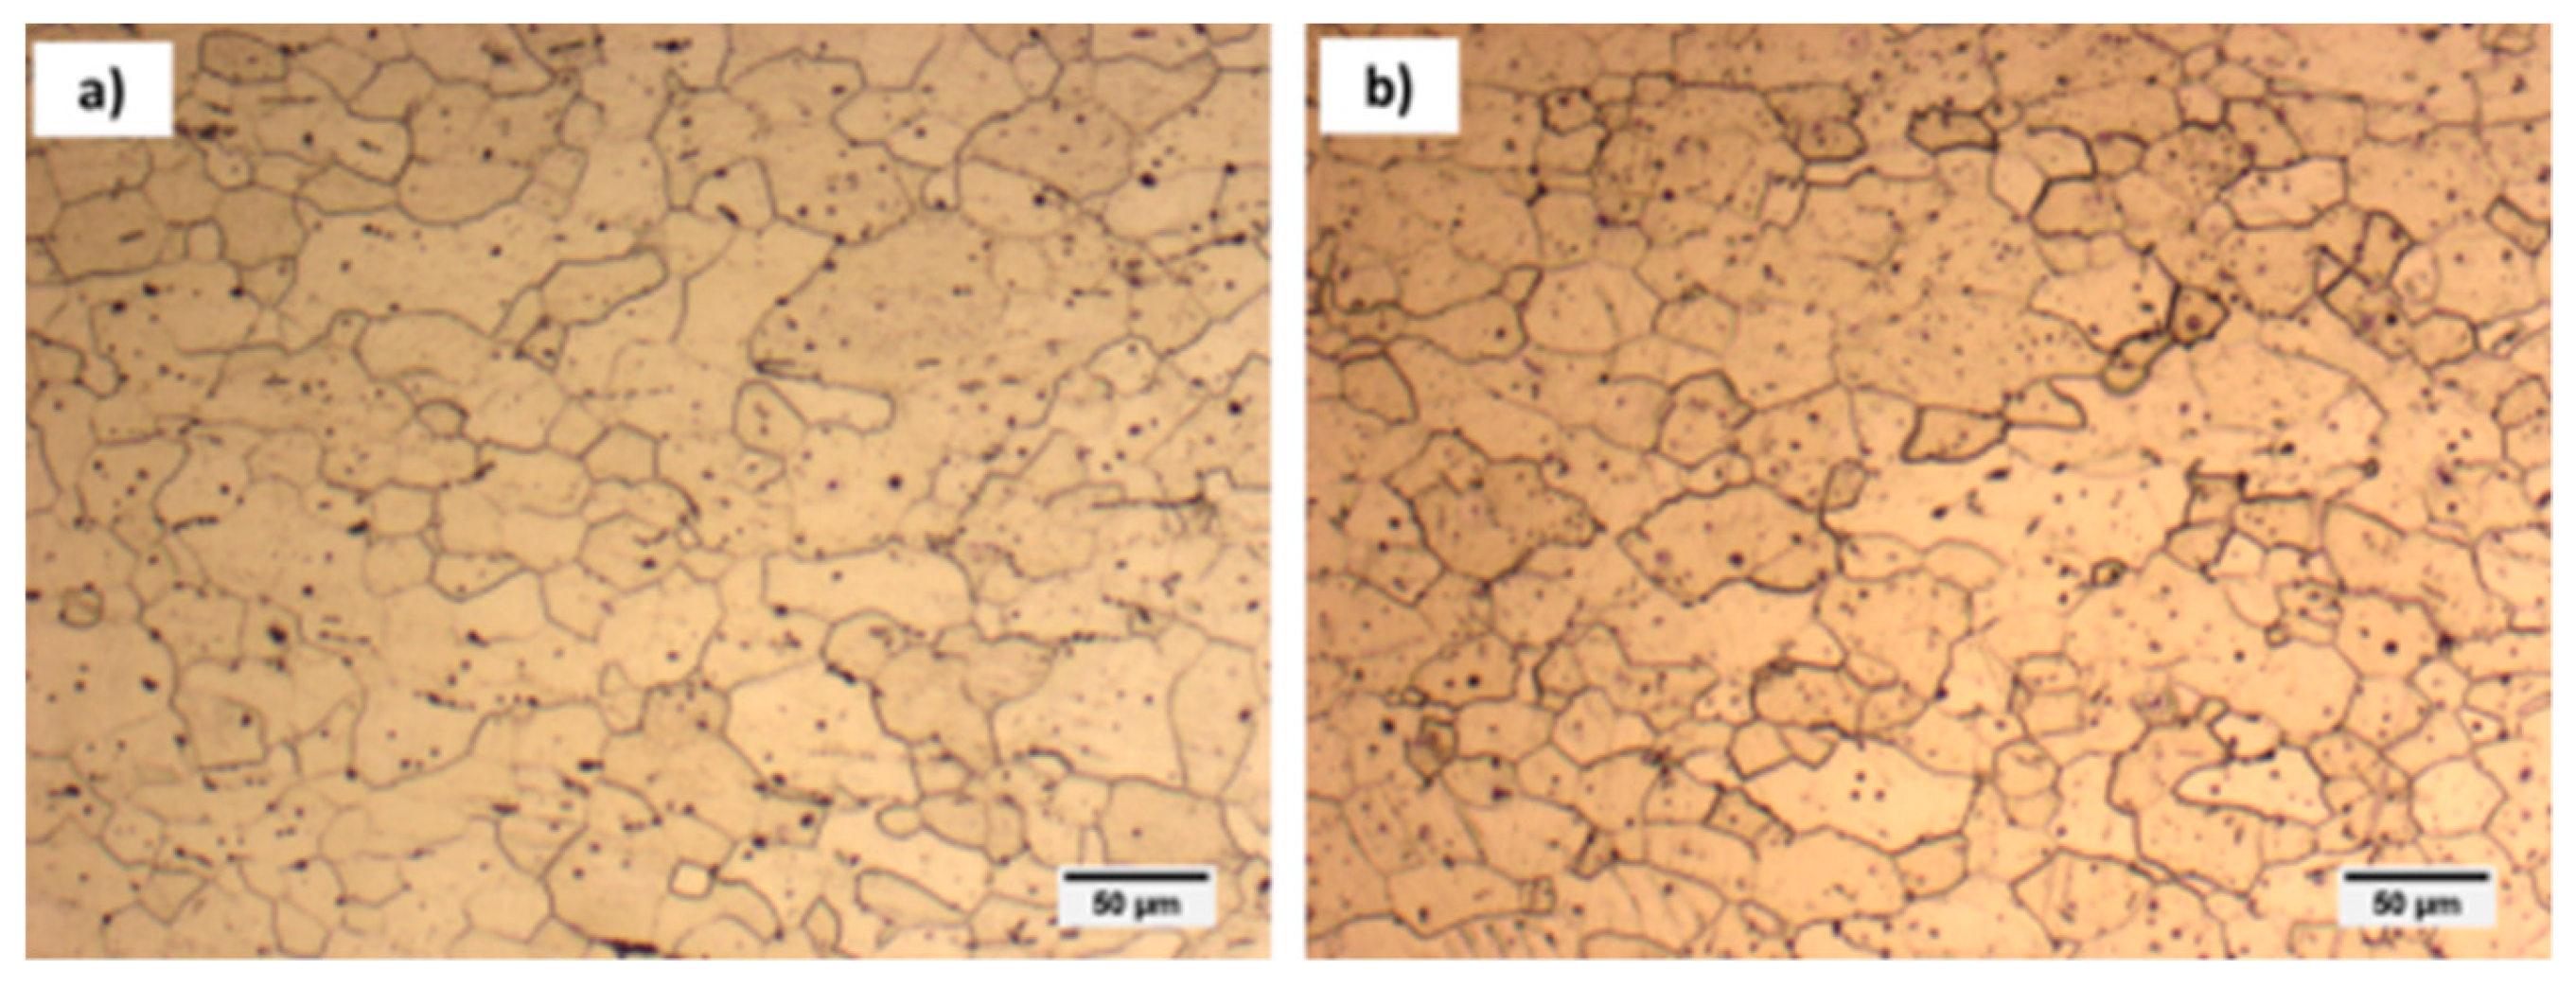
Metallographic analyses were performed with an Optical Microscope (OM, Reichert-Jung MeF3, Leica Microsystems GmbH, Wetzlar, Germany) after Keller etching. Samples obtained from cutting both in longitudinal and transverse directions were prepared and observed in order to investigate the microstructure.
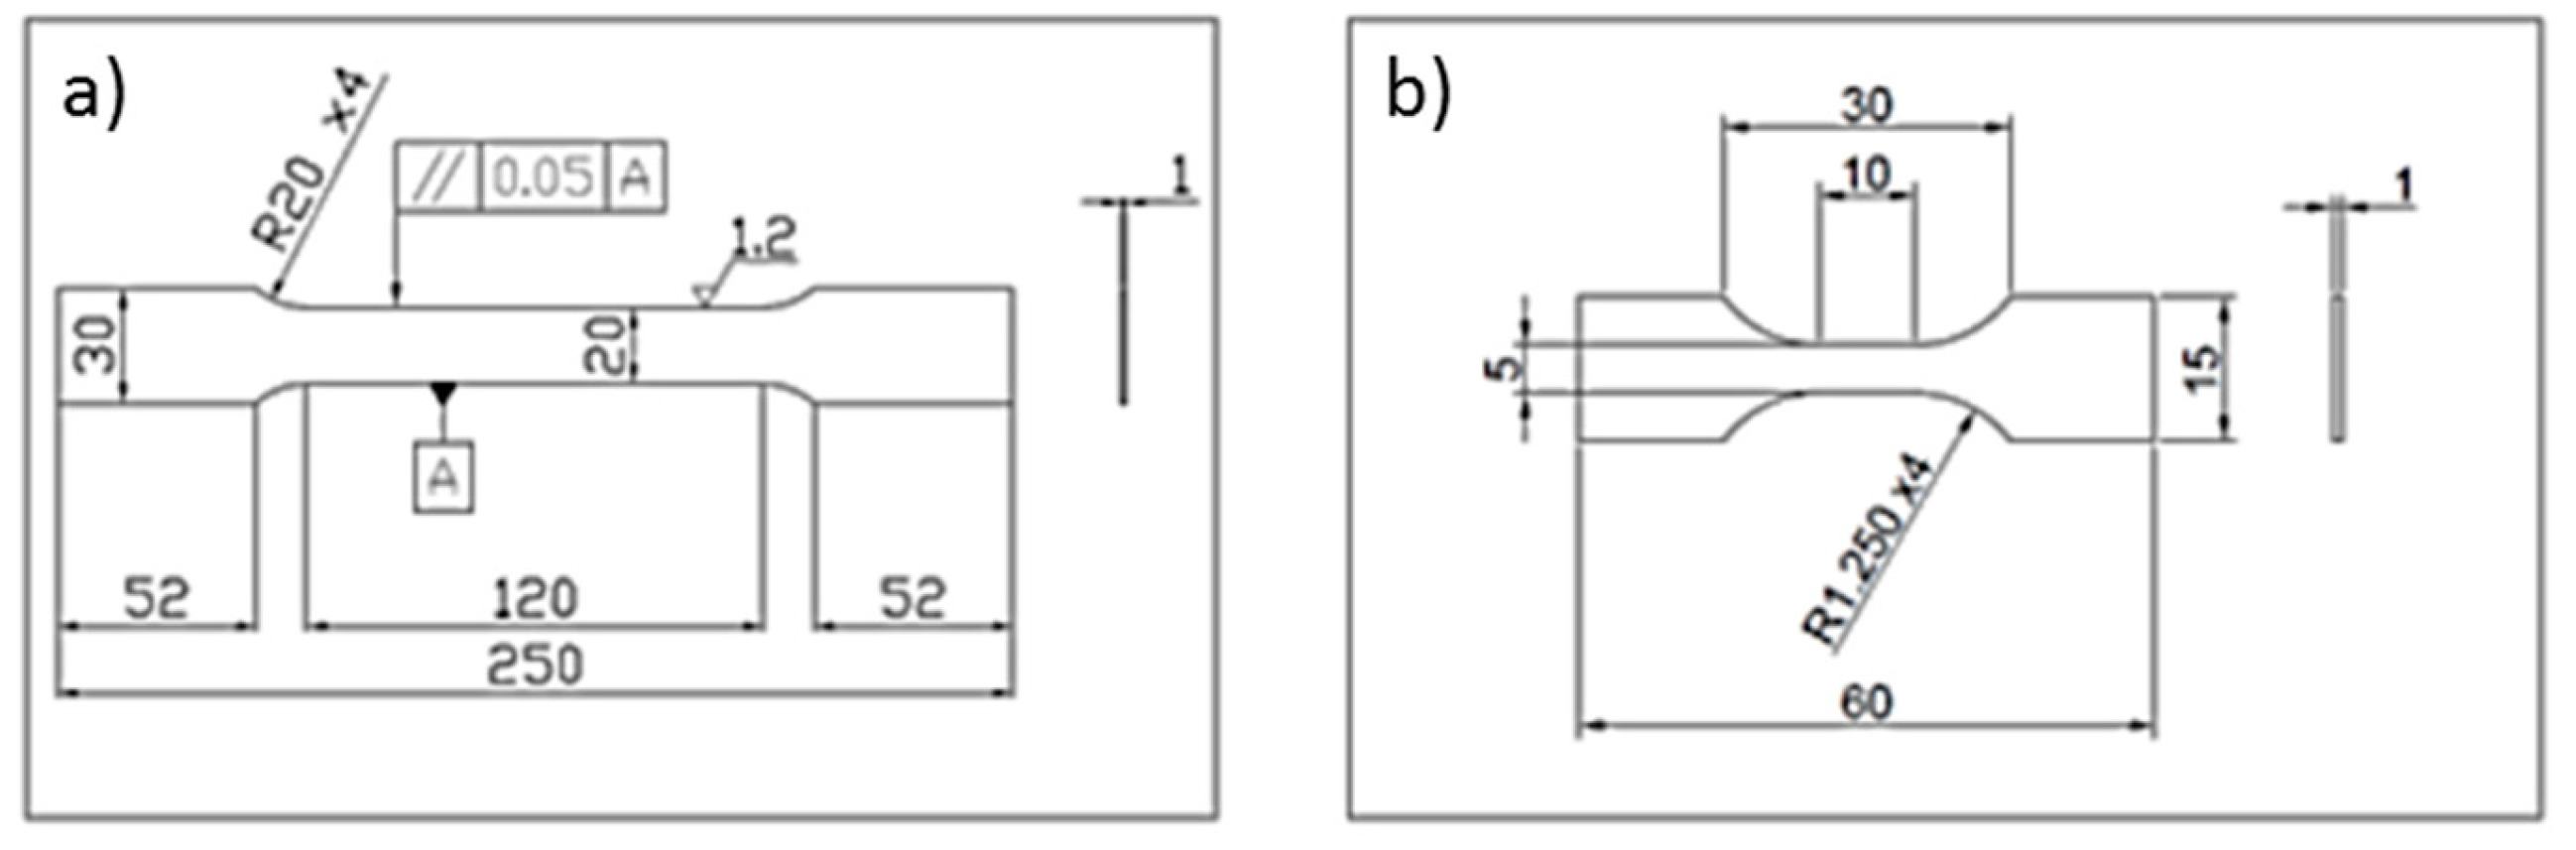
Samples for static and dynamic tests were cut, by using an abrasive jet, from the same aluminum sheet in longitudinal, transverse and diagonal direction (0°, 90°, 45°), in respect to the rolling direction. Three samples per type and direction were produced. Samples for the static tensile test were produced,
Figure 1, according to the standard ISO 6892-1. These samples are flat with the following dimensions:
80 mm gauge length, 120 mm calibrated length, 20 mm width, 1 mm thickness (standard specimen)
10 mm gauge length, 10 mm calibrated length, 5 mm width, 1 mm thickness (small specimen)
The choice of these two different dimensions was done to determine the influence of size effects on the tensile results. In fact, the gauge lengths of 80 mm, together with a longer calibrated length, is commonly adopted in standard tensile tests on sheet metal, while the 10 mm gauge length, equal to the calibrated length, was chosen to compare the results of the static tensile tests with those of the dynamic ones.
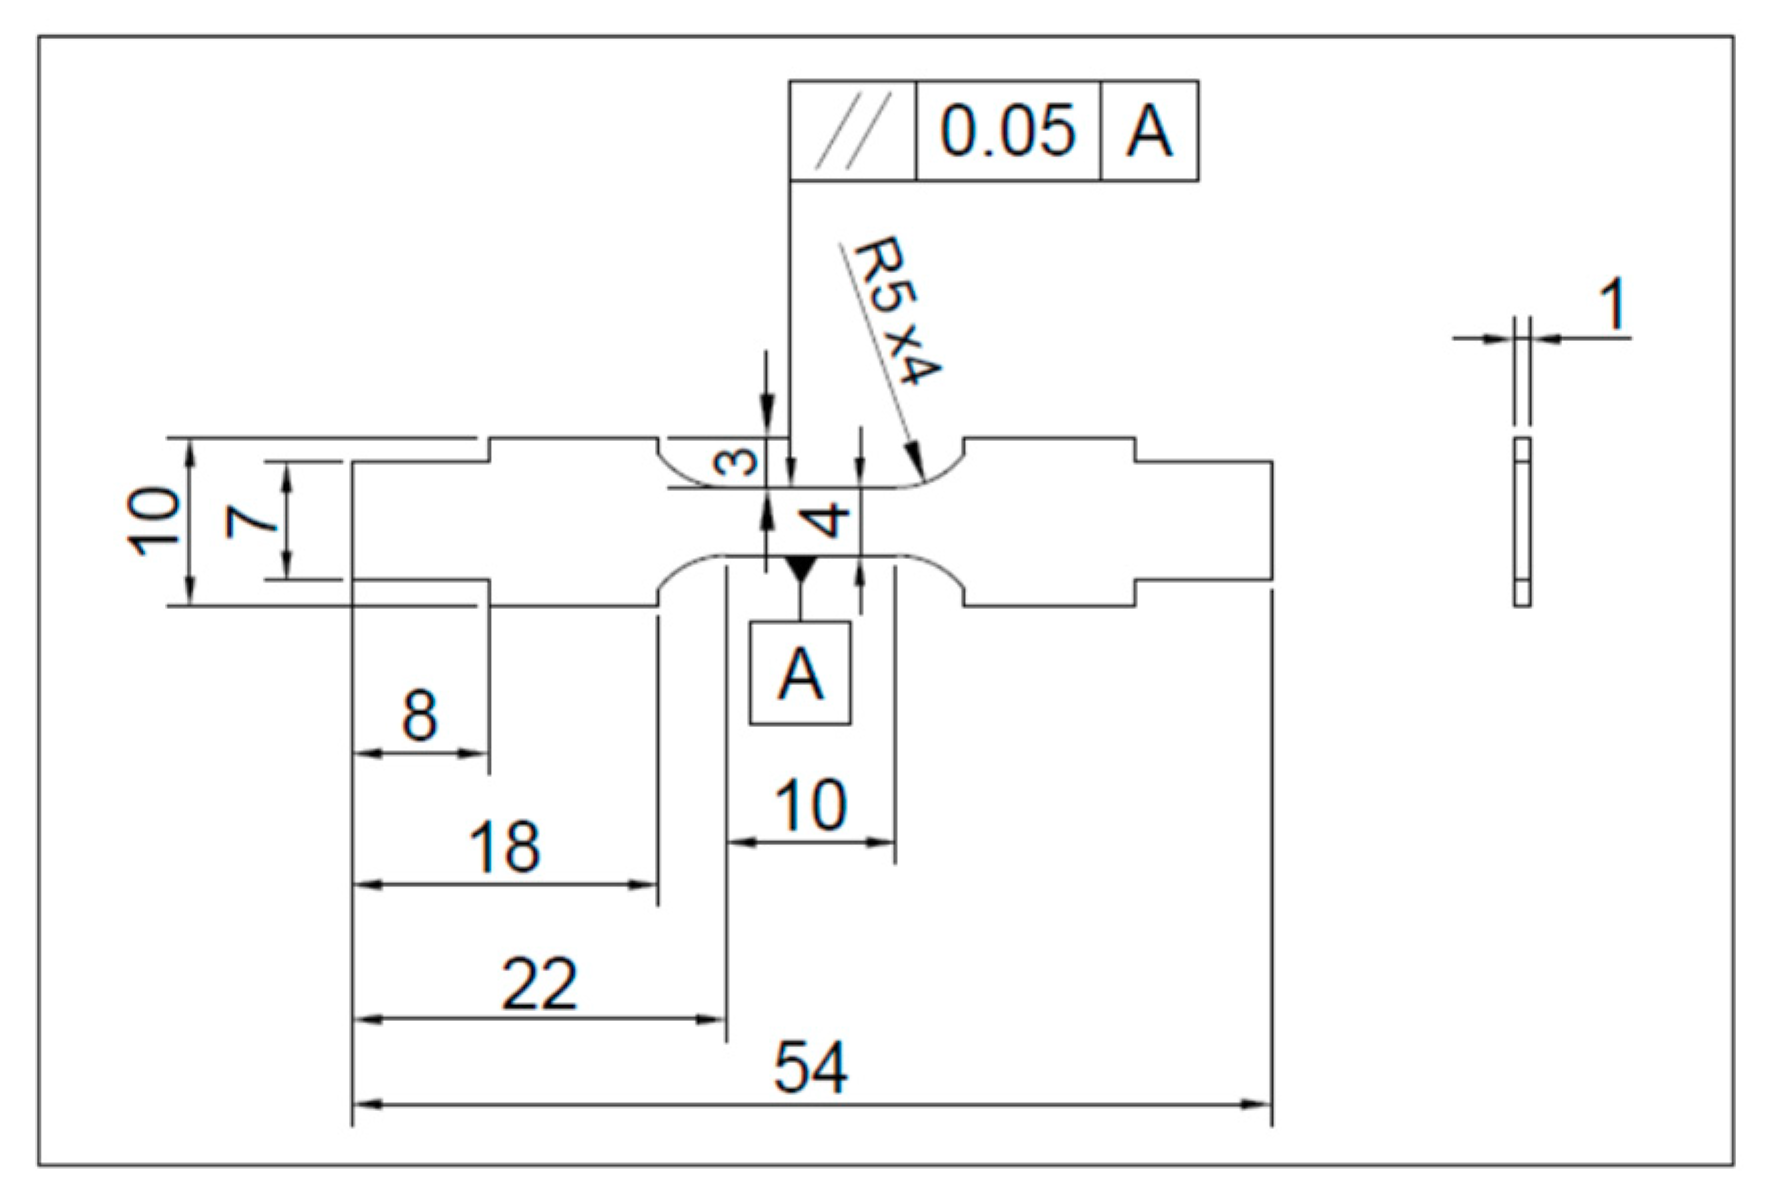
The dynamic tests were conducted with a modified Hopkinson bar (MHB) device (custom made), which requires a sample with 10 mm gauge length and 4 mm minimum width (
Figure 2). These specimens were taken from sheet positions next to those of the static tests, and had the same thickness.
The material was immediately tested in the supplied condition (T4 temper).
However, this alloy is designed to achieve the highest mechanical properties after the paint bake-cycle. In fact, this cycle induces a precipitation hardening by nucleation and growth of fine, closely distributed particles of metastable precipitating phases (Guinet–Preston types).
Therefore, in order to simulate the paint bake-cycle, before the mechanical and metallographic tests, six samples for every cutting direction were artificially aged at 180 °C for 20 min (producing an artificial ageing effect correspondent to the T6 temper) and subsequently statically and dynamically tested.
The tensile static tests (strain rate ≈ 10−3 s−1), for samples with gauge length of 80 mm, were performed by an electromechanical universal testing machine (Galdabini SpA, Cardano al Campo (VA), Italy) with 200 kN maximum load capacity. Those for samples with gauge length of 10 mm were performed by an Instron hydraulic machine (Instron, Norwood, MA, USA) with 20 kN maximum load. A video-extensometer was used in order to measure the strain on the specimen gauge length. The initial gauge length of each sample was marked with a thin indelible line to verify, after the test, the accuracy of the final length values performed through the video-extensometer.
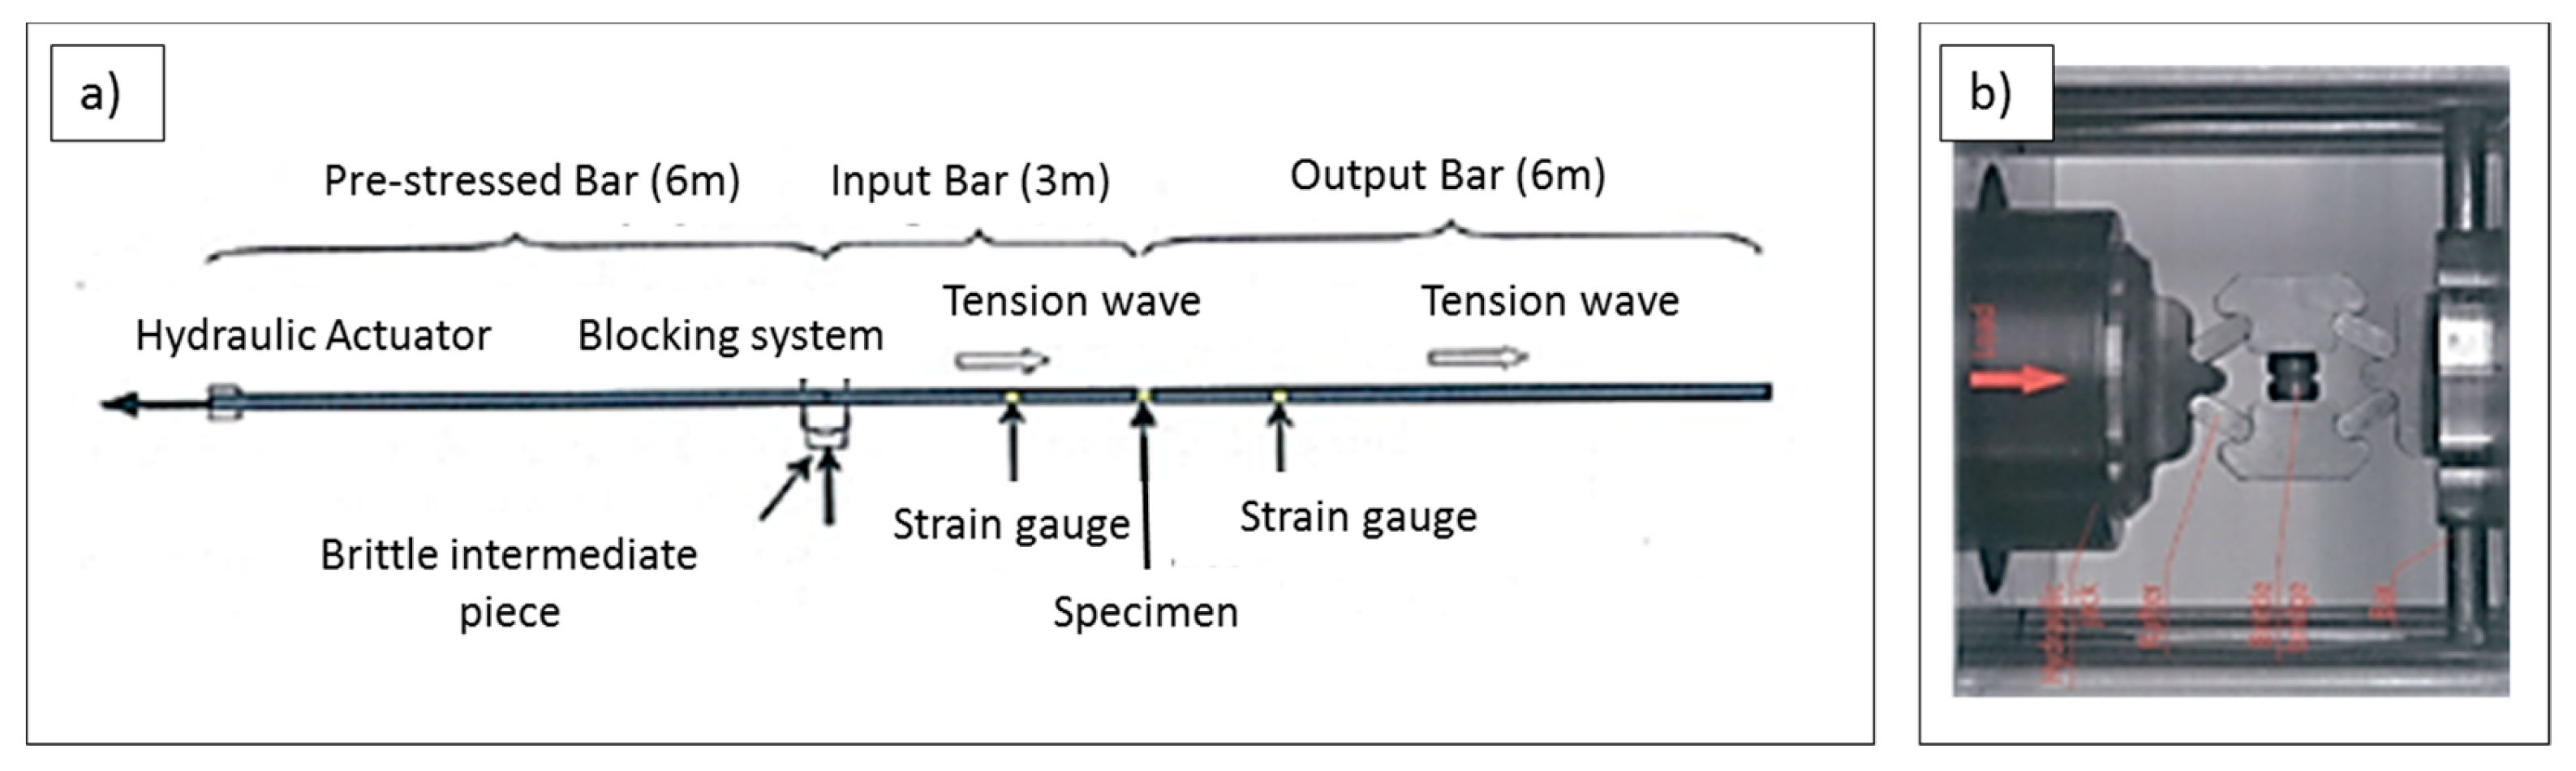
The high strain rate tests were carried out at 500 s
−1 strain rate on a modified Hopkinson bar device, i.e., the tension version developed by Albertini and Montagnani in the 1970s and nowadays widely used [
10,
19]. The device adopted for the high strain rate tests has a total length of 15 m and its scheme is shown in
Figure 3. The left-hand part of the input bar is pre-stressed by applying an increasing load, until, at a well-defined force value, the brittle intermediate piece (shown in the right box in
Figure 3) breaks, the blocking system is suddenly released, and the tensile stress is rapidly applied to the right-hand side of the input bar, which is connected to the specimen.
3. Results and Discussion
The optical microscopy (OM) metallographic analysis of AA6016 T4 sheets, observed in both longitudinal and transverse rolling directions, shows a homogeneous grain distribution without preferred orientation (
Figure 4) as confirmed from other authors after solution heat treatment [
20].
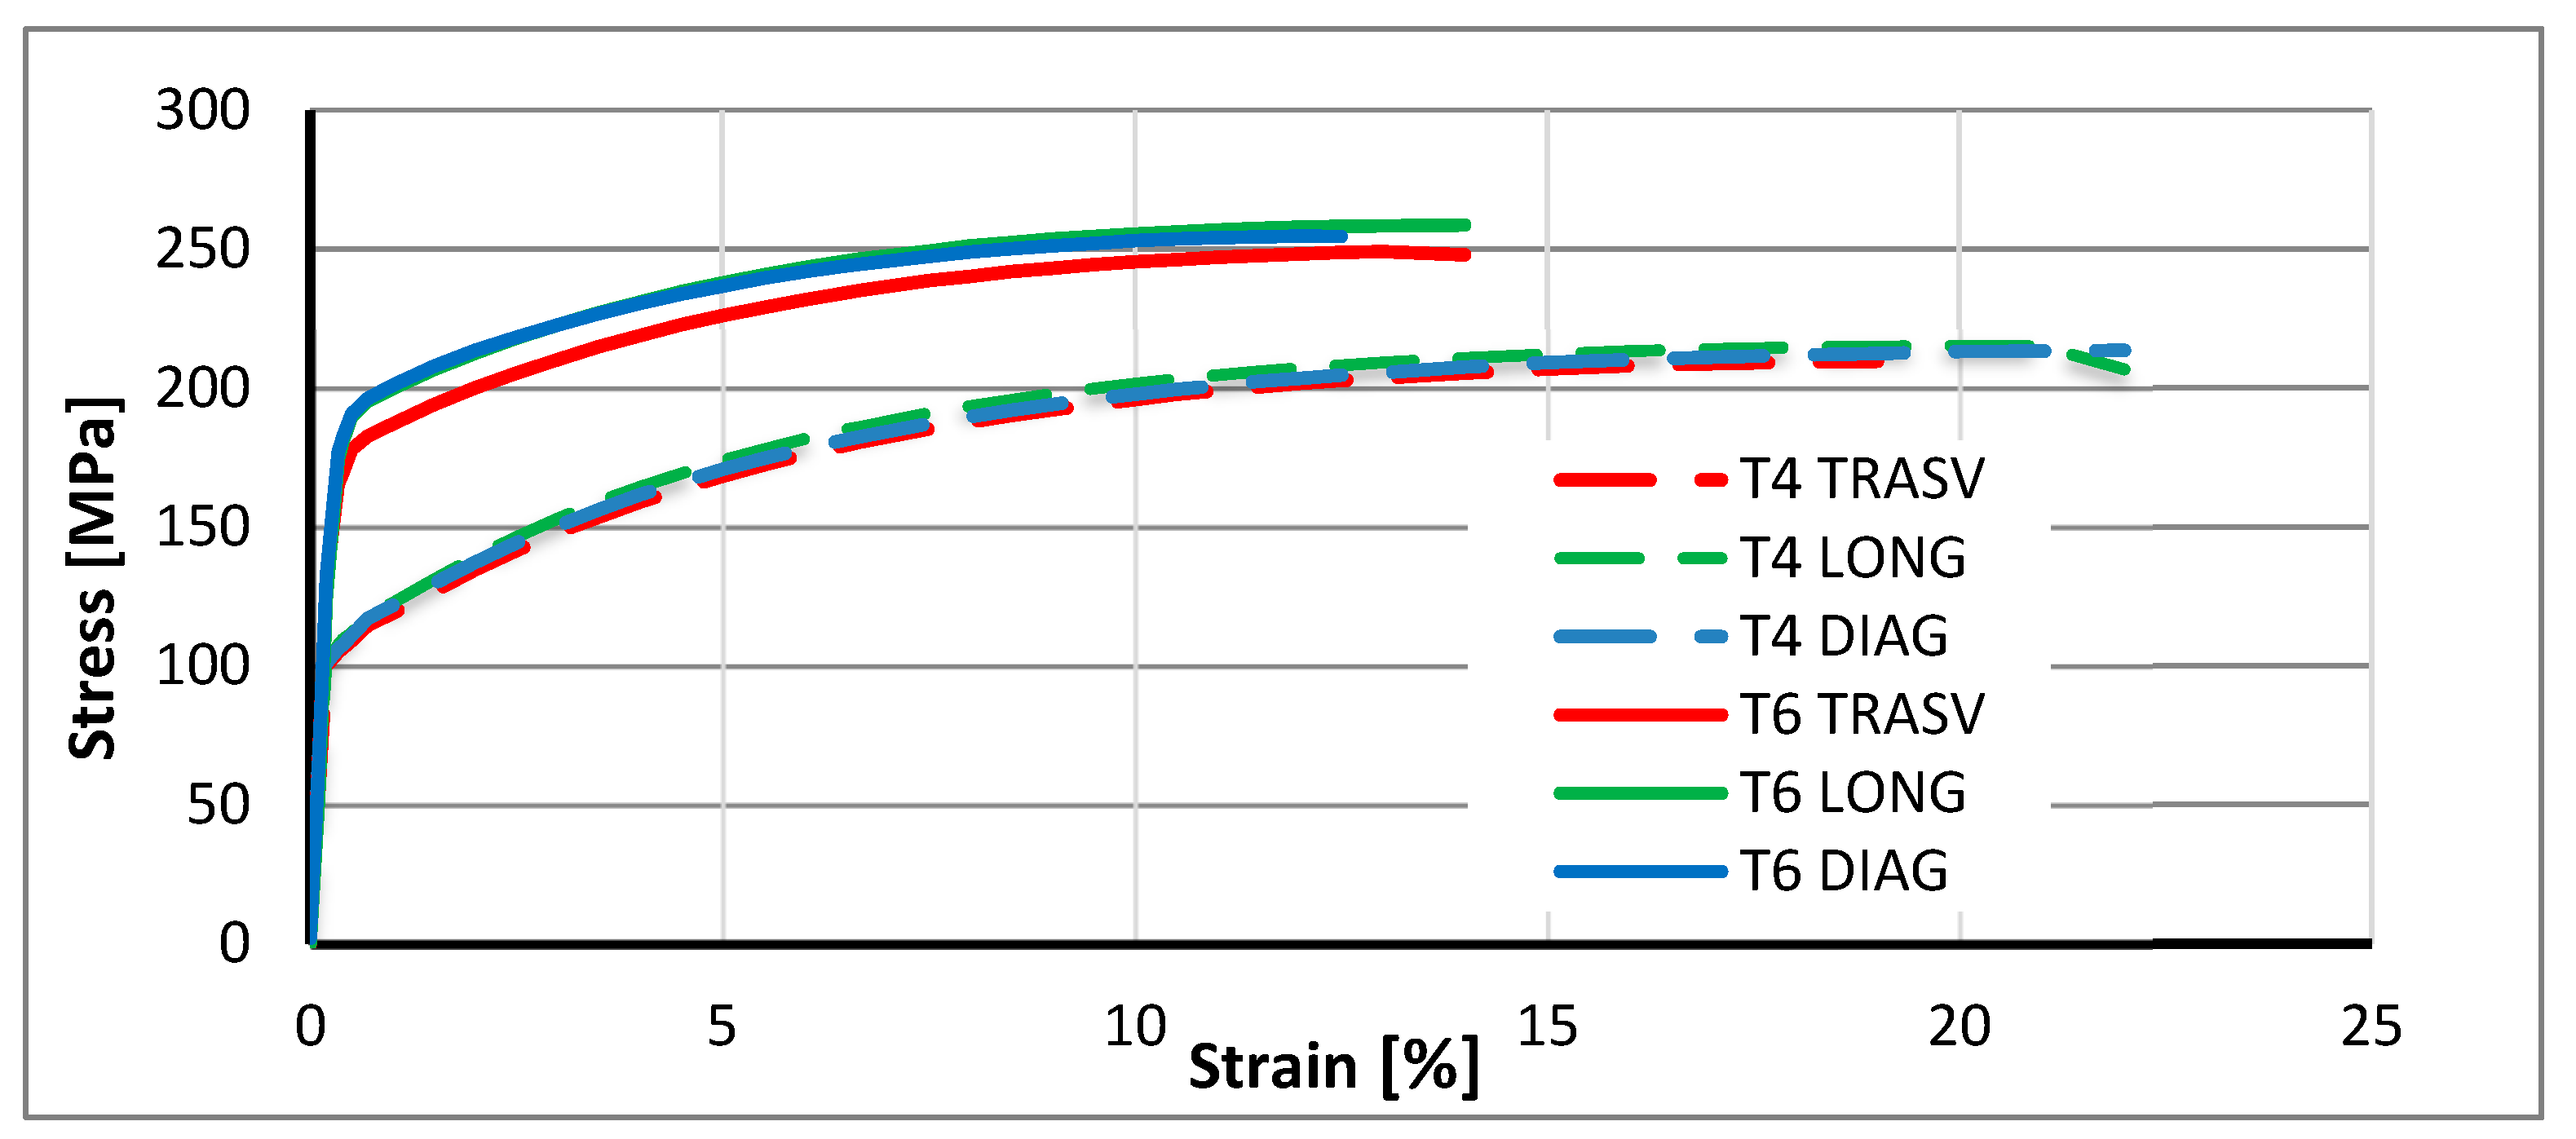
The static tensile tests, conducted on specimens both in the supplied T4 condition and in the simulated paint bake condition (T6 temper), always evidence a reduced scattering of the raw data with a substantial overlap of the curves obtained from repeated samples. In
Figure 5, the curve of one representative sample is reported for every tested direction.
The comparison of the tensile curves among the three different tested directions also shows a substantial overlap, thus evidencing a nearly isotropic behavior. On the other hand, a small anisotropy, with a variation of the yield strength of about 1.4%, was observed by Pham et al. [
21] on 1.2 mm thick sheets of the same alloy, but with possible slightly different ageing time. The here observed behavior is justifiable, because the T4 treatment provokes, in the solution heat treating temper condition, a complete re-crystallization of the grains and produces a homogeneous microstructure in the sheet. Only the specimens in T6 temper condition, tested in the transverse direction, show an around constant slight decrease of strength in the whole plastic field, in respect to those tested in the longitudinal and diagonal directions.
In
Figure 5, it is clearly evident that all the specimens did not show an evident elongation after the ultimate tensile strength (UTS) was reached. On the contrary, the load drops suddenly as the fracture appears.
The average yield strength (YS), ultimate tensile strength (UTS), and elongation at fracture (EF) values obtained from the static tensile tests, on T4 and T6 temper conditions, are reported in
Table 2 together with the percentage change of the same three values between the two temper treatments.
All the mechanical properties obtained in the case of static test of AA6016 alloy in T4 temper are in agreement with Standard EN 485-2. In [
21] the reported YS values for the same alloy in the same temper treatment (T4) are around 50% higher than those obtained in the present research, probably because our alloy was supplied for automotive applications and optimized to meet the best properties after the paint baking process.
The curves obtained for short (10 mm) and long (80 mm) specimens overlap almost completely, for both the T4 and T6 treatments.
Therefore, these results confirm the possibility to compare both stress and elongation at fracture values between the specimens of dynamic tests (usually reduced in length) those of static ones (generally longer). This possibility, despite of the different test method and instrument employed, was also suggested by Chen et al. [
22].
The dynamic tensile tests were performed on three samples for each of the three rolling directions in the T4 and T6 temper conditions. The raw data of the dynamic curves are generally characterized by marked oscillations in the elastic–plastic transition zone because the sudden applied load is not homogeneous along the specimen length and the deformation recorded by the strain gauge stations is often unstable [
14]. Two representative engineering raw curves of samples taken in longitudinal rolling direction, for the T4 and T6 treatments, as obtained by the dynamic tests, are reported in
Figure 6. At the beginning of the test, a spike followed by a sudden stress drop is usually recorded, and a final smoothed wavering trend is shown.
The raw results show similar behavior for the three repeated specimens of each type, in term of recorded stress and strain obtained for all the different sample conditions. The raw data of the tensile tests, reported in
Figure 6, are chosen as representative samples showing intermediate behavior for every type of tested conditions. In
Figure 6 the verticalaxis is set to better evidence the strain hardening behavior of the static and dynamic tests, neglecting the evident stress maximum recorded at the beginning of the dynamic test.
In order to obtain comparable data for researchers and useful ones for designers, it is required, especially in the case of dynamic tests, to fit the engineering raw data with an approximation equation in the plasticity range, before strain localization (necking), in order to obtain smooth representative strain hardening curves.
The approximation adopted in this work is the Swift-Voce hardening model (Equation (1)), subsequently denoted as ‘S-V approximation’.
This equation is a linear combination of the Swift (Equation (2)) and Voce (Equation (3)) isotropic hardening laws [
23,
24,
25], balanced with the weighting factor α.
The S-V approximation has been recently used by other authors [
21] and compared with different models (e.g., Swift, Voce, Hockett-Sherby, Ghosh, and Kim-Tuan) evidencing good results for Al6016 alloy.
The hardening parameters of the Swift (Equation (2)) and Voce (Equation (3)) laws,
and
were identified using the non-linear least square fitting method on the raw data for both the static and dynamic tests, and are reported in
Table 3. The reported parameters were calculated for the specimens shown in
Figure 6. The parameters were optimized for the two approximation models and were combined with a weighting factor α of 0.7.
The same fitting approach was also adopted in the case of the static raw data. This approach allows a better comparison of the strain hardening behavior, by comparing the calculated SV equation parameters. Moreover, the designers need these last values in the BIW components design, in stamping process design as well as in crash simulation software.
The average YS, UTS and EF values obtained from the dynamic tensile tests performed on AA6016 samples in T4 and T6 temper conditions are reported in
Table 4, together with the percentage change of the same three values for the two temper treatments.
The comparison of the results between dynamic and static tests shows, for the specimens tested in the T4 temper, a relative increase of 54% in the yield strength, of 13% in the ultimate tensile strength and of 75% in the elongation at fracture, going from the static to the dynamic tests.
In the case of the T6 temper, the same comparison of results between dynamic and static tests shows 38% increase in the yield strength, 14% in the ultimate tensile strength, and 105% in the elongation at fracture.
Aluminum alloys exhibit stacking fault energy values higher than other metallic alloys (Cu and stainless steel); therefore, the plastic deformation process takes place mainly by slipping of compact planes [
26]. In addition, in the case of face-centered cubic lattice materials, it was noted that the flow stress increases by increasing the strain rate; therefore, a higher yield stress is needed to start the plastic deformation. This phenomenon can justify the always evident increases in the resistance characteristics of the material in the case of deformation at high speed [
27,
28]. An increase in the mechanical properties of Al-alloys in dynamic tests, compared to static ones, was also previously observed by the authors on die cast components [
29].
The higher values of elongation at fracture, observed in the dynamic tests, about double for both T4 and T6 temper conditions in respect to quasi-static tensile tests, can be considered the sum of the contributions of the higher amount of uniform elongation at necking and the amount of elongation during necking, until the final fracture. Both contributions can be explained by the fact that the high strain rate tests occur in negligible time and the deformation work, mostly dissipated as thermal energy, has no time to diffuse, thus making the process almost adiabatic. This could lead to a temperature increase in the localized necking zone of the sample. The adiabatic heating of the samples has been demonstrated by other authors [
20] and the error introduced by this approximation can be considered negligible.
The engineering interest of the increase in the uniform strain, in the case of T4 treatment, consists of the possible benefit in the drawing operations (before the painting process and the baking of the paint), while in the case of the T6 treatment, the interest is focused on the crash tests as well as on the behavior of the material in case of vehicle accidents (in this case, the total elongation is the most important parameter).
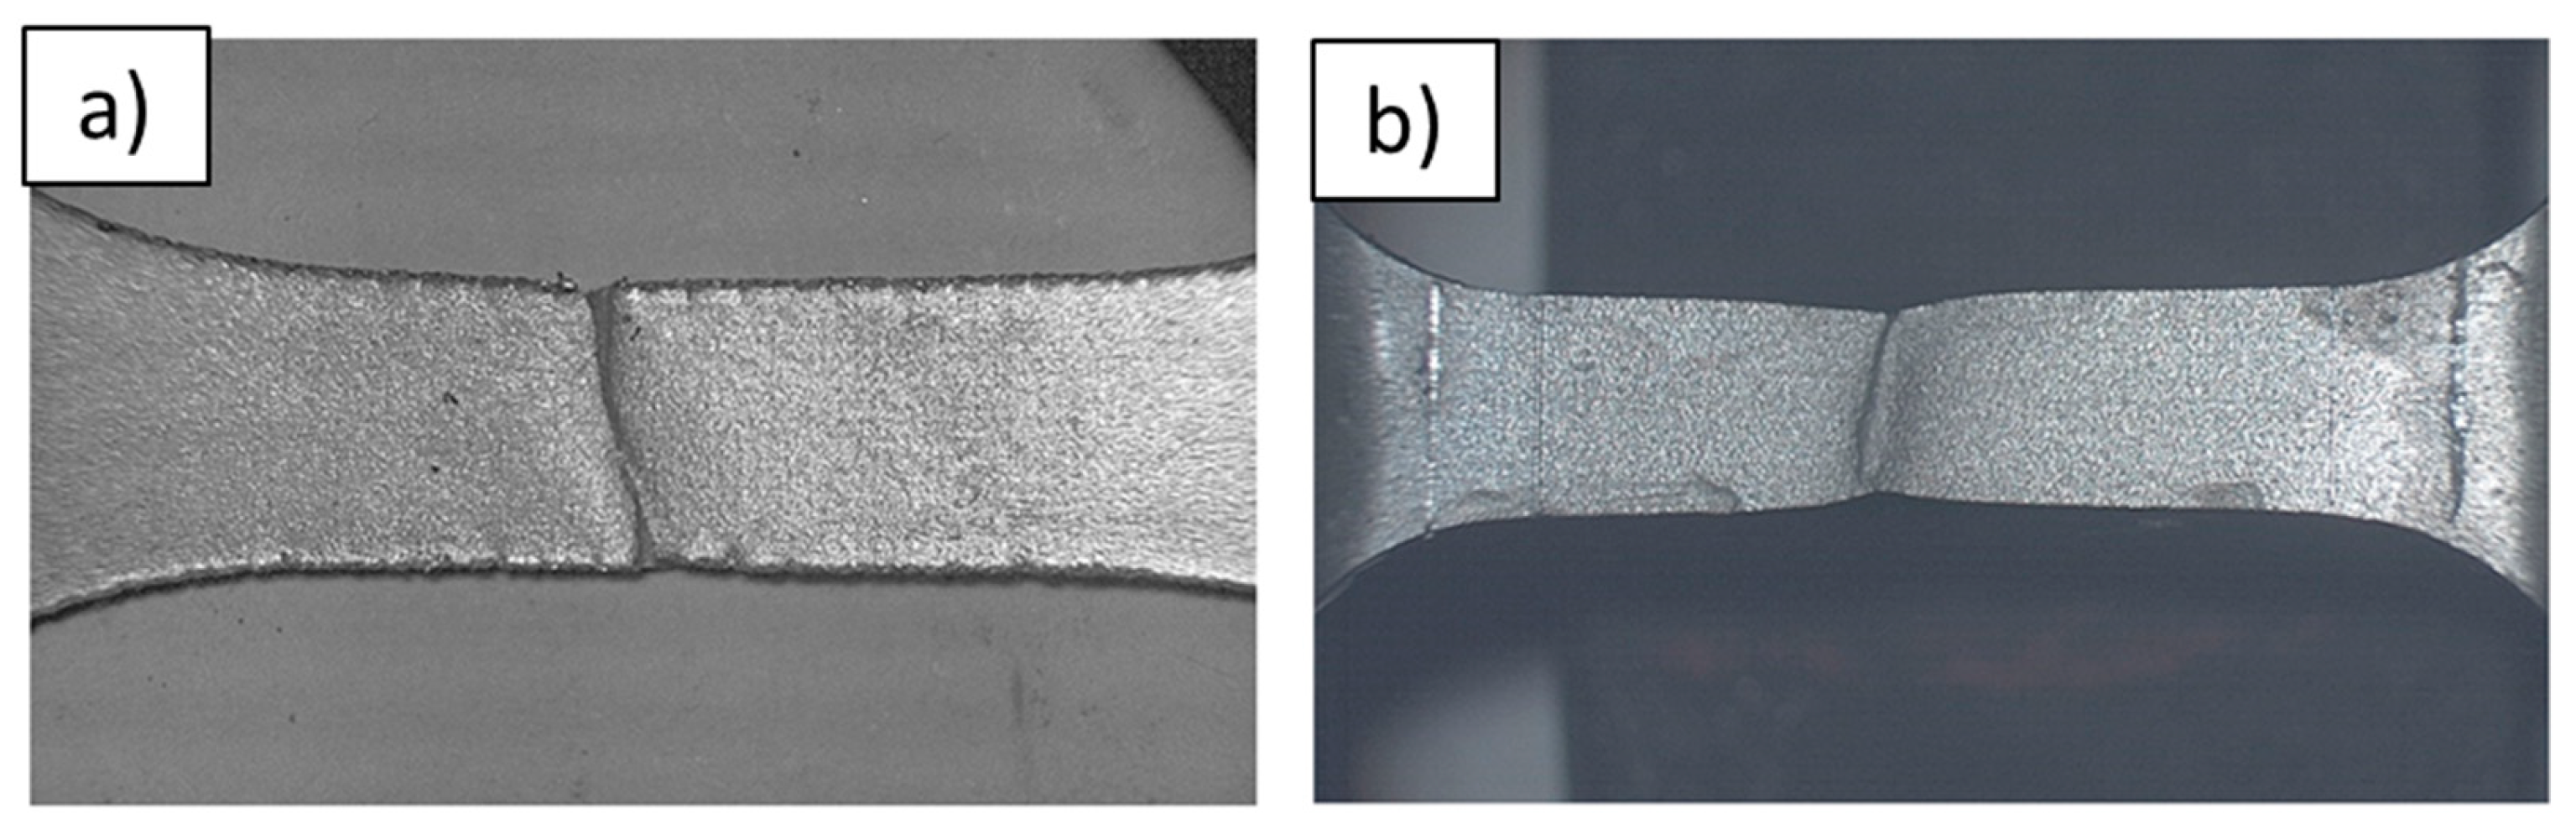
The presence of the necking phenomenon in the dynamic tests, (even if it is almost absent in the static ones), is evident in the stress–strain engineering curves of
Figure 6, and is also confirmed on the longitudinal profiles of specimens, after the tensile tests, shown in
Figure 7.
In the dynamic tests, the deformation during necking (
Figure 7b) can be about 40% more than the deformation at the maximum load; it is instead almost completely absent in the case of static tests.
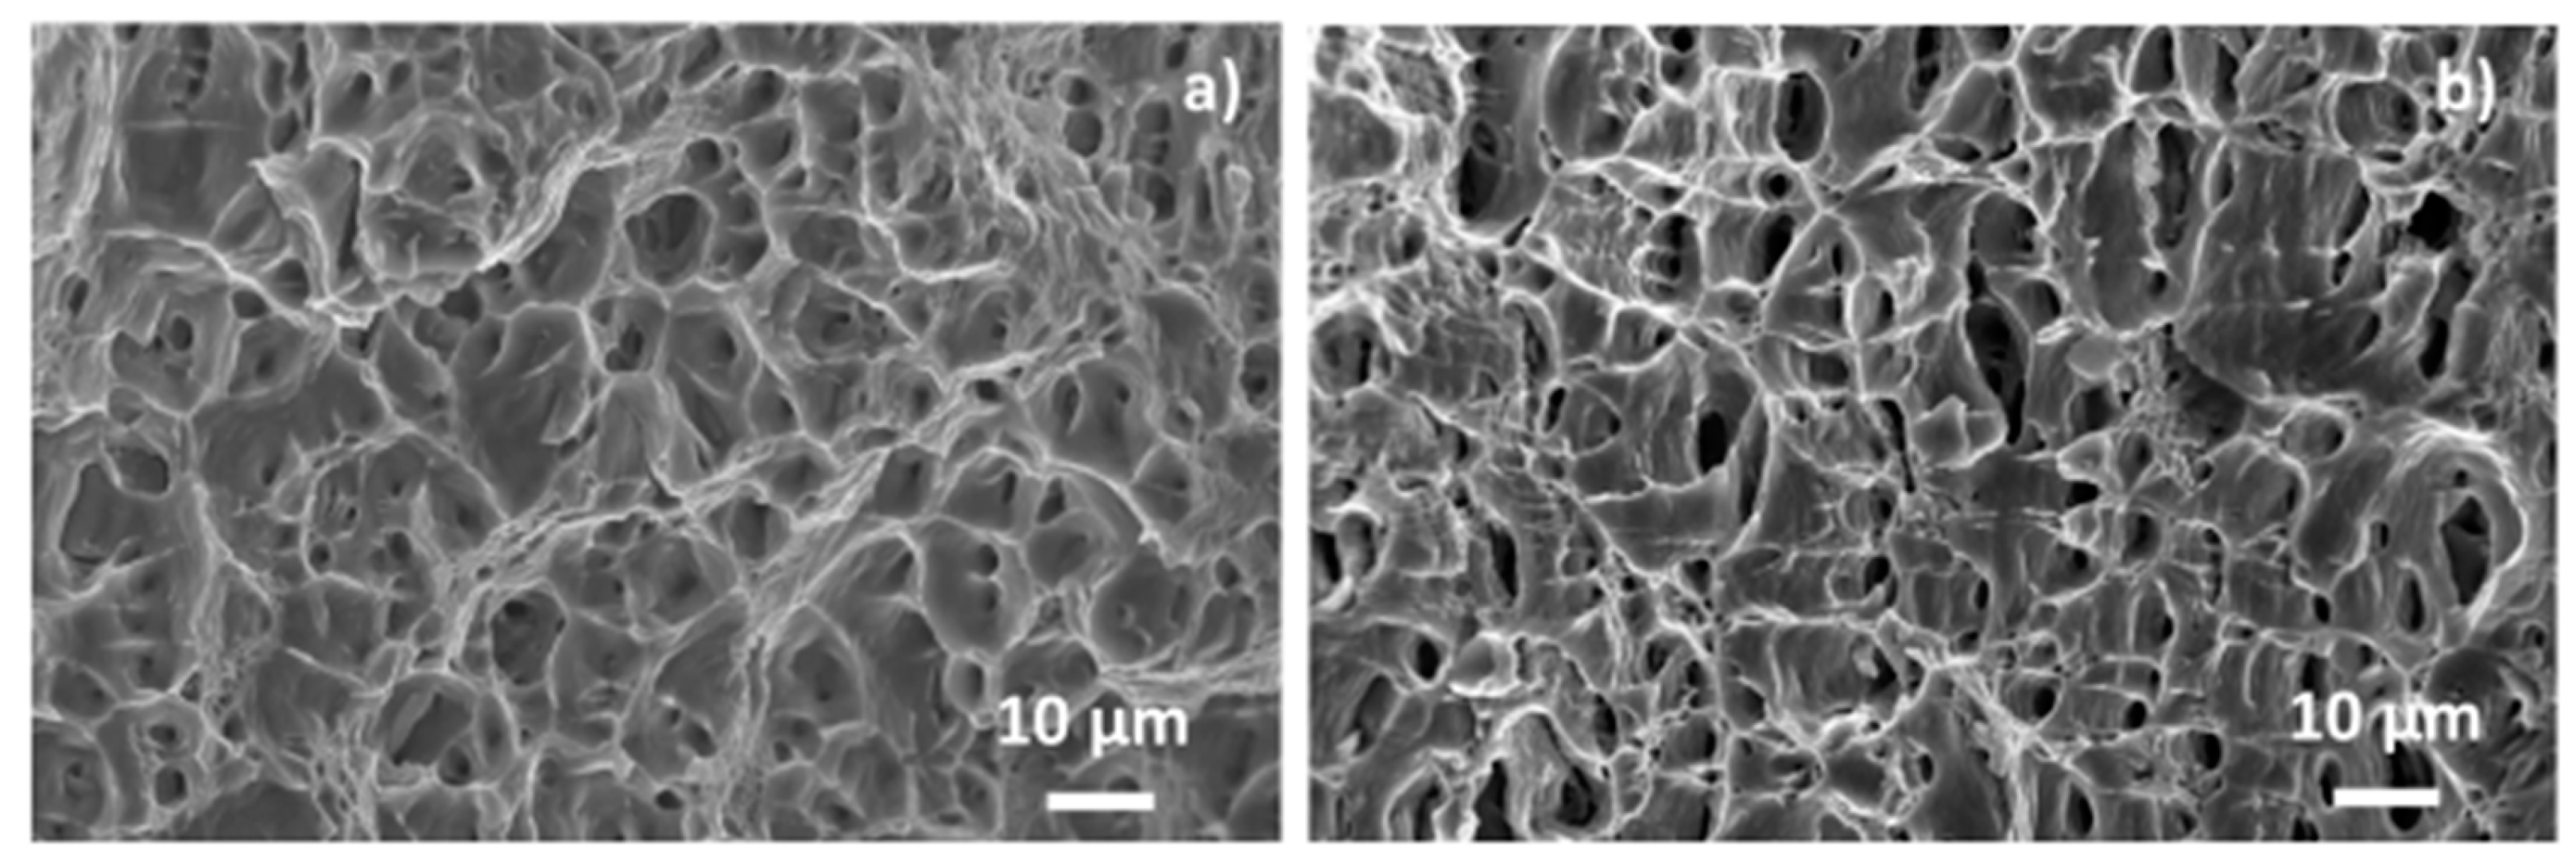
The fracture surfaces were observed by means of field emission scanning electron microscopy (FESEM SUPRA 40, Zeiss, Cohen, Germany) and show a ductile morphology characterized by micro-voids (or dimples,
Figure 8) [
30], which sometimes (images not reported) contain particles of second phases (mainly Si particles).
However, significant differences can be highlighted between them. The fracture surface of samples tested under static conditions shows dimples with the typical morphology resulting from microvoid growth and coalescence (
Figure 8a). On the other hand, the fracture surface of the samples tested under dynamic conditions (
Figure 8b) evidence the presence of microvoid growth in the area of maximum deformation of the neck, but these microvoids did not have the time to coalesce and form a crack propagating in the direction normal to that of maximum stress. This is evidenced by the presence of deformation porosities that develop even below the main fracture surface and are visible in
Figure 8b.

 ,
, 


