Biaxial Tensile Behavior of Commercially Pure Titanium under Various In-Plane Load Ratios and Strain Rates

1
School of Mechanical and Power Engineering, Nanjing Tech University, Nanjing 211816, China
2
Jiangsu Key Lab of Design and Manufacture of Extreme Pressure Equipment, Nanjing 211816, China
*
Author to whom correspondence should be addressed.
Metals 2021, 11(1), 155; https://0-doi-org.brum.beds.ac.uk/10.3390/met11010155
Submission received: 24 November 2020
/
Revised: 7 January 2021
/
Accepted: 11 January 2021
/
Published: 15 January 2021
Abstract
:The aim of the present work is to contribute to the characterization of the biaxial tensile behavior of commercially pure titanium, under various in-plane loading conditions at room temperature, by a non-contact digital image correlation system. Several loading conditions, with load ratio ranging from 4:0 to 0:4 and displacement rate ranging from 0.001 to 0.1 mm/s, are examined. It is found that the yield strength and ultimate tensile strength of biaxial sample are greater than that of uniaxial sample, where the equi-biaxial sample shows the highest strength. It is also observed that increase in strain rate leads to remarkable improvement of tensile strength. Fractographic analysis indicates that the shape and size of dimples are load ratio and strain rate dependent. Additionally, a modified Johnson–Cook constitutive model was proposed to account for the effect of strain rate on biaxial tensile deformation. The experimental results are in good agreement with the simulated results, indicating that the proposed model is reliable to predict biaxial tensile deformation of commercially pure titanium at different strain rates.
1. Introduction
Commercial pure titanium (CP-Ti) has been widely used in aerospace, chemical, and other industries due to its high strength to weight ratio, excellent work hardening ability, and corrosion resistance [1,2]. In the design of such structures, the strength and deformation of these components are generally estimated using uniaxial properties [3,4]. However, in service, these components are more often loaded in more than one direction, i.e., biaxially loaded. It has been recognized that the obtained data from uniaxial test are not adequate to accurately describe the multi-axial deformation [5,6,7], which may induce a misrepresentation of the behavior of engineering structure. Hence, more realistic biaxial tensile testing will give a better understanding for the deformation behavior of a structure.
In the past decades, uniaxial tensile behaviors of materials have been investigated a lot [8,9,10]. Currently, more and more investigations put effort to study the biaxial tensile behavior. Kulawinski et al. [11] investigated a metastable austenitic stainless steel under different biaxial-planar load paths and found the orientation dependent formation of α’-martensite is assumed to cause a combined isotropic and kinematic hardening behavior. Cheng et al. [12] explored the size effect on the yield behavior of metal foil under multiaxial stress states and revealed that both size and shape of the yield locus are influenced by size effect and stress states. Wolf et al. [13,14] calculated the K-factors for cruciform specimens. Kleemola and Ranta-Eskola [15] reported the variation of strain hardening parameters of different sheet metals in uniaxial and biaxial tension. Kubo et al. [16] studied the relation between macroscopic mechanical properties and microstructure under multi-axial deformation loading and found that the differential hardening at the grain level was caused by the crystal rotation. Liu et al. [17] investigated the rate-dependent hardening behavior of dual phase DP600 steel sheet and the strain hardening functions calibrated from both biaxial and uniaxial tensile tests were proposed. Kuwabara et al. [18,19] determined the yield surface of a cold-rolled steel sheet and an aluminum alloy sheet using abrupt strain path change in biaxial tensile tests. Xiao et al. [20,21] performed biaxial tensile tests on TA1 titanium alloy at different angles, with respect to the material rolling direction and found that the limit strain was anisotropic in nature. In addition, Srinivasan et al. [22] carried out equi-biaxial tensile tests on CP-Ti and showed that the ductility decreases and the strength increases under biaxial loading. Although the tensile behavior under equi-biaxial loading has been the focus, investigations about the effect of biaxial load ratio and strain rate on CP-Ti are rarely performed. Ambroziak et al. [23] and Broomhead et al. [24] investigated the biaxial tensile behavior of 1202S coated fabric and low carbon steel under various load ratios and strain rates and found that the value of the stress at the specimens’ breaking point and the limit load curve varied with the load ratio and strain rate, which infers that the biaxial tensile response of CP-Ti is expected to be related to the load ratio and strain rate.
In addition, a reliable constitutive model is also essential for the accurate design and manufacture of components. By now, numerous constitutive models have been developed to describe the uniaxial tensile deformation [25,26,27]. However, the applicability of these constitutive models for steels and alloys under biaxial loading is yet to be demonstrated. Delobelle et al. [28] proposed a rheological model to account for the existence of two types of viscoplastic flow in 316 austenite stainless steel under biaxial loading. To the best of authors’ knowledge, there is no study available in the literature that focused on the tensile responses of CP-Ti under various strain rates of biaxial loading. Such a constitutive model will be necessary for design and manufacture of components.
In this work, a set of biaxial tensile data for CP-Ti obtained under various load ratios and strain rates are presented to characterize the biaxial tensile behavior of commercially pure titanium under various in-plane loading conditions. The biaxial tensile responses are comparatively evaluated to demonstrate the effect of load ratio and strain rate. Fractographic features under various loading conditions are also discussed. Additionally, an improved constitutive model is proposed to take into account the effect of strain rate on biaxial tensile behavior of CP-Ti.
2. Materials and Methods
2.1. Material
The material used in this work was a cold-rolled annealed sheet CP-Ti and its chemical compositions are Fe 0.061, C 0.028, N 0.006, H 0.002, O 0.087, and Ti balance (wt.%).
2.2. Tensile Tests
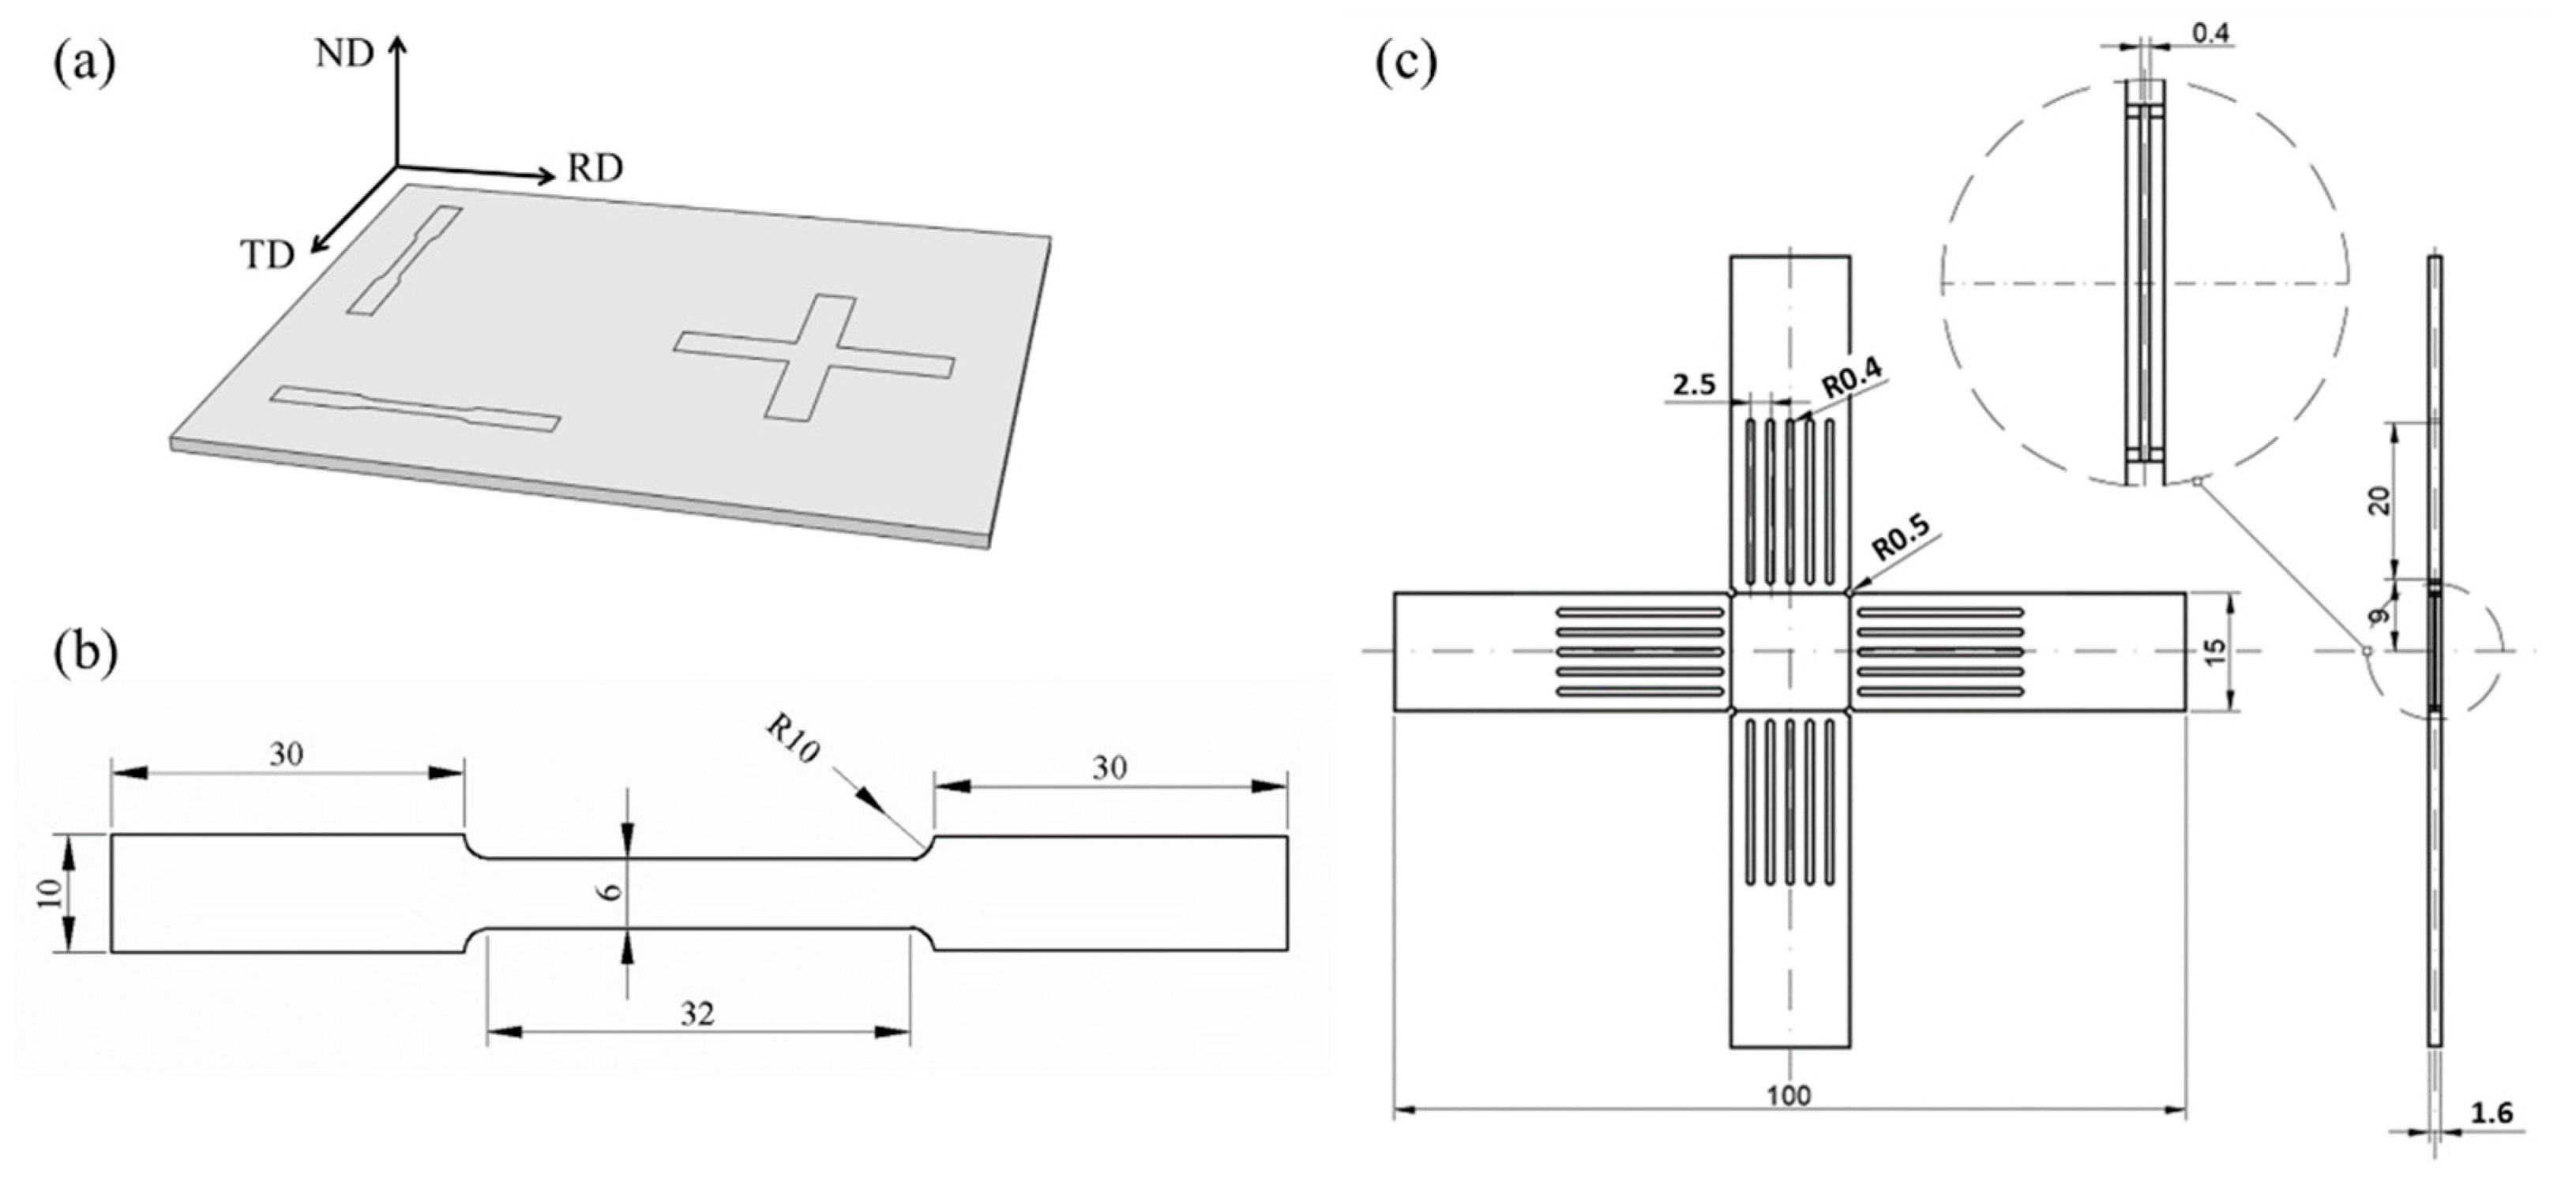
Uniaxial tensile specimens with gauge lengths and thicknesses of 32 × 0.4 mm along the rolling direction (RD) and transverse direction (TD) were cut from the plate, as shown in Figure 1a. Detailed dimensions of the uniaxial tensile specimen are shown in Figure 1b. To perform biaxial tensile tests, an improved cruciform specimen was developed according to standard BS ISO 16842 [29], as shown in Figure 1c, which has been proved to be able to provide homogeneous strain distribution in the gauge section [30]. The overall dimensions of the biaxial specimens are 100 × 100 × 1.6 mm with gauge area thickness of 0.4 mm. The cruciform sample was cut from the plate using wire-cut electric discharge machining, and then the surface of the cruciform sample was mechanically polished. The central zone was thinned by a milling machine. During all manufacture process, cooling liquid was used to avoid the effect of heat.
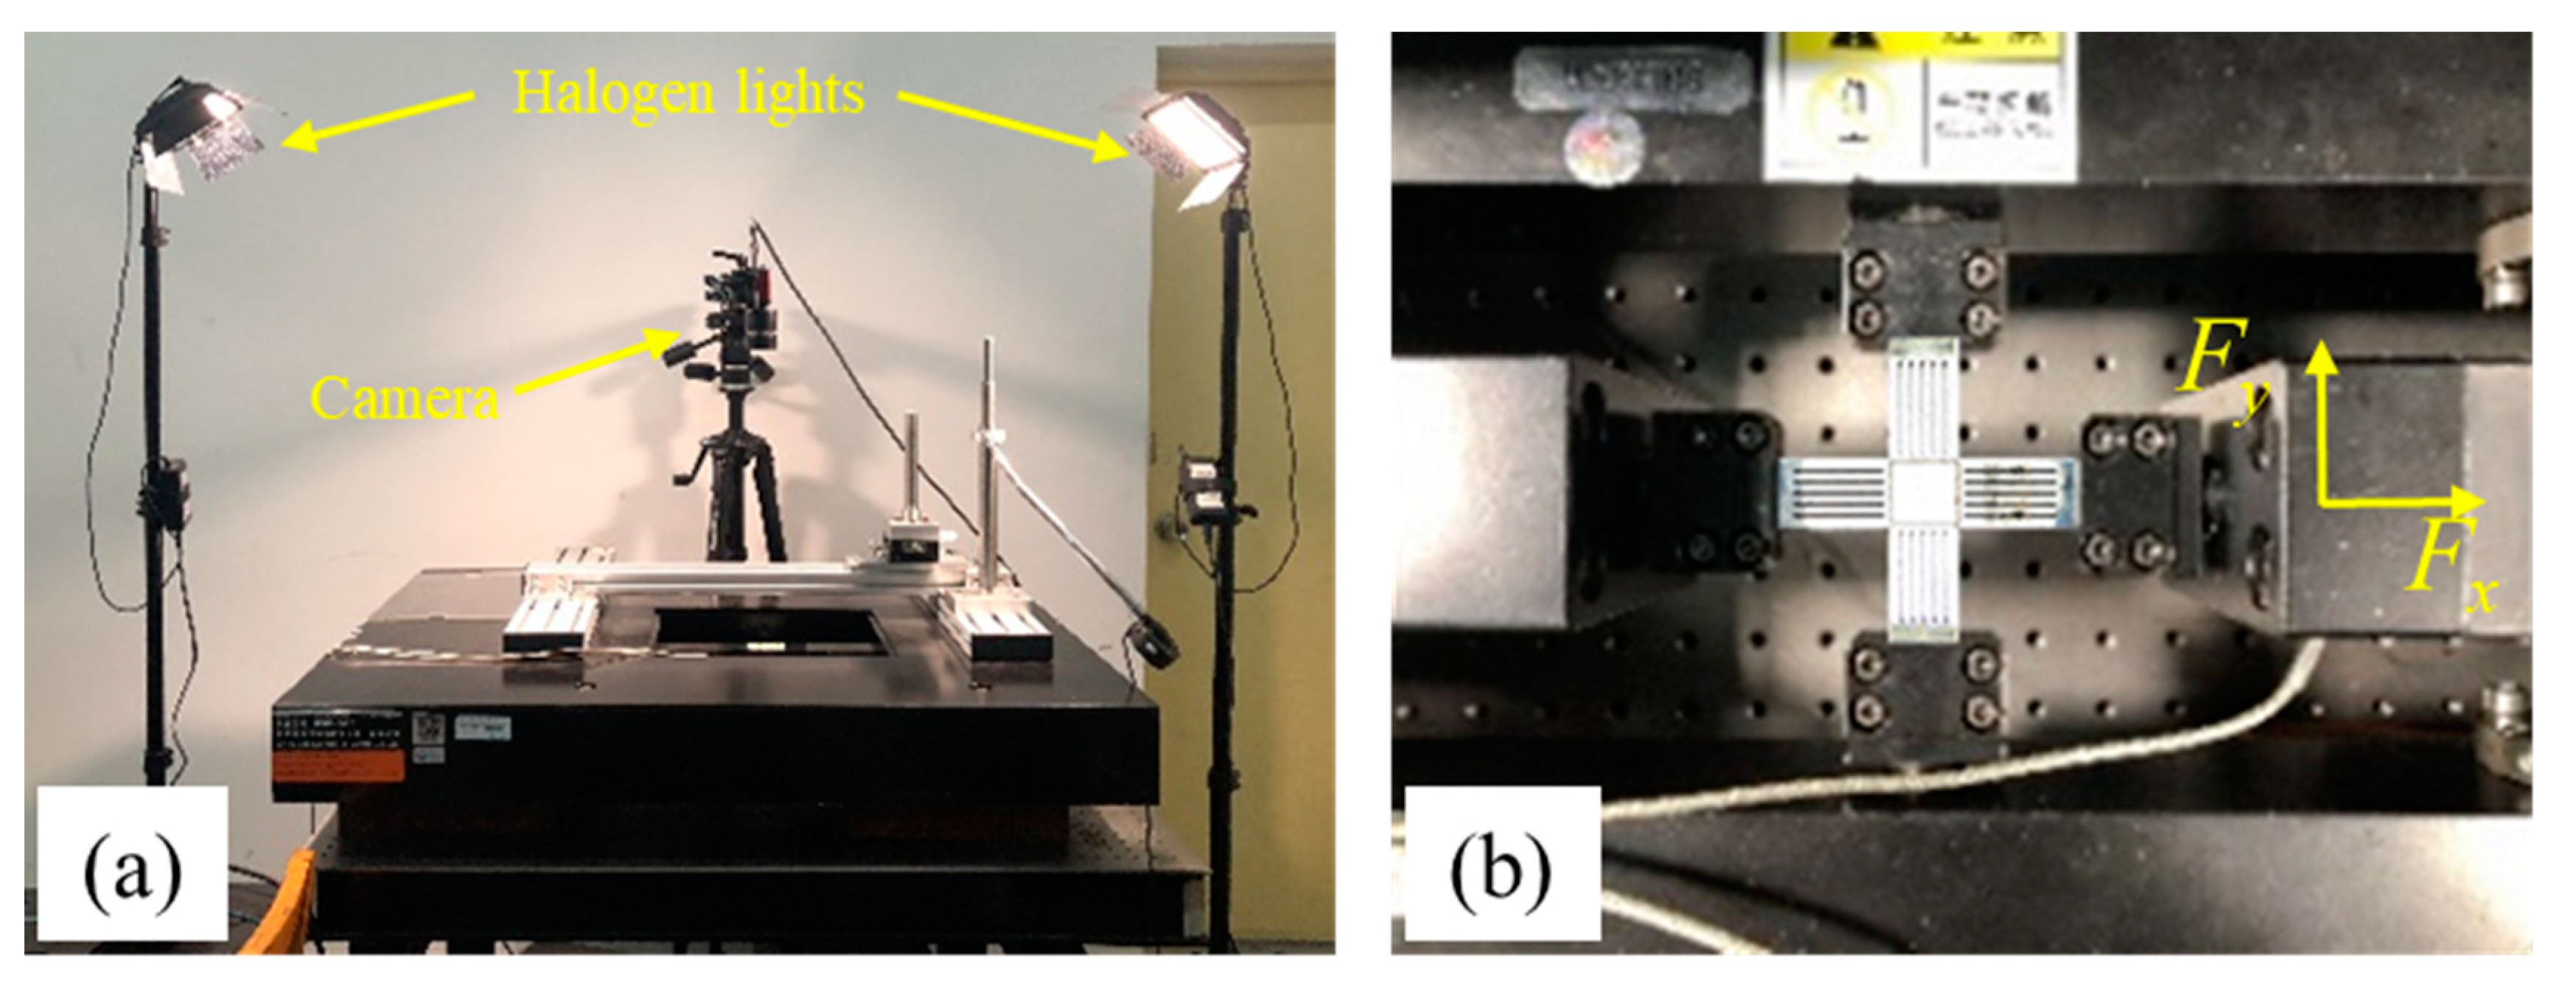
Both the uniaxial and biaxial tensile tests were carried out at room temperature on an IPBF-5000 biaxial tension test machine (CARE Measurement & Control Co. Ltd., Tianjin, China), as shown in Figure 2a. During the overall test period, the strain was measured by a non-contact digital image correlation (DIC) system. By comparing the speckle images of the gauge surface before and after deformation, the full-field strain of the gauge area can be obtained using a specific algorithm. The DIC criterion used is the zero-normalized sum of squared differences (ZNSSD), and the subset size is 21 px. Prior to tests, both uniaxial and biaxial samples surfaces were sprayed in a speckle pattern (Figure 2b). The overall gauge area was selected for the correlation analysis aiming to determine the strain distribution. Variation of speckle pattern was recorded by a FUJIFILM HF50SA-1 camera (FUJIFILM Holdings Corp., Akasaka, Tokyo, Japan) with five megapixels resolution with the shooting angle of 9.70 (Figure 2a). During the measure process, in order to decrease the error of the displacement measurement, the Gaussian prefiltering method was used. The obtained filtered images were analyzed by affine shape function and bicubic spline interpolation [30]. The colour scale presented in the present work varies from the minimum strain to the maximum strain, which is fixed by DIC system. Further, the forces in the X and Y directions, Fx and Fy, were obtained using a force sensor (CARE Measurement & Control Co. Ltd., Tianjin, China).
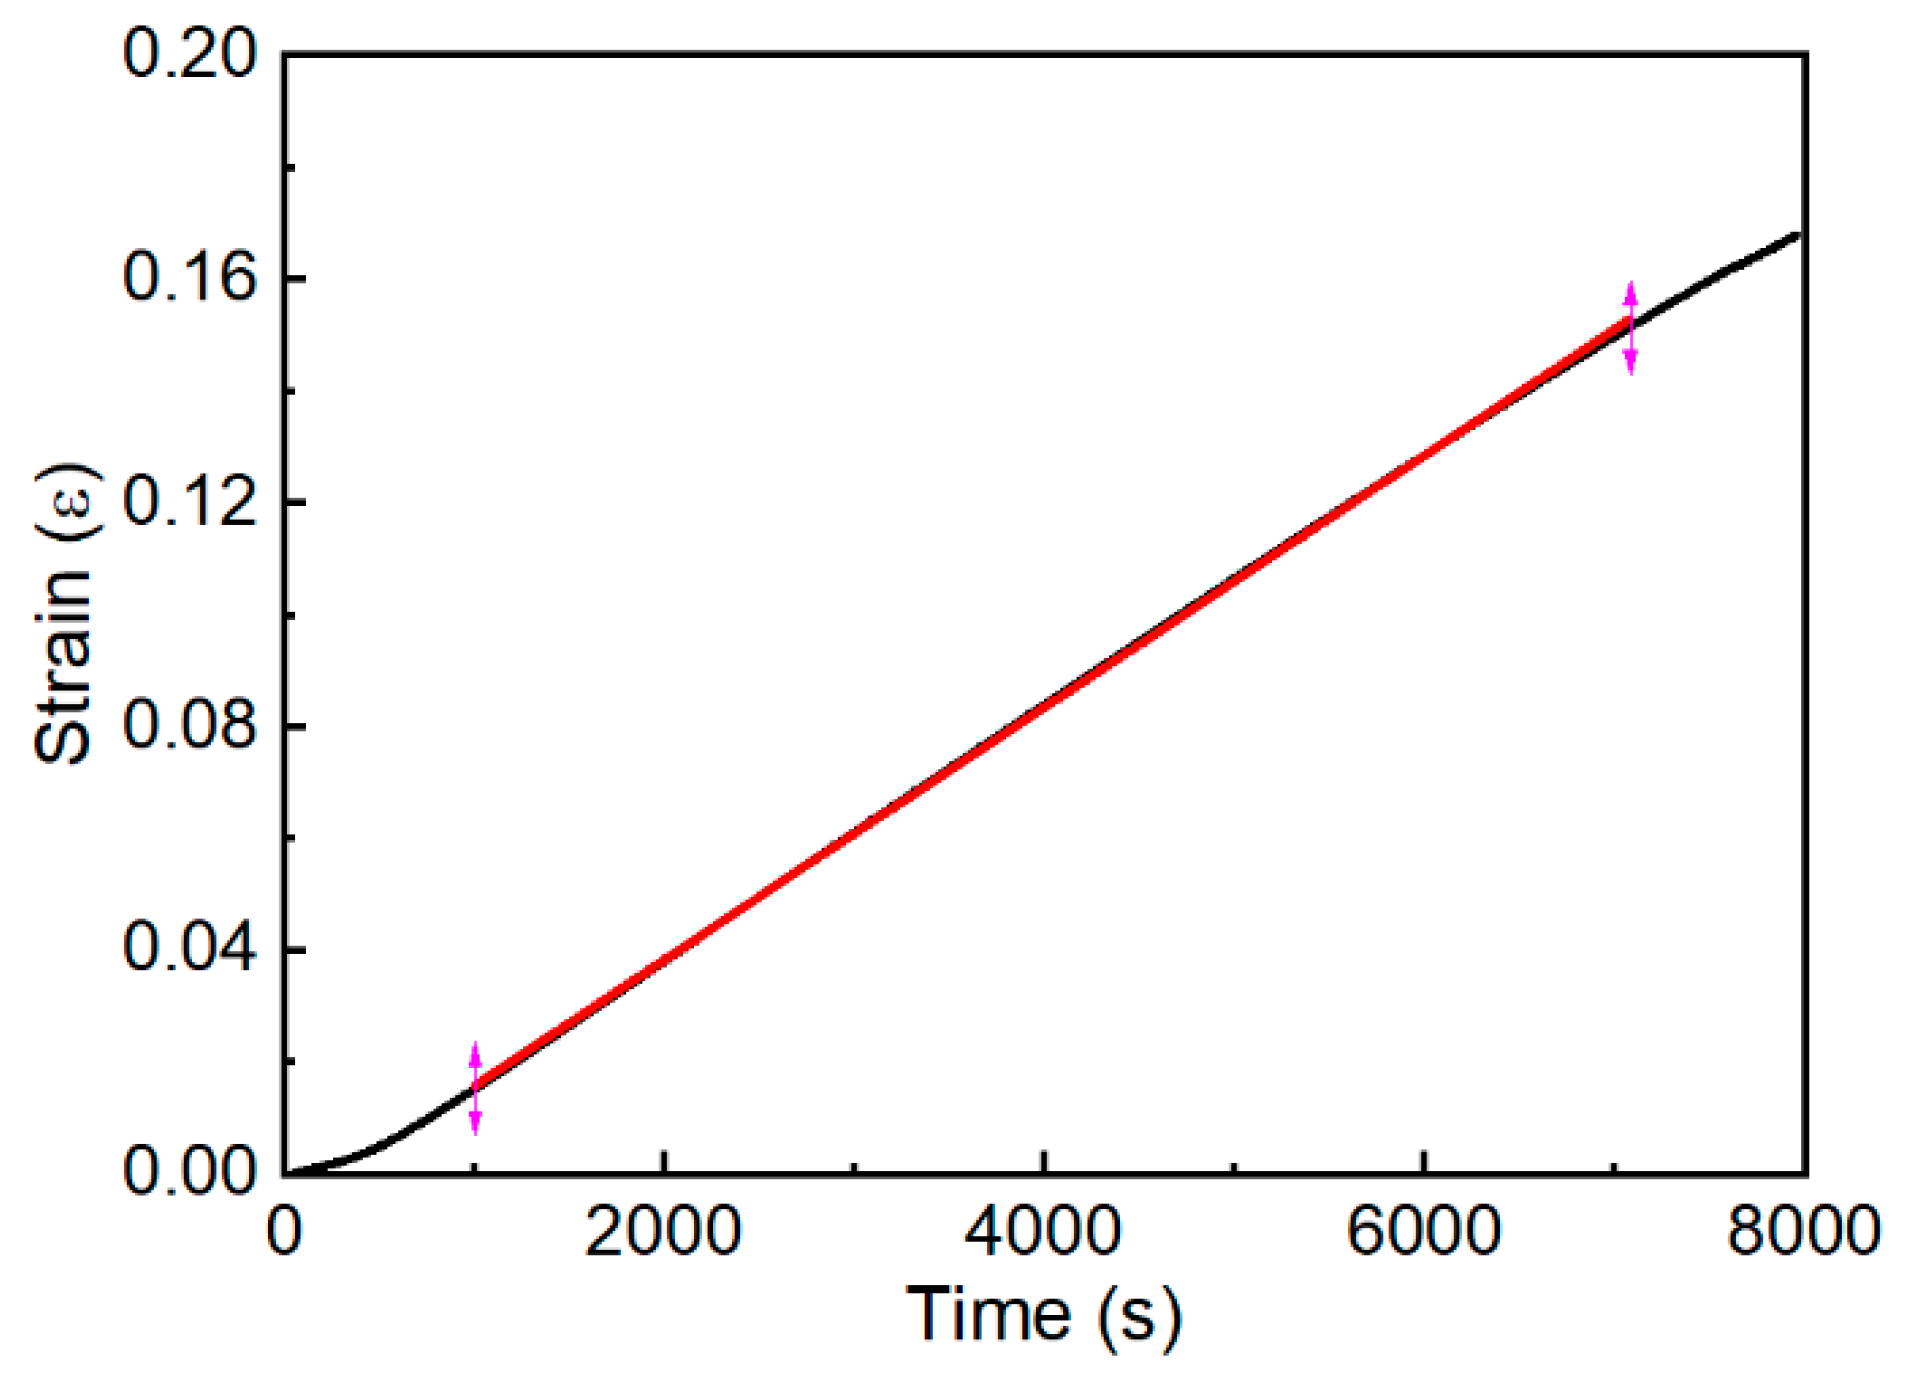
To investigate the tensile responses of CP-Ti at various load ratios, 9 fixed load ratios (Fx:Fy): 0:4, 1:4, 2:4, 3:4, 4:4, 4:3, 4:2, 4:1, 4:0 were introduced during biaxial tensile testing. The rolling and transverse direction were, respectively, defined as X and Y directions. The load ratio (Fx:Fy) represents the value of the applied load on the specimen at X and Y directions. It is worth noting that the biaxial tensile test of load ratios of 0:4 and 4:0 were replaced by uniaxial tensile tests along TD and RD directions. Table 1 lists the detailed biaxial tensile test data at various load ratios. On the other hand, to investigate the tensile responses of CP-Ti under various strain rates, displacement rate ranging from 0.001 to 0.1 mm/s were adopted. Here, displacement control mode was used because of the limitation of control mode of biaxial tensile machine. In this work, the displacement rate will be transformed to actual strain rate by the following method. During the whole test process, the relationship between time and strain measured by DIC system is plotted, where the slope of the stable stage was determined as the actual strain rate, as shown in Figure 3. The determined strain rates are listed in Table 2.
3. Results and Discussion
3.1. Effect of Load Ratio on Biaxial Tensile Properties
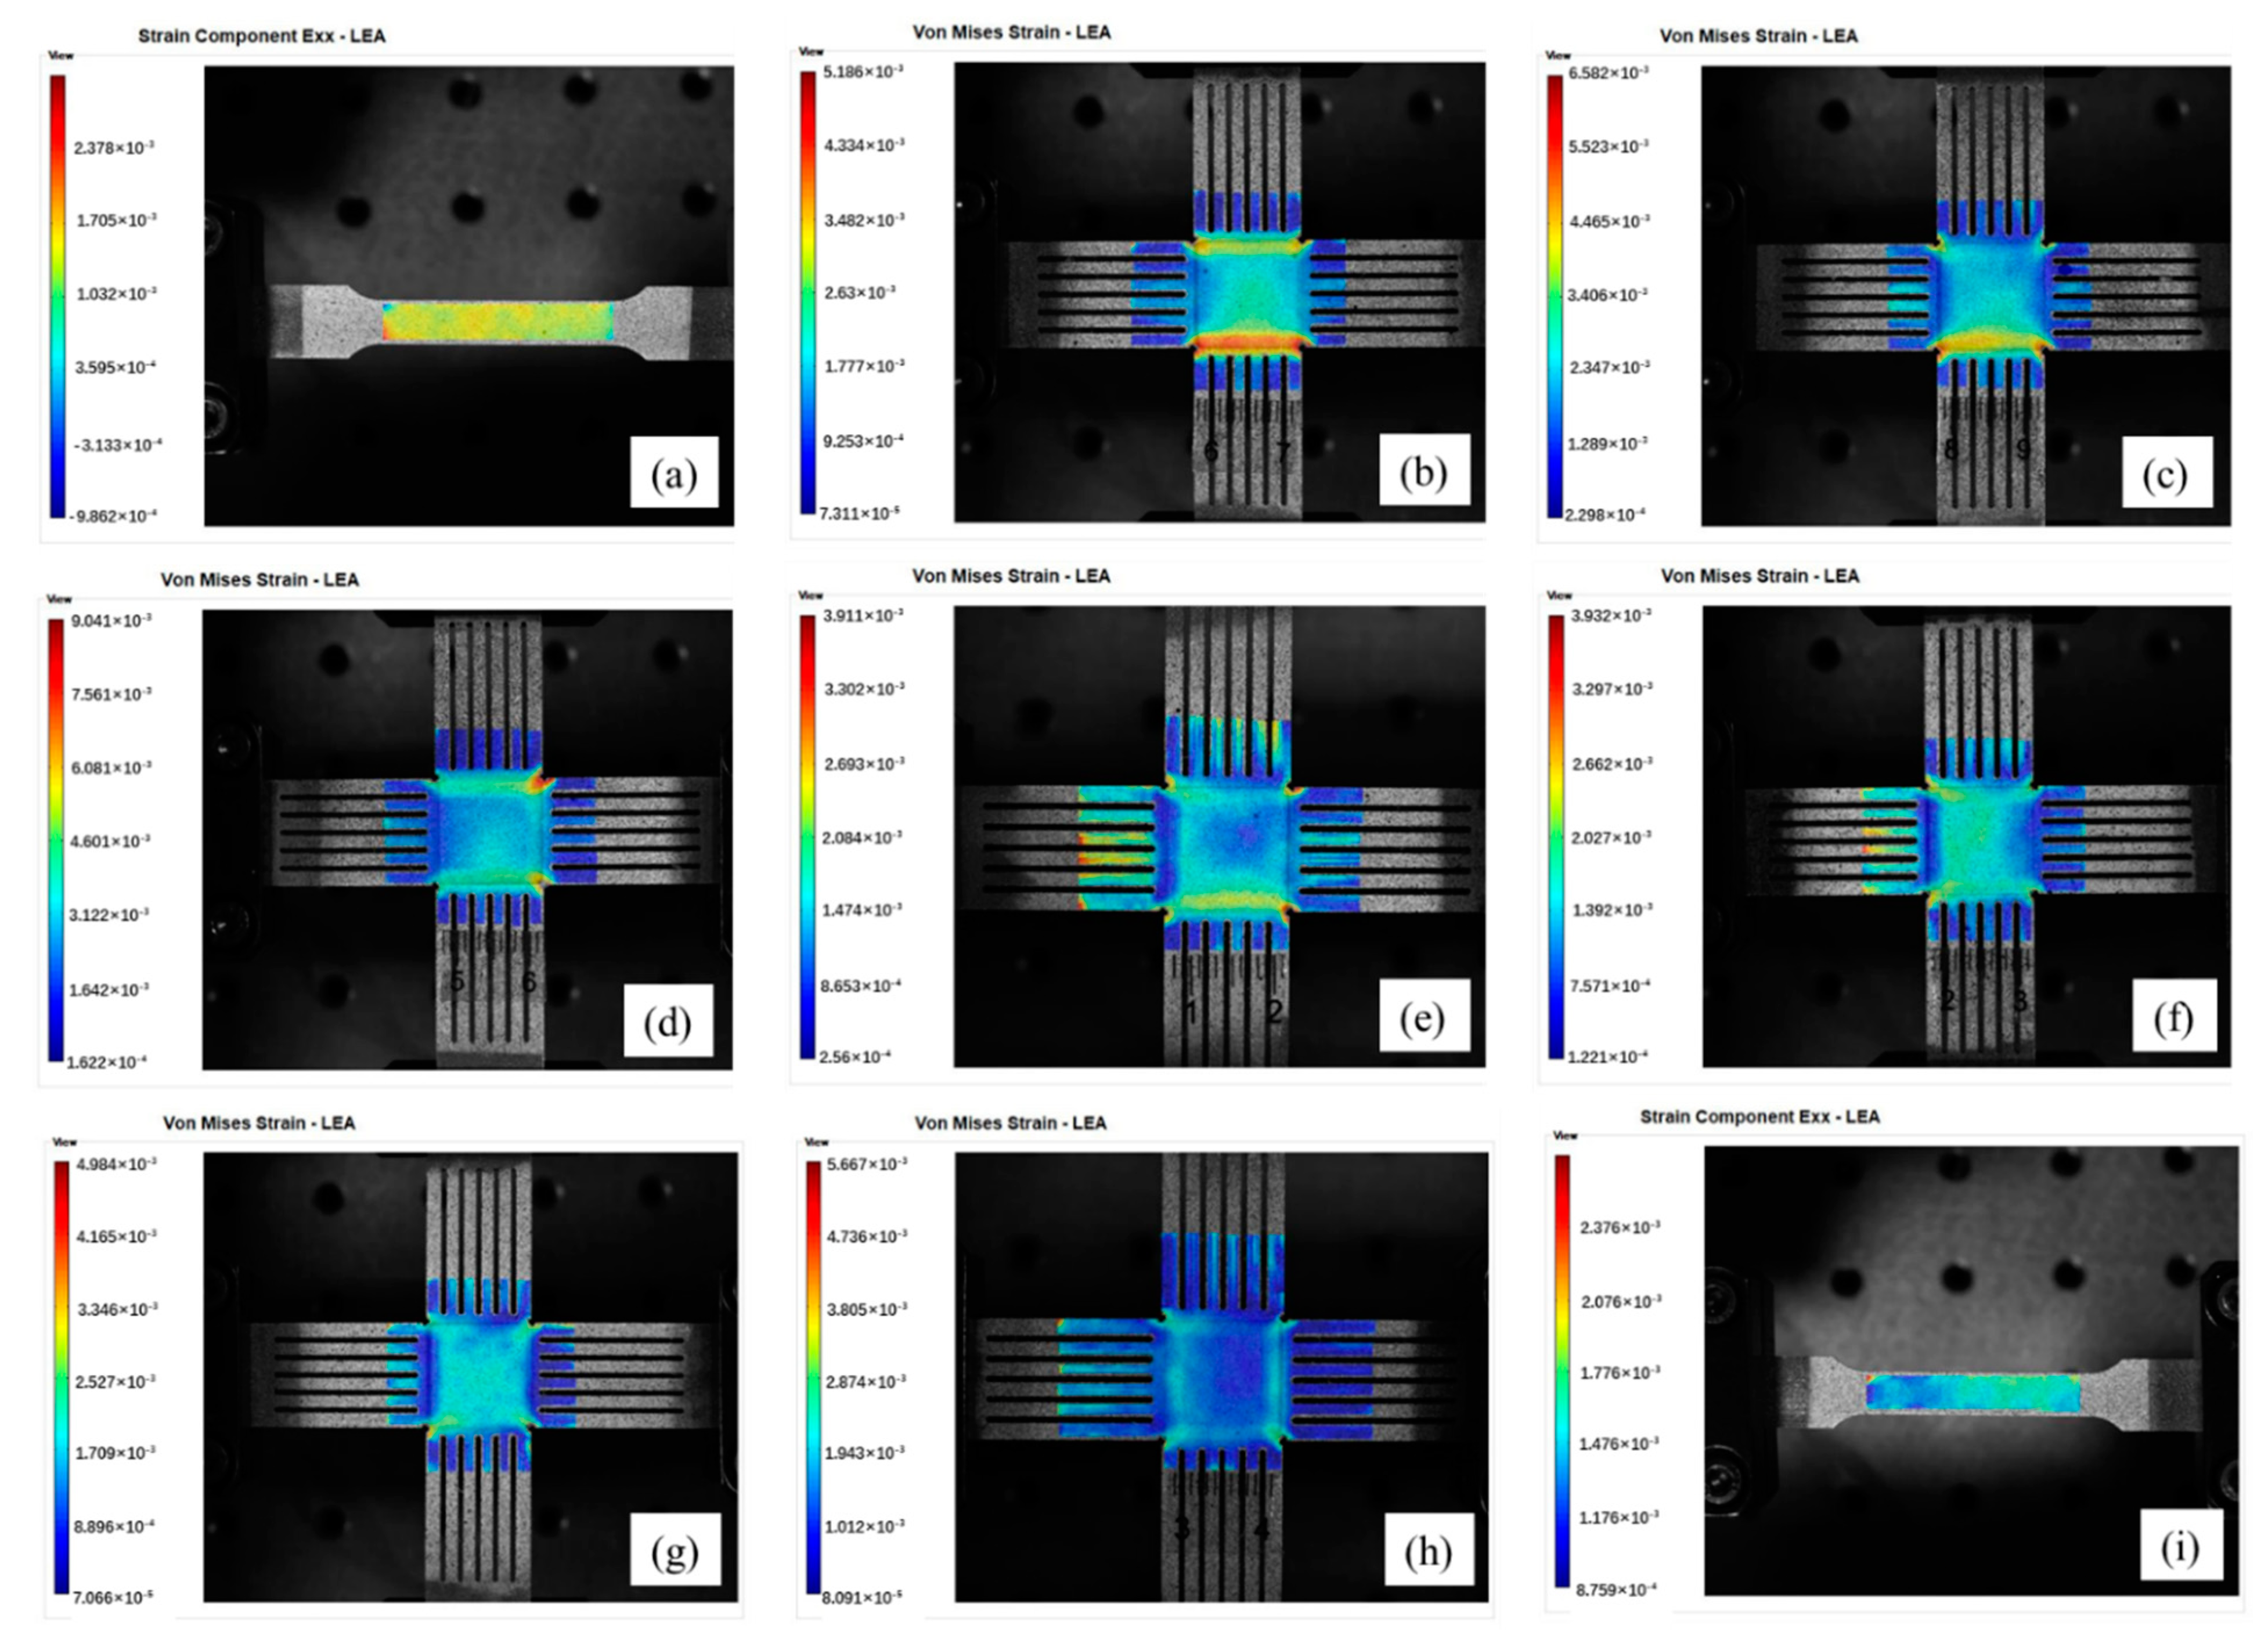
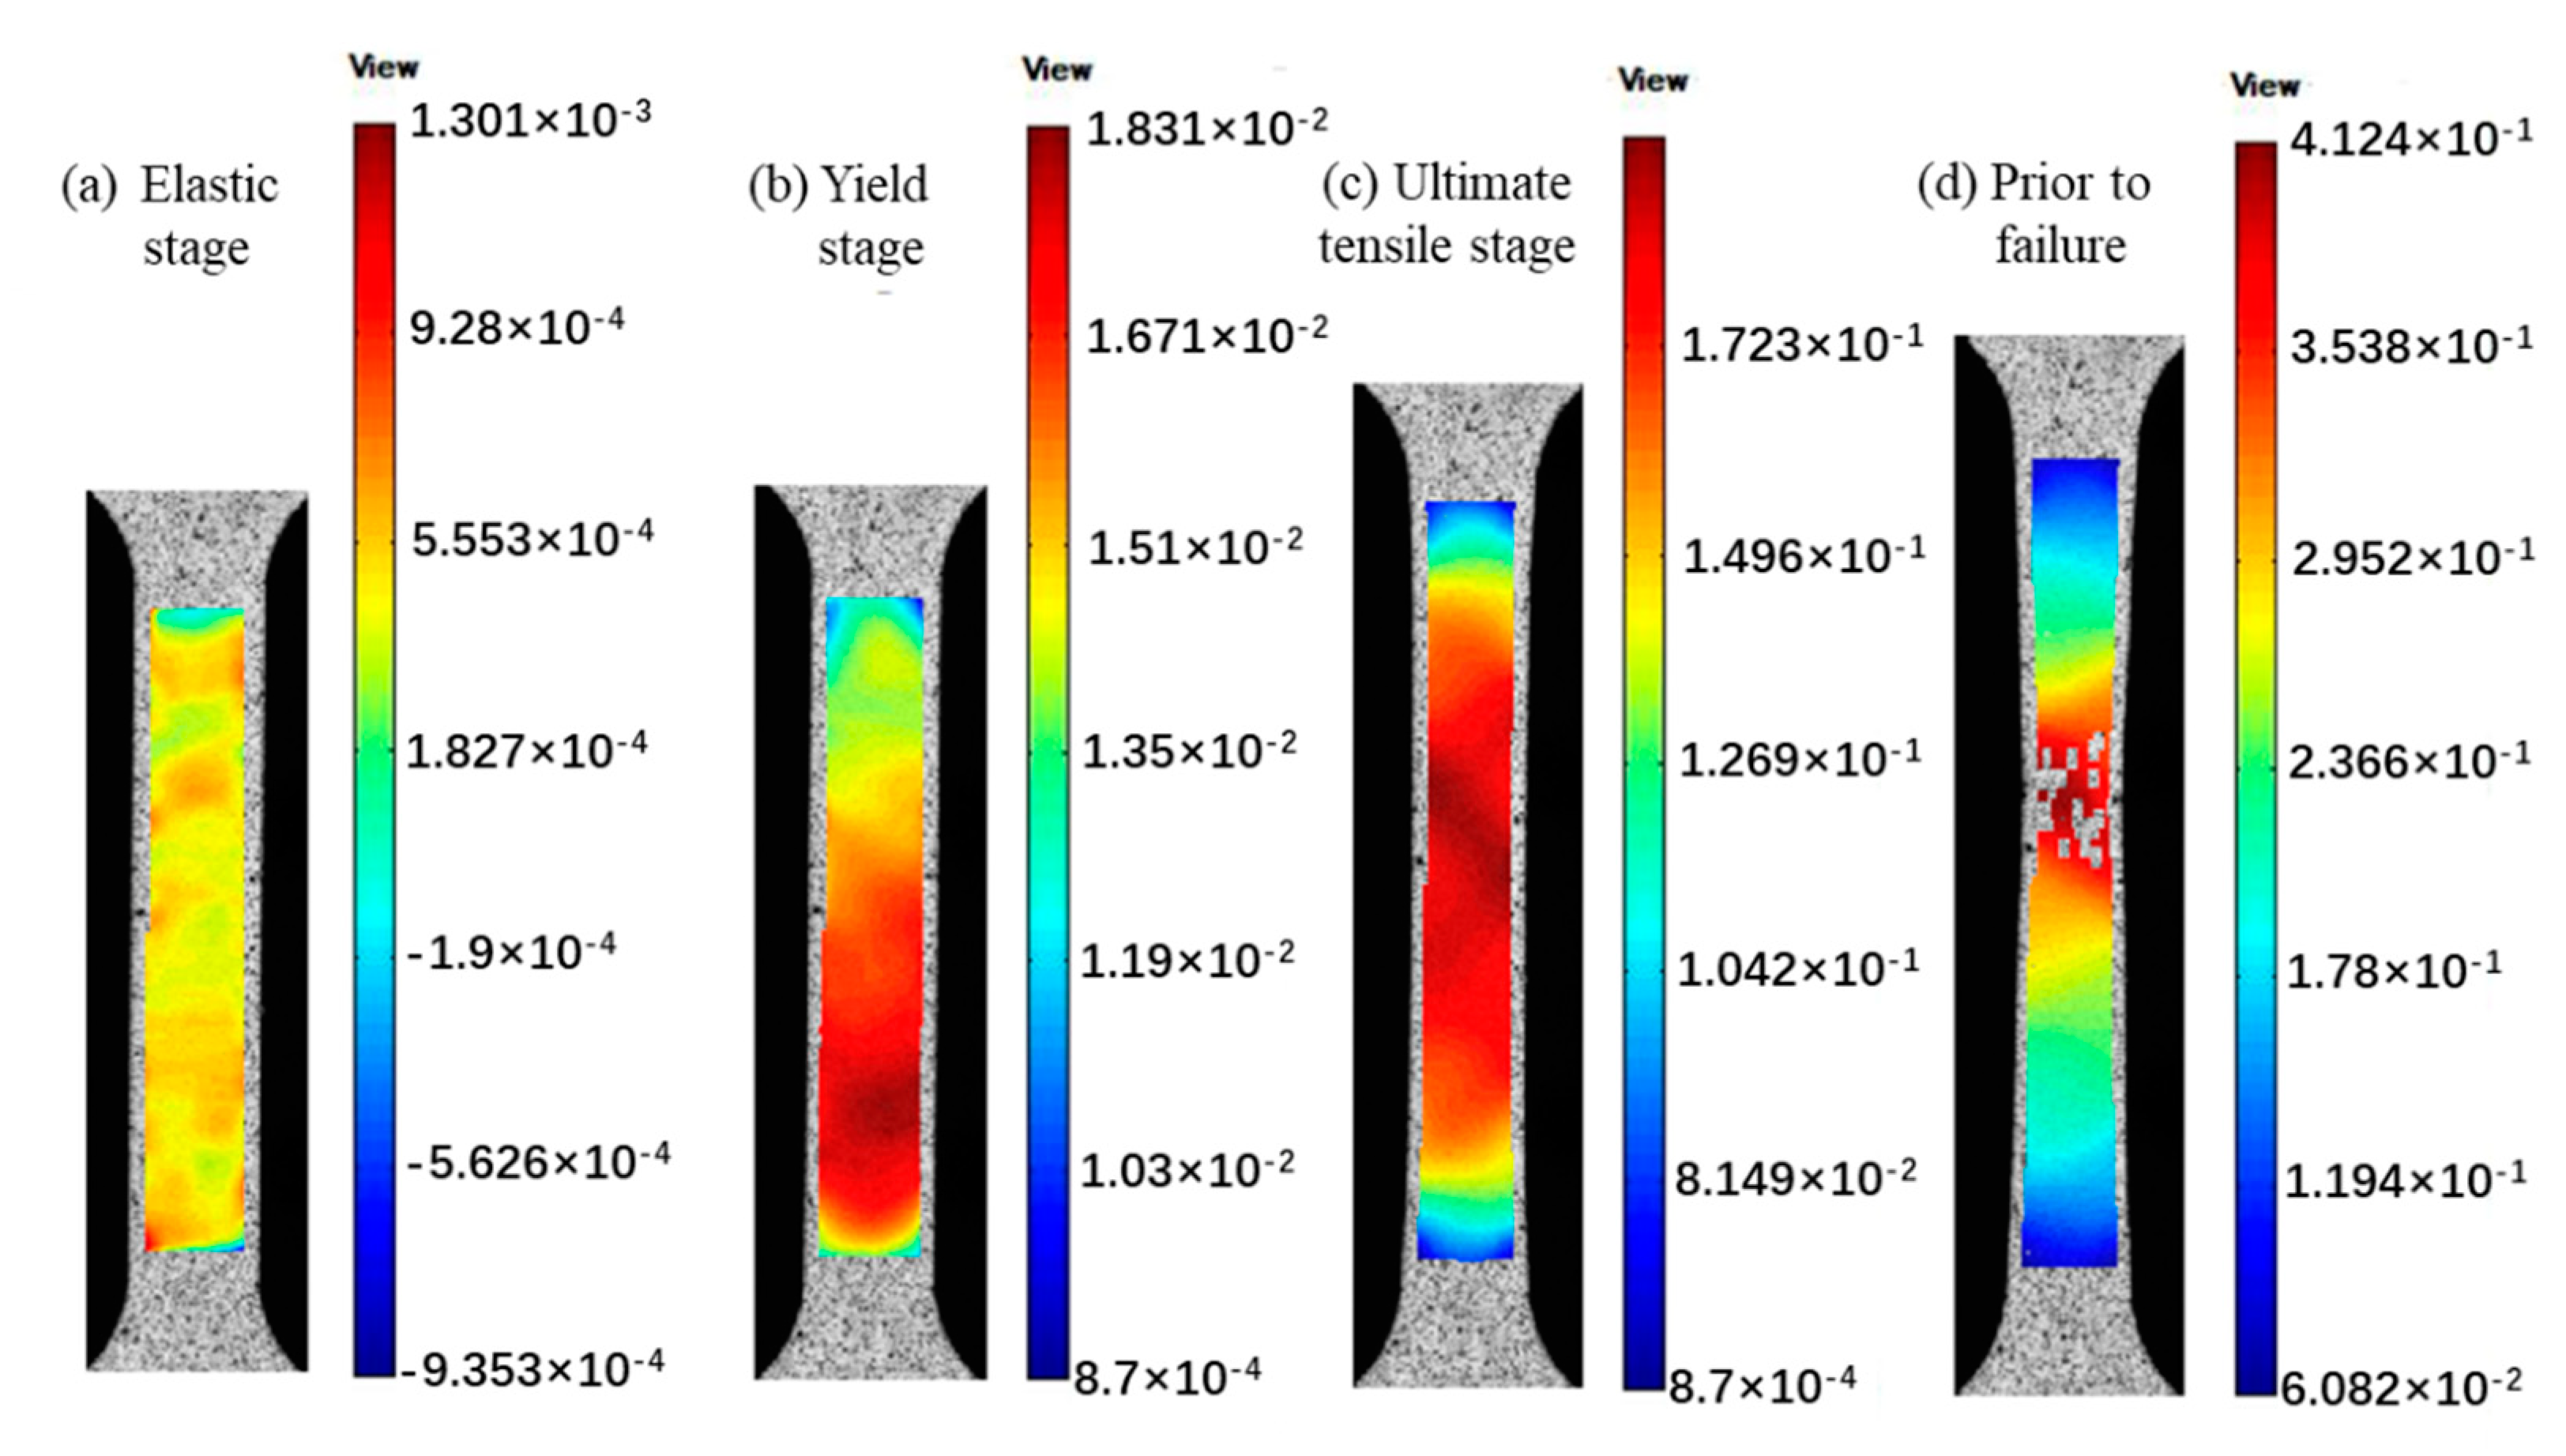
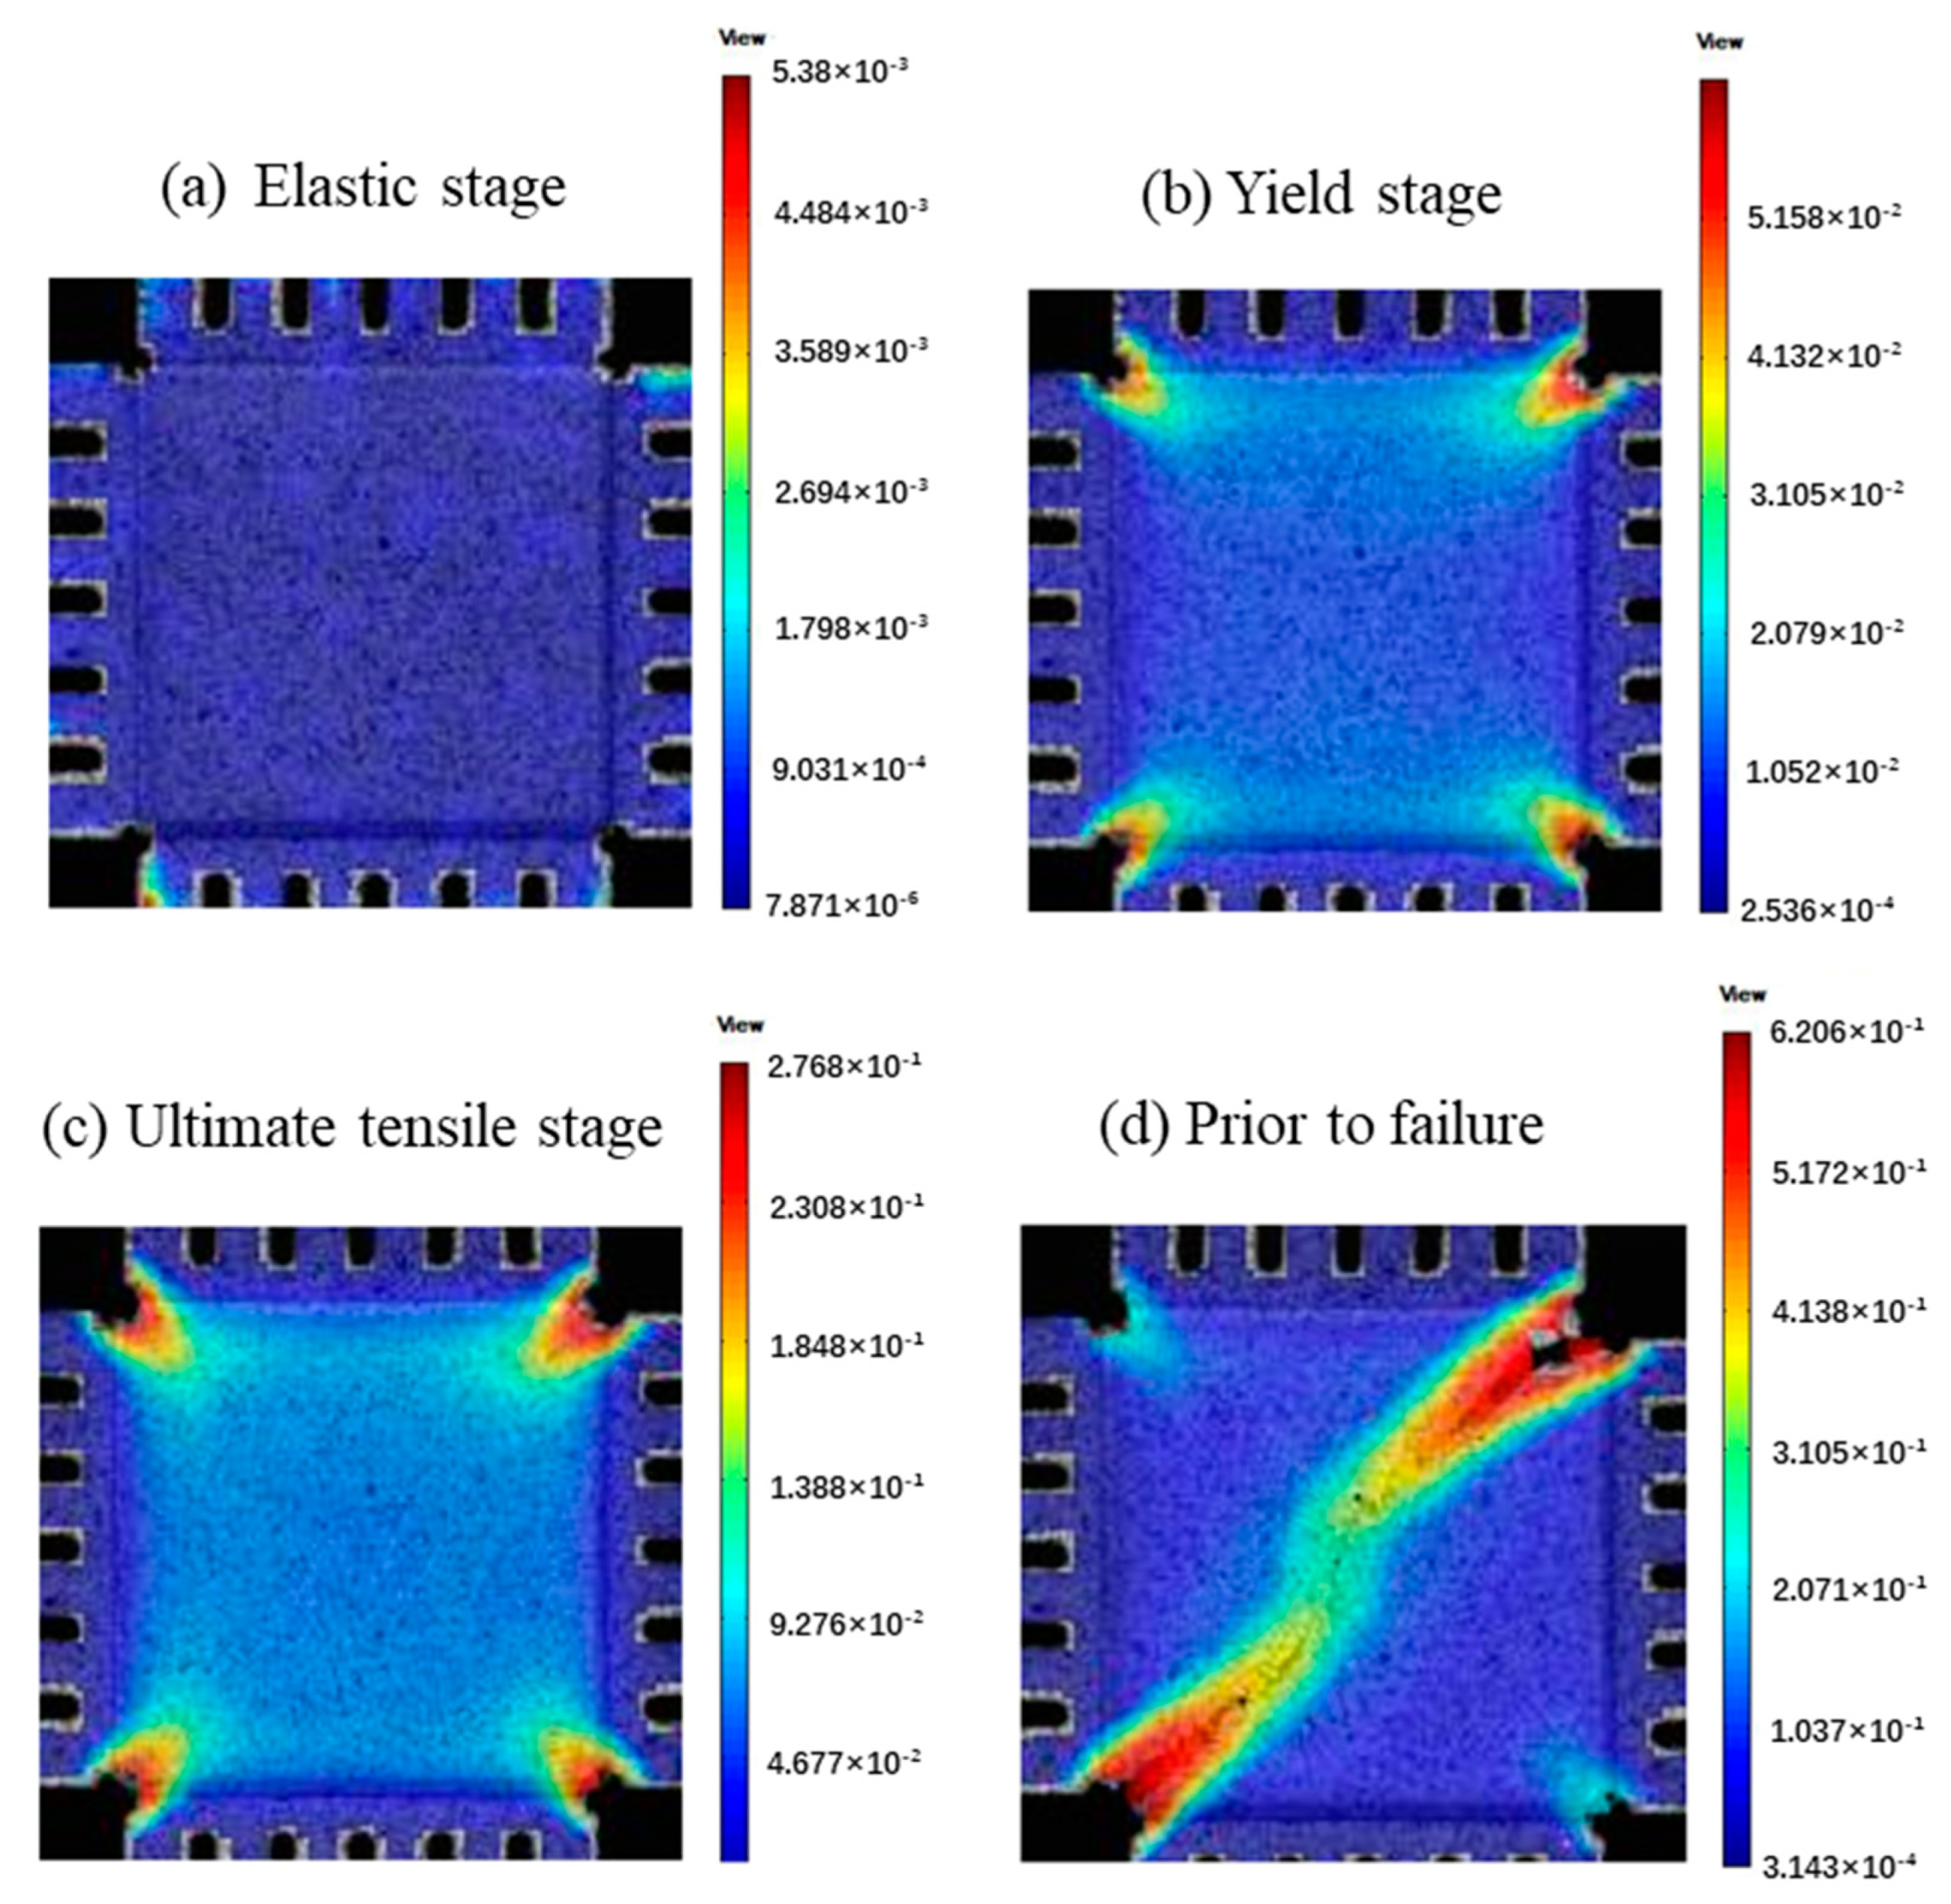
Figure 4 shows the strain contours obtained by the DIC system at various load ratios where nominal stress was kept at 100 MPa. An overview of these plots indicates that the strain distribution varies with the load ratios. The transition of the load ratio from the uniaxial tensile to the equi-biaxial tensile leads to higher strain, suggesting biaxial strain hardening behavior [31]. In addition, comparison between Figure 4a,i indicates that CP-Ti present different responses at RD and TD directions. The mean strain in RD is smaller than that of TD, indicating the higher ductility of TD samples, which is in agreement with the available literature data [32,33]. The significant changes in tensile deformation of RD and TD could be associated with the drastic change in deformation mode. In Roth’s work [34], the TD sample was found to present a greater amount of twins, whereas limited twins was observed for RD sample. Therefore, the difference in twinning during deformation should hold the responsibility for the changes in tensile deformation of RD and TD. Figure 5 and Figure 6 further presents the strain contours for the RD and equi-biaxial samples, taken at various stages corresponding to an elastic stage, a yield stage, an ultimate tensile stage and a stage just prior to failure. For RD sample (Figure 5), obvious strain localization was observed in the necked area before failure, with the strain up to 0.41. Similarly, equi-biaxial sample also showed intense strain localization (Figure 6). Moreover, detailed observation on the strain contour of equi-biaxial tensile sample indicates that the strain distribution in the gauge section was homogenous before yield, as shown in Figure 6a, which is generally desired. Nevertheless, after yielding, the region where the crack initiates significantly depends on the local strain, which is also argued to be a true biaxial condition, as shown in Figure 6b,c. Furthermore, it is observed from Figure 6d that the final crack propagation of equi-biaxial specimen follows ideal 45° direction to the loading axis.
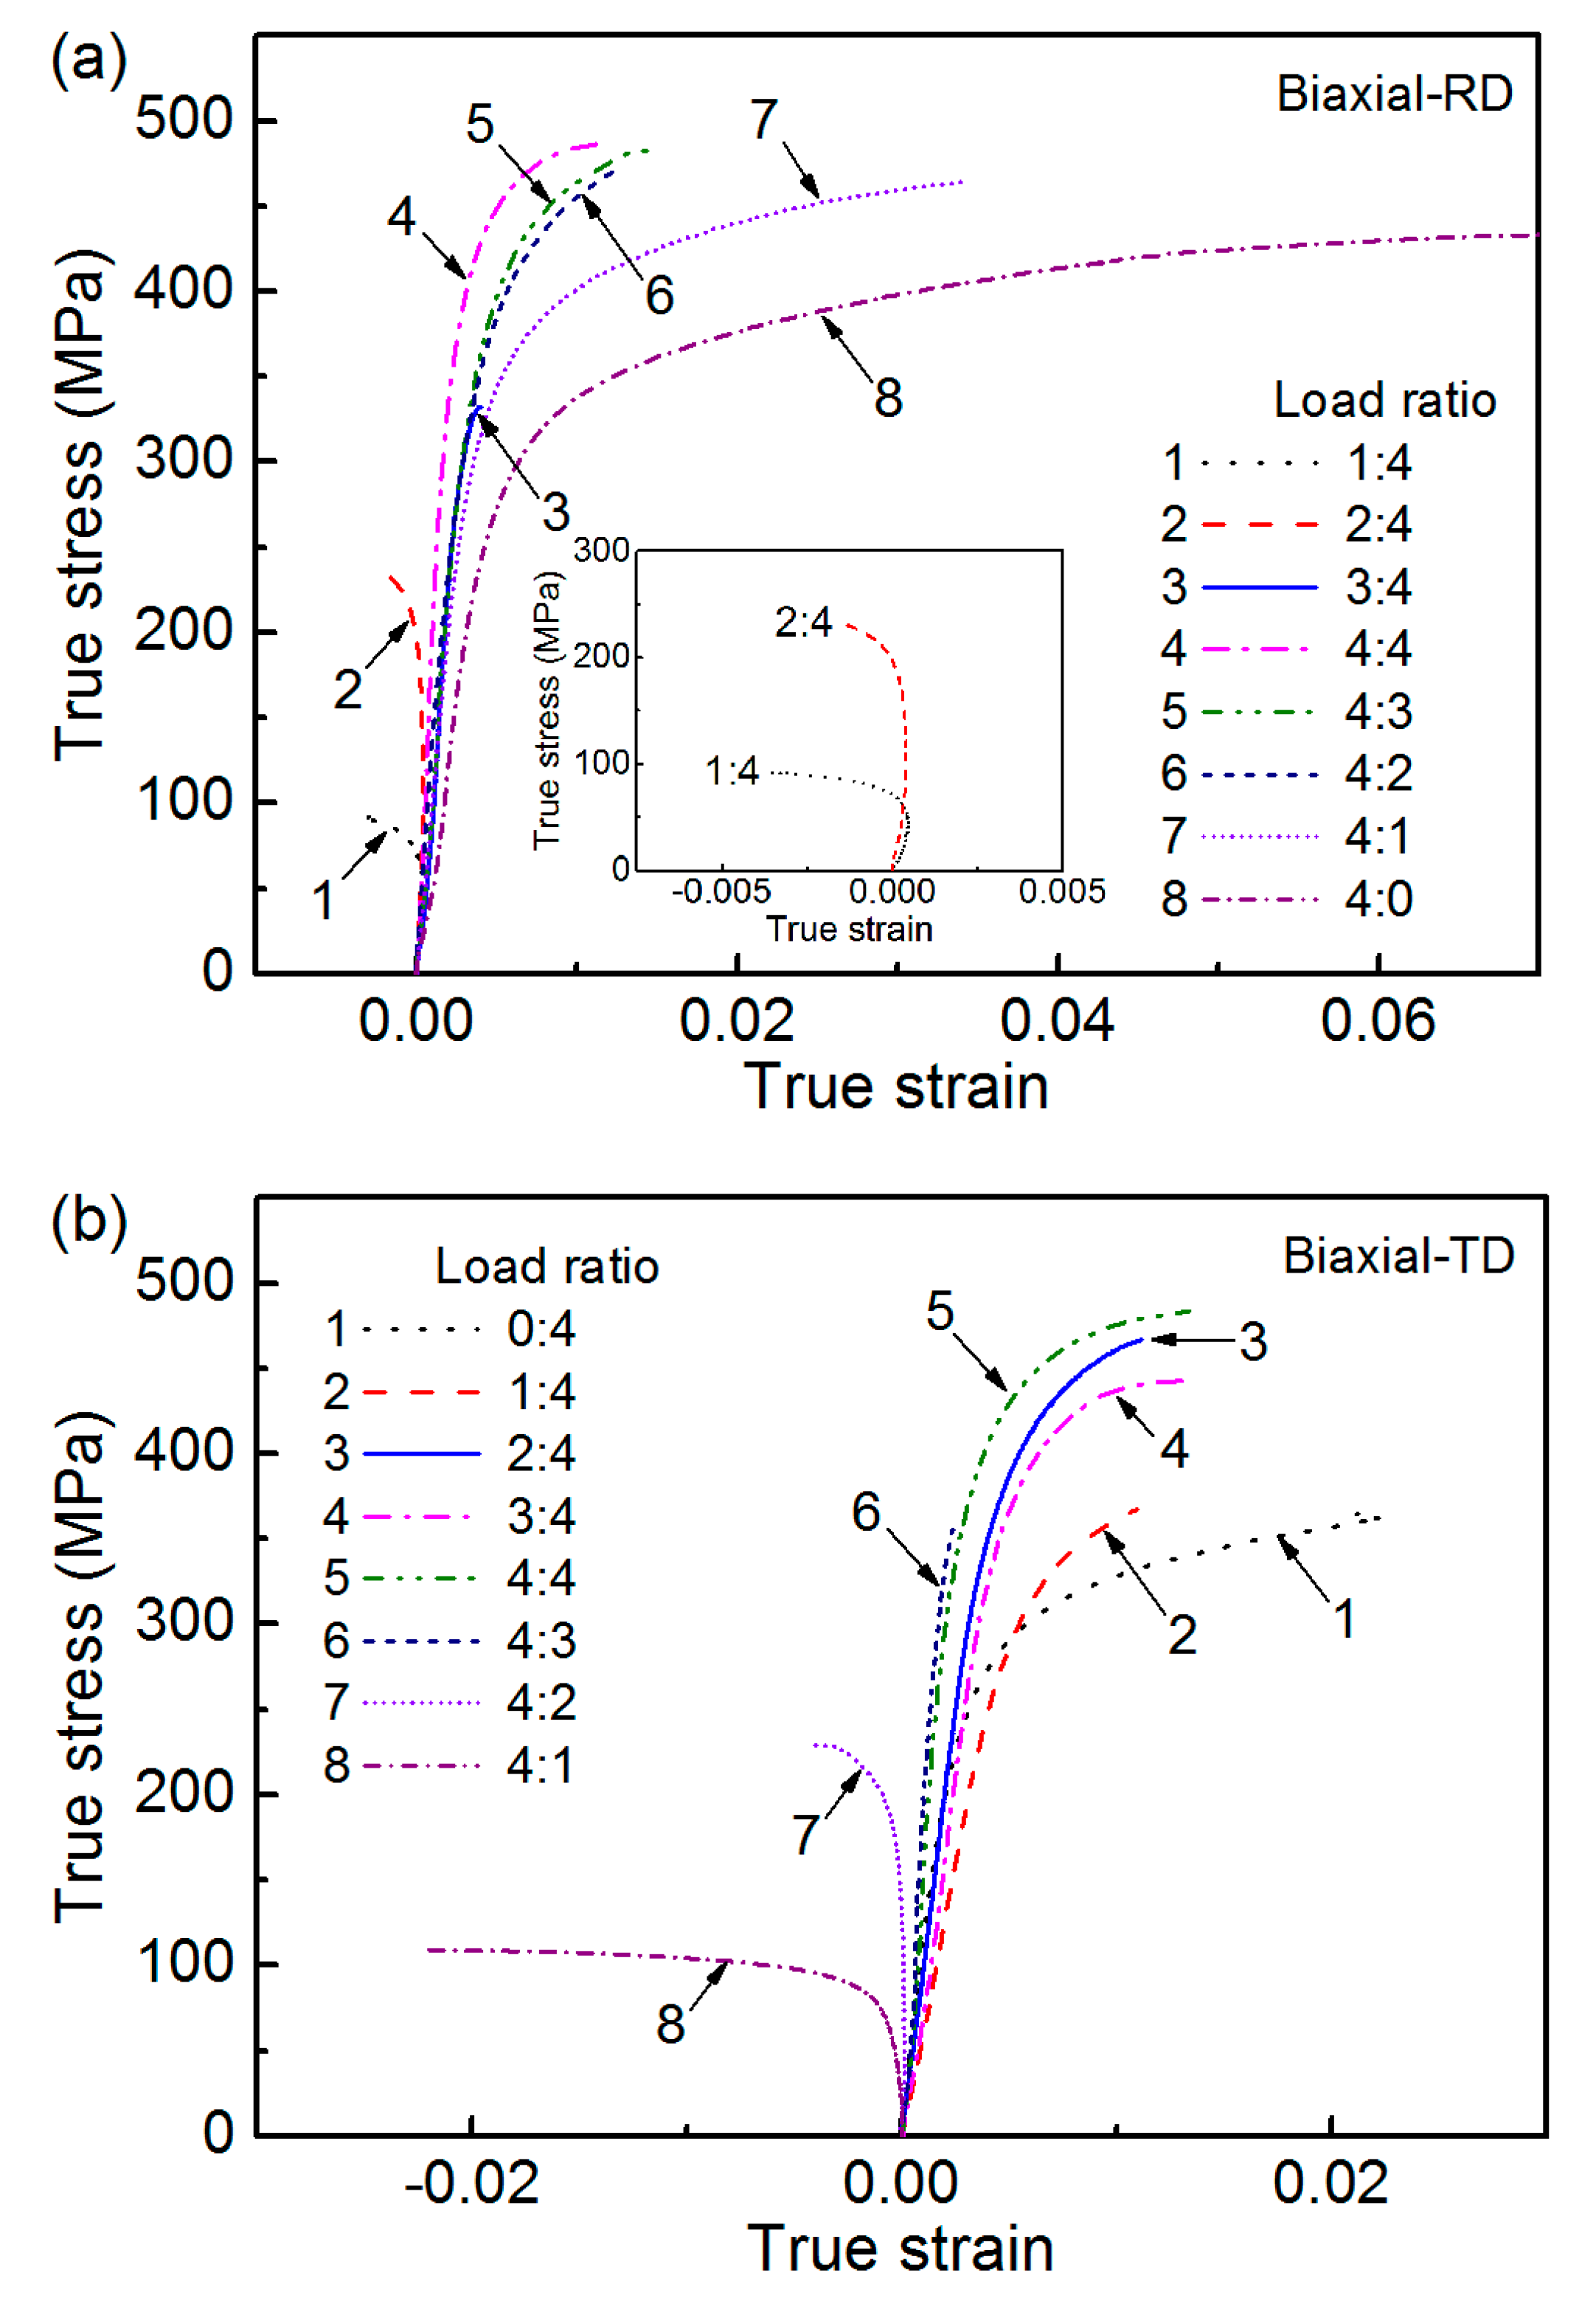
Figure 7 depicts the biaxial true stress-strain curves of CP-Ti at different load ratios. The true stress and true strain were, respectively, calculated by using the following equations [35,36]:
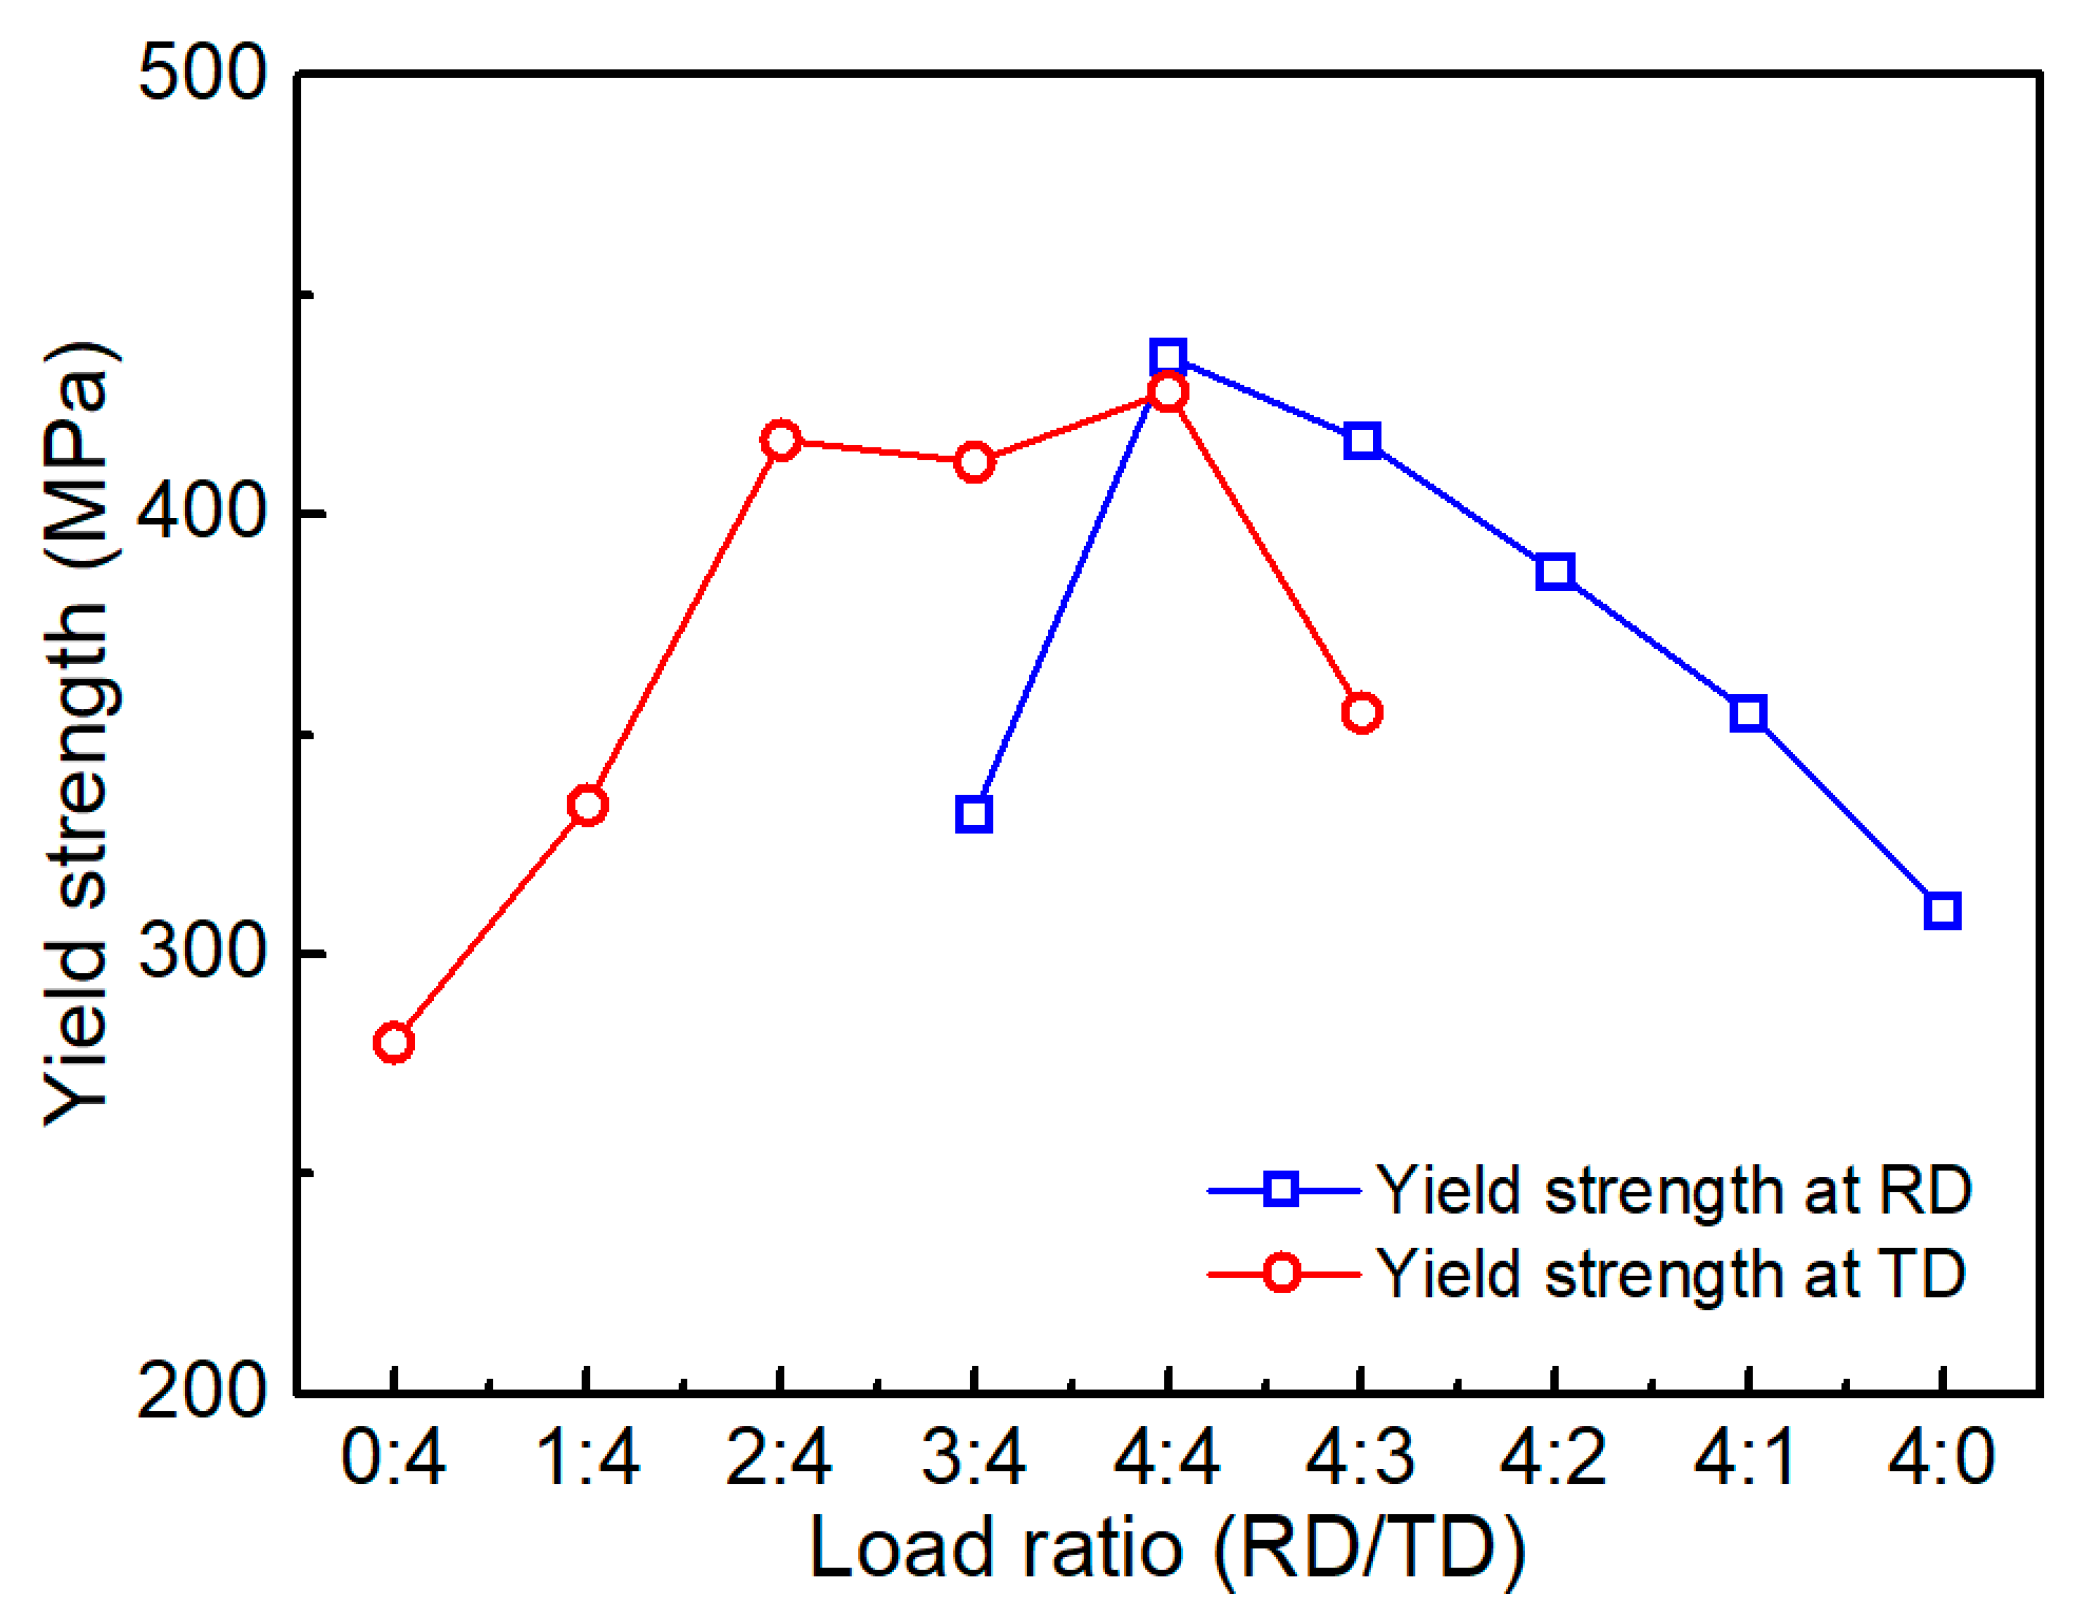
where σt is the true stress, F is the tensile force, expressed in N, ε is the engineering strain measured by the DIC system, Aeff is the effective cross-sectional area, expressed in mm2, which is taken as 7.5 mm2 in the present work [37], εt is true strain. It is observed from Figure 7 that the biaxial stress-strain curves show a gradual increase tendency as the load ratio transits from uniaxial tensile to equi-biaxial tensile, which is consistent with the observations in Figure 4. The variations of yield strength with respect to the load ratio at RD and TD directions are summarized in Table 1 and shown in Figure 8. Since for load ratio of 1:4 and 2:4 (4:1 and 4:2), strain accumulates negatively at RD (TD), therefore the yield strength is not presented for comparison. Looking at Figure 8, it is apparent that the transition of uniaxial tensile to biaxial tensile leads to the increase in yield strength. For example, in RD direction, the yield strength increases from 310 to 436 MPa when the load ratio transits from uniaxial RD to equi-biaxial tensile, up to 1.41 times. While the yield strength in TD direction increases 1.53 times. Interestingly, the yield strength at TD was observed to keep stable at load ratio of 2:4, 3:4, and 4:4, indicating that the stress at TD induced by the Poisson ratio comes to saturated after load ratio of 2:4. Remarkable improvement of yield strength under biaxial tensile loading may be ascribed to the combined effect of stress state and initial texture of CP-Ti. Since biaxial test involves only two orthogonal loading, deformation along thickness direction is restricted owing to the lack of stress in through thickness direction for hexagonal close-packed structure. The reason for this is strong basal and split-basal texture of the as-received material basal plane lying parallel to the plane of the sheet and biaxial loading is also parallel to the basal plane [22]. Therefore, remarkable improvement of biaxial yield strength was observed. Chen et al. [38] also found obvious improvement of yield strength of zirconium alloys under biaxial tension at room temperature.
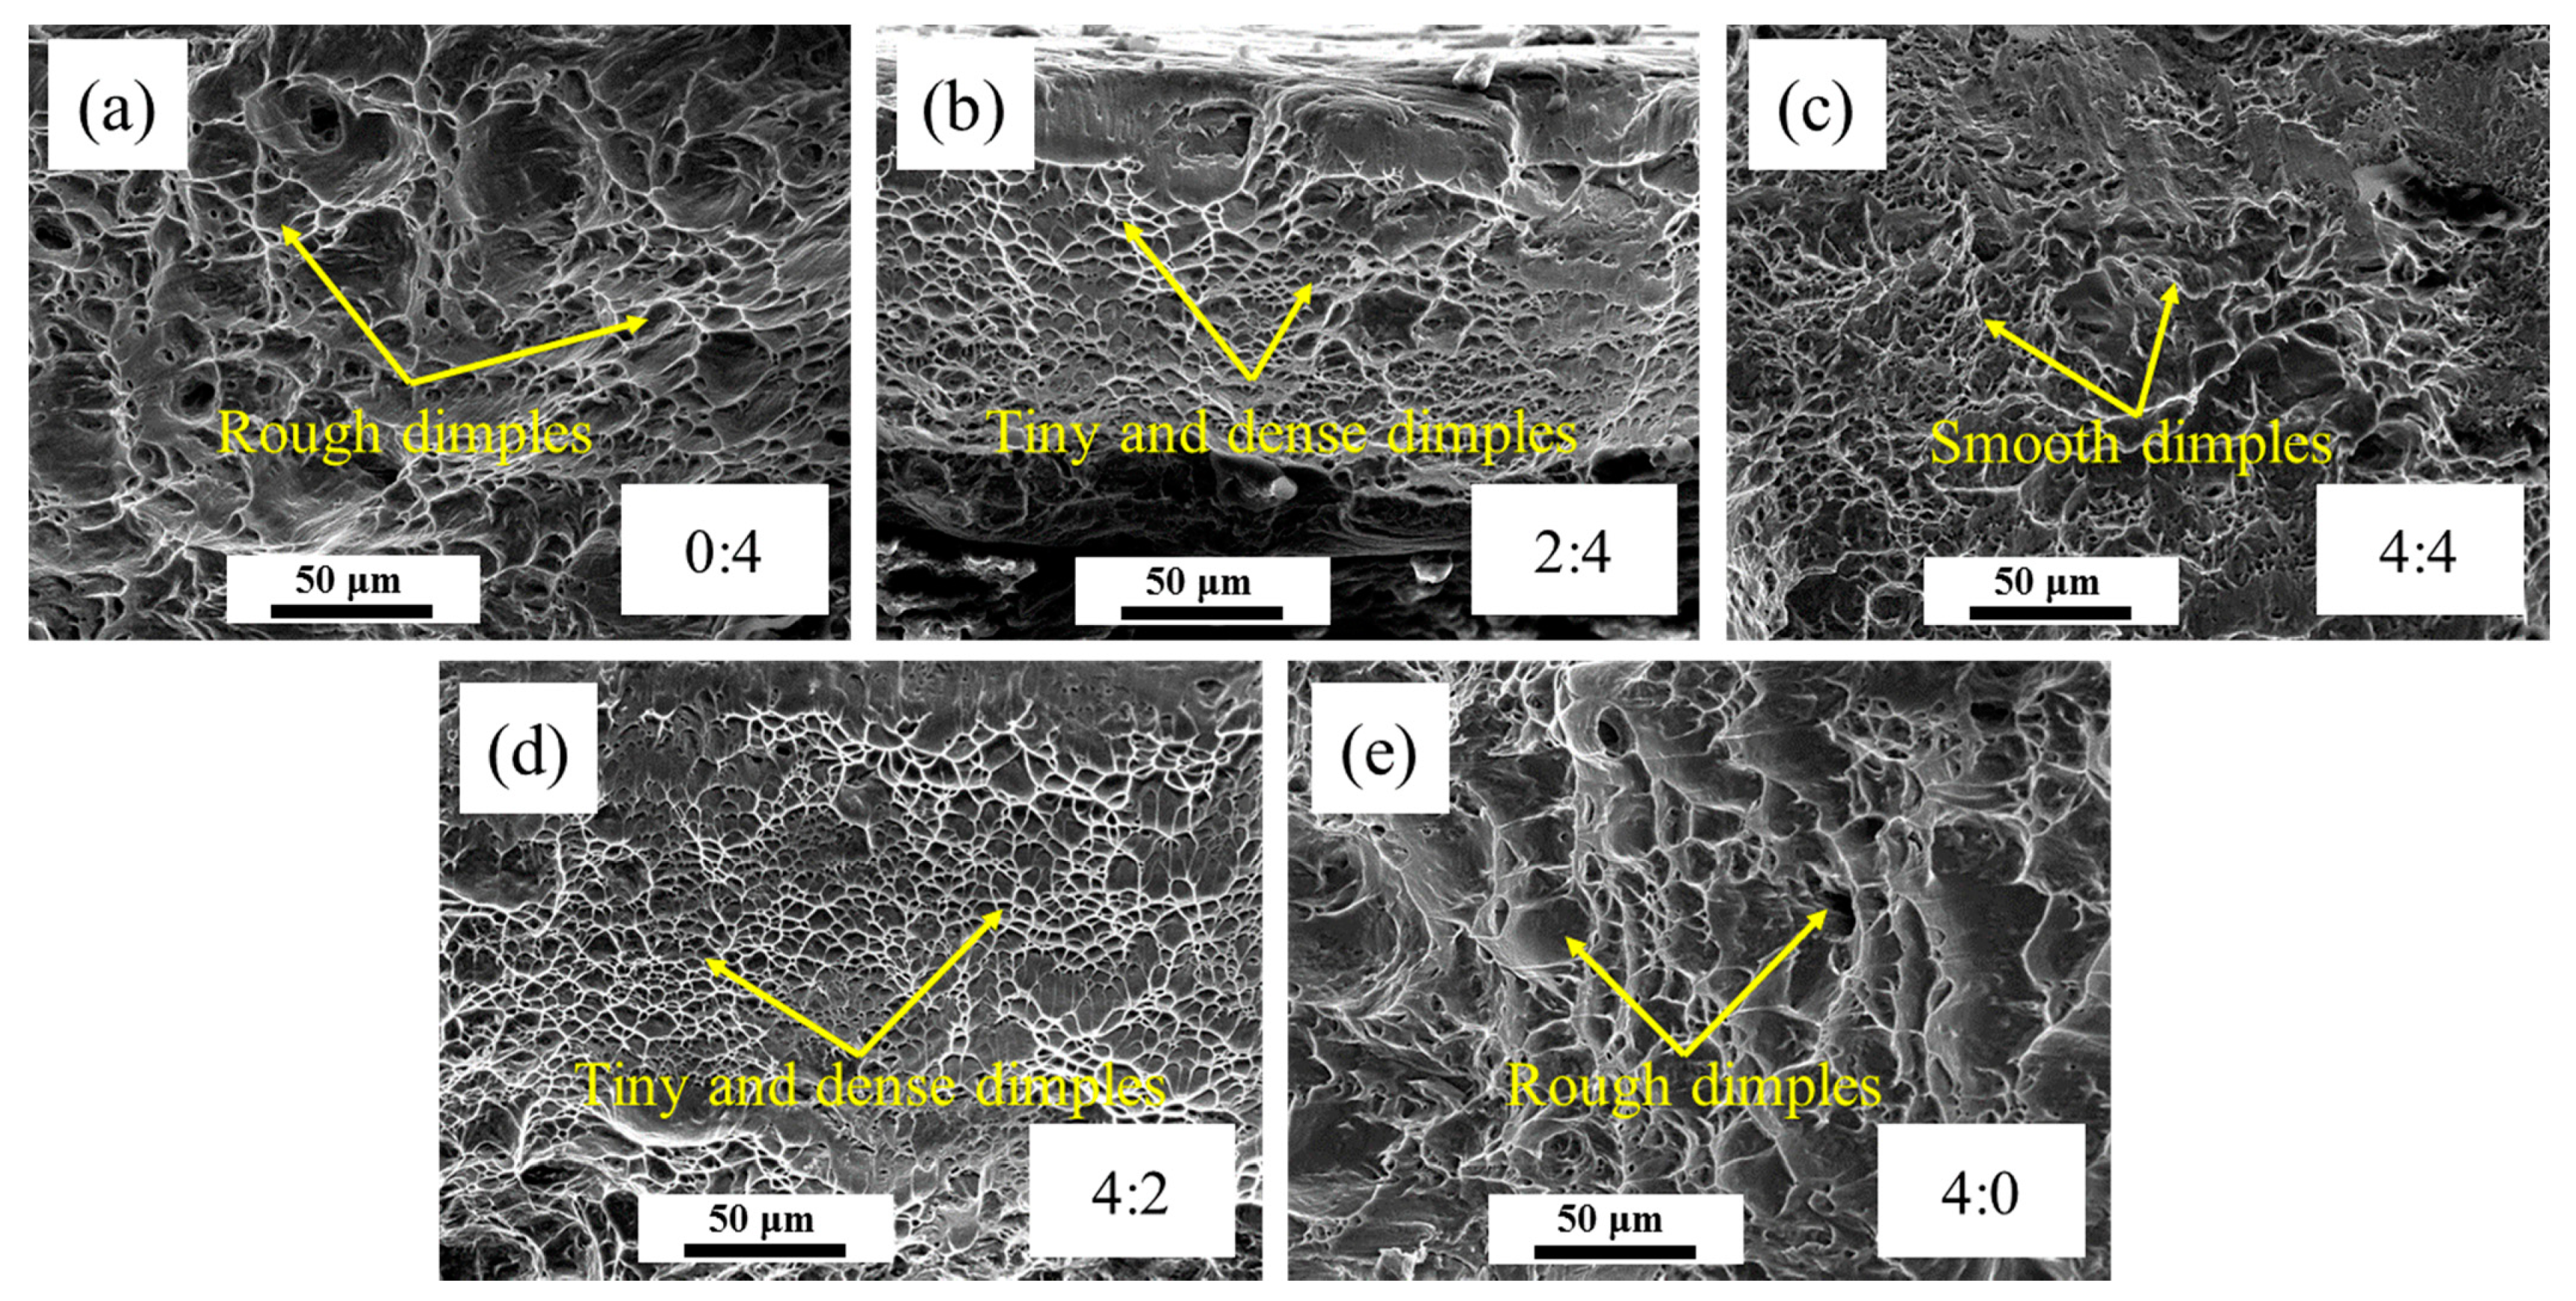
To demonstrate the fracture mechanism of CP-Ti at various load ratios, fractographs of the tested specimens were observed, as presented in Figure 9. From the overall views, visible difference between various load ratios specimens were observed. Fractograph of equi-biaxially tested specimen is relatively smooth, where the mean size of dimples is about 8 μm. However, uniaxially tested specimens show rough fractograph with deep voids interspersed within them. Moreover, the fracture surface with load ratios of 2:4 or 4:2 displayed a tiny and dense dimple. It is well known that the size and distribution of the dimples were significantly dependent on the stress state [39]. Kestner et al. [40] and Ghosh et al. [41] also pointed out that the nucleation, growth and linking of voids were related with strain path and tri-axial stress. Because biaxial loading unavoidably induces high tri-axial stress, void-link up is hence accelerated in comparison with uniaxial stress state, which eventually results in small dimples as observed above.
3.2. Effects of Strain Rate on Biaxial Tensile Properties
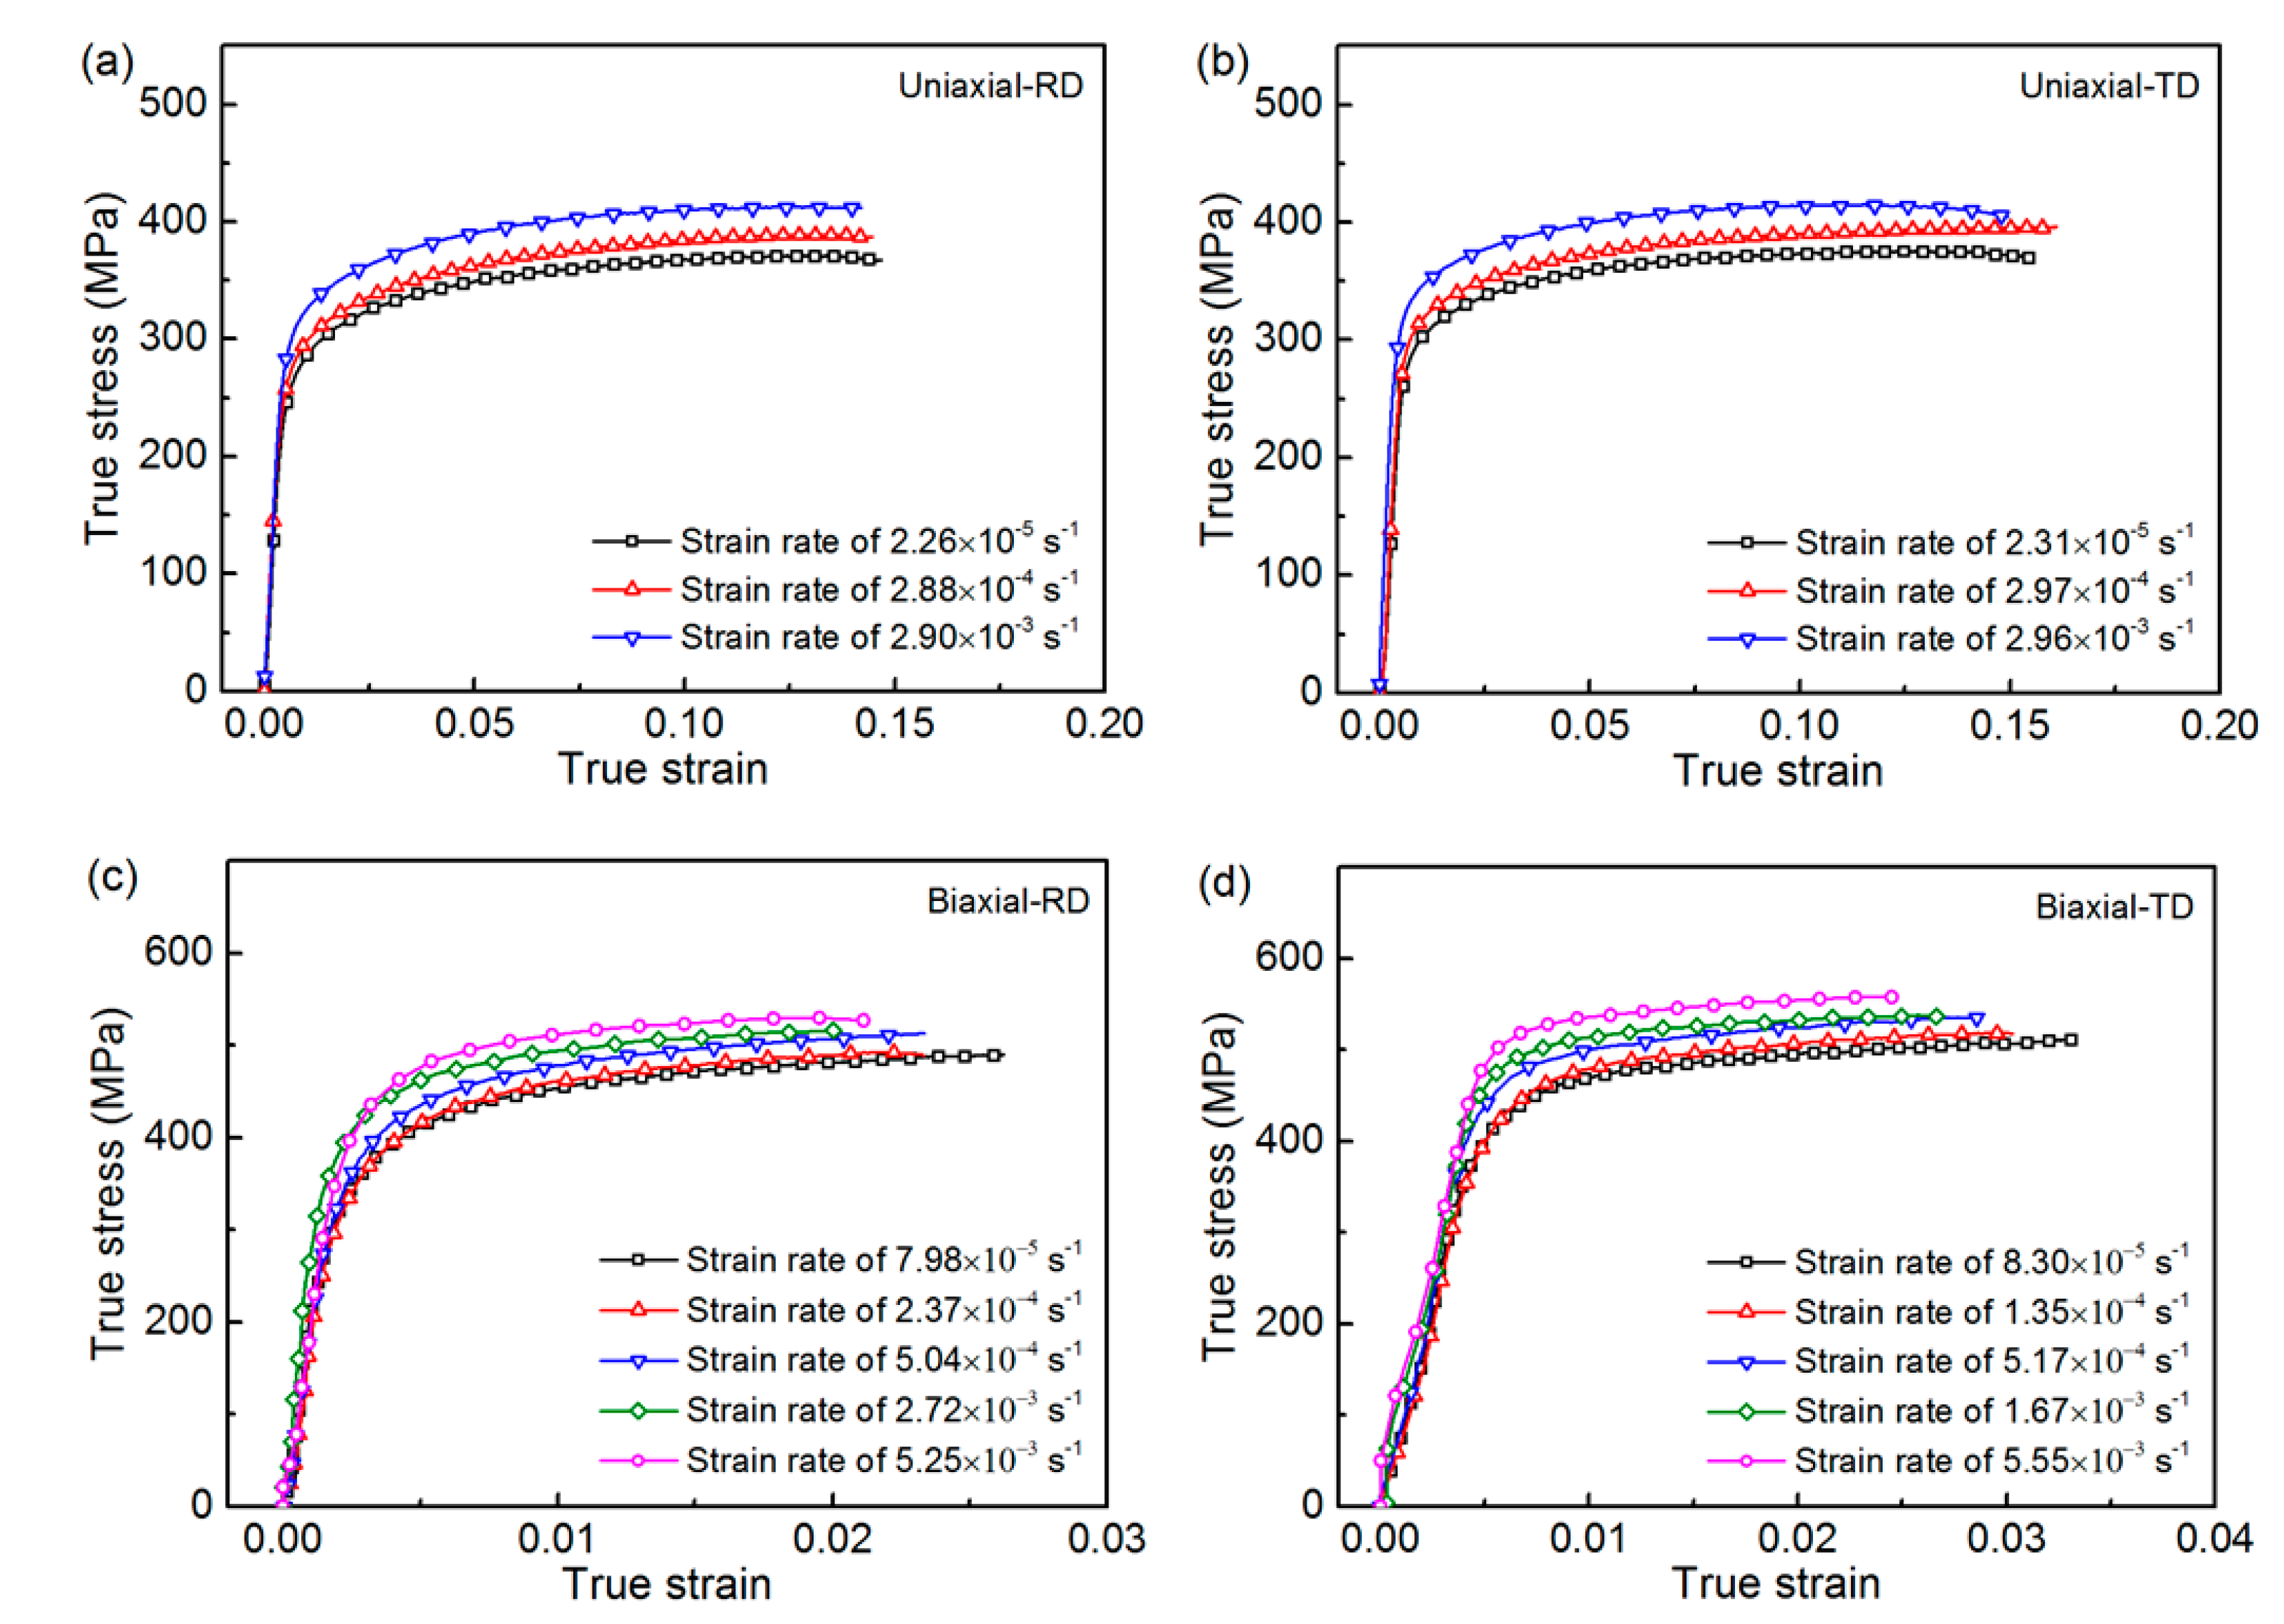
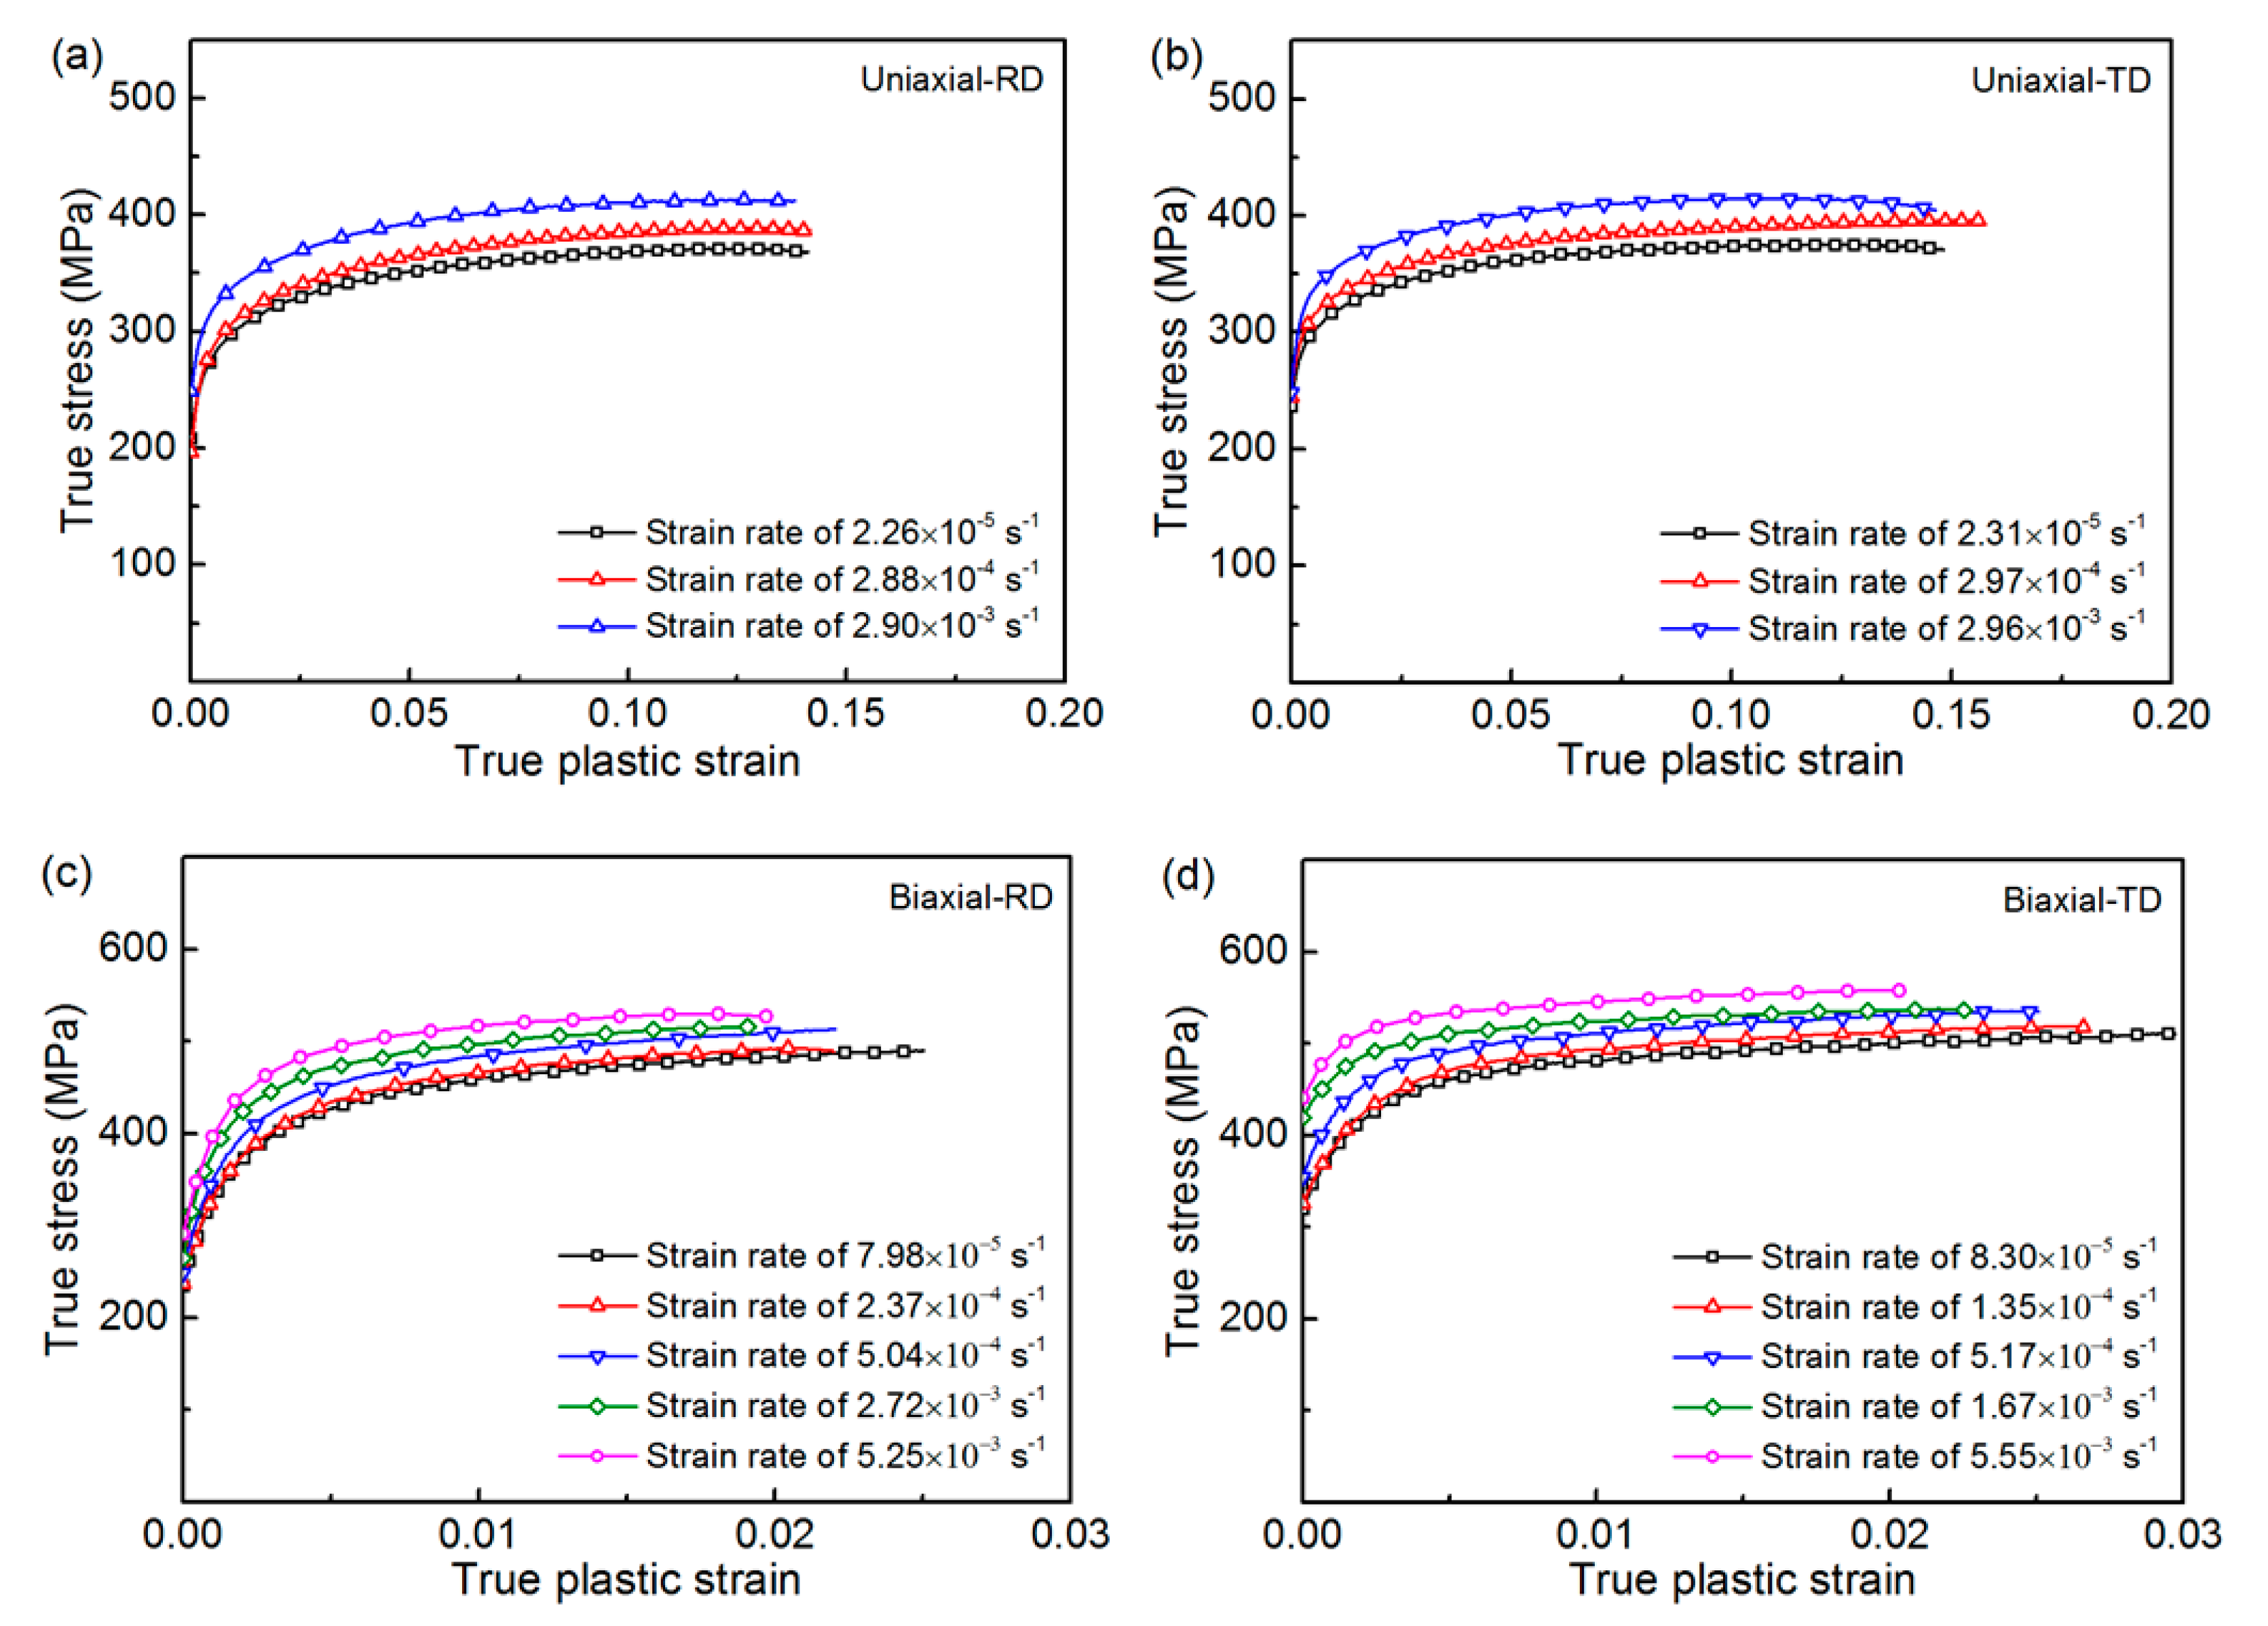
The effects of strain rate on uniaxial and biaxial tensile curves of CP-Ti are shown in Figure 10. The true plastic strain and true stress curves are also shown in Figure 11. The true plastic strains were calculated by the following equations [29]:
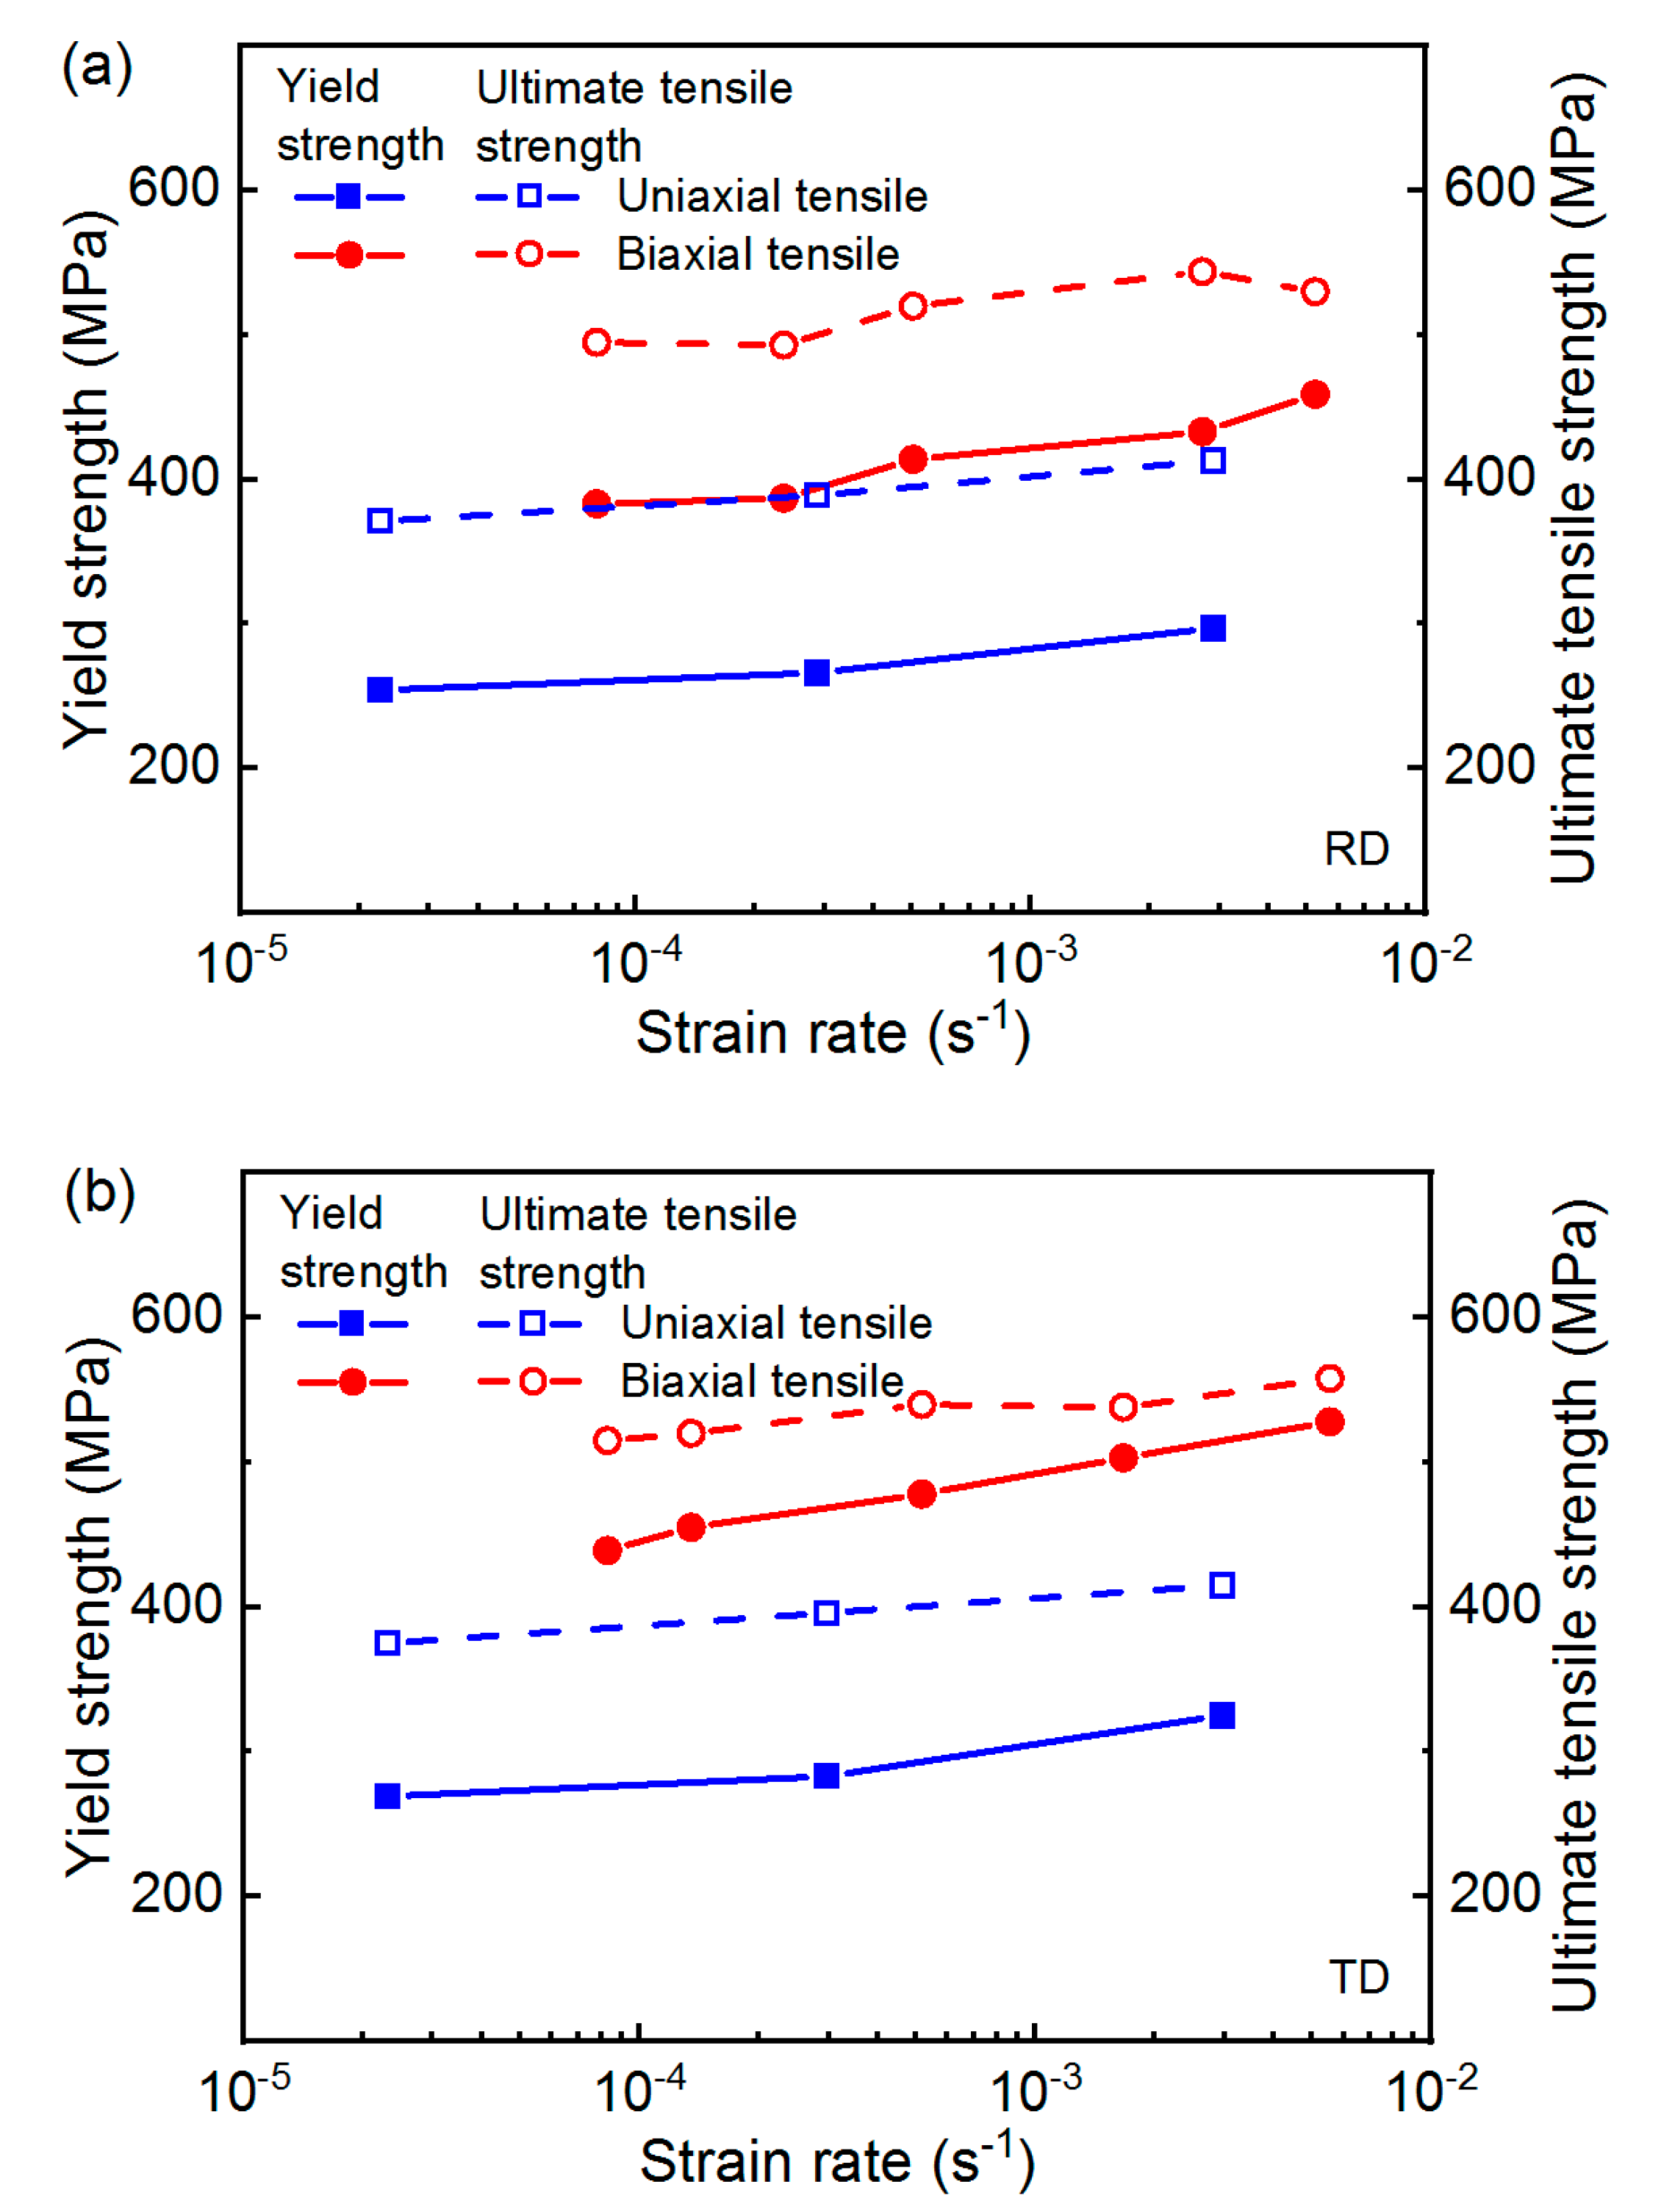
where εip (i = x, y) is the true plastic strain, Ci (i = x, y) is the slope of the elastic part of the true stress-strain curve measure in the biaxial tensile test, expressed in MPa, εi (i = x, y) is the true strain, σi (i = x, y) is the true stress, expressed in MPa. It is observed from Figure 10 and Figure 11 that the characters of stress-strain curves of biaxial tensile are similar with those of uniaxial tensile. The strain hardening behavior was enhanced by increasing strain rate either in uniaxial tensile or in biaxial tensile. Nevertheless, the elongation at biaxial tensile seems less than that at uniaxial tensile. To further elucidate the evolution of tensile properties of CP-Ti, the variation of tensile strength with respect to strain rate is listed in Table 2 and shown in Figure 12. From the figure above we can see that the yield strength and ultimate tensile strength all increase gradually with the increase in strain rate and display linear-log relationships with the strain rate. In addition, the biaxial strengthening of CP-Ti is also obvious. The yield strength and ultimate tensile strength in biaxial tensile are higher than that in uniaxial tensile, up to 1.6 times. Since the tensile plastic deformation is generally dominated by dislocation motion [42,43], the effect of strain rate on tensile response is reasonably ascribed to the difference in dislocation motion. Roth et al. [34] reported that the balance between the activities of different slip systems at the beginning of tensile plastic deformation significantly depends on the strain rate. The increase in strain rate reinforces the dominant slip systems, which in turn leads to accentuated plastic strain. Hence, the tensile strength dependence on the strain rate was observed.
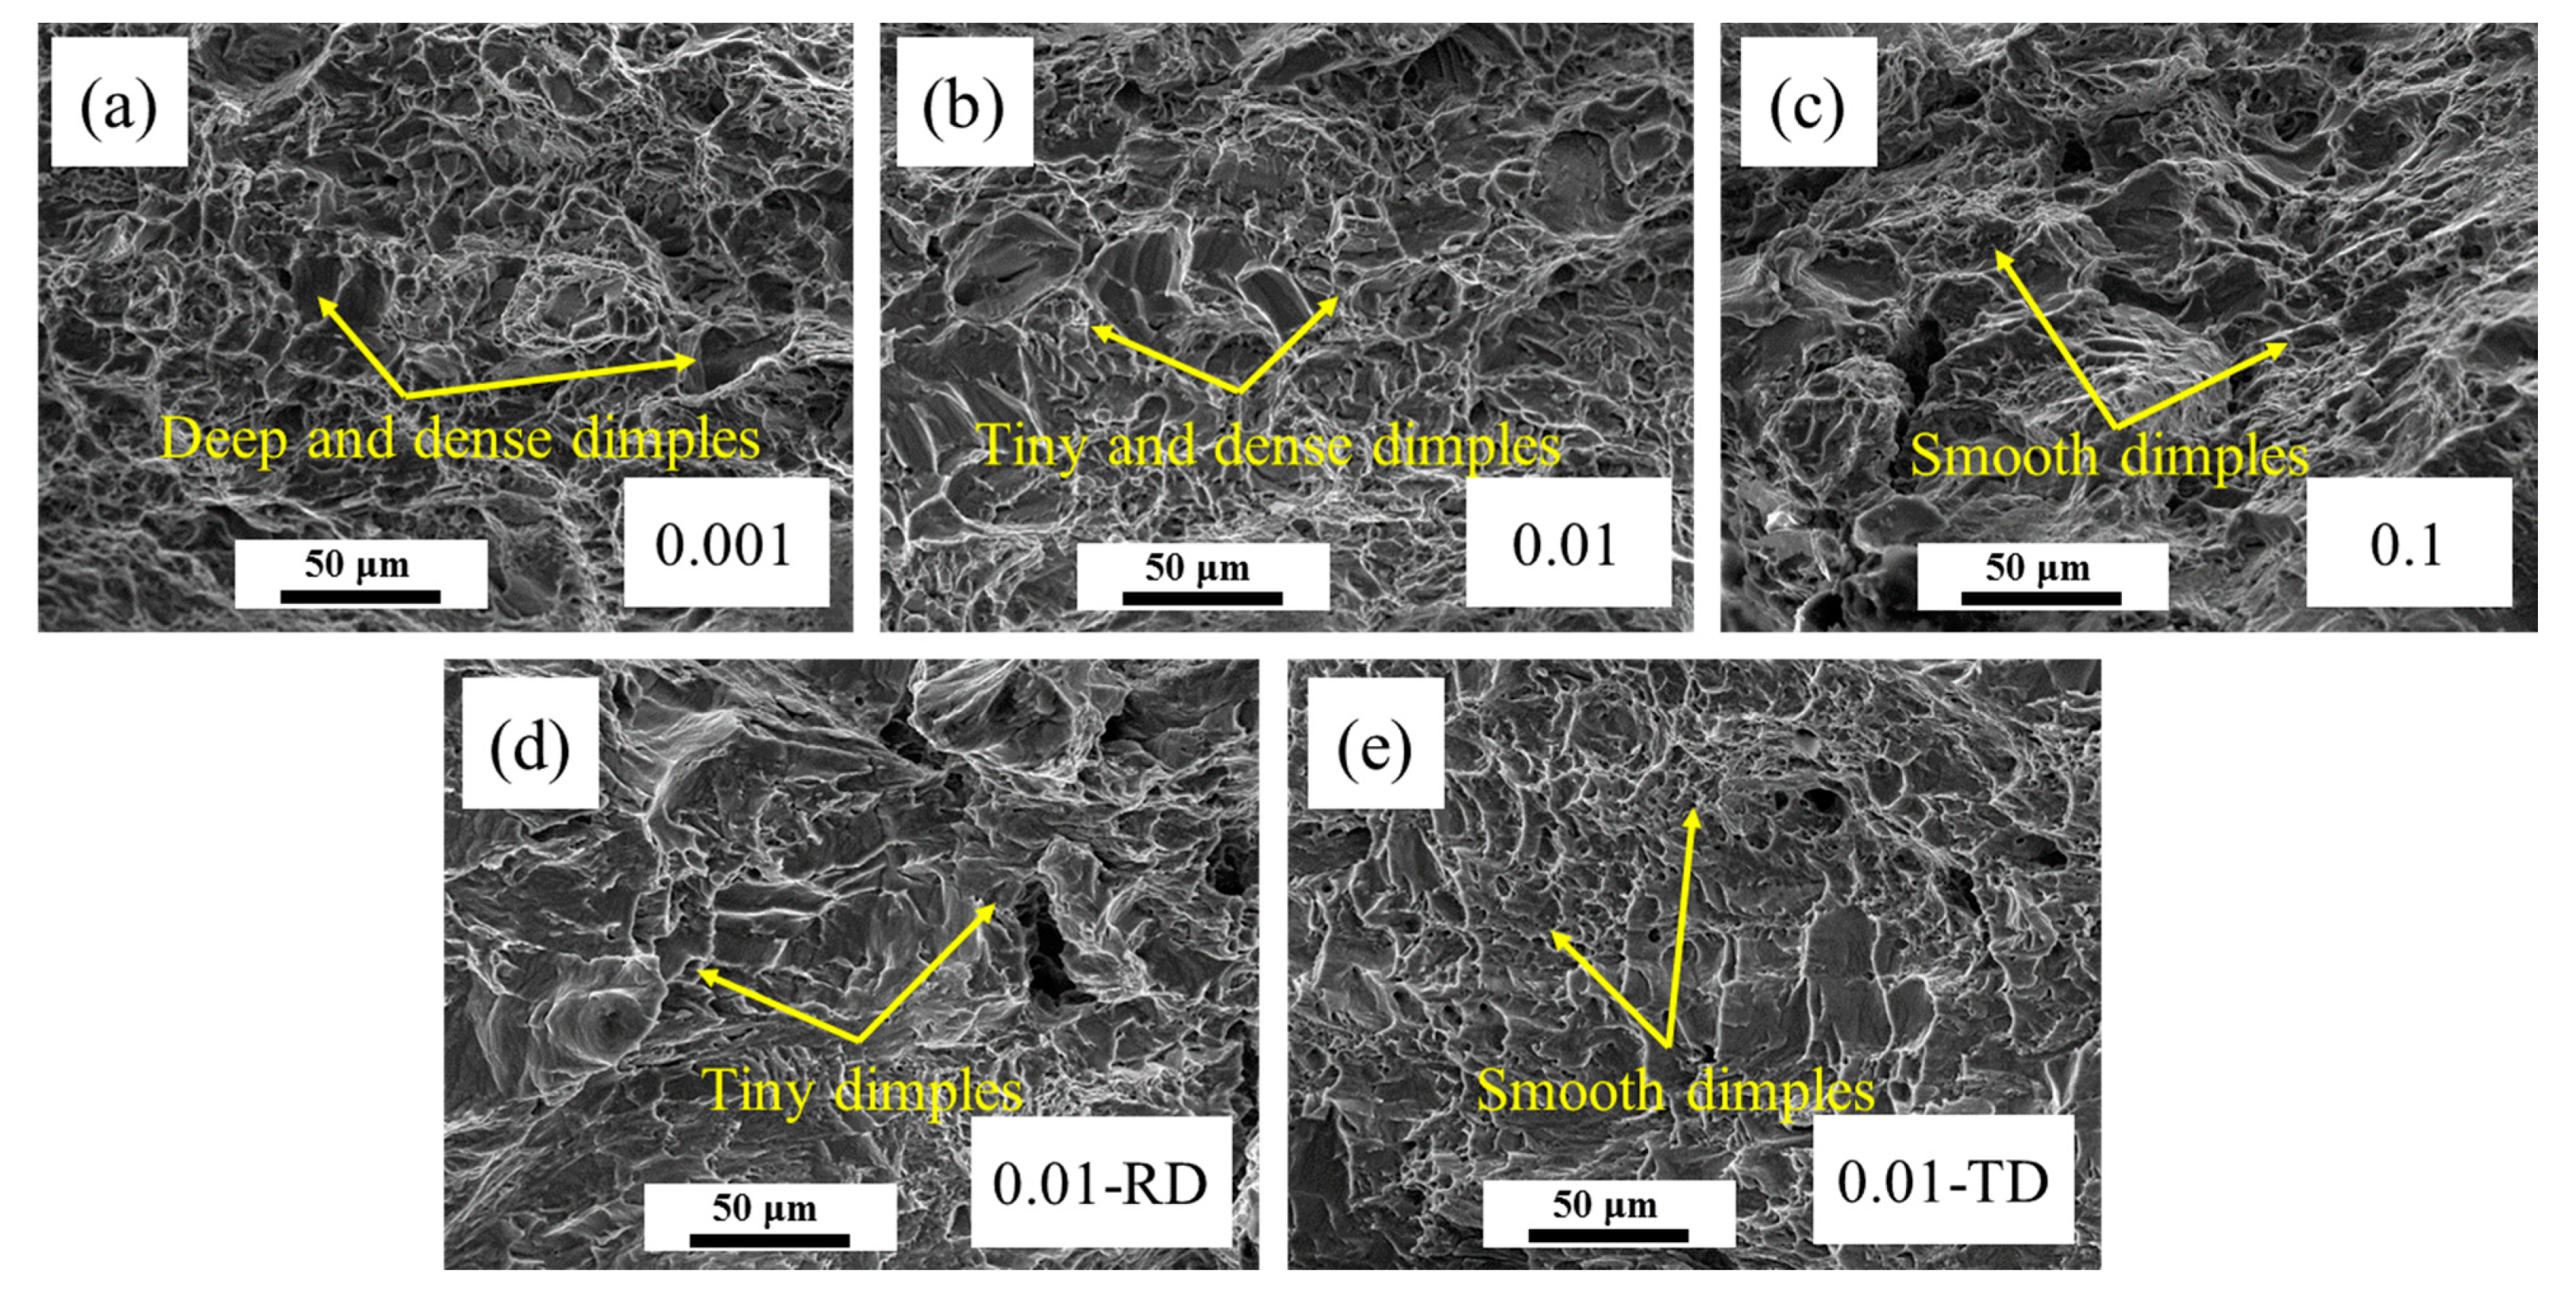
The fractographs of tensile failed specimens under various displacement rates are presented in Figure 13. The fracture surfaces also reveal the presence of dimples as observed in Figure 9. Compared with the low strain rate specimen, a slight smooth of dimple shape was observed when the strain rate increased, suggesting the reduction in ductility [44], which is consistent with the decreased elongation present in Figure 11. Moreover, detailed observation on Figure 13c reveals a brittle fracture features. As mentioned above, the void nucleation, growth, and void linking were significantly related to stress state, it is not difficult to deduce that high strain rate induces higher tri-axial stress. In addition, the comparison between Figure 13b,d,e still demonstrates that the ductility under uniaxial tensile is slightly higher than that under biaxial tensile as observed in tensile strain response (Figure 10 and Figure 11).
3.3. A Modified Johnson–Cook Model under Various Strain Rates of Biaxial Loading
As observed, the strain response shows a hardening behavior under biaxial tensile condition as compared to uniaxial tensile. Consequently, it is essential to characterize the tensile response under biaxial loading from the point view of model simulation. Delobelle et al. [28] proposed a rheological model to account for the existence of two types of viscoplastic flow in 316 austenite stainless steel under biaxial loading. Abbassi et al. [45] developed a finite element model of uniaxial and biaxial tensile tests, where a ductile damage model Gurson–Tvergaard–Needleman was used to describe material deformation involving damage evolution. Nevertheless, few previous studies have given sufficient consideration to the model of metal under various strain rates of biaxial loading. In this section, a modified Johnson–Cook (JC) model was proposed to capture the effect of strain rate on biaxial tensile deformation of CP-Ti.
The traditional JC model can be expressed as:
where σ is the equivalent flow stress expressed in MPa, ε is the equivalent plastic strain, is the strain rate, A is the yield stress at reference temperature and reference strain rate expressed in MPa, B is the coefficient of strain-hardening, n is the strain hardening exponent, C is the coefficient of strain rate hardening, is the reference strain rate, T is the current temperature expressed in K, Tr is the reference temperature expressed in K, Tm is the material melting temperature expressed in K, m is the thermal softening exponent [46,47]. The items , and describe the influence of stain hardening, strain rate and temperature, respectively.
To take into account the effect of strain hardening behavior under biaxial loading, the item (A + Bεn) that describing the influence of strain hardening will be accordingly modified. Consequently, a modified JC model is developed to describe the tensile deformation under biaxial loading and listed as follows:
where B2exp(n2ε) is proposed to consider the biaxially strain hardening behavior, B2 and n2 are material constants. In the present work, since the test and reference temperatures were taken as the room temperature, therefore the modified model can be rewritten as:
The model parameters were determined as follows: first, the uniaxial tensile test with the lowest strain rate (Figure 11a,b) was selected as the reference test, therefore the parameter A is the yield strength at reference condition; When ε = 0, the Equation (7) becomes:
The parameter C was determined by fitting the biaxial tensile curves at the lowest strain rate that are shown in Figure 11c,d (black line); The remnant parameters was determined by fitting the tensile curves shown in Figure 11c,d. The determined parameters of the modified model for biaxially tensile condition at RD and TD are listed in Table 3 and Table 4, respectively.
Since the parameters B1, B2, and n2 are strain rate dependent, therefore, the parameters B1, B2, and n2 at RD and TD biaxial tensile can be, respectively, fitted and expressed as:
Consequently, the final modified model for CP-Ti under biaxial loading can be obtained as follows:
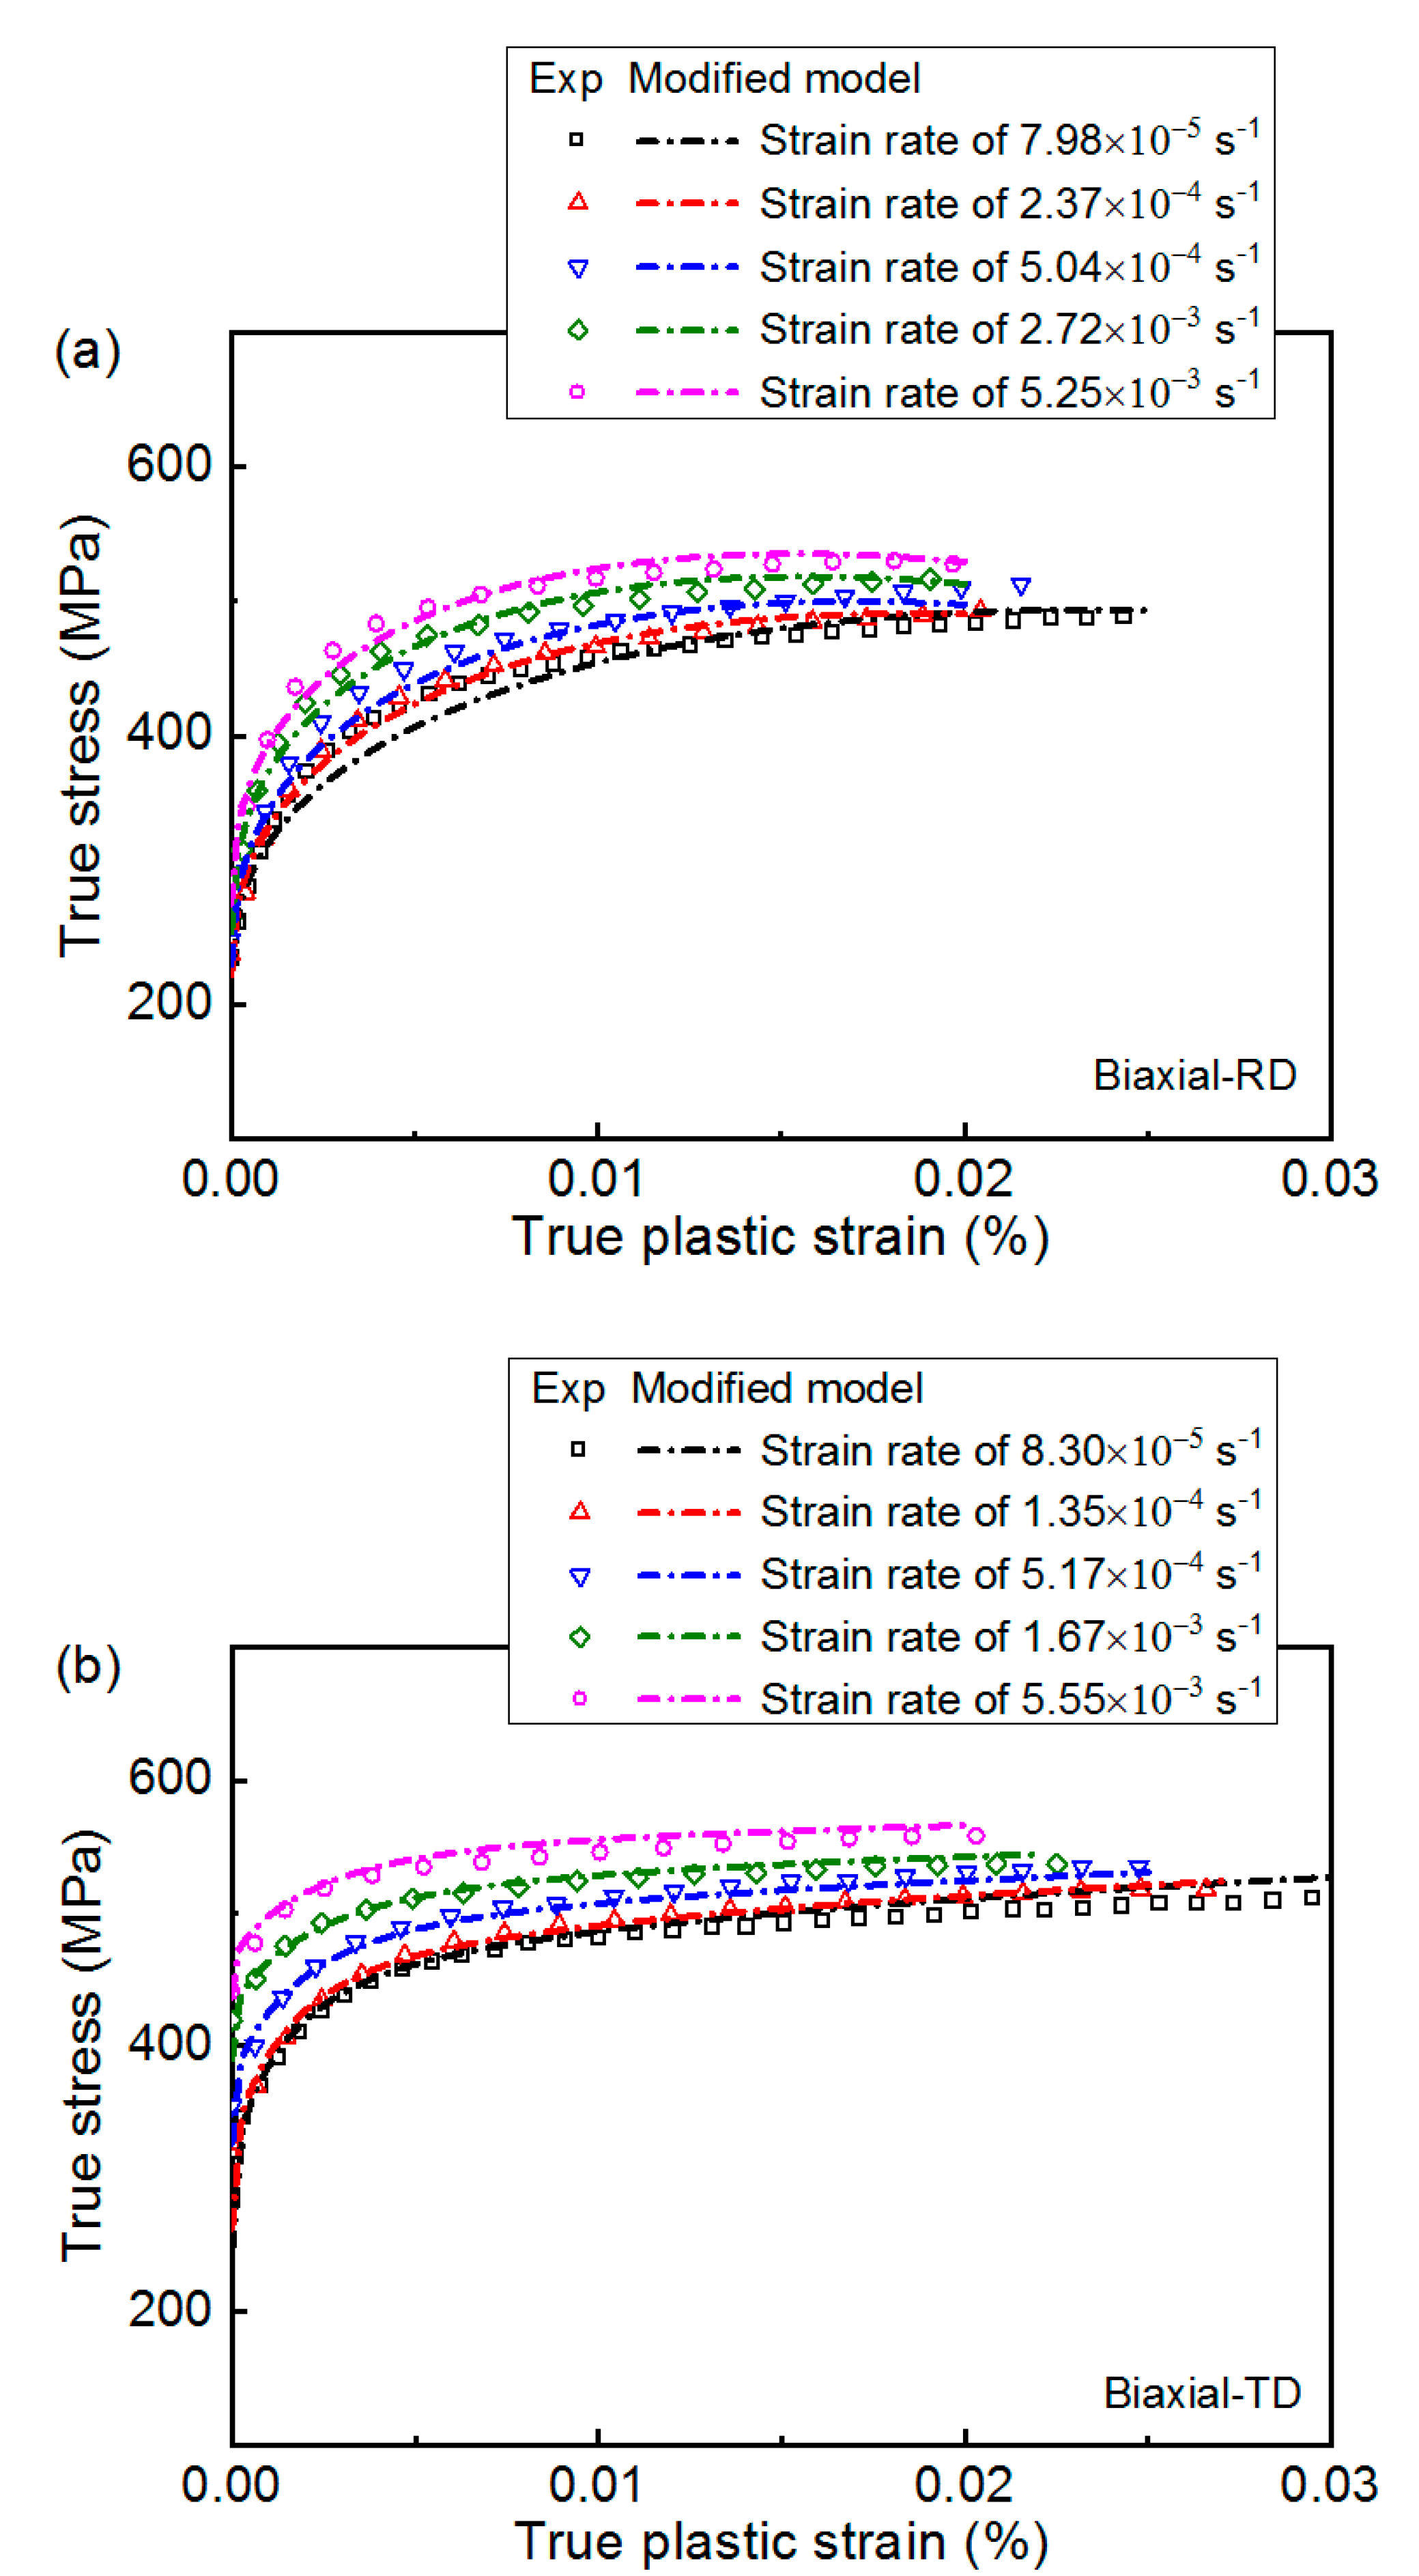
To demonstrate the accuracy of the modified model, experimental tensile curves (expressed by points) and simulated tensile curves (expressed by line) at RD and TD directions were compared. Figure 14 firstly shows the comparison of the experimental and simulated tensile results of the traditional JC model. The model parameters used in the traditional JC model were determined using the optimization program and listed in Table 5. It is noted that although the traditional JC model can account for the effect of strain rate and biaxial strain hardening behavior, evident deviation was observed. The higher the strain rate is, the higher deviation between experimental and simulated results, indicating that the traditional JC model obtained from uniaxial tests may not be appropriate for biaxial loading. Nevertheless, it can be seen that the simulated results with the modified model almost overlap with the experimental data, as shown in Figure 15, suggesting the modified model with the obtained parameters can satisfactorily describe the tensile deformation. Not only the effect of strain rate but also the biaxial strain hardening behavior can be captured by the modified model.
In order to further validate the reliability of the modified model, mean absolute error (MAE) and root mean square error (RMSE) [48,49] between experimental and predicted data of the two models were compared. The MAE and RMSE are expressed respectively as:
where σExp and σModel are experimental stress and predicted stress obtained by model, respectively, N is the number of samples. The obtained MAE and RMSE between experimental and predicted results of the two models are listed in Table 6. It can be observed that not only the MAE but also the RMSE of the proposed model is lower than that of the original JC model, which validates the reliability of the proposed model as well. In conclusion, the modified model can satisfactorily predict the tensile response of CP-Ti under biaxial loading.
4. Conclusions
In this work, the biaxial tensile behavior of commercially pure titanium under various load ratios and strain rates was investigated. Biaxial loadings with load ratio ranging from 4:0 to 0:4 and displacement rate ranging from 0.001 to 0.1 mm/s were examined. The main conclusions are as follows:
- The tensile strength of CP-Ti shows a significant improvement under biaxial tensile. Yield strength and ultimate tensile strength of biaxial sample are greater than that of uniaxial sample, in which the equi-biaxial sample shows the highest strength.
- The tensile strength of CP-Ti is strain rate dependent. Increase in strain rate leads to remarkable improvement of tensile strength. Decreased dimple size and depth in biaxially tested specimens are also observed with increase in strain rate.
- By considering the effect of biaxially strain hardening behavior, the modified JC constitutive model is capable of capturing the effect of strain rate on biaxial tensile response.
Author Contributions
Conceptualization, W.Z.; methodology, W.Z. and Z.Z.; investigation, W.Z. and Z.Z.; resources, C.Z. and X.H.; data curation, Z.Z.; writing—original draft preparation, W.Z.; writing—review and editing, C.Z.; visualization, W.Z. and Z.Z.; supervision, C.Z. and X.H.; project administration, C.Z. and X.H.; funding acquisition, C.Z. and X.H.; All authors have read and agreed to the published version of the manuscript.
Funding
This research was funded by National Natural Science Foundation of China, grant number 51675260, 51975271 and 51475223.
Institutional Review Board Statement
Not applicable.
Informed Consent Statement
Not applicable.
Data Availability Statement
Not applicable.
Conflicts of Interest
The authors declare no conflict of interest.
References
- Shah, F.A.; Trobos, M.; Thomsen, P.; Palmquist, A. Commercially pure titanium (cp-Ti) versus titanium alloy (Ti6Al4V) materials as bone anchored implants—Is one truly better than the other? Mater. Sci. Eng. C 2016, 62, 960–966. [Google Scholar] [CrossRef]
- Chang, L.; Zhou, B.B.; Ma, T.H.; Li, J.; He, X.H.; Zhou, C.Y. The difference in low cycle fatigue behavior of CP-Ti under fully reversed strain and stress controlled modes along rolling direction. Mater. Sci. Eng. A 2019, 742, 211–223. [Google Scholar] [CrossRef]
- Clausen, B.; Lorentzen, T.; Bourke, M.A.; Daymond, M.R. Lattice strain evolution during uniaxial tensile loading of stainless steel. Mater. Sci. Eng. A 1999, 259, 17–24. [Google Scholar] [CrossRef]
- Fan, G.J.; Fu, L.F.; Choo, H.; Liaw, P.K.; Browning, N.D. Uniaxial tensile plastic deformation and grain growth of bulk nanocrystalline alloys. Acta Mater. 2006, 54, 4781–4792. [Google Scholar] [CrossRef]
- Chen, X.; Jin, D.; Kim, K.S. Fatigue life prediction of type 304 stainless steel under sequential biaxial loading. Int. J. Fatig. 2006, 28, 289–299. [Google Scholar] [CrossRef]
- Jones, C.; Green, R. Pulled in different directions. Mater. World 2001, 9, 19–21. [Google Scholar]
- Khan, A.S.; Farrokh, B. Thermo-mechanical response of nylon 101 under uniaxial and multi-axial loadings: Part I, Experimental results over wide ranges of temperatures and strain rates. Int. J. Plast. 2006, 22, 1506–1529. [Google Scholar] [CrossRef]
- Peng, J.; Zhou, C.Y.; Dai, Q.; He, X.H. An improved constitutive description of tensile behavior for CP-Ti at ambient and intermediate temperatures. Mater. Des. 2013, 50, 968–976. [Google Scholar] [CrossRef]
- Dastidar, I.G.; Khademi, V.; Bieler, T.R.; Pilchak, A.L.; Crimp, M.A.; Boehlert, C.J. The tensile and tensile-creep deformation behavior of Ti–8Al–1Mo–1V (wt%). Mater. Sci. Eng. A 2015, 636, 289–300. [Google Scholar] [CrossRef] [Green Version]
- Zeng, Z.; Jonsson, S.; Zhang, Y. Constitutive equations for pure titanium at elevated temperatures. Mater. Sci. Eng. A 2009, 505, 116–119. [Google Scholar] [CrossRef]
- Kulawinski, D.; Ackermann, S.; Seupel, A.; Lippmann, T.; Henkel, S.; Kuna, M.; Weidner, A.; Biermann, H. Deformation and strain hardening behavior of powder metallurgical TRIP steel under quasi-static biaxial-planar loading. Mater. Sci. Eng. A 2015, 642, 317–329. [Google Scholar] [CrossRef]
- Cheng, C.; Wan, M.; Meng, B.; Zhao, R.; Han, W.P. Size effect on the yield behavior of metal foil under multiaxial stress states: Experimental investigation and modelling. Int. J. Mech. Sci. 2019, 151, 760–771. [Google Scholar] [CrossRef]
- Wolf, C.H.; Burgold, A.; Henkel, S.; Kuna, M.; Biermann, H. Crack growth behaviour in biaxial stress fields: Calculation of K-factors for cruciform specimens. Theor. Appl. Fract. Mec. 2020, 107, 102521. [Google Scholar] [CrossRef]
- Wolf, C.H.; Henkel, S.; Biermann, H. Behaviour of metastable and stable austenitic stainless steels under planar-biaxial load. In Austenitic TRIP/TWIP Steels and Steel-Zirconia Composites; Springer: Berlin/Heidelberg, Germany, 2020; pp. 451–483. [Google Scholar]
- Kleemola, H.J.; Ranta-Eskola, A.J. Comparison of the strain-hardening parameters of sheet metals in uniaxial and biaxial tension. Metall. Mater. Trans. A 1976, 7, 595–599. [Google Scholar] [CrossRef]
- Kubo, M.; Nakazawa, Y.; Yoshida, H.; Yonemura, S.; Hama, T.; Takuda, H. Effect of microstructure variation on differential hardening behavior of steel sheets under biaxial tensile state. ISIJ Int. 2016, 56, 2259–2266. [Google Scholar] [CrossRef]
- Liu, W.; Guines, D.; Leotoing, L.; Ragneau, E. Identification of strain rate-dependent mechanical behaviour of DP600 under in-plane biaxial loadings. Mater. Sci. Eng. A 2016, 676, 366–376. [Google Scholar] [CrossRef]
- Kuwabara, T.; Kuroda, M.; Tvergaard, V. Use of abrupt strain path change for determining subsequent yield surface: Experimental study with metal sheets. Acta Mater. 2000, 48, 2071–2079. [Google Scholar] [CrossRef]
- Yanaga, D.; Kuwabara, T.; Uema, N.; Asano, M. Material modeling of 6000 series aluminum alloy sheets with different density cube structures and effect on the accuracy of finite element simulation. Int. J. Solids Struct. 2012, 49, 3488–3495. [Google Scholar] [CrossRef] [Green Version]
- Xiao, R.; Li, X.X.; Lang, L.H.; Song, Q.; Liu, K.N. Forming limit in thermal cruciform biaxial tensile testing of titanium alloy. J. Mater. Process. Tech. 2017, 240, 354–361. [Google Scholar] [CrossRef]
- Xiao, R.; Li, X.X.; Lang, L.H.; Chen, Y.K.; Yang, Y.F. Biaxial tensile testing of cruciform slim superalloy at elevated temperatures. Mater. Des. 2016, 94, 286–294. [Google Scholar] [CrossRef]
- Srinivasan, N.; Velmurugan, R.; Kumar, R.; Singh, S.K.; Pant, B. Deformation behavior of commercially pure (CP) titanium under equi-biaxial tension. Mater. Sci. Eng. A 2016, 674, 540–551. [Google Scholar] [CrossRef]
- Ambroziak, A. Mechanical properties of Precontraint 1202S coated fabric under biaxial tensile test with different load ratios. Constr. Build. Mater. 2015, 80, 210–224. [Google Scholar] [CrossRef]
- Broomhead, P.; Grieve, R.J. The effect of strain rate on the strain to fracture of a sheet steel under biaxial tensile stress conditions. J. Eng. Mater.-T. ASME 1982, 104, 102–106. [Google Scholar] [CrossRef]
- Johnson, G.R.; Cook, W.H. Fracture characteristics of three metals subjected to various strains, strain rates, temperatures and pressures. Eng. Fract. Mech. 1985, 21, 31–48. [Google Scholar] [CrossRef]
- Khan, A.S.; Huang, S. Experimental and theoretical study of mechanical behavior of 1100 aluminum in the strain rate range 10−5− 104 s−1. Int. J. Plast. 1992, 8, 397–424. [Google Scholar] [CrossRef]
- Lee, W.S.; Liu, C.Y. The effects of temperature and strain rate on the dynamic flow behaviour of different steels. Mater. Sci. Eng. A 2006, 426, 101–113. [Google Scholar] [CrossRef]
- Delobelle, P.; Oytana, C. Modeling of 316 Stainless Steel (17.12 Sph.) Mechanical properties using biaxial experiments—Part II: Model and simulation. J. Press. Vess-T. ASME 1987, 109, 455–459. [Google Scholar] [CrossRef]
- Metallic Materials—Sheet and Strip—Biaxial Tensile Testing Method Using a Cruciform Test Piece. ISO 16842. 1 October 2014.
- Zhu, Z.; Lu, Z.; Zhang, P.; Fu, W.; Zhou, C.; He, X. Optimal design of a miniaturized cruciform specimen for biaxial testing of ta2 alloys. Metals 2019, 9, 823. [Google Scholar] [CrossRef] [Green Version]
- Benito, J.A.; Jorba, J.; Manero, J.M.; Roca, A. Change of young’s modulus of cold-deformed pure iron in a tensile test. Metall. Mater. Trans. A 2005, 36, 3317–3324. [Google Scholar] [CrossRef]
- Nixon, M.E.; Lebensohn, R.A.; Cazacu, O.; Liu, C. Experimental and finite-element analysis of the anisotropic response of high-purity α-titanium in bending. Acta Mater. 2010, 58, 5759–5767. [Google Scholar] [CrossRef]
- Murasawa, G.; Morimoto, T.; Yoneyama, S. Nucleation and growth behavior of twin region around yield point of polycrystalline pure Ti. Exp. Mech. 2012, 52, 503–512. [Google Scholar] [CrossRef]
- Roth, A.; Lebyodkin, M.A.; Lebedkina, T.A.; Lecomte, J.S.; Richeton, T.; Amouzou, K.E.K. Mechanisms of anisotropy of mechanical properties of α-titanium in tension conditions. Mater. Sci. Eng. A 2014, 596, 236–243. [Google Scholar] [CrossRef]
- Zhang, F.; Liu, Z.; Yang, M.; Su, G.; Zhao, R.; Mao, P.; Wang, F.; Sun, S. Microscopic mechanism exploration and constitutive equation construction for compression characteristics of AZ31-TD magnesium alloy at high strain rate. Mater. Sci. Eng. A 2020, 771, 138571. [Google Scholar] [CrossRef]
- Härtel, M.; Pfeiffer, S.; Schmaltz, S.; Söhngen, B.; Kulawinski, D.; Willner, K.; Henkel, S.; Biermann, H.; Wagner, M.F. On the identification of an effective cross section for a cruciform specimen. Strain 2018, 54, 12257. [Google Scholar] [CrossRef]
- Zhu, Z. Investigation on Tensile Mechanical Behavior of Commercial Pure Titanium TA2 under Biaxial Loading. Master’s Thesis, Nanjing Tech University, Nanjing, China, 2020. [Google Scholar]
- Chen, G.; Feng, S.; Zhang, X.; Cui, Y.; Shi, S. Deformation mechanisms of zirconium alloys under biaxial tension at room temperature. Mater. Lett. 2020, 271, 127773. [Google Scholar] [CrossRef]
- Das, A. Effect of stress state on fracture features. Metall. Mater. Trans. A 2018, 49, 1425–1432. [Google Scholar] [CrossRef]
- Kestner, S.C.; Koss, D.A. On the influence of strain-path changes on fracture. Metall. Mater. Trans. A 1987, 18, 637–639. [Google Scholar] [CrossRef] [Green Version]
- Ghosh, A.K. A criterion for ductile fracture in sheets under biaxial loading. Metall. Mater. Trans. A 1976, 7, 523–533. [Google Scholar] [CrossRef]
- Mompiou, F.; Caillard, D.; Legros, M.; Mughrabi, H. In situ TEM observations of reverse dislocation motion upon unloading in tensile-deformed UFG aluminium. Acta Mater. 2012, 60, 3402–3414. [Google Scholar] [CrossRef]
- Lu, J.Z.; Wu, L.J.; Sun, G.F.; Luo, K.Y.; Zhang, Y.K.; Cai, J.; Cui, C.Y.; Luo, X.M. Microstructural response and grain refinement mechanism of commercially pure titanium subjected to multiple laser shock peening impacts. Acta Mater. 2017, 127, 252–266. [Google Scholar] [CrossRef]
- Martínez, R.A. Fracture surfaces and the associated failure mechanisms in ductile iron with different matrices and load bearing. Eng. Fract. Mech. 2010, 77, 2749–2762. [Google Scholar] [CrossRef]
- Abbassi, F.; Mistou, S.; Zghal, A. Failure analysis based on microvoid growth for sheet metal during uniaxial and biaxial tensile tests. Mater. Des. 2013, 49, 638–646. [Google Scholar] [CrossRef] [Green Version]
- Samantaray, D.; Mandal, A.K. A Bhaduri, Comparative study on Johnson Cook, modified Zerilli-Armstrong and Arrhenius-type constitutive models to predict elevated temperature flow behaviour in modified 9Cr–1Mo steel. Comp. Mater. Sci. 2009, 47, 568–576. [Google Scholar] [CrossRef]
- Zhang, W.; Wang, X.; Chen, H.; Zhang, T.; Gong, J. A modified constitutive model for tensile deformation of 9% Cr steel under prior fatigue loading. Mech. Mater. 2019, 136, 103093. [Google Scholar] [CrossRef]
- Lostado-Lorza, R.; Escribano-García, R.; Fernandez-Martinez, R.; Martínez-Calvo, M.Á. Using genetic algorithms with multi-objective optimization to adjust finite element models of welded joints. Metals 2018, 8, 230. [Google Scholar] [CrossRef] [Green Version]
- Íñiguez-Macedo, S.; Lostado-Lorza, R.; Escribano-García, R.; Martínez-Calvo, M.Á. Finite element model updating combined with multi-response optimization for hyper-elastic materials characterization. Materials 2019, 12, 1019. [Google Scholar] [CrossRef] [Green Version]
Figure 1.
(a) Schematic of specimen orientation and dimensions of (b) uniaxial and (c) biaxial tensile specimen (unit: mm).
Figure 1.
(a) Schematic of specimen orientation and dimensions of (b) uniaxial and (c) biaxial tensile specimen (unit: mm).

Figure 2.
(a) DIC and biaxial tensile testing machine, (b) clamping device and speckle pattern (where Fx represents load at rolling direction and Fy represents load at transverse direction).
Figure 2.
(a) DIC and biaxial tensile testing machine, (b) clamping device and speckle pattern (where Fx represents load at rolling direction and Fy represents load at transverse direction).

Figure 3.
Schematic representation of the method to determined actual strain rate.

Figure 4.
Strain contour plots at various load ratios (100 MPa): (a) 0:4, (b) 1:4, (c) 2:4, (d) 3:4, (e) 4:4, (f) 4:3, (g) 4:2, (h) 4:1, (i) 4:0.
Figure 4.
Strain contour plots at various load ratios (100 MPa): (a) 0:4, (b) 1:4, (c) 2:4, (d) 3:4, (e) 4:4, (f) 4:3, (g) 4:2, (h) 4:1, (i) 4:0.

Figure 5.
Strain contour plots of uniaxial RD tensile sample at various load steps: (a) initial stage, (b) yield stage, (c) ultimate tensile stage, (d) prior to failure.
Figure 5.
Strain contour plots of uniaxial RD tensile sample at various load steps: (a) initial stage, (b) yield stage, (c) ultimate tensile stage, (d) prior to failure.

Figure 6.
Strain contour plots of equi-biaxial tensile sample at various load steps: (a) initial stage, (b) yield stage, (c) ultimate tensile stage, (d) prior to failure.
Figure 6.
Strain contour plots of equi-biaxial tensile sample at various load steps: (a) initial stage, (b) yield stage, (c) ultimate tensile stage, (d) prior to failure.

Figure 7.
True stress-strain curve of CP-Ti at different load ratios: (a) RD, (b) TD.

Figure 8.
Variation of yield strength at different load ratios.

Figure 9.
Fractographs of tensile failed specimens under various load ratios: (a) 0:4, (b) 2:4, (c) 4:4, (d) 4:2, (e) 4:0.
Figure 9.
Fractographs of tensile failed specimens under various load ratios: (a) 0:4, (b) 2:4, (c) 4:4, (d) 4:2, (e) 4:0.

Figure 10.
True stress-strain curve of CP-Ti at various strain rates: (a) uniaxial RD, (b) uniaxial TD, (c) biaxial RD, (d) biaxial TD.
Figure 10.
True stress-strain curve of CP-Ti at various strain rates: (a) uniaxial RD, (b) uniaxial TD, (c) biaxial RD, (d) biaxial TD.

Figure 11.
True stress-plastic strain curve of CP-Ti at various strain rates: (a) uniaxial RD, (b) uniaxial TD, (c) biaxial RD, (d) biaxial TD.
Figure 11.
True stress-plastic strain curve of CP-Ti at various strain rates: (a) uniaxial RD, (b) uniaxial TD, (c) biaxial RD, (d) biaxial TD.

Figure 12.
Variation of tensile strength with respect to strain rate: (a) tensile strength at RD, (b) tensile strength at TD.
Figure 12.
Variation of tensile strength with respect to strain rate: (a) tensile strength at RD, (b) tensile strength at TD.

Figure 13.
Fractographs of tensile failed specimens under various displacement rates: (a) biaxial, 0.001 mm/s, (b) biaxial, 0.01 mm/s, (c) biaxial, 0.1 mm/s, (d) uniaxial-RD, 0.01 mm/s, (e) uniaxial-TD, 0.01 mm/s.
Figure 13.
Fractographs of tensile failed specimens under various displacement rates: (a) biaxial, 0.001 mm/s, (b) biaxial, 0.01 mm/s, (c) biaxial, 0.1 mm/s, (d) uniaxial-RD, 0.01 mm/s, (e) uniaxial-TD, 0.01 mm/s.

Figure 14.
Comparison of predicted tensile curves of JC model and experimental tensile curves at biaxial RD (a) and TD (b).
Figure 14.
Comparison of predicted tensile curves of JC model and experimental tensile curves at biaxial RD (a) and TD (b).

Figure 15.
Comparison of predicted tensile curves of the proposed model and experimental tensile curves at biaxial RD (a) and TD (b).
Figure 15.
Comparison of predicted tensile curves of the proposed model and experimental tensile curves at biaxial RD (a) and TD (b).


Table 1.
Biaxial tensile tests data at various load ratios.
| Testing Direction | Load Ratio (RD/TD) | Yield Strength at RD (MPa) | Yield Strength at TD (MPa) |
|---|---|---|---|
| Uniaxial | 0:4 | 280 | |
| Biaxial | 1:4 | 334 | |
| Biaxial | 2:4 | 417 | |
| Biaxial | 3:4 | 332 | 412 |
| Biaxial | 4:4 | 436 | 428 |
| Biaxial | 4:3 | 417 | 355 |
| Biaxial | 4:2 | 387 | |
| Biaxial | 4:1 | 355 | |
| Uniaxial | 4:0 | 310 |
Table 2.
Uniaxial and biaxial tensile tests data at various strain rates.
| Testing Direction | Displacement Ratio (RD/TD) | Displacement Rate (mm/s) | Strain Rate at RD | Strain Rate at TD | Yield Strength at RD (MPa) | Ultimate Tensile Strength at RD (MPa) | Yield Strength at TD (MPa) | Ultimate Tensile Strength at TD (MPa) |
|---|---|---|---|---|---|---|---|---|
| Uniaxial | 0.001 | 2.26 × 10⁻⁵ | 254 | 371 | ||||
| Uniaxial | 0.01 | 2.88 × 10⁻⁴ | 266 | 389 | ||||
| Uniaxial | 0.1 | 2.90 × 10⁻³ | 297 | 413 | ||||
| Uniaxial | 0.001 | 2.31 × 10⁻⁵ | 269 | 375 | ||||
| Uniaxial | 0.01 | 2.97 × 10⁻⁴ | 283 | 396 | ||||
| Uniaxial | 0.1 | 2.96 × 10⁻³ | 325 | 415 | ||||
| Biaxial | 1:1 | 0.001 | 7.98 × 10⁻⁵ | 8.30 × 10⁻⁵ | 383 | 495 | 439 | 515 |
| Biaxial | 1:1 | 0.005 | 2.37 × 10⁻⁴ | 1.35 × 10⁻⁴ | 387 | 493 | 455 | 520 |
| Biaxial | 1:1 | 0.01 | 5.04 × 10⁻⁴ | 5.17 × 10⁻⁴ | 414 | 520 | 478 | 540 |
| Biaxial | 1:1 | 0.05 | 2.72 × 10⁻³ | 1.67 × 10⁻³ | 433 | 544 | 503 | 538 |
| Biaxial | 1:1 | 0.1 | 5.25 × 10⁻³ | 5.55 × 10⁻³ | 459 | 530 | 528 | 558 |
Table 3.
Modified model parameters for biaxially tensile condition at RD.
| Test No. | Strain Rate | A (MPa) | B1 (MPa) | n1 | B2 (MPa) | n2 | C |
|---|---|---|---|---|---|---|---|
| 1 | 7.98 × 10⁻⁵ | 254 | 1254 | 0.45 | −114 | 23 | 0.56 |
| 2 | 2.37 × 10⁻⁴ | 254 | 1192 | 0.45 | −160 | 21.9 | 0.56 |
| 3 | 5.04 × 10⁻⁴ | 254 | 914 | 0.45 | −164 | 15.2 | 0.56 |
| 4 | 2.72 × 10⁻³ | 254 | 783 | 0.45 | −184 | 15.8 | 0.56 |
| 5 | 5.25 × 10⁻³ | 254 | 683 | 0.45 | −183 | 14.1 | 0.56 |
Table 4.
Modified model parameters for biaxially tensile condition at TD.
| Test No. | Strain Rate | A (MPa) | B1 (MPa) | n1 | B2 (MPa) | n2 | C |
|---|---|---|---|---|---|---|---|
| 1 | 8.30 × 10⁻⁵ | 269 | 329 | 0.2 | −54 | −685 | 0.15 |
| 2 | 1.35 × 10⁻⁴ | 269 | 301 | 0.2 | −61 | −541 | 0.15 |
| 3 | 5.17 × 10⁻⁴ | 269 | 201 | 0.2 | −54 | −532 | 0.15 |
| 4 | 1.67 × 10⁻³ | 269 | 127 | 0.2 | −24 | −410 | 0.15 |
| 5 | 5.55 × 10⁻³ | 269 | 80 | 0.2 | −28.4 | −406 | 0.15 |
Table 5.
Traditional JC model parameters for biaxially tensile condition.
| Direction | A (MPa) | B (MPa) | n | C |
|---|---|---|---|---|
| RD-biaxial | 254 | |||
| TD-biaxial | 269 |
Table 6.
Mean absolute error (MAE) and root mean square error (RMSE) between predicted and experimental data.
Table 6.
Mean absolute error (MAE) and root mean square error (RMSE) between predicted and experimental data.
| Model | Error | RD | TD | ||||||||
|---|---|---|---|---|---|---|---|---|---|---|---|
| 7.98 × 10⁻⁵ | 2.37 × 10⁻⁴ | 5.04 × 10⁻⁴ | 2.72 × 10⁻³ | 5.25 × 10⁻³ | 8.30 × 10⁻⁵ | 1.35 × 10⁻⁴ | 5.17 × 10⁻⁴ | 1.67 × 10⁻³ | 5.55 × 10⁻³ | ||
| Original JC model | MAE | 20.91 | 42.46 | 85.98 | 142.15 | 203.00 | 23.09 | 23.87 | 8.54 | 60.47 | 104.18 |
| RMSE | 24.35 | 44.70 | 89.28 | 148.04 | 208.96 | 25.21 | 25.98 | 10.73 | 60.83 | 104.75 | |
| Modified model | MAE | 9.38 | 5.90 | 13.64 | 7.63 | 8.01 | 8.95 | 2.87 | 5.22 | 4.35 | 7.24 |
| RMSE | 11.62 | 7.16 | 19.03 | 8.76 | 9.23 | 11.00 | 4.67 | 5.78 | 6.35 | 7.66 | |
Publisher’s Note: MDPI stays neutral with regard to jurisdictional claims in published maps and institutional affiliations. |
© 2021 by the authors. Licensee MDPI, Basel, Switzerland. This article is an open access article distributed under the terms and conditions of the Creative Commons Attribution (CC BY) license (http://creativecommons.org/licenses/by/4.0/).
Share and Cite
MDPI and ACS Style
Zhang, W.; Zhu, Z.; Zhou, C.; He, X. Biaxial Tensile Behavior of Commercially Pure Titanium under Various In-Plane Load Ratios and Strain Rates. Metals 2021, 11, 155. https://0-doi-org.brum.beds.ac.uk/10.3390/met11010155
AMA Style
Zhang W, Zhu Z, Zhou C, He X. Biaxial Tensile Behavior of Commercially Pure Titanium under Various In-Plane Load Ratios and Strain Rates. Metals. 2021; 11(1):155. https://0-doi-org.brum.beds.ac.uk/10.3390/met11010155
Chicago/Turabian StyleZhang, Wei, Zhikang Zhu, Changyu Zhou, and Xiaohua He. 2021. "Biaxial Tensile Behavior of Commercially Pure Titanium under Various In-Plane Load Ratios and Strain Rates" Metals 11, no. 1: 155. https://0-doi-org.brum.beds.ac.uk/10.3390/met11010155
Note that from the first issue of 2016, this journal uses article numbers instead of page numbers. See further details here.