Article

Interface Quality Indices of Al–10Si–Mg Aluminum Alloy and Cr18–Ni10–Ti Stainless-Steel Bimetal Fabricated via Selective Laser Melting

1
Engine Production Technology Department, Samara National Research University, 34 Moskovskoye Shosse, 443086 Samara, Russia
2
Metal Forming Department, Samara National Research University, 34 Moskovskoye Shosse, 334086 Samara, Russia
3
Samara Federal Research Center of the Russian Academy of Sciences, 3A Studencheskiy Pereulok, 443001 Samara, Russia
4
Almetyevsk State Oil Institute, 2 Ulitsa Lenina, 423450 Almetyevsk, Russia
*
Author to whom correspondence should be addressed.
Submission received: 3 December 2020 / Revised: 11 January 2021 / Accepted: 18 January 2021 / Published: 19 January 2021
(This article belongs to the Special Issue Analysis and Design of Metal-Forming Processes)

Abstract

:
Bimetallic materials are important in many industries (aerospace, medicine, etc.) since they allow the creation of constructions that combine specific functional properties, for example, low density (aluminum alloy) and high corrosion resistance (stainless steel), due to layering fabrication of the bimetallic joint. On the other hand, the difference in thermophysical properties of the dissimilar material layers leads to residual stresses, which cause deformation and destruction of such a bimetallic joint produced via the methods of surfacing or additive technologies. This article discusses the methods based on the gray relational analysis and generalized desirability function for the quality assessment of Al–10Si–Mg aluminum alloy and Cr18–Ni10–Ti stainless-steel bimetal fabricated via selective laser melting (SLM). There are four main parameters (quality indices) of the quality generalized assessment, which determine the degree of Al penetration into the steel substrate and Fe into the deposited layer, the difference in microhardness values on both sides of the interface boundary, and the resistance to mechanical destruction of the bimetallic joint. According to the results obtained, the best set of quality indices corresponds to the SLM technological modes with an energy density of 105 and 147 J/mm3. The greatest functionality of the bimetals is determined by the quality index associated with its strength. Therefore, methods of gray relational analysis and desirability function make it possible to form a generalized assessment for the bimetallic joint quality and, consequently, to select the best technological mode.

1. Introduction

Bimetallic materials are widely used in the medical and aerospace industries, for example, in the fabrication of bimetallic interfaces in joints, where it is necessary to switch from one material to another in a limited space (for example, stainless steel–aluminum alloy interfaces in pneumatic hydraulic systems of launch vehicles).
Bimetallic materials are a type of functional-gradient material (FGM). In FGMs, both the composition and the structure gradually change over the volume, resulting in corresponding changes in the material properties. The structural unit of an FGM refers to a gradient along the thickness direction having a continuously varying spatial composition [1]. The FGM concept applies to many engineering applications, for example, machine parts and engine components with incompatible functions such as heat, wear, corrosion resistance plus toughness, and machinability incorporated into a single part [2]. A separate class of FGMs is made up of metallic layered materials (bimetals) and materials with a large gradient of the composition ingredients in the interface area. These materials include bimetallic compounds such as stainless steel–aluminum alloy and stainless steel–copper alloy and are widely used in the aerospace industry. It should be noted that joining of two or more dissimilar materials in the laminar form often leads to failure owing to delamination, because of poor bonding between the materials, as well as the structural strength and stability of the materials. Furthermore, the difference in the thermal expansion coefficients of these materials is the cause of significant thermal stresses in the interface area during their manufacture and operation. Thus, the object of the present research is the interfacial zone between the layers of the steel–aluminum alloy bimetal. The aim of this research was to develop and test criteria and methods for quantitatively assessing the structural heterogeneity in the interfacial zone and to explore the structural gradient along the thickness direction. These evaluation criteria are necessary to select the optimal technological modes for obtaining a bimetallic material with required functional properties.
Various methods are used to join dissimilar materials in bimetallic joints, such as thermal bonding due to mechanical action (friction stir welding [3,4]) or heat-source direct action (arc welding [5,6], laser welding [7,8,9,10,11], and hot aluminizing [12]). The cold welding or cladding techniques are used for the manufacturing of bimetallic sheet materials by covering the parts surfaces with a uniform layer of another metal through strong compression and plastic deformation [13]. These technologies are based on a well-known method in which the joint of metal parts occurs via creating atomic bonds between their metal surfaces without mutual penetration of the materials.
Selective laser melting (SLM) is a new additive manufacturing technology that uses high-power lasers to create three-dimensional physical objects by fusing metal powders [14,15,16]. The SLM process takes place inside the building chamber, in which a given pressure is maintained and the ambient gas is controlled, as well as inside technological equipment, where the initial powder materials and the formed product are located. A large number of parameters influence the SLM process. The main technological parameters of SLM are usually divided into four groups: laser parameters, scanning parameters, material parameters, and atmospheric parameters [17].
The formation of high residual stresses in the layer interface, caused by the significant difference in their thermal expansion coefficients, is a main drawback of additive manufacturing of steel–aluminum bimetallic joints. The increasing the aluminum layer thickness, deposited by the selective laser melting (SLM) method on a stainless-steel substrate, due to the action of residual stresses, leads to deformation and destruction of the bimetallic joint [18].
A decrease in the thermophysical property gradient of intermetallic compound layers at the interface between steel and aluminum is achieved by expanding this area. The effect of residual stresses can be reduced by reducing the degree of the thermal effect during melting. In this article, the tasks of identification and qualitative assessment of the bimetallic joint quality indicators, which are obtained via the SLM of aluminum powder by deposition on a stainless-steel substrate, were addressed. Moreover, the dependence of quality indicators on the values of the specific fusion energy was investigated.

2. Materials and Methods

The Al–Si10–Mg metal powder was used as a surfacing material. The results of Al–Si10–Mg morphology, microscopy, and chemical composition investigations are shown in Figure 1 and Table 1. Powder particles generally had a nonspherical form, with a significant number of inclusions, i.e., satellites. The results of studying the powder grain-size composition showed that the particle size distribution varied in the range from 5 to 60 μm. The presence of adhering particles, i.e., conglomerates, with an average size of 70 μm was observed.
The surfacing of aluminum powder was performed onto a precleaned Cr18–Ni10–Ti stainless-steel substrate (cold-rolled sheet with a thickness of 2.0 mm). Table 2 shows the chemical composition of the stainless-steel substrate.
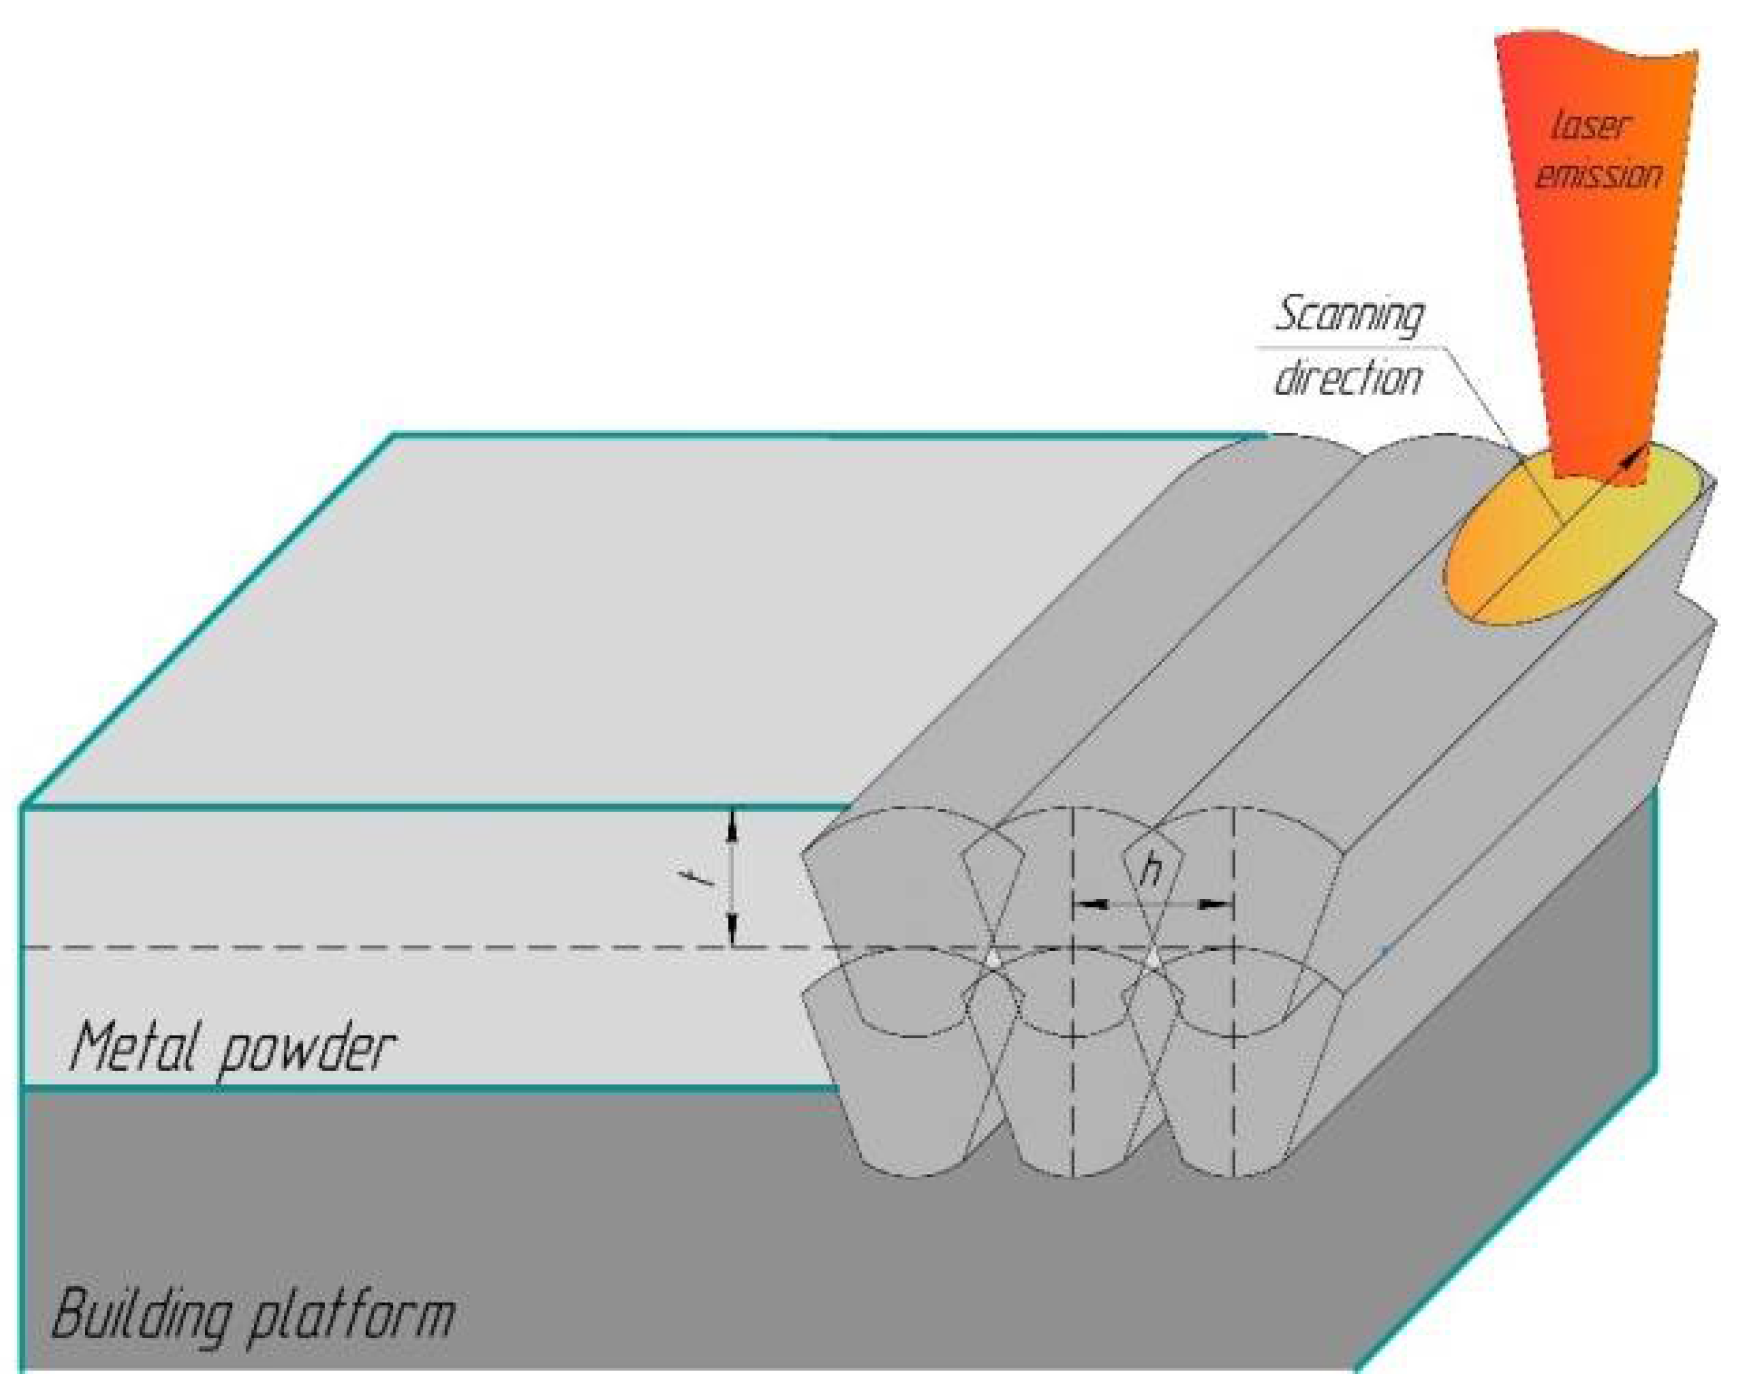
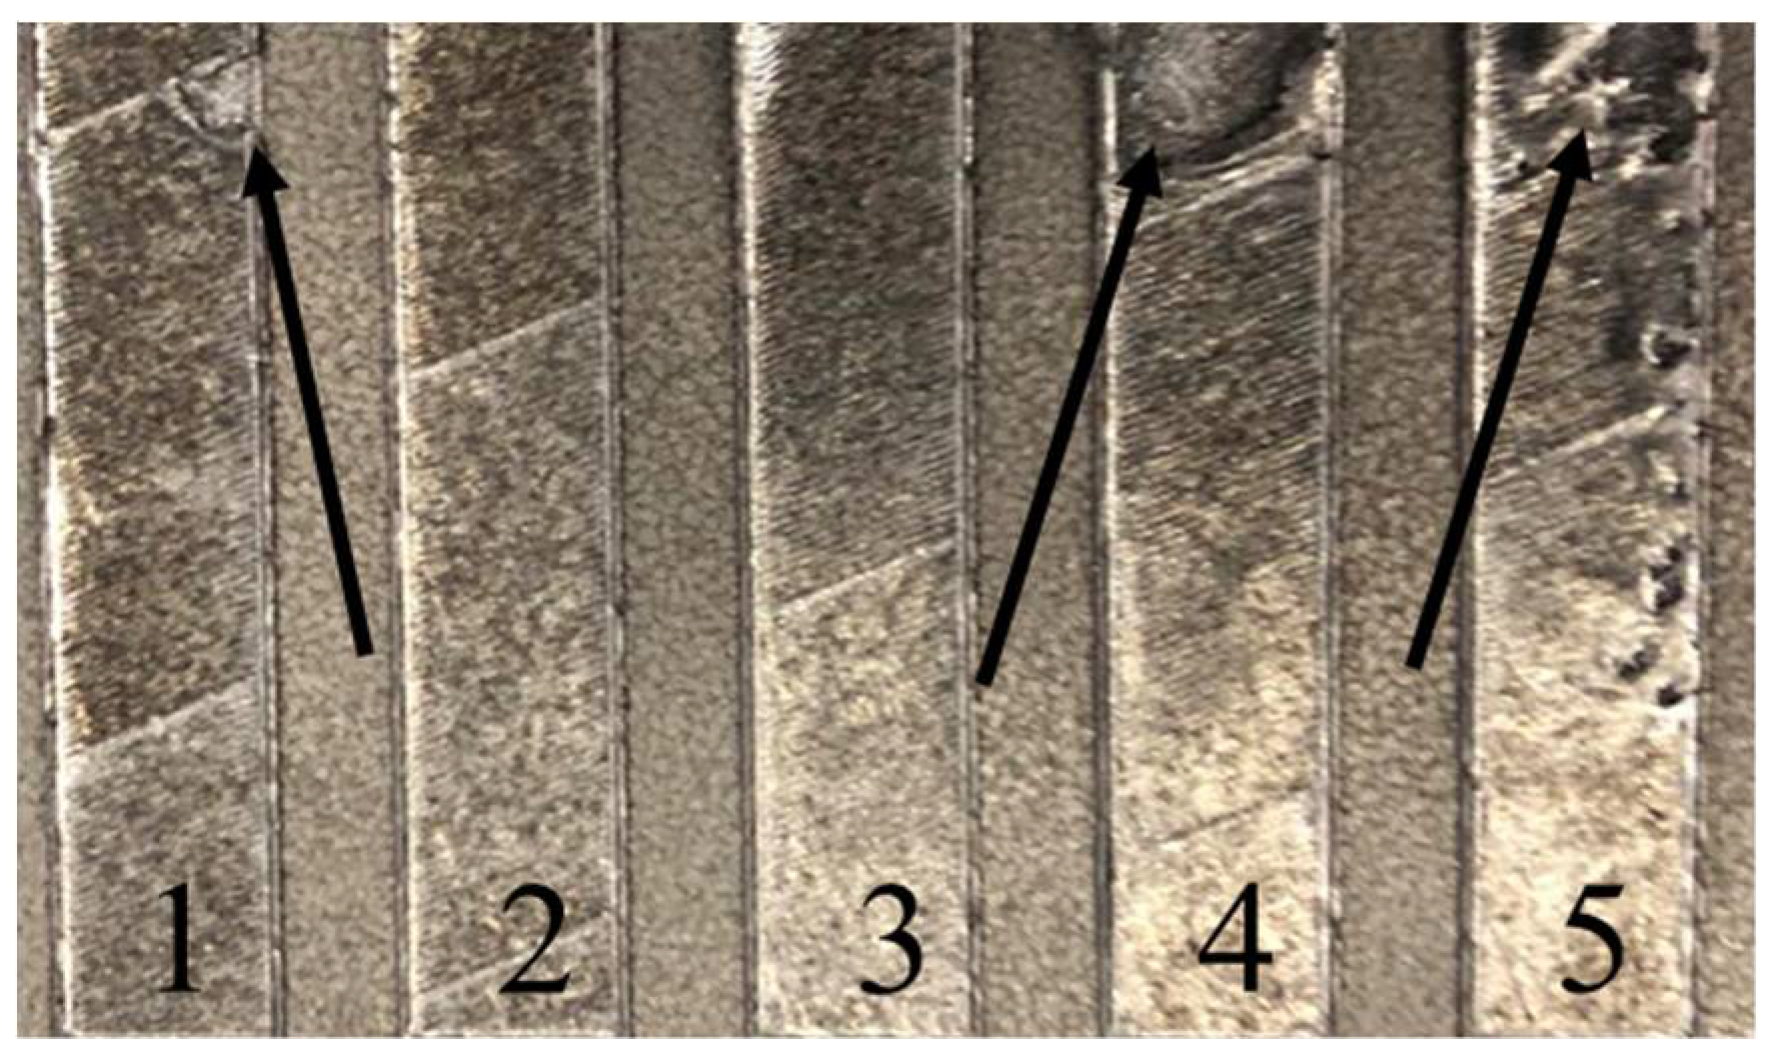
The surfacing was realized by stripes with dimensions of 70 × 10 mm. Ten layers were deposited sequentially on five strips (specimens) using different SLM scanning parameters for each strip (Table 3). The main SLM scanning parameters (Figure 2) affecting the quality of the synthesized material were as follows: laser power P, W; scanning speed V, mm/s; scanning step (hatch distance) h, mm; layer thickness t, mm; type of scanning strategy [19]. For comparison of the physical and mechanical properties of material sintered under various technological scanning parameters, the energy density E (J/mm3) is often used [20,21].
E = P V h t .
Bimetal fabrication was carried out on the SLM 280 machine.
The metallographic samples of the bimetal cross-section were prepared for analysis of the microstructure and chemical composition, as well as measurement of the microhardness in the interface area. The samples were cut on a cutting machine equipped with a cooling system, which allowed for avoiding thermal effects due to heating. Furthermore, the experimental samples were pressed into a conductive phenolic resin with a graphite filler (pressing temperature, 160 °C; holding time, 8 min; water cooling). Then, the pressed samples were ground on sandpaper. The paper grain was reduced from 320 to 2400 during grinding. The samples were then polished using a suspension (the size of diamond particles ranged from 9 to 1 μm). Grinding and polishing were carried out at a speed of 180 rpm for 3 min. Next, the samples were etched by dipping for 5 min in an acid solution (H2SO4–HCl–HNO3–HF in a proportion of 180–180–120–30 mL, respectively).
Microstructure analysis was performed using a Zeiss Axio Vert A1 Mat optical microscope (Carl Zeiss Microscopy GmbH, Jena, Germany) in a light field and a gray filter to improve the visibility of the grain boundaries, with 200× and 500× magnifications for each sample. The processing of the microstructure images was carried out using the specialized software SIAMS 800 (version 800, OOO “SIAMS”, Ekaterinburg, Russia).
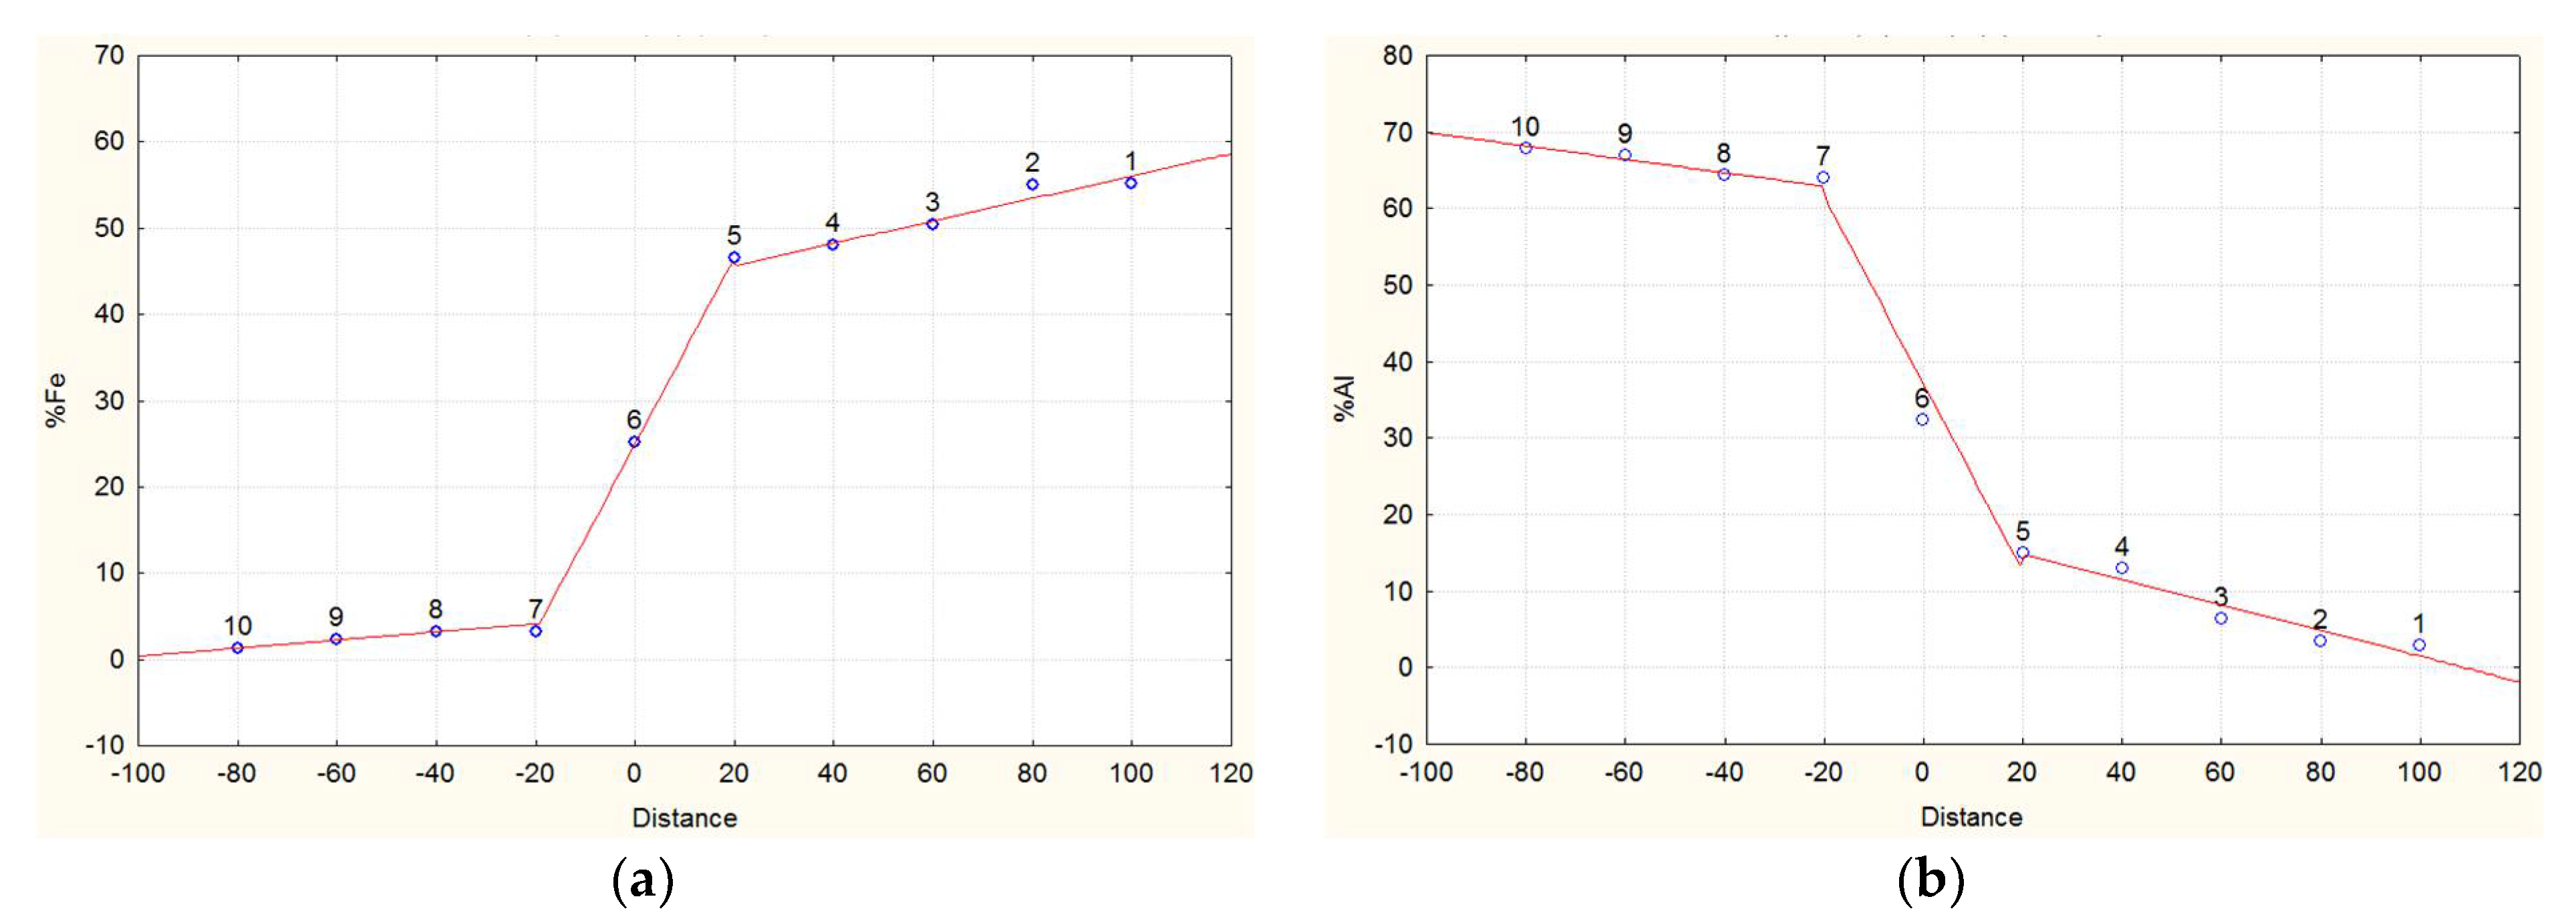
To determine the chemical composition, a Phenom ProX electron microscope with an attachment for energy-dispersive analysis was used (Phenom-World, Eindhoven, Netherlands). The chemical composition was measured at the boundary of two materials with a step of 18–20 μm (five measurements along and 10 measurements across the boundary) with a magnification of 1000×. The measurement results along the border were averaged and processed using statistical methods.
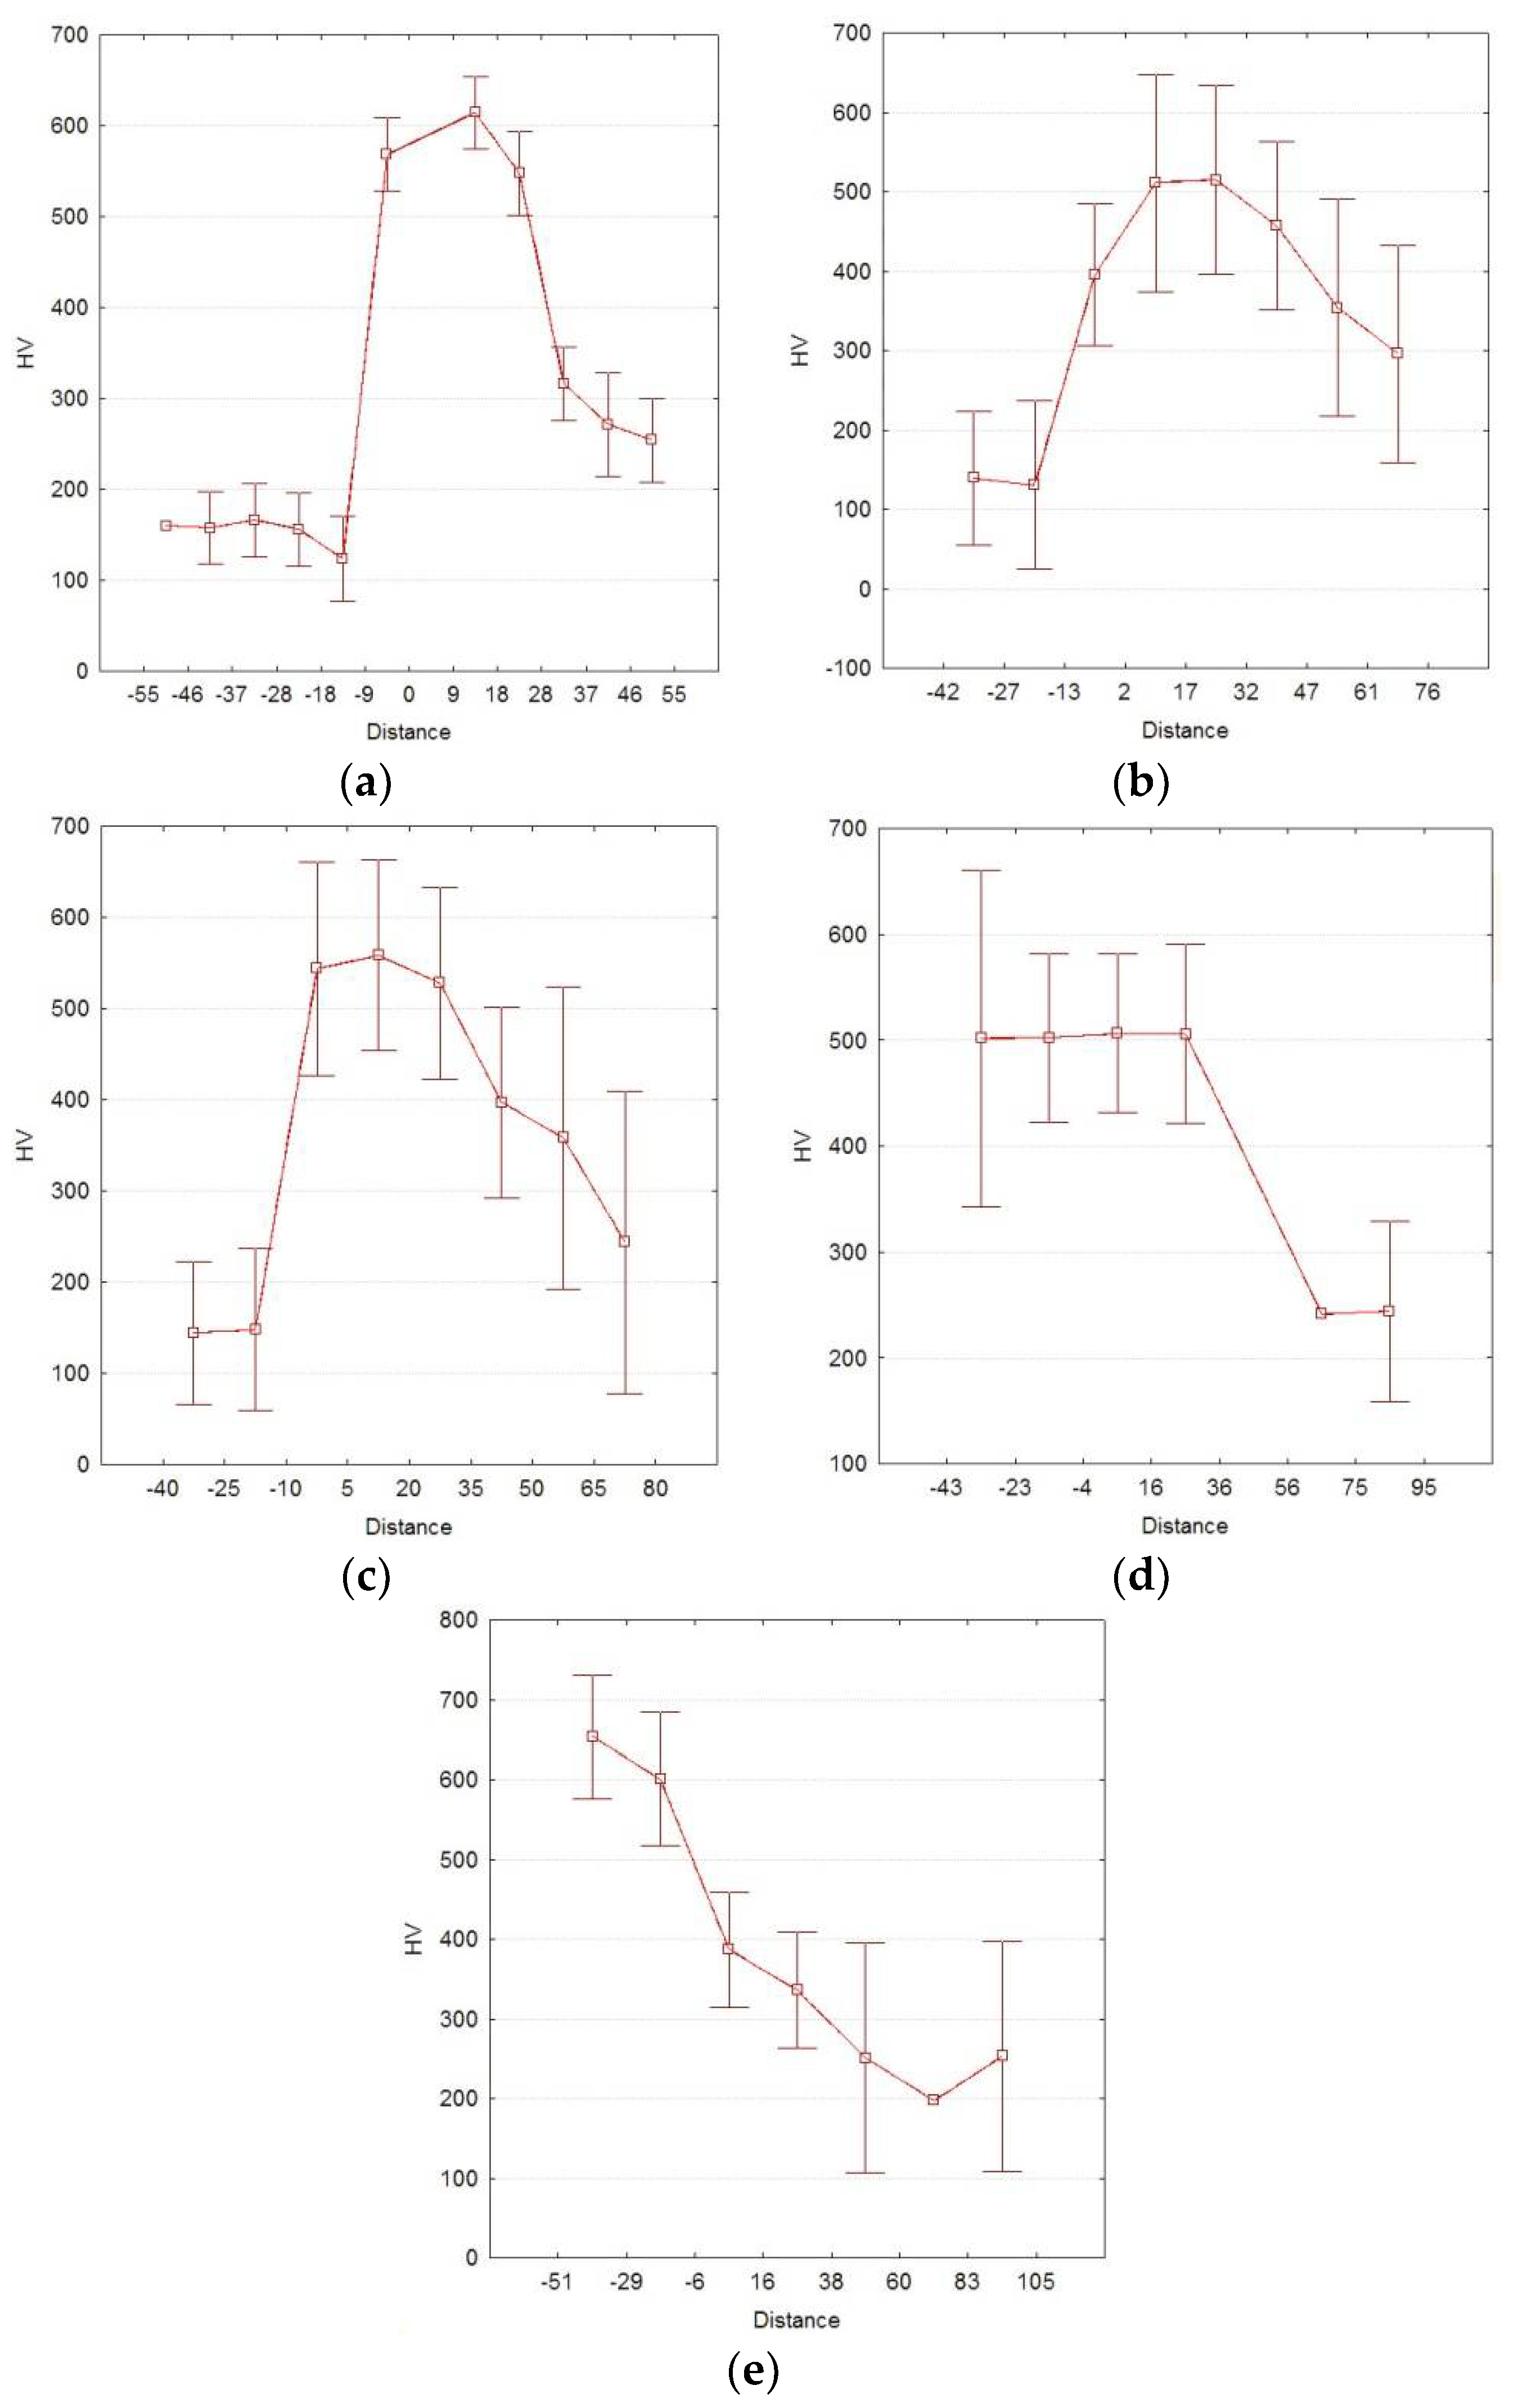
Vickers microhardness was measured on a Matsuzawa MMT-X microhardness tester (Matsuzawa Co., Ltd., Toshima, Japan) at a load of 100 g and a holding time of 10 s. The measurements were carried out at the boundary of two materials with a step of 10–20 μm (four measurements along and 10 measurements across the boundary) at a magnification of 400×.
The resistance to mechanical fracture was evaluated by cross-cutting of the bimetallic specimens with a 1 mm thick disc cutter. With the simultaneous penetration of the cutter tooth into the deposited layer and the substrate material, shear stresses were formed in the interface zone, leading to local delamination of the deposited layer material. Resistance to mechanical fracture was evaluated in points from 0 to 10. Samples with the greatest damage in the cut area corresponded to zero points, whereas 10 points denoted samples with the least damage.

3. Experimental Results

3.1. Micro- and Macrostructure of the Bimetal Interface Zone

A general view of the specimens deposited using various SLM scanning parameters is shown in Figure 3. Excessive energy was supplied to specimens 4 and 5 during SLM, which led to intense evaporation of the aluminum alloy during its deposition and the formation of discontinuities in the sintered layer (Figure 3). The bimetallic joint of specimen 1 was formed with an insufficient amount of SLM energy density, which led to a weakened connection of the deposited material with the substrate, as evidenced by the heterogeneous surface of the deposited layer. The melting of samples 2 and 3 with the steel substrate along the strip length was uniform and continuous.
The microstructure of the samples is shown in Figure 4. There were three zones in all samples after SLM: a zone of deposited material, a zone of thermal action, and a substrate (from bottom to top, Figure 4a–e). The depth of the heat-affected zone in the substrate increased from 65–80 μm (SLM modes 1–3) to 120–180 μm (SLM modes 4 and 5) with increasing energy density. The thickness of the deposited layer decreased with increasing energy density: SLM mode 1, 180–240 μm; 2, 120–200 μm; 3, 60–100 μm; 4 and 5, 20–40 μm (in some places, there was no deposited layer). SLM modes 1 and 2 were characterized by pores in deposited layers. The most continuous and smoothest layer corresponded to SLM mode 3. The molten state of the substrate during the SLM process was proven by the columnar microstructure in the heat-affected zone with the grains oriented normally to the substrate surface (Figure 4f–j; the deposited layer was removed during etching). The difficulty in heat removal from the heat-affected zone with increasing depth (caused by the increase in energy density) led to the formation of equiaxed grains.

3.2. Distribution of Chemical Elements at the Bimetal Interface Zone

The distribution of chemical elements at the bimetal interface zone is shown in Figure 5. The zero of the abscissa is the boundary of the substrate and the deposited layer, whereby positive values correspond to the substrate and negative values correspond to the deposited layer. As can be seen from Figure 5, a mutual penetration of elements from the deposited layer material into the substrate and vice versa took place during the SLM process. The depth and intensity of penetration slightly varied depending on the element and the SLM mode; however, in all cases, the depth was no more than 80–100 μm.

3.3. Distribution of Microhardness and Resistance to Mechanical Destruction

Figure 6 presents the results of microhardness variance analysis (ANOVA) for five specimens. Microhardness measurements were carried out at 25–30 equidistant points located in four rows at distances within 60–90 µm of the bimetal layer boundary. The specified range of distances was divided into 7–12 uniform sections, on which the measured values of microhardness were averaged. Mean standard errors of microhardness were calculated using pooled variance.
The analysis of changes in microhardness for five specimens with different SLM scanning parameters (Figure 6) showed that the maximum values of microhardness shifted into the depth of the substrate as the SLM energy density and, therefore, the melt pool depth increased. The average maximum values of microhardness were 500–650 HV for all specimens.
The resistance to mechanical fracture of bimetallic specimens was scored as follows: specimen obtained first SLM mode—5 points; second SLM mode—10 points, third SLM mode—8 points, fourth and fifth SLM modes—0 points. The maximum resistance corresponded to 105 J/mm3 energy density, whereas lower or higher energy density during SLM did not provide good adhesion between the deposited layer and substrate (this led to failure and delamination during the cutting test).

4. Discussion

4.1. Gray Relational Analysis of Quality Indices

We used six quality indices to analyze the quality of the bimetal through the gray relational analysis method:
  • The Fe content in the deposited aluminum layer at a distance more than 20 microns from the boundary (% Fe, h < −20 µm).
  • The gradient of Fe content in a narrow region near the boundary (grad % Fe, −20 µm ≤ h ≤ 20 µm).
  • The Al content in the steel substrate at a distance more than 20 microns from the boundary (% Al, h > 20 µm).
  • The gradient of Al content in a narrow region near the boundary (grad % Al, −20 µm ≤ h ≤ 20 µm).
  • Difference in microhardness between the deposited aluminum alloy and the steel substrate near the boundary of the layers ( Δ H V ).
  • Relative resistance to mechanical fracture of bimetal in points from 0 to 10 during transverse cutting.
To determine the quantitative characteristics of the penetration of Al into the substrate and Fe into the deposited layer, a piecewise linear approximation of the experimental data was used.
% m = { a 0 + a 1 h , h < h A l , b 0 + b 1 h , h A l h h F e , c 0 + c 1 h , h   > h F e ,
where % m is the content of the corresponding element depending on the distance from the bimetal boundary; a 0 ,   a 1 ,   b 0 ,   b 1 ,   c 0 ,   c 1 are the approximation coefficients, found using the least square method; and h F e and h A l are the coordinates of the break point of the approximating straight lines (linear regression lines) from the substrate and sintered layers.
The coefficients, calculated according to Equation (2), are given in Table 4 and Table 5. The adequacy degree of the piecewise linear approximation by Equation (2) was R > 0.92. The statistical significance (p-level) of the approximation coefficients, except for a few cases, was less than 0.005. Typical piecewise linear approximation curves are shown in Figure 7.
The microhardness in the interface region had a gap; therefore, the experimental results were approximated using the following equation:
H V = { d 0 ,   h < h 0 0 , e 0 + e 1 h + e 2 h 2 ,   h > h 0 0 ,
where HV is the Vickers microhardness, e 0 ,   e 1 ,   e 2 ,   d 0 are approximation coefficients (Table 6), the values of which were found using the least square method, and h 0 is the coordinate of the break point. A typical curve of microhardness approximation is shown in Figure 8.
On the basis of the performed regression analysis of Al and Fe content in the interface (Equation (2)), as well as the microhardness (Equation (3)), it was possible to determine the values of five quality indices:
Index 1: % F e   ( h < 20   μ m ) = a 0 —The Fe penetration into the deposited layer (Table 4);
Index 2: g r a d   % F e   ( 20   μ m h 20   μ m ) = b 1 —The gradient of Fe content in the bimetal interface (Table 4);
Index 3: % A l   ( h > 20   μ m ) = c 0 —The Al penetration into the substrate (Table 5);
Index 4: g r a d   % A l   ( 20   μ m h 20   μ m ) = b 1 —The gradient of Al content in the bimetal interface (Table 5);
Index 5: Δ H V = e 0 d 0 —Microhardness gap (Table 6).
These indices and the values of resistance to mechanical destruction are shown in Table 7. It is obvious that the degree of Fe and Al penetration into the deposited layer and the substrate should be maximized, i.e., “more is better”. The same characteristic was used for the resistance to mechanical destruction. The opposite requirement (“less is better”) was suggested for the parameters of the Fe and Al gradient in the interface zone and the microhardness gap near the bimetal layer boundary.
Since the quality indices were heterogeneous, we used a gray relational analysis. Gray relational analysis is a measurement technique in gray system theory that analyzes the degree and the ratio of dissimilar parameters for their discrete sequence.
Initial experimental data were normalized in the range from 0 to 1 in accordance with the principle “less is better” for indicators 2, 4, and 5 (Table 7).
x i j = y i j min j y i j max j y i j min j y i j ,
where y i j represents the values of the quality indices j for the i-th SLM technological mode, and max j y i j and min j y i j are the maximal and minimal values among the considered SLM modes ( n = 1 5 ).
For quality indices 1, 3, and 6, for which the “more is better” characteristic was suitable, the normalization was carried out as follows:
x i j = max j y i j y i j max j y i j min j y i j .
The gray relational coefficient ξ i j , which is calculated to determine the relationship between ideal and actual experimental results, can be evaluated as
ξ i j = min i min j | x j 0 x i j | + ζ m a x i max j | x j 0 x i j | | x j 0 x i j | + ζ m a x i max j | x j 0 x i j | ,
where x j 0 is the ideal result (i.e., the best normalized result) for the j -th quality index. The values of x j 0 corresponded to 33% Fe for index 1, 45% Al for index 3, 0 for indices 2, 4, and 5, and 10 points for index 6.
The distinguishing coefficient is ζ = [ 0 , 1 ] , which weakens the influence of max i max j | x j 0 x i j | (when it becomes too large, it increases the significance of the gray relational coefficient). In general, its value is taken as equal to 0.5 if all process parameters have equal weight [22]. For the SLM process, as a method for bimetal manufacturing, the influence (weight) of Al uniformity and Fe distribution in the bimetal interface, which is described by indices 1–4, and the difference in microhardness (index 5), in total, should not exceed the weight of resistance to mechanical destruction, which is the key indicator of the bimetal quality. In this regard, the following values of the distinguishing coefficients were adopted: ξ = 0 , 2 for indices 1–5; ξ = 1 for index 6.
A general assessment of multiple quality indices was made after obtaining the gray relational coefficients:
γ i = 1 N n = 1 N ( 1 m n j = 1 m n ξ i j ) ,
where N is the number of quality index groups, each of which has m n indices. All quality indices were divided into two groups: content of elements and microhardness (indices 1–5, m 1 = 5 ); resistance to mechanical destruction (index 6, m 2 = 1 ).
The resulting relational quality assessments based on Equation (7) are shown in Figure 9. A higher integral relational assessment denotes better experimental results, closer to the ideal normalized value. According to Figure 9, it can be seen that the second ( γ = 0.562 ) and third ( γ = 0.548 ) SLM technological modes had the maximum value of the integral relational assessment. The parameters of these technological modes (Table 3) provided the best-quality bimetal.

4.2. Desirability Function of Quality Indices

The use of complex quality indices is a very promising approach for solving problems with several dependent variables. Such an index is the desirability function [23,24]. Desirability denotes one or another desired level of quality indices. The value of desirability, depending on the type of desirability function, can vary from 0 to 1.
The value of each quality index ( y i j ), the number of which is not limited, was transformed into the desirability ( d i j ). The following equation was chosen as the desirability function:
d i j = e ( e x i j ) n j ,
where n j is a coefficient characterizing the significance of the j-th quality index in the generalized desirability function. The values of n j were similar to the coefficient ζ for gray relational analysis: n j = [ 0.2 , 0.2 , 0.2 , 0.2 , 0.2 , 1 ] . Normalized values of quality indices ( x i j ) were substituted into Equation (8). Normalization was carried out using Equations (4) and (5) in the same way as gray relational analysis. The values of the desirability for each quality index (without the influence of n j ) are given in Table 8.
Subsequently, the generalized desirability function ( D i ) is calculated, which represents the geometric mean of the desirabilities of individual quality indices for the i-th SLM mode.
D i = d i 1 d i 2 d i m m .
The values of the generalized desirability function are shown in Figure 10. It can be seen that the maximum value corresponded to the second SLM technological mode.

5. Conclusions

As a result of the studies carried out to select the best mode for obtaining a bimetal, criteria that characterize the degree of heterogeneity of the interfacial zone were obtained and tested. A group of criteria describing the gradient of changes in the composition of key elements (aluminum and iron) in the interfacial zone was proposed. Using these criteria, the thickness of the interface region and its uniformity could be evaluated. The microhardness values on both sides of the layer interface and the resistance to interlayer delamination under mechanical loading were used as functional criteria to characterize the adhesion of the layers. Methods of gray relational analysis and desirability function were used, allowing us to consolidate the criteria considered, taking into account their significance to form a generalized assessment for the bimetallic joint quality and to select the best technological mode. Of course, characteristics such as the residual porosity and quantitative assessment of the presence of microcracks should be used for further analysis of the quality of a bimetallic joint; however, discussion of this issue is beyond the scope of this work.
According to gray relational analysis and analysis of the quality generalized by the desirability function, the best set of quality indices corresponded to the SLM technological modes with an energy density of 105 and 147 J/mm3. The greatest functionality of the bimetal was determined by the quality index associated with its strength.
The quantity of the alloying elements in the interface zone of the bimetal, i.e., the content of Fe in the deposited layer and Al in the substrate material, as well as the uniformity of their distribution, was related to the strength properties of the bimetal. A more chemically uniform interface led to a more uniform distribution of the mechanical and thermophysical properties in this zone. Any heterogeneity contributed to interlayer separation.
Analysis showed that increasing the SLM energy density led to deepening of the melt pool. As a result, the mutual penetration of alloying elements of the substrate and the deposited layer increased. This led to the formation of a wider interface zone, as evidenced by analysis of the microstructure and chemical composition. At the same time, the significant difference between the thermal expansion coefficients of the substrate material and the deposited layer led to deterioration of the heat stress state and growth of the residual stresses with an increase in SLM energy density.
Significant residual stresses in the interface zone led to deformation and destruction of the bimetallic joint, as evidenced by the resistance to mechanical destruction of specimens manufactured by SLM modes with an energy density of 246 and 737 J/mm3. Further studies suggested a decrease in the effect of residual stresses and stabilization of the heat stress state in the bimetal interface due to the use of powder mixtures in the intermediate layer during SLM, the use of a special strategy for the layer formation, and the preparation of a special texture of the substrate surface.

Author Contributions

Conceptualization, A.K. (Alexander Khaimovich) and Y.E.; methodology, V.S.; formal analysis, A.A.; investigation, A.K. (Alexander Kuzin); data curation, V.R. and I.P.; Writing—Original draft preparation, A.K. (Alexander Khaimovich); Writing—Review and editing, Y.E.; software, I.B.; visualization, V.K. All authors have read and agreed to the published version of the manuscript.

Funding

This research was funded by the Russian Science Foundation, grant number 20-69-46070.

Institutional Review Board Statement

Not applicable.

Informed Consent Statement

Not applicable.

Conflicts of Interest

The authors declare no conflict of interest.

References

  1. Mortensen, A.; Suresh, S. Functionally graded metals and metal-ceramic composites: Part I “Processing”. Int. Mat. Rev. 1995, 40, 239–265. [Google Scholar] [CrossRef]
  2. Miyamoto, Y.; Kaysser, W.A.; Rabin, B.H.; Kawasaki, A.; Ford, R.G. Functionally Graded Materials: Design, Processing and Applications; Springer: New York, NY, USA, 1999. [Google Scholar] [CrossRef] [Green Version]
  3. Liyanage, T.; Kilbourne, J.; Gerlich, A.P.; North, T.H. Joint Formation in Dissimilar Al Alloy/Steel and Mg Alloy/Steel Friction Stir Spot Welds. Sci. Technol. Weld. Join. 2009, 14, 500–508. [Google Scholar] [CrossRef]
  4. Taban, E.; Gould, J.E.; Lippold, J.C. Dissimilar Friction Welding of 6061-T6 Aluminum and AISI 1018 Steel: Properties and Microstructural Characterization. Mater. Des. 2010, 31, 2305–2311. [Google Scholar] [CrossRef]
  5. Li, J.; Li, H.; Huang, C.; Xiang, T.; Ni, Y.; Wei, H. Welding Process Characteristics of Pulse on Pulse MIG Arc Brazing of Aluminum Alloy to Stainless Steel. Int. J. Adv. Manuf. Technol. 2017, 91, 1057–1067. [Google Scholar] [CrossRef]
  6. Arivazhagan, N.; Singh, S.; Prakash, S.; Reddy, G.M. Investigation on AISI 304 Austenitic Stainless Steel to AISI 4140 Low Alloy Steel Dissimilar Joints by Gas Tungsten Arc, Electron Beam and Friction Welding. Mater. Des. 2011, 32, 3036–3050. [Google Scholar] [CrossRef]
  7. Pardal, G.; Meco, S.; Ganguly, S.; Williams, S.; Prangnell, P. Dissimilar Metal Laser Spot Joining of Steel to Aluminium in Conduction Mode. Int. J. Adv. Manuf. Technol. 2014, 73, 365–373. [Google Scholar] [CrossRef]
  8. Yang, J.; Chen, J.; Zhao, W.; Zhang, P.; Yu, Z.; Li, Y.; Zeng, Z.; Zhou, N. Diode Laser Welding/Brazing of Aluminum Alloy to Steel Using a Nickel Coating. Appl. Sci. 2018, 8, 922. [Google Scholar] [CrossRef] [Green Version]
  9. Mehrpouya, M.; Gisario, A.; Barletta, M.; Natali, S.; Veniali, F. Dissimilar Laser Welding of NiTi Wires. Lasers Manuf. Mater. Process. 2019, 6, 99–112. [Google Scholar] [CrossRef]
  10. Tomashchuk, I.; Grevey, D.; Sallamand, P. Dissimilar Laser Welding of AISI 316L Stainless Steel to Ti6-Al4-6V Alloy via Pure Vanadium Interlayer. Mater. Sci. Eng. 2015, 622, 37–45. [Google Scholar] [CrossRef]
  11. Mehrpouya, M.; Gisario, A.; Broggiato, G.B.; Puopolo, M.; Vesco, S.; Barletta, M. Effect of Welding Parameters on Functionality of Dissimilar Laser-Welded NiTi Superelastic (SE) to Shape Memory Effect (SME) Wires. Int. J. Adv. Manuf. Technol. 2019, 103, 1593–1601. [Google Scholar] [CrossRef]
  12. Tanaka, Y.; Kajihara, M. Kinetics of Isothermal Reactive Diffusion between Solid Fe and Liquid Al. J. Mater. Sci. 2010, 45, 5676–5684. [Google Scholar] [CrossRef]
  13. William, A.; Groll, M. Method for Making a Copper Core Five-Ply Composite for Cookware. U.S. Patent 6,267,830 B1, 31 July 2001. [Google Scholar]
  14. Sufiyarov, V.S.; Borisov, E.V.; Polozov, I.A.; Masailo, D.V. Control of structure formation in selective laser melting process. Tsvetnye Met. 2018, 7, 68–74. [Google Scholar] [CrossRef]
  15. Graf, B.; Gook, S.; Gumenyuk, A.; Rethmeier, M. Combined Laser Additive Manufacturing for Complex Turbine Blades. Glob. Nucl. Saf. 2016, 3, 34–42. [Google Scholar] [CrossRef]
  16. Lewis, G.K.; Nemec, R.B.; Milewski, J.O.; Thoma, D.J.; Cremers, D.; Barbe, M.R. Directed light fabrication. In Proceedings of the ICALEO’94, Orlando, FL, USA, 17–20 October 1994. [Google Scholar] [CrossRef] [Green Version]
  17. Gusarov, A.V.; Smurov, I. Modeling the interaction of laser radiation with powder bed at selective laser melting. Phys. Procedia 2010, 5, 381–394. [Google Scholar] [CrossRef] [Green Version]
  18. Nguyen, D.-S.; Park, H.-S.; Lee, C.-M. Applying Selective Laser Melting to Join Al and Fe: An Investigation of Dissimilar Materials. Appl. Sci. 2019, 9, 3031. [Google Scholar] [CrossRef] [Green Version]
  19. Yadroitsev, I.; Krakhmalev, P.; Yadroitsava, I. Selective laser melting of Ti6Al4V alloy for biomedical applications: Temperature monitoring and microstructural evolution. J. Alloy. Compd. 2014, 583, 404–409. [Google Scholar] [CrossRef]
  20. Heeling, T.; Gusarov, A.; Cloots, M.; Wegener, K. Melt pool simulation for the evaluation of process parameters in selective laser melting. Addit. Manuf. 2017, 14, 116–125. [Google Scholar] [CrossRef]
  21. Ali, H.; Ma, L.; Ghadbeigi, H.; Mumtaz, K. In-situ residual stress reduction, martensitic decomposition and mechanical properties enhancement through high temperature powder bed pre-heating of Selective Laser Melted Ti6Al4V. Mater. Sci. Eng. A 2017, 695, 211–220. [Google Scholar] [CrossRef]
  22. Liu, S.; Yang, Y.; Forrest, J. Grey Data Analysis Methods: Models and Applications; Springer: Berlin/Heidelberg, Germany, 2016. [Google Scholar] [CrossRef]
  23. Harrington, E. The Desirability Function. Ind. Qual. Control 1965, 21, 494–498. [Google Scholar] [CrossRef] [Green Version]
  24. John, B. Application of desirability function for optimizing the performance characteristics of carbonitrided bushes. Int. J. Ind. Eng. Comput. 2013, 4, 305–314. [Google Scholar] [CrossRef] [Green Version]
Figure 1. Scanning electron mycroscopy images of Al–Si10–Mg powder.
Metals 11 00172 g001
Figure 2. Selective laser melting (SLM) scanning parameters.
Metals 11 00172 g002
Figure 3. A general view of the sintered specimens: 1—SLM mode1; 2—SLM mode 2; 3—SLM mode 3; 4—SLM mode 4; 5—SLM mode 5; arrows—defects.
Metals 11 00172 g003
Figure 4. Microstructure of bimetal interface zone: (a,f) SLM scanning mode 1; (b,g) SLM scanning mode 2; (c,h) SLM scanning mode 3; (d,i) SLM scanning mode 4; (e,j) SLM scanning mode 5; (ae) 200×, without etching; (fj) 500×, after etching.
Metals 11 00172 g004aMetals 11 00172 g004b
Figure 5. Distribution of chemical elements Fe (a), Al (b), Cr (c), Si (d) and Ni (e) at the bimetal interface zone: SLM mode 1; SLM mode 2; SLM mode 3; SLM mode 4; SLM mode 5.
Metals 11 00172 g005
Figure 6. Distribution of hardness at the bimetal interface zone: (a) SLM scanning mode 1; (b) SLM scanning mode 2; (c) SLM scanning mode 3; (d) SLM scanning mode 4; (e) SLM scanning mode 5.
Metals 11 00172 g006
Figure 7. Piecewise linear approximation of Fe (a) and Al (b) content in the bimetal interface (SLM mode 2).
Metals 11 00172 g007
Figure 8. Piecewise approximation of microhardness distribution in the bimetal interface (SLM mode 2).
Metals 11 00172 g008
Figure 9. The resulting relational quality assessments of SLM technological modes.
Metals 11 00172 g009
Figure 10. The generalized desirability function of quality indices for different SLM technological modes.
Metals 11 00172 g010
Table 1. Chemical composition of Al–Si10–Mg powder.
ElementSiCOMgAl
Weight ratio, %10.733.352.411.30balance
Table 2. Chemical composition of Cr18–Ni10–Ti stainless-steel sheet.
ElementCrNiMoMnSiTiСРSFe
Weight ratio, %16.0–18.010.0–14.02.0–3.0<2.0<1.0<0.5<0.07<0.045<0.03balance
Table 3. Technological scanning parameters for selective laser melting (SLM) of Al–Si10–Mg and Cr18–Ni10–T bimetal.
Mode No.Laser Power P, WScanning Speed V, mm/sHatch Distance h, mmLayer Thickness t, mmEnergy Density E, J/mm3
13504500.190.0582
23503500.190.05105
33502500.190.05147
43501500.190.05246
5350500.190.05737
Table 4. Piecewise linear approximation coefficients of Fe content (%) in the bimetal interface zone.
Mode No.12345
Coef.ValuepValuepValuepValuepValuep
a08.680.0585.080.0776.520.33741.840.08555.210.000
a10.050.3960.050.2450.010.9490.440.1140.070.254
b027.830.00024.960.00029.520.00046.740.011
b10.940.0001.080.0001.290.0000.300.042
c042.850.00043.050.00054.790.00061.690.033
c10.170.0070.130.0040.100.1660.030.619
Table 5. Piecewise linear approximation coefficients of Al content (%) in the bimetal interface zone.
Mode No.12345
Coef.ValuepValuepValuepValuepValuep
a061.160.00143.780.00189.900.00023.300.12617.550.002
a1−0.090.493−0.220.0660.180.098−0.750.029−0.150.009
b019.040.02918.890.01233.950.00122.020.056
b1−1.060.001−1.030.000−1.600.000−0.480.025
c018.050.02913.560.03013.080.0285.340.420
c1−0.170.086−0.120.103−0.090.161−0.040.596
Table 6. Piecewise approximation coefficients of microhardness in the bimetal interface zone.
Mode No.12345
Coef.ValuepValuepValuepValuepValuep
d0151.720.002160.300.000147.420.003475.220.000573.950.000
e0679.750.000549.170.000448.150.000276.960.042367.360.131
e1−7.480.001−7.060.00020.410.01015.350.062−0.490.598
e2 −0.510.003−0.210.028
Table 7. Coefficients of gray relational analysis of quality indices for bimetal interface.
Mode No.%FeGrad %Fe%AlGrad %AlΔHVResistance to Destruction
y i j
18.680.9418.051.064775
25.081.0813.561.0342310
36.521.3013.081.603278
441.840.3015.000.481980
555.210.0617.550.151860
More is betterLess is betterMore is betterLess is betterLess is betterMore is better
x i j
10.0720.2881.0000.3720.0000.500
20.0000.1700.0950.3910.1851.000
30.0290.0000.0000.0000.5160.800
40.7330.8010.3860.7710.9590.000
51.0001.0000.8991.0001.0000.000
x j 0 0.5571.0456.4271.1031.6421.000
ξ i j
10.1860.1790.1080.1800.1590.928
20.1840.1760.1010.1800.1631.000
30.1850.1720.1000.1710.1700.970
40.1950.1930.1030.1900.1810.865
50.1870.1990.1080.1970.1820.865
ζ 0.21
Table 8. The desirability for each quality index (without the influence of n j ).
Mode No.%FeGrad %Fe%AlGrad %AlΔHVResistance to Destruction
10.3940.4720.6920.5020.3680.545
20.3680.4300.4030.5080.4360.692
30.3780.3680.3680.3680.5510.638
40.6190.6380.5070.6300.6820.368
50.6920.6920.6660.6920.6920.368
n j 0.21
Publisher’s Note: MDPI stays neutral with regard to jurisdictional claims in published maps and institutional affiliations.

