Article

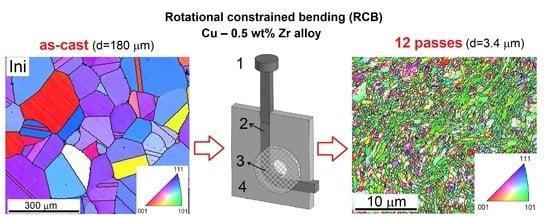
Microstructure Evolution in Cu–0.5 wt% Zr Alloy Processed by a Novel Severe Plastic Deformation Technique of Rotational Constrained Bending

1
Faculty of Mathematics and Physics, Charles University, Ke Karlovu 3, 121 16 Praha 2, Czech Republic
2
Department of Materials Physics, Eötvös Loránd University, P.O.B. 32, H-1518 Budapest, Hungary
3
Institute of Physics of Advanced Materials, Ufa State Aviation Technical University, 12 K. Marx str., 450008 Ufa, Russia
4
Institute of Molecule and Crystal Physics UFRC RAS, 151 pr. Oktyabrya, 450075 Ufa, Russia
*
Author to whom correspondence should be addressed.
Submission received: 26 November 2020 / Revised: 23 December 2020 / Accepted: 26 December 2020 / Published: 30 December 2020

Abstract

:
In the present study, a coarse-grained Cu–0.5 wt% Zr alloy was repeatedly processed by a novel technique of rotational constrained bending (RCB). In this technique, the workpiece was deformed by bending in a channel with an angle of 90°, using a rotating roller. The influence of the number of passes (N) of RCB on strain distribution, microstructure evolution and mechanical properties of the alloy was investigated. The heterogeneous distribution of the microhardness in the billet cross-section after the first pass was transformed into a homogeneous one after twelve passes, due to the rotation of the sample by 90° clockwise between individual passes. In addition, the gradual refinement/homogenization of the microstructure and formation of strong (110) crystallographic texture were found with increasing N. The initial grain size of 180 μm decreased down to 3.4 μm after twelve passes. The dislocation density increased by two orders of magnitude after RCB processing. In accordance with the grain-size refinement and the strong increase of the dislocation density, RCB processing significantly enhanced the strength of the alloy, while the ductility considerably decreased. The yield stress increased from 63 to 524 MPa, while the elongation to failure decreased below 10% after twelve passes.

Graphical Abstract

1. Introduction

Utilization of severe plastic deformation (SPD) techniques for processing of metallic materials was found to be effective in substantial microstructure refinement and enhancement of mechanical properties [1,2,3,4,5]. In the last two decades, this finding led to an extensive development of various SPD techniques that introduce large plastic strains (exceeding hundreds of percent) into the workpieces. Equal channel angular pressing (ECAP) [6,7,8] and high-pressure torsion (HPT) processes [9,10,11] have been considered as the most popular and widely applied SPD methods so far. These techniques impose shear deformation on the workpieces during processing of the samples in special dies, preserving the original dimension and shape of the samples. This feature enables repetitive processing of specimens and thus accumulation of the total strain to the value required for significant microstructure refinement. On the other hand, the slow processing speed and, in most cases, the limited size of samples obtained by the abovementioned techniques hinder the massive application in the industry.
One of the SPD techniques that overcame the issue presented above is the method of free bending in rotating rollers developed recently by Raab et al. [12]. In this technique, the material is processed through the set of rollers, which significantly reduce the friction forces acting during the processing and allow for the processing of long billets at higher speeds, as in the case of the other SPD methods. This concept was employed for the development of a newly designed constrained bending die, consisting of one driven roller in the top part of the bended channel with a uniform cross-section. Such geometry enables us to use a hydraulic pressing machine which is able to exert very high pressures and thus is suitable for processing of hard materials. Recently, this new technique—called as rotational constrained bending (RCB)—was successfully used for exceptional microstructure refinement, down to the grain size of 400 nm in commercial pure (cp) grade 4 titanium with a closely packed hexagonal crystal structure [13]. Due to the limited experimental results obtained on the materials processed by RCB technique, further investigation on other types of materials which would introduce a deeper insight into the processing by RCB is highly desirable. The favorable cost of Cu–Zr alloys, exhibiting the high strength, while preserving good thermal and electrical conductivities, makes these materials very promising candidates for many applications in electrical and welding industries. These alloys exhibit a higher work-hardening rate, as compared to pure copper, and are thus suitable for mechanical processing, applied for achieving a significant strength improvement [14].
In this paper, experiments were conducted for studying the evolution of the microstructure in Cu–0.5 wt% Zr alloy processed by different numbers of RCB passes. In addition, the influence of microstructural changes on the mechanical properties is discussed in detail. The RCB processing effectively decreased the grain size of the as-cast Cu–0.5 wt% Zr alloy, down to the submicrometer range, and enhanced dislocation density stored in the microstructure. As a result, the yield stress and the ultimate tensile strength increased significantly after 12 passes.

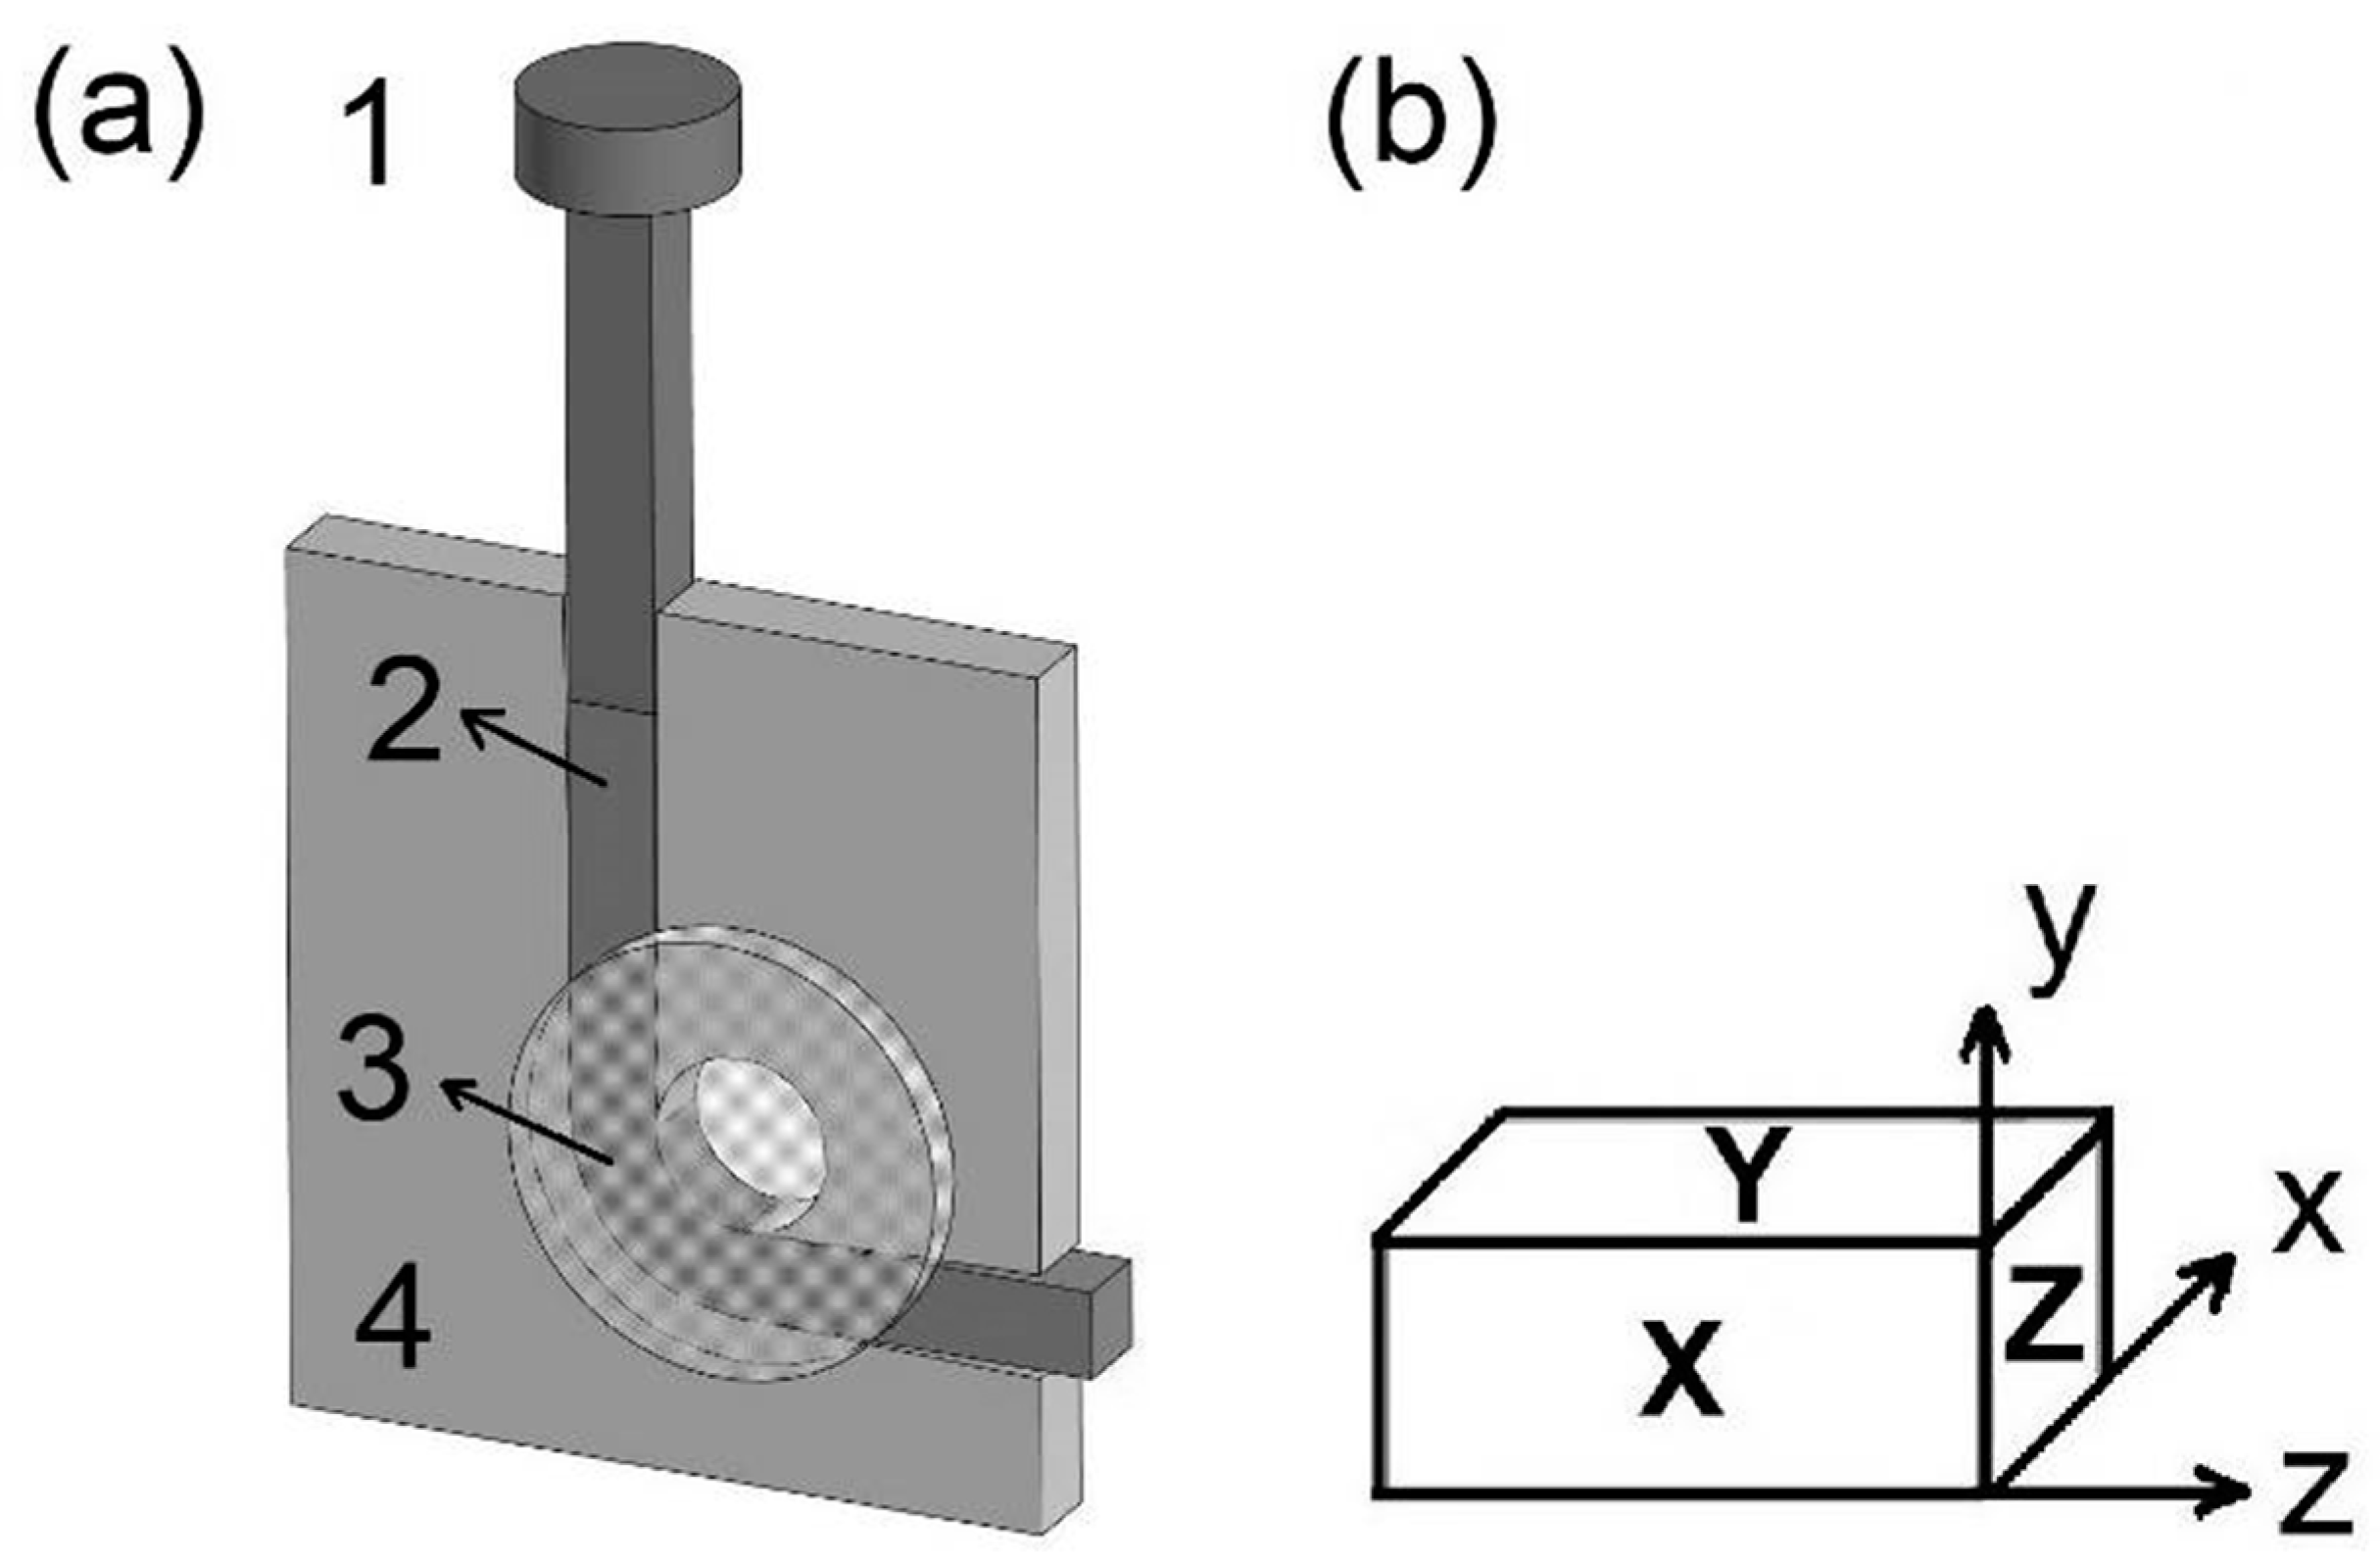
2. Materials and Methods

Cu–0.5 wt% Zr alloy in the hot-rolled condition was used as initial material for processing via rotational constrained bending. Before the processing, the samples were homogenized at the temperature of 1000 °C for 1 h and then water quenched. This is referred to as the initial state of the material. Billets with a square cross-section of 10 × 10 mm2 were repeatedly processed through constrained bending die at 300 °C and a speed of 7 mm/s (the die is shown schematically in Figure 1a, where the sample is bended at an angle of 90°). In order to investigate the microstructure evolution during processing, a series of samples were prepared after one, two, four, eight and twelve passes of RCB. The samples were lubricated by the MoS2 grease. Deformation route Bc was used for RCB processing, i.e., the sample was rotated by 90° around its longitudinal axis between the individual passes [15]. The strain imposed on the billet per pass varied throughout the billet cross-section [16].
Deformation-induced microstructural changes in the whole billet cross-section were investigated by precise Vickers microhardness mapping in a regular net of indents. The lateral distance between the individual indents was 1 and 0.3 mm for the initial sample and the specimens processed by RCB, respectively. Comprehensive microstructure characterization in the central part of the cross-section was performed by the combination of scanning electron microscopy (SEM) and electron and X-ray diffraction. Microhardness measurements (HV 0.5, in which the load was 500 g and the dwell time was 10 s) were performed by an automatic microhardness tester Qnes Q10a (QATM, Salzburg Austria). SEM microscope FEI Quanta 200 (Thermo Fisher Scientific, Hillsboro, OR, USA) with EDAX electron backscatter diffraction (EBSD) camera (Ametek, Inc. Berwyn, PA, USA) and a high-resolution rotating anode X-ray diffractometer (type: Rigaku RAMultiMax9, Rigaku, Tokyo, Japan) with CuKα1 radiation (wavelength: λ = 0.15406 nm) were employed for the study of the microstructure. The areas investigated by EBSD were the following: initial state area—1 × 1.5 mm2, one to two passes area—300 × 300 μm2 and four–twelve passes area—100 × 100 μm2. The measured X-ray diffraction spectra were evaluated by the Convolutional Multiple Whole Profile (CMWP) fitting method [17]. The microstructure parameters evaluated by this method include the median (m) and the log-normal variance (σ) of the crystallite size distribution function, the dislocation density (ρ) and the dislocation arrangement parameter (M). The area-weighted mean crystallite size (<x> area) was calculated according to the following formula:
<x> area = m × exp (2.5σ2).
Mechanical properties of some selected samples (those that exhibited an almost-homogeneous microstructure in the cross-section) were investigated by tensile testing at a constant strain rate of 10−3 s−1, at room temperature, using a universal Instron 5882 testing machine. The tensile direction was parallel to z-axis, defined in Figure 1b. The dimensions of the tensile samples having a dog-bone shape were the following: width—3 mm, thickness—1 mm and gauge length—12 mm. The sample preparation for microstructural observations consisted of mechanical grinding with 1200-, 2400- and 4000-grit SiC papers, followed by polishing with diamond suspensions with the particle sizes of 3 and 1 μm. Mechanically polished Cu–0.5 wt% Zr samples were additionally electropolished, using the water solution of 50% H3PO4 at 10 °C for 1 min. For the optical microscopy observations performed by using a Zeiss Axio Observer 7 microscope (Zeiss, Berlin, Germany), the mechanically polished surface was etched with a solution of 2 g K2Cr2O7 + 100 mL H2O + 4 mL of saturated NaCl + 8 mL H2SO4.

3. Results

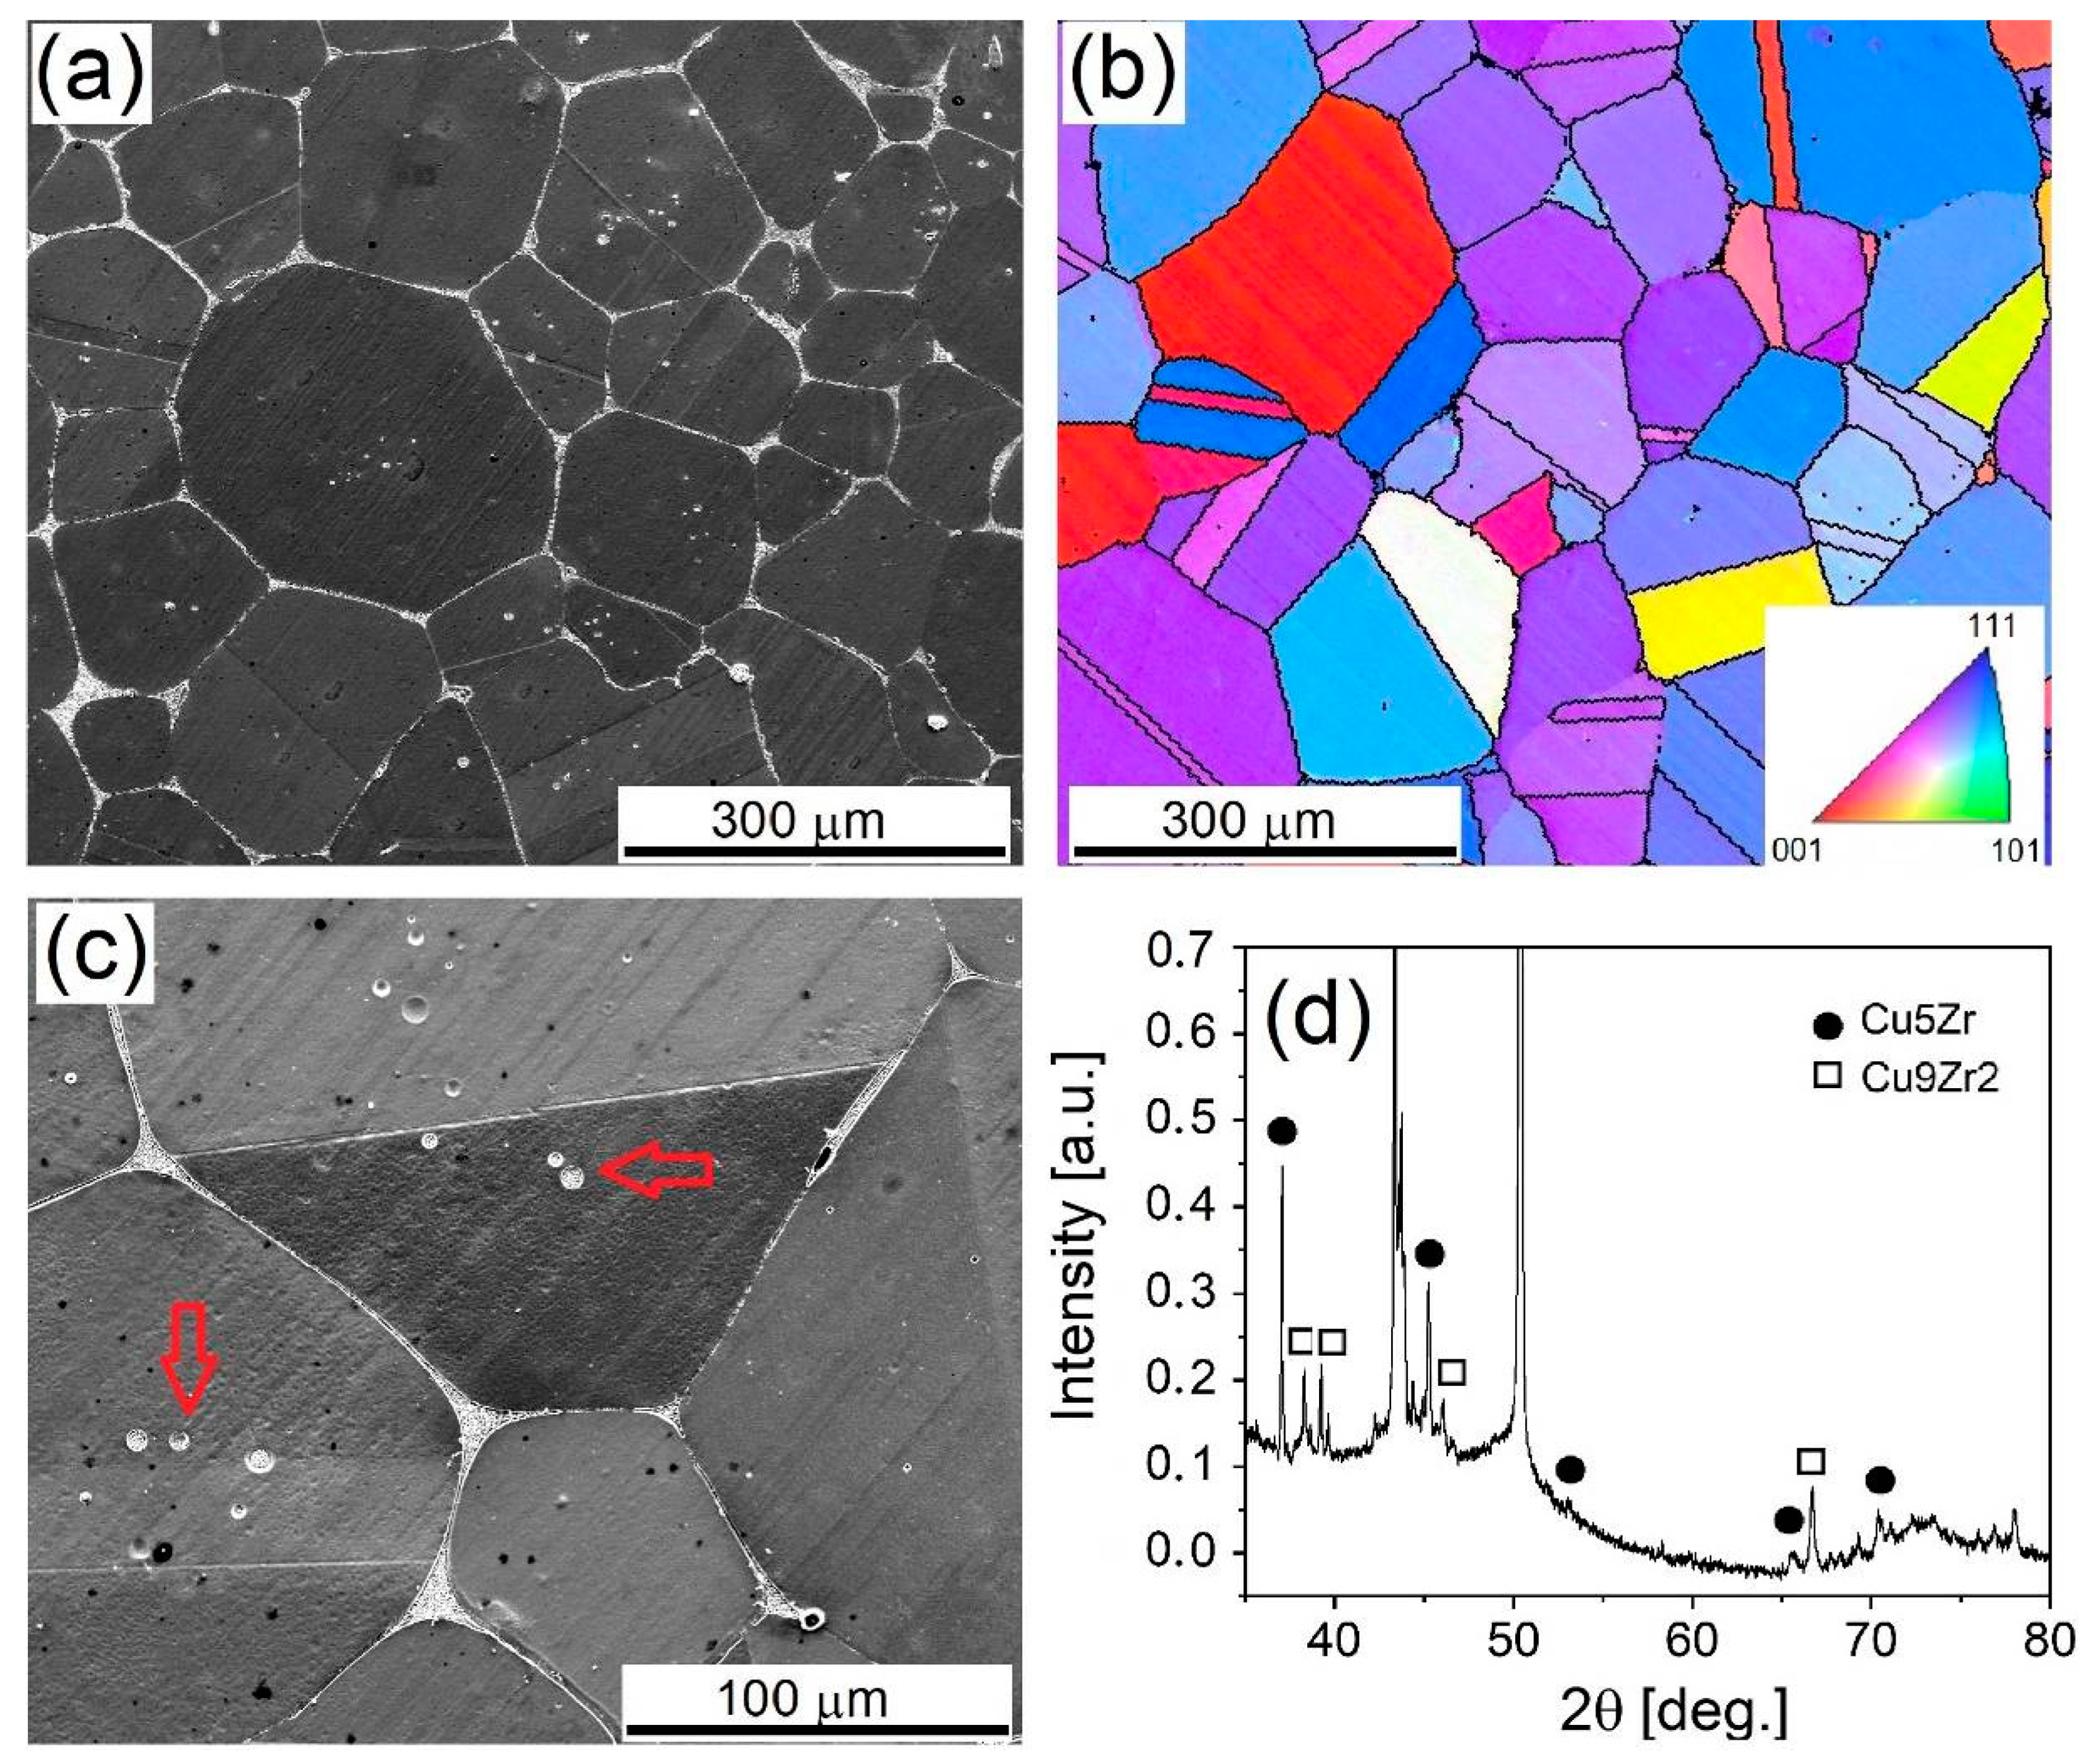
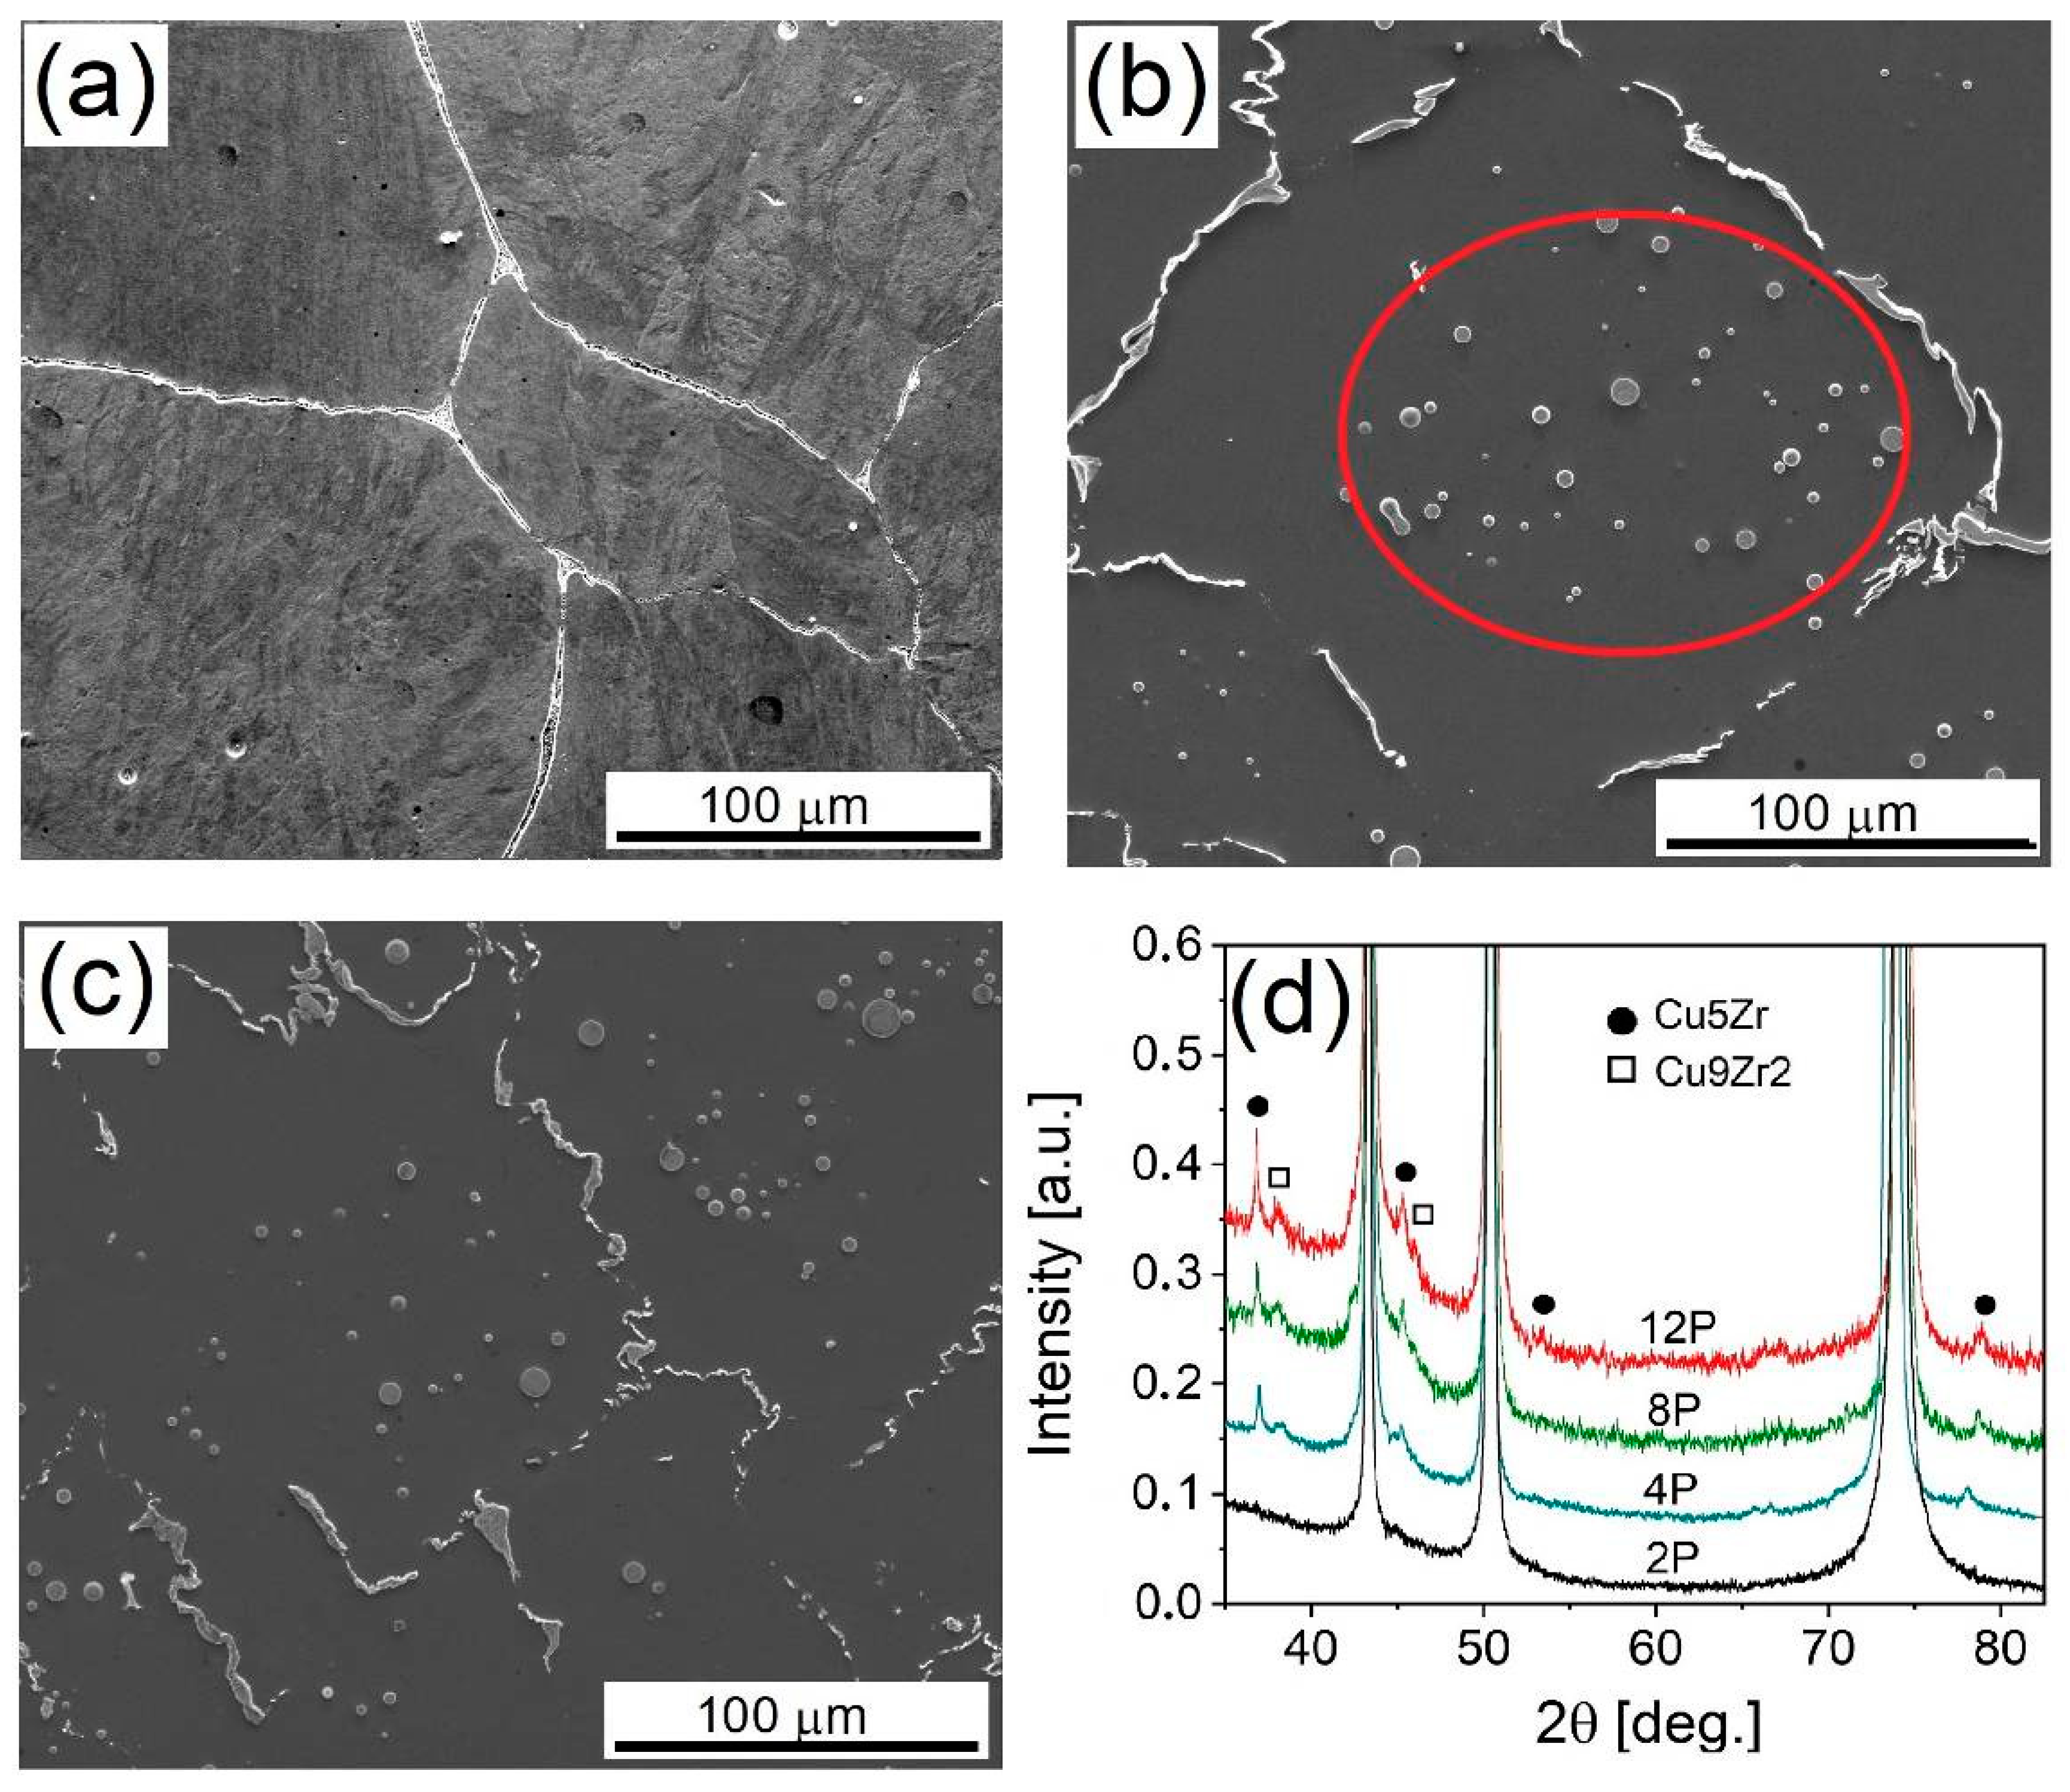
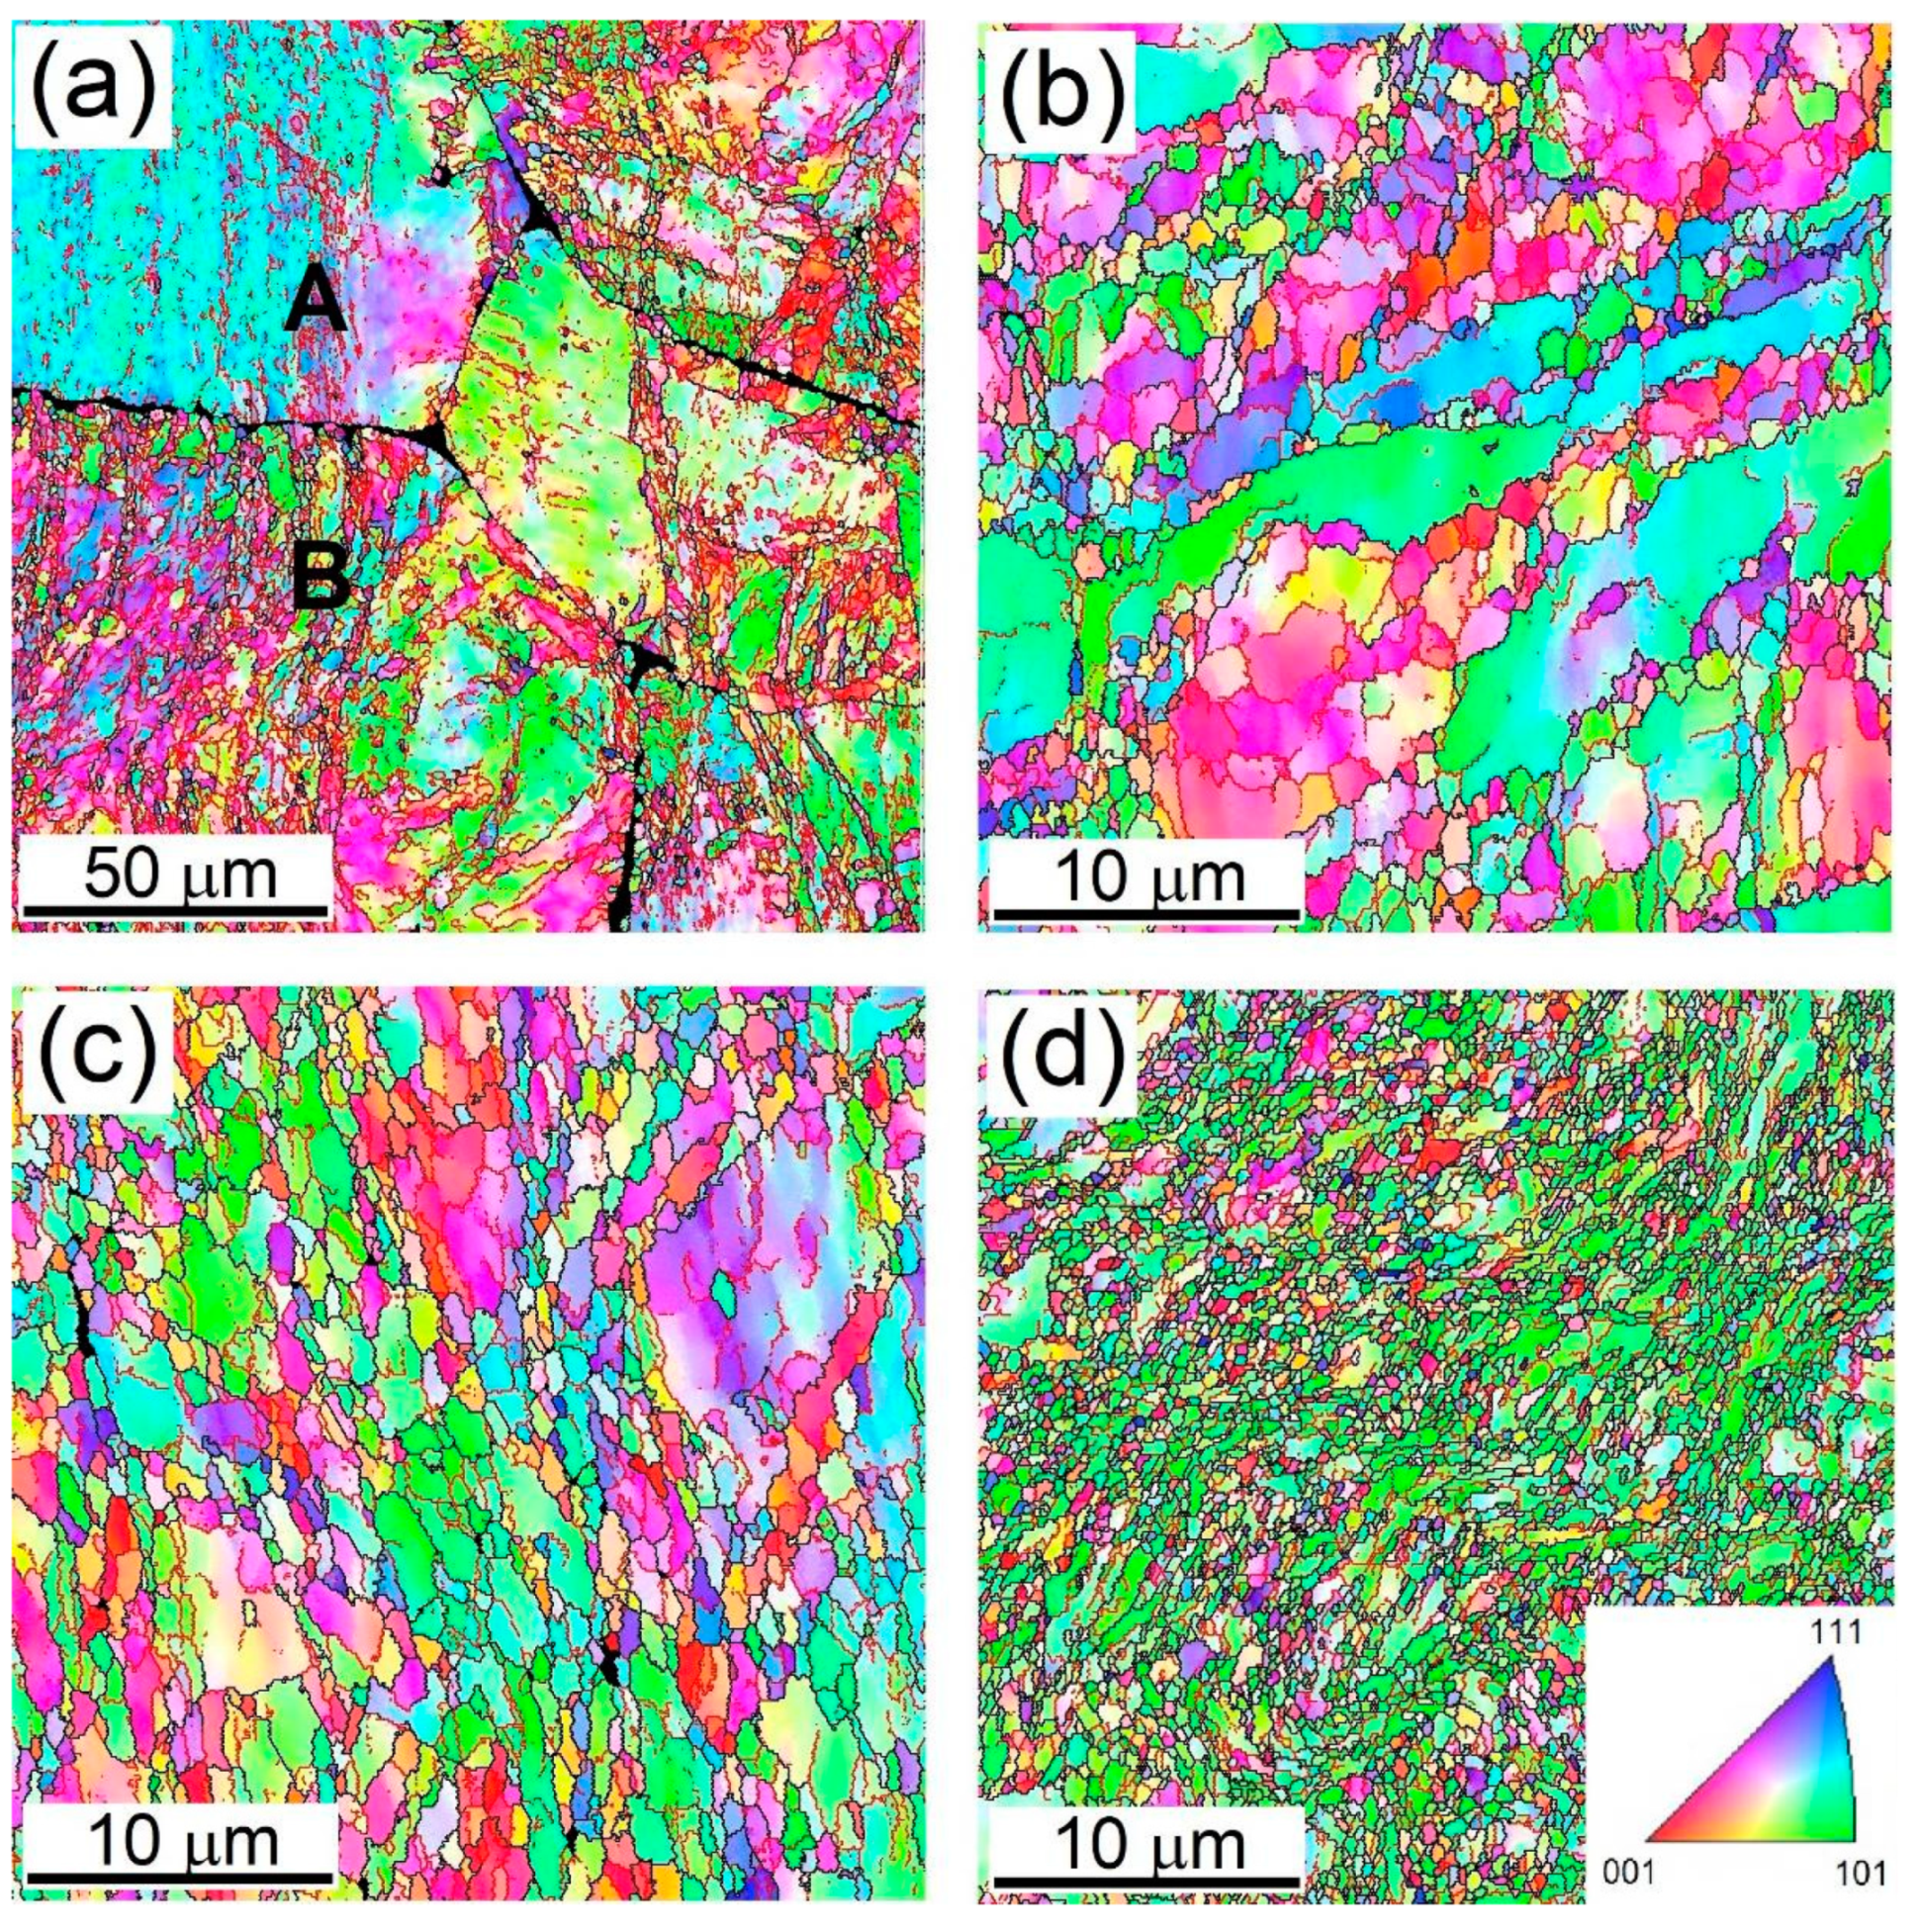
3.1. Microstructure of the Initial Sample and the Specimen Processed by One Pass

A SEM micrograph and a grain orientation map for the initial state of Cu–0.5 wt% Zr alloy are shown in Figure 2a,b, respectively. The microstructure of the initial Cu–0.5 wt% Zr alloy consists of equiaxed grains of the primary face-centered cubic (fcc) α-Cu phase with the average grain size of 180 μm that are surrounded by lamellas of intermetallic compound Cu5Zr in the eutectic phase [18]. The phase composition was identified from the XRD pattern of the initial state shown in Figure 2d. The majority of the secondary phase can be found on grain boundaries of large matrix grains (see Figure 2c). Unlike in Reference [18], we also observed particles in grain interiors and identified them as Cu9Zr2 phase. The homogeneity of the initial microstructure was confirmed by precise microhardness measurement on the billet cross-section, where uniform distribution of the HV values can be observed (cf. Figure 3a). Even after the first pass of RCB (the 1P sample), the microhardness increased significantly, and a strong variation of the microhardness values across the billet cross-section was observed (see Figure 3b). The microhardness decreased from the top towards the bottom part, indicating the presence of a gradient type microstructure.
Direct microstructure observations in both the central and top parts of the sample processed by one pass reveal the presence of deformed, elongated grains (see Figure 4), while in the bottom part, there is no significant change in the microstructure, as compared to the initial state. The EBSD grain orientation map taken from the top part indicates microstructure refinement (see Figure 4d). In this image, the dislocation cell walls with low misorientations are highlighted with a red color, while the newly formed high-angle grain boundaries (HAGBs) having misorientation higher than 15° are highlighted in black inside the original grains.
Microtexture investigations by EBSD in the central part of the billet cross-section revealed significant transformation of the original random crystallographic texture after the first pass (cf. Figure 5a,b). As it is apparent from Figure 5b, the 1P sample exhibits the strong (110) texture. Distinctive maxima corresponding to the three texture components denoted as A, B and C indicate the presence of three dominant orientations of the cubic cell, graphically shown in Figure 5c.

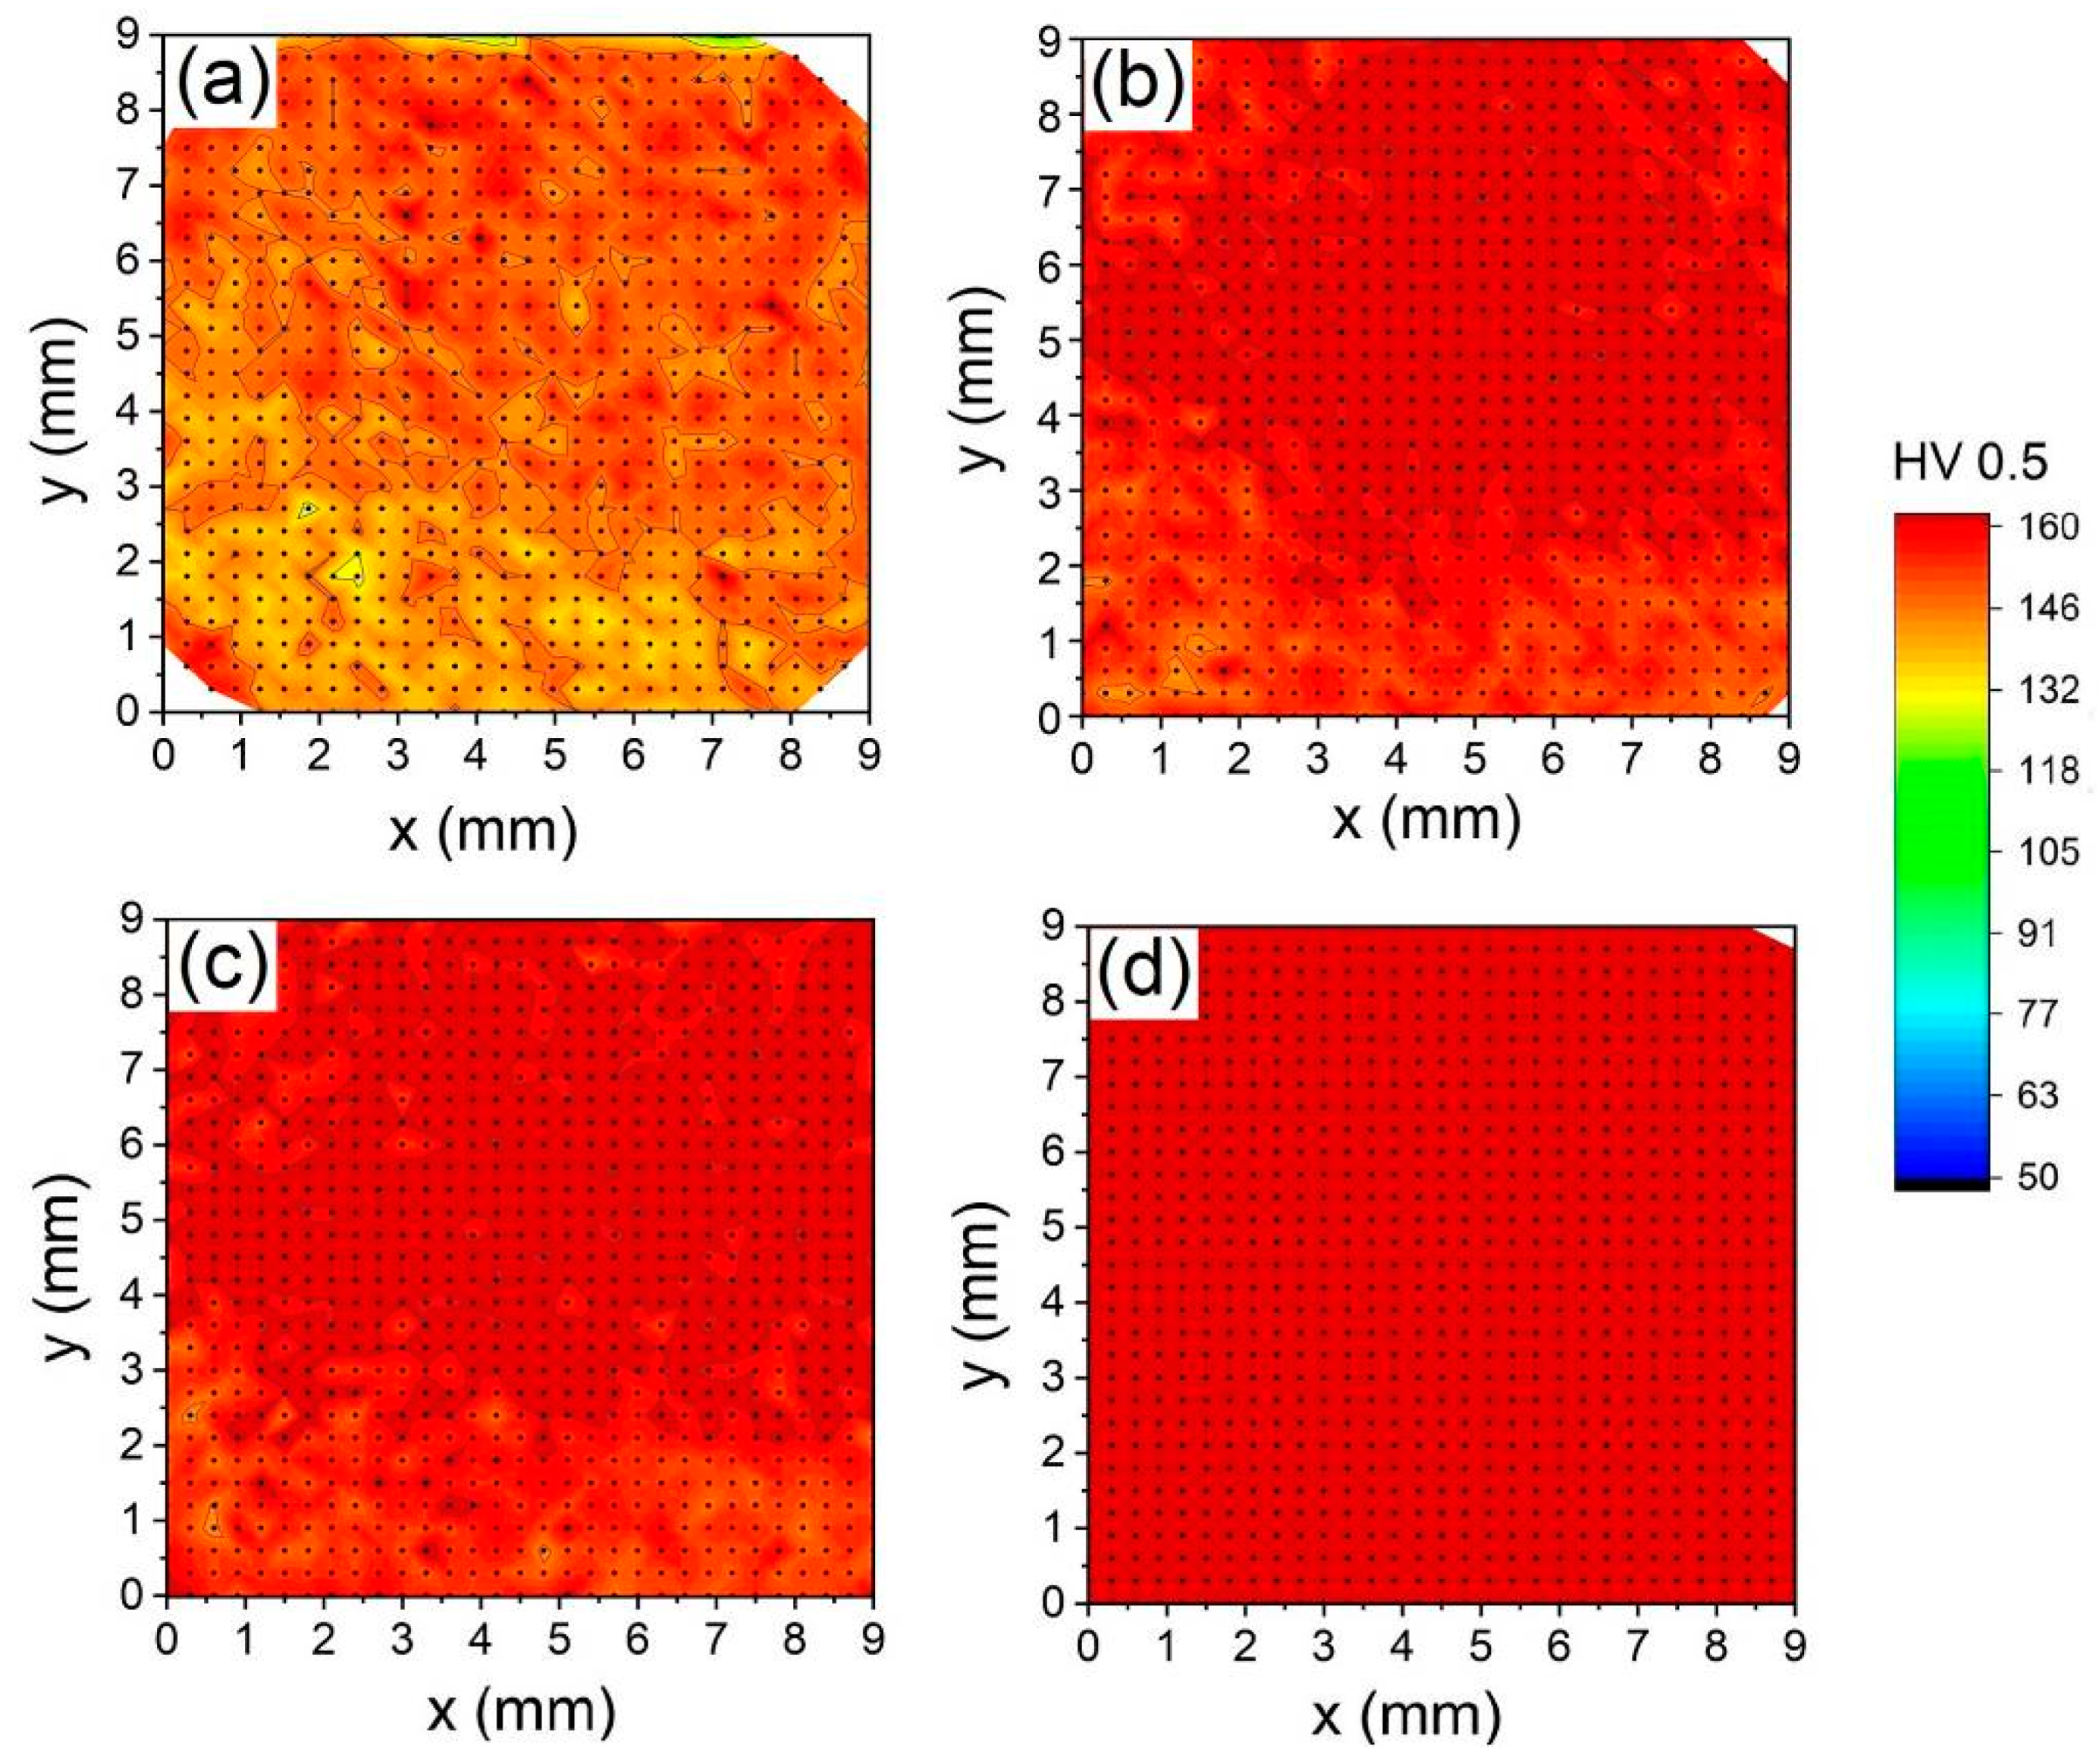
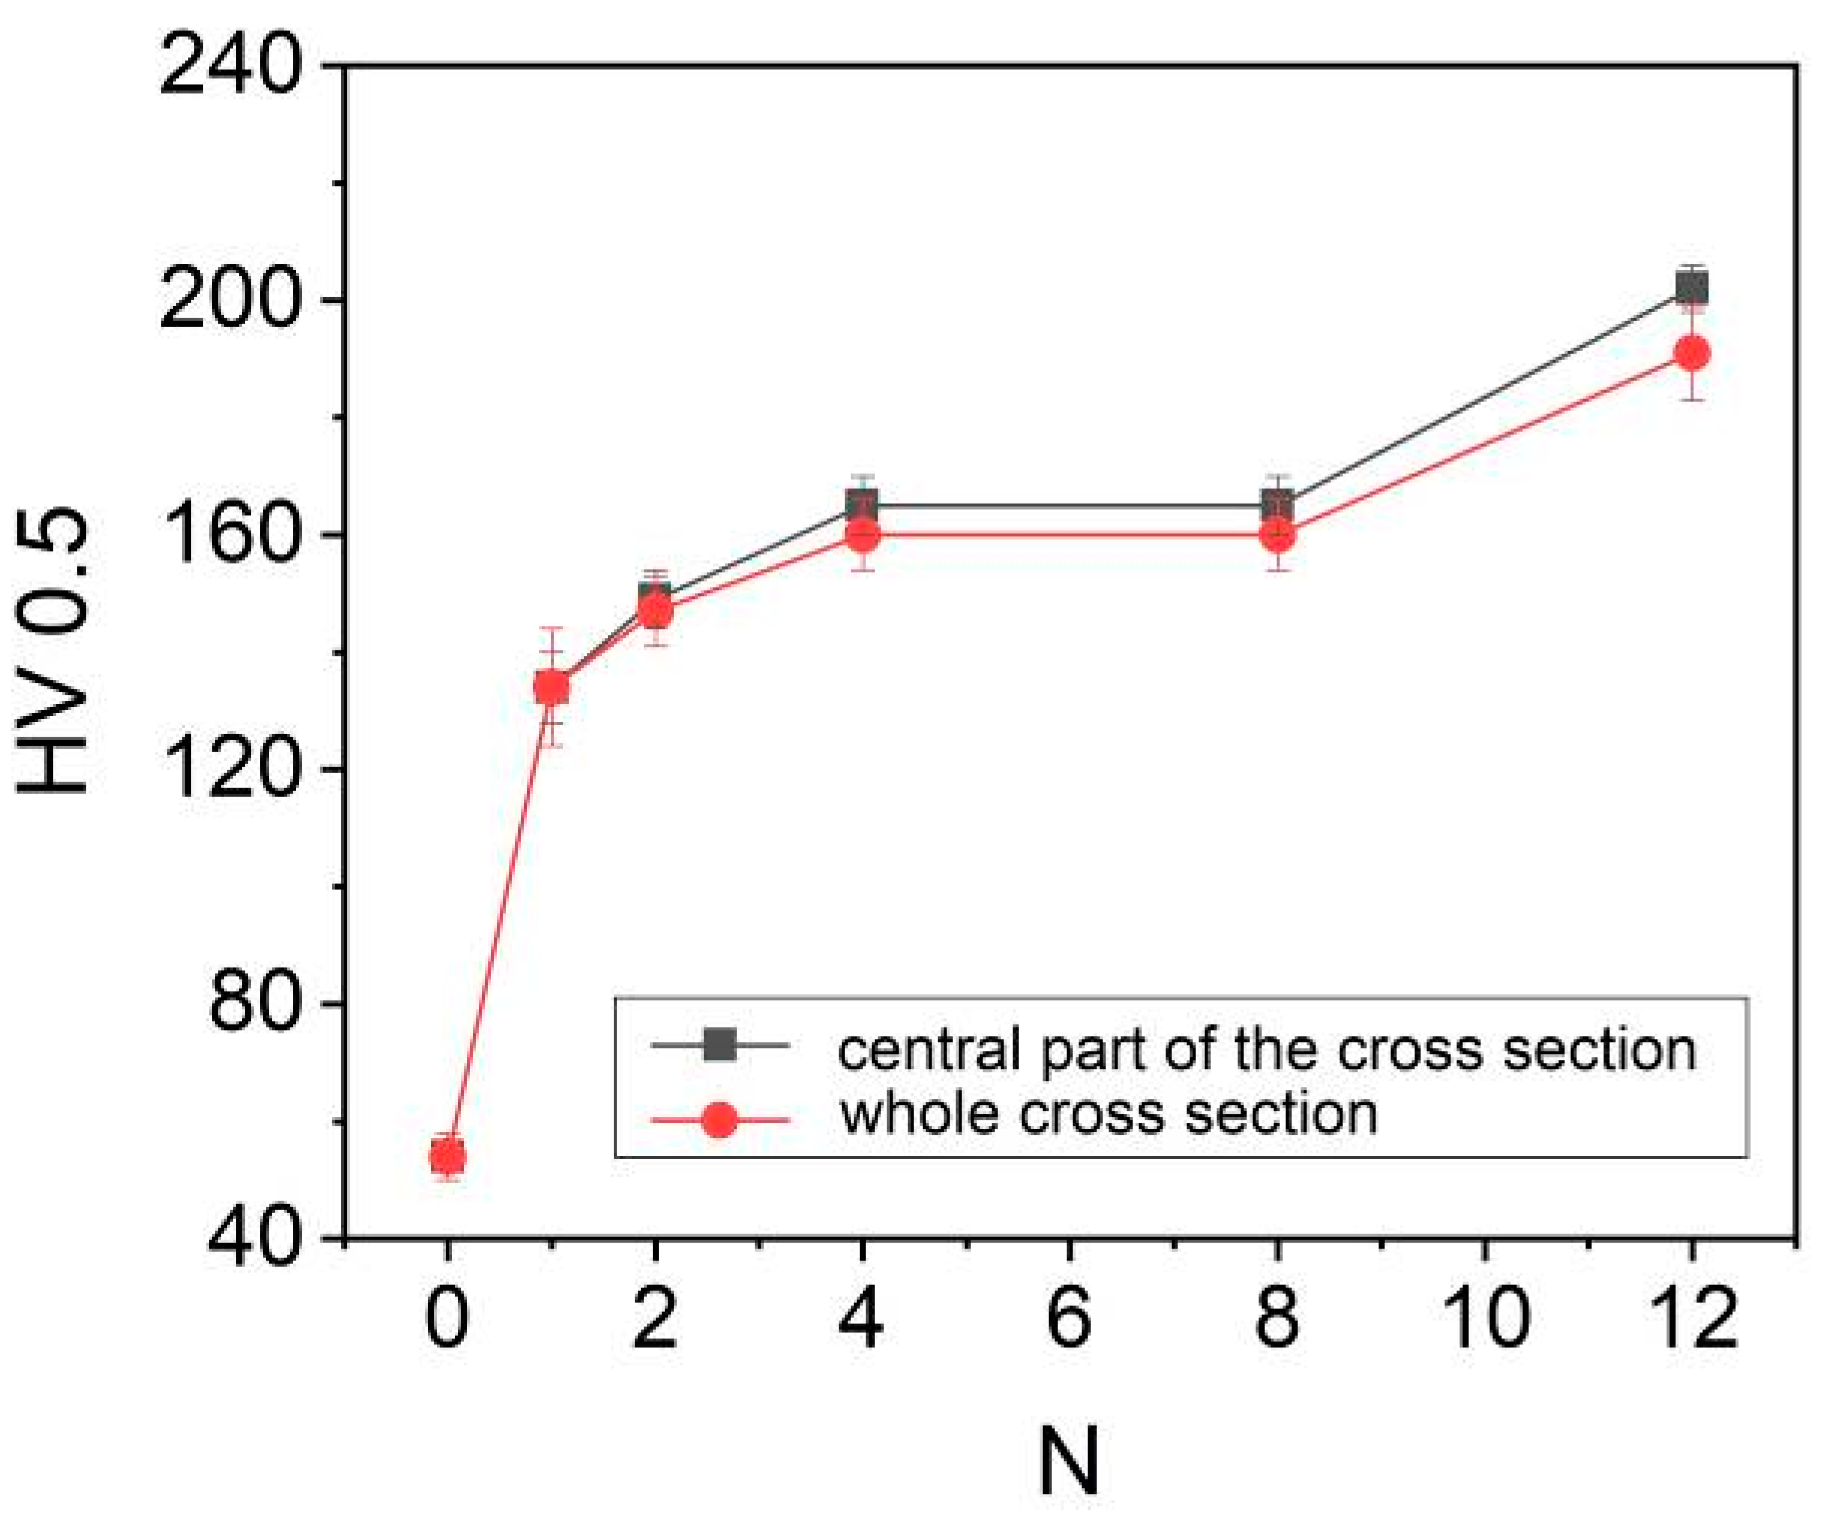
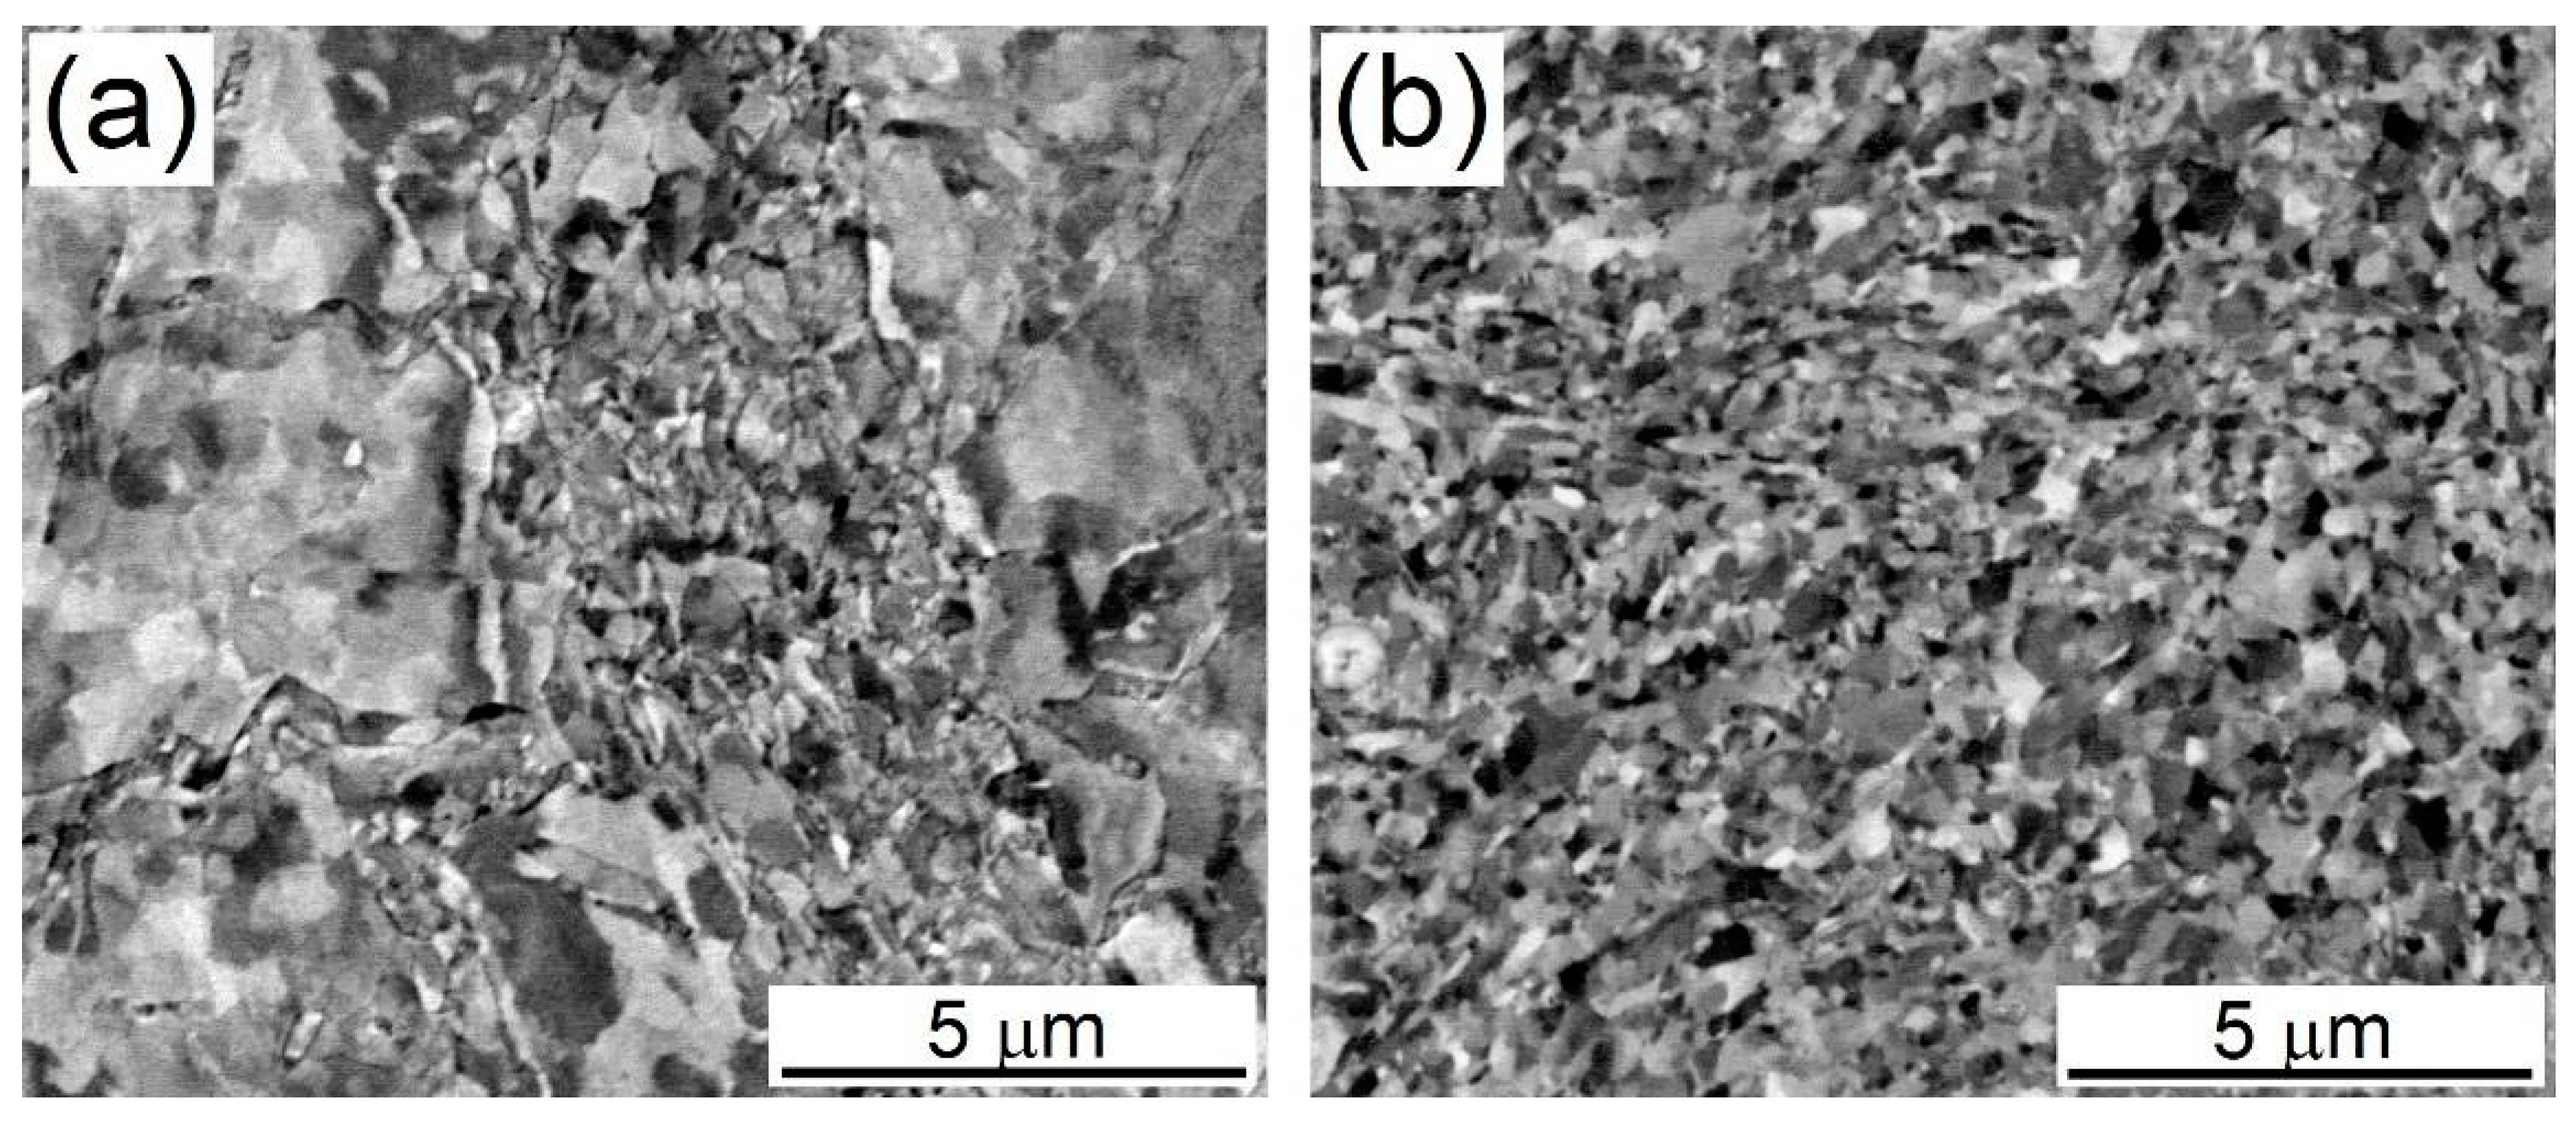
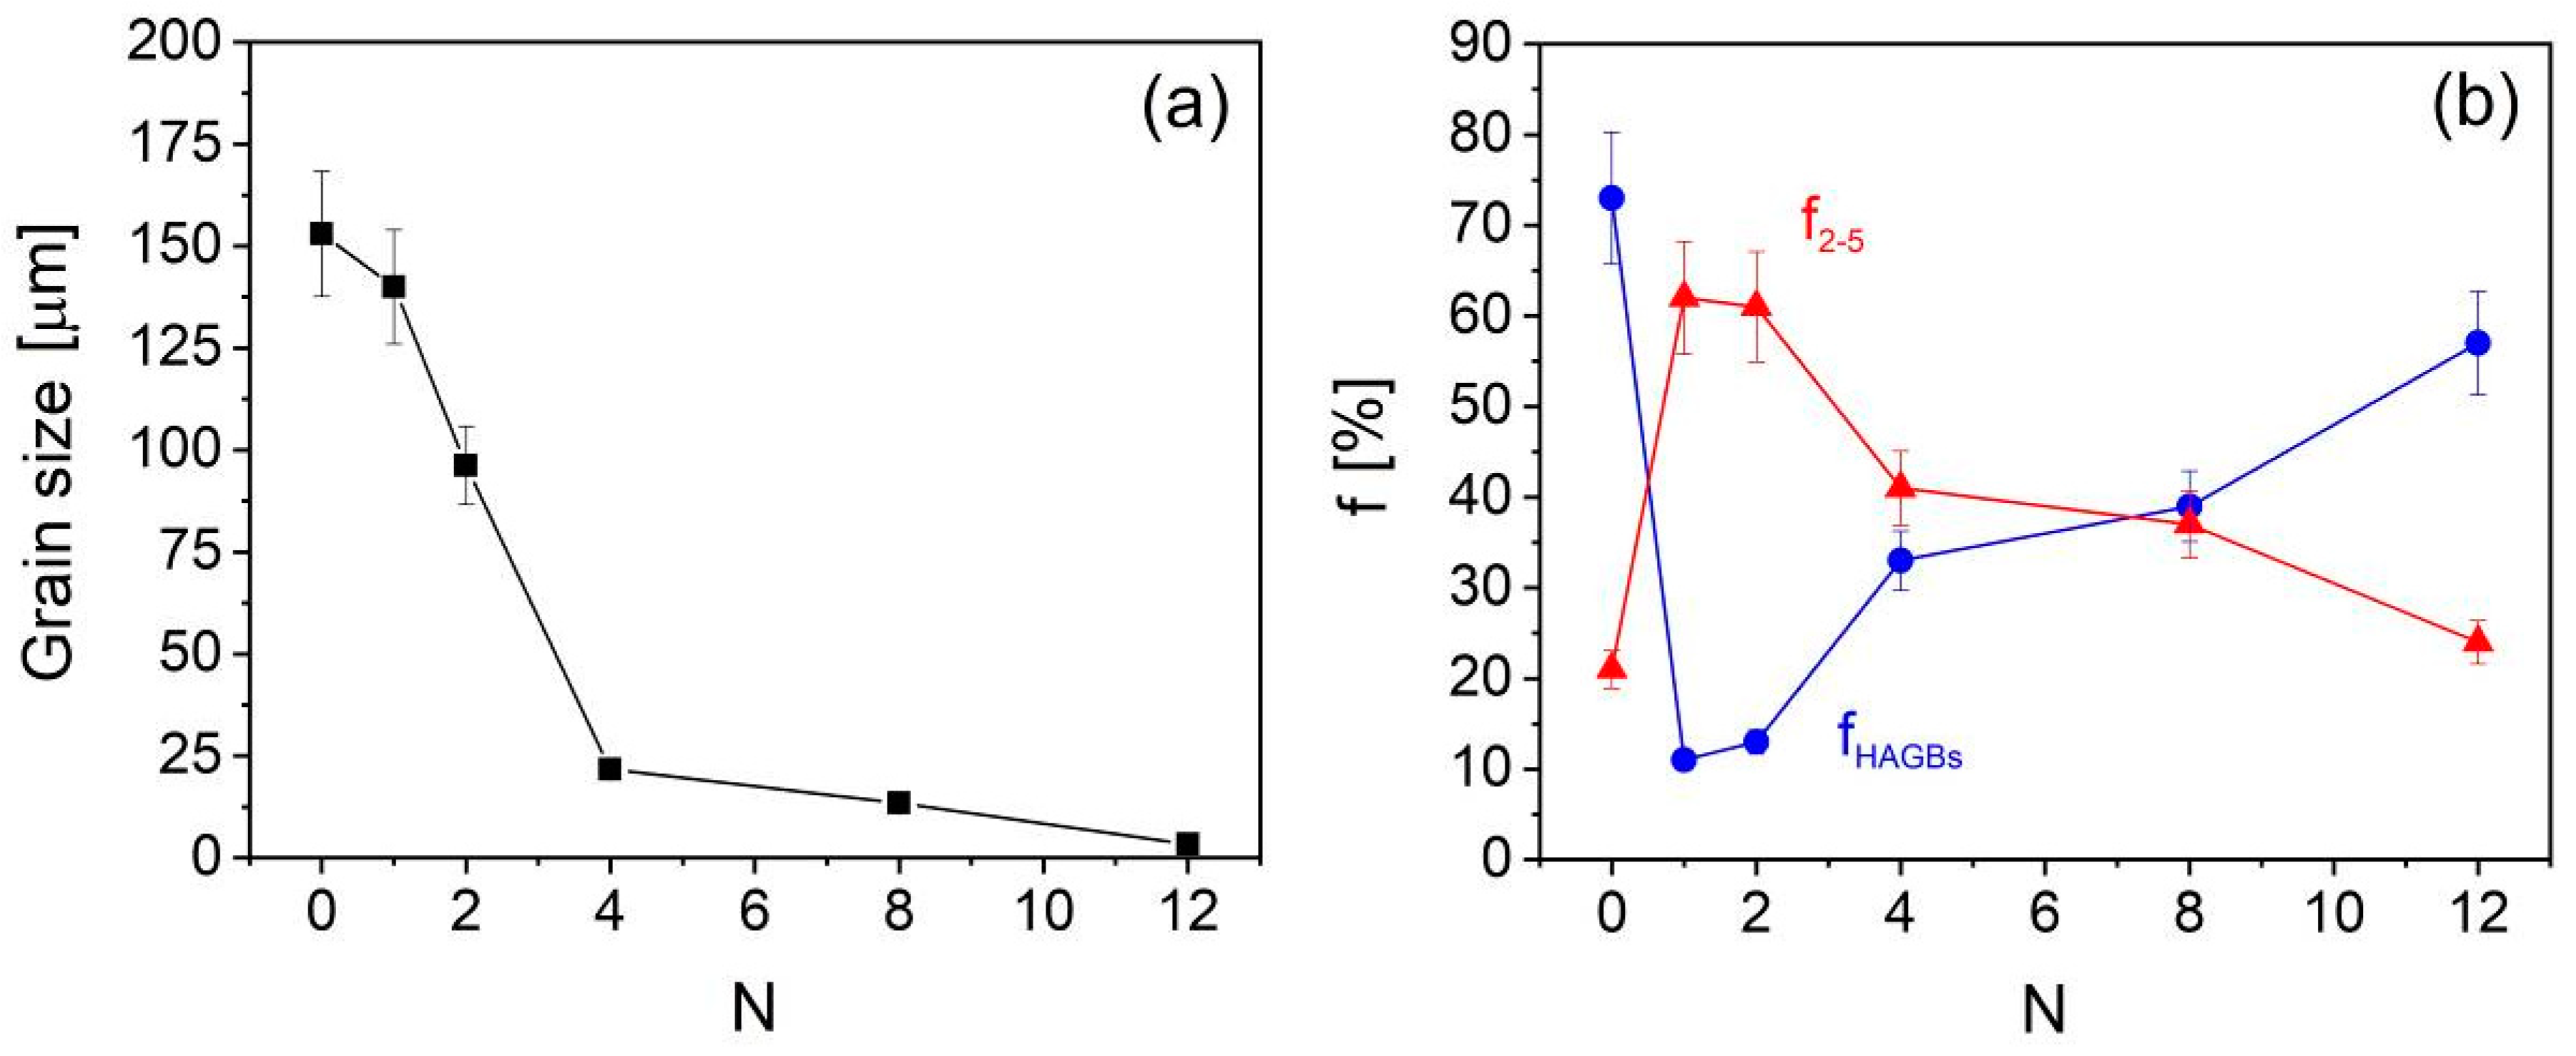
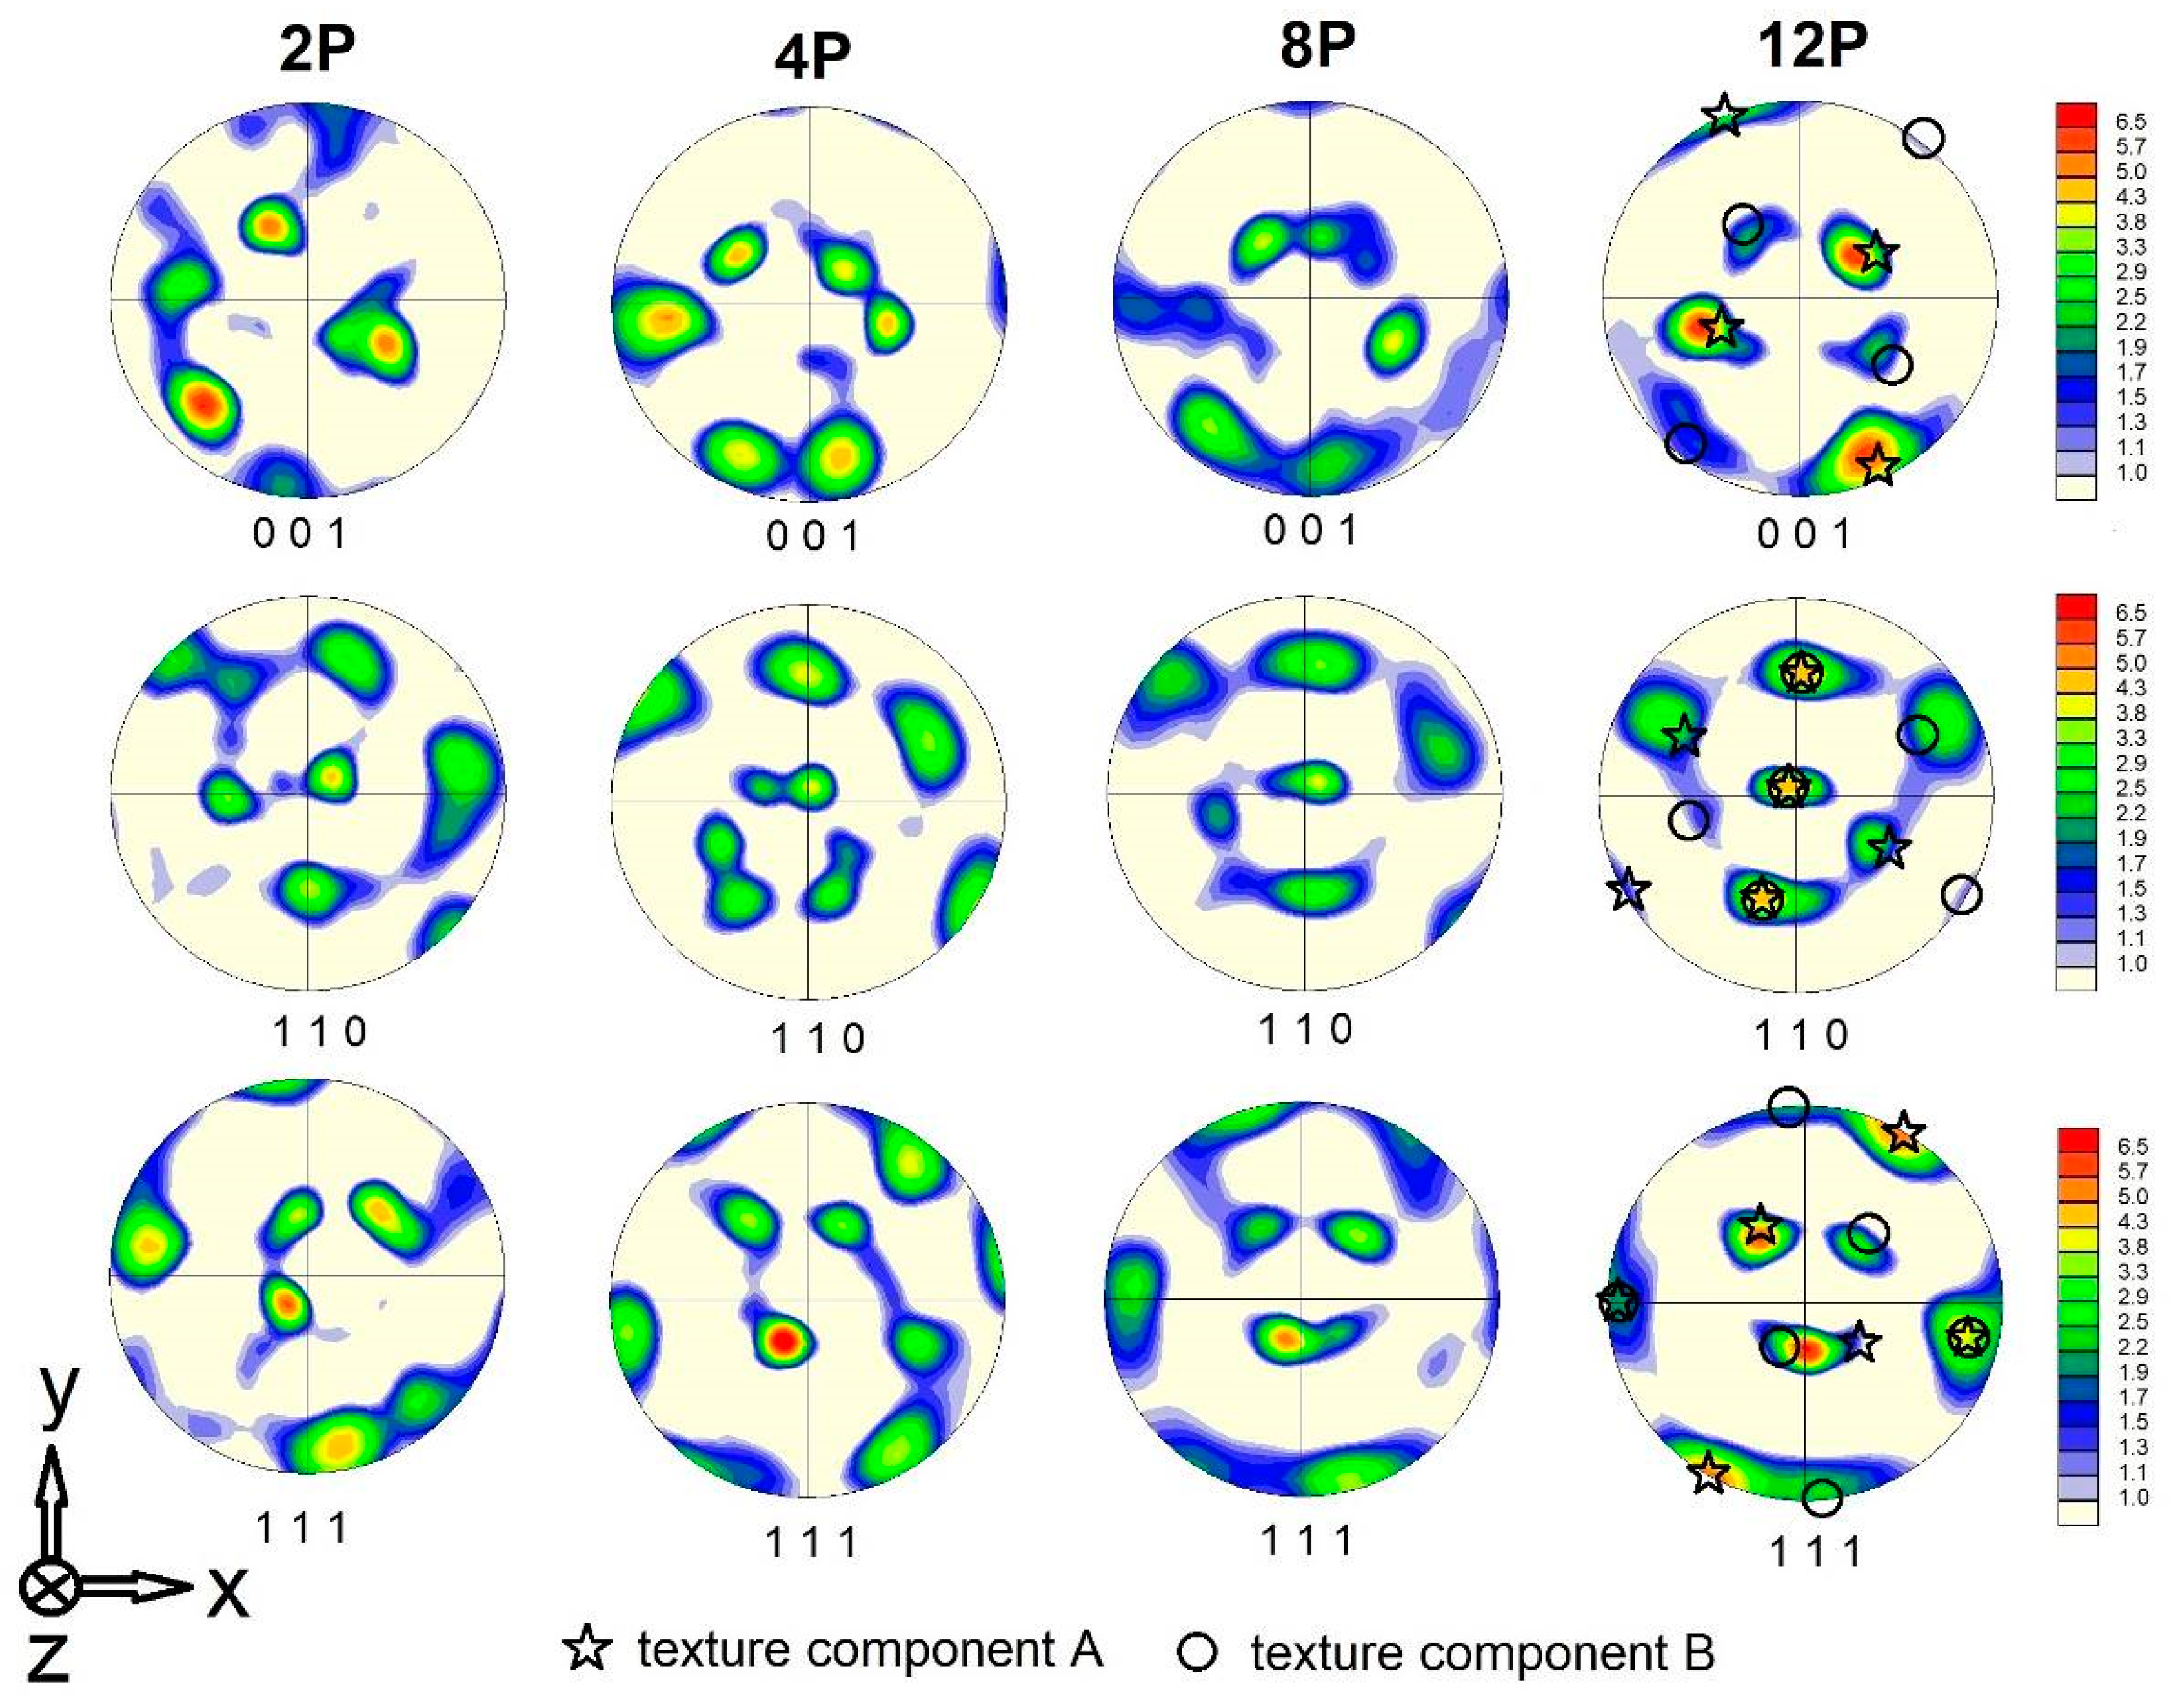
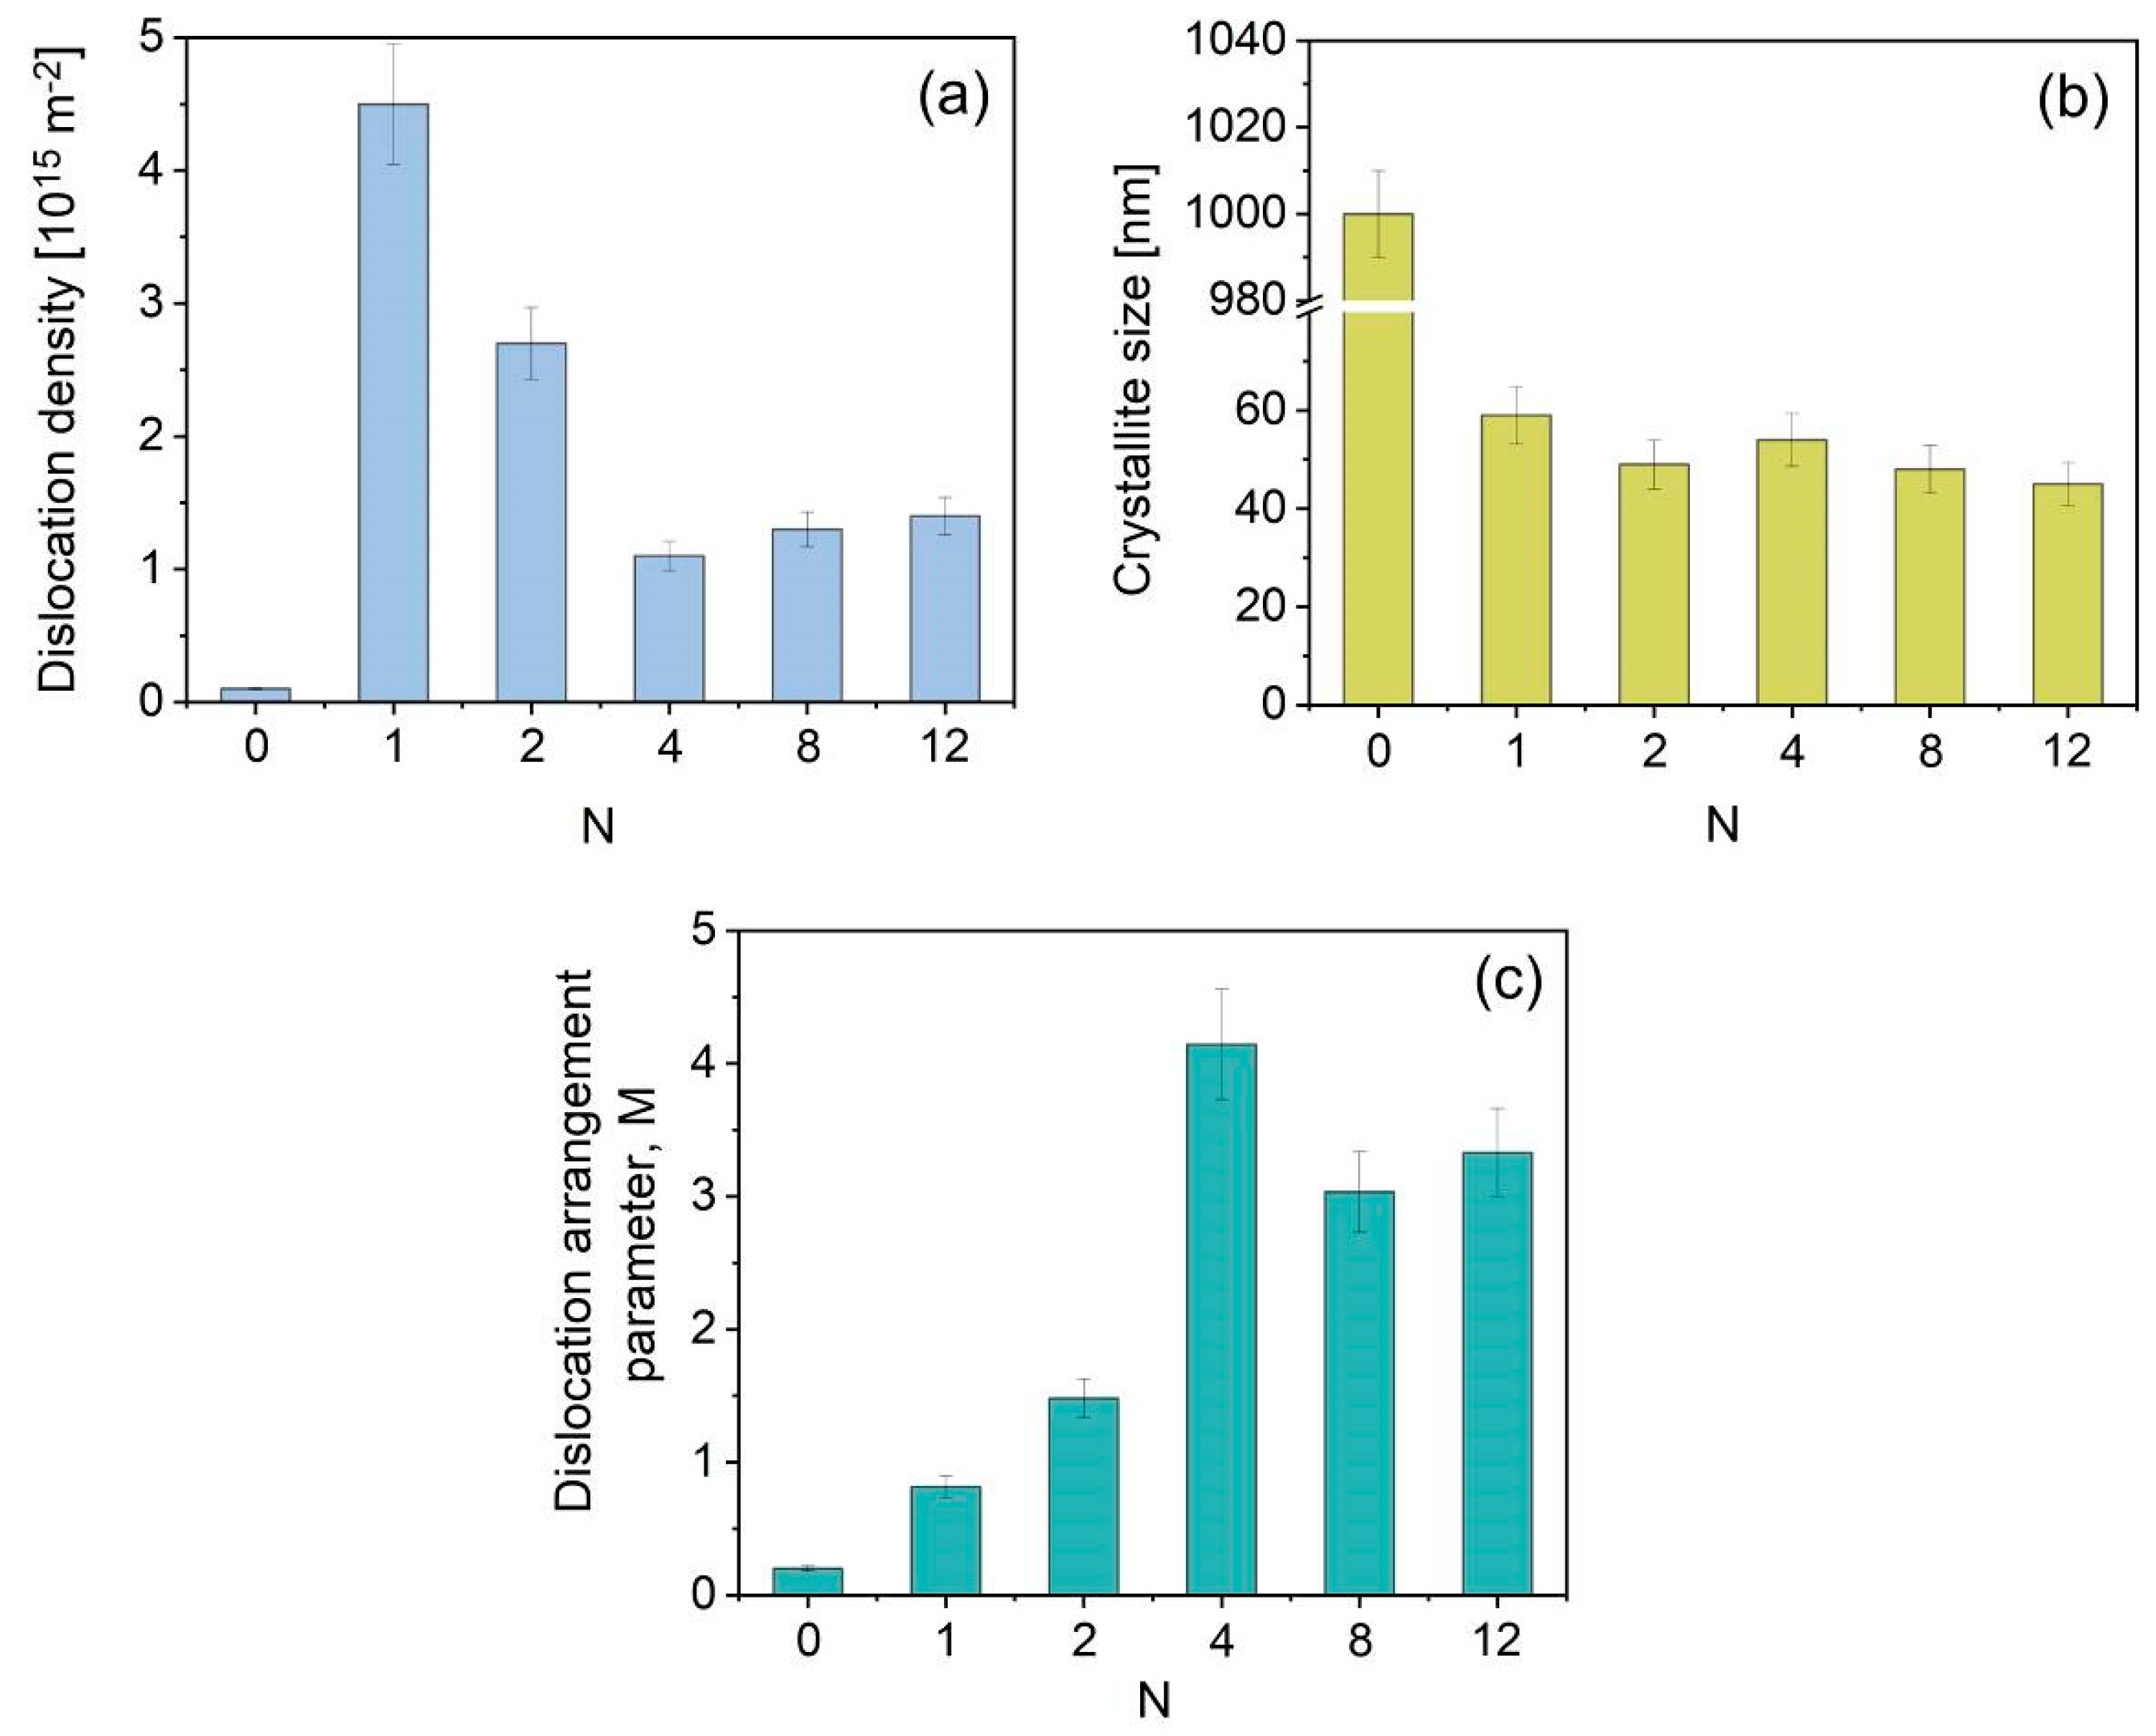
3.2. Evolution of the Microstructure with Increasing Number of Passes
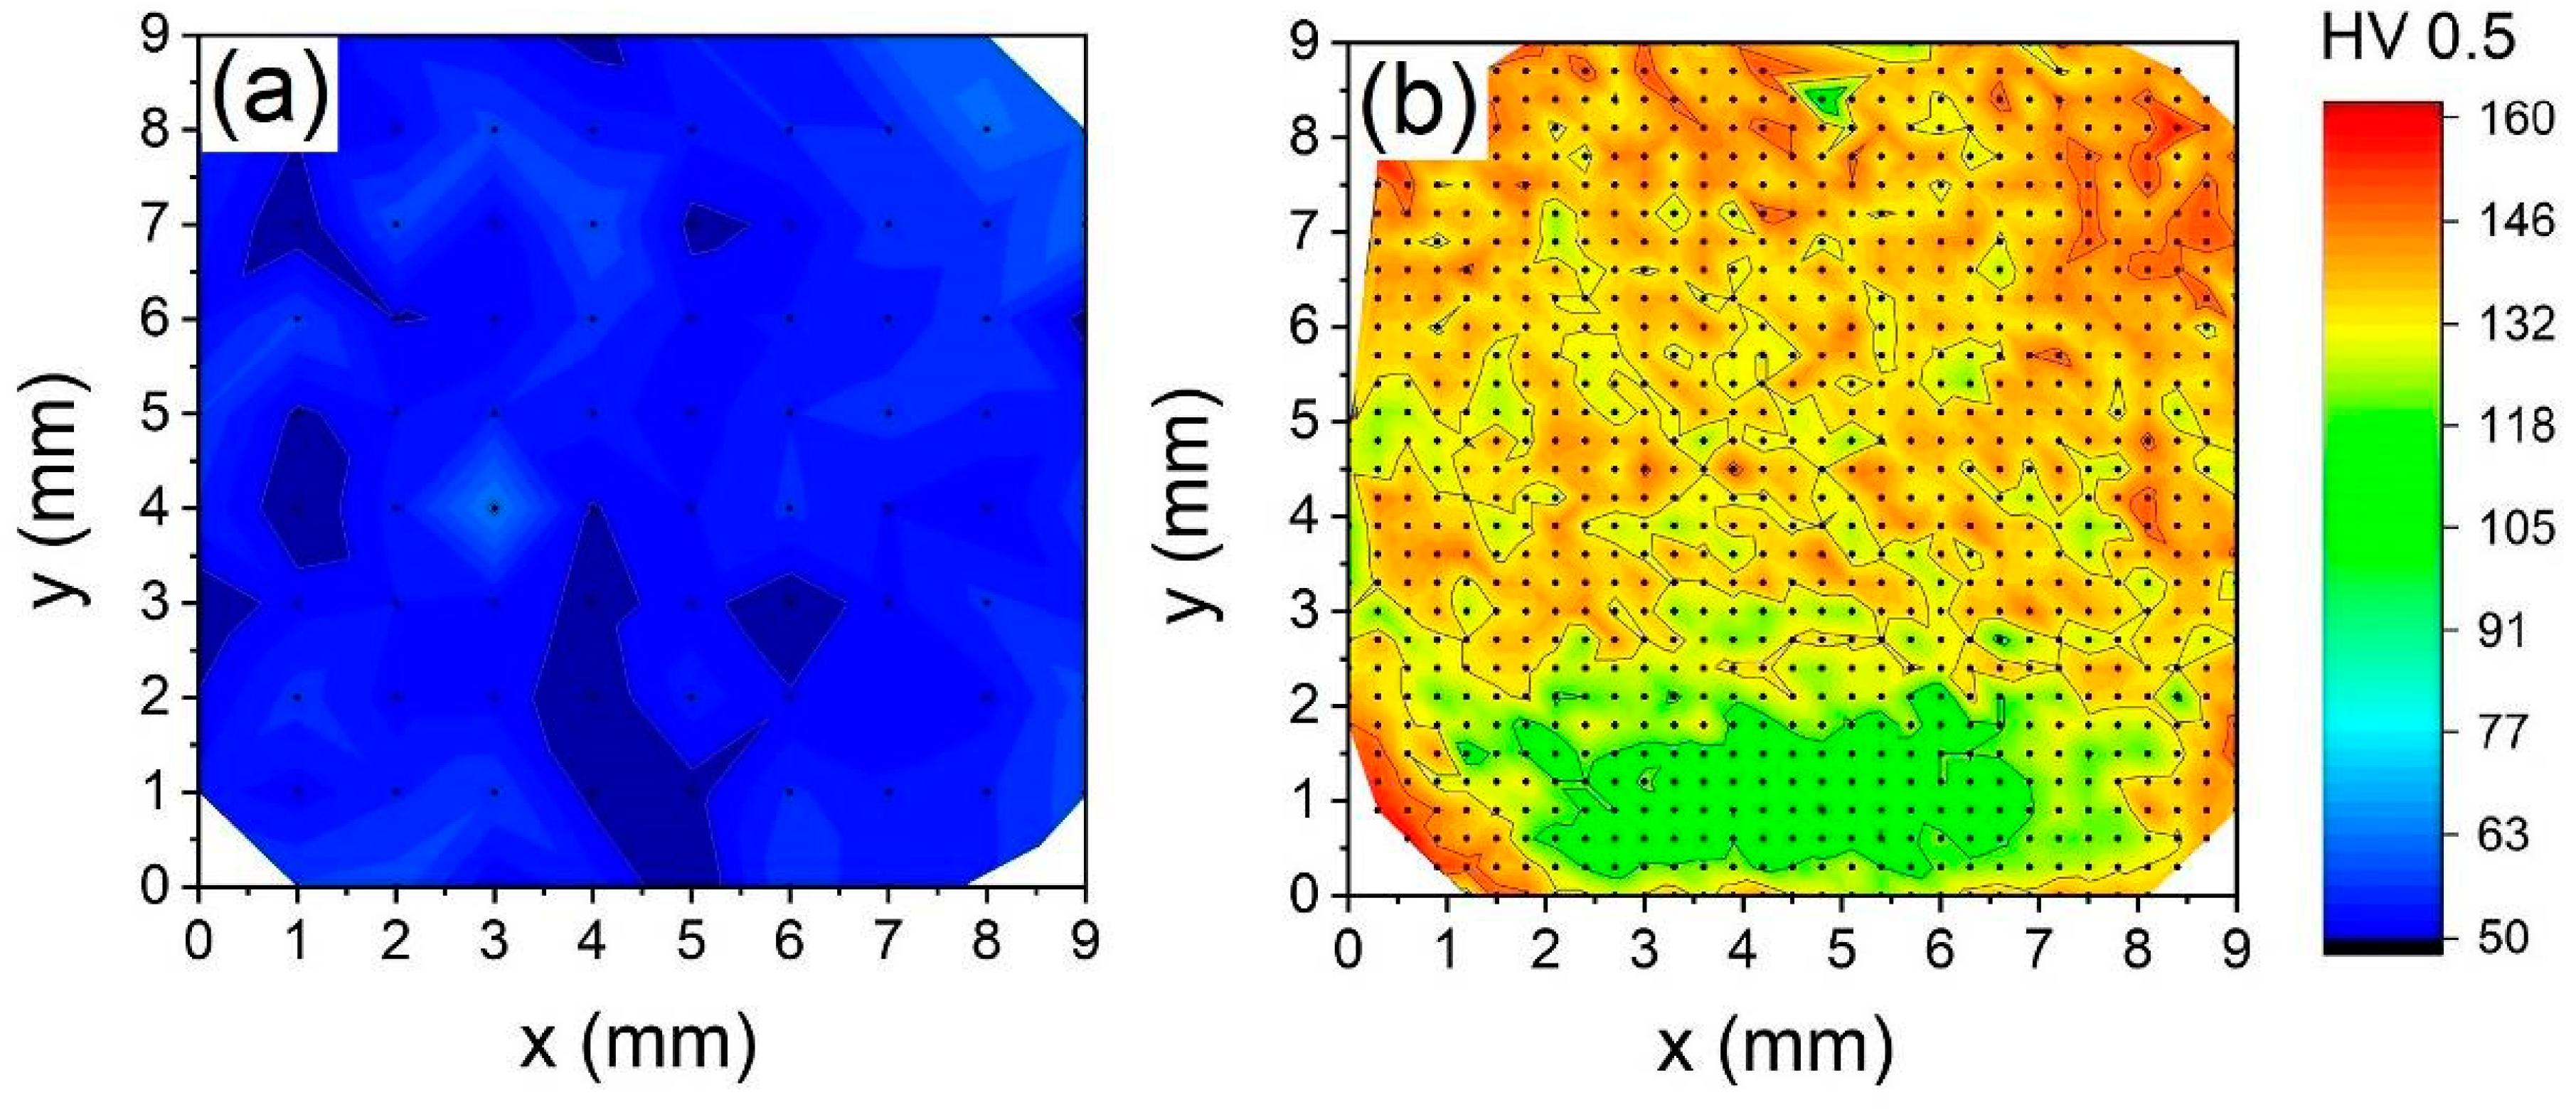
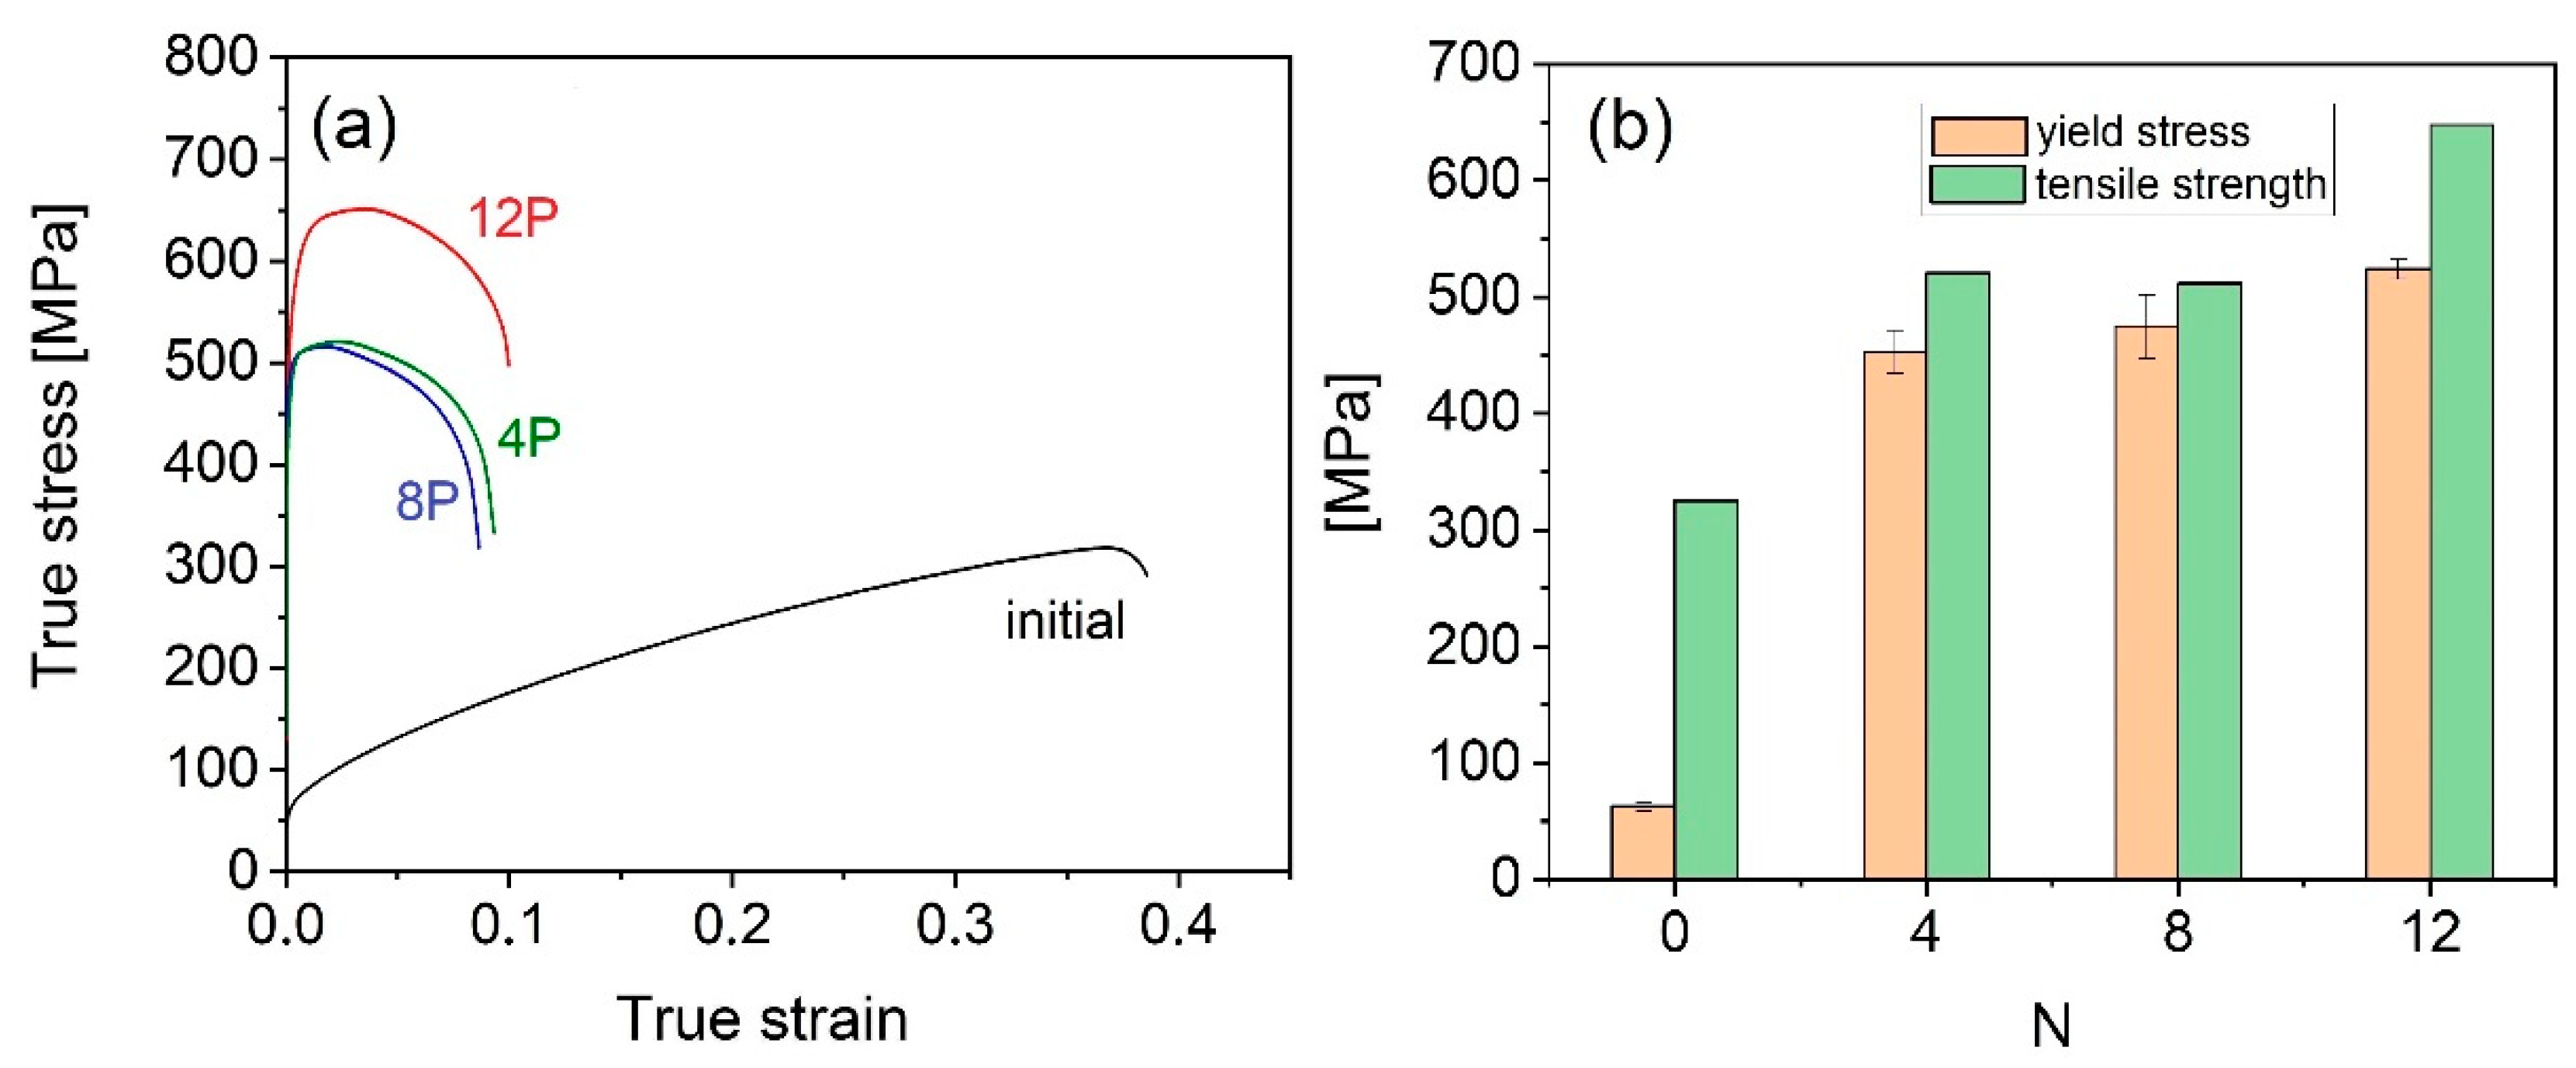
With the increasing number of RCB passes, the strain-induced hardening gradually spread into the whole volume of the material, and the hardness distribution became homogenous after twelve passes (see Figure 6). The saturation of the HV occurred first in the central part of the 4P sample and spread to the sample edges during further processing. The average microhardness calculated for the central part of the cross-section (an area of 3 × 3 mm2) and the whole cross-section as a function of N is plotted in Figure 7. After the first pass of RCB, the microhardness increased abruptly. Further processing up to four passes increased the microhardness moderately. Between four and eight passes, the HV remained constant, while after twelve passes, the HV value increased rapidly again. The total increase from 55 HV in the initial state to about 200 HV after twelve passes was observed (cf. Figure 7).
Microstructural observations by SEM in the central part of the billet cross-section show gradual microstructure fragmentation with increasing number passes. The bimodal microstructure observed in the 4P sample was continuously transformed to a unimodal one after twelve passes (cf. Figure 8). As it is apparent from Figure 9a, the morphology of the eutectic phase remained unchanged after two passes of RCB. Nevertheless, serrations on the original straight lamellas were observed at the higher number of passes (N > 2). In addition, starting from four passes, a massive precipitation of new small particles in the grain interiors of the RCB-processed samples was observed. These particles (indicated by the red ellipse in Figure 9b) were identified by using XRD as the intermetallic compound of Cu5Zr and Cu9Zr2. Additional peaks to those of the primary α-Cu phase corresponding to these phases can be observed on the XRD pattern of the specimen after four passes, as shown in Figure 9d.
EBSD grain orientation maps measured in the central part of the billet cross-section for two, four, eight and twelve passes are shown in Figure 10. HAGBs and low-angle grain boundaries (LAGBs with misorientations between 5 and 15°) are highlighted by black and red colors, respectively. The color variation inside the grains of the 2P sample indicates the presence of lattice distortions caused by RCB processing. However, the rate of microstructure refinement in the sample volume is not homogenous. The fraction of LAGBs and the number of newly formed fine grains separated by HAGBs are very different in the neighboring grains denoted as A and B in Figure 10a. With increasing number of passes, the number fraction of the newly formed grains gradually increased. Nevertheless, after twelve passes, some small non-fragmented areas (e.g., areas separated only by LAGBs) are still present.
The microstructural parameters evaluated from the EBSD images are plotted in Figure 11. The area-weighted mean grain size decreases with the increasing number of passes, see Figure 11a. The largest drop in the grain size is observed between two and four passes. During further RCB processing, the grain size decreased slightly to the value of 3.4 μm (1.4 μm if the averaging is carried out with the number fractions). As it is apparent from Figure 11b, the fraction of HAGBs (fHAGBs) rapidly decreased after the first pass. During further straining up to the twelve passes, fHAGBs increased but did not reach the value characteristic for the initial state. On the other hand, the fraction of subgrain boundaries having misorientation in the range of 2–5° (f2–5) increased abruptly after the first pass and then decreased during further straining. Nevertheless, the value of f2–5 after twelve passes was slightly higher, as compared to the initial state (see Figure 11b).
The texture evolution between two and twelve passes is illustrated by the (001), (110) and (111) EBSD poles figures in Figure 12. After two passes, the texture component C, which was dominant for the 1P sample, completely disappeared, and the maxima of texture components A and B were tilted roughly by 45° towards the y-axis. Further processing via RCB preserved both texture components; however, their position slightly varied with the increasing number of passes. After the total number of twelve passes, the crystallographic texture resembled that obtained after the first pass, except for the absence of the component C.
The dislocation density (ρ) and the area-weighted mean crystallite size (<x> area) as a function of the number of RCB passes are plotted in Figure 13a,b, respectively. In addition, the values of the microstructure parameters obtained from the CMWP fitting method are listed in Table 1. The values of ρ and <x> area of the initial sample (N = 0) were found to be below and above the detection limits of the present X-ray line profile analysis, respectively (i.e., <x> area > 1 μm, ρ < 1013 m−2). Therefore, these limits were plotted for the initial sample (N = 0) in Figure 13. The dislocation density increased at least by two orders of magnitude to ~45 × 1014 m−2 immediately after the first pass. Further processing up to four passes gradually decreased the dislocation density to about 11 × 1014 m−2. while additional processing resulted only in a marginal variation of the dislocation density. On the other hand, the crystallite size evolution with increasing number of passes was monotonous. The crystallite size decreased below 100 nm immediately after the first pass. During further processing, <x> area decreased only slightly, and after twelve passes, it reached an average value of ~45 nm. It should be noted that the crystallite size evaluated from XRD represents the size of coherently scattering domains having the misorientation of about 2°. It corresponds to the size of dislocations cells or subgrains. On the other hand, the grain size evaluated from EBSD reflects grains separated by HAGBs, and therefore it is bigger than the crystallite size. As it is apparent from Figure 13c, the dislocation arrangement parameter, M, strongly varied during RCB processing and reached a maximum after four passes. The increase of the value of parameter M indicates that the strain field of dislocations is less shielded. Between one and four passes, the increase of M is accompanied by the decrease of the dislocation density, suggesting that mainly those dislocations were annihilated which were arranged into low-energy configurations, such as dipoles or LAGBs.

3.3. Tensile Tests

The results of tensile tests for selected samples are summarized in Figure 14. In Figure 14a the true stress–true strain tensile curves are plotted. In the initial state, a strong work hardening up to the failure can be observed, resulting in a significant difference between the values of the yield stress and the ultimate tensile strength (cf. Figure 14b). As a result of RCB processing, the value of the yield stress increased in the specimen after four passes. During further processing, the yield stress gradually increased, and after twelve passes, it reached a value of about 524 MPa, which is about one order of magnitude higher than that in the initial sample (~63 MPa). Similarly to the yield stress, the ultimate tensile strength of the Cu–0.5 wt% Zr samples increased due to RCB processing. A total increase in the ultimate tensile strength with a factor of two was observed after twelve passes, while the ductility decreased below 10%.

4. Discussion

This study revealed that the application of the bending deformation through the processing by RCB led to a substantial microstructure refinement in coarse-grained Cu–0.5 wt% Zr alloy. The inhomogeneous strain imposed on the billet during the first pass resulted in the formation of a gradient-type microstructure. A similar gradient-type structure was also observed in a Cu–0.5 wt% Zr alloy deformed by simple bending [19]. During the first pass, the bottom part, deformed mainly by tension, did not exhibit any observable microstructural change. On the other hand, in the central and the top parts (the latter one deformed by compression), small grains separated by HAGBs formed. This observation suggests a more pronounced grain refinement in the central and the top parts of the sample due to the higher amount of dislocations generated in these areas. Deformation-induced dislocation rearrangement into low-energy configurations, such as dislocation walls and LAGBs, and their transformation into HAGBs (cf. Figure 4d) could cause grain refinement [20]. Due to the enhanced temperature of processing at 300 °C, the simultaneous gran-size refinement through dynamic recrystallization could not be excluded. In addition to the presented RCB technique, the processing by the gradation extrusion was found to be effective in the formation of gradient-type microstructure in age-hardenable AA6082 aluminum alloy. The combination of a coarse-grained center and an ultrafine-grained hard surface was obtained as a result of the gradation processing [21]. Further processing, accompanied by sample rotation by 90° after each pressing step, alternated the areas of the billet that were deformed by tension and compression, and this way of RCB led to a gradual homogenization of the imposed strain and resulted in a substantial microstructure refinement in the whole billet cross-section after twelve passes. In addition, the rate of microstructure fragmentation is not constant with the increasing number of passes. Whereas a rapid decrease in the grain size up to four passes of RCB was observed, further processing by eight and twelve passes decreased grain size only slightly. Such pronounced microstructure refinement, especially between two and four passes, can be explained by massive transformation of cell/subgrain boundaries having misorientation in the range of 2–5° to HAGBs (cf. Figure 11b, where the fraction of f2–5 dropped rapidly, while the fraction of HAGBs increased).
A high value of the dislocation density (~45 × 1014 m−2) was observed even after the first pass of RCB. Similar dislocation density values were achieved in dilute Cu alloys by traditional SPD techniques, such as ECAP and HPT [22]. This result proves the effectiveness of the RCB method in processing a microstructure with a high defect density. With further straining, the density of dislocations decreased, while the dislocation arrangement parameter increased between one and four passes (see Figure 13a,c). This observation can be explained by the transformation of cell/subgrain boundaries into HAGBs, which is accompanied by the annihilation of dislocations arranged in strongly correlated configurations, such as dipoles and LAGBs. However, the microstructure fragmentation was not completed even after twelve passes, as numerous LAGBs remained in the microstructure for the 12P sample and were not transformed to the HAGBs. It should be noted that the grain size achieved by RCB processing is also influenced by the initial grain size of the material. Indeed, the much smaller initial grain size of 12 μm in commercially pure grade-4 Ti resulted in a much smaller grain size of 400 nm after 10 passes of RCB, as compared to the Cu–0.5 wt% Zr alloy, where the initial grain size was 180 μm, while the minimum grain size achieved 3.4 μm [13].
In addition to the microstructure refinement, RCB processing generated a characteristic crystallographic texture in the Cu–0.5 wt% Zr samples. The strong (110) texture formed already after the first pass was partially preserved up to twelve passes. In fcc materials processed by ECAP, usually a distinct and strong fiber texture develops in association with shear deformation acting during the processing, as reported in References [23,24,25,26]. The simple shear texture is composed of two partial fibers, namely {111} <uvw> (denoted as A) and {hkl} <110> (denoted as B) (see Table 2). Regardless of the fact that the dominant deformation mechanism during RCB is not a simple shear as it is during ECAP, the texture that developed after twelve passes is very similar. Figure 15 shows orientation distribution function (ODF)-sections of the 12P sample for different ϕ2 angle values which are given in the top right corner of each ODF section. Note that the results are shown for the X-plane. The individual texture components are primarily visible in the section ϕ2 = 45°, where the positions of all “typical” components listed in Table 2 are marked. The data unambiguously show that the measured texture is consistent with the texture formed by the simple shear. However, there is an apparent shift in the ϕ1 angle of the texture components by ~25°. It has been already reported that the actual shear plane depends strongly on the geometry of the ECAP die, especially on the inner angle, and the ϕ1 value observed for RCB corresponds to an ECAP die having an inner angle of 130° [23]. As mentioned above, the deformation during RCB is not a simple shear but rather a bending process. The material is being repeatedly bent up to 90° during individual passes, causing the deformation plane to rotate by 45° from the Y-plane. However, a part of the deformation is elastic. In addition, there is an additional shear in the Y-plane, due to the driving roller. Consequently, the “actual” deformation plane is rotated only by 25° from the Y-plane. The variation in the intensity of the individual texture components is primarily caused by the fact that EBSD data were used for ODF calculation. The measured volume is relatively small compared to XRD. Moreover, a significant variation in the intensity of the individual texture components along the y-axis has already been reported in Cu processed by ECAP [24]. This variation is most probably even higher in the case of the RCB, because of the nature of bending deformation. However, the results prove that the texture resulting from RCB processing of Cu–0.5 wt% Zr resembles the one obtained by ECAP.
As a result of the microstructure refinement and the enhanced dislocation density, the strength of the RCB-processed Cu–0.5 wt% Zr samples significantly increased, while the ductility decreased substantially (cf. Figure 14a). The largest increase in the yield stress, observed after four passes, is consistent with the rapid drop in the grain size and the enhanced dislocation density as compared to the initial state. The slight increase in the yield stress between four and twelve passes can be attributed to the moderate decrease of the grain size and increase of the dislocation density. The significant increase of the average microhardness by about 140% (from 55 to 134 HV) observed already after the first pass is consistent with the rapid increase of the dislocation density (cf. Figure 7 and Figure 13a), while the grain size decreased only slightly (cf. Figure 11a). It indicates the high sensitivity of the strength of Cu–0.5 wt% Zr alloy to the dislocation strengthening and confirms the suitability of these type of alloys for mechanical processing by SPD techniques.

5. Conclusions

In the present study, several experiments were conducted for the study of the microstructure and the mechanical properties of a microalloyed Cu–0.5 wt% Zr alloy processed by RCB. The results can be summarized as follows:
Application of bending deformation via rotational constrained bending led to the formation of a gradient-type microstructure after the first pass. Processing by a higher number of passes gradually refined the microstructure in the whole billet cross-section. A refined, homogenous microstructure with an average grain size of 3.4 μm was obtained after twelve passes.
A substantial enhancement of the dislocation density to ~45 × 1014 m−2 was found even after the first pass of RCB. A further increase of the number of passes to four caused a gradual reduction of the dislocation density to ~11 × 1014 m−2. In addition, the dislocation arrangement parameter increased between one and four passes. After four passes, significant change in the dislocation structure was not observed.
The formation of a strong (110) crystallographic texture was observed in the RCB samples.
The yield stress and the ultimate tensile strength increased for twelve passes by factors of eight and two, respectively, as compared to the initial state, due to the strong grain refinement.

Author Contributions

Conceptualization, M.J. and G.R.; methodology, A.R. and R.A.; validation, J.G.; investigation, T.K., P.M., F.N. and P.T.H.; data curation, T.K.; writing—original draft preparation, T.K. and P.M.; writing—review and editing, M.J. and J.G.; visualization, T.K., P.M. and G.R. All authors have read and agreed to the published version of the manuscript.

Funding

This work was financially supported by the Ministry of Education, Youth and Sports of the Czech Republic, under the project LTARF18010, and by the Ministry of Science and Higher Education of the Russian Federation, under grant agreement No. 14.586.21.0059 (UIN: RFMEFI58618X0059). Partial financial support by ERDF project no. CZ.02.1.01/0.0/0.0/15 003/0000485 is also gratefully acknowledged. This work was completed in the ELTE Institutional Excellence Program (TKP2020-IKA-05) financed by the Hungarian Ministry of Human Capacities.

Conflicts of Interest

The authors declare no conflict of interest.

References

  1. Langdon, T.G. Twenty-five years of ultrafine-grained materials: Achieving exceptional properties through grain refinement. Acta Mater. 2013, 61, 7035–7059. [Google Scholar] [CrossRef]
  2. Valiev, R.Z.; Islamgaliev, R.K.; Alexandrov, I.V. Bulk nanostructured materials from severe plastic deformation. Prog. Mater. Sci. 2000, 45, 103–189. [Google Scholar] [CrossRef]
  3. Raab, G.J.; Valiev, R.Z.; Lowe, T.C.; Zhu, Y.T. Continuous processing of ultrafine grained Al by ECAP—Conform. Mater. Sci. Eng. A 2004, 382, 30–34. [Google Scholar] [CrossRef]
  4. Saito, Y.; Utsunomiya, H.; Tsuji, N.; Sakai, T. Novel ultra-high straining process for bulk materials—Development of the accumulative roll-bonding (ARB) process. Acta Mater. 1999, 47, 579–583. [Google Scholar] [CrossRef]
  5. Asano, M.; Yuasa, M.; Miyamoto, H.; Tanaka, T.; Erdogan, C.; Yalçinkaya, T. Potential of High Compressive Ductility of Ultrafine Grained Copper Fabricated by Severe Plastic Deformation. Metals 2020, 10, 1503. [Google Scholar] [CrossRef]
  6. Segal, V.M. Materials processing by simple shear. Mater. Sci. Eng. A 1995, 197, 157–164. [Google Scholar] [CrossRef]
  7. Krajňák, T.; Minárik, P.; Gubicza, J.; Máthis, K.; Kužel, R.; Janeček, M. Influence of equal channel angular pressing routes on texture, microstructure and mechanical properties of extruded AX41 magnesium alloy. Mater. Charact. 2017, 123, 282–293. [Google Scholar] [CrossRef]
  8. Minárik, P.; Veselý, J.; Čížek, J.; Zemková, M.; Vlasák, T.; Krajňák, T.; Kubásek, J.; Král, R.; Hofman, D.; Stráská, J. Effect of secondary phase particles on thermal stability of ultra-fine grained Mg-4Y-3RE alloy prepared by equal channel angular pressing. Mater. Charact. 2018, 140, 207–216. [Google Scholar] [CrossRef]
  9. Zhilyaev, A.P.; Langdon, T.G. Using high-pressure torsion for metal processing: Fundamentals and applications. Prog. Mater. Sci. 2008, 53, 893–979. [Google Scholar] [CrossRef]
  10. Stráská, J.; Janeček, M.; Gubicza, J.; Krajňák, T.; Yoon, E.Y.; Kim, H.S. Evolution of microstructure and hardness in AZ31 alloy processed by high pressure torsion. Mater. Sci. Eng. A 2015, 625, 98–106. [Google Scholar] [CrossRef]
  11. Čížek, J.; Hruška, P.; Vlasák, T.; Vlček, M.; Janeček, M.; Minárik, P.; Krajňák, T.; Šlapáková, M.; Dopita, M.; Kužel, R.; et al. Microstructure development of ultra fine grained Mg-22 wt%Gd alloy prepared by high pressure torsion. Mater. Sci. Eng. A 2017, 704, 181–191. [Google Scholar] [CrossRef]
  12. Raab, G.I.; Utyashev, F.Z.; Asfandiyarov, R.N.; Raab, A.G.; Aksenov, D.A.; Kodirov, I.S.; Janeček, M.; Krajňák, T. Physical and Technical Foundations of the Use of Alternating Free Bending for Producing Long-length Semi-products from Metals and Alloys with Improved Mechanical Properties. Metals 2020, 10, 879. [Google Scholar] [CrossRef]
  13. Krajňák, T.; Janeček, M.; Minárik, P.; Veselý, J.; Cejpek, P.; Gubicza, J.; Hung, P.T.; Preisler, D.; Nový, F.; Raab, A.G.; et al. Microstructure evolution and mechanical properties of cp-Ti processed by a novel technique of rotational constrained bending. Metall. Mater. Trans. A. under review.
  14. Muramatsu, N.; Kimura, H.; Inoue, A. Development and Microstructure of Cu-Zr Alloy Wire with Ultimate Tensile Strength of 2.2 GPa. Mater. Trans. 2012, 53, 1062–1068. [Google Scholar] [CrossRef]
  15. Furukawa, M.; Horita, Z.; Nemoto, M.; Langdon, T.G. Review: Processing of metals by equal-channel angular pressing. J. Mater. Sci. 2001, 36, 2835–2843. [Google Scholar] [CrossRef]
  16. Raab, G.I.; Aksenov, D.A.; Asfandiyarov, R.N.; Raab, A.G.; Kodirov, I.S.; Janeček, M. Characteristics of the stress-strain state and structural changes in axisymmetric samples under sign-alternating deformation by free and constrained bending. Lett. Mater. 2019, 9, 494–498. [Google Scholar] [CrossRef] [Green Version]
  17. Ribárik, G.; Gubicza, J.; Ungár, T. Correlation between strength and microstructure of ball-milled Al–Mg alloys determined by X-ray diffraction. Mater. Sci. Eng. A 2004, 387–389, 343–347. [Google Scholar] [CrossRef]
  18. Muramatsu, N.; Kimura, H.; Inoue, A. Microstructures and Mechanical Properties of Highly Electrically Conductive Cu 0.5, Cu 1 and Cu 2 at% Zr Alloy Wires. Mater. Trans. 2013, 54, 176–183. [Google Scholar] [CrossRef] [Green Version]
  19. Raab, A.G.; Aksenov, D.A.; Asfandiyarov, R.N.; Kodirov, I.S.; Raab, G.I. Development of severe plastic deformation methods for the production of contact wires from a Cu-Zr alloy for high-speed railways. IOP Conf. Series: Mater. Sci. Eng. 2018, 447, 012088. [Google Scholar] [CrossRef]
  20. Chen, Y.J.; Li, Y.J.; Walmsley, J.C.; Dumoulin, S.; Skaret, P.C.; Roven, H.J. Microstructure evolution of commercial pure titanium during equal channel angular pressing. Mater. Sci. Eng. A 2010, 527, 789–796. [Google Scholar] [CrossRef] [Green Version]
  21. Frint, P.; Härtel, M.; Selbmann, R.; Dietrich, D.; Bergmann, M.; Lampke, T.; Landgrebe, D.; Wagner, M.F. Microstructural Evolution during Severe Plastic Deformation by Gradation Extrusion. Metals 2018, 8, 96. [Google Scholar] [CrossRef] [Green Version]
  22. Gubicza, J. Defect Structure and Properties of Nanomaterials; Woodhead Publishing: Duxford, UK, 2017. [Google Scholar]
  23. Li, S.; Beyerlein, I.J.; Bourke, M.A.M. Texture formation during equal channel angular extrusion of fcc and bcc materials: Comparison with simple shear. Mater. Sci. Eng. A 2005, 394, 66–77. [Google Scholar] [CrossRef]
  24. Klein, H.; Schwarzer, R.A. Texture Heterogeneity in ECAP Deformed Copper. Solid State Phenom. 2010, 160, 47–54. [Google Scholar] [CrossRef]
  25. Molodovaa, X.; Bhaumik, S.; Winning, M.; Gottstein, G. ECAP Processed Copper during Deformation and Subsequent Annealing. Mater. Sci. Forum 2006, 503–504, 469–474. [Google Scholar] [CrossRef]
  26. Suwas, S.; Massion, R.A.; Tóth, L.S.; Eberhardt, A.; Fundenberger, J.J.; Skrotzki, W. Evolution of crystallographic texture during equal channel angular extrusion of copper: The role of material variables. Metall. Mater. Trans. A 2006, 37, 739–753. [Google Scholar] [CrossRef]
Figure 1. (a) Schematic of the die for processing via constrained bending. The main part of the die comprises 1—plunger, 2—billet, 3—roller and 4—steel die. (b) Orientation of the workpiece in the orthogonal coordinate system used for representation of microhardness and texture measurements.
Metals 11 00063 g001
Figure 2. (a) SEM micrograph of the initial state, (b) grain orientation map, (c) magnified view showing the secondary phase Cu5Zr on grain boundaries and particles of Cu9Zr2 inside the original grains as indicated by the red arrows, and (d) the corresponding XRD pattern.
Metals 11 00063 g002
Figure 3. Microhardness maps of (a) the initial and (b) the 1P sample measured on the cross-section of the samples.
Metals 11 00063 g003
Figure 4. Optical micrographs for the 1P sample, showing the microstructure in the (a) bottom, (b) middle and (c) top parts of the billet cross-section (plane Z). Magnified view of the microstructure from the top part is shown as an electron backscatter diffraction (EBSD) grain orientation map in (d).
Metals 11 00063 g004
Figure 5. EBSD pole figures (001), (110) and (111) for (a) the initial state and (b) the sample after one pass of rotational constrained bending (RCB). The maxima corresponding to the particular texture components A, B and C are denoted by symbols according to the legend placed in the bottom part of the figure. (c) Graphical representations of the orientation of the cubic cells corresponding to the three texture components.
Metals 11 00063 g005
Figure 6. Microhardness maps measured on the billet cross-section (plane Z) for the samples processed by (a) two, (b) four, (c) eight and (d) twelve passes of RCB. The positions of individual indents are marked by the black points in these maps.
Metals 11 00063 g006
Figure 7. The average hardness as a function of the number of passes (N) calculated for the whole and central part (an area of 3 × 3 mm2) of the cross-section.
Metals 11 00063 g007
Figure 8. SEM micrographs of the Cu–0.5 wt% Zr samples processed by (a) four passes and (b) twelve passes of RCB (central part of the billet cross-section, plane Z).
Metals 11 00063 g008
Figure 9. SEM micrographs taken on the central part of the billet cross-section of the Cu–0.5 wt% Zr sample processed by (a) two passes, (b) four passes and (c) twelve passes. The red ellipse in (b) shows an area where new small particles formed in the grain interior. (d) The XRD patterns of samples processed by different number of passes. The peaks of both secondary phases Cu5Zr and Cu9Zr2 are indicated by solid circles and open squares, respectively. In (d), the pattern for the 1P sample is not shown, as it is the same as the pattern of the 2P sample.
Metals 11 00063 g009
Figure 10. EBSD grain orientation maps for the Cu–0.5 wt% Zr samples processed by (a) two passes, (b) four passes, (c) eight passes and (d) twelve passes. Low-angle grain boundaries (LAGBs) and high-angle grain boundaries (HAGBs) are indicated by red and black colors, respectively.
Metals 11 00063 g010
Figure 11. (a) Average grain size and (b) fraction of HAGBs and subgrain boundaries with misorientation in the range of 2–5° plotted as a function of the number of passes N.
Metals 11 00063 g011
Figure 12. EBSD pole figures (001), (110) and (111) for the samples processed by two, four, eight and twelve passes of RCB.
Metals 11 00063 g012
Figure 13. Evolution of (a) the dislocation density, (b) the crystallite size and (c) the dislocation arrangement parameter M with increasing number of RCB passes.
Metals 11 00063 g013
Figure 14. (a) True stress–true strain tensile curves and (b) tensile properties in selected samples.
Metals 11 00063 g014
Figure 15. ODF-sections of the 12P sample for different ϕ2 angle values. The texture was calculated for the X-plane. The notations of the ideal texture orientations are listed in Table 2 (ϕ2 values are given in the top right corner of each subgraph).
Metals 11 00063 g015
Table 1. The values of the dislocation density (ρ), the crystallite size (<x> area) and the dislocation arrangement parameter (M) obtained from XLPA.
Number of Passesρ (1014 m−2)<x> area (nm)M
0˂0.1>1000n/a
145 ± 559 ± 60.8 ± 0.1
227 ± 349 ± 51.5 ± 0.2
411 ± 154 ± 54.1 ± 0.4
813 ± 148 ± 53.0 ± 0.3
1214 ± 145 ± 43.3 ± 0.3
Table 2. The main ideal orientations of texture components formed by a simple shear in the Y-plane. The data are given for ϕ2 = 45°.
ComponentMiller Indicesφ1Euler Angles (°) ϕφ2Fiber
■ A*1(111) [−1–12]125.269045A
▼ A*2(111) [11–2]54.74/234.749045A
▶ A(1−11) [110]035.2645B
◀ A-(−11–1) [−1–10]18035.2645B
◆ B(1–12) [110]0/120/24054.7445B
● B-(−11–2) [−1–10]60/18054.7445B
🟌 C{001} <110>0/1809045B
* is the commonly used way of notation of the respective texture components.
Publisher’s Note: MDPI stays neutral with regard to jurisdictional claims in published maps and institutional affiliations.

