
Synthesis of Functional Surface Layers on Stainless Steels by Laser Alloying
by
 , and
, and
Zoia Duriagina
1,2,*, 
Volodymyr Kulyk
1,*,
Taras Kovbasiuk
1,
Bogdan Vasyliv
3 and
Andrii Kostryzhev
4 1
Department of Materials Science and Engineering, Lviv Polytechnic National University, 12 Bandera Street, 79013 Lviv, Ukraine
2
The John Paul II Catholic University of Lublin, Al. Racławickie 14, 20-950 Lublin, Poland
3
Karpenko Physico-Mechanical Institute of the National Academy of Sciences of Ukraine, 5 Naukova Street, 79060 Lviv, Ukraine
4
School of Mechanical, Materials, Mechatronic and Biomedical Engineering, University of Wollongong, Wollongong, Northfields Avenue, NSW 2522, Australia
*
Authors to whom correspondence should be addressed.
Metals 2021, 11(3), 434; https://0-doi-org.brum.beds.ac.uk/10.3390/met11030434
Submission received: 3 February 2021
/
Revised: 24 February 2021
/
Accepted: 2 March 2021
/
Published: 6 March 2021
(This article belongs to the Special Issue Strengthening Mechanisms in Metallic Materials)
Abstract
:Laser alloying is an effective method to form functional surface layers (coatings) on metallic materials, particularly on stainless steels. Unique phase balance, dislocation substructure, and a possibility to obtain gradient microstructures after laser alloying slow down the surface degradation and increase the wear resistance. In this work, the optimal parameters of laser alloying and their effects on microstructure and properties were investigated for two stainless steels: ferritic AISI 420 and austenitic AISI 304. Three types of alloying plasters were used: 85Nb + 15 graphite, 85Nb + 15 liquid glass, and 15Fe + 30Ni + 20B + 10Si + 25 liquid glass (wt.%). The laser power density of 0.3 × 10⁵ W/cm2 and beam scanning speed of 1990 mm/min were found to generate 220–320 μm thick coatings with complex microstructures. Phase balance in the coatings was studied with X-ray diffraction and magnetometric phase analyses. High microhardness (up to 16 GPa) and wear resistance were associated with the formation of martensite with some retained austenite and Nb-, Cr-, Si-, and B-rich particles in the surface layer of AISI 420 steel, and high dislocation density austenite strengthened with Ti-, Nb-, Cr-, and Si-rich particles in AISI 304 steel.
1. Introduction
Structural materials applied in power generation and metallurgical industries to transport different high-temperature substances (salt solutions, superheated steam, molten metals) have shown various degradation mechanisms. In particular, the surfaces of stainless steels and vanadium alloys, operating in contact with melts of fusible metals, degrade via selective dissolution of individual elements or the whole structural components. As the temperature of the liquid metal environment and the operating time increase, the intensity of mass transfer processes on the component surface increases. Similar structure and properties degradation phenomena are observed in corrosive and high-temperature environments of thermal power plants. The only difference is that the degradation of the component surface to a certain depth is caused by the adsorption and diffusion of atoms (ions) from the operating environment (water or superheated steam) into the surface of the structural component. Therefore, the controlled formation of a certain microstructural state and phase balance in the surface layers will significantly improve the bulk properties and increase the operating life of machine parts and structural elements of power equipment [1]. This in turn will ensure their reliability and safety during operation [2,3].
The problems associated with the development and spread of surface defects in the structural components and machine parts can be solved by creating a barrier layer on the part surfaces. This is achieved by changing the type and level of stresses in the surface, via initiating the phenomena of surface segregation and reaction-diffusion. As a result, a microstructure of the composite type is formed, where secondary phases add to the solid solution strengthening and reinforce the matrix. Such a conceptual approach and its implementation using surface engineering methods are proposed in a number of works [4,5,6,7,8].
The microstructure formed by surface engineering methods is thermodynamically unstable in almost all cases [9]. Therefore, it is important to study the microstructure development mechanisms on the outer and inner interfaces of the protective coatings. The process of microstructure transformation as a result of phase transformations is accompanied by a decrease in free energy, surface segregation, reaction-diffusion, etc. The total entropy of the system increases, reducing the free energy of the interfaces. This energy state slows down the kinetics of destructive processes on the surface, which are responsible for the corrosion-electrochemical and micro-mechanical properties of materials. These factors increase the duration of the existence of metastable structures [10]. It is known that an open system passes through an intermediate metastable state with increased energy before reaching a more stable state with less energy. In this case, the presence of a structural barrier (coating) prolongs the duration of the transient or metastable state [11]. It should be noted that the synthesis of barrier layers or coatings does not lead to complete stabilization of the structural and energy states. It is important to take into account the displacement of the contact boundary of the material surface with the operating environment as a result of the mutual mass transfer, reaction-diffusion, mechanical damage to the layer, etc.
One of the modern methods of obtaining such layers is surface laser alloying, for example, using plasters based on niobium (Nb) or zirconium (Zr) powders with a higher affinity to interstitial impurities (O, N, C), compared to the matrix elements (Cr, Ni, V, Ti). The formation of a surface layer is carried out either as a result of segregation or reaction-diffusion [5,12,13,14,15,16,17,18]. The stability of the properties of the surface layers will depend on their microstructure, phase balance, and the level of dislocation density [19,20]. This will change the features of the crystal lattice dynamics in the surface layers and the process of defects evolution when the system exchanges energy and matter with the environment [21,22,23,24,25]. The formed metastable phases change the structural and energy states of the surface, which allows for controlling the functional properties of materials [26,27,28]. For example, for thermal power equipment, it is necessary to increase the volume fraction of carbides and intermetallics (NbC, Nb2C, VC, TiC, Ni3Ti, Fe2Nb) in the synthesized surface layers [29,30]. In contrast to this, protective layers containing nitride or oxynitride phases (TiN, TiON, VN, Fe4N) are better for nuclear and thermonuclear power plants, where the equipment operates in melts of fusible metals (Pb, Li, Na) or their eutectics (Li17Pb83) [2,3]. The coefficient of thermal expansion will decrease gradually from the base material toward the surface, which will provide high adhesion. In this case, the level of compressive residual stresses will increase towards the surface. In this way, it was possible to increase the corrosion and wear resistance of vanadium alloys of the V-Cr-Ti system and stainless steels [31,32,33,34], used for manufacturing of thermal and nuclear power plant components (turbine blades, throttle washers, shut-off valves, energy steam generators, feed pump jackets, valve surface seals) and various machine parts in airspace, radio electronics and precision manufacturing industries (small parts that undergo friction and wear in aggressive environments).
In this paper, two stainless steels, AISI (American Iron and Steel Institute) 420 with predominantly martensitic microstructure and AISI 304 with austenitic microstructure, were subjected to laser alloying with three plasters containing various concentrations of C, Nb, Fe, Ni, Si, and B. Optimization of the laser treatment parameters allowed to achieve a remarkable increase in wear resistance of the surface layers. The strengthening mechanisms are discussed on the basis of detailed microstructural characterization and analysis of the microstructure-properties relationships.
2. Materials and Experimental Techniques
Two steels were used in this study: AISI 420 containing 0.15C-13Cr-1Mn-1Si (wt.%) and AISI 304 containing 0.08C-18Cr-8Ni-2Mn-0.75Si-0.50Ti (wt.%). They were microalloyed with three types of plasters in a nitrogen atmosphere using a CO2-laser of continuous action manufactured by TRUMF (Ditzingen, Germany). The following parameters were applied: 6.5 kW of power, 10.6 μm of radiation wavelength, a system of segment mirrors converted a spherical beam into a flat one with 20 mm spot length and 2 mm spot width, 1997 mm/min of the beam scanning speed along the surface. This set of parameters provided uniform heating and minimal surface roughness.
Plasters were prepared on the basis of graphite and liquid glass. Graphite powder was diluted with a 3% solution of silicate glue in acetone to the consistency of a suspension. The reflection coefficient of this mixture was 22.7%, which provided the maximum density of laser radiation. Therefore, the plaster on this basis was used to determine the optimal modes of laser alloying. Plasters based on liquid glass (reflection coefficient 2.7%) with additions of 85Nb or 15Fe + 30Ni + 20B + 10Si (wt.%) powders were also prepared for laser alloying.
The plaster compositions were selected based on the analysis of the corresponding phase diagrams taking into account the chemical affinity between the elements in the base steel composition and the plaster components. The plasters were brought to the desired consistency. Then, a 15–20 μm thick plaster layer was applied to the surface of each sample [29].
The metallographic analysis was performed using a Neophot 21 (Zeiss, Oberkochen, Germany) optical microscope (with a unit for measuring microhardness), ZEISS EVO 40XV (Zeiss, Oberkochen, Germany) scanning electron microscope (SEM), and JEOL JSM-6490LV SEM (JEOL Ltd, Tokyo, Japan) equipped with an OXFORD INCA Energy 350 (Oxford Instruments, Abingdon, UK) energy dispersive X-ray spectrometer (EDS). Imaging was carried out with a 3 nm resolution at an accelerating voltage of 30 kV. Phase analysis was performed using an X-ray diffraction technique (XRD) on a diffractometer DRON3M (Bourevestnik, St Petersburg, Russia) with Co–Kα irradiation: a wavelength of 1.79 Å, a voltage of 35 kV, and an anode current of 20 mA were applied. The accelerating voltage of the microanalyzer was 65 eV according to the Kα carbon line, 70 eV according to the Kα fluorine line, and 133 eV according to the Kα manganese line.
Microhardness was measured on the unit for measuring microhardness with the Vickers pyramid (an angle at the apex of 136°) pressed into the surface under the action of a load (0.98 N) applied over a period of time (10 s).
Magnetometric phase analysis allowed for the study of the properties of ferrimagnets, which they acquire under the influence of strong magnetic fields, i.e., in the state of technical saturation. The magnetic characteristics, namely the saturation magnetization Js and the Curie point Θc, which are structurally insensitive, were obtained from the curve of the temperature dependence of the saturation magnetization. They provided information about the alloy phase composition and its variations during heating and cooling and during deformation. The Curie point and the saturation magnetization are called primary magnetic properties because their values are determined by the nature of the ferromagnetic phase of the alloy (its crystal lattice, electronic structure of atoms, the chemical composition of the phase). A dependence of these characteristics on the stresses, shape, and size of the ferromagnetic particles in an alloy is weak. Thus, in a study of a particular alloy, the changes in magnetization and Curie points of its individual phases are not related to the growth of these particles (from 10−6 cm in size) but caused only by changes in chemical composition and types of the crystal structure of these phases. Based on the data obtained using magnetometric phase analysis, it is possible to study the kinetics of the individual phase formation in the early stages (when their size is below 10−6 cm) according to the dynamics of magnetization growth and the Curie point [33]. Thus, a weak dependence of the saturation magnetization and the Curie point on the stress state, shape, and dispersity of the ferrimagnet particles allows assessing the phase formation. The determination of phases with XRD was carried out via crystal lattice analysis, whereas the magnetometric phase analysis involved the use of magnetic properties of the phases (Js and Θc). This facilitated the study of systems in which the dispersity, shape, and stress level of the microstructure constituents change.
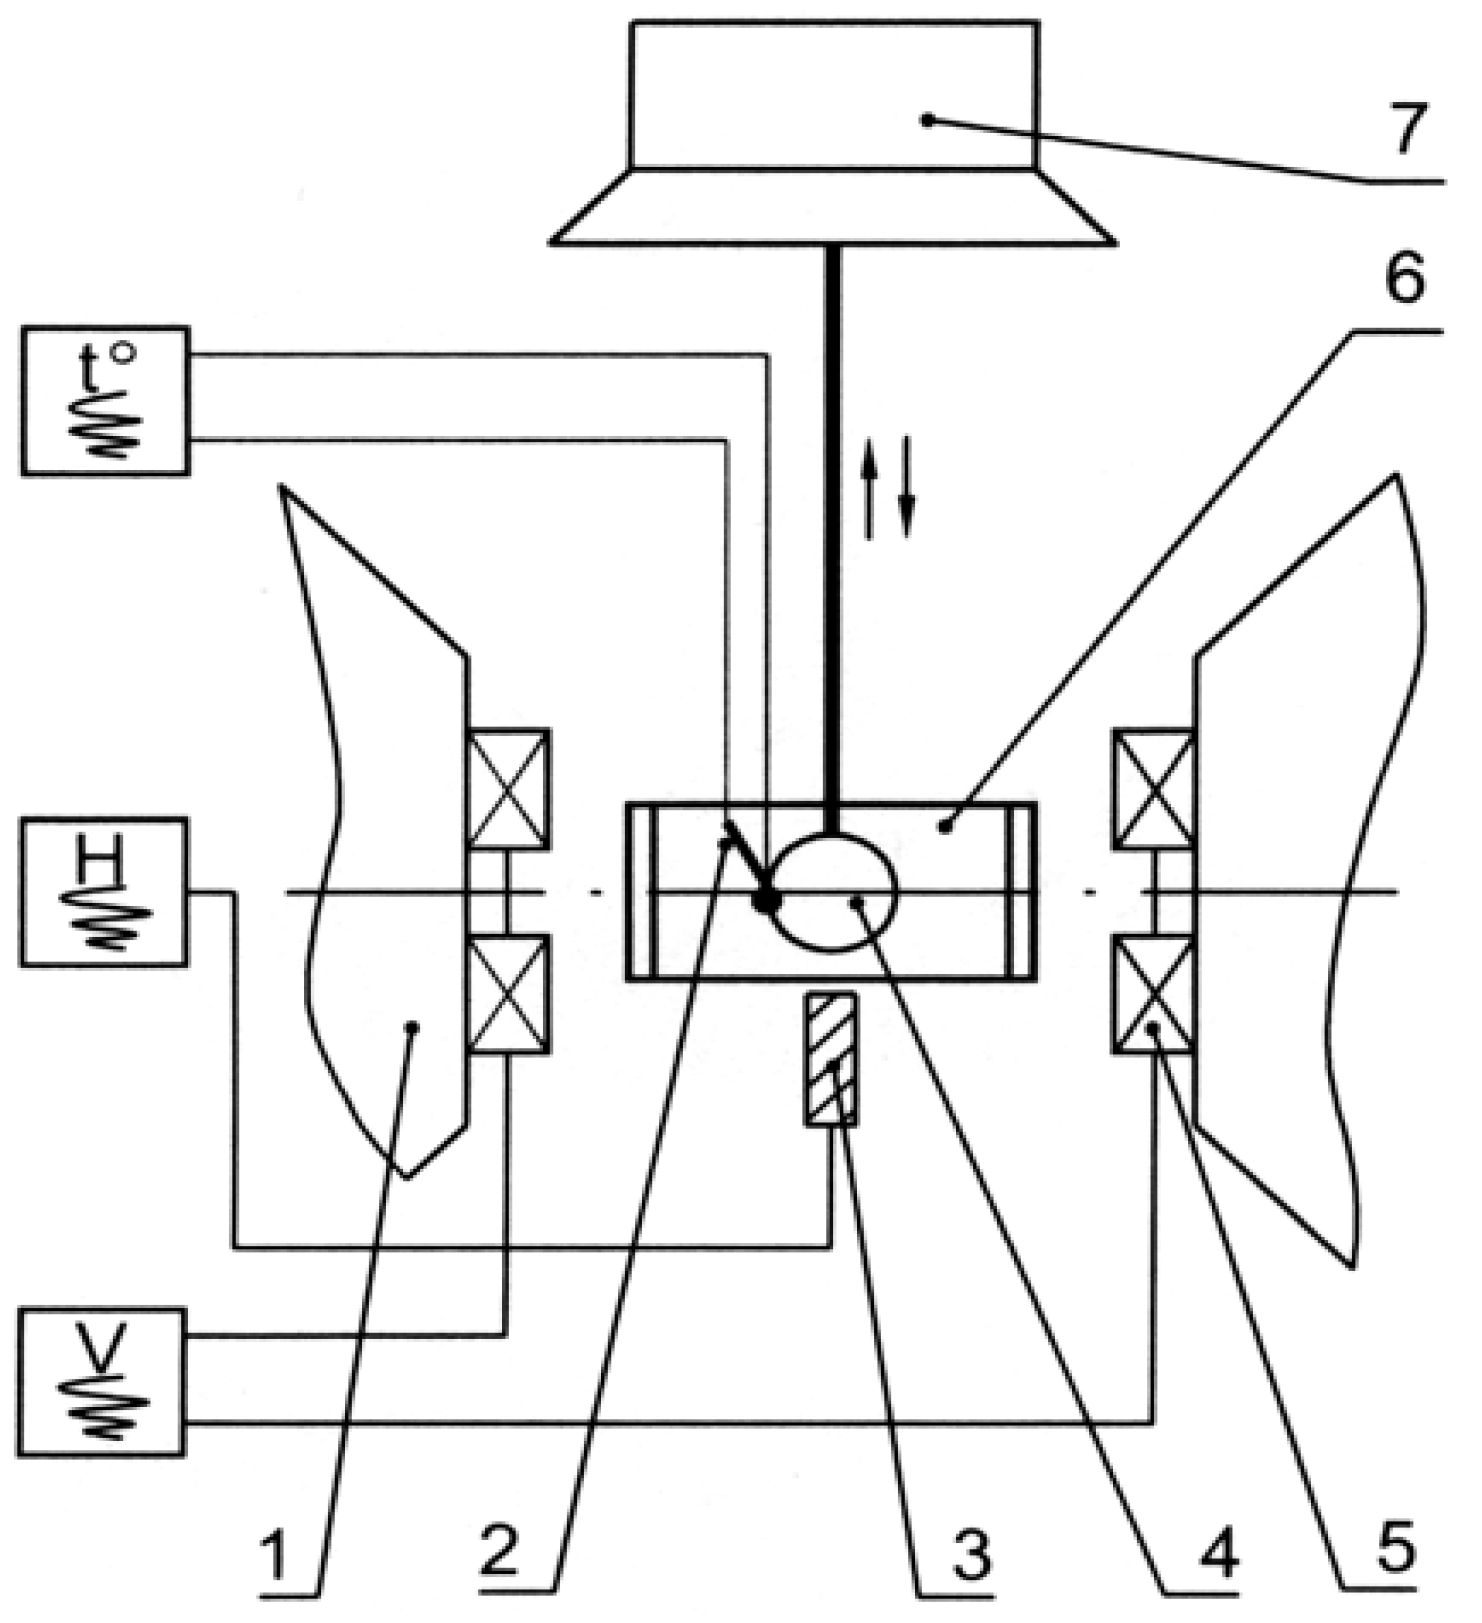
Magnetometric phase analysis was performed in this work using a vibrating magnetometer with a vibrating sample (Lviv, Ukraine), with a power of 3.5 kW and a sensitivity according to a magnetic moment of 5·10−6 A·m2 [31] (Figure 1).
The specific saturation magnetization of the surface layers of the samples after laser alloying, each of about 30 mg in weight, was recorded in the temperature range from 20 to 800 °C for various heating/cooling modes at a heating rate from 10 to 30 °C/min and cooling rate from 10 to 400 °C/min. The magnetic field strength during the measurements was 800 and 1200 kA/m, which allowed for performing a quantitative magnetic phase analysis. Annealed samples of investigated steels were used as a reference for estimating the amount of residual austenite [31].
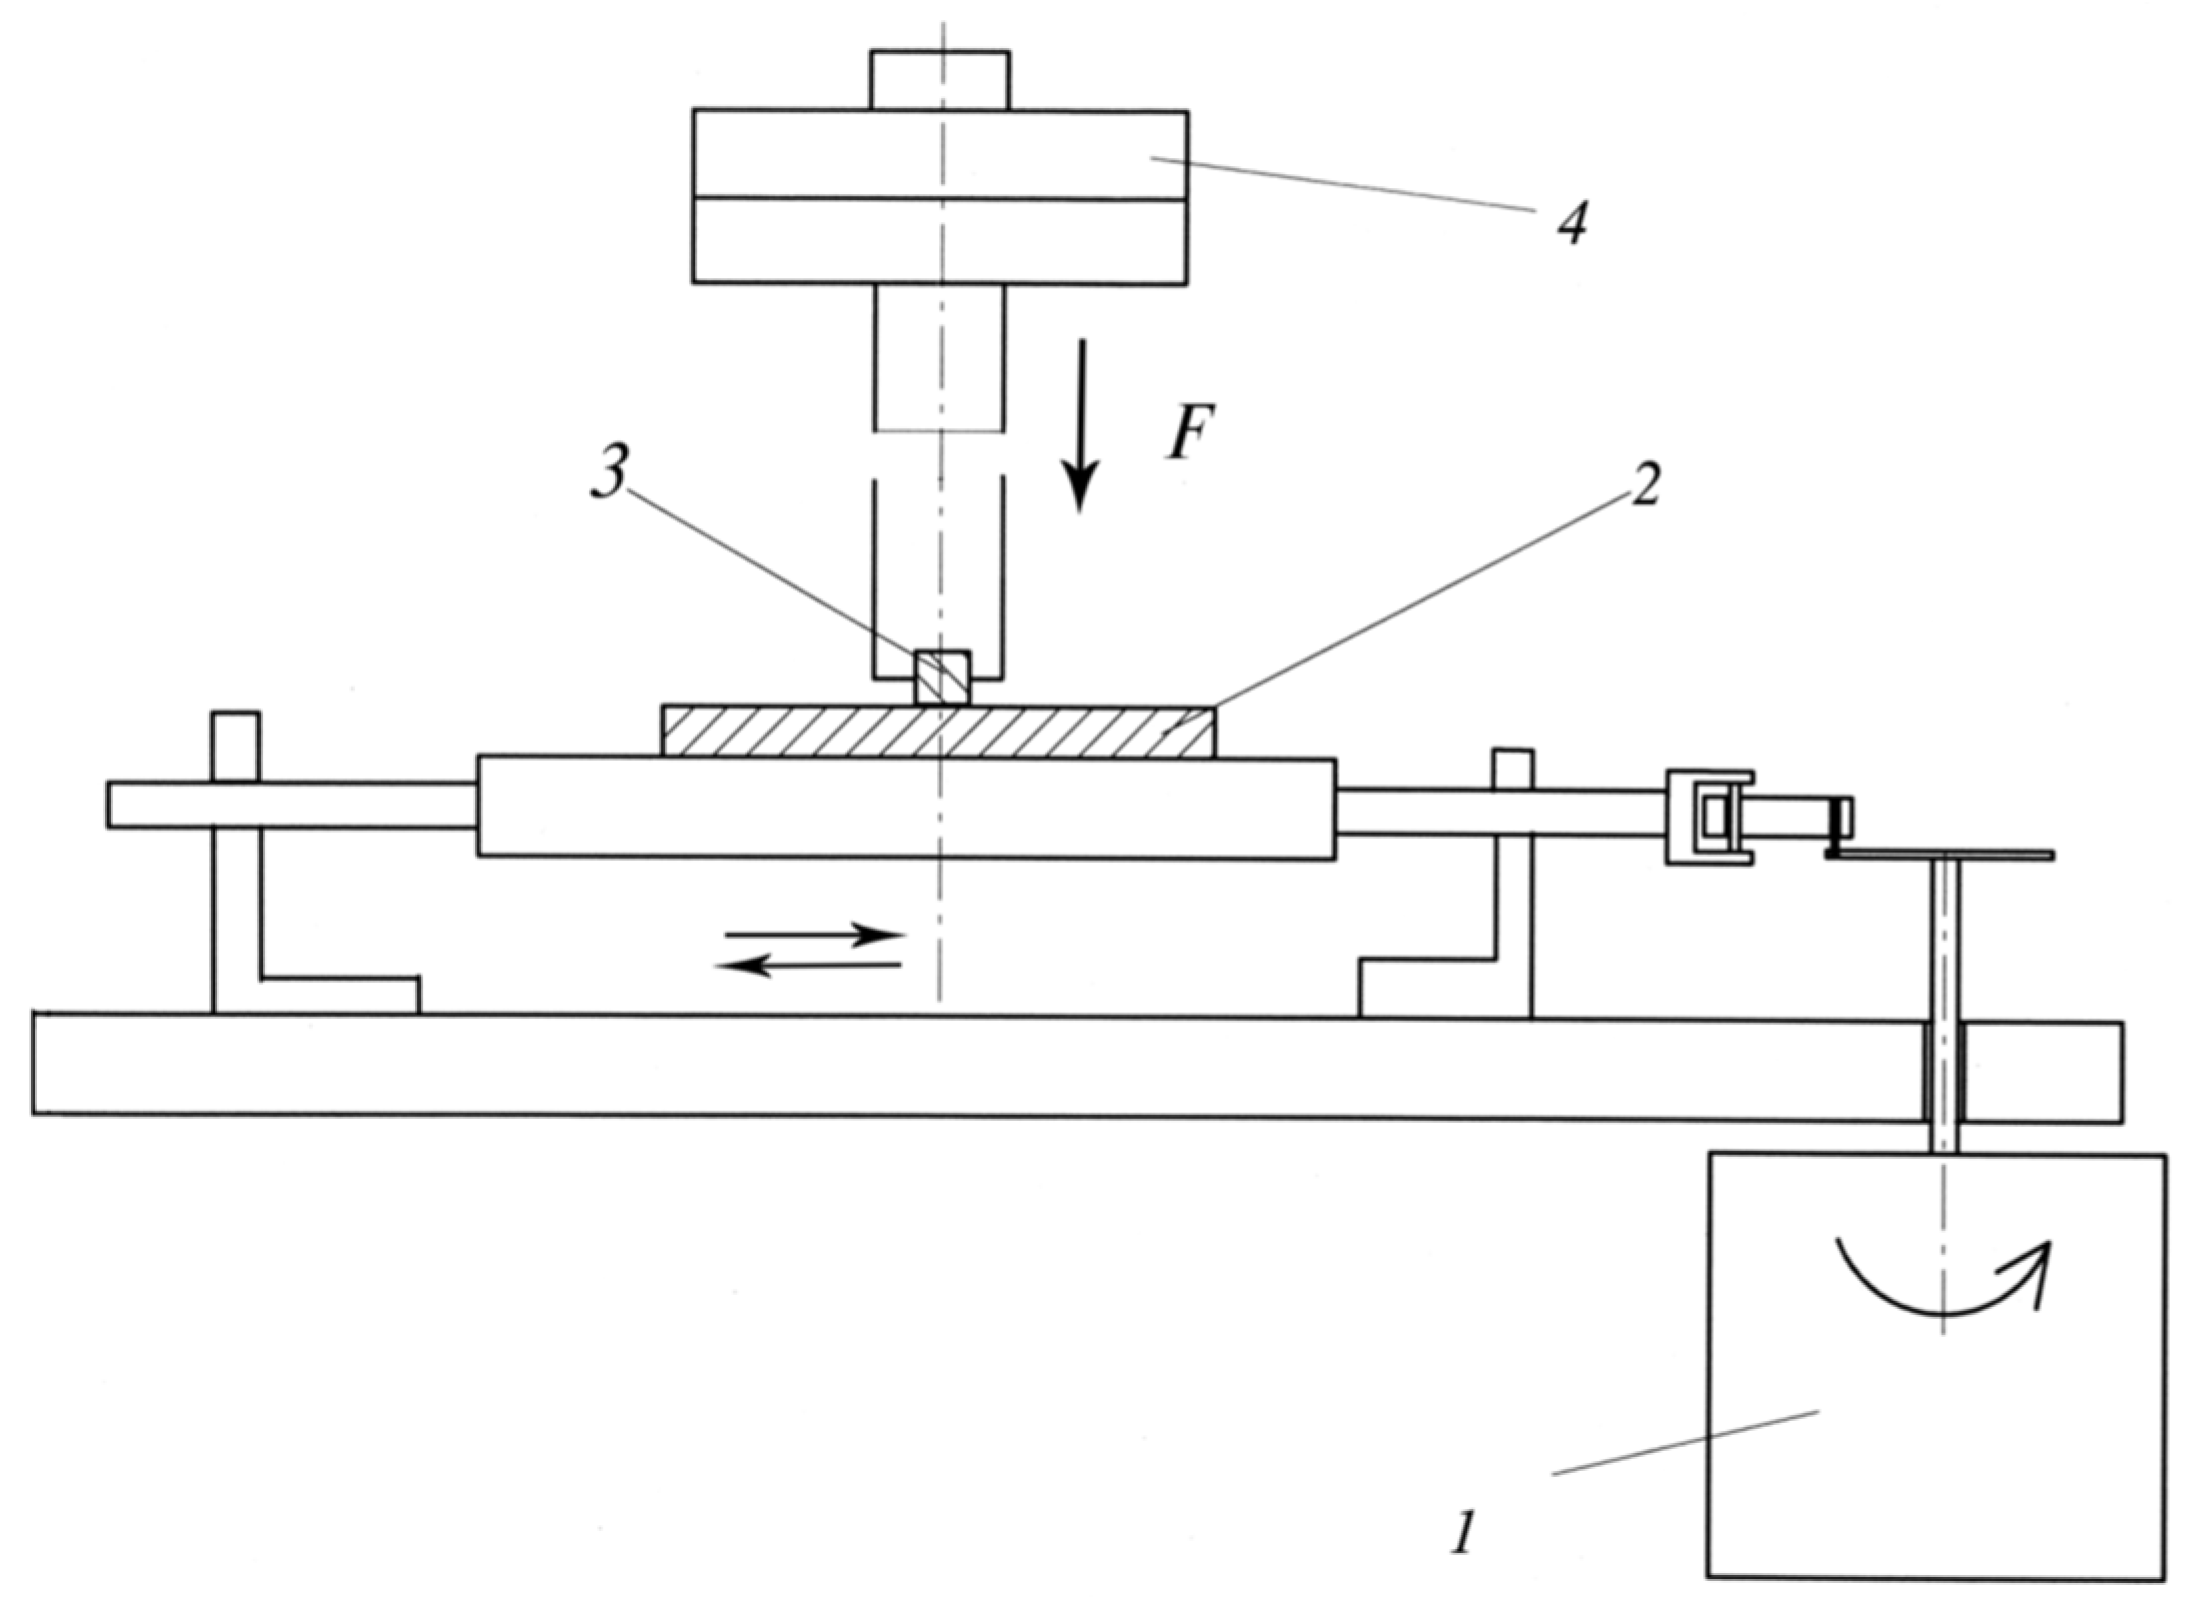
Wear tests were performed on a pin-on-plate wear testing machine under reciprocating motion without lubricants (Figure 2). The contact pressures were 0.29 and 0.42 MPa, and the velocity of motion was 0.1 m/s. A friction couple consisted of a movable sample (plate of test steel) and a fixed pin (counterbody) [35]. The counterbody material was AISI 1045 carbon steel for AISI 420 steel and AISI 304 steel for AISI 304 steel. The counterbody materials were chosen to replicate the actual operating conditions as close as possible.
The roughness and bearing capacity of the surface after laser alloying were determined using a Calibr S-265 (Moscow, Russia) profilograph-profilometer, in which a diamond needle moves over the material surface, and its oscillations are converted into stress by induction. The computer software Roughness Plot Analyzer was used to increase the accuracy of processing of profilograms [36,37].
The basic parameters of surface roughness, calculated from the obtained profilograms, were as follows: arithmetical mean deviation of the assessed profile Ra, average distance based on the ten highest peaks and lowest valleys over the entire sampling length Rz, average radius of microprojection curvature r, maximum height of the profile Rmax, step of peaks along the mean line S, root mean squared Rq, maximum peak height above the mean line within a single sampling length Rp.
The bearing capacity of the material surface was determined to confirm the results obtained after wear tests, laser treatment, grinding, polishing, etc., i.e., after each treatment that changed the microstructural and phase conditions of the surface [38,39,40,41]. To determine the bearing capacity of the material surface, a wide range of microgeometry parameters was used, in particular, amplitude, surface and volume, spatial and hybrid, functional parameters and parameters of the bearing capacity function. The parameters according to which the calculation was carried out were chosen depending on the method of surface treatment and the degree of isotropy of the surface layer [42,43,44,45,46].
In our case, the calculation was based on the surface parameters, such as the size of protrusions and the distance between them. The bearing capacity indicator was determined by our own methodology:
where A(h) is the support surface within the trial surface Sq (quenched) with the axis h (height); M is the number of trial points in one print; Δx is the trial interval in the orthogonal direction.
The value of Sq (trial surface) was calculated using the equation:
The value of M (number of trial points in one print) was taken equal to 128 [47].
3. Results and Discussion
3.1. Prediction of Optimum Laser Parameters
Our mathematical model can be used to predict the optimal parameters of laser alloying using analysis of the temperature field distribution in the molten and heat-affected zones. The latter consists of areas with different microstructures, the boundaries of which coincide with the corresponding isotherms. In particular, in the area heated to a temperature of , a complete quenching occurs, in contrast to the incomplete one at . Besides, in areas where (melting and evaporation temperatures), the surface will melt, and the chemical composition, microstructure, and volume fractions of phases will change during alloying.
Depending on the utilized alloying parameters (continuous laser of the power Ν(τ) = 1, Q = 6.5 kW), the irradiation spot (ryrx = 10 mm2, rj = kj−0.5 is the spot size along j~{x,y} coordinate) moves translationally and parallel to the x-axis along the surface of the plate the initial temperature of which is t0 = 0, and the heat exchange with the environment is absent. At such temperature-spatial parameters of treatment, the quasi-stationary temperature mode of this zone is established no later than 0.85 s after the beginning of irradiation. In this case, the maximum temperature does not exceed 3345 °C, and the maximum depth of the melt is 1.2 mm.
The simulation was performed for stainless steels taking into account their thermophysical properties: thermal conductivity λt = 21.333 W/K⋅m; thermal diffusivity a = 0.5016 × 10⁻⁶ m2/s; melting temperature tm = 1800 °C. It was found that at the beam scanning speed along the sample surface of 1997 mm/min, the depth of the melted surface layers reaches 36–42 μm in AISI 420 steel and 48–52 μm in AISI 304 steel. These values correlate with the microhardness measurements (Figure 3) and this correlation is confirmed by the accuracy of the temperature field calculation. As a result, the temperature at each point is determined by the depth, width, and length of the molten zone of the irradiated surface, which simplifies the analysis of microstructure formation and allows optimizing the alloying process. The simulation showed that for the formation of 220–320 μm deep layers with a complex microstructure, high microhardness and wear resistance, the laser alloying should be carried out at the laser power densities of q = (0.30–0.31) × 105 W/cm2 and beam scanning speed of 1990 mm/min.
3.2. Alloying with 85 Nb + 15% Graphite
Alloying of AISI 420 steel with 85Nb + 15% graphite plaster in a nitrogen atmosphere resulted in a double diffusion layer on the surface with a microhardness of 4–4.3 GPa (curve 2 in Figure 3a). The outer part of the layer is characterized by a fine-grained microstructure of a cellular type. The inner part, 20 μm thick, has the structure of a mechanical mixture of α-phase grains and Cr7C3, Cr23C6, and NbC0.5 particles.
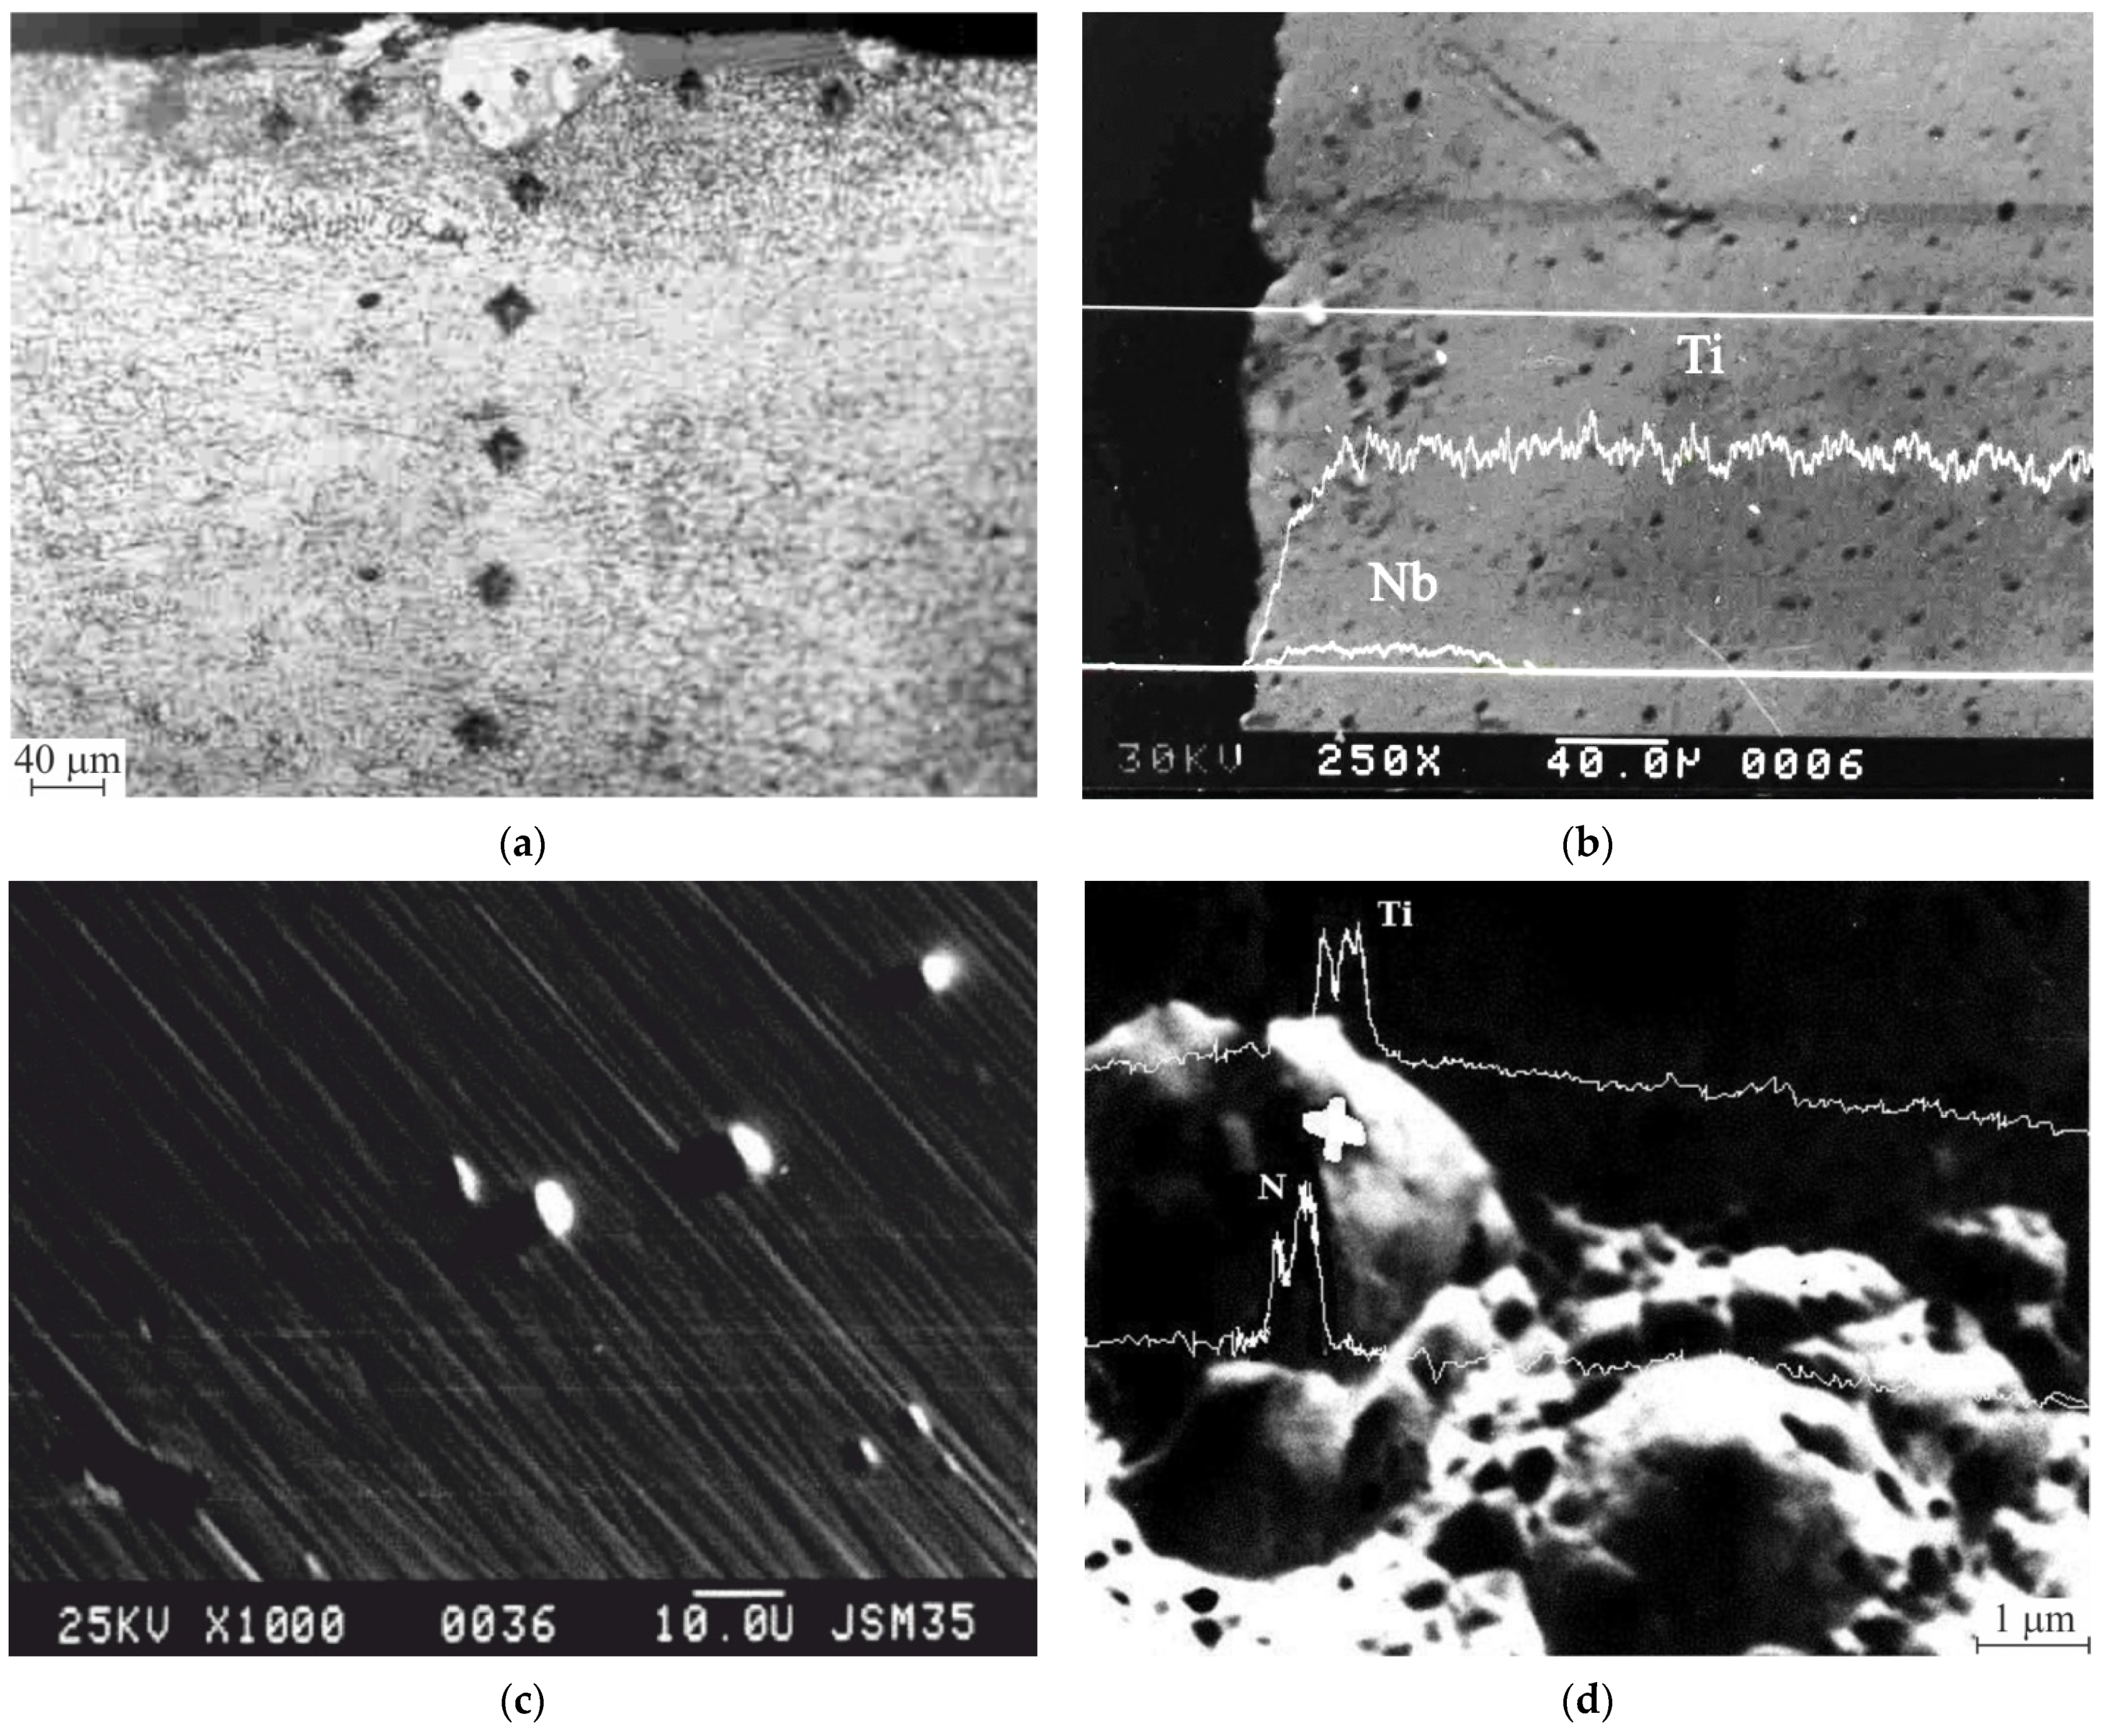
On the surface of AISI 304 steel, alloying with 85Nb + 15% graphite produced a 50 μm thick layer of the highly concentrated γ-solid solution with NbC0.5, TiN, and NbN particles (curve 2 in Figure 3b and Figure 4). Titanium segregated to the surface in the amount of 1.10–1.30 wt.% significantly contributing to the layer formation via diffusion into the base metal and reaction with nitrogen and carbon (Figure 4). Ti is known to exhibit a great affinity to both elements. The microhardness of this layer is over 14 GPa (curve 2 in Figure 3b) [48,49].
3.3. Alloying with 85 Nb + 15% Liquid Glass
On the surface of AISI 420 steel, laser alloying with a plaster of 85Nb + 15% liquid glass produced a 300 μm thick layer of the α-solid solution with particles of secondary phases. The possibility of carbide formation was confirmed by an increase in C concentration (by 1.75 times), and the corresponding decrease in Cr (by 16%) and Fe (by 16.5%) concentrations in the matrix. Moreover, some amount of Nb was spent on the formation of carbides, nitrides, or oxynitrides, due to its high affinity to nitrogen and oxygen. The X-ray diffraction phase analysis clearly identified the NbC carbide and NbN nitride; the amount of the latter dominated. A small amount of the Cr7C3 and Cr2N phases was also detected. Their reflexes, with the exception of lines (111) for Cr2N and (611) for Cr7C3, coincide with the α-Fe or NbN phases (Figure 5). An increase in the surface layer microhardness to 6–7 GPa, followed by an abrupt decrease to the level of the steel substrate microhardness, was due to the formation of such a complex phase balance (compare curves 3 and 1 in Figure 3a).
After laser alloying of AISI 304 steel with a plaster of 85Nb + 15% liquid glass, the surface layer consists of two zones. The outer zone (15–20 μm thick) had a granular cell-type microstructure, and the inner zone (250–300 μm thick) was a mechanical mixture of the γ-solid solution with dispersed inclusions of Cr7C3, TiC, NbC, NbC0.5, Cr4C, SiN4, and TiN. This correlates with the distribution of the elemental composition and was confirmed by durometry data. In particular, Nb was partially consumed for the formation of carbides, and partially for nitrides and carbonitrides because of its greater affinity to nitrogen than to carbon. Besides, the segregation of titanium to the surface under the influence of nitrogen and the presence of interstitial silicon atoms in the surface layer promoted the formation of SiN4 and TiN phases. The microhardness of this layer varied between 7–8 GPa (curve 3 in Figure 3b). This was related to a change in phase balance and dislocation density, chemical inhomogeneity on the surface, and refinement of mosaic blocks. Partial dissolution of carbide phases and chemical inhomogeneity occurred following rapid cooling.
3.4. Alloying with 15Fe + 30Ni + 20B + 10Si + 25% Liquid Glass
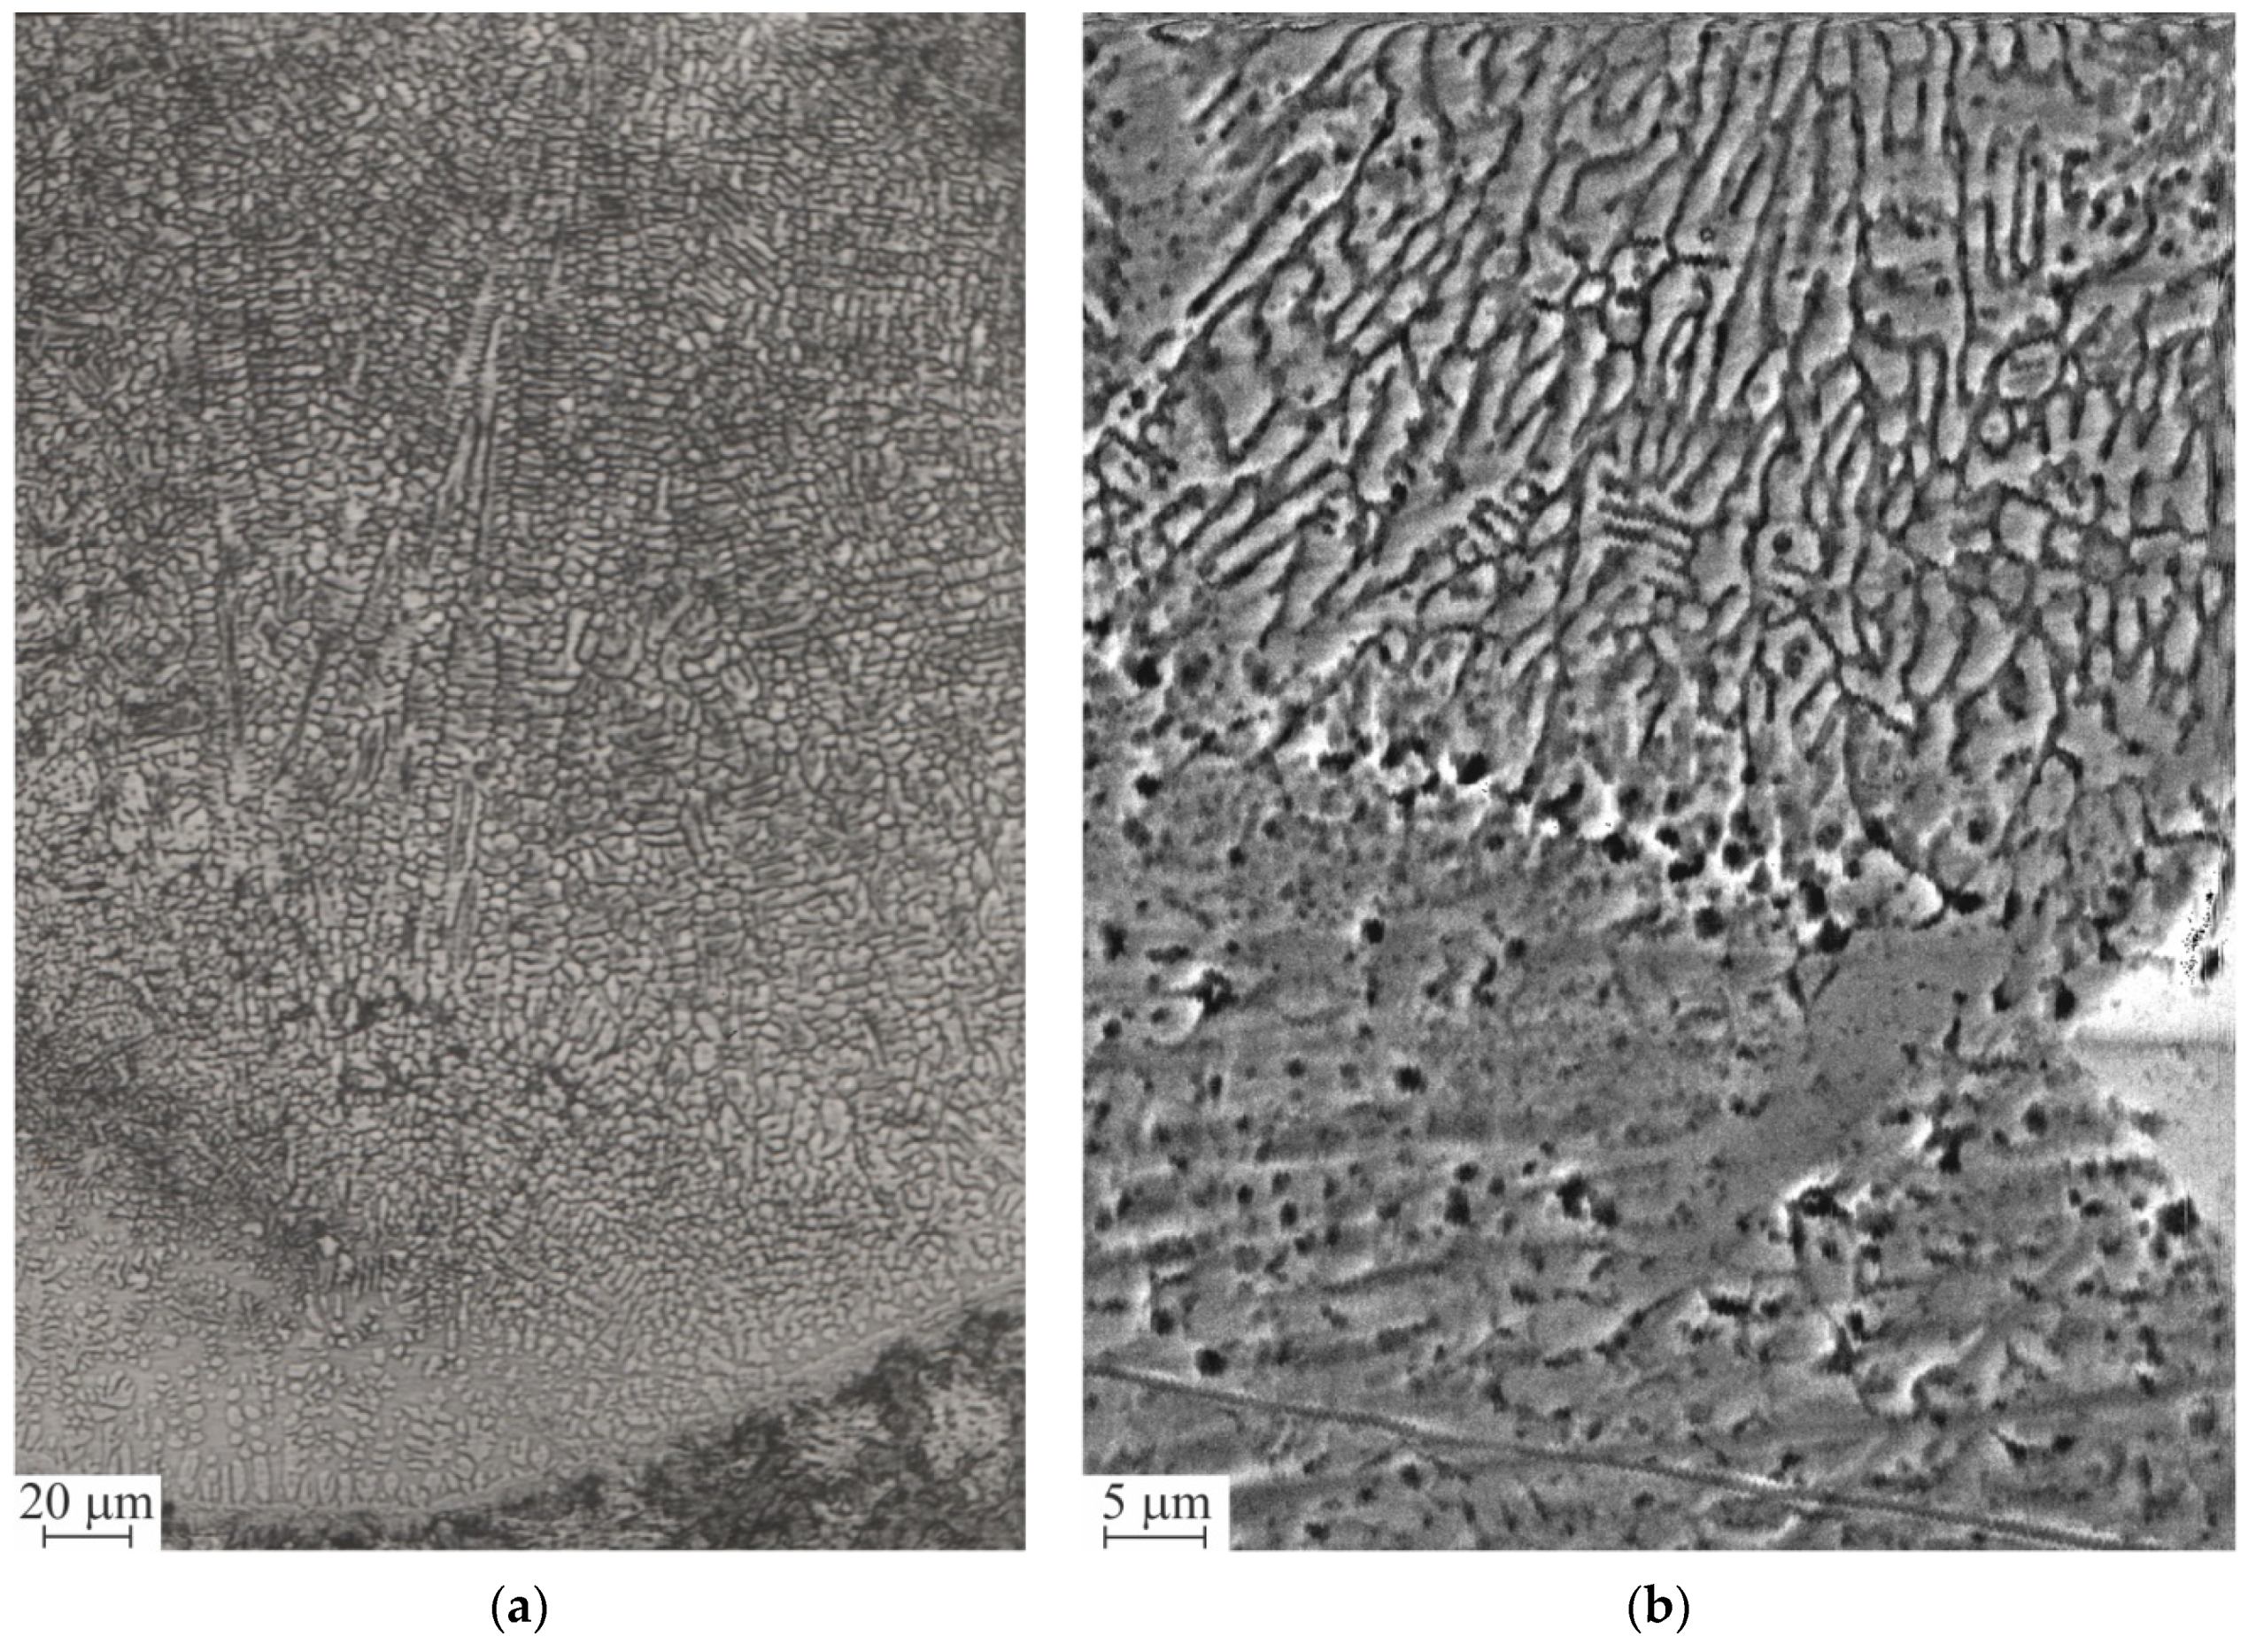
The surface of the AISI 420 steel sample after laser alloying with a plaster of 15Fe + 30Ni + 20B + 10Si + 25% liquid glass was poorly etched. This may indicate the formation of a super-dispersed microstructure or a probability of quasi-amorphization (Figure 6a). The 20–30 μm thick outer zone of the layer had a complex microstructure consisting of colonies of dendritic crystallites, in which the second phases were uniformly distributed (Figure 6a). This corresponds to an increase in the microhardness in this zone to 16 GPa (curve 4 in Figure 3a). As a result of the greater affinity of Si and B (embodied as interstitial elements in the surface layers from an alloying plaster) to N, compared to this of Cr and Fe (present in the steel composition), the steel coating contained SiN4 and BN particles. Moreover, the segregation of carbon to the surface and the simultaneous reduction in Cr concentration in the matrix (by 16 wt.%) indicates the precipitation of Cr7C3 and Cr23C6 carbides. At a depth of <200 μm, the outer layer microstructure consisted of a mechanical mixture of α-phase dendritic colonies and secondary phases, the amount of which decreased with distance from the interface with the outer zone (Figure 6a, bottom part). This is supported by a reduction in the microhardness in this zone from 16 to 8 GPa. The transition diffusion zone had a thickness of about 150–200 μm. Its microhardness was 6.5–7 GPa and gradually decreased to the level of steel base microhardness.
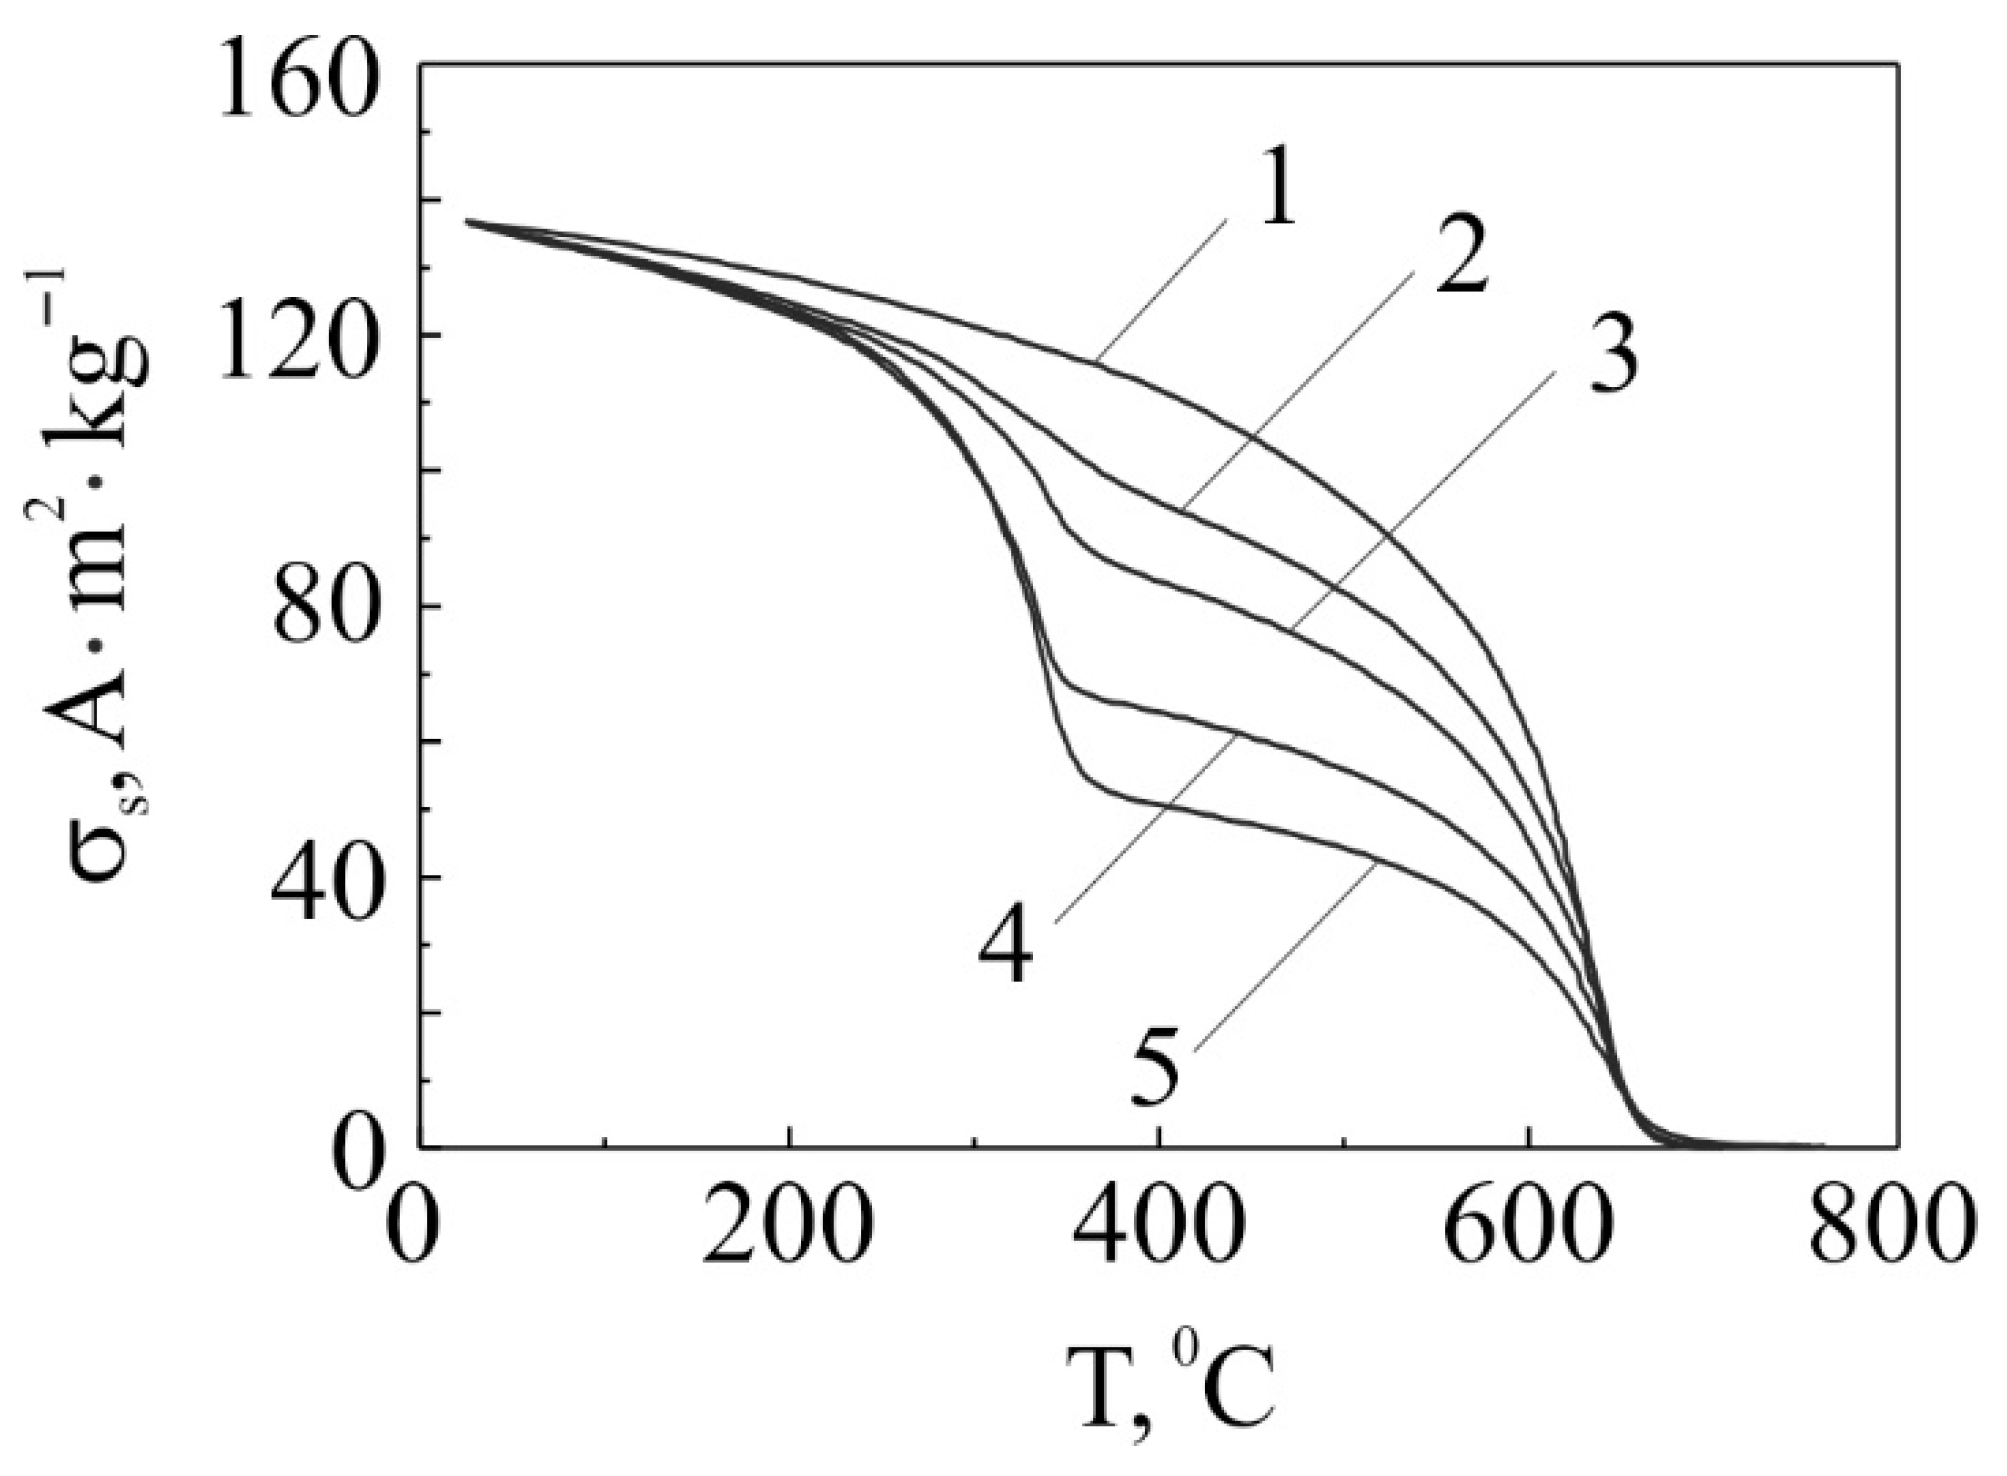
Analysis of phase transformations in the surface layers of AISI 420 steel was performed by the magnetometric method. The temperature dependences of the specific magnetization recorded during cooling at different rates are shown in Figure 7 (curves 2–5). The start temperature of residual austenite decomposition was determined magnetometrically to be 520 °C, and the end temperature to be 630 °C. In layers alloyed with a plaster of 15Fe + 30Ni + 20B + 10Si + 25% liquid glass, the amount of residual austenite was 4%. A more precise determination of its fraction was impossible due to partial amorphization of the microstructure in the formed layers. Therefore, an increase in the specific saturation magnetization was not noticeable on the temperature dependence obtained during heating (Figure 7). Since the γ→α transformation takes place during cooling from a temperature of 750 °C, it is possible to determine the Curie point of the alloyed ferrite. Austenite does not completely decompose into a ferrite-carbide mixture, because a part of austenite is supercooled and transforms to martensite at a temperature of about 350 °C. The specific saturation magnetization at room temperature decreases due to the transformation of residual austenite. When the reheated sample was cooled at a higher rate (curves 3–5 in Figure 7), a slightly larger amount of supercooled austenite transforms to martensite. The accuracy of values of the specific saturation magnetization at room temperature for the samples before heating and after cooling indicates the absence of residual austenite at a given cooling rate.
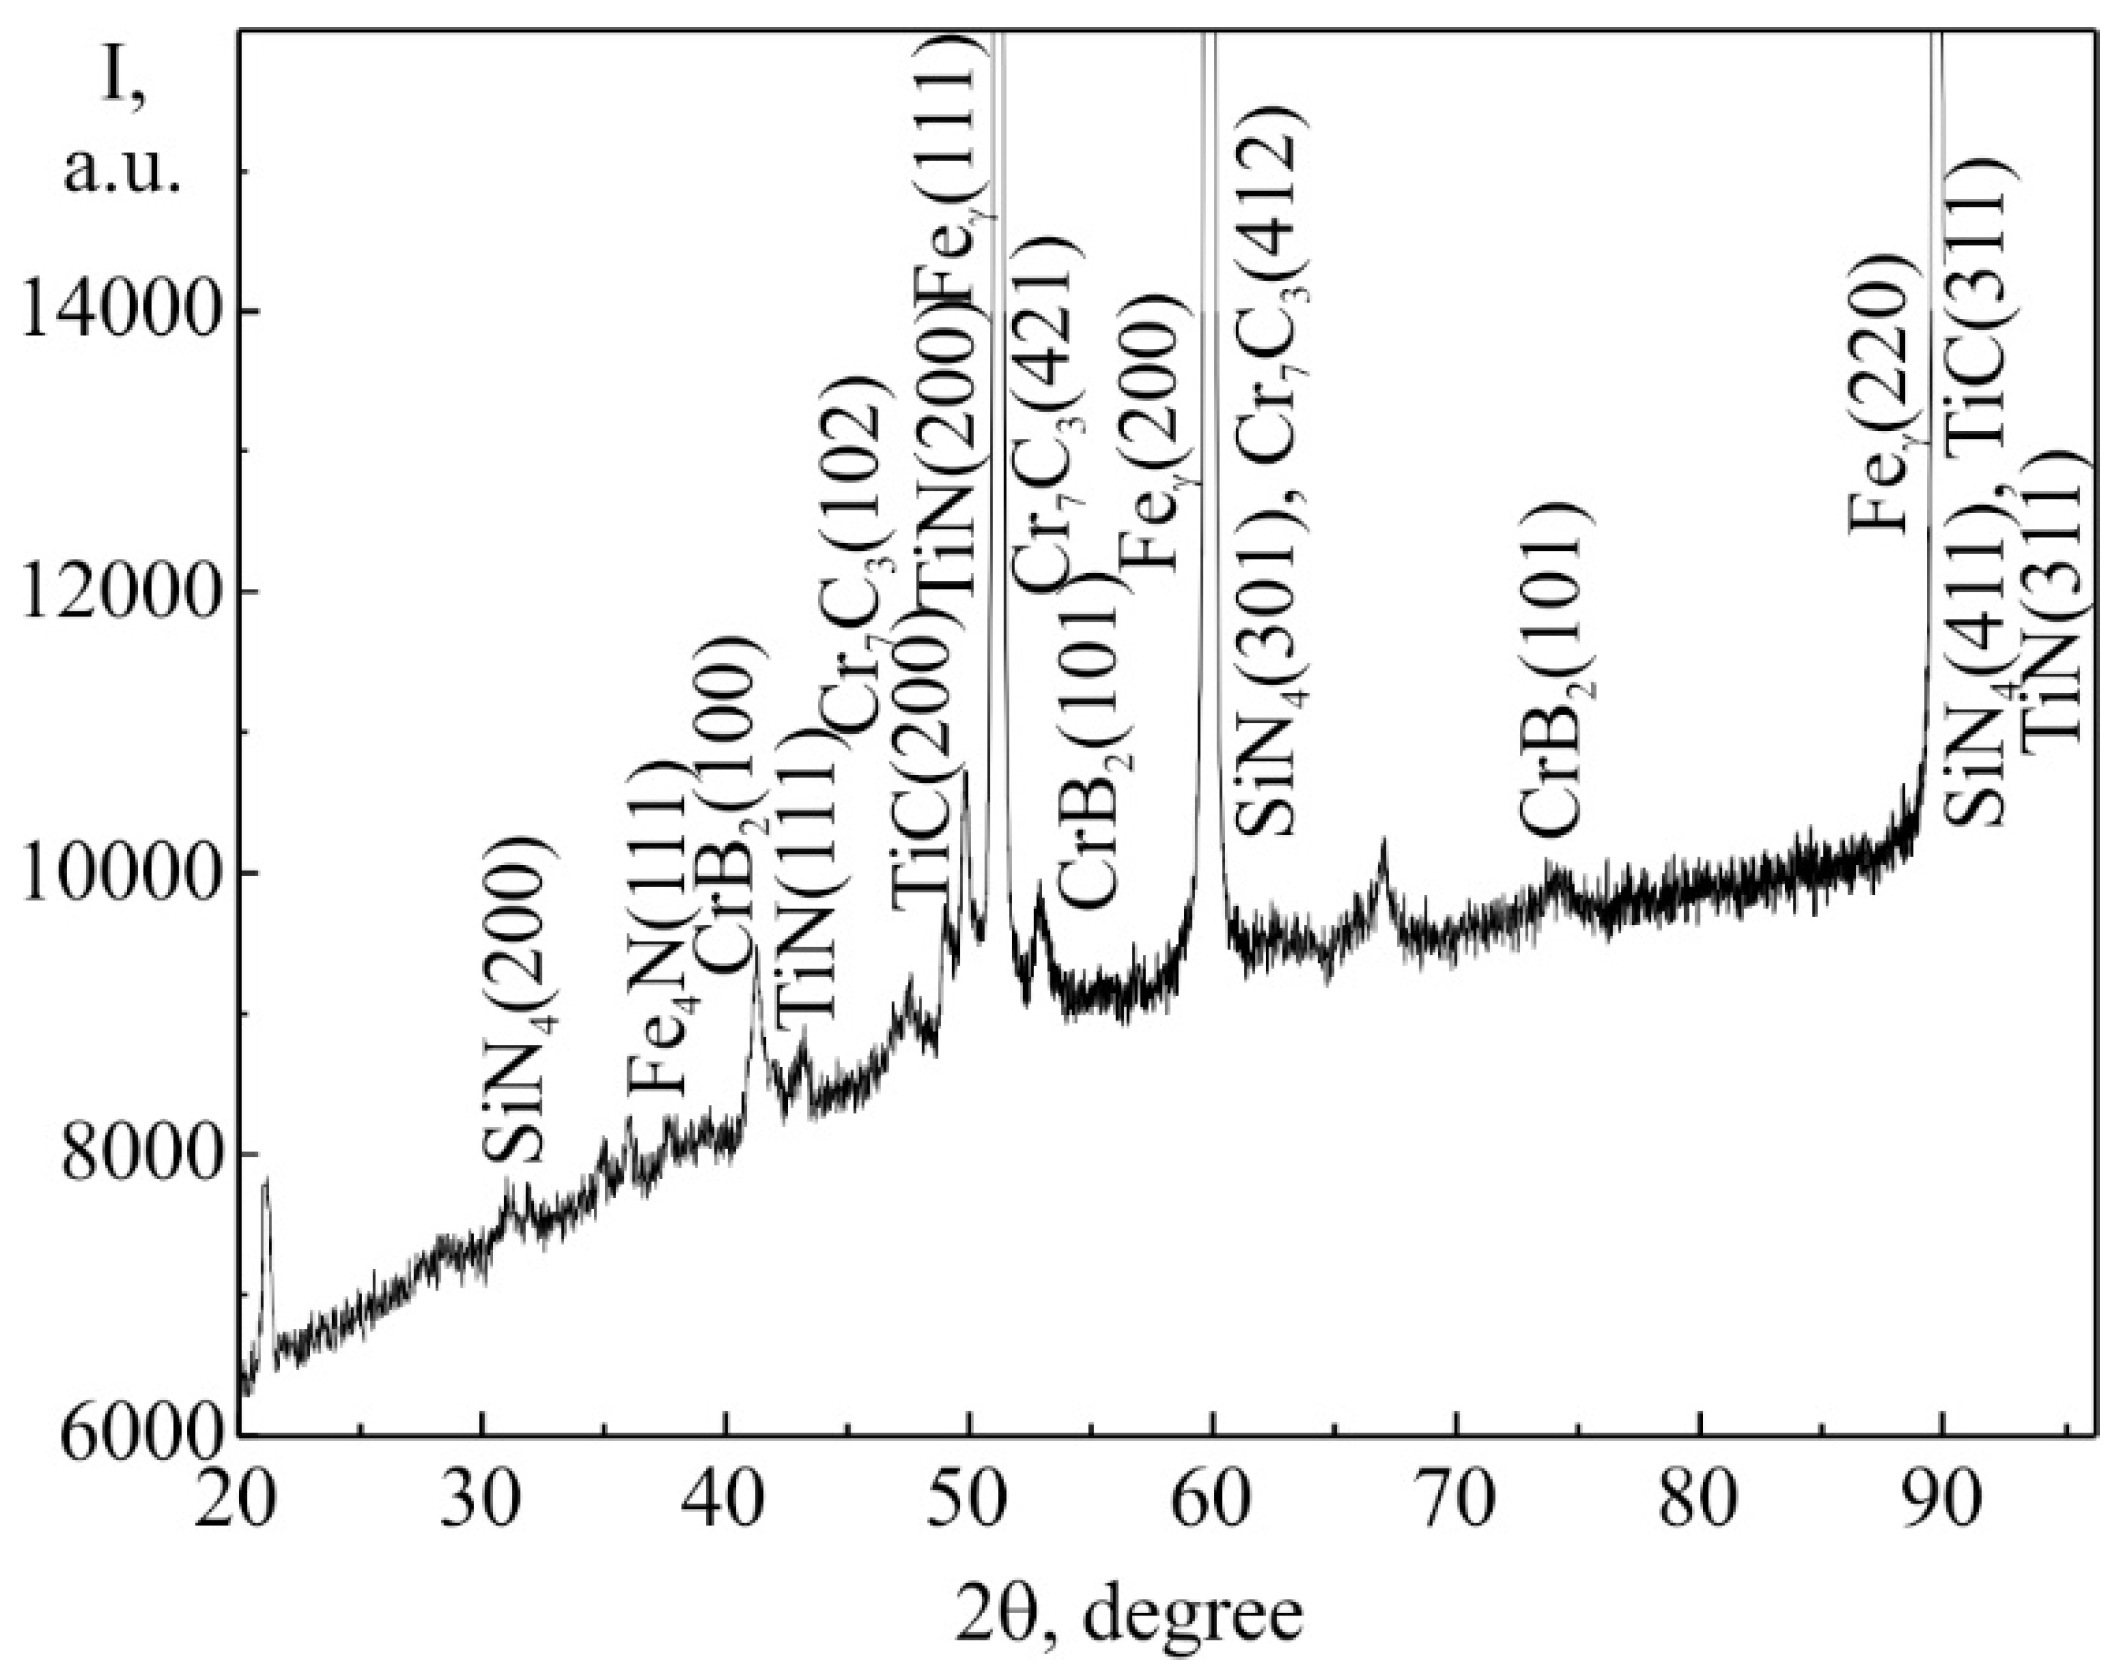
Laser alloying of AISI 304 steel with a plaster of 15Fe + 30Ni + 20B + 10Si + 25% liquid glass allowed the enrichment of its surface in Ti, Cr, and Si to a depth of 130 μm. This layer consisted of two zones. The outer zone (30 μm thick) had a cell-type microstructure with a microhardness of about 3.4 GPa (curve 4 in Figure 3b). The inner zone (to a depth of 100 μm) consisted of a mechanical mixture of dispersed dendritic crystallites (Figure 6b) with inclusions of Cr7C3, TiC, SiN4, and TiN phases. In particular, the formation of nitrides occurred due to the greater affinity of Si and Ti (coming from the plaster) to N than that of Cr and Fe (present in the base steel). These considerations correlate with the results of X-ray phase analysis (Figure 8) summarized as follows:
- CrB2 and TiN phases were clearly identified. Probably, the amount of SiN4, Cr7C3, and TiC phases was small, because their reflexes, with the exception of (200) for SiN4, (200) for TiC, and (102) for Cr7C3, nearly coincided with the reflexes of the γ-Fe phase;
- the regularity of the crystal lattice varied, this was supported by a steep decrease in the intensity I of diffraction maxima;
- the crystal lattice parameter of the γ-solid solution decreased to 0.356–0.358 nm, compared to 0.36–0.40 nm for an ideal austenite;
- the main diffraction maxima shift indicates the formation of compressive stresses in the surface layers after laser alloying. This can be facilitated by nitrogen atoms penetrating into the octahedral interstices of the crystal lattice. They “push” iron atoms, creating significant compressive stresses, the intensity of which decreases from the surface layer towards the steel base, due to compensation by Peierls stress.
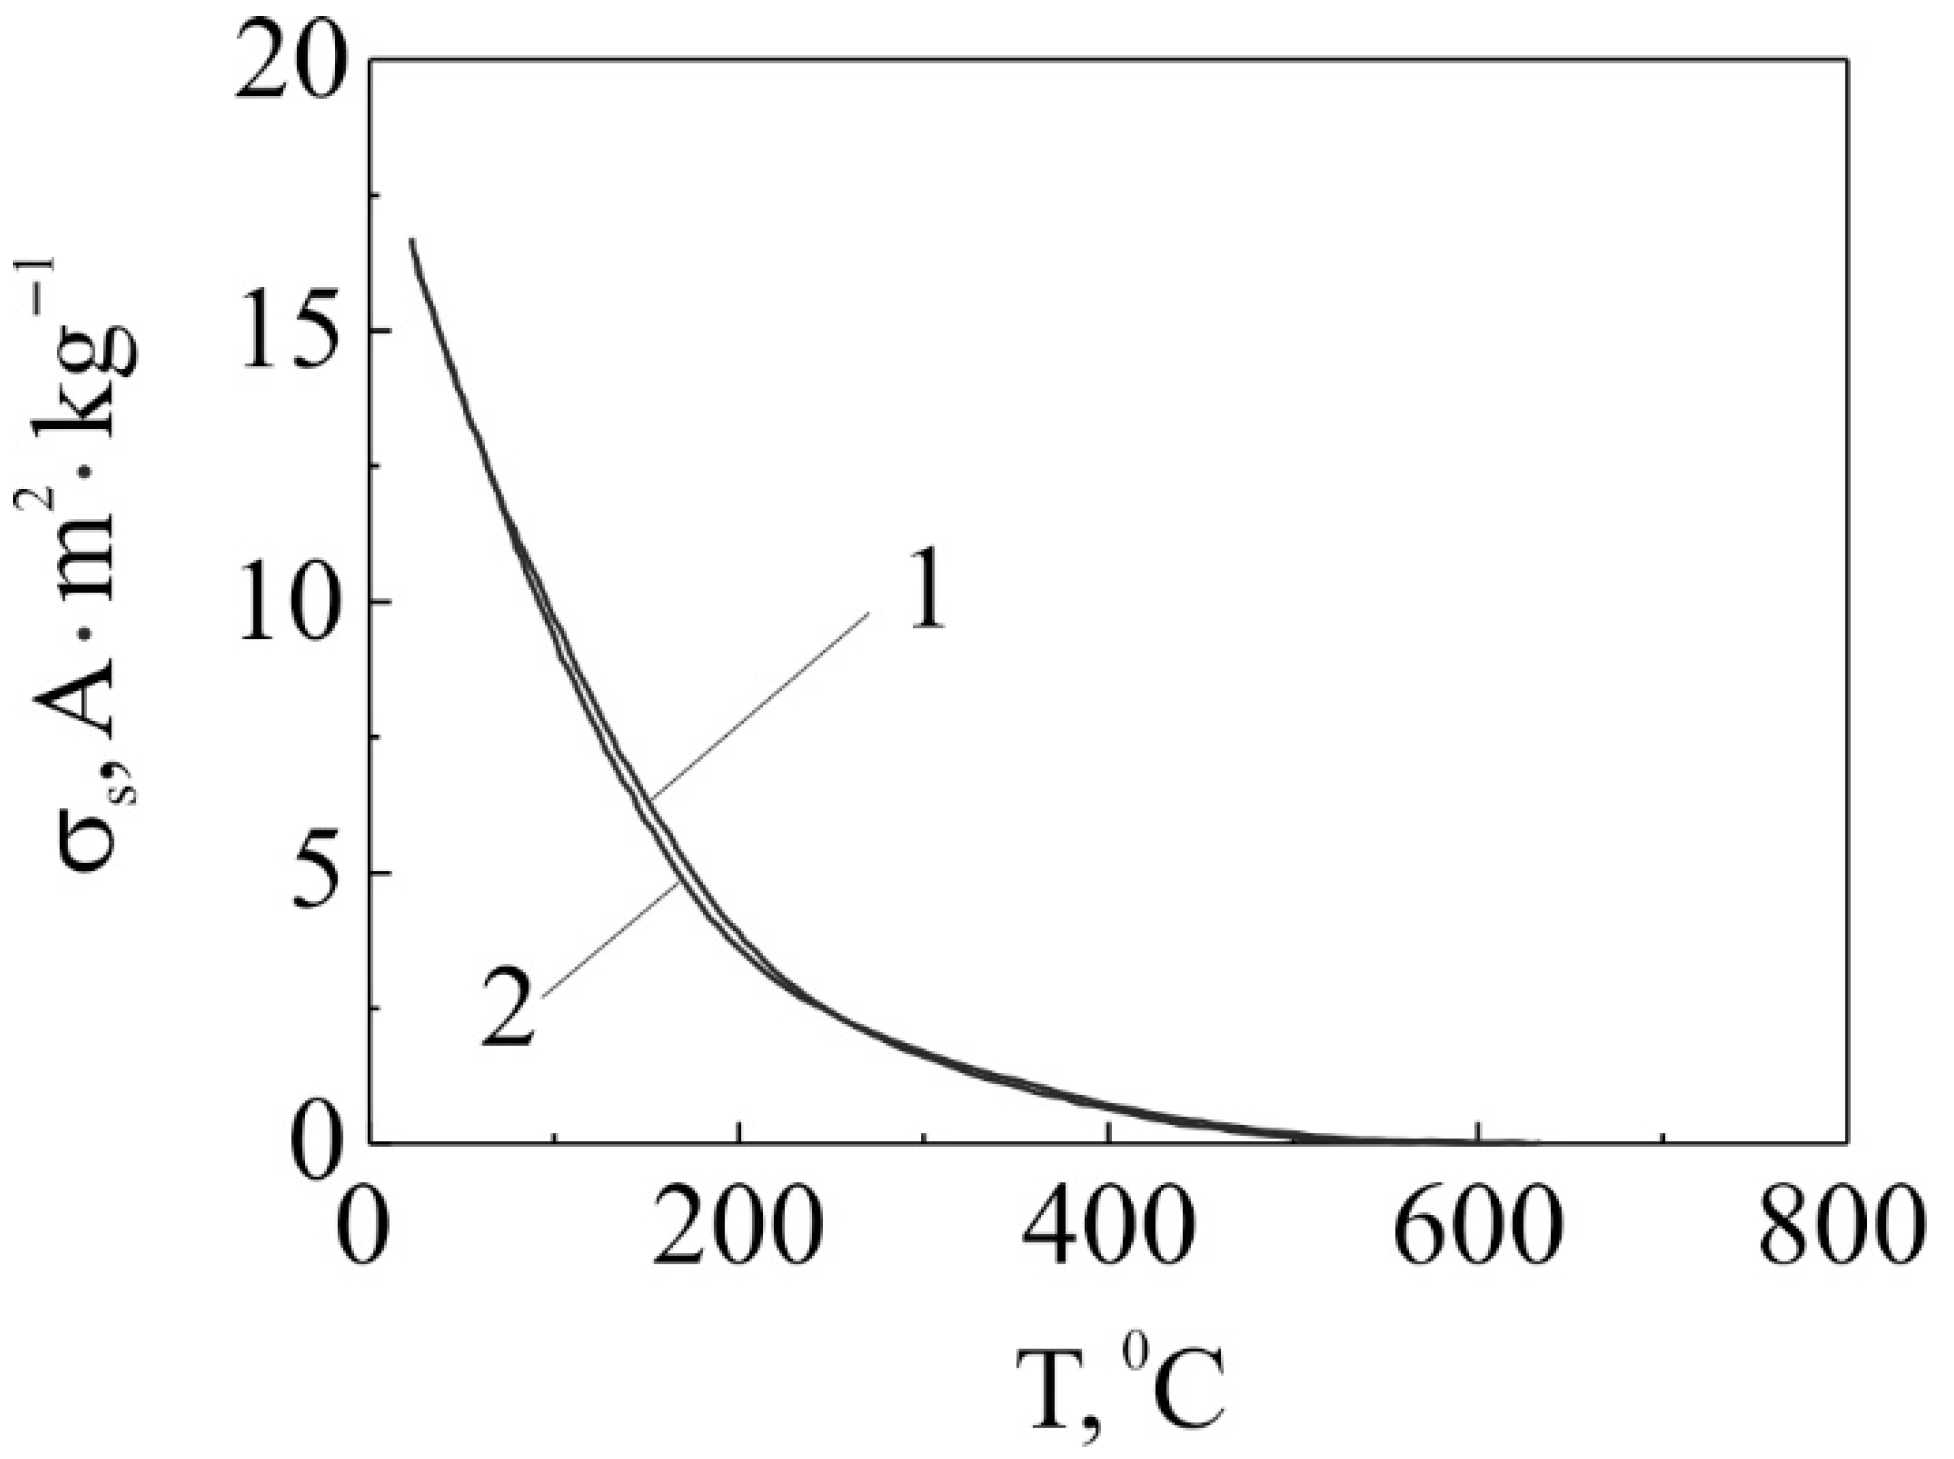
In AISI 304 steel, along with the disordered solid solution of N in γ-Fe, the nitride phase Fe4N, isomorphic to this solution, was formed. It is characterized by the ordered arrangement of nitrogen atoms and vacancies, which also leads to the formation of compressive stresses. This effect is enhanced by the presence of SiN4 and TiN phases. The combination of nitrides with the carbides (Cr7C3 and TiC) increases the overall microhardness and, consequently, the wear resistance of the surface layers. The presence of Fe4N in the surface layers of AISI 304 steel was confirmed by the magnetometric phase analysis. No ferromagnetic phases were detected in the surface layers of the initial samples; however, after laser alloying the ferromagnetic properties manifested with a specific saturation magnetization of the order of 16.7 A∙m2∙kg−1. Analysis of the temperature dependence of the specific saturation magnetization allowed the identification of two ferromagnetic phases in the surface layers (Figure 9): Fe4N and, probably, Fe3(C,N) or Fe3N.
Determination of the temperature dependences of the specific saturation magnetization was carried out in a magnetic field with an intensity of 1200 kA∙m−1. Below the paramagnetic/ferromagnetic transition temperature of about 490 °C, the first Curie temperature associated with phase transformation was 488 °C, which is believed to originate from Fe4N (interstitial γ/phase with a cubic face-centred lattice). This was partially confirmed by X-ray diffraction phase analysis (Figure 8). Works [29,32] indicated that this phase has high values of saturation induction in strong magnetic fields. The second Curie temperature was about 294 °C. Although the origin of this temperature cannot be unambiguously identified, it is assumed to be associated with nitrogen cementite Fe3(C,N) or iron nitride Fe3N of a nonstoichiometric composition.
3.5. Wear Testing of AISI 420 Steel
The protecting effect of the surface layers after laser alloying is determined by an increase in surface hardness and wear resistance, associated with the formation of a complex gradient microstructure [50,51,52,53,54]. For example, 3 h wear tests showed that the laser alloying of AISI 420 steel with a plaster of 85Nb + 15% liquid glass decreased the wear mass loss (increased the wear resistance) by 7.1 times at a contact pressure of 0.29 MPa and by 2.0 times at a contact pressure of 0.42 MPa (Figure 10).
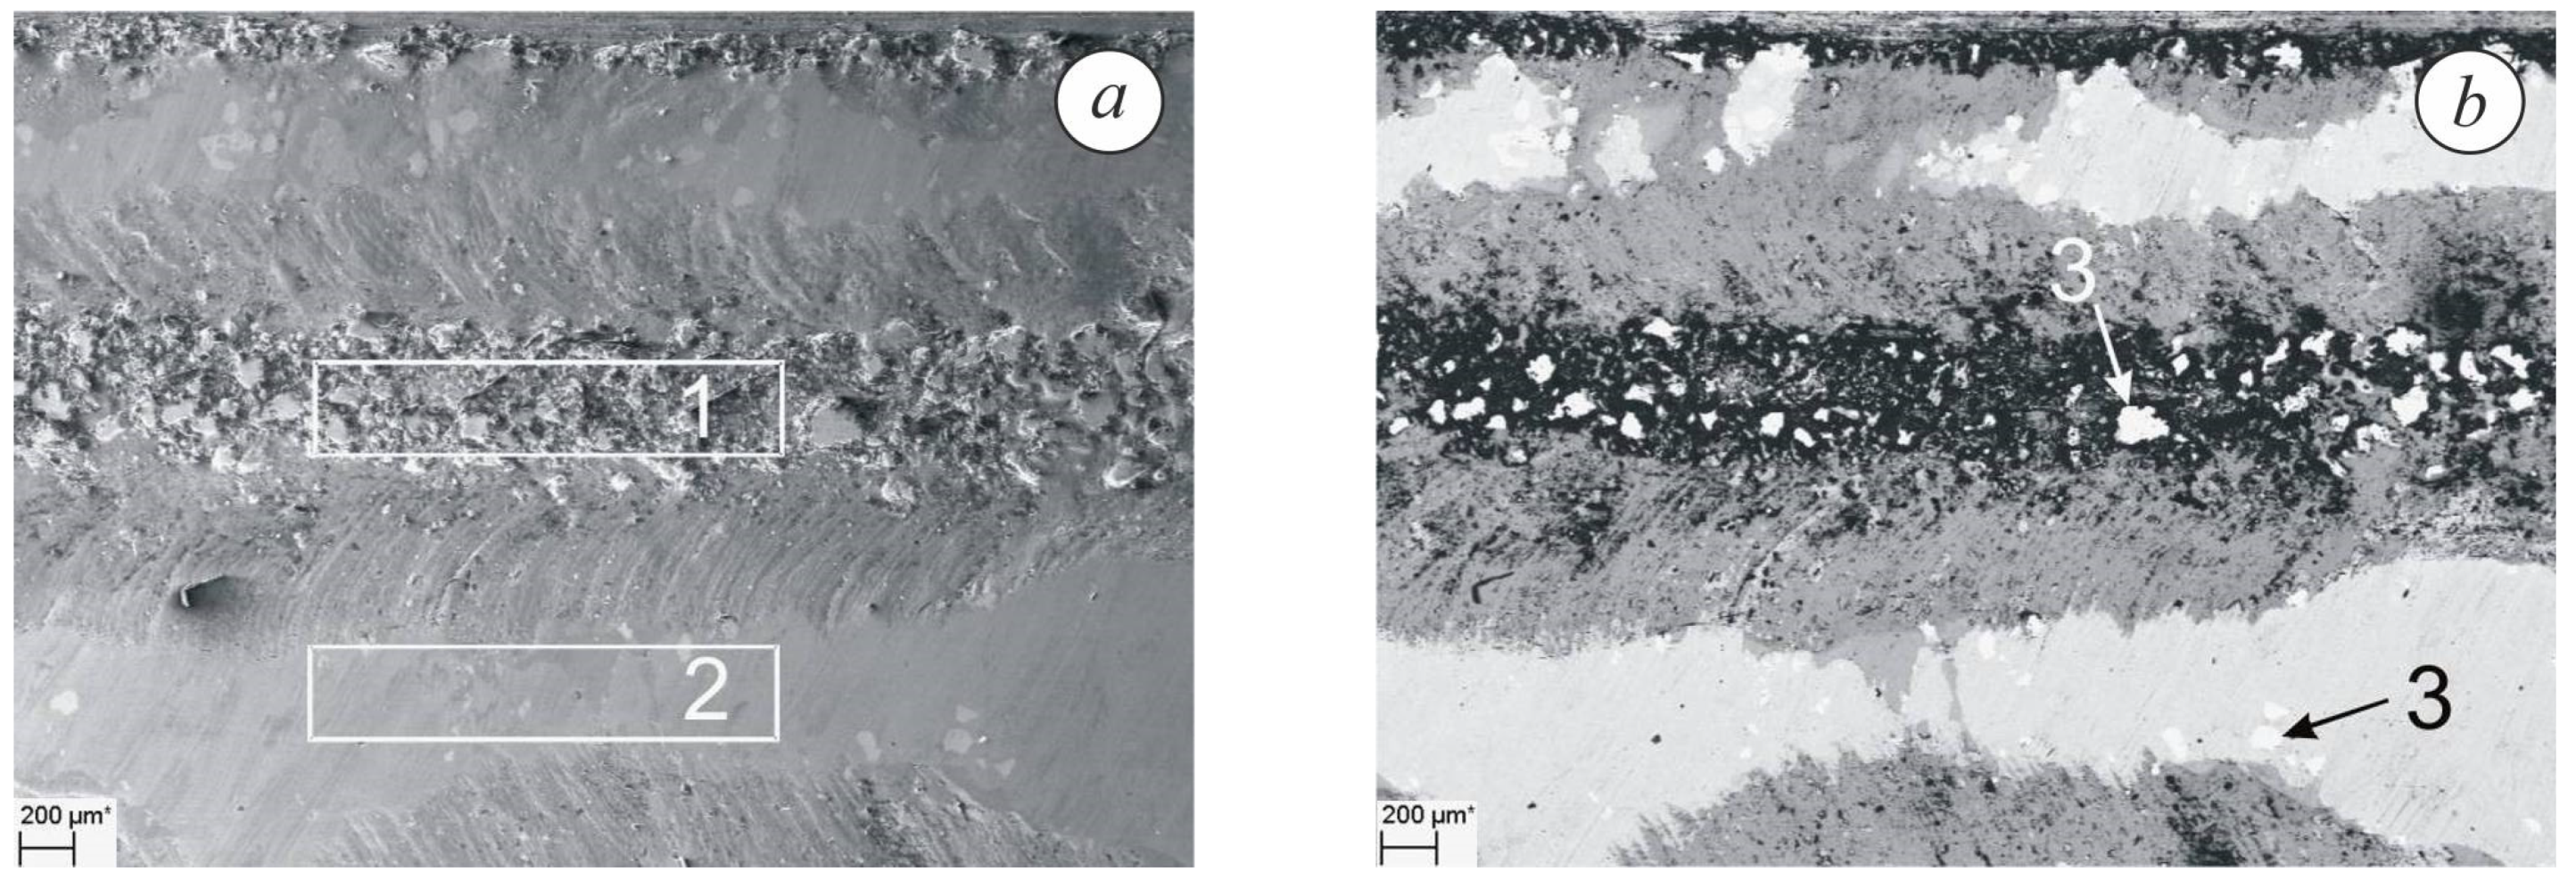
To reveal the wear mechanisms, changes in the surface chemical composition in the zones of frictional contact were analyzed (zones 1 and 2 in Figure 11a). Due to the wear of the surface layers during testing, the concentration of niobium, oxygen, and carbon in them decreases. On the wear tracks, numerous inclusions of <10 μm in size have been detected (notation 3 in Figure 11b), which contained more than 74 wt.% Nb, ~24 wt.% C, and more than 1 wt.% O.
This indicates that Nb is present both in the solid solution and in the form of carbide and oxycarbide phases [29]. Appropriate morphology and fraction of these phases reinforce the surface layers and increase their wear resistance. The obtained results correlate well with the previous studies. After the wear testing, the surface topography has changed significantly (Figure 12a and Table 1).
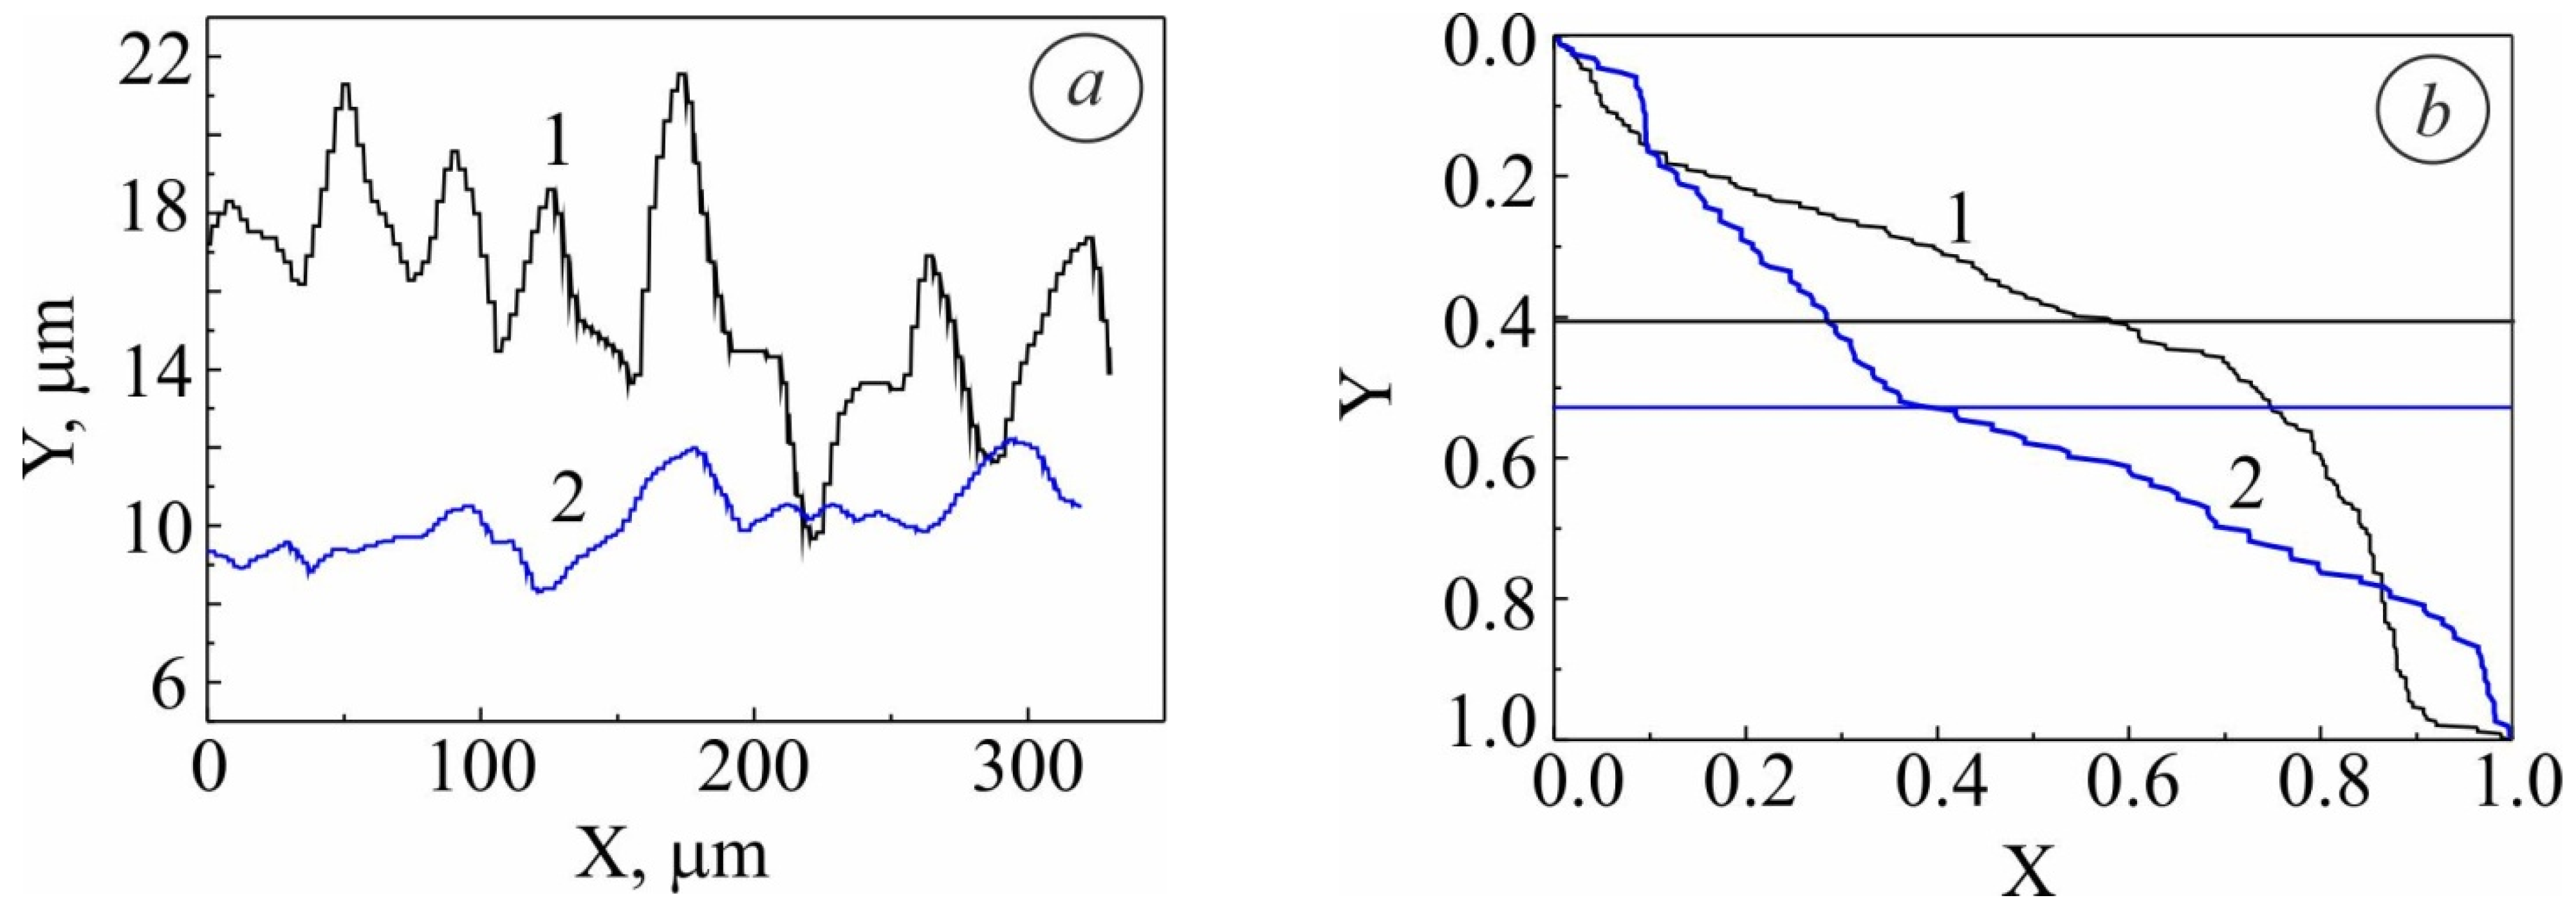
As a result of friction, the height and depth of microprojections (parameters Ra, Rz, Rmax, and Rp) decreased by 2.5–3 times, and the steps of peaks along the mean line S and the average radii of curvature r increased by 15–20%. The profile of the reference curve also changed (Figure 12b): the coordinates of the points of its intersection with the midline shifted from (0.6; 0.4) to (0.4; 0.58). This indicates the smoothing of the surface and reduction in the number of peaks/valleys and their height/depth. The reference curve of the surface profile characterizes the bearing capacity of the steel surface, so it is important to study the dynamics of its variation. For this purpose, the bearing capacity indicator (Stp) according to equation (1) and the value of Sq (trial surface) according to equation (2) were calculated. The results for the AISI 420 steel surface after laser alloying and wear testing are given in Table 2 and Table 3.
The average value of the bearing capacity indicator (Stp) of the alloyed surface increased to 0.076 after wear testing, compared to the value of 0.069 before the tests. This indicates the stability of wear resistance characteristics of the surface layers after laser alloying and indirectly supports good adhesion of these layers to the steel base.
3.6. Wear Testing of AISI 304 Steel
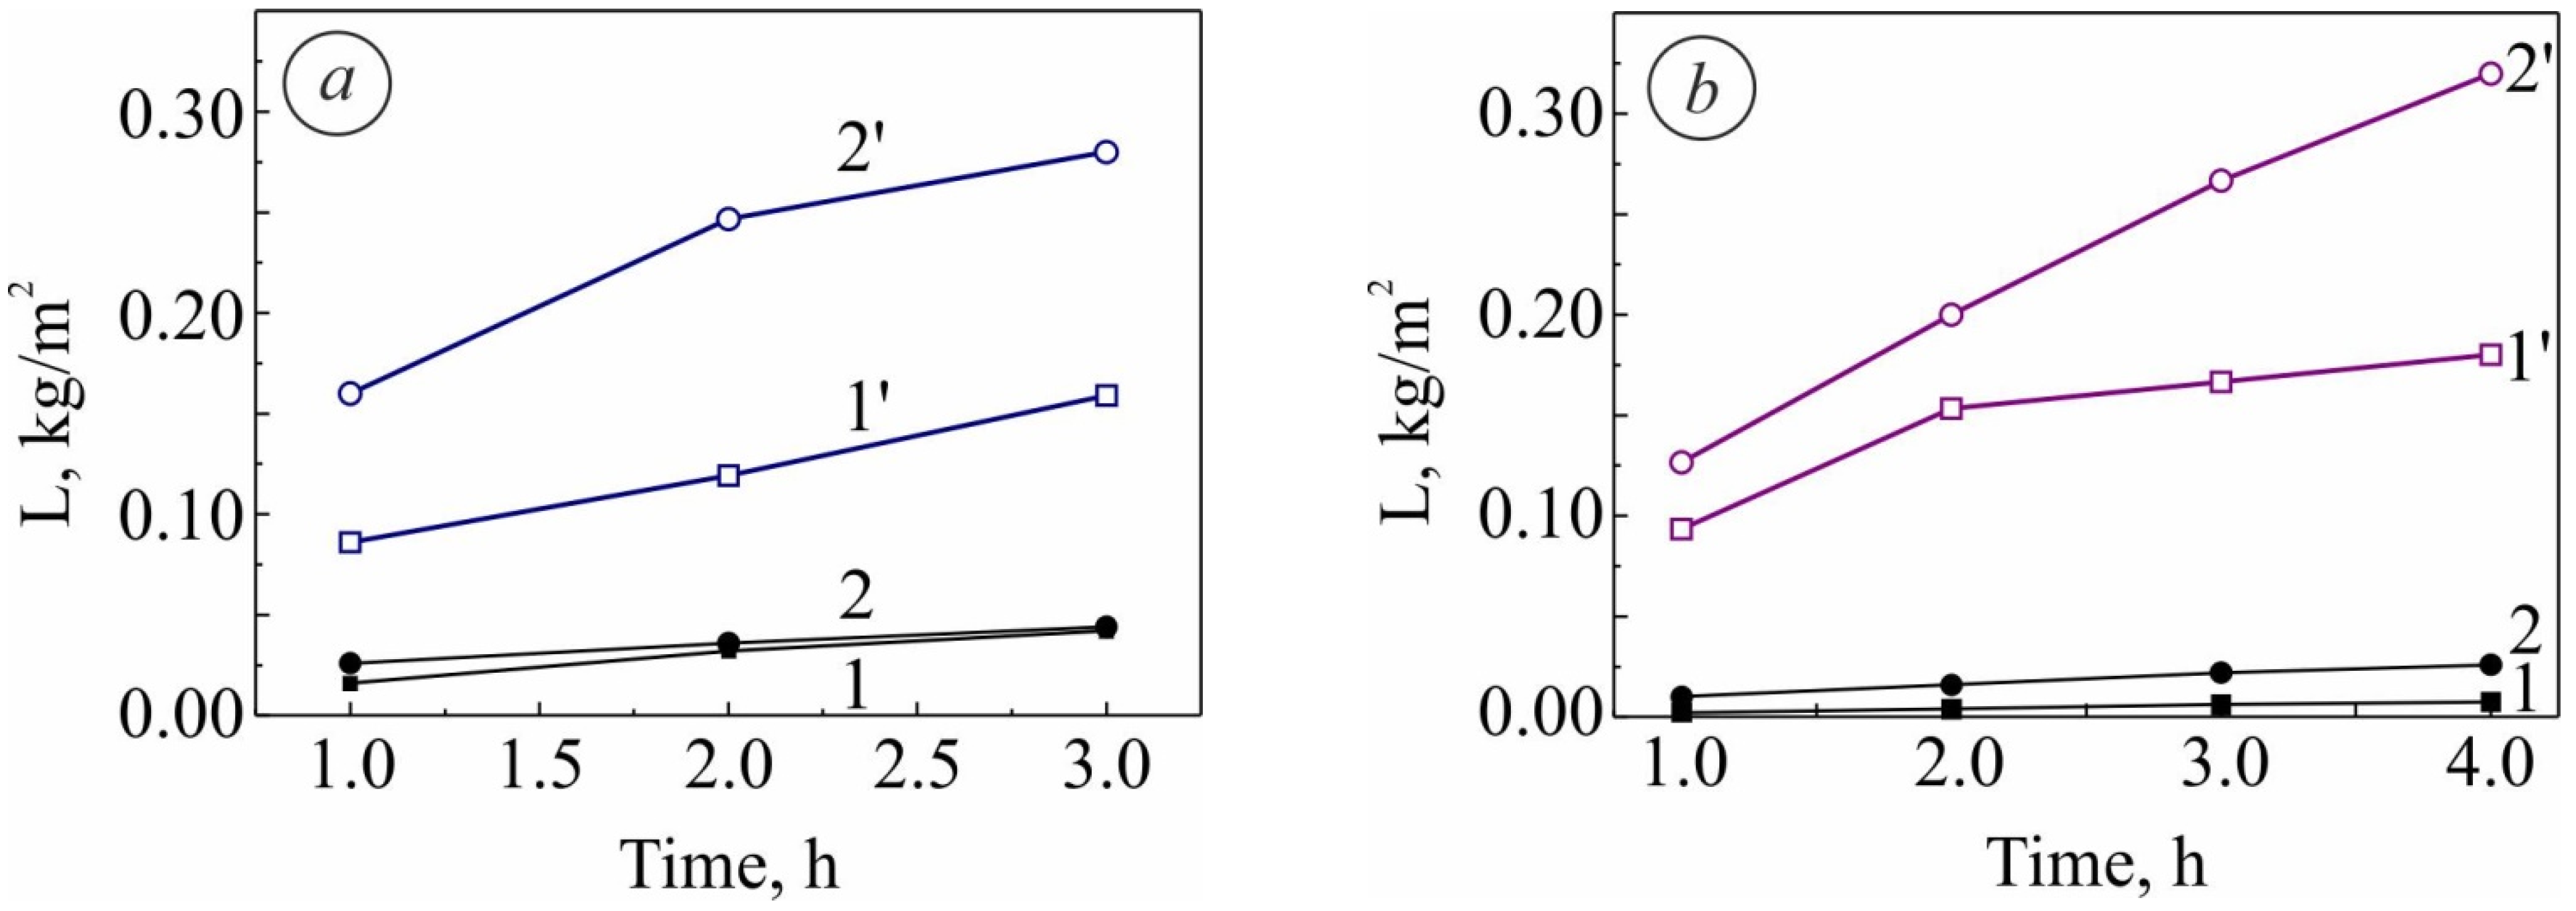
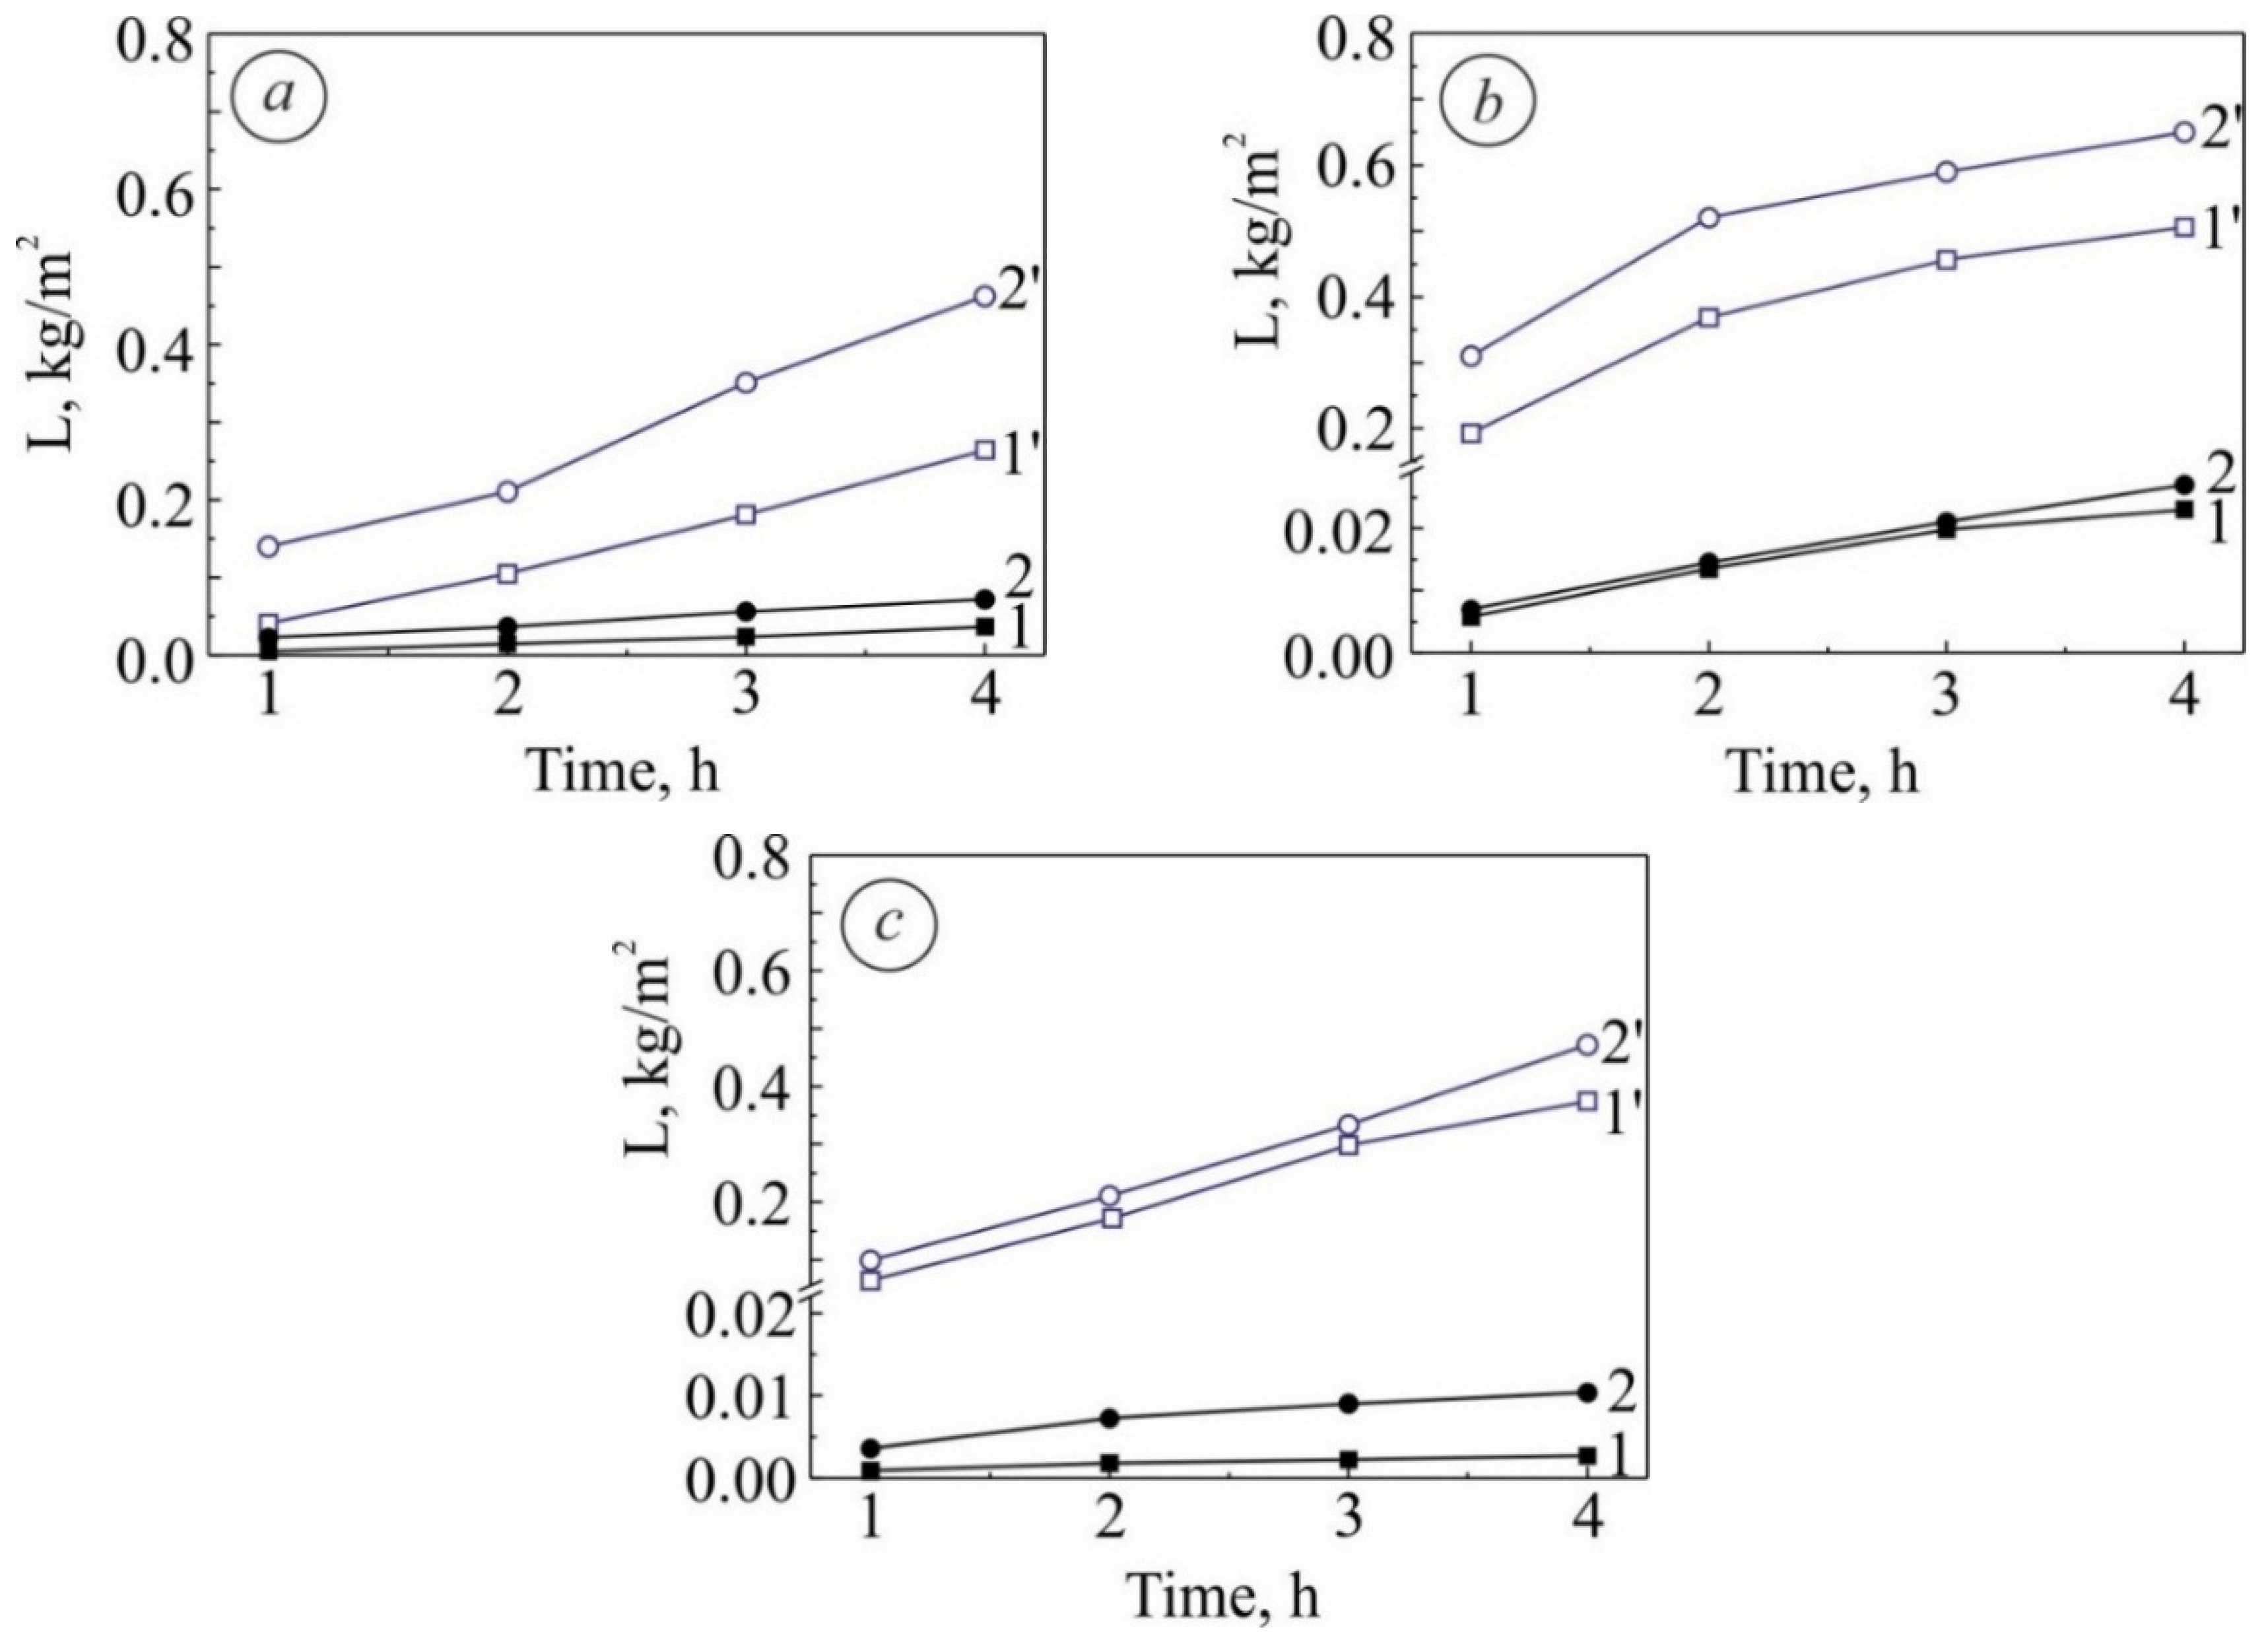
The laser alloying of AISI 304 steel with a plaster of 85Nb + 15% liquid glass decreased the wear mass loss (increased the wear resistance) of surface layers by 1.6 times at a contact pressure of 0.29 MPa and 2.6 times at a contact pressure of 0.42 MPa for a 4 h testing time (Figure 13a,b). Comparison of the alloyed steel samples with the counterbody (non-alloyed) showed that the wear of uncoated steel surface depends on the applied load (Figure 13a), although after laser alloying the variation was minor (Figure 13b) [29]. The results of energy dispersive X-ray microanalysis showed an insignificant decrease in the concentration of Nb in the friction zone, which indicates its fairly uniform distribution in the alloyed layer.
The analysis of surface roughness after wear testing (Figure 14a) showed a smoothing of the surface, as evidenced from the reduction in linear characteristics of the reference curve profile (Ra, Rz, Rmax, Rq, and Rp) by 5–6 times, the increase in the average distance between the microprojection peaks (S) by 10%, and increase in the average radii of microprojections by 5 times (Table 4). After wear testing, the reference curve profile changed, which indicated a gradual transition of the distribution of microprojections to a normal one (Figure 14b). The calculated parameters of the bearing capacity of the AISI 304 steel surface laser alloyed with a plaster of 85Nb + 15% liquid glass are given in Table 5 and Table 6. The average value of the bearing capacity indicator (Stp) increased after wear testing to 0.075 from below 0.068 for the alloyed steel before the test.
Laser alloying of AISI 304 steel with a plaster of 15Fe + 30Ni + 20B + 10Si + 25% liquid glass also promoted an increase in the wear resistance by 13.7 times at a contact pressure of 0.29 MPa and 7.2 times at a contact pressure of 0.42 MPa for 4 h of test duration (Figure 13c).
4. Conclusions
Investigation of laser alloying of AISI 304 and AISI 420 steels with plasters of 85Nb + 15% graphite, 85Nb + 15% liquid glass, and 15Fe + 30Ni + 20B + 10Si + 25% liquid glass and its effects on the surface microstructure, hardness and wear properties has led to the following conclusions.
The optimal parameters of laser alloying have been found using mathematical modelling to be: laser power density q = (0.30–0.31)·105 W/cm2 and beam scanning speed 1990 mm/min. These parameters produced a 220–320 μm deep surface layer with a complex microstructure, high microhardness and wear resistance.
The surface microstructure of AISI 420 steel alloyed with 85Nb + 15% liquid glass consisted of the α-solid solution with NbC and NbN, and a small amount of Cr7C3 and Cr2N; the microhardness was 6–7 GPa. The surface microstructure of this steel alloyed with 15Fe + 30Ni + 20B + 10Si + 25% liquid glass consisted of very fine grains (with a possibility of amorphisation) and uniformly distributed SiN4, BN, Cr7C3 and Cr23C6 particles; the microhardness was 16 GPa. A higher hardness after alloying with 15Fe + 30Ni + 20B + 10Si + 25% liquid glass originated from the formation of martensite as the major phase.
The surface microstructure of AISI 304 steel alloyed with 85Nb + 15% liquid glass was characterised by the chemical inhomogeneity of γ-solid solution with Cr7C3, TiC, NbC, NbC0.5, Cr4C, SiN4, and TiN particles, increased dislocation density, and the refinement of mosaic blocks; the microhardness was 7–8 GPa. Alloying of this steel with 15Fe + 30Ni + 20B + 10Si + 25% liquid glass produced a microstructure consisting of the γ-solid solution with a compressed lattice (to 0.356–0.358 nm, compared to usual 0.36–0.40 nm), CrB2, Cr7C3, TiC, SiN4, and TiN particles; the microhardness was 3.4 GPa. A higher hardness after alloying with 85Nb + 15% liquid glass originated from the precipitation of Nb-rich particles.
Magnetometric phase analysis allowed accurate characterisation of the microstructure and determination of phases. It can facilitate the study of systems in which dispersity, shape, and stress level of microstructure constituents vary. In particular, in the studied AISI 420 steel alloyed with 15Fe + 30Ni + 20B + 10Si + 25% liquid glass, the magnetometric phase analysis allowed for the detection of 4% of the residual austenite, in a predominantly martensitic microstructure, and the temperature range of its decomposition. In the AISI 304 steel alloyed with 15Fe + 30Ni + 20B + 10Si + 25% liquid glass two ferromagnetic phases were revealed by magnetometric phase analysis, Fe4N (with Curie temperature of 488 °C) and Fe3(C,N)/Fe3N (with Curie temperature of 294 °C).
Laser alloying of AISI 420 steel with plaster of 85Nb + 15% liquid glass increased the surface wear resistance by 7.1 times at a contact pressure of 0.29 MPa and by 2.0 times at a contact pressure of 0.42 MPa. The bearing capacity indicator (Stp) of the alloyed surface after the wear test increased to 0.076, compared to 0.069 before the tests. Laser alloying of AISI 304 steel with plaster of 85Nb + 15% liquid glass increased the surface wear resistance by 1.6 times at a contact pressure of 0.29 MPa and 2.6 times at a contact pressure of 0.42 MPa. The average value of the bearing capacity indicator (Stp) increased after wear testing to 0.075 from below 0.068 for the alloyed steel before the test. An increase in bearing capacity indicates high adhesion of the alloyed layers to the steel base and supports the stability of the wear characteristics.
Author Contributions
Conceptualization, Z.D.; methodology, V.K.; software, T.K.; validation, Z.D., V.K., T.K. and B.V.; formal analysis, V.K.; investigation, Z.D. and T.K.; resources, Z.D.; data curation, Z.D.; writing—original draft preparation, Z.D. and V.K.; writing—review and editing, Z.D., V.K., T.K., B.V. and A.K; visualization, V.K., T.K. and A.K.; supervision, Z.D.; project administration, Z.D.; funding acquisition, Z.D. All authors have read and agreed to the published version of the manuscript.
Funding
This research was funded by the Ministry of Education and Science of Ukraine grant number 0119U002248 “Improvement of reliability and forecasting of the safe operational life of elements for turbine engines of aviation engineering”.
Acknowledgments
The authors are thankful to H.V. Laz’ko for her help with performing microstructural studies and analysis of wear test results.
Conflicts of Interest
The authors declare no conflict of interest.
References
- Efremenko, V.G.; Zurnadzhi, V.I.; Chabak, Y.G.; Tsvetkova, O.V.; Dzherenova, A.V. Application of the Q-n-P-Treatment for Increasing the Wear Resistance of Low-Alloy Steel with 0.75% C. Mater. Sci. 2017, 53, 67–75. [Google Scholar] [CrossRef]
- Prokhorenko, V.Y.; Duryagina, Z.A.; Pazdrii, I.P.; Pleshakov, E.I.; Tsyura, I.V. Effect of laser treatment on corrosion resistancer of steels in lead melts. Phys. Chem. Mater. Treat. 1988, 22, 70–73. [Google Scholar]
- Duryagina, Z.A.; Bondar’, E.R.; Pastukhova, L.V. Mechanism and character of interaction of chromium stainless steel with molten lead and bismuth. Mater. Sci. 1988, 23, 544–547. [Google Scholar] [CrossRef]
- Pashechko, M.I.; Shyrokov, V.V.; Duryahina, Z.A.; Vasyliv, K.B. Structure and Corrosion-Mechanical Properties of the Surface Layers of Steels after Laser Alloying. Mater. Sci. 2003, 39, 108–117. [Google Scholar] [CrossRef]
- Prokhorenko, V.Y.; Duryagina, Z.A.; Patsyurkevich, I.V.; Murachev, A.D. Effect of laser treatment on compatibility of corrosion-resisting steels with 83Pb-17Li melt. Mater. Sci. 1990, 25, 537–540. [Google Scholar] [CrossRef]
- Duryahina, Z.A.; Makhorkin, I.M.; Laz’Ko, H.V.; Bychyns’Kyi, V.I. Evaluation of temperature fields in corrosion-resistant steels under the action of laser radiation. Mater. Sci. 2007, 43, 800–806. [Google Scholar] [CrossRef]
- Duryagina, Z.A.; Mudryi, S.I.; Lutsyshyn, T.I. Relationship between the Structural Parameters of Li17Pb83 Melt and Its Interaction with Stainless Steels. Mater. Sci. 2004, 40, 94–101. [Google Scholar] [CrossRef]
- Duryagina, Z.A.; Mudryi, S.I. Structural Coherence on the Interface of Stainless Steel with Li17Pb83 (Pb) Melts. Mater. Sci. 2005, 41, 56–61. [Google Scholar] [CrossRef]
- Chabak, Y.G.; Fedun, V.I.; Pastukhova, T.V.; Zurnadzhy, V.I.; Berezhnyy, S.P.; Efremenko, V.G. Modification of steel surface by pulsed plasma heating. Prob. At. Sci. Technol. 2017, 110, 97–102. [Google Scholar]
- Efremenko, V.; Shimizu, K.; Pastukhova, T.; Chabak, Y.; Brykov, M.; Kusumoto, K.; Efremenko, A. Three-body abrasive wear behaviour of metastable spheroidal carbide cast irons with different chromium contents. Int. J. Mater. Res. 2018, 109, 147–156. [Google Scholar] [CrossRef]
- Sukhova, O.V.; Polons’Kyi, V.A.; Ustinova, K.V. Corrosion Resistance of Alloys of the Al–Cu–Fe–(Si, B) System in Mineralized Saline and Acid Solutions. Mater. Sci. 2019, 55, 291–298. [Google Scholar] [CrossRef]
- Jiru, W.G.; Sankar, M.R.; Dixit, U.S. Laser Surface Alloying of Copper, Manganese, and Magnesium with Pure Aluminum Substrate. J. Mater. Eng. Perform. 2016, 25, 1172–1181. [Google Scholar] [CrossRef]
- Sun, R.; Yang, D.; Guo, L.; Dong, S. Laser cladding of Ti-6Al-4V alloy with TiC and TiC+NiCrBSi powders. Surf. Coat. Technol. 2001, 135, 307–312. [Google Scholar] [CrossRef]
- Chen, E.; Zhang, K.; Zou, J. Laser cladding of a Mg based Mg–Gd–Y–Zr alloy with Al–Si powders. Appl. Surf. Sci. 2016, 367, 11–18. [Google Scholar] [CrossRef]
- Liu, Y.; Guo, Z.; Yang, Y.; Wang, H.; Hu, J.; Li, Y.; Chumakov, A.; Bosak, N. Laser (a pulsed Nd:YAG) cladding of AZ91D magnesium alloy with Al and Al2O3 powders. Appl. Surf. Sci. 2006, 253, 1722–1728. [Google Scholar] [CrossRef]
- Ma, Q.; Gao, X.; Li, J. Microstructure performance and formation mechanism of laser alloying rare earth oxides modified nanocrystalline layer on TA7. Phys. E 2016, 77, 29–33. [Google Scholar] [CrossRef]
- Zhang, H.; Pan, Y.; He, Y.; Jiao, H. Microstructure and properties of 6FeNiCoSiCrAlTi high-entropy alloy coating prepared by laser cladding. Appl. Surf. Sci. 2011, 257, 2259–2263. [Google Scholar] [CrossRef]
- Li, Y.; Zhang, P.; Bai, P.; Wu, L.; Liu, B.; Zhao, Z. Microstructure and properties of Ti/TiBCN coating on 7075 aluminum alloy by laser cladding. Surf. Coat. Technol. 2018, 334, 142–149. [Google Scholar] [CrossRef]
- Report of the National Cristial Technologies Panel; Pennsylvania State University: Arlington, VA, USA, 1991; 126p.
- Kwok, C.T.; Cheng, F.; Man, H. Laser surface modification of UNS S31603 stainless steel. Part I: Microstructures and corrosion characteristics. Mater. Sci. Eng. A 2000, 290, 55–73. [Google Scholar] [CrossRef]
- Qin, R.; Zhang, X.; Guo, S.; Sun, B.; Tang, S.; Li, W. Laser cladding of high Co–Ni secondary hardening steel on 18Cr2Ni4WA steel. Surf. Coat. Technol. 2016, 285, 242–248. [Google Scholar] [CrossRef]
- Yue, T.; Xie, H.; Lin, X.; Yang, H.; Meng, G. Solidification behaviour in laser cladding of AlCoCrCuFeNi high-entropy alloy on magnesium substrates. J. Alloy. Compd. 2014, 587, 588–593. [Google Scholar] [CrossRef]
- Gong, F.-B.; Shen, J.; Gao, R.-H.; Zhang, T.; Xie, X.; Li, Y. Influence of heat treatment on microstructure and mechanical properties of FeCrNi coating produced by laser cladding. Trans. Nonferrous Met. Soc. China 2016, 26, 2117–2125. [Google Scholar] [CrossRef]
- Vilar, R.; Santos, E.; Ferreira, P.; Franco, N.; Da Silva, R. Structure of NiCrAlY coatings deposited on single-crystal alloy turbine blade material by laser cladding. Acta Mater. 2009, 57, 5292–5302. [Google Scholar] [CrossRef]
- Sexton, L.; Lavin, S.; Byrne, G.; Kennedy, A. Laser cladding of aerospace materials. J. Mater. Process. Technol. 2002, 122, 63–68. [Google Scholar] [CrossRef]
- Liu, Z.; Jiang, Q.; Li, T.; Dong, S.; Yan, S.; Zhang, H.; Xu, B. Environmental benefits of remanufacturing: A case study of cylinder heads remanufactured through laser cladding. J. Clean. Prod. 2016, 133, 1027–1033. [Google Scholar] [CrossRef]
- Orlovskii, V.P.; Komlev, V.; Barinov, S.M. Hydroxyapatite and Hydroxyapatite-Based Ceramics. Inorg. Mater. 2002, 38, 973–984. [Google Scholar] [CrossRef]
- Cheng, B.; Kim, Y.-J.; Chou, P. Improving Accident Tolerance of Nuclear Fuel with Coated Mo-alloy Cladding. Nucl. Eng. Technol. 2016, 48, 16–25. [Google Scholar] [CrossRef] [Green Version]
- Shyrokov, V.V.; Vasyliv, K.B.; Duryahina, Z.A.; Laz’Ko, H.V.; Rats’Ka, N.B. Effect of laser microalloying with niobium on the wear resistance of stainless steels. Mater. Sci. 2009, 45, 473–480. [Google Scholar] [CrossRef]
- Ryabtsev, S.; Polonskyy, V.; Sukhova, O. Effect of Scandium on the Structure and Corrosion Properties of Vapor-Deposited Nanostructured Quasicrystalline Al–Cu–Fe Films. Powder Met. Met. Ceram. 2020, 58, 567–575. [Google Scholar] [CrossRef]
- Duryagina, Z.A.; Bespalov, S.A.; Borysyuk, A.K.; Pidkova, V.Y. Magnetometric analysis of surface layers of 12Kh18N10T steel after ion-beam nitriding. Metallofizika i Noveishie Tekhnologii 2011, 33, 615–622. [Google Scholar]
- Duryahina, Z.A.; Borysyuk, A.K.; Bespalov, S.A.; Pidkova, V.Y. Influence of the thermal cyclic treatment on the phase composition of ion-nitrided surface layers of 12Kh18N10Т steel. Mater. Sci. 2012, 48, 364–368. [Google Scholar] [CrossRef]
- Pavlenko, N.; Shcherbovskikh, N.; Duriagina, Z. Interstitial Fe-Cr alloys: Tuning of magnetism by nanoscale structural control and by implantation of nonmagnetic atoms. Eur. Phys. J. Appl. Phys. 2012, 58, 10601. [Google Scholar] [CrossRef]
- Spiridonova, I.; Sukhova, O.V.; Vashchenko, A. Multicomponent diffusion processes in boride-containing composite materials. Metallofizika i Noveishie Tekhnologii 1999, 21, 122–125. [Google Scholar]
- Ghelloudj, E.; Hannachi, M.T.; Djebaili, H. Effect of salt bath nitriding on surface roughness behaviour of AISI 4140 steel. Acta Metall. Slovaca 2017, 23, 45–54. [Google Scholar] [CrossRef] [Green Version]
- Taylor, J.B.; Carrano, A.L.; Kandlikar, S.G. Characterization of the effect of surface roughness and texture on fluid flow—Past, present, and future. Int. J. Therm. Sci. 2006, 45, 962–968. [Google Scholar] [CrossRef]
- Nakar, D.; Feuermann, D. Surface roughness impact on the heat loss of solar vacuum heat collector elements (HCE). Renew. Energy 2016, 96, 148–156. [Google Scholar] [CrossRef]
- Slamani, M.; Gauthier, S.; Chatelain, J.-F. Comparison of surface roughness quality obtained by high speed CNC trimming and high speed robotic trimming for CFRP laminate. Robot. Comput. Manuf. 2016, 42, 63–72. [Google Scholar] [CrossRef]
- Yildirim, M.; Okutucu-Özyurt, T.; Dursunkaya, Z. A numerical algorithm to determine straightness error, surface roughness, and waviness measured using a fiber optic interferometer. Opt. Laser Technol. 2016, 85, 19–29. [Google Scholar] [CrossRef]
- Disrattakit, P.; Chanphana, R.; Chatraphorn, P. Roughness distribution of multiple hit and long surface diffusion length noise reduced discrete growth models. Phys. A Stat. Mech. Appl. 2016, 462, 619–629. [Google Scholar] [CrossRef]
- Singh, G.P.; Alphonsa, J.; Barhai, P.; Rayjada, P.; Raole, P.; Mukherjee, S. Effect of surface roughness on the properties of the layer formed on AISI 304 stainless steel after plasma nitriding. Surf. Coat. Technol. 2006, 200, 5807–5811. [Google Scholar] [CrossRef]
- Poon, C.Y.; Bhushan, B. Comparison of surface roughness measurements by stylus profiler, AFM and non-contact optical profiler. Wear 1995, 190, 76–88. [Google Scholar] [CrossRef]
- Al-Kindi, G.A.; Shirinzadeh, B. An evaluation of surface roughness parameters measurement using vision-based data. Int. J. Mach. Tools Manuf. 2007, 47, 697–708. [Google Scholar] [CrossRef]
- Misumi, I.; Naoi, K.; Sugawara, K.; Gonda, S. Profile surface roughness measurement using metrological atomic force microscope and uncertainty evaluation. Measurement 2015, 73, 295–303. [Google Scholar] [CrossRef]
- Brüning, H.; Teepe, M.; Vollertsen, F. Surface Roughness and Size Effect in Dendrite Arm Spacing at Preforms of AISI 304 (1.4301) Generated by Laser Rod End Melting. Procedia Eng. 2014, 81, 1589–1594. [Google Scholar] [CrossRef] [Green Version]
- Hiziroglu, S.; Kosonkorn, P. Evaluation of surface roughness of Thai medium density fiberboard (MDF). Build. Environ. 2006, 41, 527–533. [Google Scholar] [CrossRef]
- Stout, K.J.; Dong, W.P.; Mainsah, E. A Proposal for Standartisation of Assessment of Three-Dimensional Micro-Topography—Part I: Surface Digitisation and Parametric Characterisation; The University of Birmingham: Birmingham, UK, 1993; 20p. [Google Scholar]
- Duryahina, Z.A.; Kuzin, O.A.; Kuzin, M.O.; Shcherbovs’Kykh, N.V. Influence of the modes of laser alloying on the parameters of wear resistance of 12Kh17T steel. Mater. Sci. 2011, 47, 327–333. [Google Scholar] [CrossRef]
- Duryagina, Z.A.; Shcherbowskikh, N.V.; Bespalov, S.A. The effect of laser alloying by powder mixtures on the structure and micromechanical properties of 12X18H10T steel. Metallofizika i Noveishie Tekhnologii 2011, 33, 969–975. [Google Scholar]
- Celik, E.; Culha, O.; Uyulgan, B.; Azem, N.A.; Ozdemir, I.; Turk, A. Assessment of microstructural and mechanical properties of HVOF sprayed WC-based cermet coatings for a roller cylinder. Surf. Coat. Technol. 2006, 200, 4320–4328. [Google Scholar] [CrossRef]
- Elbah, M.; Yallese, M.A.; Aouici, H.; Mabrouki, T.; Rigal, J.-F. Comparative assessment of wiper and conventional ceramic tools on surface roughness in hard turning AISI 4140 steel. Measurement 2013, 46, 3041–3056. [Google Scholar] [CrossRef]
- Podgornik, B.; Vižintin, J.; Wänstrand, O.; Larsson, M.; Hogmark, S.; Ronkainen, H.; Holmberg, K. Tribological properties of plasma nitrided and hard coated AISI 4140 steel. Wear 2001, 249, 254–259. [Google Scholar] [CrossRef]
- Corengia, P.; Ybarra, G.; Moina, C.; Cabo, A.; Broitman, E. Microstructural and topographical studies of DC-pulsed plasma nitrided AISI 4140 low-alloy steel. Surf. Coat. Technol. 2005, 200, 2391–2397. [Google Scholar] [CrossRef]
- Sen, S.; Sen, U.; Bindal, C. Tribological properties of oxidised boride coatings grown on AISI 4140 steel. Mater. Lett. 2006, 60, 3481–3486. [Google Scholar] [CrossRef]
Figure 1.
Scheme of a magnetometer with a vibrating sample: 1—electromagnet, 2—thermocouple, 3—Hall sensor, 4—sample, 5—measuring coils, 6—heating device, 7—electromagnetic system for excitation of periodic oscillations; t is temperature, H is intensity of magnetic field, V is heating/cooling rate.
Figure 1.
Scheme of a magnetometer with a vibrating sample: 1—electromagnet, 2—thermocouple, 3—Hall sensor, 4—sample, 5—measuring coils, 6—heating device, 7—electromagnetic system for excitation of periodic oscillations; t is temperature, H is intensity of magnetic field, V is heating/cooling rate.

Figure 2.
Scheme of wear testing apparatus working in reciprocating mode: 1—reciprocating drive; 2—sample; 3—counterbody; 4—load unit; F is loading force.
Figure 2.
Scheme of wear testing apparatus working in reciprocating mode: 1—reciprocating drive; 2—sample; 3—counterbody; 4—load unit; F is loading force.

Figure 3.
The microhardness variation in the surface layers on steel (a) AISI 420 and (b) AISI 304: 1—initial state; 2—after laser alloying with a plaster of 85Nb + 15% graphite, 3—85 Nb + 15% liquid glass, 4—15Fe + 30Ni + 20B + 10Si + 25% liquid glass.
Figure 3.
The microhardness variation in the surface layers on steel (a) AISI 420 and (b) AISI 304: 1—initial state; 2—after laser alloying with a plaster of 85Nb + 15% graphite, 3—85 Nb + 15% liquid glass, 4—15Fe + 30Ni + 20B + 10Si + 25% liquid glass.

Figure 4.
(a) Optical and (b–d) SEM images of AISI 304 steel after laser alloying with a plaster of 85Nb + 15% graphite with (b,d) EDS line scans showing distributions of (b) Ti, Nb and (d) Ti, N.
Figure 4.
(a) Optical and (b–d) SEM images of AISI 304 steel after laser alloying with a plaster of 85Nb + 15% graphite with (b,d) EDS line scans showing distributions of (b) Ti, Nb and (d) Ti, N.

Figure 5.
A diffraction pattern of a surface layer on AISI 420 steel after laser alloying with a plaster of 85Nb + 15% liquid glass.
Figure 5.
A diffraction pattern of a surface layer on AISI 420 steel after laser alloying with a plaster of 85Nb + 15% liquid glass.

Figure 6.
(a) Optical and (b) SEM images of (a) AISI 420 and (b) AISI 304 steels after laser alloying with a plaster of 15Fe + 30Ni + 20B + 10Si + 25% liquid glass.
Figure 6.
(a) Optical and (b) SEM images of (a) AISI 420 and (b) AISI 304 steels after laser alloying with a plaster of 15Fe + 30Ni + 20B + 10Si + 25% liquid glass.

Figure 7.
Temperature dependences of the specific saturation magnetization of AISI 420 steel after laser alloying with a plaster of 15Fe + 30Ni + 20B + 10Si + 25% liquid glass for various heating/cooling modes: 1—heating rate (Vh) 30 °C/min, 2—cooling rate (Vc) 30 °C/min, 3—Vc = 60 °C/min, 4—Vc = 80 °C/min, 5—Vc = 100 °C/min.

Figure 8.
A diffraction pattern of the surface layer on AISI 304 steel laser alloyed with a plaster of 15Fe + 30Ni + 20B + 10Si + 25% liquid glass.
Figure 8.
A diffraction pattern of the surface layer on AISI 304 steel laser alloyed with a plaster of 15Fe + 30Ni + 20B + 10Si + 25% liquid glass.

Figure 9.
Temperature dependences of the specific saturation magnetization of the surface layer on AISI 304 steel after laser alloying with a plaster of 15Fe + 30Ni + 20B + 10Si + 25% liquid glass; the heating and cooling rates are 30 °C/min.
Figure 9.
Temperature dependences of the specific saturation magnetization of the surface layer on AISI 304 steel after laser alloying with a plaster of 15Fe + 30Ni + 20B + 10Si + 25% liquid glass; the heating and cooling rates are 30 °C/min.

Figure 10.
Cumulative wear mass loss for friction couples “AISI 420 steel (curves 1, 2)—counterbody (curves 1′, 2′)” at a contact pressure of 0.29 MPa (curves 1, 1′) and 0.42 MPa (curves 2, 2′): (a) the initial state; (b) after laser alloying with a plaster of 85Nb + 15% liquid glass.
Figure 10.
Cumulative wear mass loss for friction couples “AISI 420 steel (curves 1, 2)—counterbody (curves 1′, 2′)” at a contact pressure of 0.29 MPa (curves 1, 1′) and 0.42 MPa (curves 2, 2′): (a) the initial state; (b) after laser alloying with a plaster of 85Nb + 15% liquid glass.

Figure 11.
SEM (a) SE and (b) CZ BSD images of surface microstructure on AISI 420 steel after laser alloying with a plaster of 85Nb + 15% liquid glass and wear testing: the numbers 1 and 2 mark different zones of friction contact, and 3 marks inclusions on wear tracks.
Figure 11.
SEM (a) SE and (b) CZ BSD images of surface microstructure on AISI 420 steel after laser alloying with a plaster of 85Nb + 15% liquid glass and wear testing: the numbers 1 and 2 mark different zones of friction contact, and 3 marks inclusions on wear tracks.

Figure 12.
Profilograms (a) and reference curves (b) of surface layers for AISI 420 steel after laser alloying with a plaster of 85Nb + 15% liquid glass (curve 1) and after wear testing (curve 2).
Figure 12.
Profilograms (a) and reference curves (b) of surface layers for AISI 420 steel after laser alloying with a plaster of 85Nb + 15% liquid glass (curve 1) and after wear testing (curve 2).

Figure 13.
Cumulative wear mass loss for friction couples “AISI 304 steel (curves 1, 2)—counterbody (curves 1′, 2′)” at a contact pressure of 0.29 MPa (curves 1, 1′) and 0.42 MPa (curves 2, 2′) in the (a) initial state, and after laser alloying with a plaster of (b) 85Nb + 15% liquid glass, and (c) 15Fe + 30Ni + 20B + 10Si + 25% liquid glass.

Figure 14.
(a) Profilograms and (b) reference curves for surface layers of AISI 304 steel after laser alloying with a plaster of 85Nb + 15% liquid glass (curve 1) and after friction (curve 2).
Figure 14.
(a) Profilograms and (b) reference curves for surface layers of AISI 304 steel after laser alloying with a plaster of 85Nb + 15% liquid glass (curve 1) and after friction (curve 2).


Table 1.
Surface roughness parameters for AISI 420 steel after laser alloying with a plaster of 85Nb + 15% liquid glass (μm).
Table 1.
Surface roughness parameters for AISI 420 steel after laser alloying with a plaster of 85Nb + 15% liquid glass (μm).
| Surface Roughness Parameters | Initial State (after Laser Alloying) | after Wear Testing |
|---|---|---|
| Ra | 4.43 | 1.10 |
| Rz | 9.38 | 3.13 |
| Radius | 1330.01 | 2633.97 |
| Rmax | 20.89 | 10.55 |
| Rq | 5.21 | 1.38 |
| Rp | 10.83 | 2.53 |
| Kp | 0.48 | 0.52 |
| TM | 0.61 | 0.41 |
| S | 52.40 | 63.63 |
Table 2.
The results of calculating the bearing capacity for the AISI 420 steel surface after laser alloying with a plaster of 85Nb + 15% liquid glass.
Table 2.
The results of calculating the bearing capacity for the AISI 420 steel surface after laser alloying with a plaster of 85Nb + 15% liquid glass.
| h, μm | A(h), % | Sq, % | h = A(h)/Sq | (M-1) Δx, μm | Stp | Stp% |
|---|---|---|---|---|---|---|
| 18.5 | 0.19 | 0.48 | 0.39 | 5.08 | 0.076 | 7.6 |
| 21.50 | 0.22 | 0.48 | 0.45 | 5.72 | 0.078 | 7.8 |
| 20 | 0.20 | 0.48 | 0.42 | 4.45 | 0.094 | 9.4 |
| 19 | 0.19 | 0.48 | 0.40 | 6.35 | 0.062 | 6.2 |
| 22 | 0.22 | 0.48 | 0.46 | 7.62 | 0.060 | 6.0 |
| 17 | 0.17 | 0.48 | 0.36 | 8.89 | 0.040 | 4.0 |
| 17.5 | 0.18 | 0.48 | 0.36 | 5.08 | 0.072 | 7.2 |
Table 3.
The results of calculating the bearing capacity of the laser-alloyed surface of AISI 420 steel after wear testing.
Table 3.
The results of calculating the bearing capacity of the laser-alloyed surface of AISI 420 steel after wear testing.
| h, μm | A(h), % | Sq, % | h = A(h)/Sq | (M-1) Δx, μm | Stp | Stp% |
|---|---|---|---|---|---|---|
| 9 | 0.09 | 0.52 | 0.17 | 1.27 | 0.136 | 13.6 |
| 10 | 0.10 | 0.52 | 0.19 | 2.54 | 0.076 | 7.6 |
| 11 | 0.11 | 0.52 | 0.21 | 10.16 | 0.021 | 2.1 |
| 12 | 0.12 | 0.52 | 0.23 | 10.80 | 0.021 | 2.1 |
| 10 | 0.10 | 0.52 | 0.19 | 2.54 | 0.076 | 7.6 |
| 10.5 | 0.105 | 0.52 | 0.20 | 1.27 | 0.159 | 15.9 |
| 10 | 0.10 | 0.52 | 0.19 | 2.54 | 0.076 | 7.6 |
| 12.5 | 0.125 | 0.52 | 0.24 | 5.72 | 0.042 | 4.2 |
Table 4.
Parameters of profilograms (μm) of the friction surface of AISI 304 steel after laser alloying with a plaster of 85Nb + 15% liquid glass.
Table 4.
Parameters of profilograms (μm) of the friction surface of AISI 304 steel after laser alloying with a plaster of 85Nb + 15% liquid glass.
| Surface Roughness Parameters | Initial State (after Laser Alloying) | after Friction |
|---|---|---|
| Ra | 9.12 | 1.20 |
| Rz | 24.76 | 4.19 |
| Radius | 1526.43 | 7908.57 |
| Rmax | 40.40 | 7.80 |
| Rq | 9.89 | 1.41 |
| Rp | 11.89 | 4.66 |
| Kp | 0.71 | 0.40 |
| TM | 0.50 | 0.46 |
| S | 46.94 | 51.74 |
Table 5.
The results of calculating the bearing capacity of the surface of AISI 304 steel after laser alloying with a plaster of 85Nb + 15% liquid glass.
Table 5.
The results of calculating the bearing capacity of the surface of AISI 304 steel after laser alloying with a plaster of 85Nb + 15% liquid glass.
| h, μm | A(h), % | Sq, % | h = A(h)/Sq | (M-1) Δx, μm | Stp | Stp% |
|---|---|---|---|---|---|---|
| 30 | 0.30 | 0.54 | 0.56 | 6.35 | 0.087 | 8.7 |
| 33 | 0.33 | 0.54 | 0.61 | 7.62 | 0.080 | 8.0 |
| 29 | 0.29 | 0.54 | 0.54 | 7.62 | 0.070 | 7.0 |
| 19.5 | 0.195 | 0.54 | 0.36 | 6.35 | 0.057 | 5.67 |
| 18 | 0.18 | 0.54 | 0.33 | 6.35 | 0.052 | 5.2 |
| 17 | 0.17 | 0.54 | 0.31 | 6.35 | 0.050 | 5.0 |
| 22 | 0.22 | 0.54 | 0.41 | 5.08 | 0.080 | 8.0 |
| 24 | 0.24 | 0.54 | 0.44 | 6.35 | 0.070 | 7.0 |
| 24 | 0.24 | 0.54 | 0.44 | 7.62 | 0.058 | 5.8 |
| 25.5 | 0.255 | 0.54 | 0.47 | 6.35 | 0.074 | 7.4 |
Table 6.
The results of calculating the bearing capacity of the laser alloyed surface of AISI 304 steel after wear testing.
Table 6.
The results of calculating the bearing capacity of the laser alloyed surface of AISI 304 steel after wear testing.
| h, μm | A(h), % | Sq, % | h = A(h)/Sq | (M-1) Δx, μm | Stp | Stp% |
|---|---|---|---|---|---|---|
| 5.5 | 0.055 | 0.46 | 0.12 | 2.54 | 0.047 | 4.7 |
| 5 | 0.05 | 0.46 | 0.11 | 2.03 | 0.053 | 5.3 |
| 5 | 0.05 | 0.46 | 0.11 | 2.03 | 0.053 | 5.3 |
| 5.1 | 0.051 | 0.46 | 0.11 | 1.91 | 0.058 | 5.8 |
| 6.5 | 0.065 | 0.46 | 0.14 | 1.27 | 0.111 | 11.1 |
| 7 | 0.07 | 0.46 | 0.15 | 1.27 | 0.120 | 12.0 |
| 6.5 | 0.065 | 0.46 | 0.14 | 1.27 | 0.111 | 11.1 |
| 4.8 | 0.048 | 0.46 | 0.10 | 1.52 | 0.068 | 6.8 |
| 4 | 0.04 | 0.46 | 0.09 | 2.03 | 0.043 | 4.3 |
| 7.5 | 0.075 | 0.46 | 0.16 | 1.91 | 0.086 | 8.6 |
Publisher’s Note: MDPI stays neutral with regard to jurisdictional claims in published maps and institutional affiliations. |
© 2021 by the authors. Licensee MDPI, Basel, Switzerland. This article is an open access article distributed under the terms and conditions of the Creative Commons Attribution (CC BY) license (http://creativecommons.org/licenses/by/4.0/).
Share and Cite
MDPI and ACS Style
Duriagina, Z.; Kulyk, V.; Kovbasiuk, T.; Vasyliv, B.; Kostryzhev, A. Synthesis of Functional Surface Layers on Stainless Steels by Laser Alloying. Metals 2021, 11, 434. https://0-doi-org.brum.beds.ac.uk/10.3390/met11030434
AMA Style
Duriagina Z, Kulyk V, Kovbasiuk T, Vasyliv B, Kostryzhev A. Synthesis of Functional Surface Layers on Stainless Steels by Laser Alloying. Metals. 2021; 11(3):434. https://0-doi-org.brum.beds.ac.uk/10.3390/met11030434
Chicago/Turabian StyleDuriagina, Zoia, Volodymyr Kulyk, Taras Kovbasiuk, Bogdan Vasyliv, and Andrii Kostryzhev. 2021. "Synthesis of Functional Surface Layers on Stainless Steels by Laser Alloying" Metals 11, no. 3: 434. https://0-doi-org.brum.beds.ac.uk/10.3390/met11030434
Note that from the first issue of 2016, this journal uses article numbers instead of page numbers. See further details here.