
Role of Promaxon-D in Controlling Tribological Performance of Cu-Free Brake Pads


1
Centre for Automotive Research and Tribology (CART), Indian Institute of Technology Delhi, New Delhi 110016, India
2
Department of Mechanical Engineering, Indian Institute of Technology Delhi, New Delhi 110016, India
*
Author to whom correspondence should be addressed.
Metals 2021, 11(3), 441; https://0-doi-org.brum.beds.ac.uk/10.3390/met11030441
Submission received: 4 February 2021
/
Revised: 24 February 2021
/
Accepted: 2 March 2021
/
Published: 7 March 2021
(This article belongs to the Special Issue New Developments in Friction Brake Materials)
Abstract
:Copper appears to be an indispensable ingredient of non-asbestos organic (NAO) brake friction materials owing to its multifunctionality. However, recent findings proved it as a threat to aquatic life and efforts were initiated worldwide over the last few years to find a substitute for it. Recently, the authors’ group had reported on the potential of particulate Promaxon-D (hydrated calcium silicate), a porous material for enhancement of noise–vibration (NV) performance of Cu-free brake pads. It was felt necessary to investigate how Promaxon-D (PD) contributes to controlling tribo-performance of brake pads since this aspect is most important for the brake friction materials. A series of five types of brake pads was developed by keeping parent composition fixed and varying the theme ingredient PD content from 0–20 wt.%. The tribo-performance was evaluated on a full-scale brake inertia dynamometer as per the JASO C406 test standards. The increase in PD contents led to a reduction in density, hardness, and thermal conductivity while an increase in porosity and compressibility. With the increase in PD contents, almost all tribo properties such as average μ, fade ratio, and recovery ratio got enhanced, sensitivity of µ for pressure, speed, and temperature lowered but at the cost of wear resistance. Finally, the worn surfaces of pads and discs were observed under a scanning electron microscope equipped with energy dispersive X-ray (SEM-EDX) to find out the presence of various elements at the contact zone and to monitor specific topographical events responsible for wear mechanism.
1. Introduction
Friction materials (FMs) form one of the very complex multi-ingredients (up to 25) of composites containing mainly four types viz. resin, fibers, friction modifiers, and functional fillers in various proportions and combinations. Among these reinforcing fillers, functional fillers play crucial roles in enhancing various performance properties, such as physical, thermal and thermo-physical, mechanical, tribological, noise–vibration (NV) absorption, etc., and are from all classes such as organic (cashew dust, rubber, etc.), metallic (Cu, steel, brass, etc.), and inorganic (potassium titanate, calcium carbonate, vermiculite, etc.) [1]. A great deal of information is being reported on the exploration of inorganic fillers for improving performance properties of FMs. Raj et al. [2] found that a friction composite having 10 wt.% calcium sulfate whiskers was an optimum amount as a functional filler for manipulating stable compared to 5, 10, and 15 wt.%. Singh et al. [3] examined the effect of shape (powder and fiber) and amount of wollastonite (0, 10, and 20 wt.%) as a functional filler in FMs and claimed that the mechanical properties of FMs improved with increased wollastonite contents for both forms. However, fibers containing FMs performed better in wear and friction fluctuations. Mahale et al. [4] investigated potassium titanate as the functional filler for brake pads with variations of 0, 3, 6, 9, 12, and 15 wt.% and showed 12 wt.% potassium titanates was the best combination for performance.
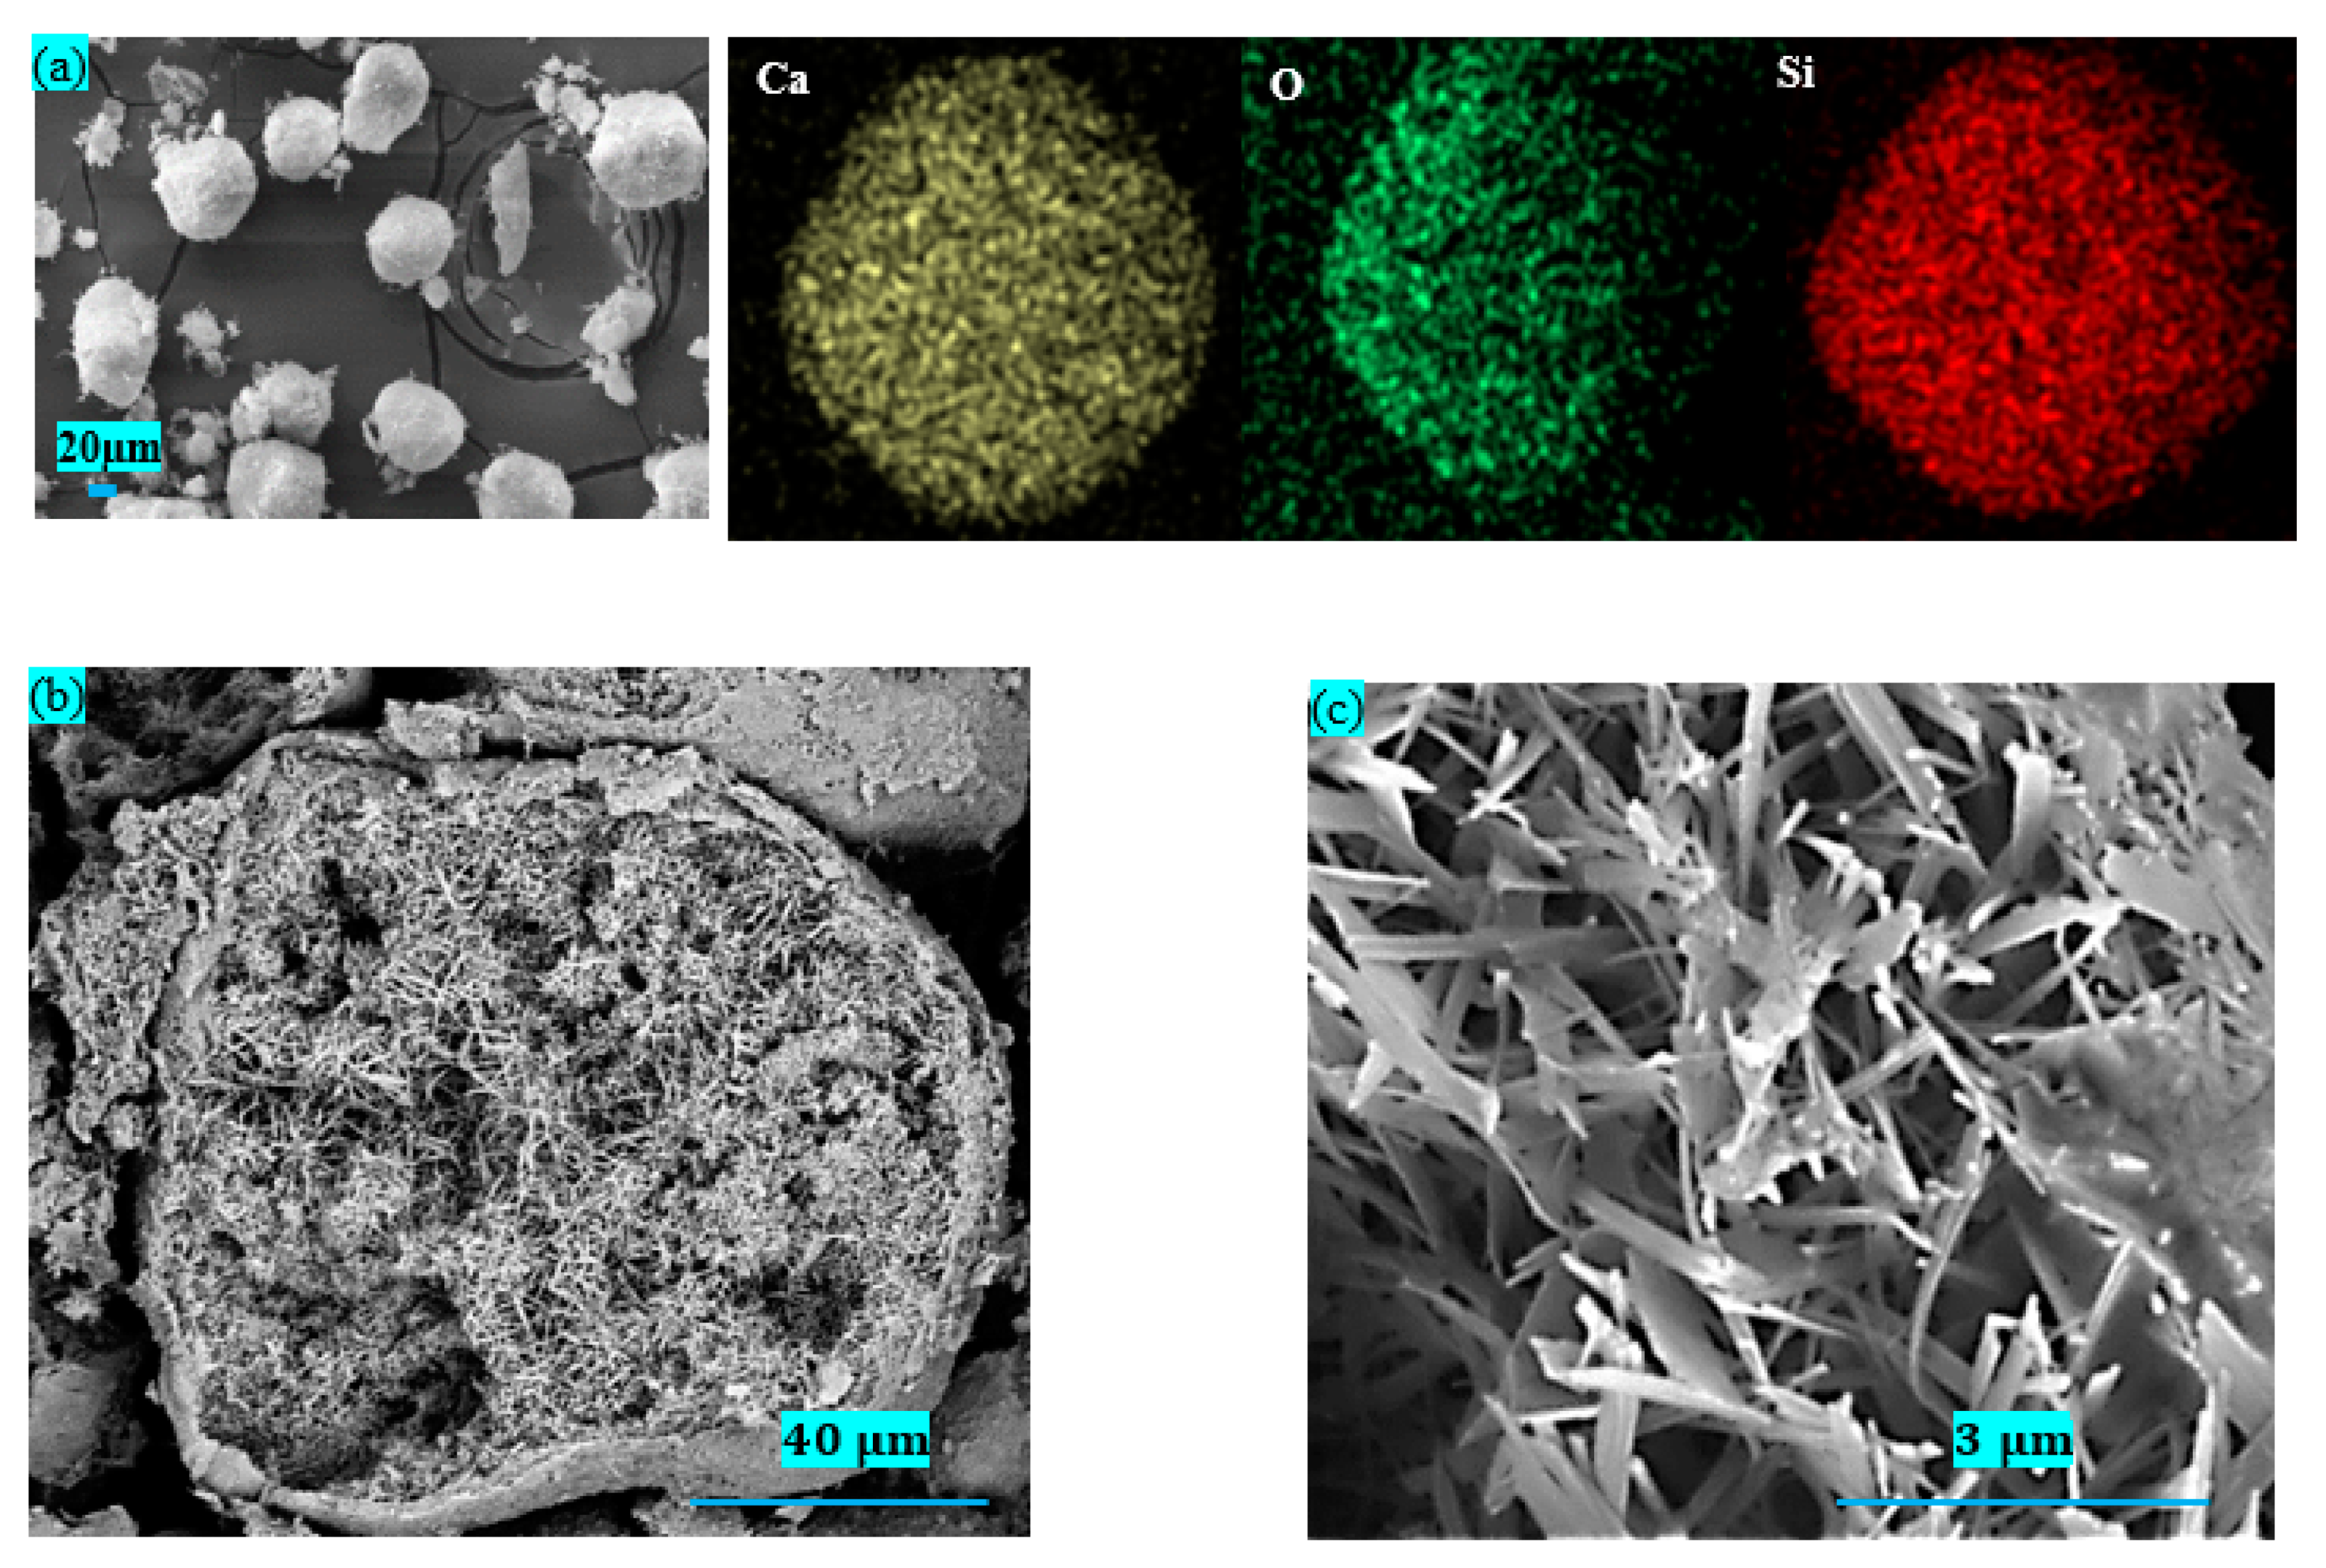
A synthetic hydrated calcium silicate, commercially available as Promaxon-D (PD), possesses a high thermal stability (>1500 °C), high porosity (>90%), and a Mohs hardness of 6.5 [5,6]. Moreover, during synthesis, special crystallization and control of grain growth lead to special morphology of particles, i.e., needle knitted crystals surrounded by an outer shell (Figure 1), and imparted high porosity. Razo et al. [6] studied the two types of PD, viz. spherical and milled (6.5 vol.%), with 16 vol.% binder in Cu-free non-asbestos organic (NAO) nonsteel formulation. They found that the PD considerably increased the compressibility, porosity, and stability of friction and a third body layer and hence noise was reduced. Mahale et al. [7] studied the PD (0, 5, and 10 wt.%) based nonmetallic brake pads using 10 wt.% phenolic binder and compared with Cu 10 wt.%. The results revealed that nonmetallic brake pads containing PD proved equally good barring wear when compared to Cu-based pads with similar parent composition. Smeets et al. [8] investigated Cu-based brake pads containing 0, 3, 6, and 9 vol.% of PD with fixed 18 vol.% binder and reported that the optimum amount of PD for the best tribo-performance was in the range of 3–6 vol.%. Anton et al. [9] used PD (0–20 wt.%) with 7 wt.% binder in complementary combination with calcium carbonate in NAO brake pads and claimed that PD enhanced the strength (green and mechanical), friction stability, fade resistance, and recovery, while the thermal conductivity and noise level got reduced. However, detailed information about the role of PD was not discussed owing to proprietary reasons. Recently, the authors’ group has investigated the performance of Cu-free FMs with the inclusion of PD (0, 5, 10, 15, and 20 wt.%) to investigate the influence on noise and vibration and reported an improvement in the mechanical properties and amelioration of the noise–vibration [10]. The 20 wt.% PD pads showed superior NV performance with overall ~3 dBA reduction in noise level and 12% drop in vibration compared to PD-free pads. However, in-depth studies on tribological performance were not reported, which are essential for the brake-materials as qualifying criteria. Hence, in this paper, detailed studies on brake-inertia dynamometer Japanese Automobile Standards JASO C406 are reported to reveal the complete potential of PD particles and the optimum amount for best performance properties.
2. Materials and Methods
Brake pads investigated in the present study were from the NAO Cu-free category comprising 13 ingredients with details given in our earlier paper [10]. The main ingredient Promaxon-D in the form of white powder was supplied by Promat International N. V. Belgium (chemical formula Ca6Si6O17(OH)2, diameter 35–85 µm, density 2.6 g/cc, Specific surface area (m2/g) > 40, Moh’s hardness 6.5, and melting point () > 1500) [5]. The spherical morphology and size distribution of Promaxon-D (PD) particles are shown in Figure 1a along with the EDX data in the form of dot maps to confirm their constituting elements. The chemical structure of PD corresponds with Xonotlite Ca6Si6O17(OH)2 and hence Ca, Si, and O dots were observed in the EDX analysis. Figure 1b,c shows the particles with pores having a knitted needle-like crystal structure.
2.1. Formulations and Development of the Brake Pads
A series of five types of Maruti Alto™ brake pads was developed based on parent composition (69 wt.%) with an increase in the content of a theme ingredient PD (0–20 wt.%) followed by a complementary decrease in barite content (Table 1). All the ingredients were mixed sequentially (dry) in a plough shear mixture to get a homogeneous mixture as per the standard mixing schedule [11]. Subsequently, 65 g of mixture was cold pressed in the shape of Maruti Alto™ car brake pads to get green pads. The hot compression molding was done on the green pads supported by back plates in eight cavity molds under 140 bars at 155–160 °C for 9 min with five intermittent breathings to expel gaseous products and to prevent cracking in the brake pads followed by curing, as discussed in an earlier paper [11]. The compositions of these Cu-free brake pads with varying Promaxon-D contents, and coded as P0, P5, P10, P15, and P20 (wt.%), are listed in Table 1.
2.2. Characterization of Cu-Free Brake Pads
The acetone extraction test following ASTM D 494 standards was used to find the uncured resins content by using a Soxhlet extraction apparatus while shear strength was measured following ISO 6312 standards with a 4500 N/s load rate. Thermal conductivity of the brake pads was measured using a thermal conductivity analyzer (Linseis, LFA 500, Selb, Germany) with sample dimensions of 10 mm × 10 mm × 3 mm as per ASTM-E1461-01. Five samples of the same brake pads were used for testing and the average values were reported.
2.3. Tribological Performance Evaluation on a Full Scale Dynamometer
Tribological tests were conducted on a full scale brake inertia dynamometer in accordance with the JASO C406 schedule at 25–30 °C and ≈50–55% RH in dry mode. The details of the dynamometer testing are available in earlier articles [12,13]. The parts of Maruti Alto™ car brake assembly (brake callipers and rotor disc) were used for testing the developed Maruti Alto™ brake pads in the laboratory. A fresh/unused Maruti Suzuki® Alto™ pearlite grey cast iron disc with 280 mm outer diameter was used as the counterpart for each test. Before the test, the disc was polished with 1000 grit silicon carbide paper to remove burrs and achieve Ra = 0.25 0.05 µm. Prior to the tribological tests, bedding operation (200 brakes) was performed on each pair of brake pads to get more than 80% conformal contact followed by an actual test of 200 brakes consisting of three main cycles; (I) effectiveness, (II) fade, and (III) recovery. The details are found in our earlier work [12]. Two tests were performed for repeatability and consistency. In each experiment a fresh pair of pads and disc were used. The µ was measured online by a torque sensor and wear was measured by weight loss of pads, before and after the test. Volume loss of pads was calculated using loss in weight and density.
2.4. Analysis of Worn Surfaces and Friction Layer
The worn surfaces of brake pads and discs were inspected using SEM (Zeiss EVO MA10, Carl Zeiss, Germany) at 20 kV after depositing a thin Au layer to enhance the electric conduction. Elemental compositions of the worn brake pads, disc surface, and friction layer were analysed using energy dispersive X-ray spectroscopy (EDX, Bruker AXS 127 eV) attached to SEM.
3. Results and Discussions
3.1. Material Characterization
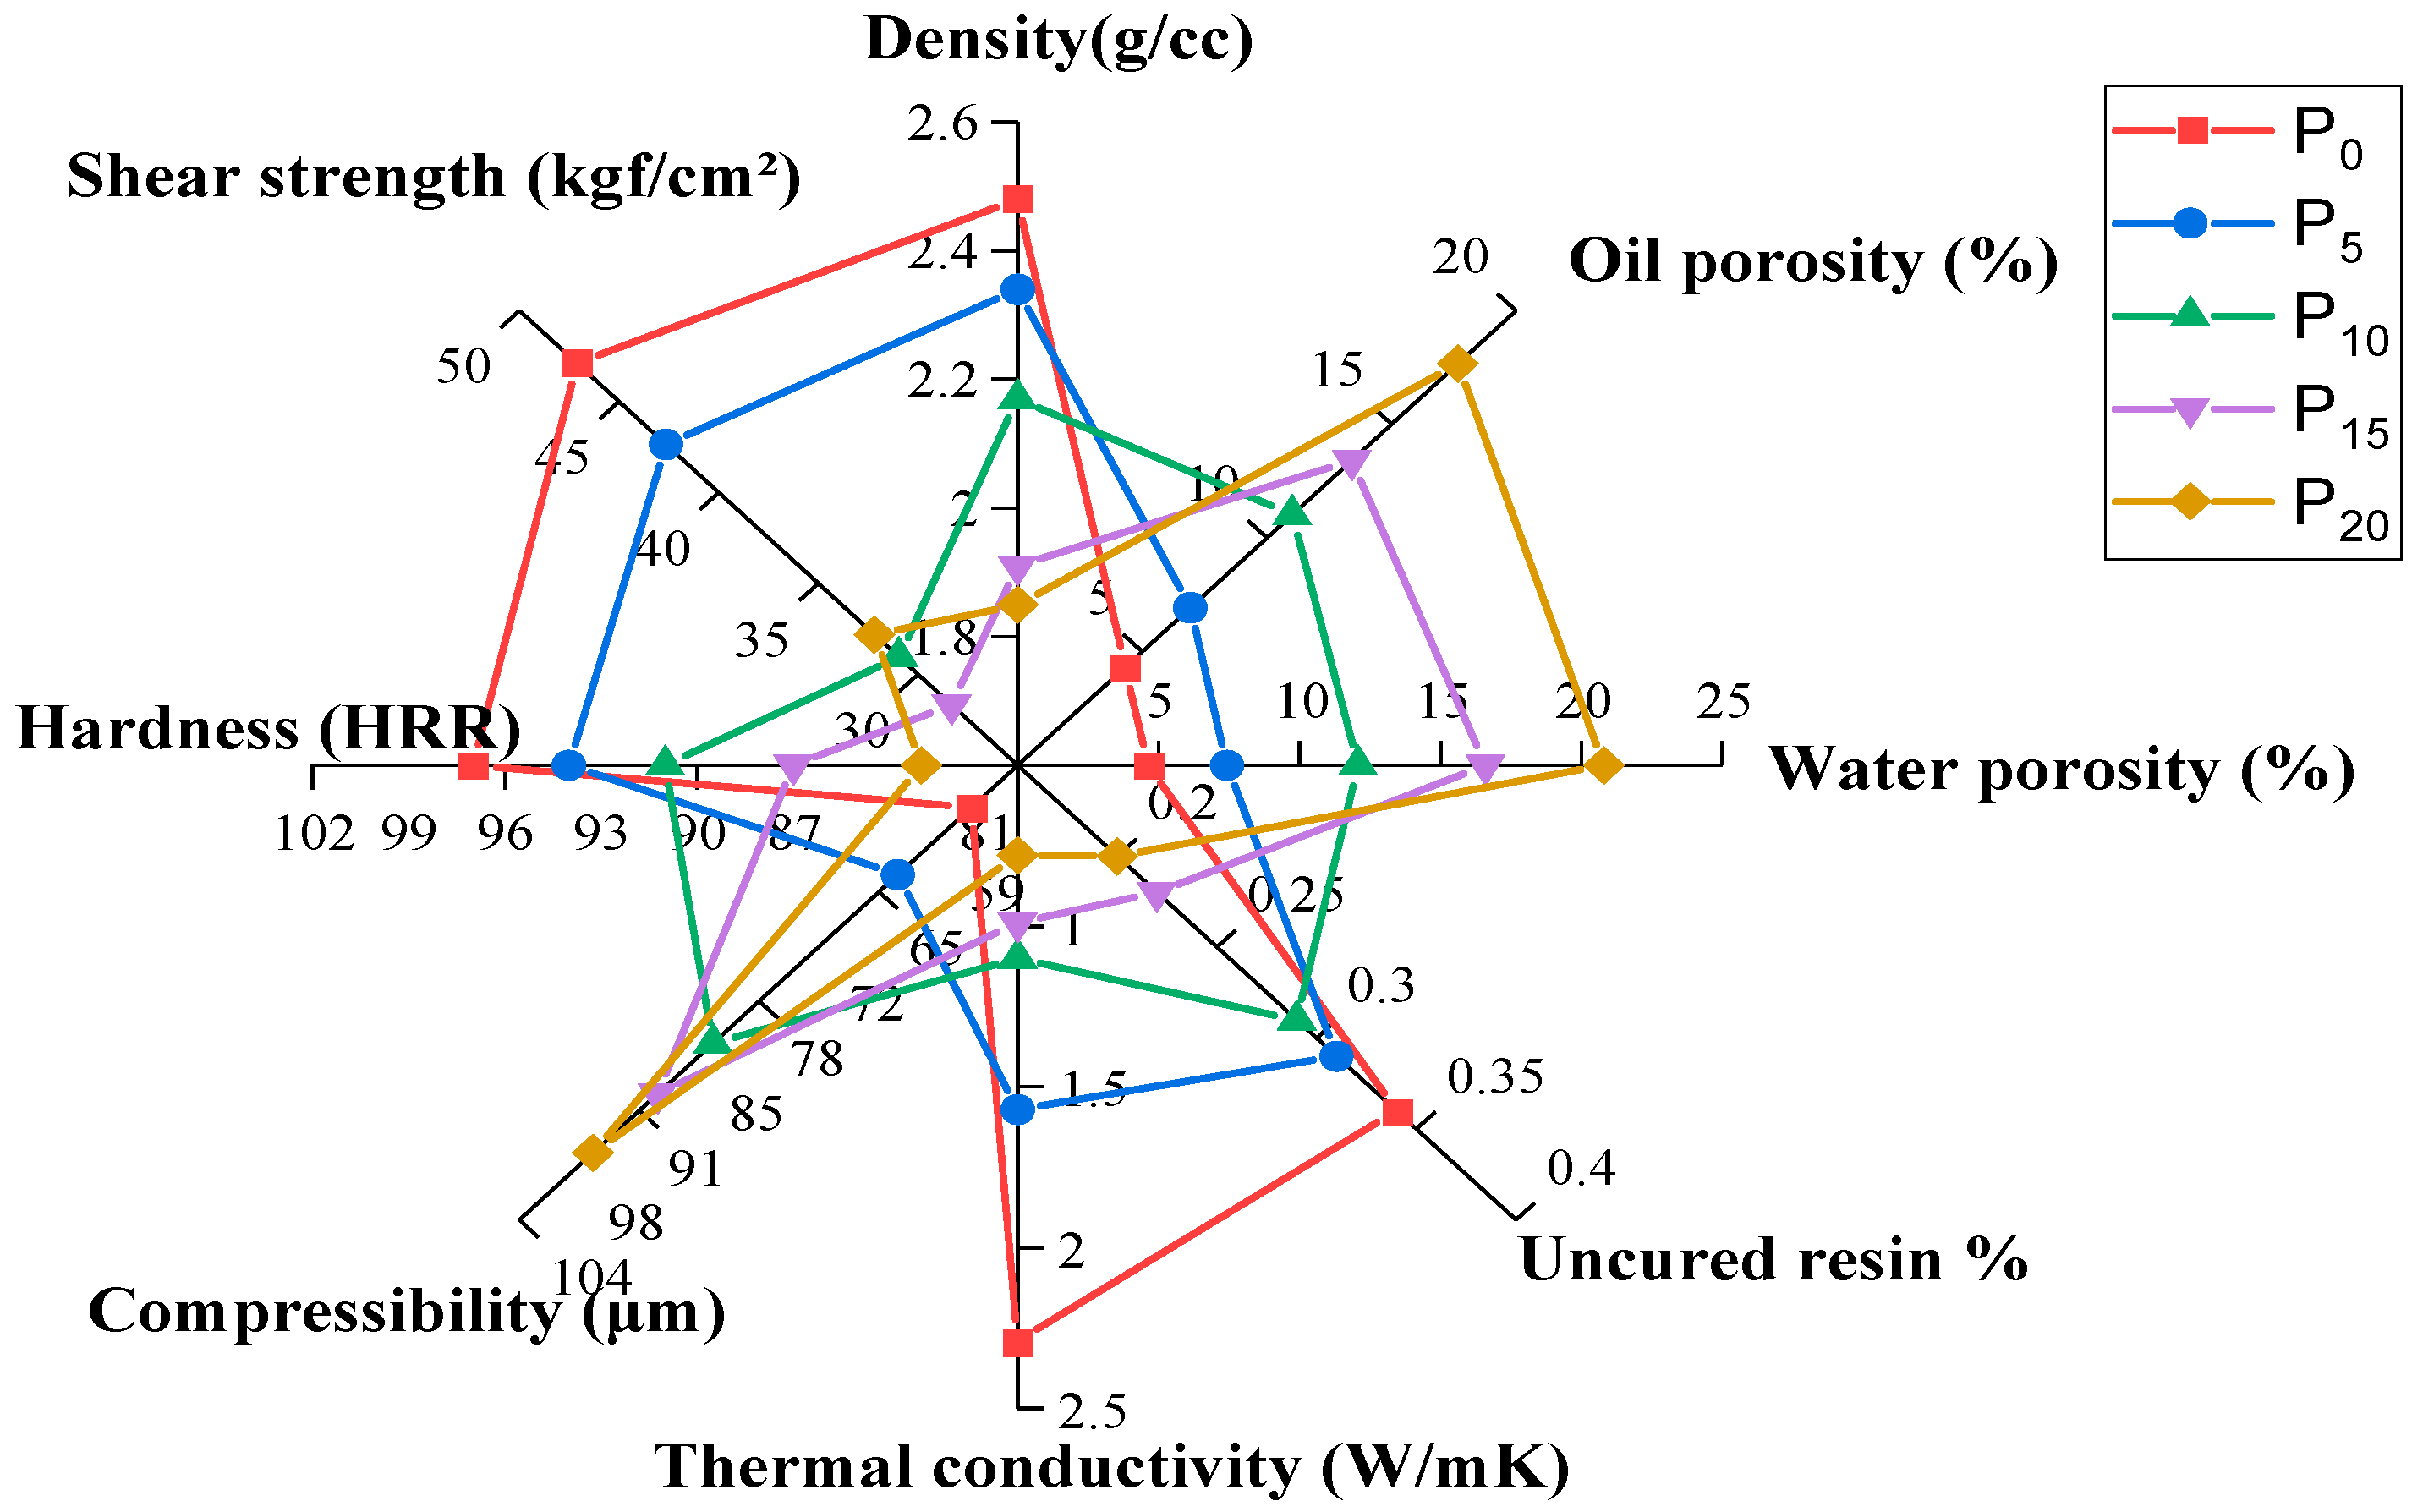
Physical, chemical and mechanical properties of the brake pads are shown in Figure 2.
The density and hardness decreased with increasing PD content, whereas porosity and compressibility showed opposite trends, as explained in an earlier paper [10]. The % uncured resin was in the range of 0.20–0.34 and within the prescribed range (<1%). The thermal conductivity (TC) of brake pads was in the range of 0.78–2.29 W m−1 K−1 and decreased considerably from 2.29 to 0.78 (66%) by adding 20 wt.% PD owing to reduced density, and increased porosity of brake-pads resulted in deterring the phonon scattering [14]. Shear strength of brake-pads reflects the adhesion between the back-plate and friction material when adhered with commercial glue. The shear strength of developed brake pads was within the acceptable range (>25 kgf/cm2).
3.2. Tribological Performance of Cu-Free Brake Pads
3.2.1. Effectiveness Studies (Pressure-Speed Sensitivity)
The steady coefficient of friction (µ) of desired magnitude is one of the critical requirements from the formulation of brake-pads. However, polymer composites do not follow Amonton’s and Coloumb’s laws and hence, µ does not remain constant with pressure and speed [13]. The decline in µ, called pressure fade and speed fade, is addressed during the effectiveness studies. Ideally, the sensitivity of µ towards pressure or speed should be minimal and slope and undulations in the µ-deceleration curve should be minimal.
3.2.2. Pressure Sensitivity of µ
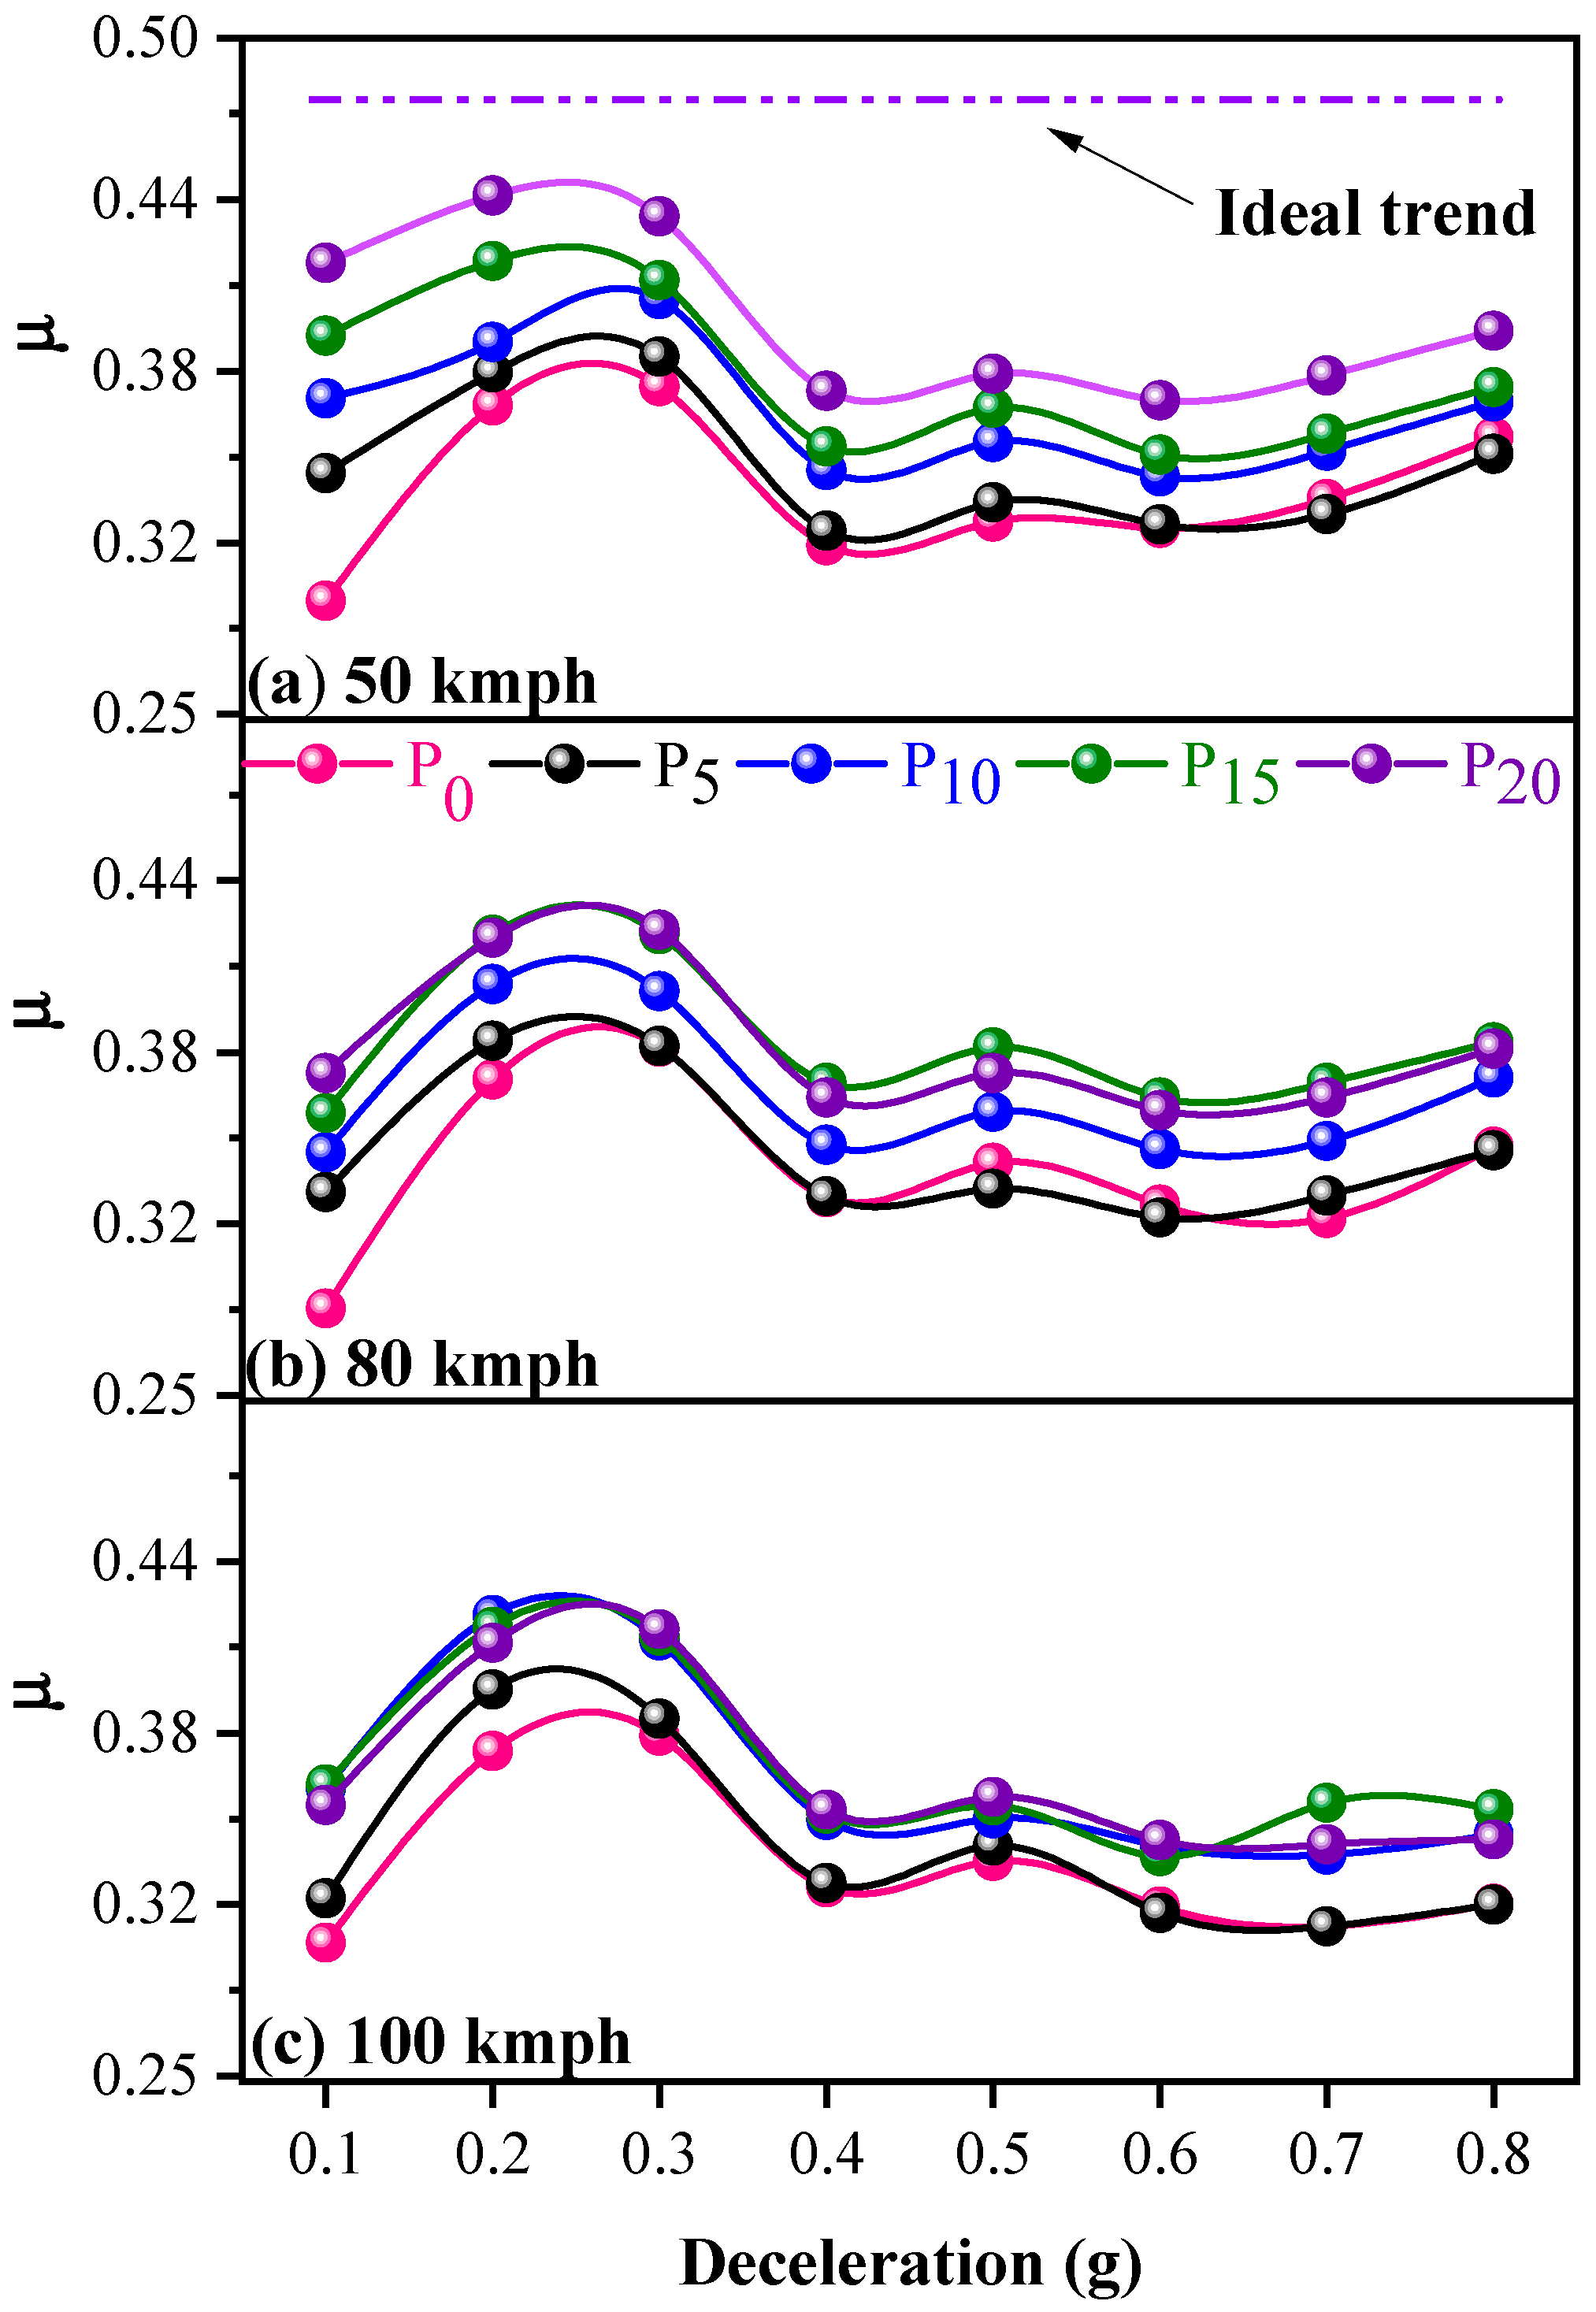
This stipulates the discrepancy in µ with an increase in deceleration/pressure at various constant speeds. Figure 3 shows the variation of µ with deceleration (0.1–0.8 g) at various speeds (50, 80, and 100 kmph). It can be observed from Figure 3, the µ of the brake pads was in the range of 0.28–0.45 and decreased with increasing pressure/deceleration at all speeds compared to the initial 0.2–0.3 g value. These results are in accordance with the literature [7,15]. This is mainly because the polymer asperities are deformed elastically at the interface of polymer composite and metal interface. For elastic contact at the interface, Areal P(2/3), where Areal is the real area of contact and P is normal load [16]. Therefore, the increase in pressure/deceleration generally leads to an increase in the real area of contact disproportionally owing to the viscoelasticity of polymeric material and also generation of CO2 at the contact zone ultimately resulting in lower pressure and hence µ is decreased [15]. A slight raise in the µ at 0.2 and 0.3 g could be because of the work-hardening of metallic ingredients in the pad. The pressure fade followed the order 100 kmph > 80 kmph > 50 kmph which also is an indication of speed-fade. With an increase of speed, temperature at the contact zone increases leading to softening or melting of organic ingredients—and this layer of lower shearing strength reduces µ [17]. The overall performance order based on pressure sensitivity (lower sensitivity is desirable) and magnitude of µ was P20 > P15 > P10 > P5 > P0.
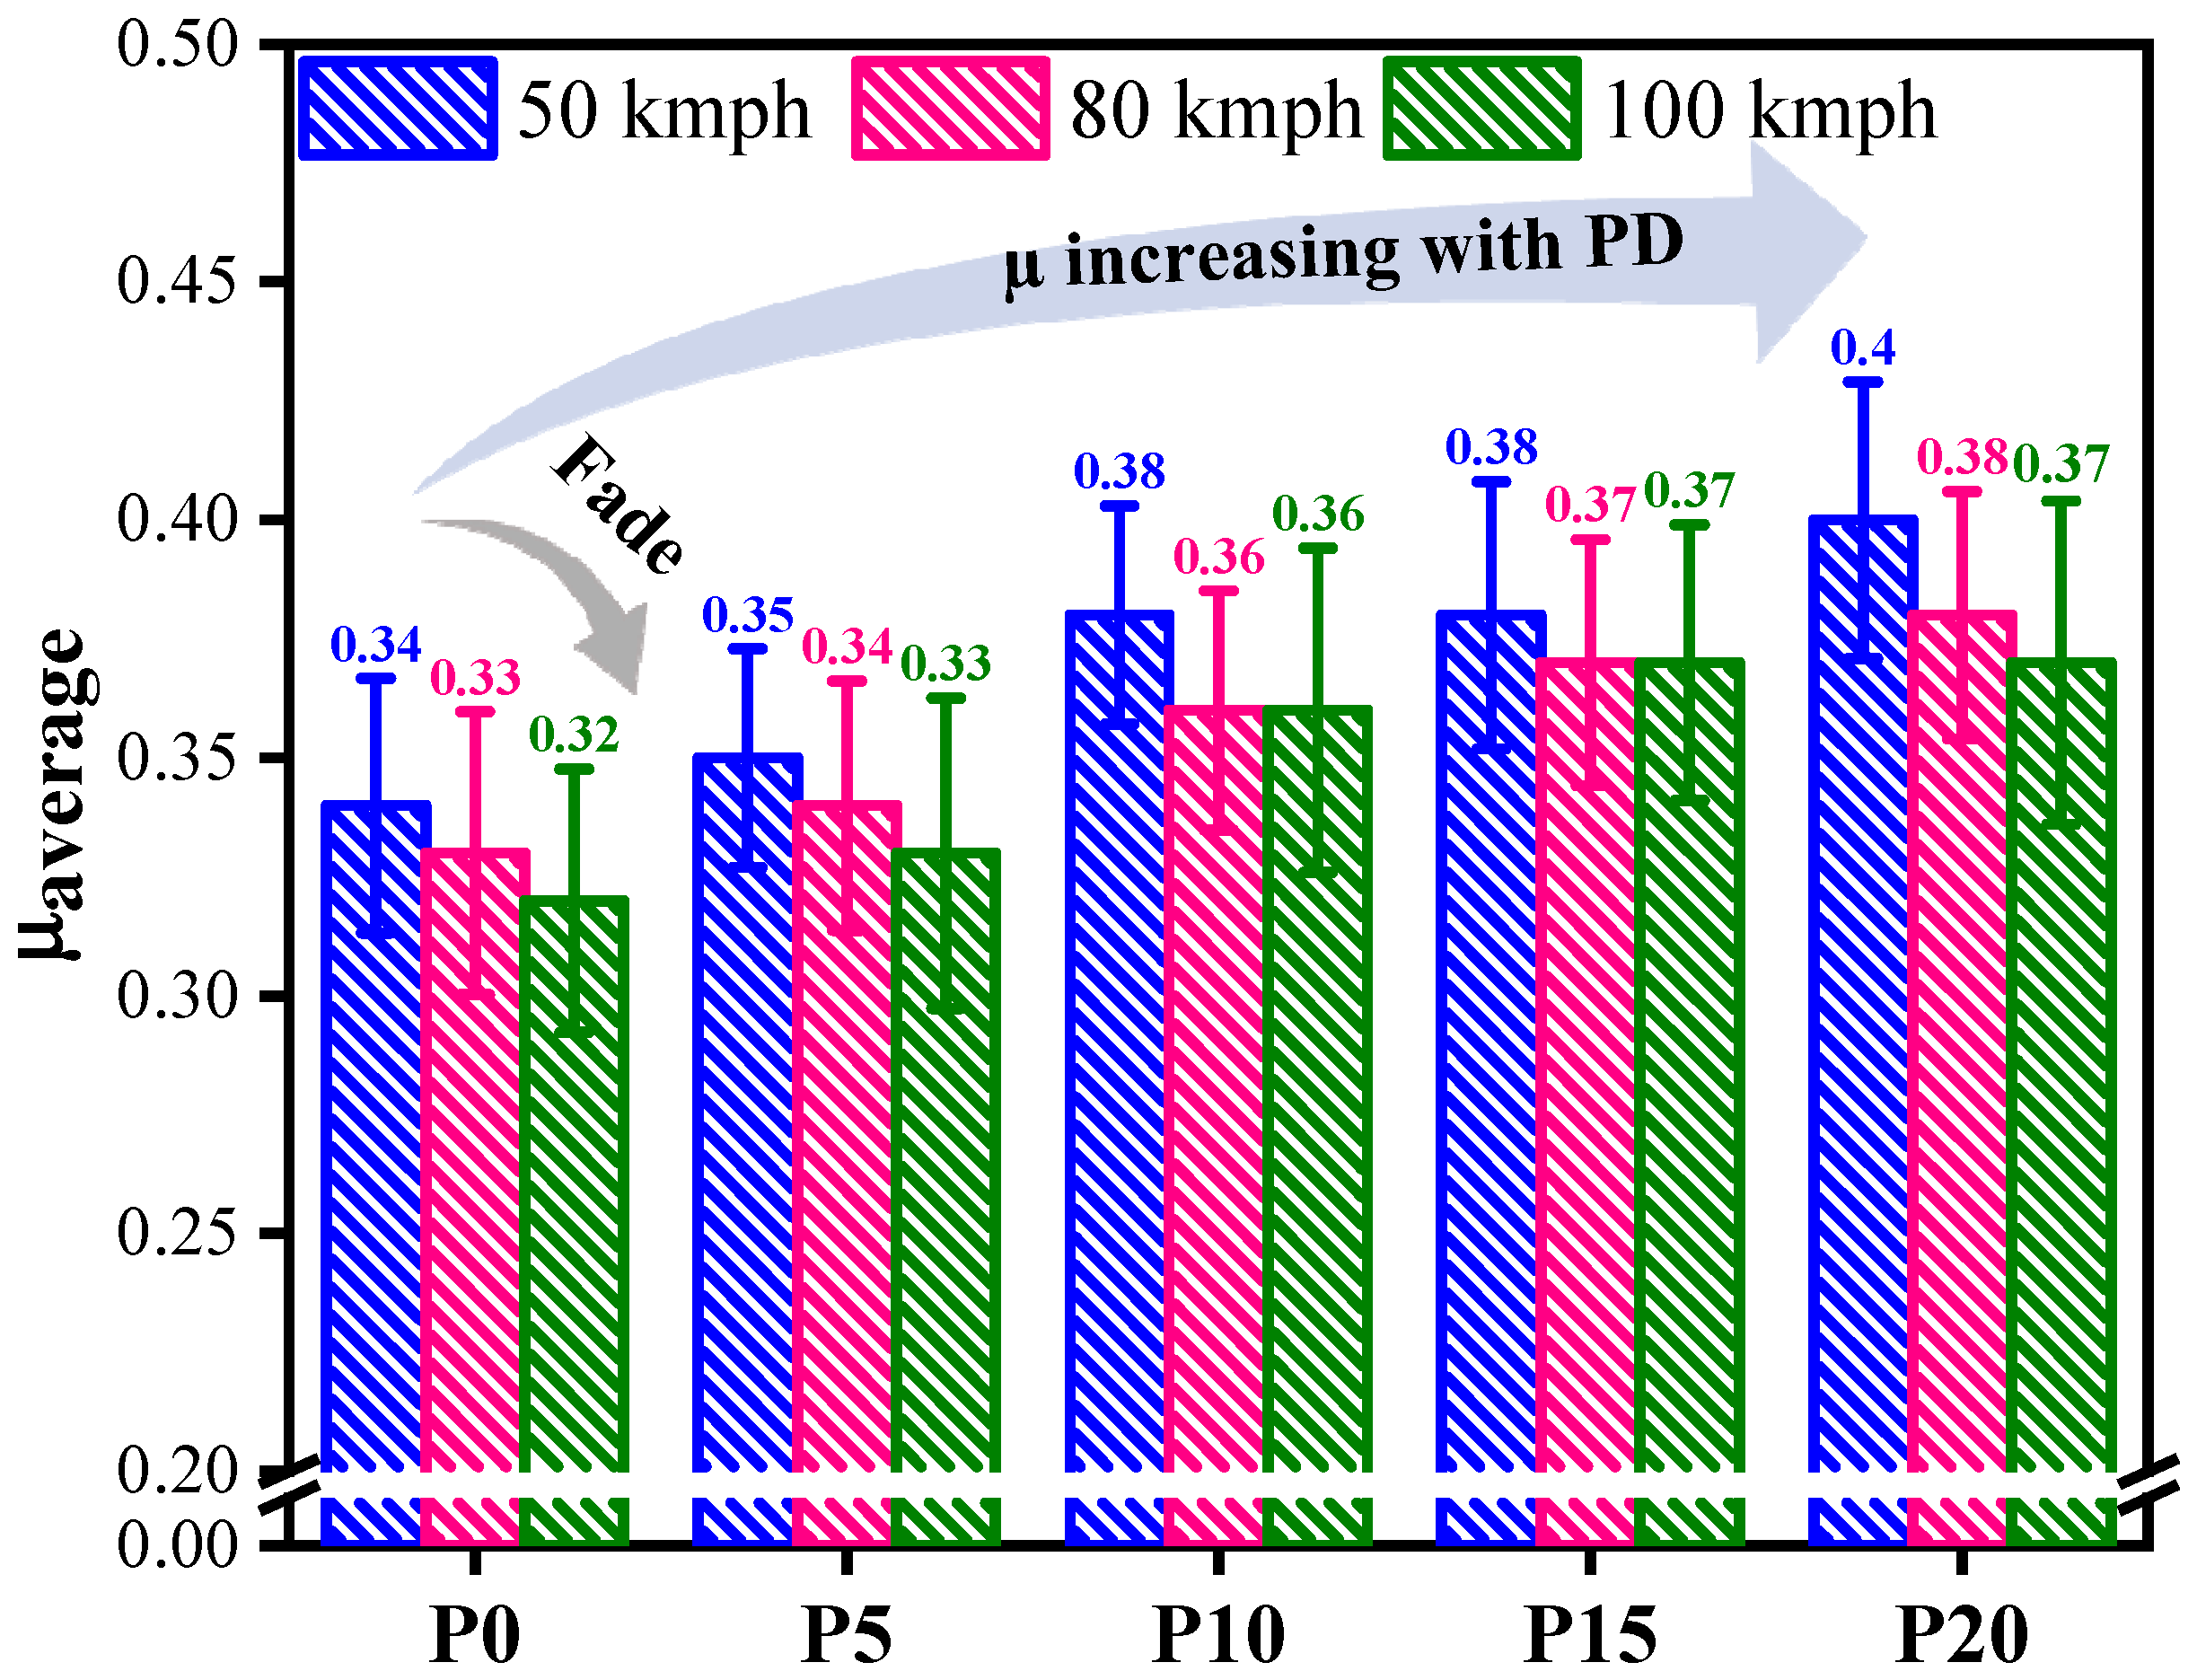
3.2.3. Average μ, Fluctuations in μ (Δμ), and Speed Sensitivity
To assess the stability of µ with different speeds, the average value of µ for 24 brakes during the effectiveness cycle was calculated and represented in Figure 4. As the speed increased the µaverage reduced for all pads due to speed fade. The reduction in µ could be due to the generation of more frictional heat (Q) at the interface as per the following equation [18].
where W is load (N), v is sliding velocity (m/s), g is the acceleration due to gravity (m/s2), and J is the mechanical equivalent of heat (4.186 J/cal). With the increase in PD contents, µaverage increased for each speed, which could be due to the presence of an increasing number of PD particles of higher hardness (6.5 Mohs hardness) and abrasivity in the contact zone, compared to barite (3–4 Mohs hardness). The order of µaverage was as follows.
50 kmph: P20 (0.40) > P15 (0.38) ≈ P10 (0.38) > P5 (0.35) > P0 (0.34)
80 kmph: P20 (0.38) > P15 (0.37) > P10 (0.36) > P5 (0.34) > P0 (0.33)
100 kmph: P20 (0.37) ≈ P15 (0.37) > P10 (0.36) > P5 (0.33) > P0 (0.32)
Figure 5 shows the Δµ (µmax − µmin) at different speeds (50, 80, and 100 kmph). Where µmax and µmin are maximum and minimum values of µ among 24 brakes during the effectiveness cycle.
Ideally, Δµ should be zero. The lesser the value, the better the performance rating, and was as follows, indicating the inclusion of PD was beneficial. This also indicates that PD-containing brake pads should be less susceptible to vibration and noise and this was reported in our earlier paper [10].
For 50 kmph: P0(0.08) > P15(0.07) P20(0.07) P10(0.07) > P5(0.05)
For 80 kmph: P0(0.08) > P15(0.07) P20(0.07) > P10(0.06) P5(0.06)
For 100 kmph: P0(0.09) ≈ P5(0.09)P10(0.9) > P15(0.08) P20(0.08)
3.2.4. Speed Sensitivity
The variation of the speed spread % (SS %) with respect to pressure/deceleration is represented by speed sensitivity (Figure 6).
The SS is defined as the ratio of µ at the higher speed to the lower speed and expressed in terms of %. Ideally, a higher value with minimal undulation is imperative to meet the demand of an efficient braking. Figure 6 shows % SS in the range of 109–86 and 104–88 for severe and mild conditions respectively as a function of deceleration. Inclusion of PD appeared to be beneficial (barring P20) especially in severe braking conditions and overall, P15 was the best in both the conditions.
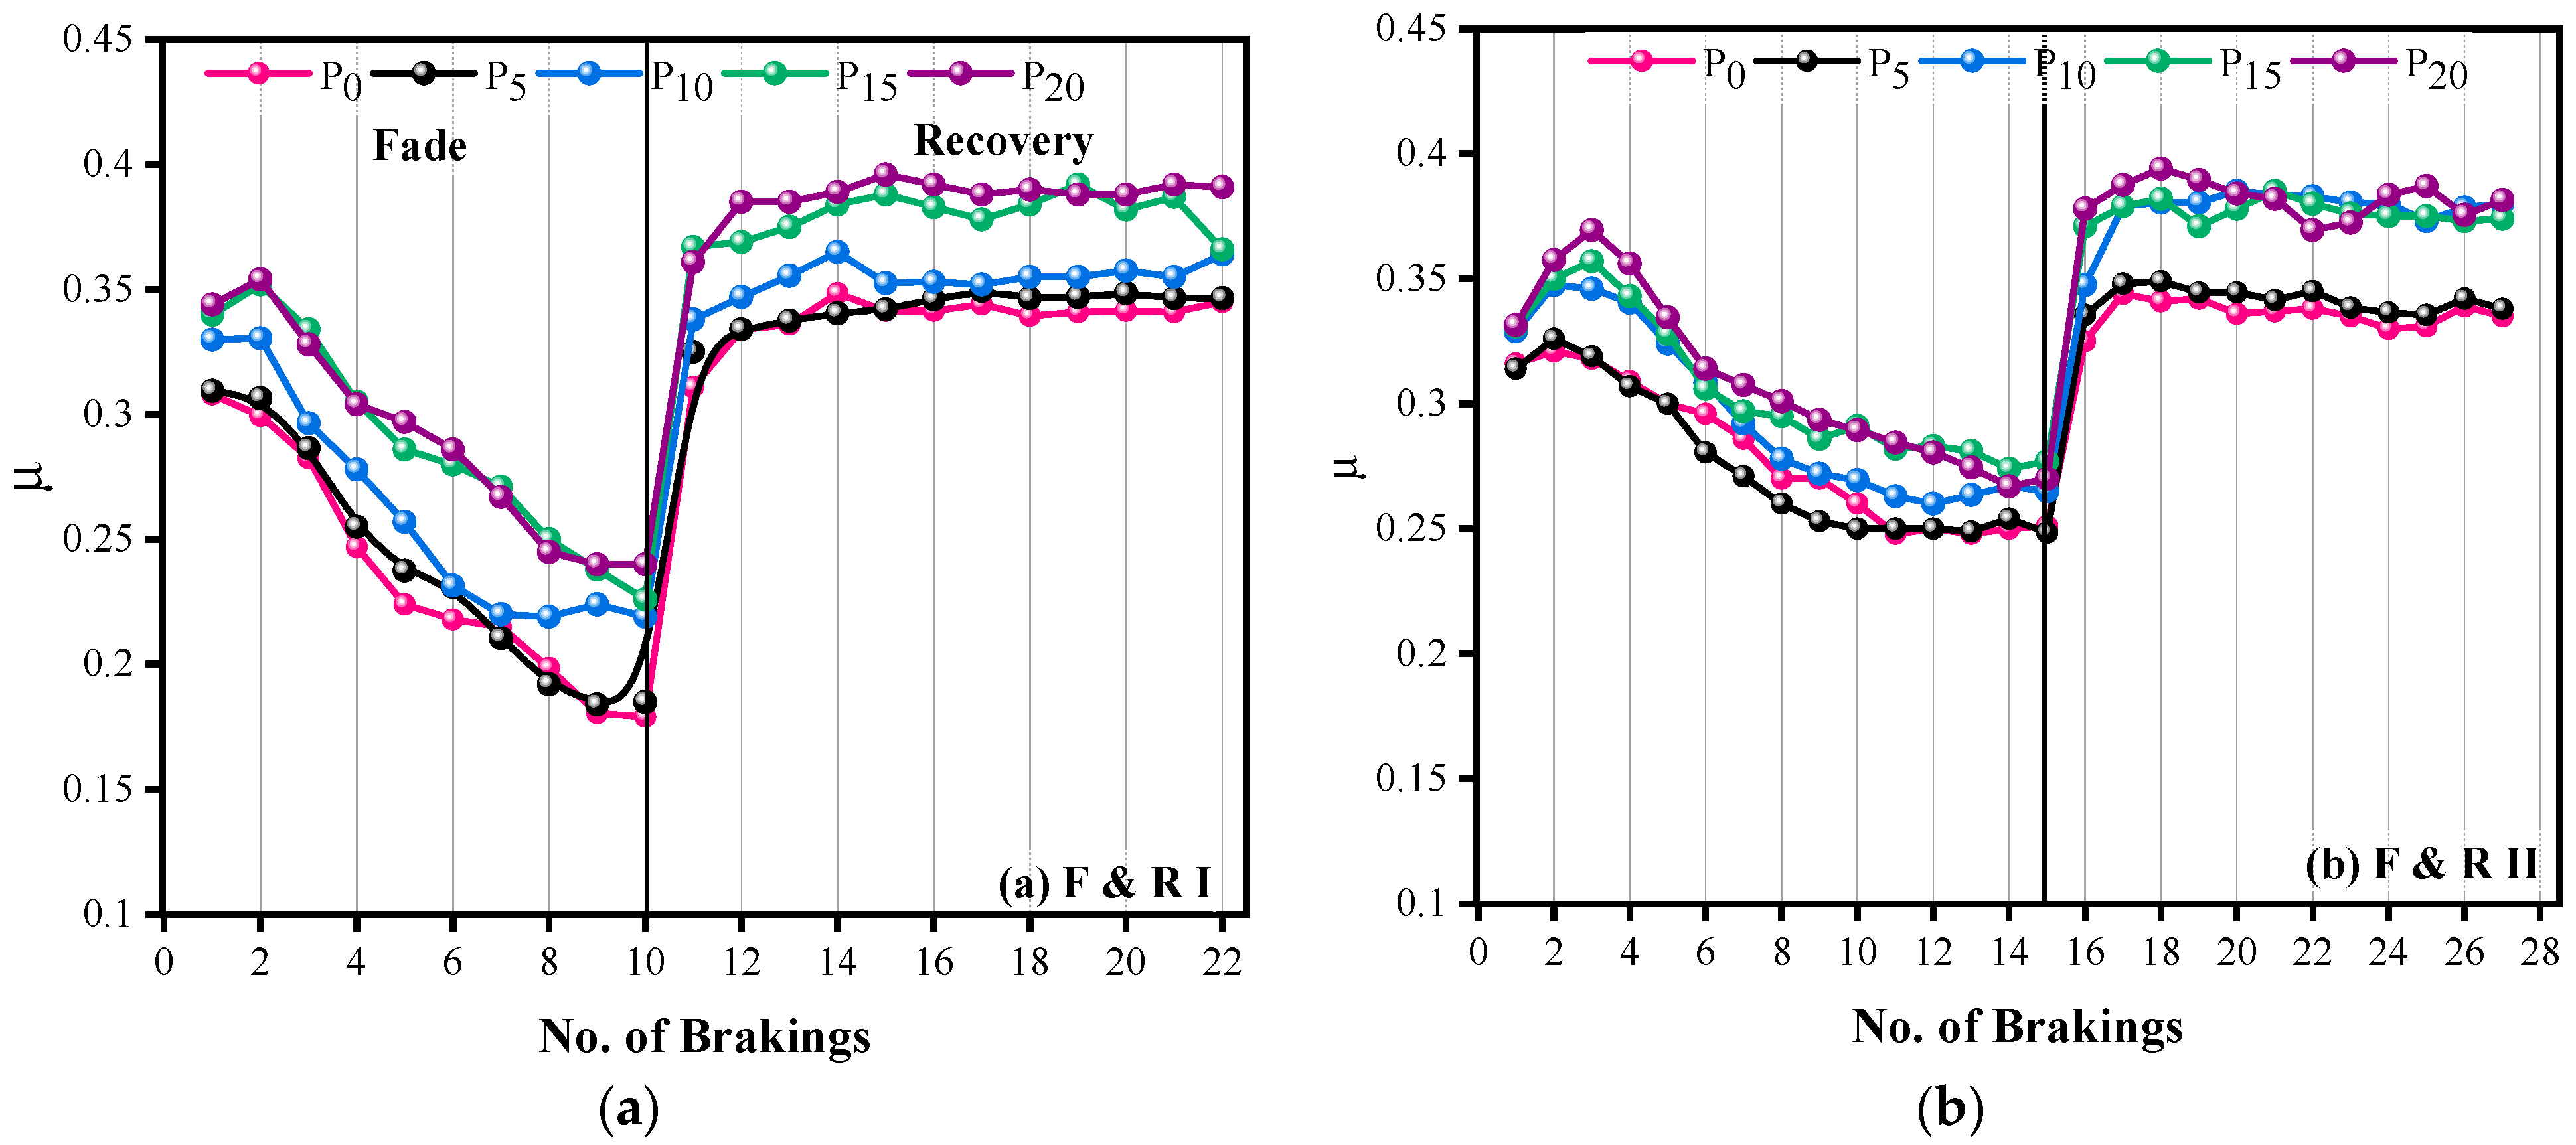
3.2.5. Fade and Recovery Studies (Temperature Sensitivity)
A separate braking cycle (called fade and recovery cycle, Figure 7) is inbuilt during the schedule of braking. During braking, the contact/flash temperature can be high, up to 600 [19]. Reduction in µ due to increase in high temperature is known as temperature-fade and revival of the µ at normal temperature posterior to braking induced thermal elevation is known as recovery. This unwanted behavior (fade) is because of degradation of organic ingredients, changes in mechanical properties, previous tribological history of the material, nature of tribo-film, etc. [15,20]. For ideal material, fade should be minimal and recovery should be high. The parameters such as μfade, μrecovery, % fade ratio (FR), % recovery ratio (RR), and temperature rise in the tribo-couples (brake-pads and disc) are considered for better understanding of F&R performance.
Figure 7a,b shows the variation in the μ as a function of number of brakings during fade and recovery cycles (F&R) I and II respectively. It is observed from Figure 7 that μ decreased drastically after the 2nd and 3rd braking during the first and second cycle respectively. However, for Cycle II, less decline in μ was observed. As the PD contents increased the extent of the decline in μ diminished for both the cases, again a beneficial feature. In the case of recovery friction level was stable and recovery performance improved with the inclusion of PD. Hence the inclusion of PD led to improved F&R performance, which is attuned with the previous results [7]. Furthermore, a comprehensive study, and data extracted from the curve are discussed in the next section.
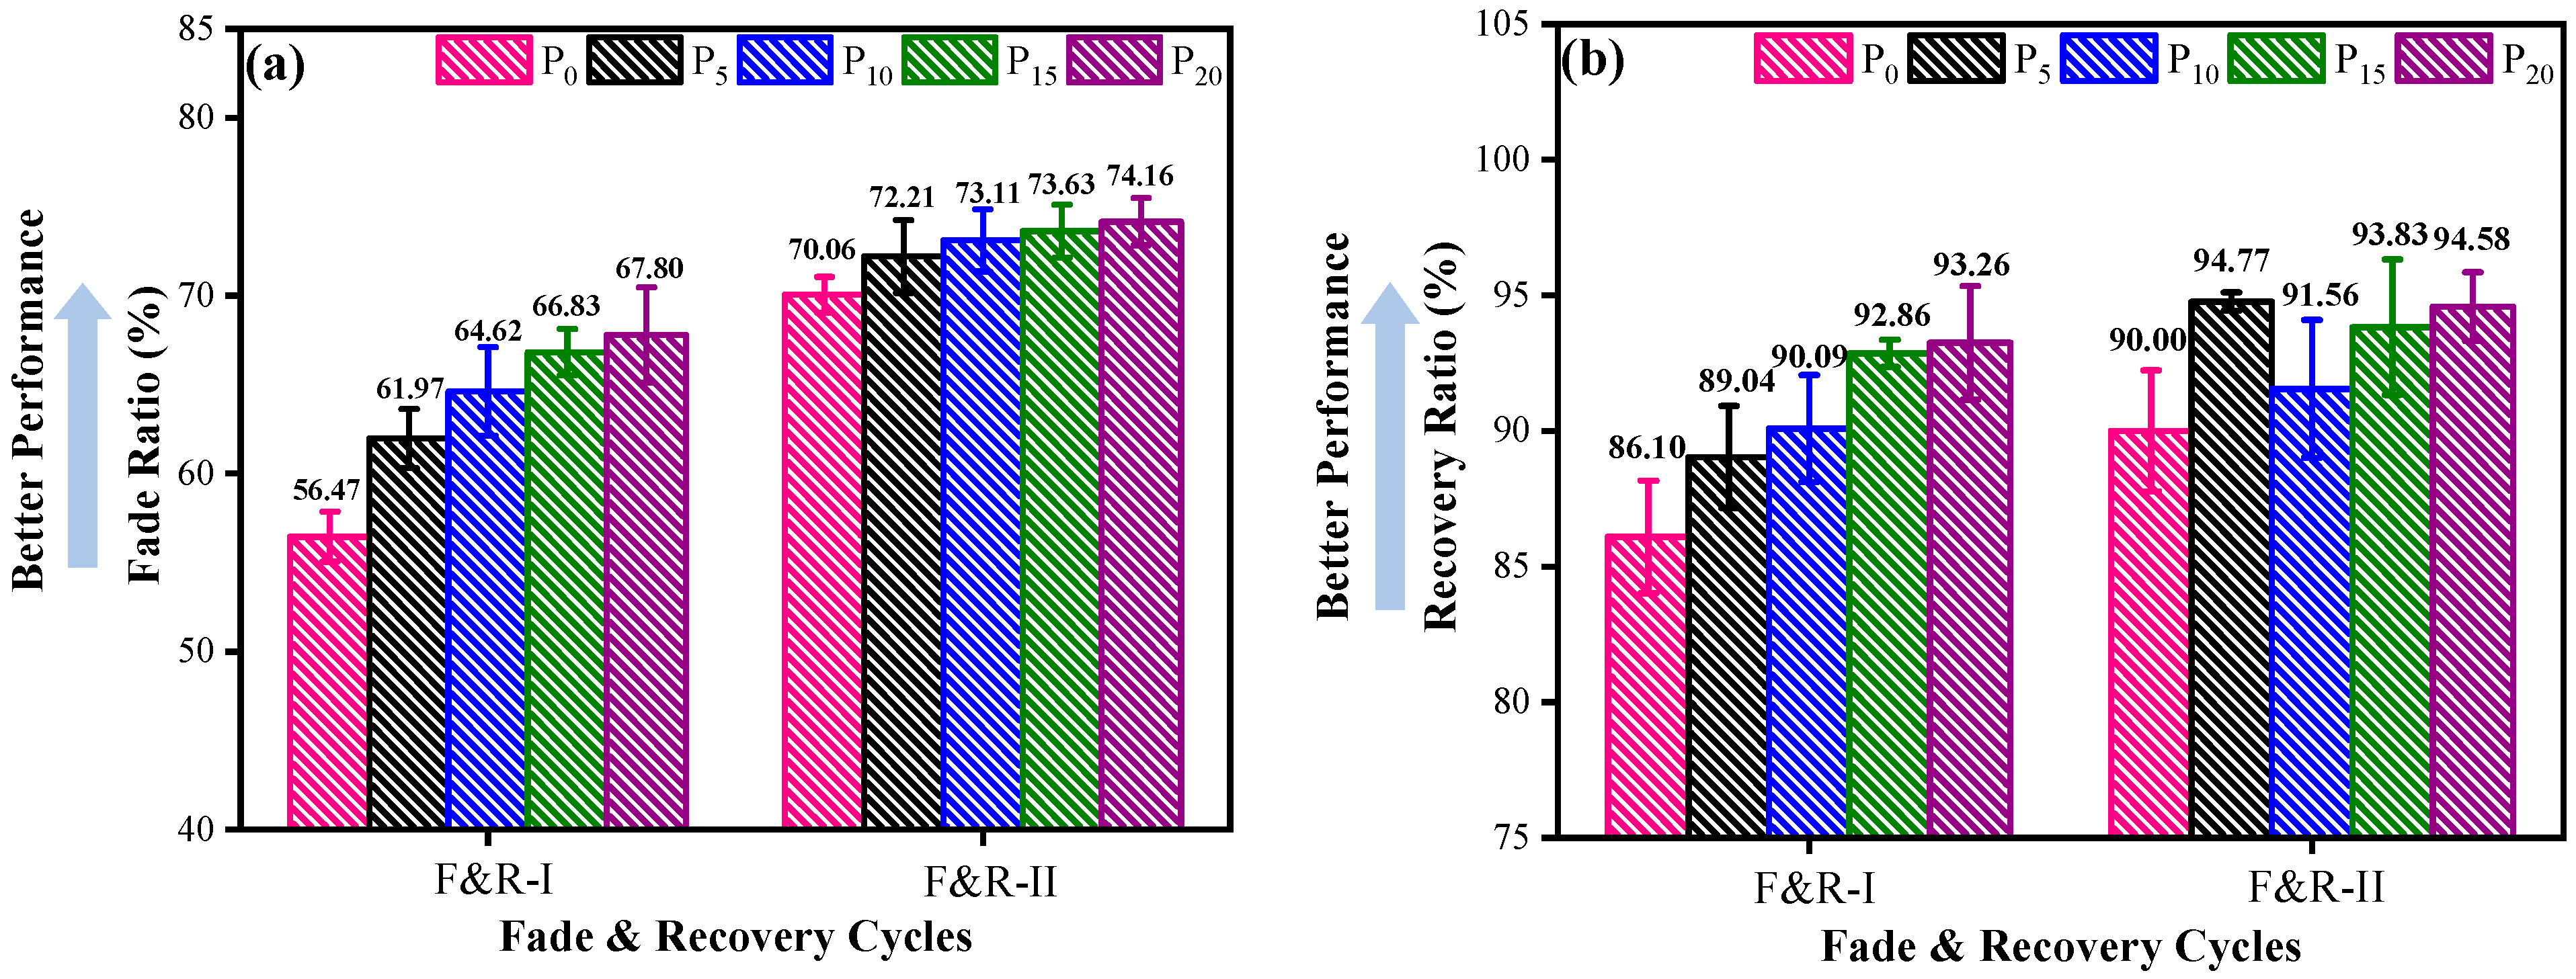
Figure 8 shows the fade ratio and recovery ratio for developed brake-pads. Fade ratio (FR) is described as the status of the reduction in friction level during harsh braking. It is defined as the % ratio of µmin to µmax during fade cycles while recovery ratio (RR) is described as the status of retrieved friction levels after fade cycles. Likewise, FR is defined as the % ratio of µmin to µmax during recovery cycles. Higher values of FR/RR are desirable for efficient pads. Overall, both the ratios were higher for Cycle II. Addition of PD enhanced the fade ratio almost regularly and for P20 20% enhancement was recorded compared to P0. However, no significant difference was observed during the Fade II cycle. The order of fade performance in both cycles was, P20 > P15 > P10 > P5 > P0.
Similar trends were observed for RR for both the cycles confirming benefits endowed by inclusion of increasing amount of PD.
Figure 9 shows the average values of µ during fade and recovery Cycles I and II. Brake pads without PD showed abysmal fade behavior. However, the µfade increased by more than 33% by adding 20% PD (Figure 9) for fade I. No significant difference in µfade during fade II was observed.
Likewise, µrecovery increased by 18% for P20 in both cases. The µrecovery was higher than µfade which was mainly due to change in the rheology of the friction film and hardening effects underneath the friction film. At higher temperature the film is viscous while during the recovery cycle, owing to cooling it is converted to a solid form. This phenomenon also boosts the wear debris formation and wear debris triggers the third body abrasion on the contact zone, hence µrecovery is increased. This is in agreement with the observation reported in the literature [7,13,21].
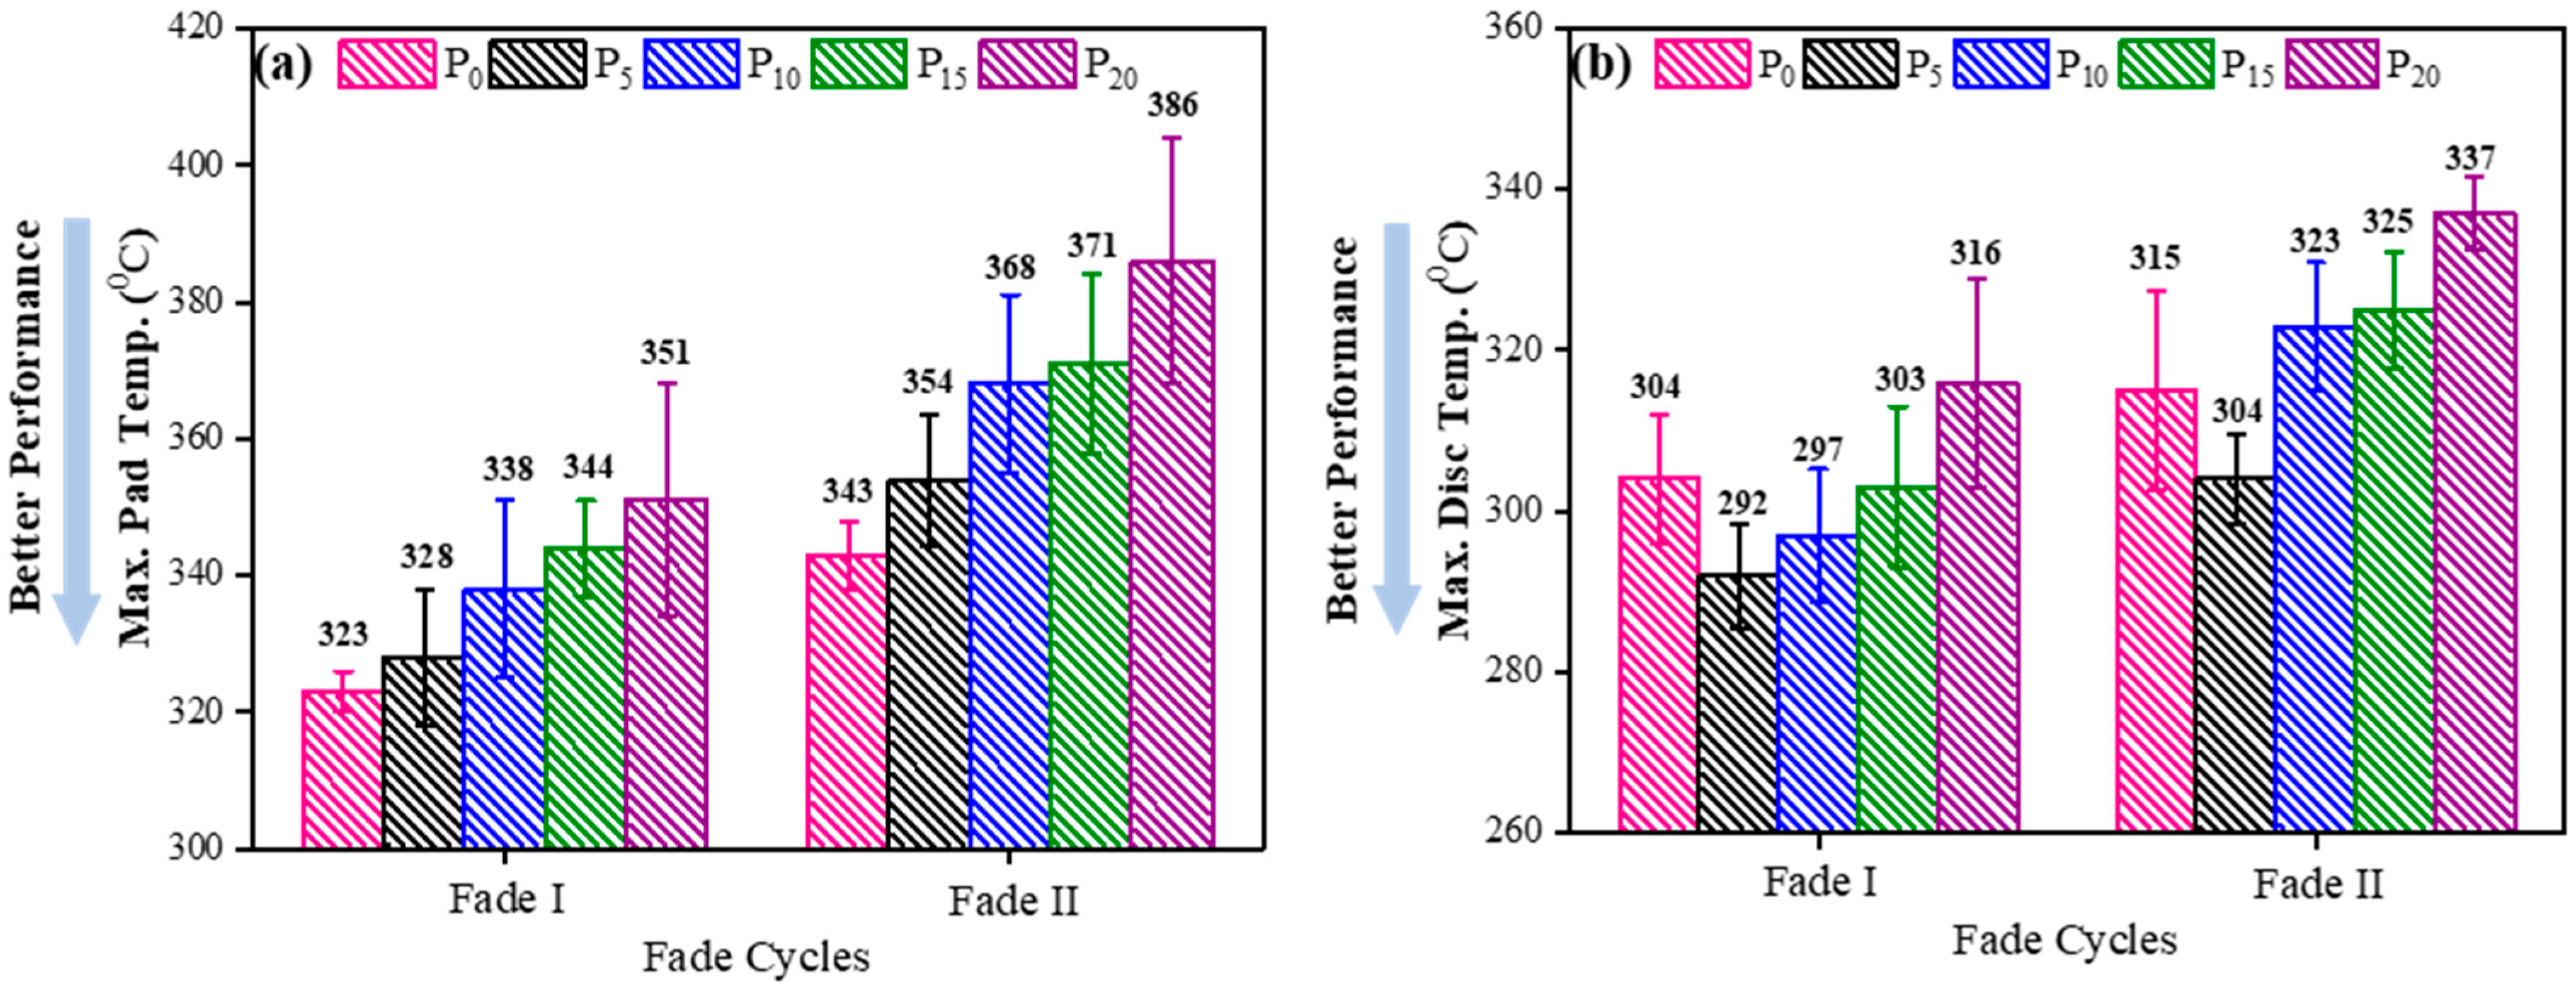
Figure 10 shows the rise in the temperature of brake pads (thermocouple 5 mm away from the tribo-surface and in the centre of pad) and disc during the fade cycles, and is used for addressing the counterface friendliness of brake pads. For good quality pads, temperature rise should be as low as possible for both parts. The temperature rise is dependent on various factors, such as μ level, thermal conductivity and diffusivity, porosity, and ambient temperature. The heat generation increased with the addition of PD in brake pads owing to a higher μ level (Figure 4). The thermal conductivity on the other hand reduced with the addition of PD. Both factors were favorable for the rise in temperature of both the parts with the increase in PD contents, barring P5.
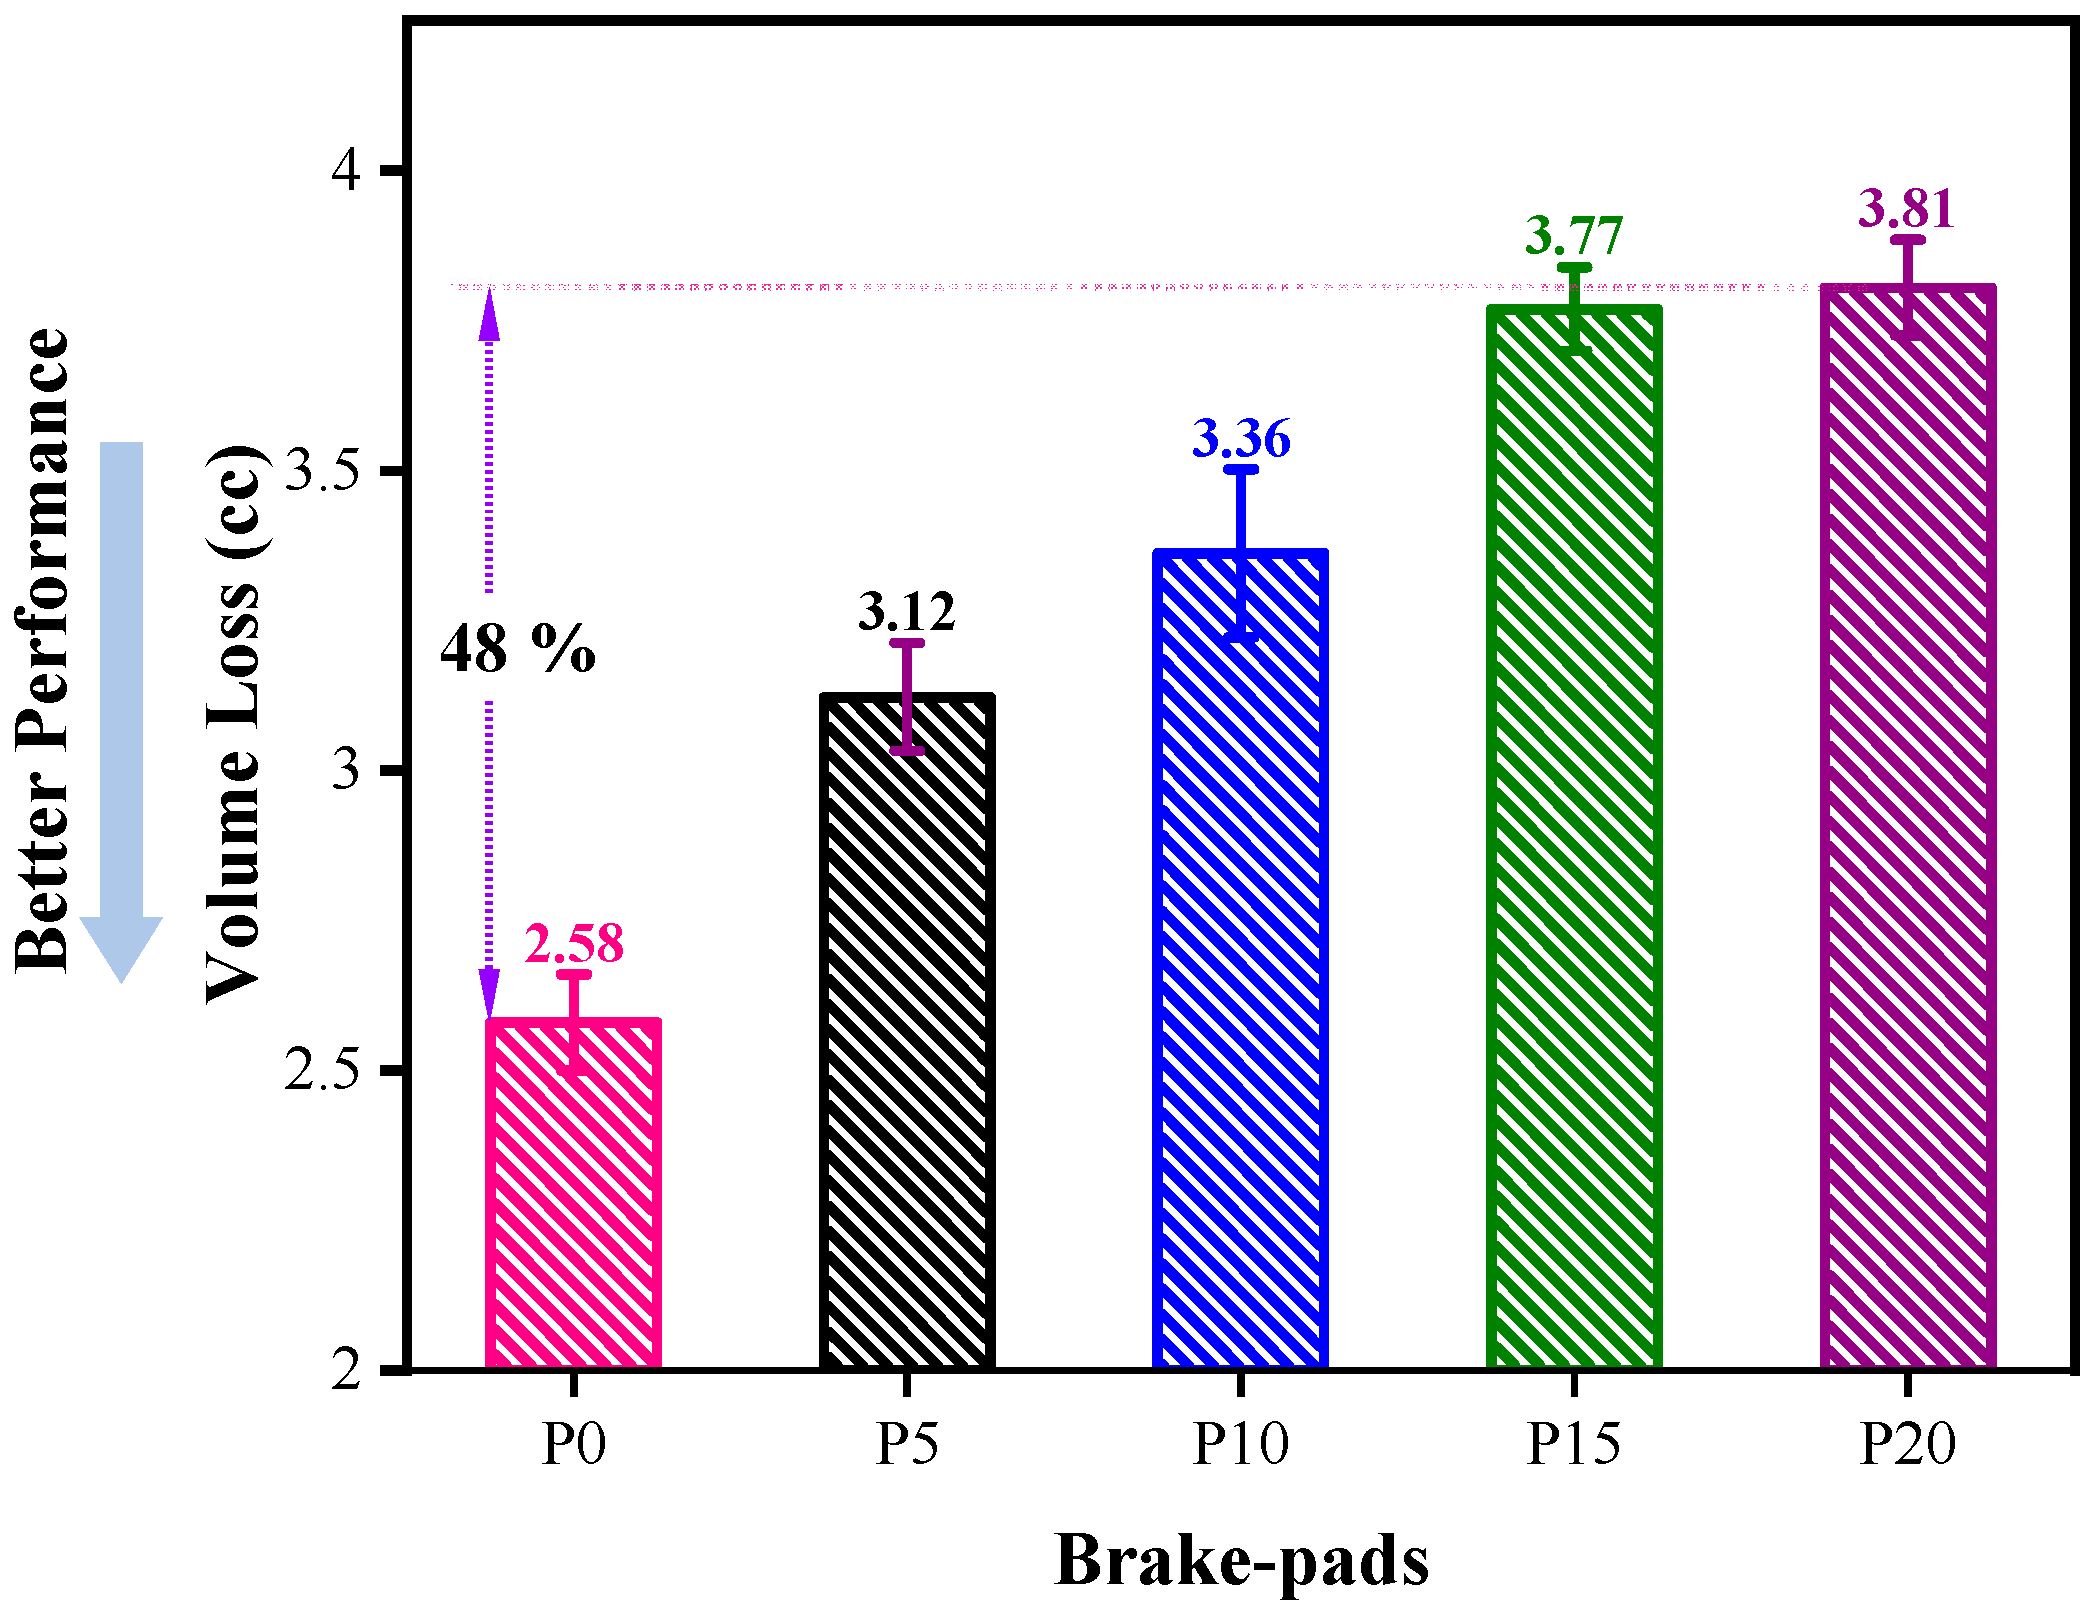
3.3. Wear Characteristics and Worn Surface Studies
The wear loss (volume) of the brake pads is shown in Figure 11 which indicated significant increase in wear (≈48%) for 20 wt.% PD based pads, and the higher the contents, the higher was the wear. This was not a desirable feature and was attributed to decreased hardness as per Archard’s wear equation; wear is inversely proportional to hardness [16]. Another reason could be a poor adhesion of PD particles with phenolic resin compared to barite particles. Cai et al. [22] reported that the particles of inorganic compounds such as mullite having less adhesion with the phenolic matrix led to higher wear.
3.4. Worn Surface Analysis by SEM-EDX
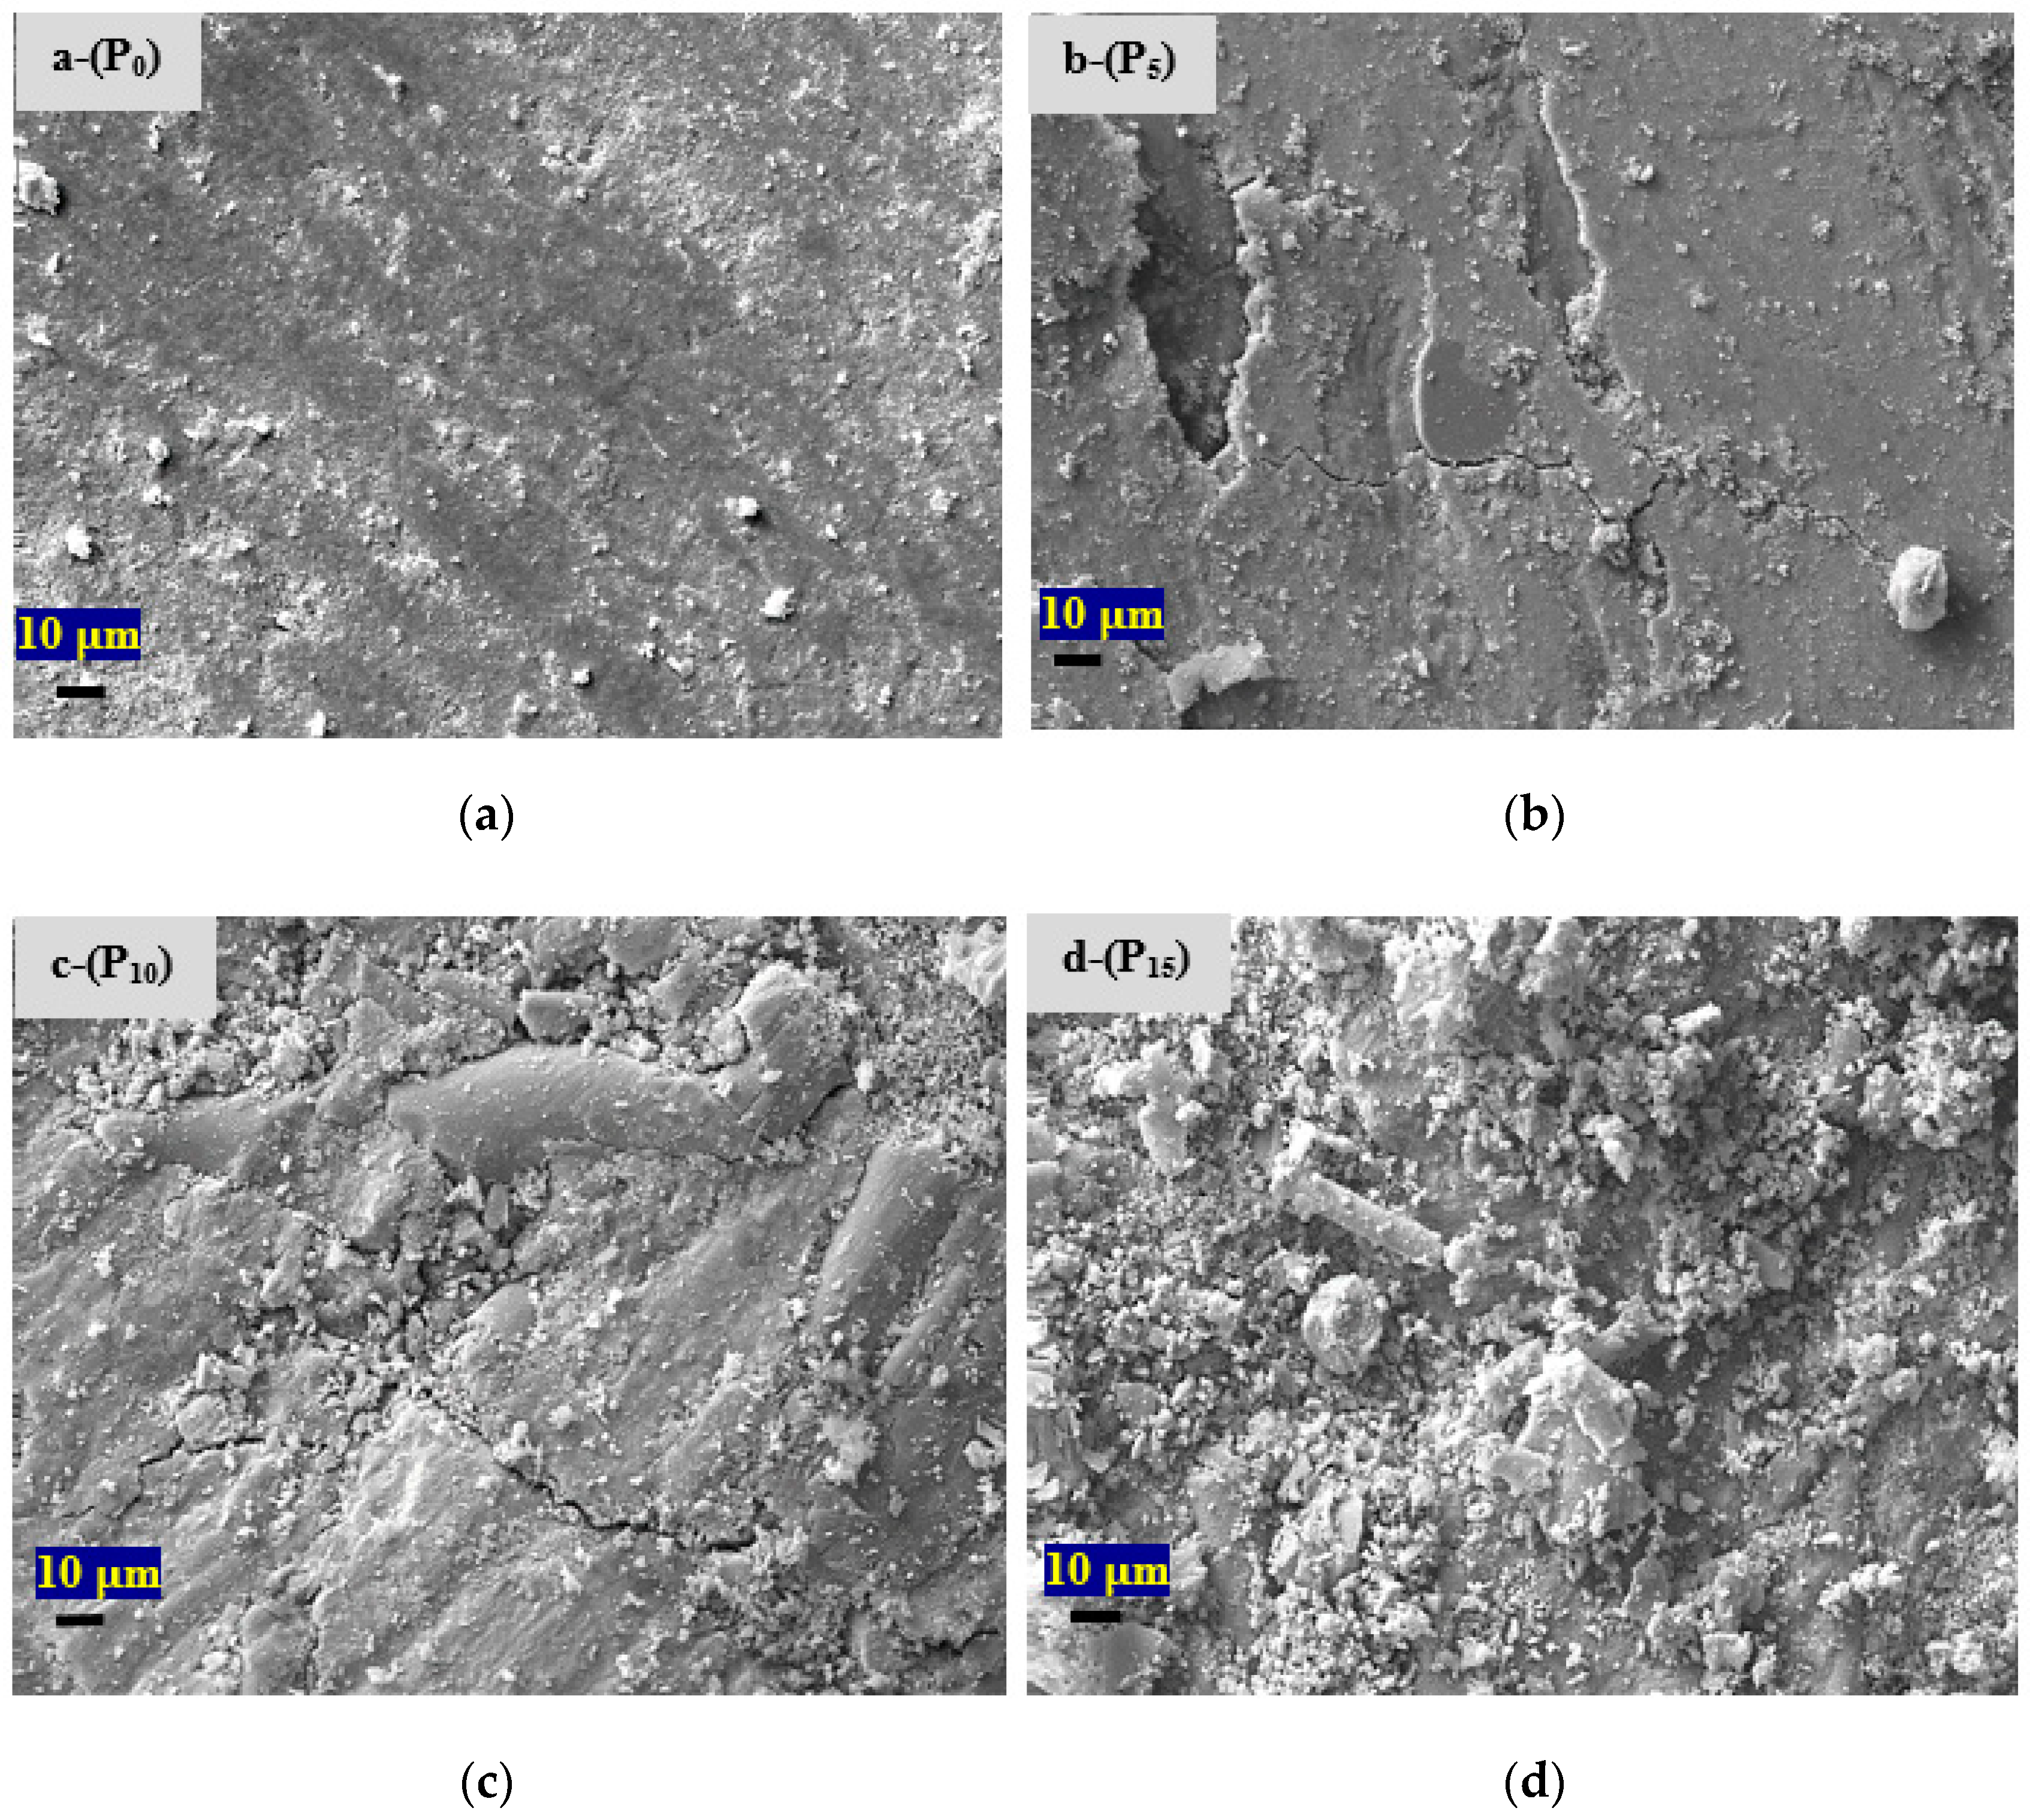
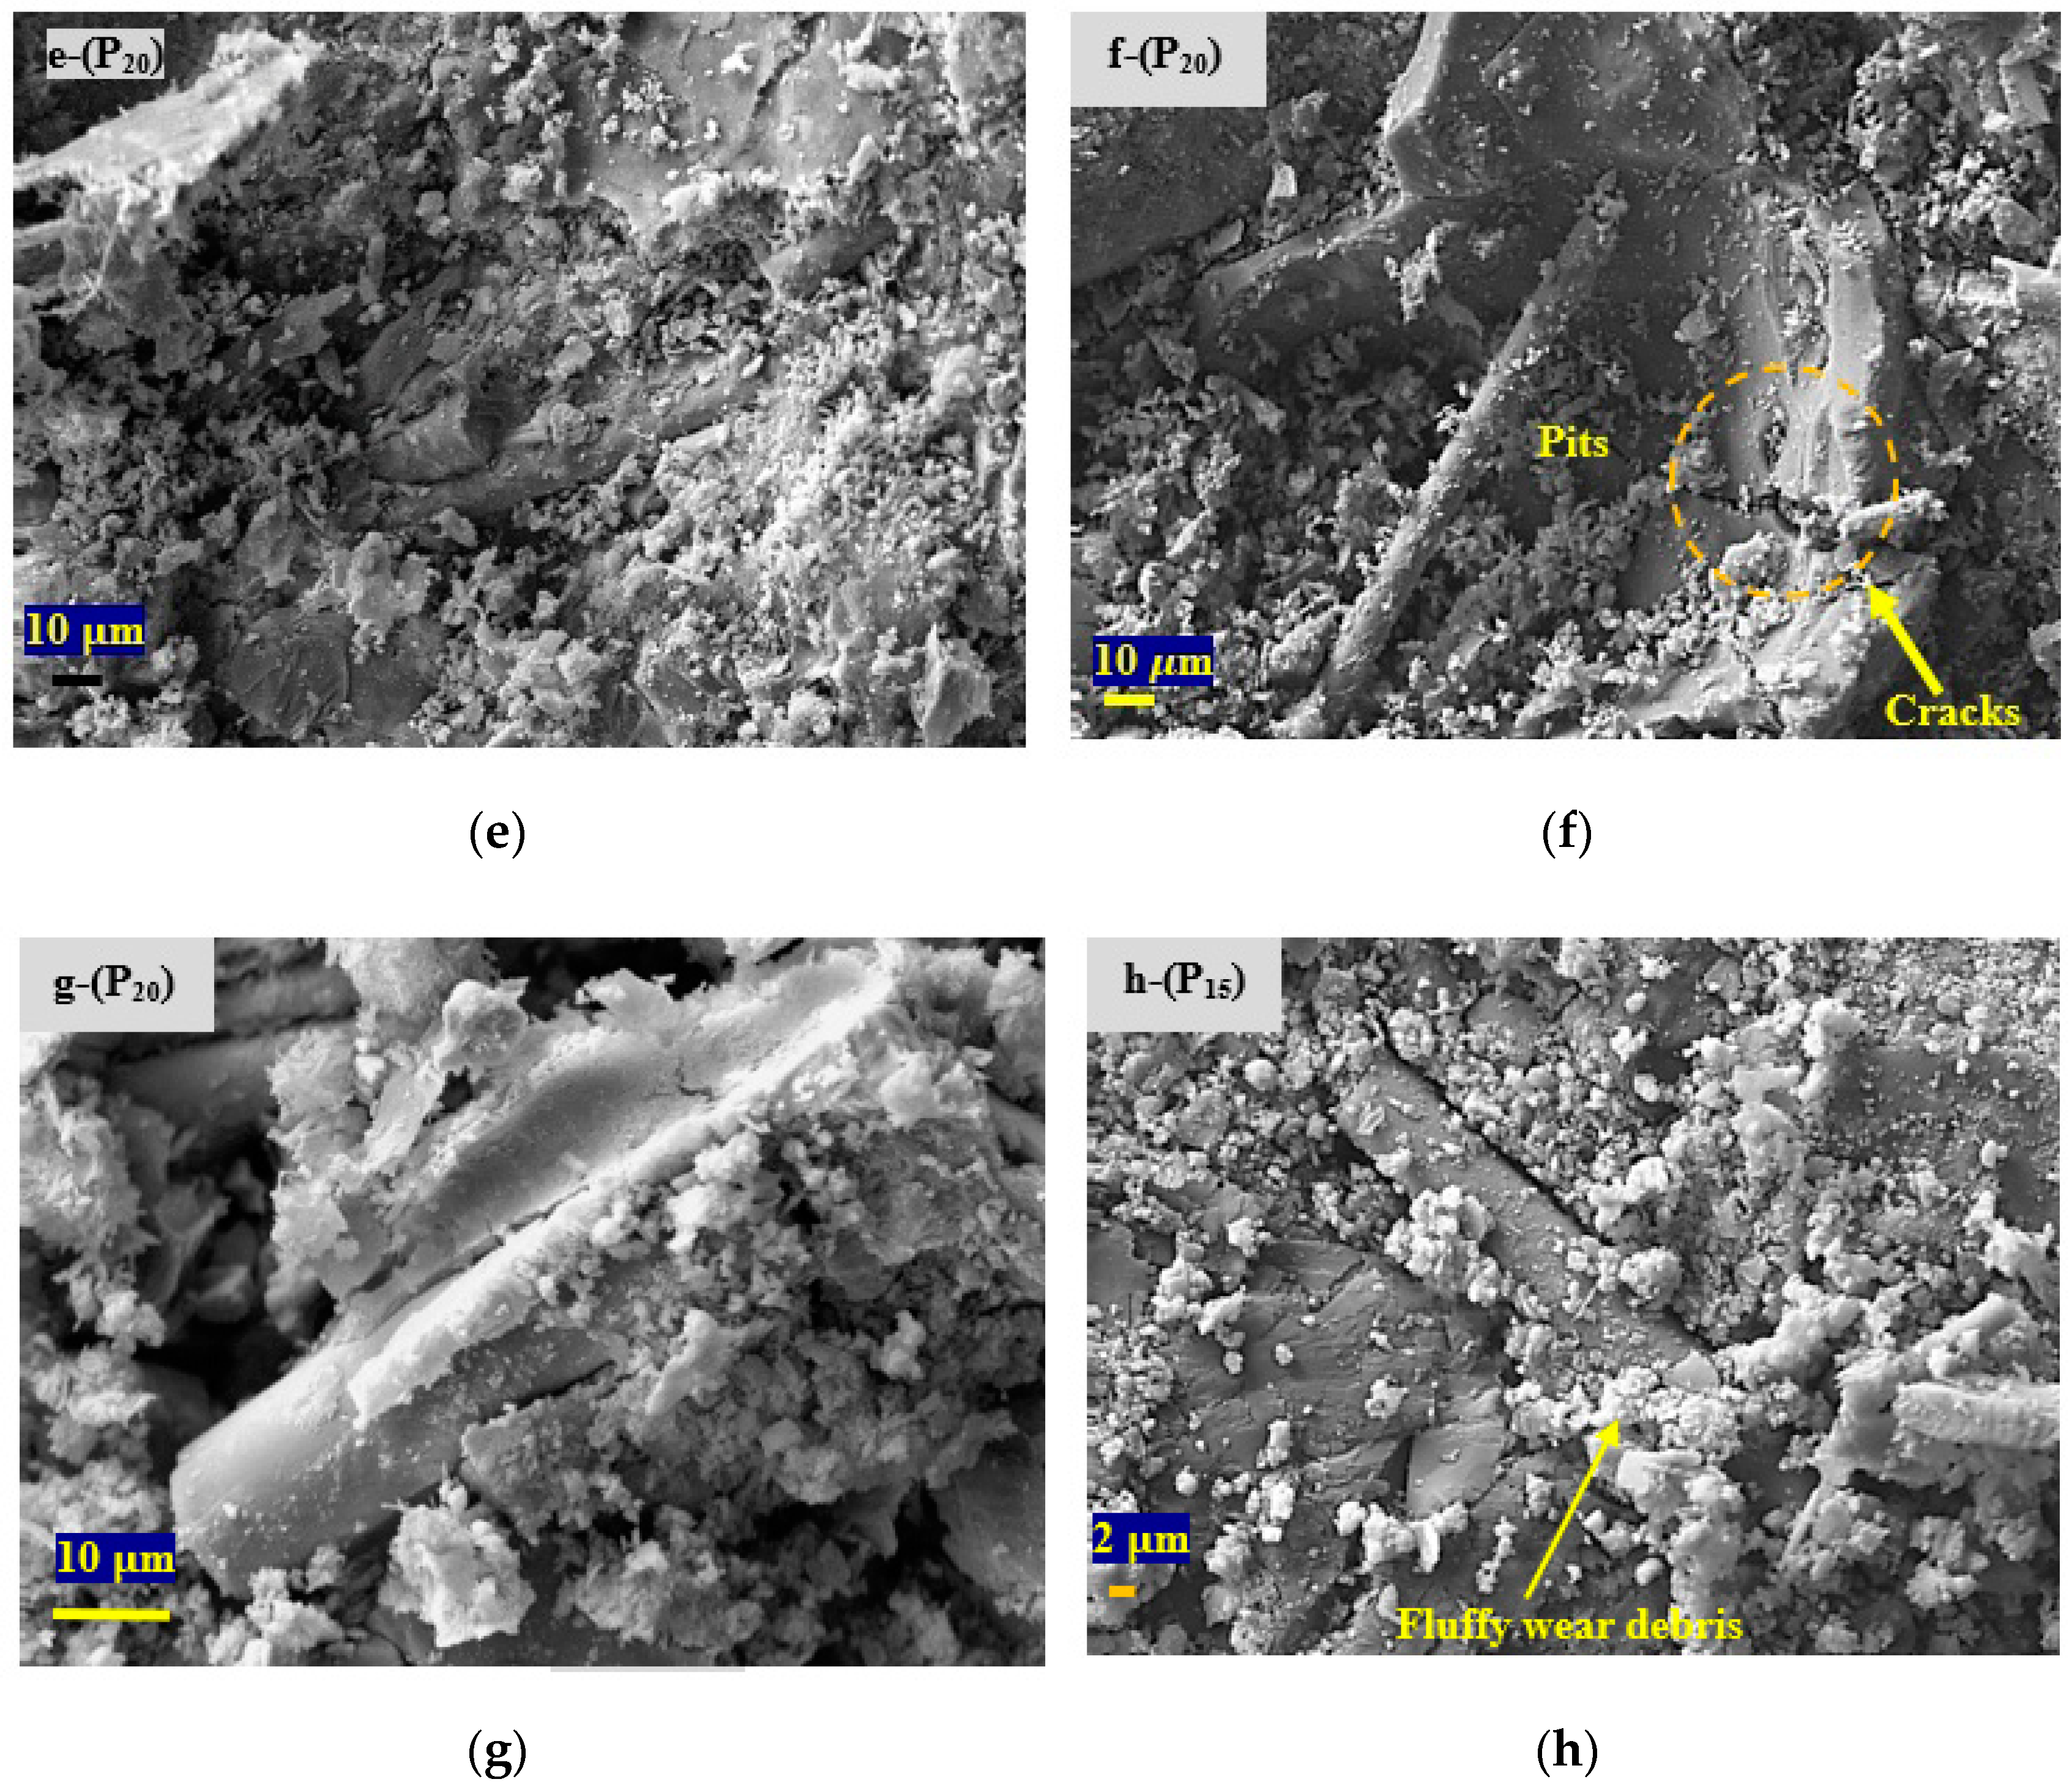
Worn surfaces of pads and discs were studied with SEM and EDX and collected in Figure 12, Figure 13 and Figure 14. SEM micrographs of the worn pads are arranged in the order of increasing wear in Figure 12. The distinct difference in the topography supporting the increase in wear was in the form of increasing extent of secondary plateaus, back transferred wear debris which was trapped in the pits, exposed and pulled out fibers and large sized particles, enhanced debonding (filler-matrix/fiber-matrix), cracks, etc. The surface of P20 was excessively rough and full of porous debris, damaged fibers, etc., which supports its highest wear. Figure 12f–h are for different locations for P20 and P15 showing various different features in details.
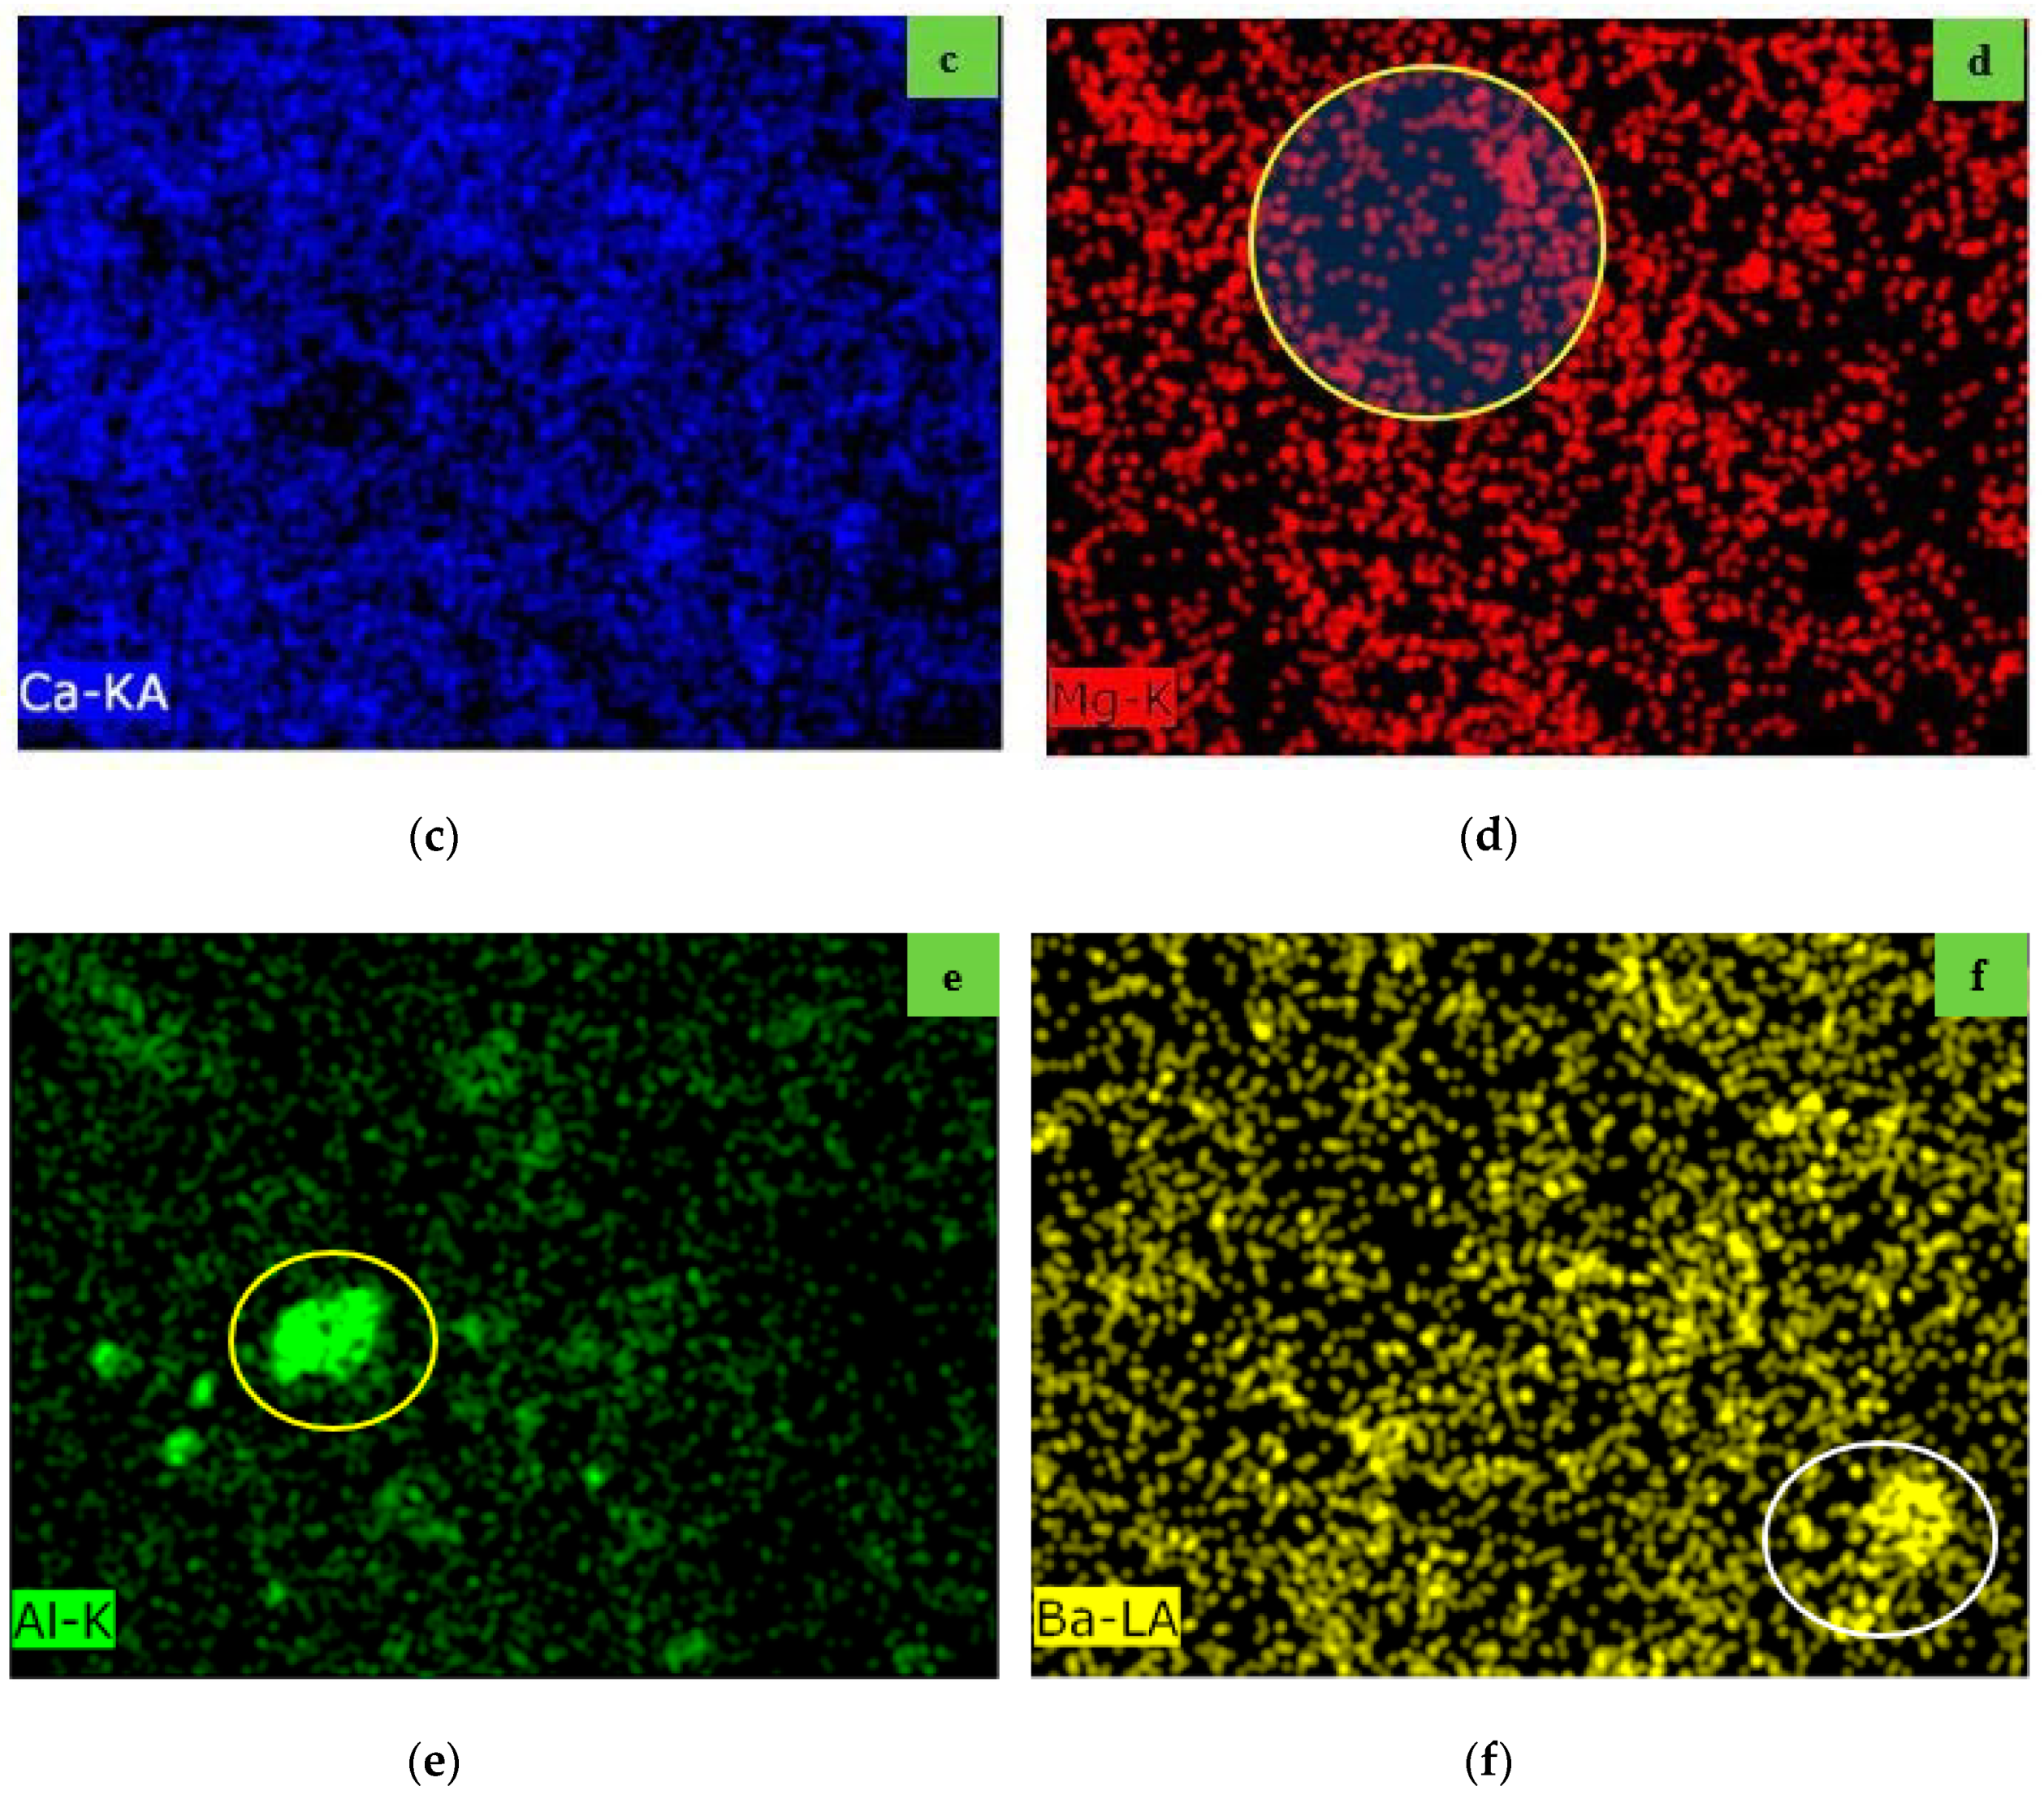
Figure 13 shows micrographs and corresponding EDX data in the form of dot maps. It is slightly difficult to identify Promaxon-D on the surface since PD and rockwool fibers have common elements Si, Ca, and O. The only difference is of Mg, which is absent in PD. As seen in marked portion in Figure 13d (Mg dot map), Mg is absent. This portion definitely indicates the presence of PD particles isolated from the debris of rockwool fibers. Similarly, alumina particles and barite particles can be identified as marked in the Al dot map (Figure 13e) and Ba dot map (Figure 13f).
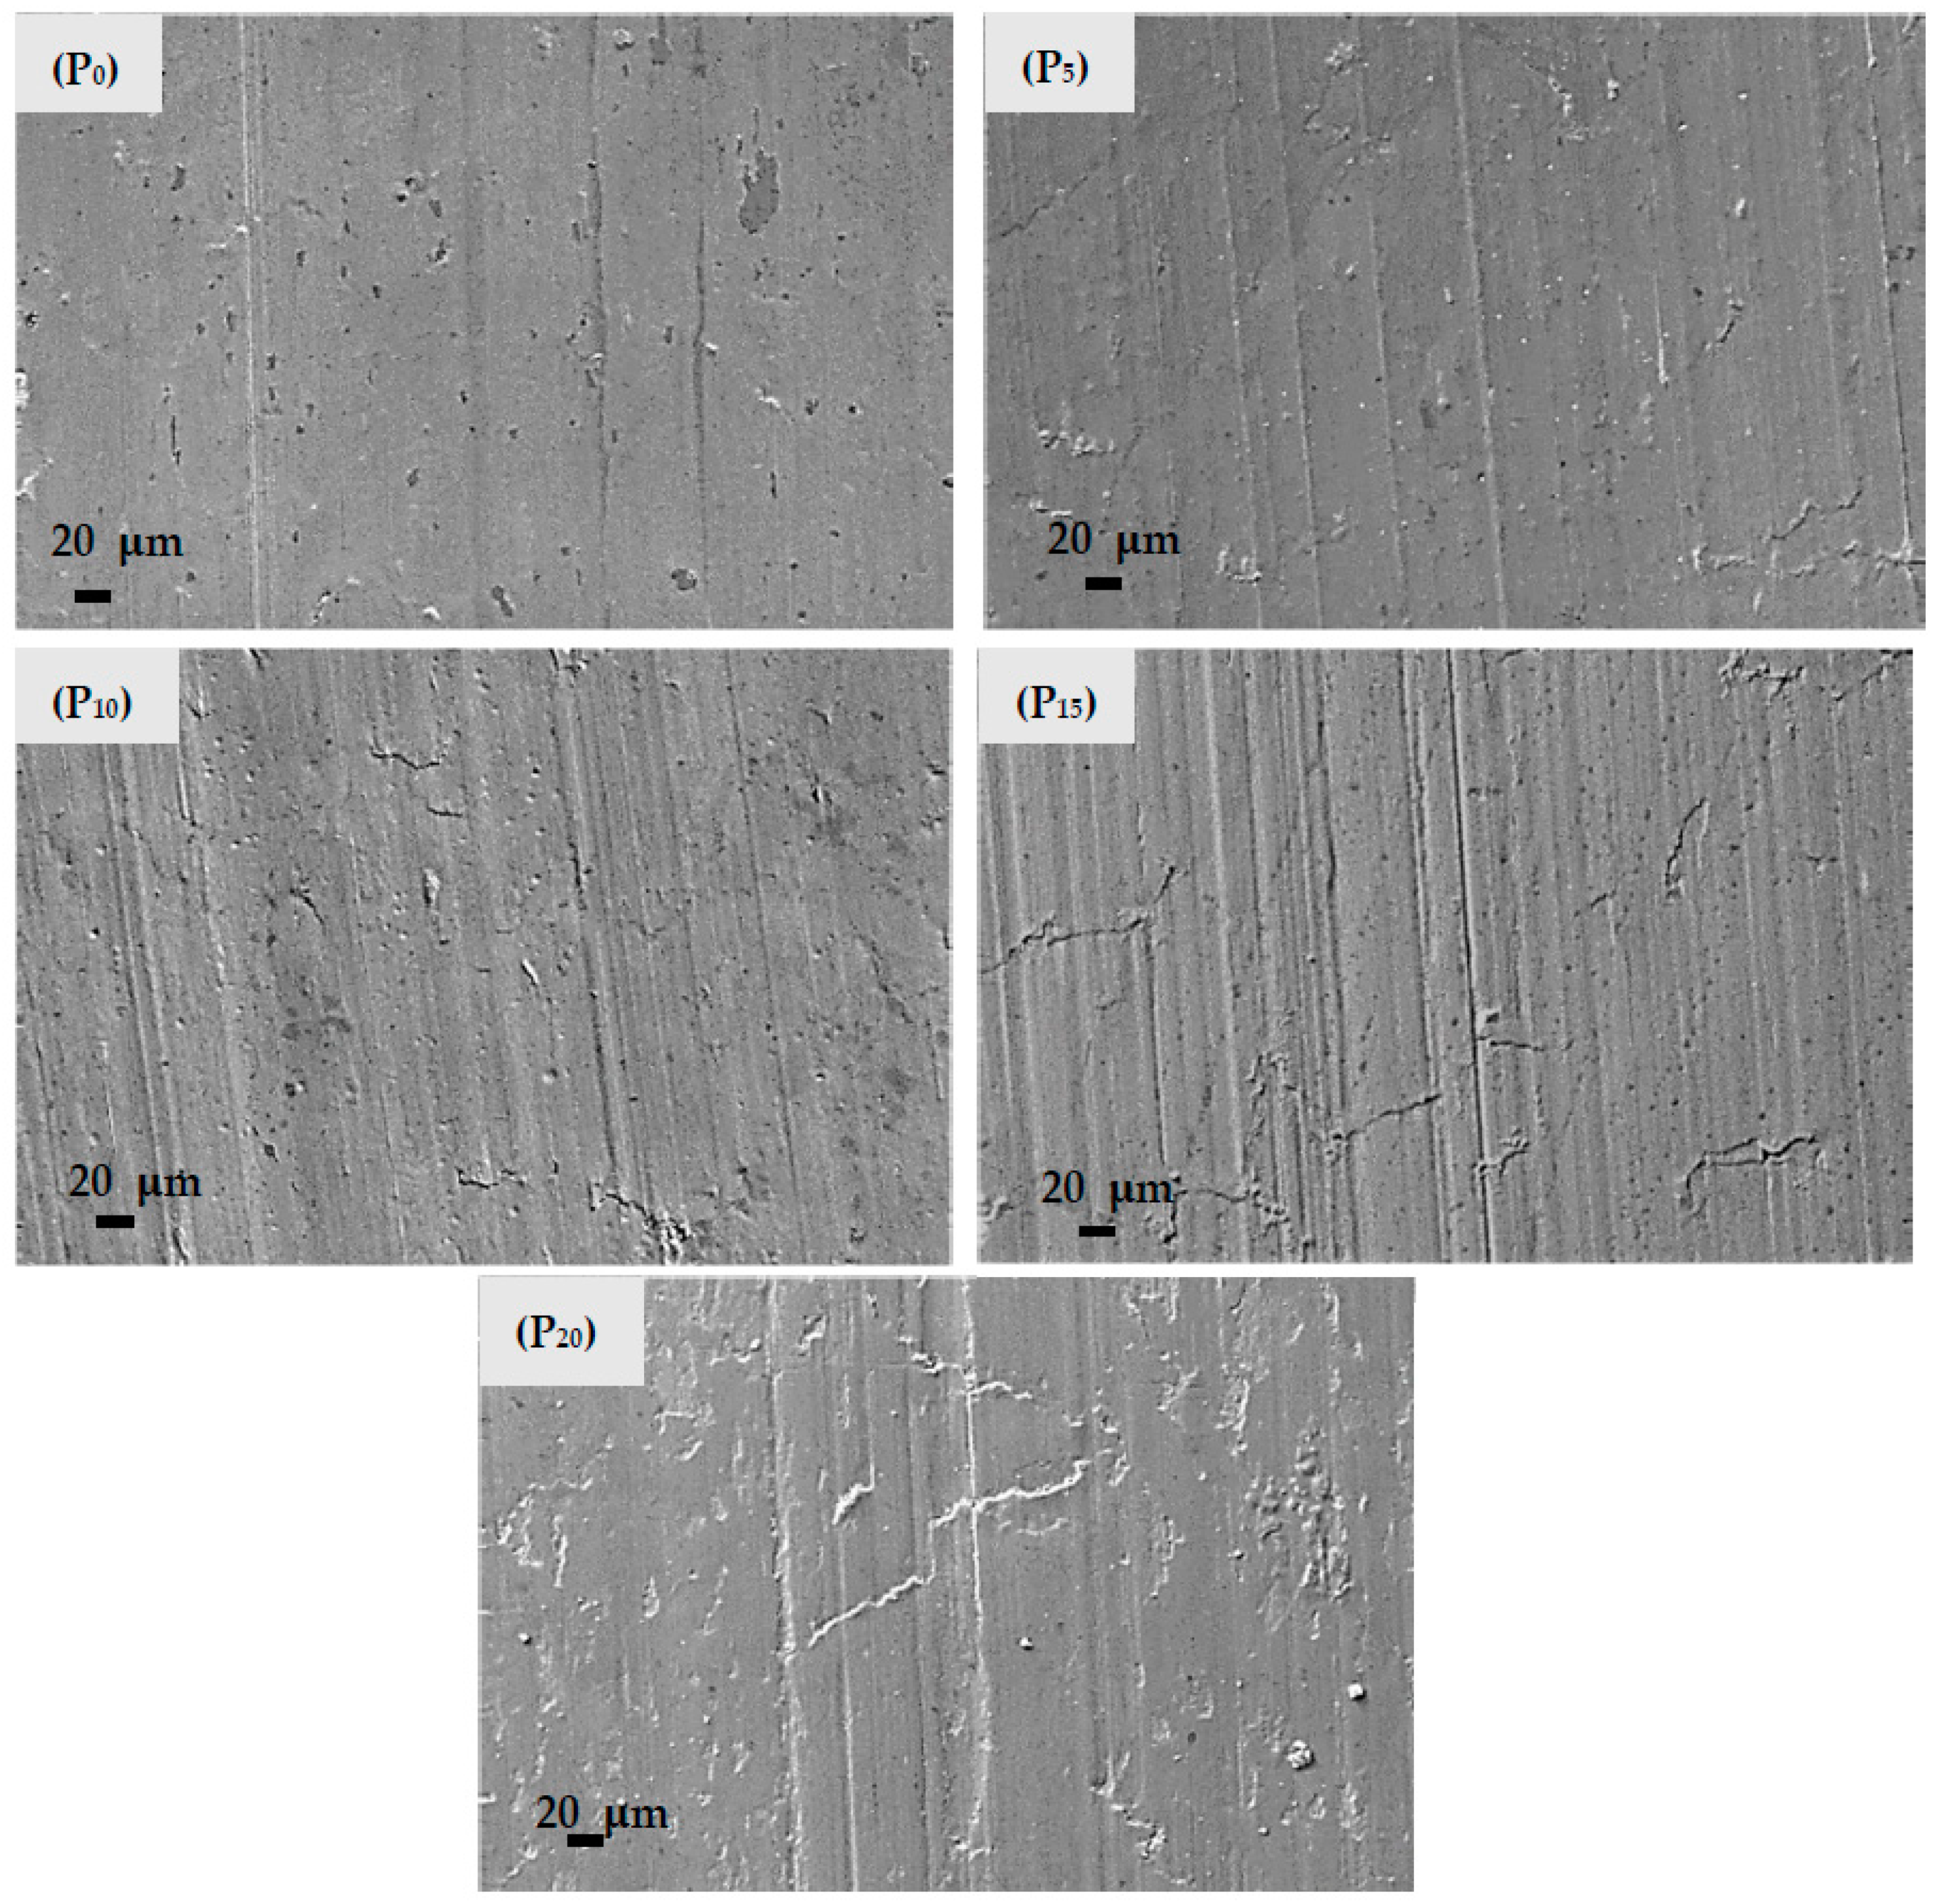
Figure 14 shows the SEM of disc surfaces arranged in the order of increasing wear of pads. There was no significant difference in the topography of the discs. However, it can be observed that as wear of pads increased from P0 to P20, the disc surface showed thicker and thicker layers with an increasing amount of overlap on each other as marked along with increasing signs of abrasion due to the increased amount of PD particles in the pad, which being hard, were responsible for the grooving action.
4. Conclusions
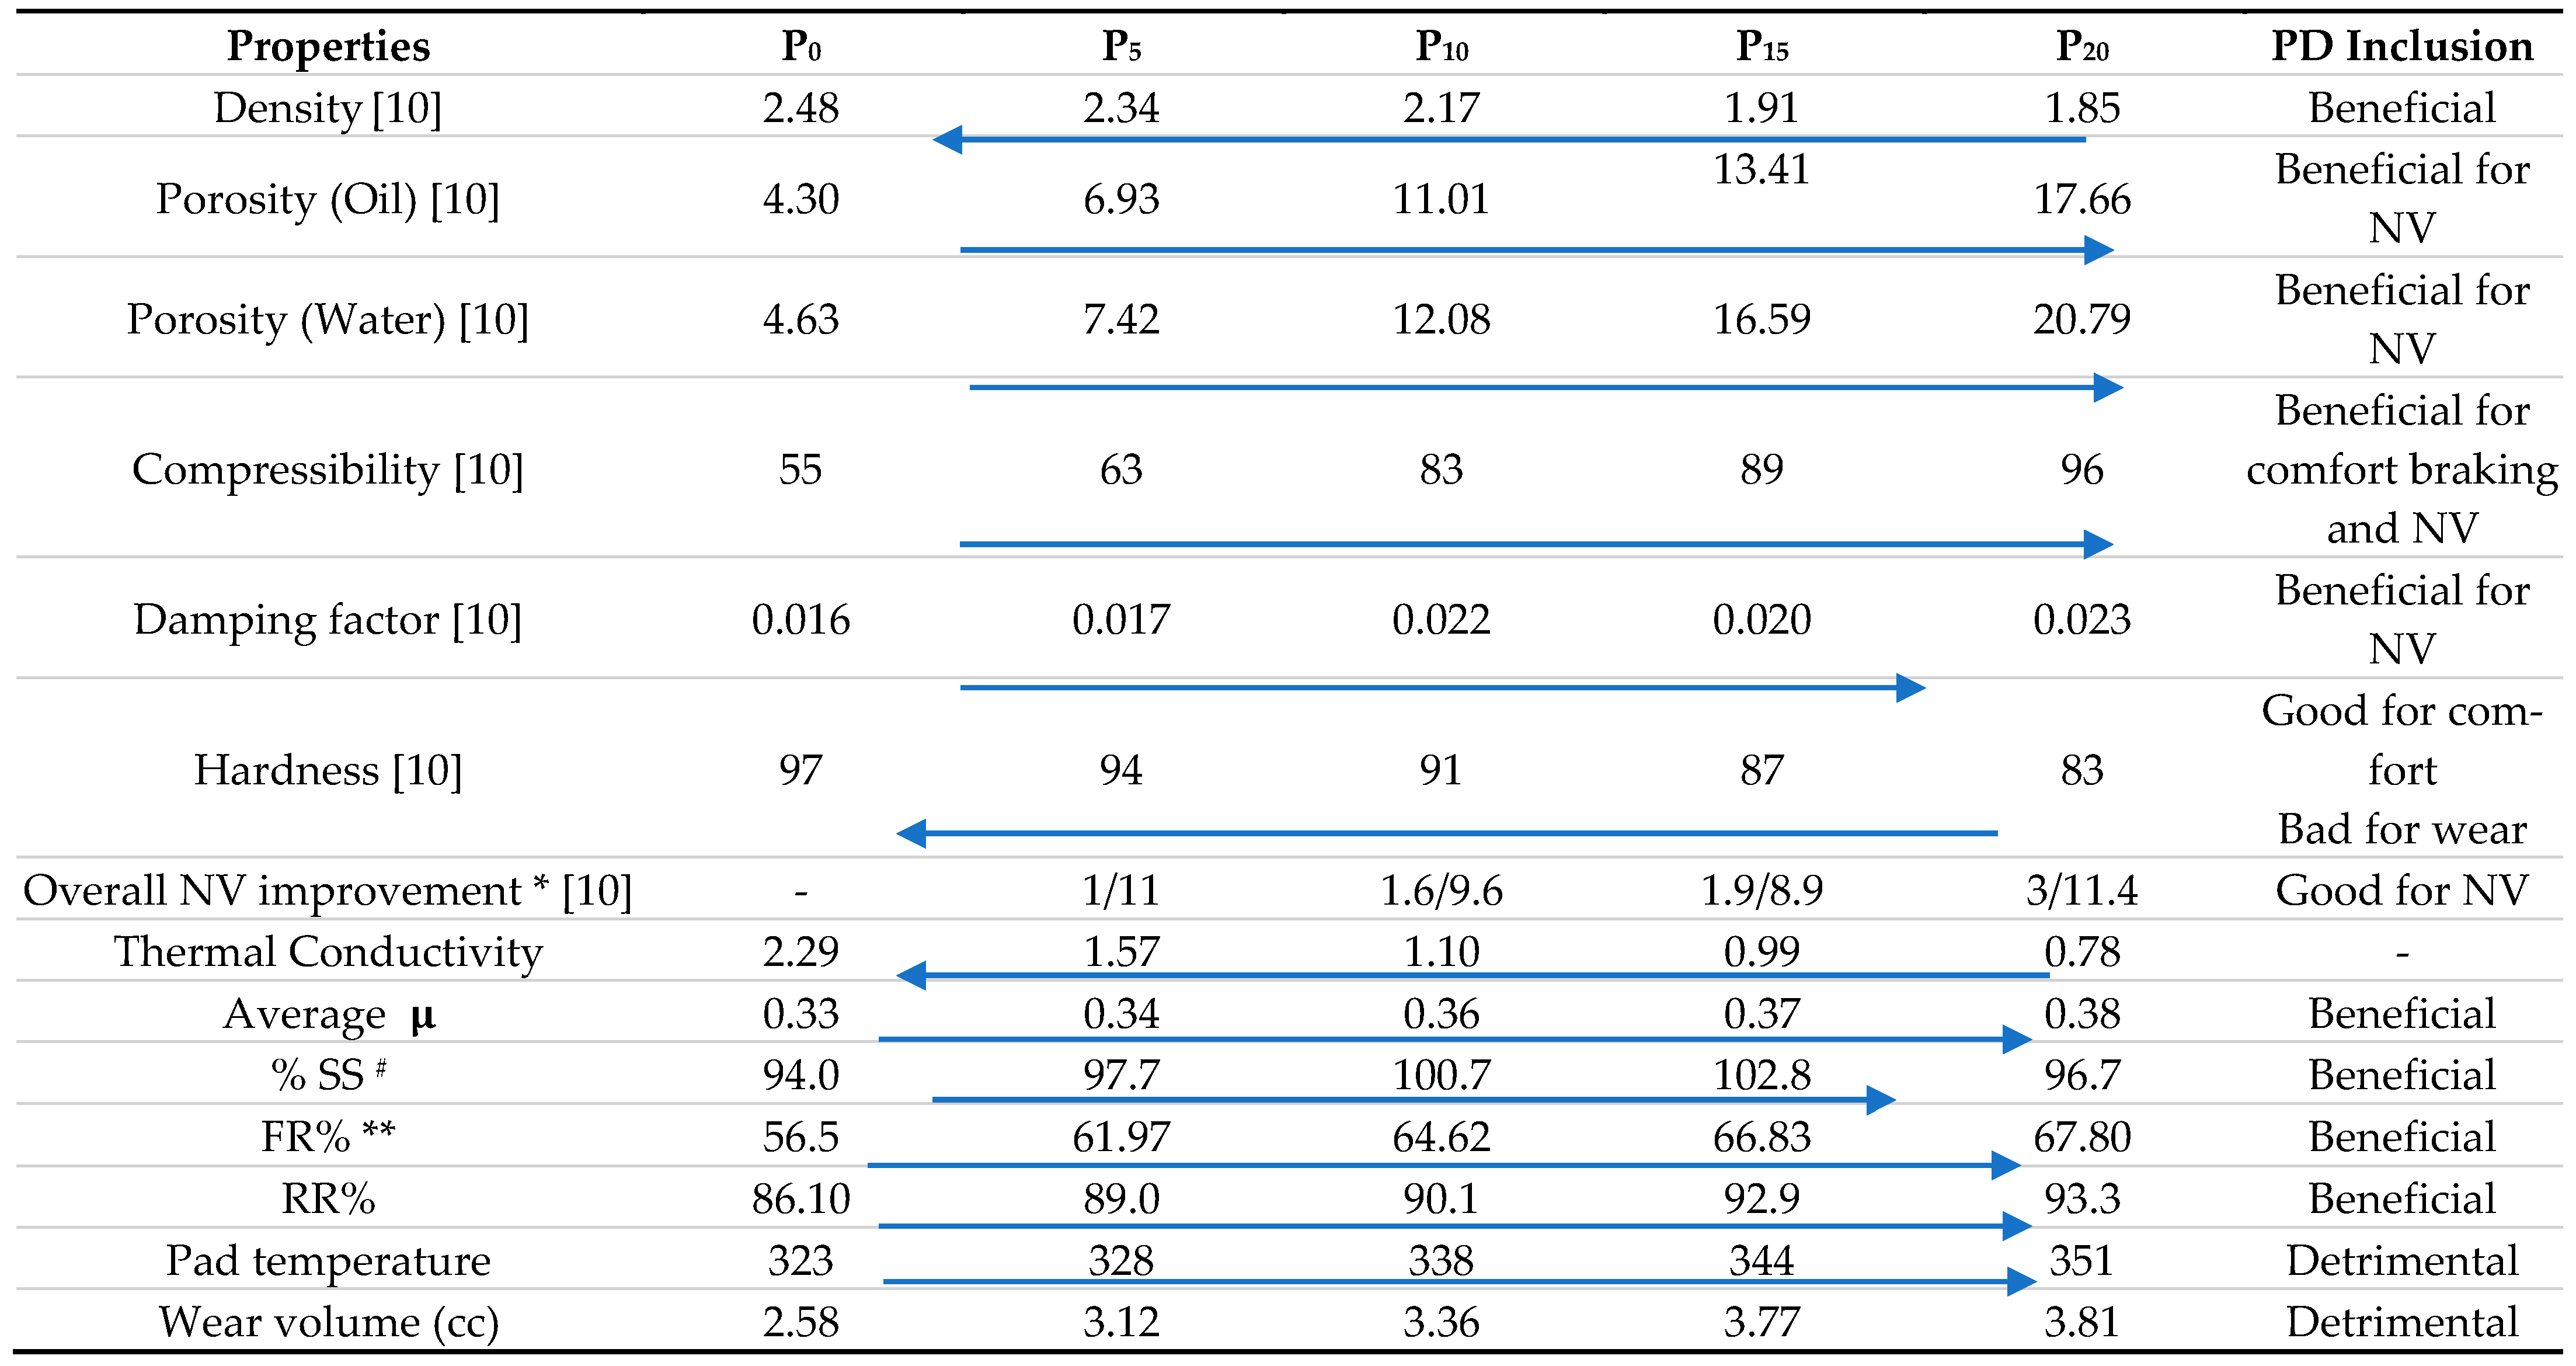
Based on the series of brake-pads with increasing contents of Promaxon-D (PD) particles (0, 5, 10, 15, and 20 wt.%), tribo-investigations in this paper, along with Noise–vibration studies in the earlier paper following a similar essence were summarized (Table 2).
Based on these, it was concluded that the inclusion of PD particles in NAO Cu-free brake pads proved to be beneficial almost in every respect barring wear resistance. The higher the contents, the more were the benefits, in general.
Author Contributions
Conceptualization, B.B. and N.K.; methodology, B.B., N.K. and J.B.; writing—original draft preparation, B.B. and J.B.; resources, N.K., A.D. and J.B.; writing—review and editing, J.B., B.B., N.K. and A.D.; visualization, B.B. and J.B.; supervision, J.B. and A.D. All authors have read and agreed to the published version of the manuscript.
Funding
This research received no external funding.
Institutional Review Board Statement
Not applicable.
Informed Consent Statement
Not applicable.
Data Availability Statement
All data analyzed during this study are incorporated in the present article.
Acknowledgments
Authors are grateful to Johan Decrock Promat International N. V. Belgium for gifting the Promaxon-D material for the research. The authors would like to express thanks to Raj Khanolkar, Technical Director Masu Brakes, Delhi, India.
Conflicts of Interest
The authors declare no conflict of interest.
References
- Bijwe, J. Multifunctionality of nonasbestos organic brake materials. In Multifunctionality of Polymer Composites; Friedrich, K., Breuer, U., Eds.; William Andrew Publishing: Oxford, UK, 2015; pp. 551–572. [Google Scholar]
- Raj, J.S.; Christy, T.; Gnanaraj, S.D.; Sugozu, B. Influence of calcium sulfate whiskers on the tribological characteristics of automotive brake friction materials. Eng. Sci. Technol. Int. J. 2020, 23, 445–451. [Google Scholar] [CrossRef]
- Singh, T.; Tiwari, A.; Patnaik, A.; Chauhan, R.; Ali, S. Influence of wollastonite shape and amount on tribo-performance of non-asbestos organic brake friction composites. Wear 2017, 386–387, 157–164. [Google Scholar] [CrossRef]
- Mahale, V.; Bijwe, J.; Sinha, S. Studies on friction mechanism of NAO brake-pads containing potassium titanate powder as a theme ingredient. SAE Int. J. Mater. Manuf. 2018, 11, 43–56. [Google Scholar] [CrossRef]
- PROMAXON® D: Improving Performance and Cost of Disc Brake Pads. Available online: https://www.promaxon.com/downloads/get/en/b70f9e86-bcaa-4014-94b6-8397b5e8a616#:~:text=PROMAXON%C2%AE%20D%20is%20a%20versatile%20raw%20material%20used%20in,keeping%20processing%20conditions%20the%20same) (accessed on 3 February 2021).
- Razo, D.A.S.; Decrock, J.; Opsommer, A.; Fabré, M.; Persoon, F. Promaxon® D in NAO Non Steel Disc Pad Formulations: The Importance in the Third Body Layer and its Effect on Brake Noise. SAE Int. J. Mater. Manuf. 2015, 9, 158–170. [Google Scholar] [CrossRef]
- Mahale, V.; Bijwe, J.; Sinha, S. Efforts towards green friction materials. Tribol. Int. 2019, 136, 196–206. [Google Scholar] [CrossRef]
- Smeets, L.; Van De Worp, B.; Dewald, K.S. Improved Friction Performance by using Highly Porous, Thermally Stable Particles; Promaxon D. SAE Tech. Pap. Ser. (2011-01-2368) 2011. [Google Scholar] [CrossRef]
- Anton, O.; Eckert, A.; Eckert, A. Brake Linings. U.S. Patent US4994506A, 19 February 1991. [Google Scholar]
- Bhatt, B.; Kalel, N.; Darpe, A.; Bijwe, J. Promaxon-D reinforced brake-pads to ameliorate the noise-vibration perfor-mance. Wear 2021. (Accepted). [Google Scholar]
- Aranganathan, N.; Mahale, V.; Bijwe, J. Effects of aramid fiber concentration on the friction and wear characteristics of non-asbestos organic friction composites using standardized braking tests. Wear 2016, 354–355, 69–77. [Google Scholar] [CrossRef]
- Kumar, M.; Bijwe, J. Optimized selection of metallic fillers for best combination of performance properties of friction materials: A comprehensive study. Wear 2013, 303, 569–583. [Google Scholar] [CrossRef]
- Kumar, M.; Bijwe, J. NAO friction materials with various metal powders: Tribological evaluation on full-scale inertia dynamometer. Wear 2010, 269, 826–837. [Google Scholar] [CrossRef]
- Sumirat, I.; Ando, Y.; Shimamura, S. Theoretical consideration of the effect of porosity on thermal conductivity of porous materials. J. Porous Mater. 2006, 13, 439–443. [Google Scholar] [CrossRef]
- Mahale, V.; Bijwe, J.; Sinha, S. A step towards replacing copper in brake-pads by using stainless steel swarf. Wear 2019, 424–425, 133–142. [Google Scholar] [CrossRef]
- Hutchings, I.; Shipway, P. Tribology: Friction and Wear of Engineering Materials; Butterworth-Heinemann: Oxford, UK, 2017; ISBN 0081009518. [Google Scholar]
- Sarkar, A.D. Friction and Wear; Academic Press: London, UK, 1980. [Google Scholar]
- Blau, P.J. Friction science and technology: From concepts to applications; CRC Press: Florida, FL, USA, 2008; ISBN 1420054104. [Google Scholar]
- Eddoumy, F.; Kasem, H.; Dhieb, H.; Buijnsters, J.G.; Dufrenoy, P.; Celis, J.P.; Desplanques, Y. Role of constituents of friction materials on their sliding behavior between room temperature and 400 °C. Mater. Des. 2015, 65, 179–186. [Google Scholar] [CrossRef]
- Gopal, P.; Dharani, L.; Blum, F.D. Fade and wear characteristics of a glass-fiber-reinforced phenolic friction material. Wear 1994, 174, 119–127. [Google Scholar] [CrossRef]
- Aranganathan, N.; Bijwe, J.; Khatri, D. Role of combination of hexagonal boron nitride and graphite in NAO friction material. Proc. Inst. Mech. Eng. Part J J. Eng. Tribol. 2016, 230, 1107–1112. [Google Scholar] [CrossRef]
- Cai, P.; Wang, Y.; Wang, T.; Wang, Q. Improving tribological behaviors of friction material by mullite. Tribol. Int. 2016, 93, 282–288. [Google Scholar] [CrossRef]
Figure 1.
(a) Scanning electron micrographs and energy dispersive X-ray (EDX) dot maps (Ca, O, and Si) of Promaxon-D (PD) particles; (b,c) inside morphological features of PD particles (Received from Dr Ann Opsommer, ETE, Belgium).
Figure 1.
(a) Scanning electron micrographs and energy dispersive X-ray (EDX) dot maps (Ca, O, and Si) of Promaxon-D (PD) particles; (b,c) inside morphological features of PD particles (Received from Dr Ann Opsommer, ETE, Belgium).

Figure 2.
Physical, chemical, and mechanical properties of developed brake pads.

Figure 3.
Sensitivity of µ towards deceleration at (a) 50 kmph, (b) 80 kmph, and (c) 100 kmph.

Figure 4.
Average µ of brake pads during effectiveness cycle.

Figure 5.
µ (-) at varying deceleration (0.1–0.8 g) at different speeds.

Figure 6.
(a) % speed spread (SS) with deceleration (0.1–0.8 g) at mild and severe conditions; (b) average SS % with fluctuations for mild and severe conditions.
Figure 6.
(a) % speed spread (SS) with deceleration (0.1–0.8 g) at mild and severe conditions; (b) average SS % with fluctuations for mild and severe conditions.

Figure 7.
Fade and recovery performance of brake-pads for (a) F&R I and (b) F&R II.

Figure 8.
(a) % fade ratio and (b) % recovery ratio for developed brake pads.

Figure 9.
(a) µfade and (b) µrecovery for developed brake pads in F&R I and II.

Figure 10.
Max. temperature rise of (a) pads and (b) disc during Fade I and II cycles.

Figure 11.
Wear volume of brake-pads containing different wt.% PD.

Figure 12.
Scanning electron micrographs of worn surfaces of pads with decreasing wear resistance (1500×) (a) P0; (b) P5; (c) P10; (d) P15; (e) P20; and (f–h) specific topographical features of P20 and P15.
Figure 12.
Scanning electron micrographs of worn surfaces of pads with decreasing wear resistance (1500×) (a) P0; (b) P5; (c) P10; (d) P15; (e) P20; and (f–h) specific topographical features of P20 and P15.


Figure 13.
(a) Scanning electron micrograph of P20 and corresponding EDX data in the form of dot maps; (b) for Si, (c) for Ca, (d) for Mg, (e) for Al, and (f) for Ba.
Figure 13.
(a) Scanning electron micrograph of P20 and corresponding EDX data in the form of dot maps; (b) for Si, (c) for Ca, (d) for Mg, (e) for Al, and (f) for Ba.


Figure 14.
Scanning electron micrographs of worn discs.


Table 1.
Compositions (main ingredient Promaxon-D (PD) particles and compensating inert material barite Total 31 wt.%) of brake pads excluding 69 wt.% parent composition (binder:fibers:friction modifiers:functional fillers 7:16:12:34).
Table 1.
Compositions (main ingredient Promaxon-D (PD) particles and compensating inert material barite Total 31 wt.%) of brake pads excluding 69 wt.% parent composition (binder:fibers:friction modifiers:functional fillers 7:16:12:34).
| Composition (wt.%) | Brake Pads Designation | ||||
|---|---|---|---|---|---|
| P0 | P5 | P10 | P15 | P20 | |
| Promaxon-D particles (35–85 µm) Promat International N. V. Belgium | 0 | 5 | 10 | 15 | 20 |
| Inert filler (Barite) (10–100 µm) Stark Intl. Ltd. India | 31 | 26 | 21 | 16 | 11 |
Table 2.
The gist of the present studies.

* Relative to P0: sensitivity of for (# speed at severe condition; ** temperature)
Publisher’s Note: MDPI stays neutral with regard to jurisdictional claims in published maps and institutional affiliations. |
© 2021 by the authors. Licensee MDPI, Basel, Switzerland. This article is an open access article distributed under the terms and conditions of the Creative Commons Attribution (CC BY) license (http://creativecommons.org/licenses/by/4.0/).
Share and Cite
MDPI and ACS Style
Bhatt, B.; Kalel, N.; Darpe, A.; Bijwe, J. Role of Promaxon-D in Controlling Tribological Performance of Cu-Free Brake Pads. Metals 2021, 11, 441. https://0-doi-org.brum.beds.ac.uk/10.3390/met11030441
AMA Style
Bhatt B, Kalel N, Darpe A, Bijwe J. Role of Promaxon-D in Controlling Tribological Performance of Cu-Free Brake Pads. Metals. 2021; 11(3):441. https://0-doi-org.brum.beds.ac.uk/10.3390/met11030441
Chicago/Turabian StyleBhatt, Bhaskaranand, Navnath Kalel, Ashish Darpe, and Jayashree Bijwe. 2021. "Role of Promaxon-D in Controlling Tribological Performance of Cu-Free Brake Pads" Metals 11, no. 3: 441. https://0-doi-org.brum.beds.ac.uk/10.3390/met11030441
Note that from the first issue of 2016, this journal uses article numbers instead of page numbers. See further details here.