
Hot Rolling of Magnesium Single Crystals


1
Department of Metallurgical Engineering, Instituto Politécnico Nacional-ESIQIE, 07738 Mexico City, Mexico
2
Institute for Physical Metallurgy and Materials Physics, RWTH Aachen, 52056 Aachen, Germany
*
Author to whom correspondence should be addressed.
Metals 2021, 11(3), 443; https://0-doi-org.brum.beds.ac.uk/10.3390/met11030443
Submission received: 30 January 2021
/
Revised: 15 February 2021
/
Accepted: 3 March 2021
/
Published: 8 March 2021
(This article belongs to the Special Issue Microstructure-Mechanical Properties and Application of Magnesium Alloys)
Abstract
:To analyze the effect of the initial orientation in the activity of twinning and texture development, magnesium single crystals were rolled at 400 °C (nominal furnace temperature) in two specific orientations. In both orientations, the rolling direction of the sheet (RD) was parallel to the c-axis. For orientation 1, the direction was parallel to the normal direction (ND), and for orientation 2, it was parallel to the direction. The samples were rolled at 30%, 50% and 80% of thickness reduction. After rolling, all the samples were quenched in water to retain the microstructure. The microstructure and texture evolution were characterized by X-ray diffraction and Electron Backscatter Diffraction (EBSD). The initial single crystals were turned into polycrystals, where most grains had their c-axis almost parallel to the ND, and this reorientation was explained by extension twinning. The active twin variants in orientation 1 aligned the basal plane ~30° from the sheet plane and caused a weaker basal texture compared to orientation 2, where the twin variants aligned the basal plane almost parallel to the sheet plane. Strain localization inside contraction twins was observed, and consequently, non-basal grains nucleated inside these twins and weakened the final basal texture only in orientation 1.
1. Introduction
Magnesium has a hexagonal closely packed structure, which causes high mechanical anisotropy and low formability at room temperature, owing to the limited number of easily activate slip systems. In addition, it is well known that magnesium develops a basal texture after deformation [1,2]. The above has given rise to many investigations seeking to improve the mechanical properties and formability of this material, which requires a vast understanding of the deformation mechanisms present in the forming processes.
Studies on deformation of single crystals have several advantages compared to deformation of polycrystals. The use of specifically oriented single crystals with respect to the loading axes allow to isolate and identify the deformation mechanisms depending on the initial orientation of the crystal, since the operating deformation mechanisms, at least at early stages of deformation, can be determined using the Schmid’s Law [3,4,5,6].
First studies on magnesium single crystals were performed by Wonziewicz et al. [5] and Kelly et al. [6]. In these studies, the crystals were subjected to plane strain compression (PSC) tests in different orientations, which showed profuse deformation by twinning and recrystallization. However, these investigations were limited to small strains and focused on the effect of temperature on the activity of the deformation mechanisms.
More recently, Chapuis et al. [7] evaluated the temperature dependency of critical resolved shear stresses (CRSS) of the slip and twinning systems of Mg single crystals by PSC tests and concluded that basal slip and twinning are not temperature-dependent mechanisms, prismatic and pyramidal II slip were identified only at about 300 °C and contraction twinning systems and were identified as temperature-dependent systems because their CRSS decreased with the temperature increase.
Molodov et al. [8,9,10,11,12,13,14] characterized the deformation behavior and microstructure evolution of Mg single crystals in plane strain compression, using Electron Backscatter Diffraction (EBSD) and X-ray pole figure measurements. They focused on the activation of twinning and dynamic recrystallization mechanisms and its influence on the texture evolution.
Currently, no works on rolling of magnesium single crystals have been reported, and considering the contributions of the previously described works, single crystals could help us to understand the deformation behavior of magnesium during rolling deformation, which allows a certain broadening of the sample, contrary to PSC, where broadening is usually suppressed by the walls of the channel die. Therefore, the aim of this work is to provide a basic understanding of the deformation mechanisms involved in hot rolling of magnesium single crystals at 400 °C and its contribution to the final texture.
2. Materials and Methods
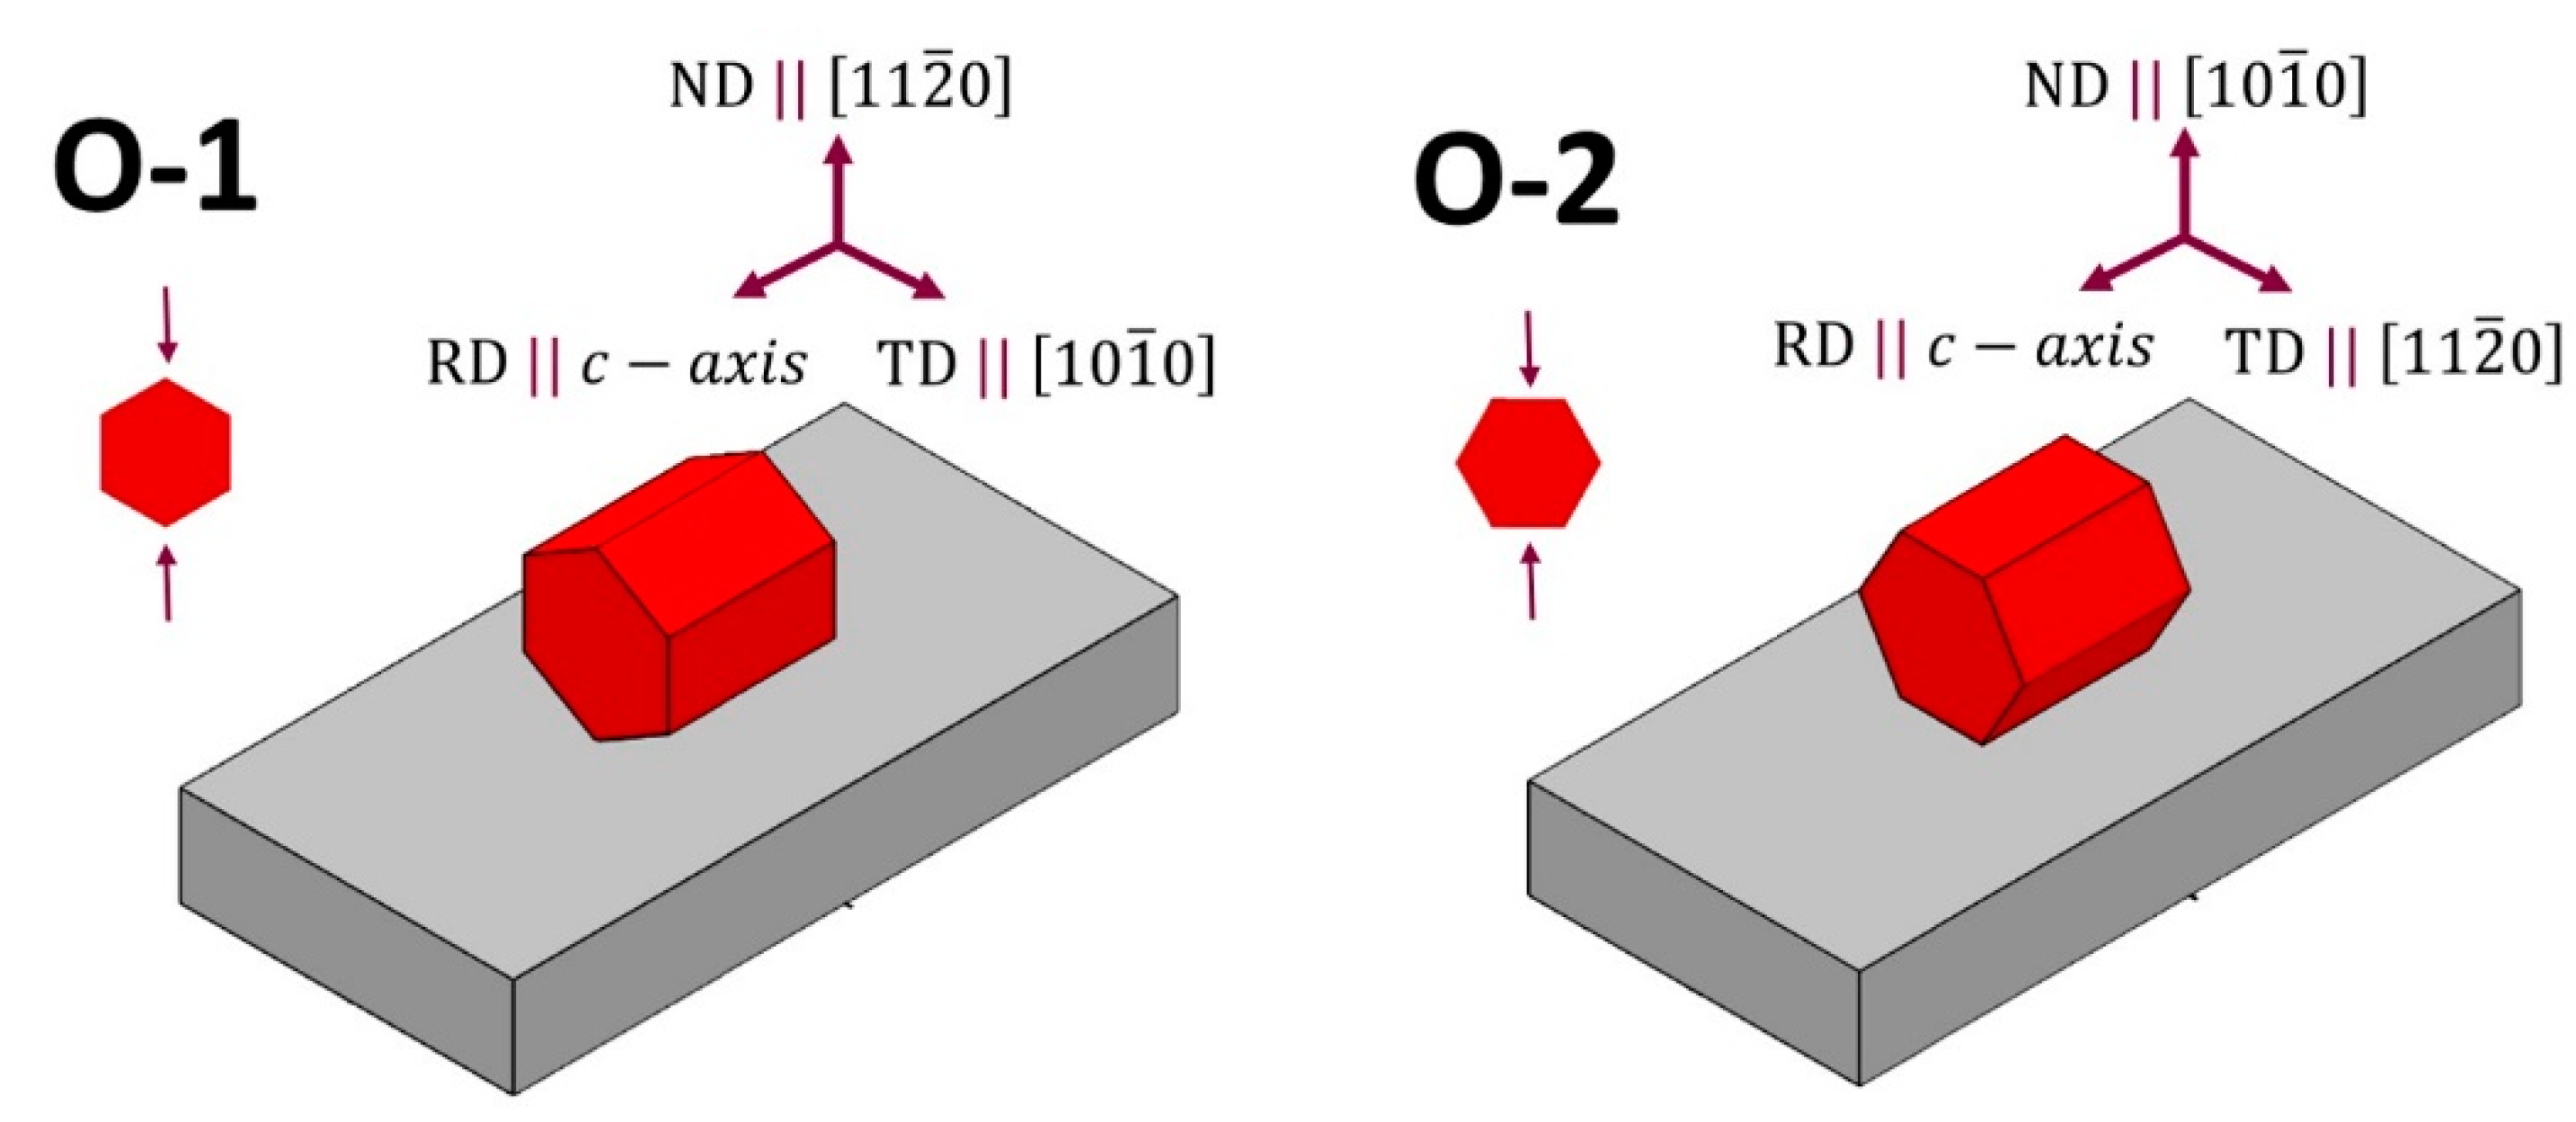
The single crystals of commercially pure magnesium (min. 99.95%) were fabricated by crystal growth using the Bridgman method in a vertical configuration. To manufacture monocrystalline rolling samples with their geometric axes coinciding with specific crystallographic directions, each grown single crystal was oriented by means of the Laue X-ray back diffraction method [15], then, slabs with dimensions of 40 mm × 20 mm × 6 mm were cut by electrical discharge machining (EDM). Figure 1 shows the schemes of the rolling samples and their orientation relationship with the crystal directions. The c-axis of the crystals were aligned parallel to the rolling direction in both orientations. In the sample labeled “orientation 1” (O-1), the normal direction (ND) was aligned parallel to crystal direction and the transversal direction (TD) corresponds to . In the sample of “orientation 2” (O-2), the normal direction (ND) was aligned parallel to crystal direction and the transversal direction (TD) corresponds to . The misalignment between the crystallographic directions and the specimen axes was less than 0.5°.
It is well known that above about 250 °C, additional slip systems become operative in the deformation of pure magnesium and fulfill the Von Mises criterion, which states that in a polycrystalline material, five independent sliding systems must be activated to perform any possible deformation without fail. That is why the typical temperature range for magnesium rolling is between 300 and 500 °C [16,17,18,19]. In the current work, considering that the specimens were single crystals, and it might be a little harder to deform them successfully compared to polycrystalline material, the slabs of both orientations were heated at 400 °C for 30 min to ensure the deformation ability of the material and avoid cracking during deformation. Subsequently, each slab was rolled at 200 mm/s to ~30%, ~50% and ~80% of thickness reductions, using 7, 11 and 16 rolling passes, respectively. The complete rolling schedule is presented in Table 1. Between each rolling pass, the samples were returned to the furnace for reheating at 400 °C for 10 min. After the final pass, the sheets were quenched in water to freeze the microstructure and prevent post-mortem static recrystallization. For the microstructural and texture analysis, several samples were cut from the sheets mid-plane using EDM.
The sample preparation for X-ray and EBSD measurements consisted of soft grinding with 2000 and 4000 grinding paper of silicon carbide during 10 min for each particle size, followed by 3 and 1 μm diamond suspension polishing for 15 and 20 min, respectively. After that, electropolishing in a solution of 125 mL ethanol and 75 mL H3PO4 was performed at 2.0 V, submerging the specimens in the electrolyte for 40 min. In the case of microstructural characterization by optical microscopy, a chemical color-etching with a freshly prepared solution of 10 mL H2O, 10 mL CH3-COOH and 70 mL picral 4% was applied.
To characterize the crystallographic texture, X-ray pole figure measurements were conducted in a Bruker D8 Advance diffractometer (Bruker, Billerica, MA, USA), equipped with a HI-STAR multi-wire area detector (Bruker, Billerica, MA, USA) with a circular beryllium window, operating at 30 kV and 25 mA. A set of six incomplete pole figures of the , , , , and families were measured and used to determine the orientation density function (ODF) using the MTEX 5.1.1 toolbox [20].
Electron Backscatter Diffraction (EBSD) measurements were conducted on a JEOL JSM-6701F (JEOL Ltd., Tokyo, Japan) scanning electron microscope equipped with a field emission gun (LaB6 filament) and an HKL-Nordlys II EBSD detector (Oxford Instruments PLC, Abingdon, UK). An acceleration voltage of 30 kV was used for all measurements. The HKL Channel5 5.11 (Oxford Instruments PLC, Abingdon, UK) software was used for the post-processing of the raw data.
3. Results
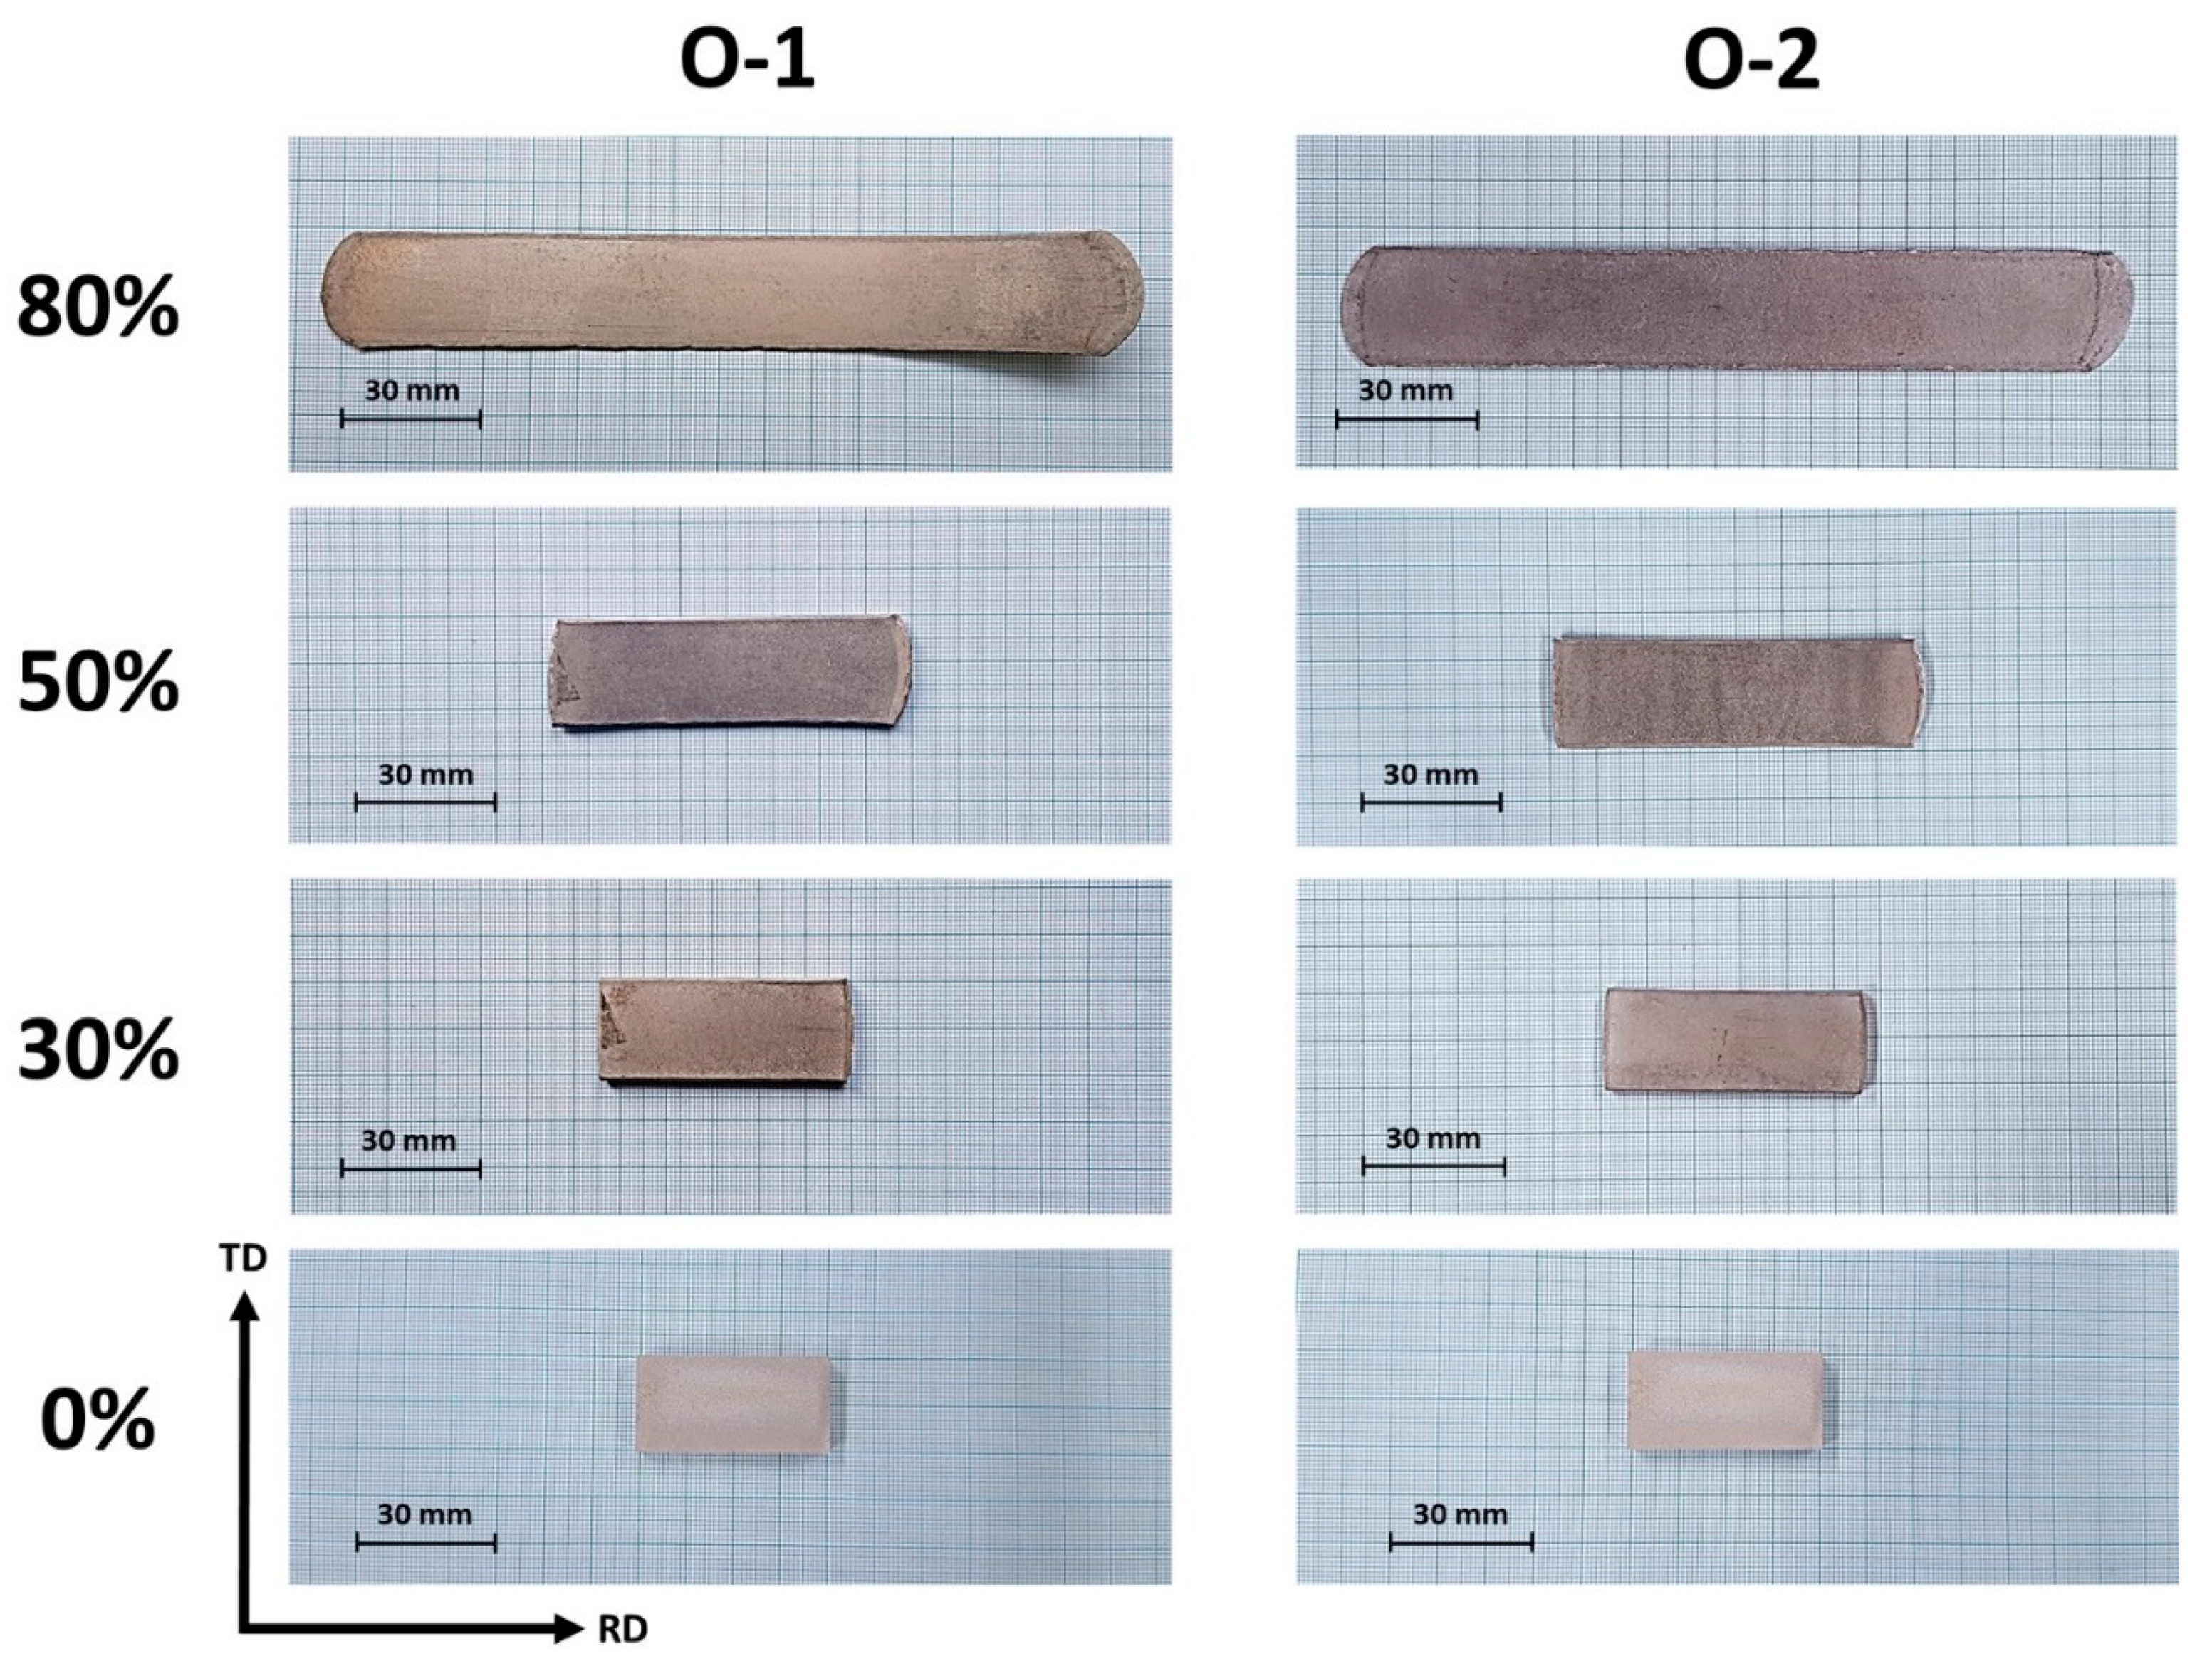
The sheets of pure Mg single crystals rolled at 400 °C are shown in Figure 2, which reveal a smooth surface without visible cracks for both orientations. There were no significant changes in the final dimensions (as a broadening) between the sheets of two orientations, which could indicate small changes in the deformation behavior caused by the difference of the initial crystallographic orientation.
3.1. Microstructure Evolution during Rolling Process
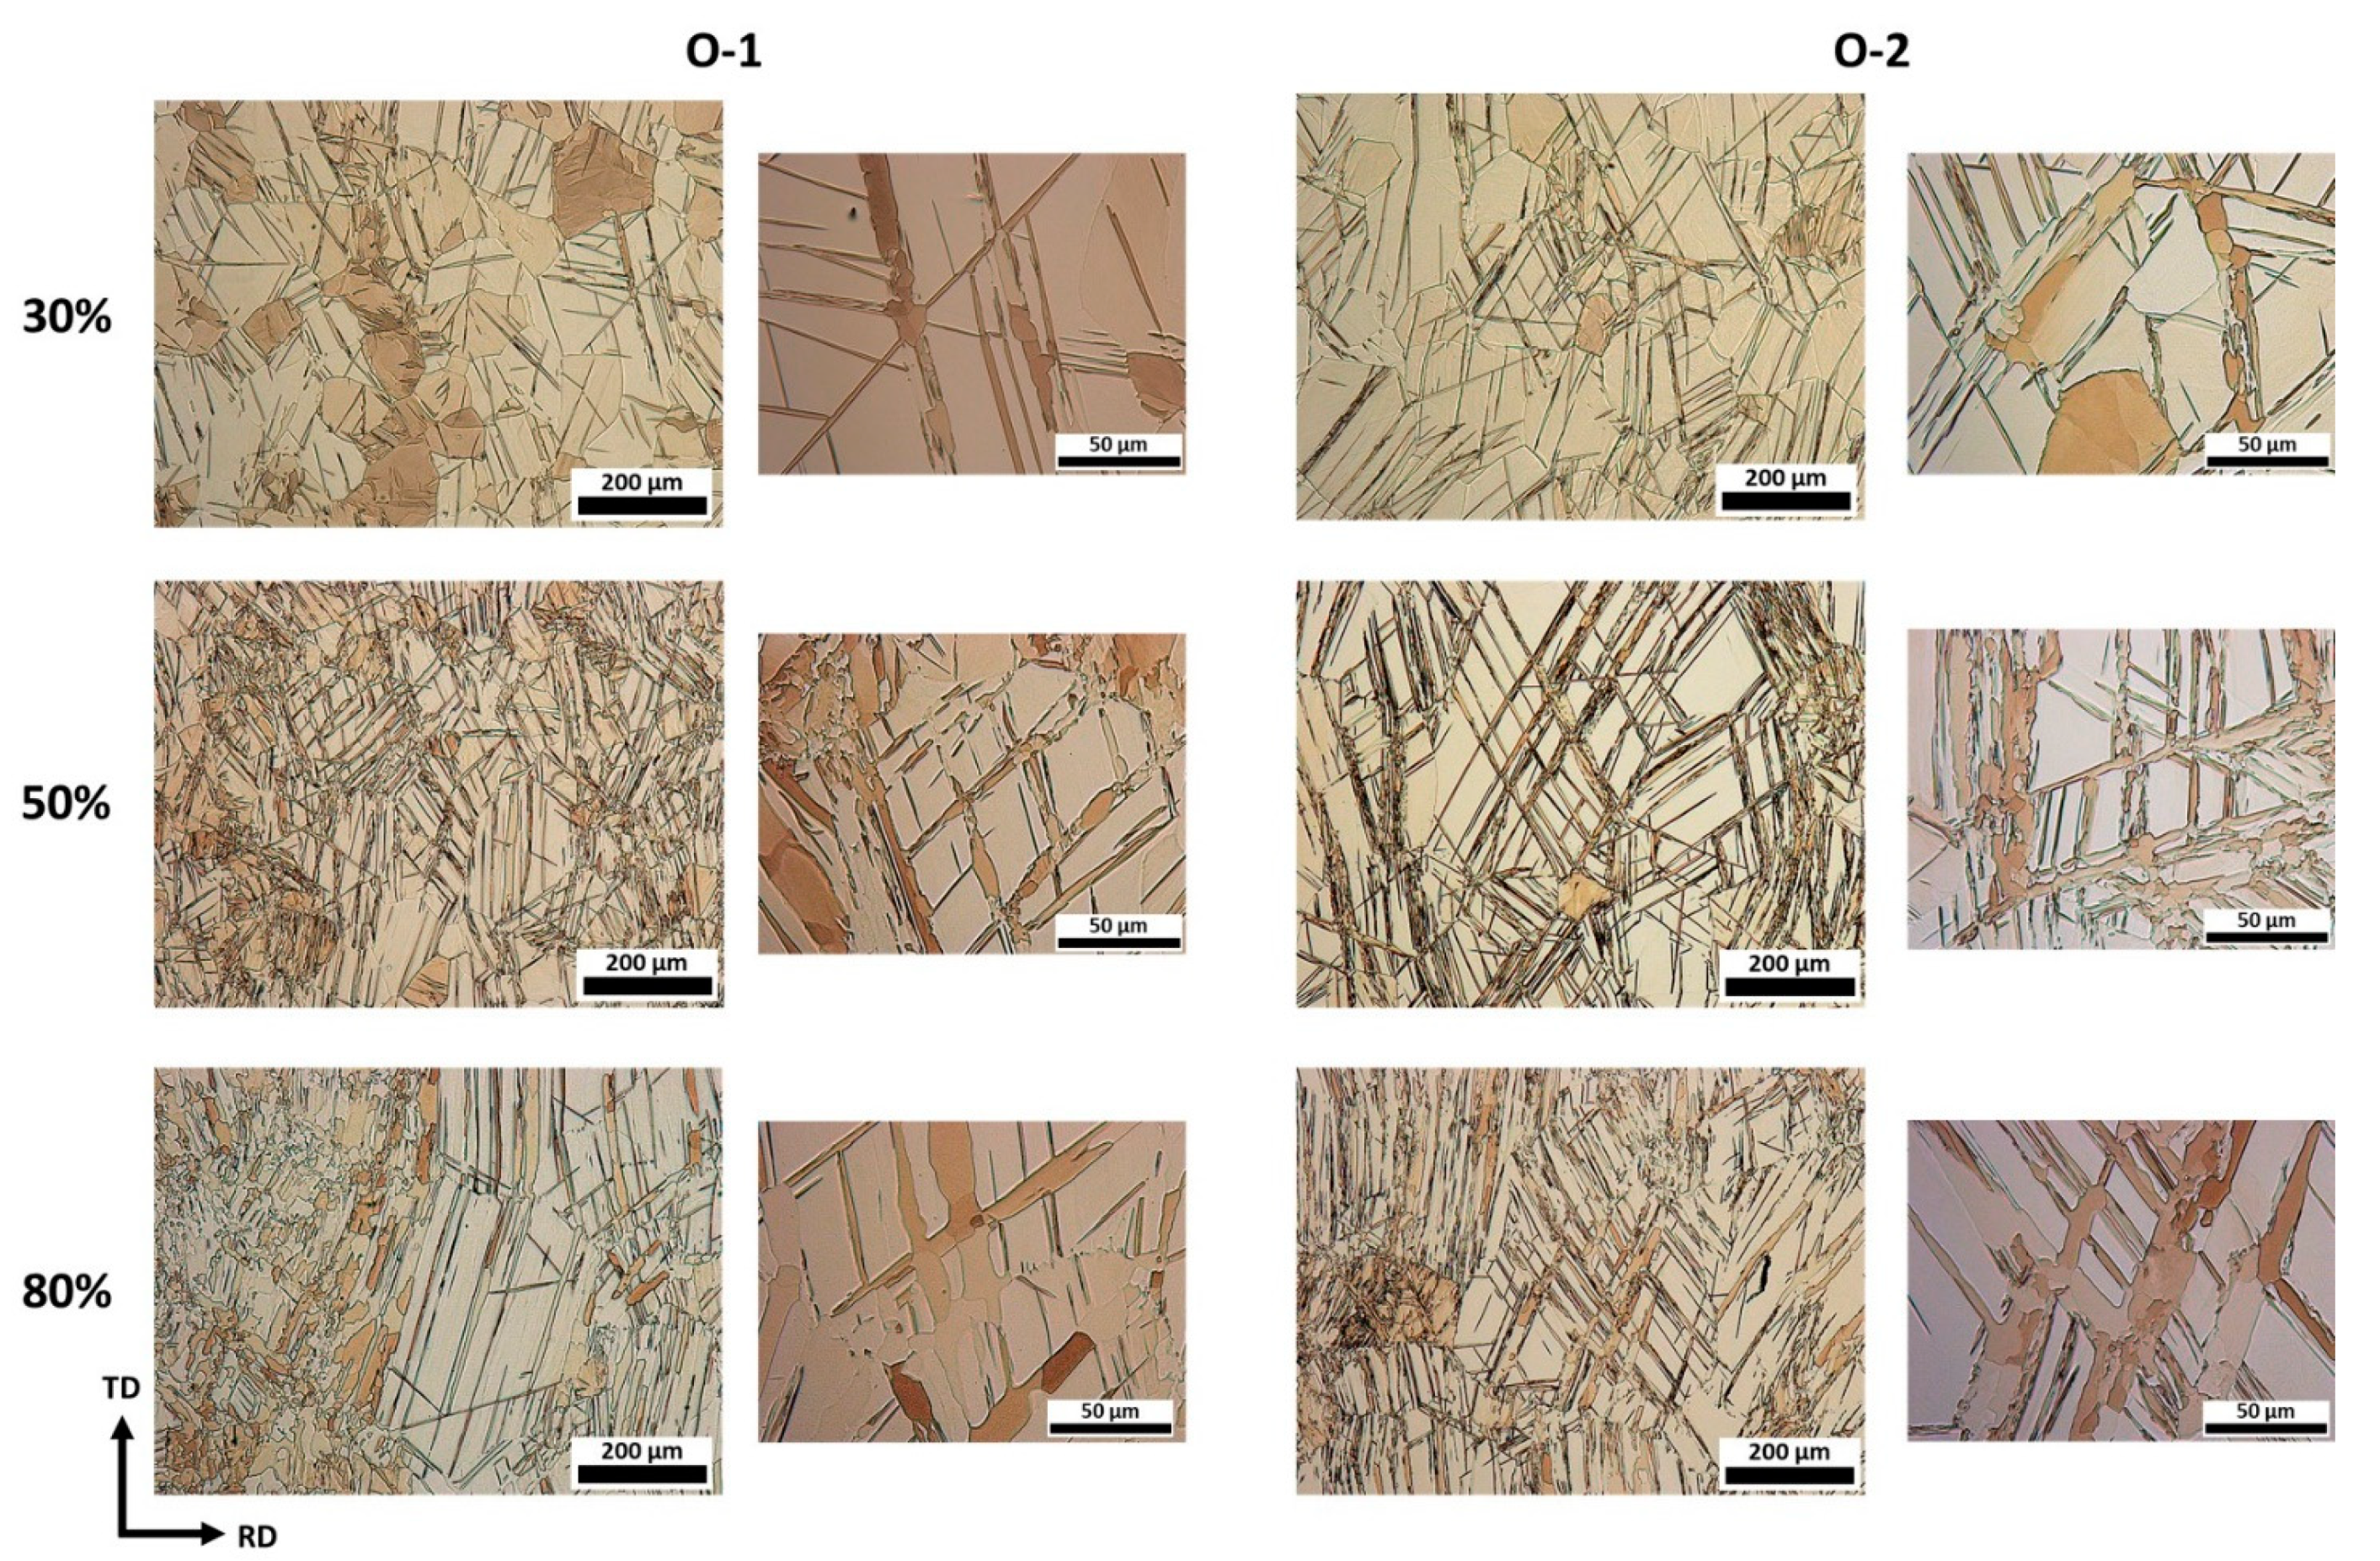
The microstructure of the rolled samples was examined by optical microscopy and the results are presented in Figure 3. The single crystal has been totally turned into a polycrystal of relatively large grains with a particular characteristic, featured by their straight grain boundaries. Thus, they can be described as polygonal grains. In both orientations, many twins and recrystallized twin bands, consisting of fine dynamic recrystallized grains along the twin bands, were observed. The network of twins distributed homogeneously along the microstructure formed symmetric sets, and an inclination angle of ~60° can be observed between them.
At of reduction, many lenticular twins were observed, in O-1 as well as in O-2. In the case of O-2, some recrystallized grains inside the twins can be observed, suggesting the occurrence of dynamic recrystallization (DRX) process. In the O-2, coarser grains compared to O-1 can be observed, but this feature is not so evident in subsequent reductions.
With further deformation (at ), the microstructure of O-1 was characterized by the presence of more and finer twins compared to 30%. In O-2, fewer twins were observed, but in this case, they were coarser than those observed in this orientation at 30% and tended to form clusters. In both orientations, fine grains were observed inside the twins and some twin-free grains were identified.
Finally, at , the O-1 exhibited a partially recrystallized and heterogeneous microstructure described by two zones. In the first, to the left of the micrograph, recrystallized grains almost consumed all the matrix (there was a grain growth considering the size of recrystallized grains observed in previous strains). In the second, at the center, some recrystallized and coarse twin bands as well as recrystallization-free twin bands were found, suggesting that the grains initially recrystallize within the twins, grow, and consume the surrounding matrix.
It can be observed that the fraction of recrystallized grains increases as the rolling progresses, especially inside the twins, and consumes them (O-1 at 80%). These observations indicate that the DRX process plays a dominant role in the microstructure evolution during rolling, giving rise to new grains and, in consequence, new orientations that could modify the texture, and it is interesting to analyze them.
3.2. Texture Evolution during Hot Rolling
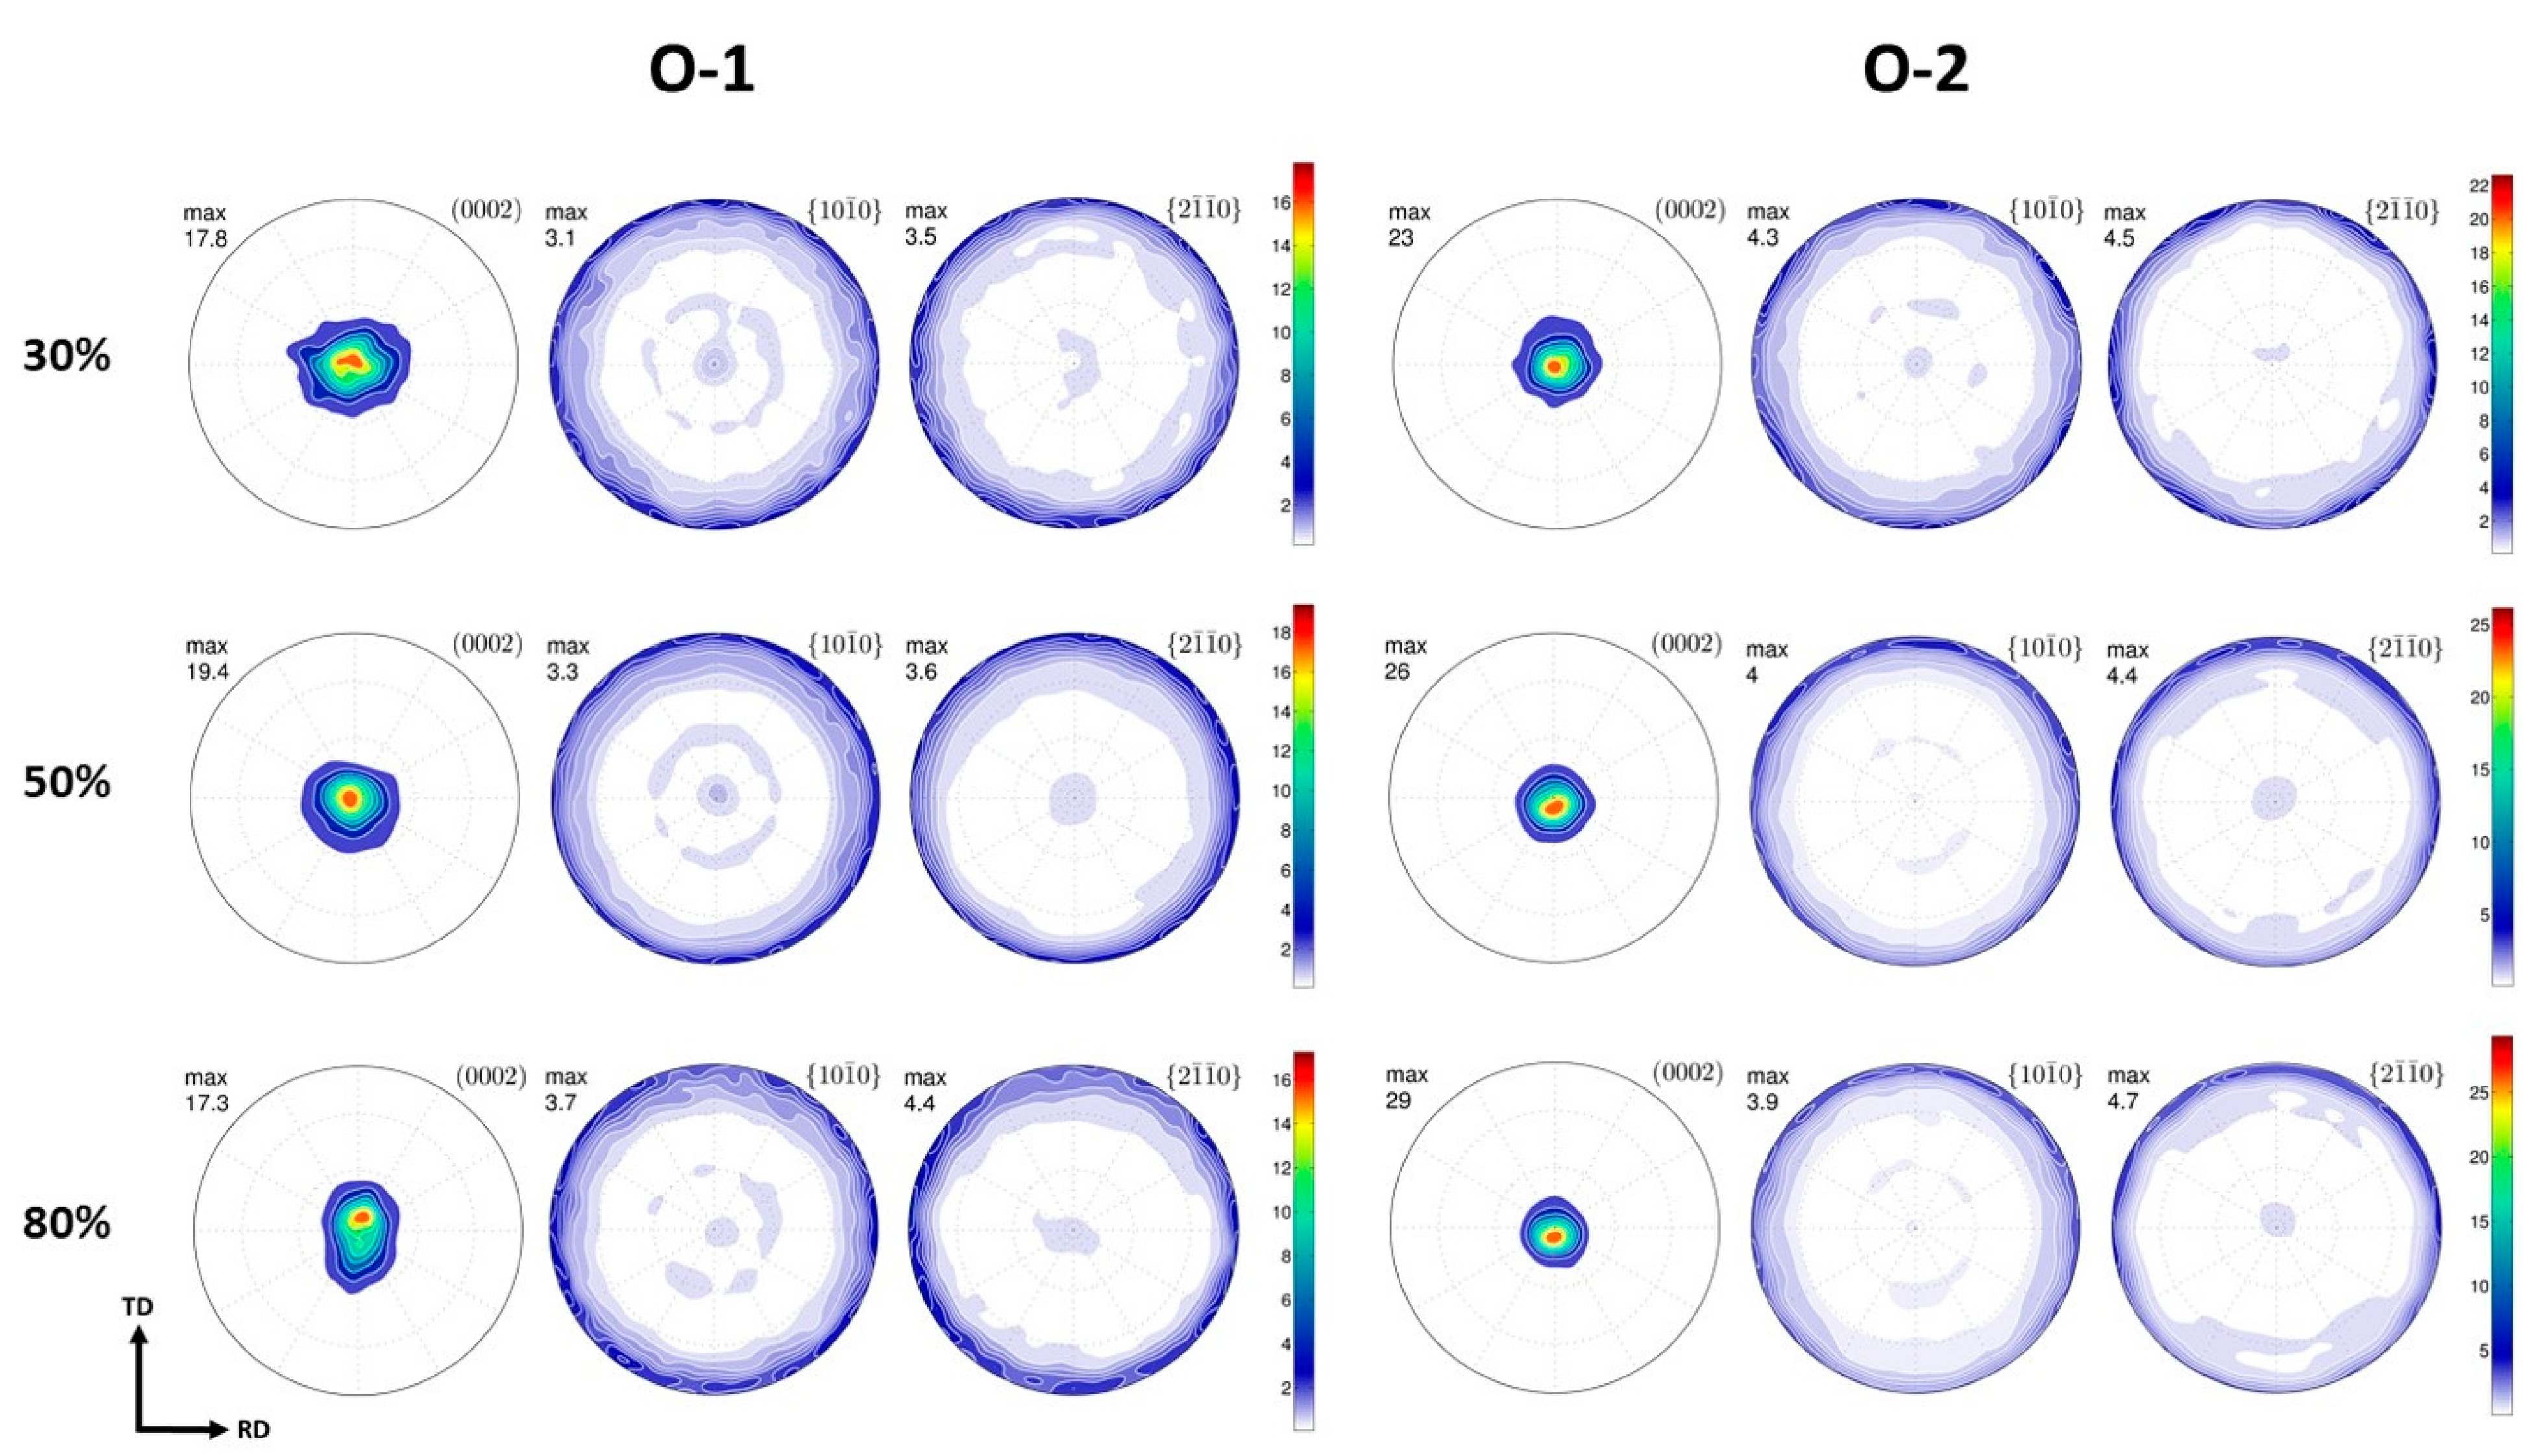
Texture measurements were carried out along the sheets and the average texture was reported by means of pole figures (PF) in Figure 4. For O-1 at the early stage of , the (0002) pole figure exhibits a strong basal texture with an intensity value of 17.8. On the other hand, the O-2 presents a stronger basal texture with a maximum of 23. The corresponding and pole figures of both orientations reveal that the prismatic plane distributes homogeneously along the transversal and rolling direction of the sheet. Other components can be clearly detected at the center of these; in the , a weak pick indicates that some prismatic planes are parallel to the ND of the sheet. A texture fiber component can be observed at ~30° from the ND in this PF, which is the same component shown by the weak peak at ND of the pole figure.
With increasing strain at of reduction thickness, in the O-1 texture, the basal texture intensity became strengthened and reached a value of 19.4. Meanwhile, (0002) PF of O-2 shows an intensity of 26. The increment in the intensity is slightly higher for O-2 than for O-1 with respect to the PF at 30%. Regarding the and pole figures, the same components described at 30% can also be observed at 50%.
At the final reduction thickness of , the (0002) PF of O-1 reveals the emergence of a double-pick component slightly deviated from ND with a maximum of 17.3, weakening the basal texture compared with previous stages. In the case of O-2, the maximum of the basal PF increased until 29.0 and no changes in the components that have already been described in previous deformations were found.
According to the microstructure evolution, it is certain that the texture development is strongly associated with the changes on the microstructure during rolling. In general, a strong basal texture with a non-preferential orientation of the a-axis was observed in both orientations since 30% until 80% of thickness reduction, but this basal texture is weaker in O-1 than in O-2. Also, at 80% in O-1, there is a decrease in the intensity of basal texture and the presence of a new double-pick component, the opposite to O-2, where there is always a strengthening of the texture and the components stay the same.
3.3. EBSD Measurements
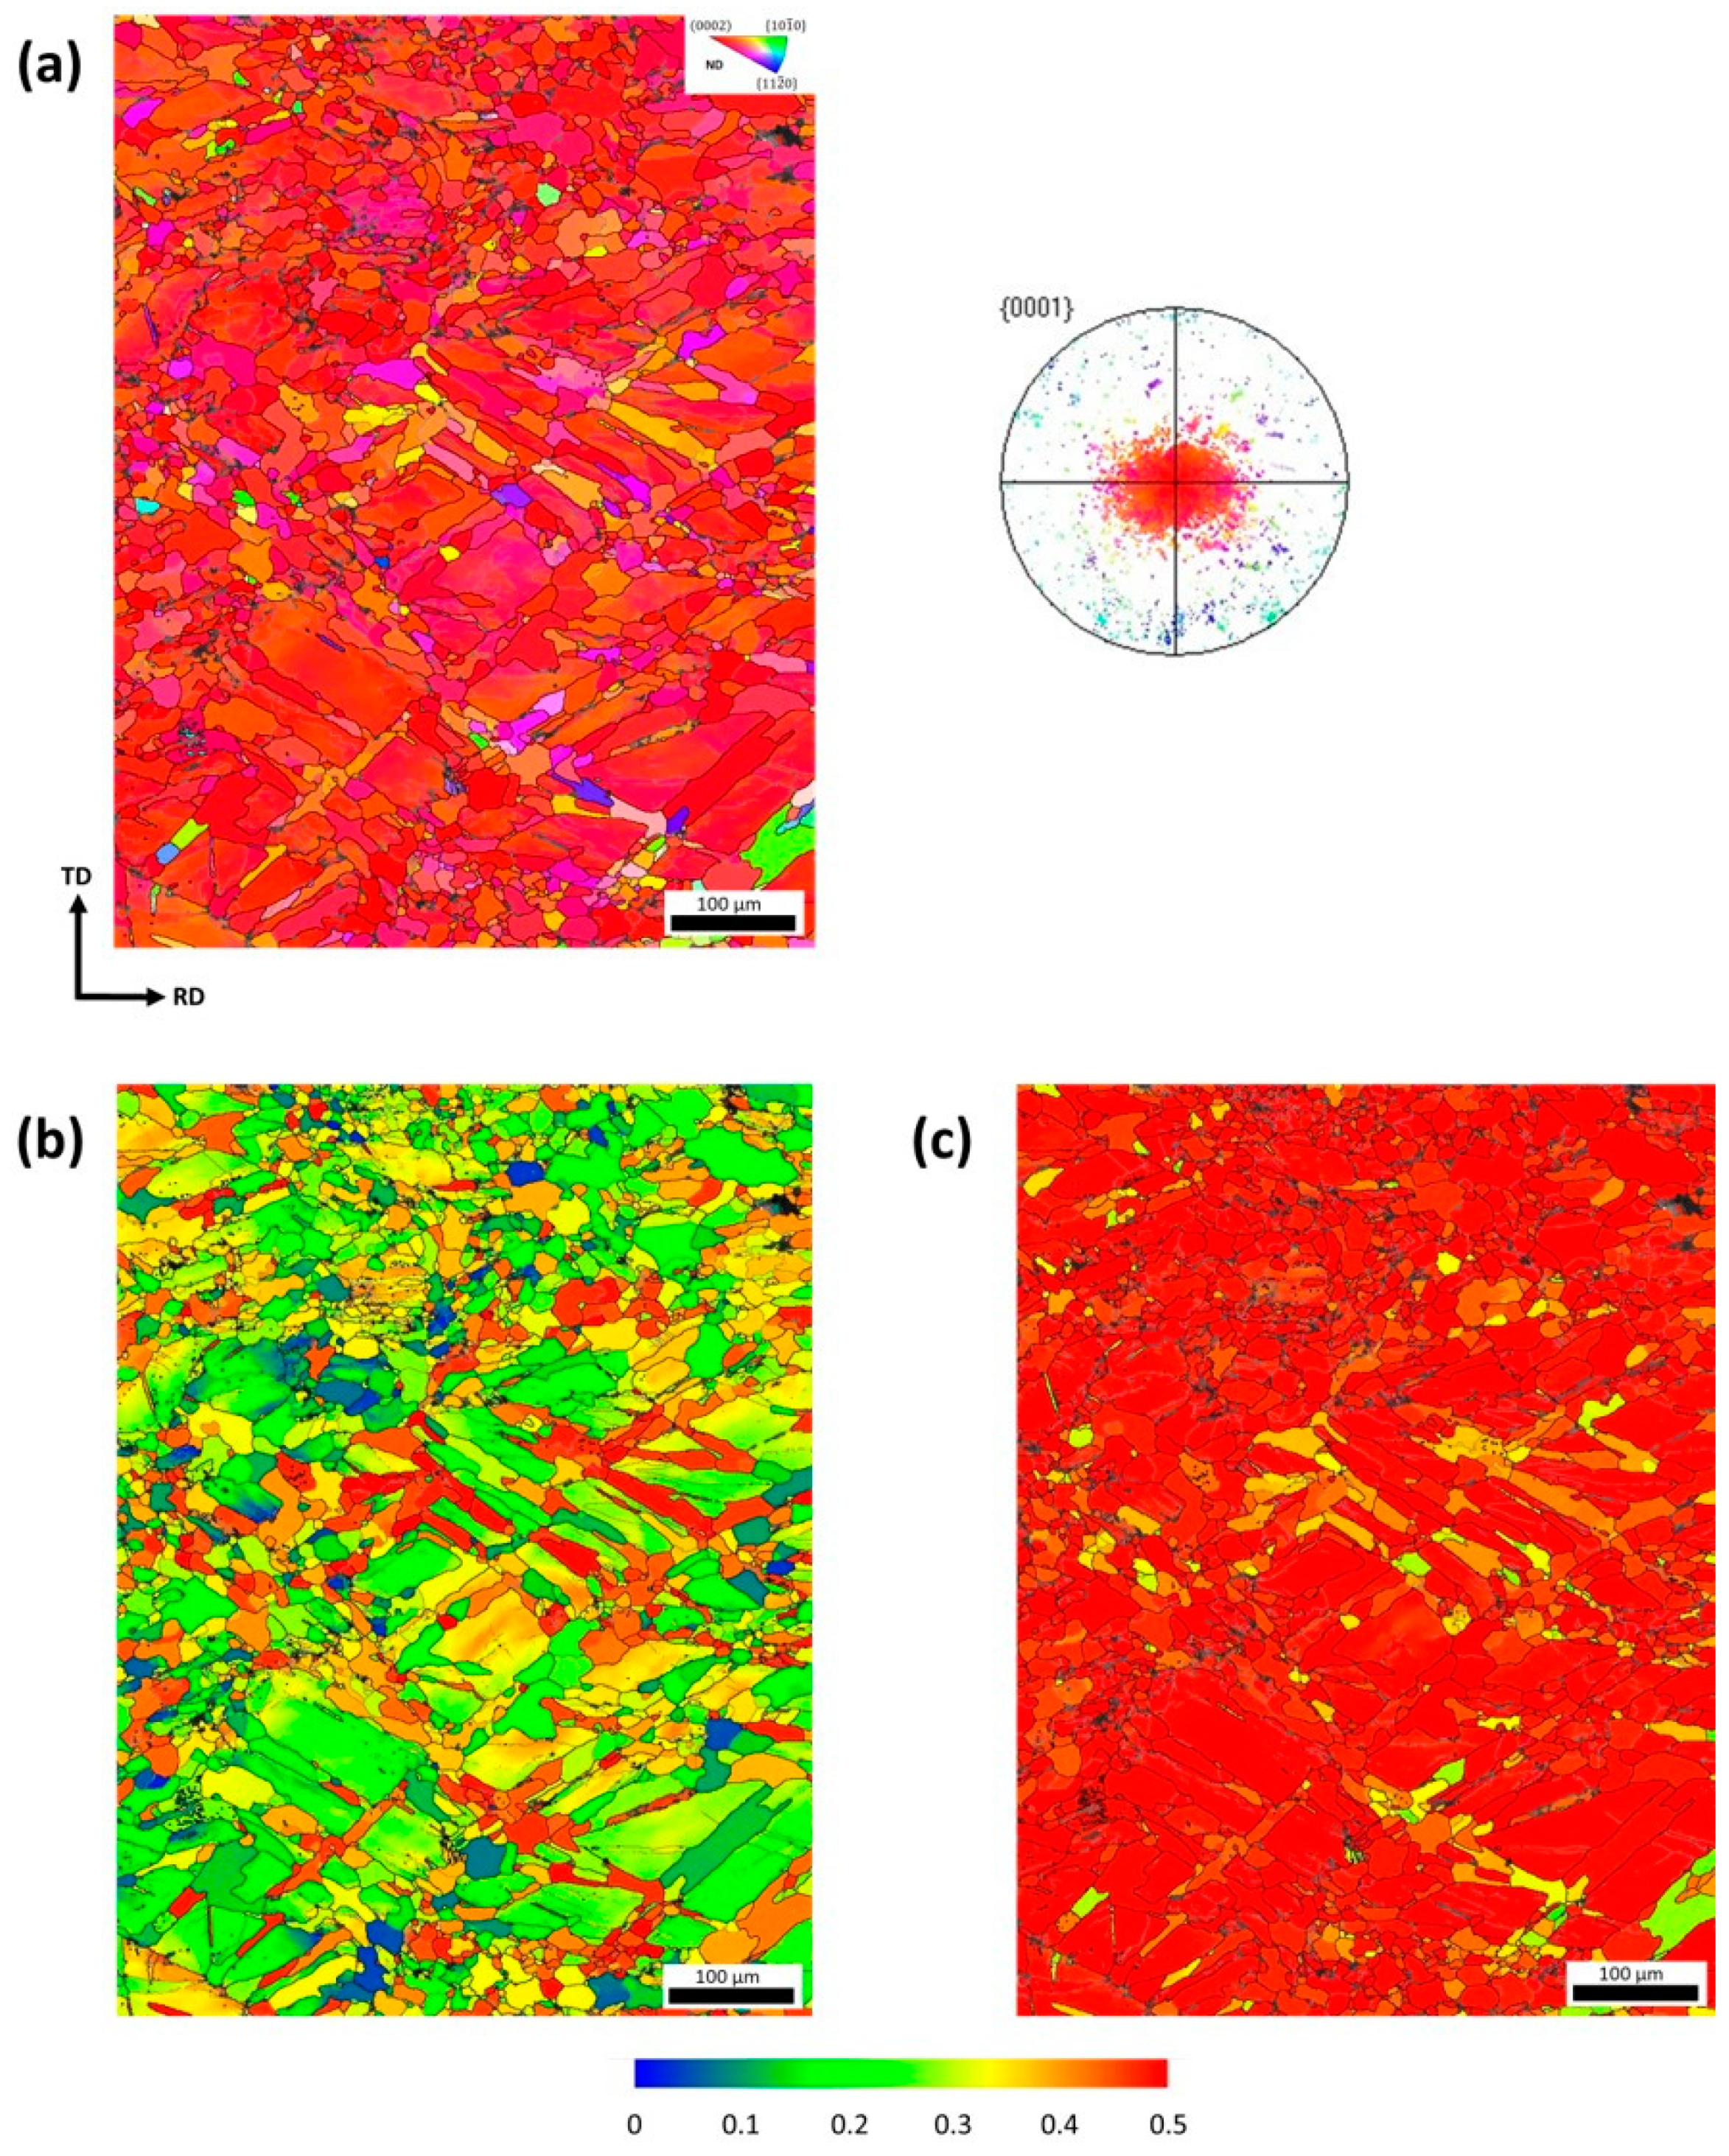
The microstructure evolution was characterized by EBSD to reveal the twin types during magnesium single crystal rolling. The orientation maps are presented in terms of inverse pole figure coloring with respect to the ND. A step size of 0.7 µm was used for all measurements. High-angle grain boundaries (HAGBs, >15°) were highlighted in black and low-angle grain boundaries (LAGBs, 2–15°) in gray. Black areas show remaining zero solutions (non-indexed EBSD patterns) correlating with high local strain areas. Noise reduction was carefully applied to improve the original indexing using a minimum of five neighbors. In the twin boundary misorientation map, the types of twins were determined based on their particular misorientation angles and rotation axes [21]. The deviation of angle and axis to identify the twin boundaries was within 5° of the ideal values. It is important to mention that the Schmid Factor (SF) maps and misorientation profiles will be analyzed in Section 4.
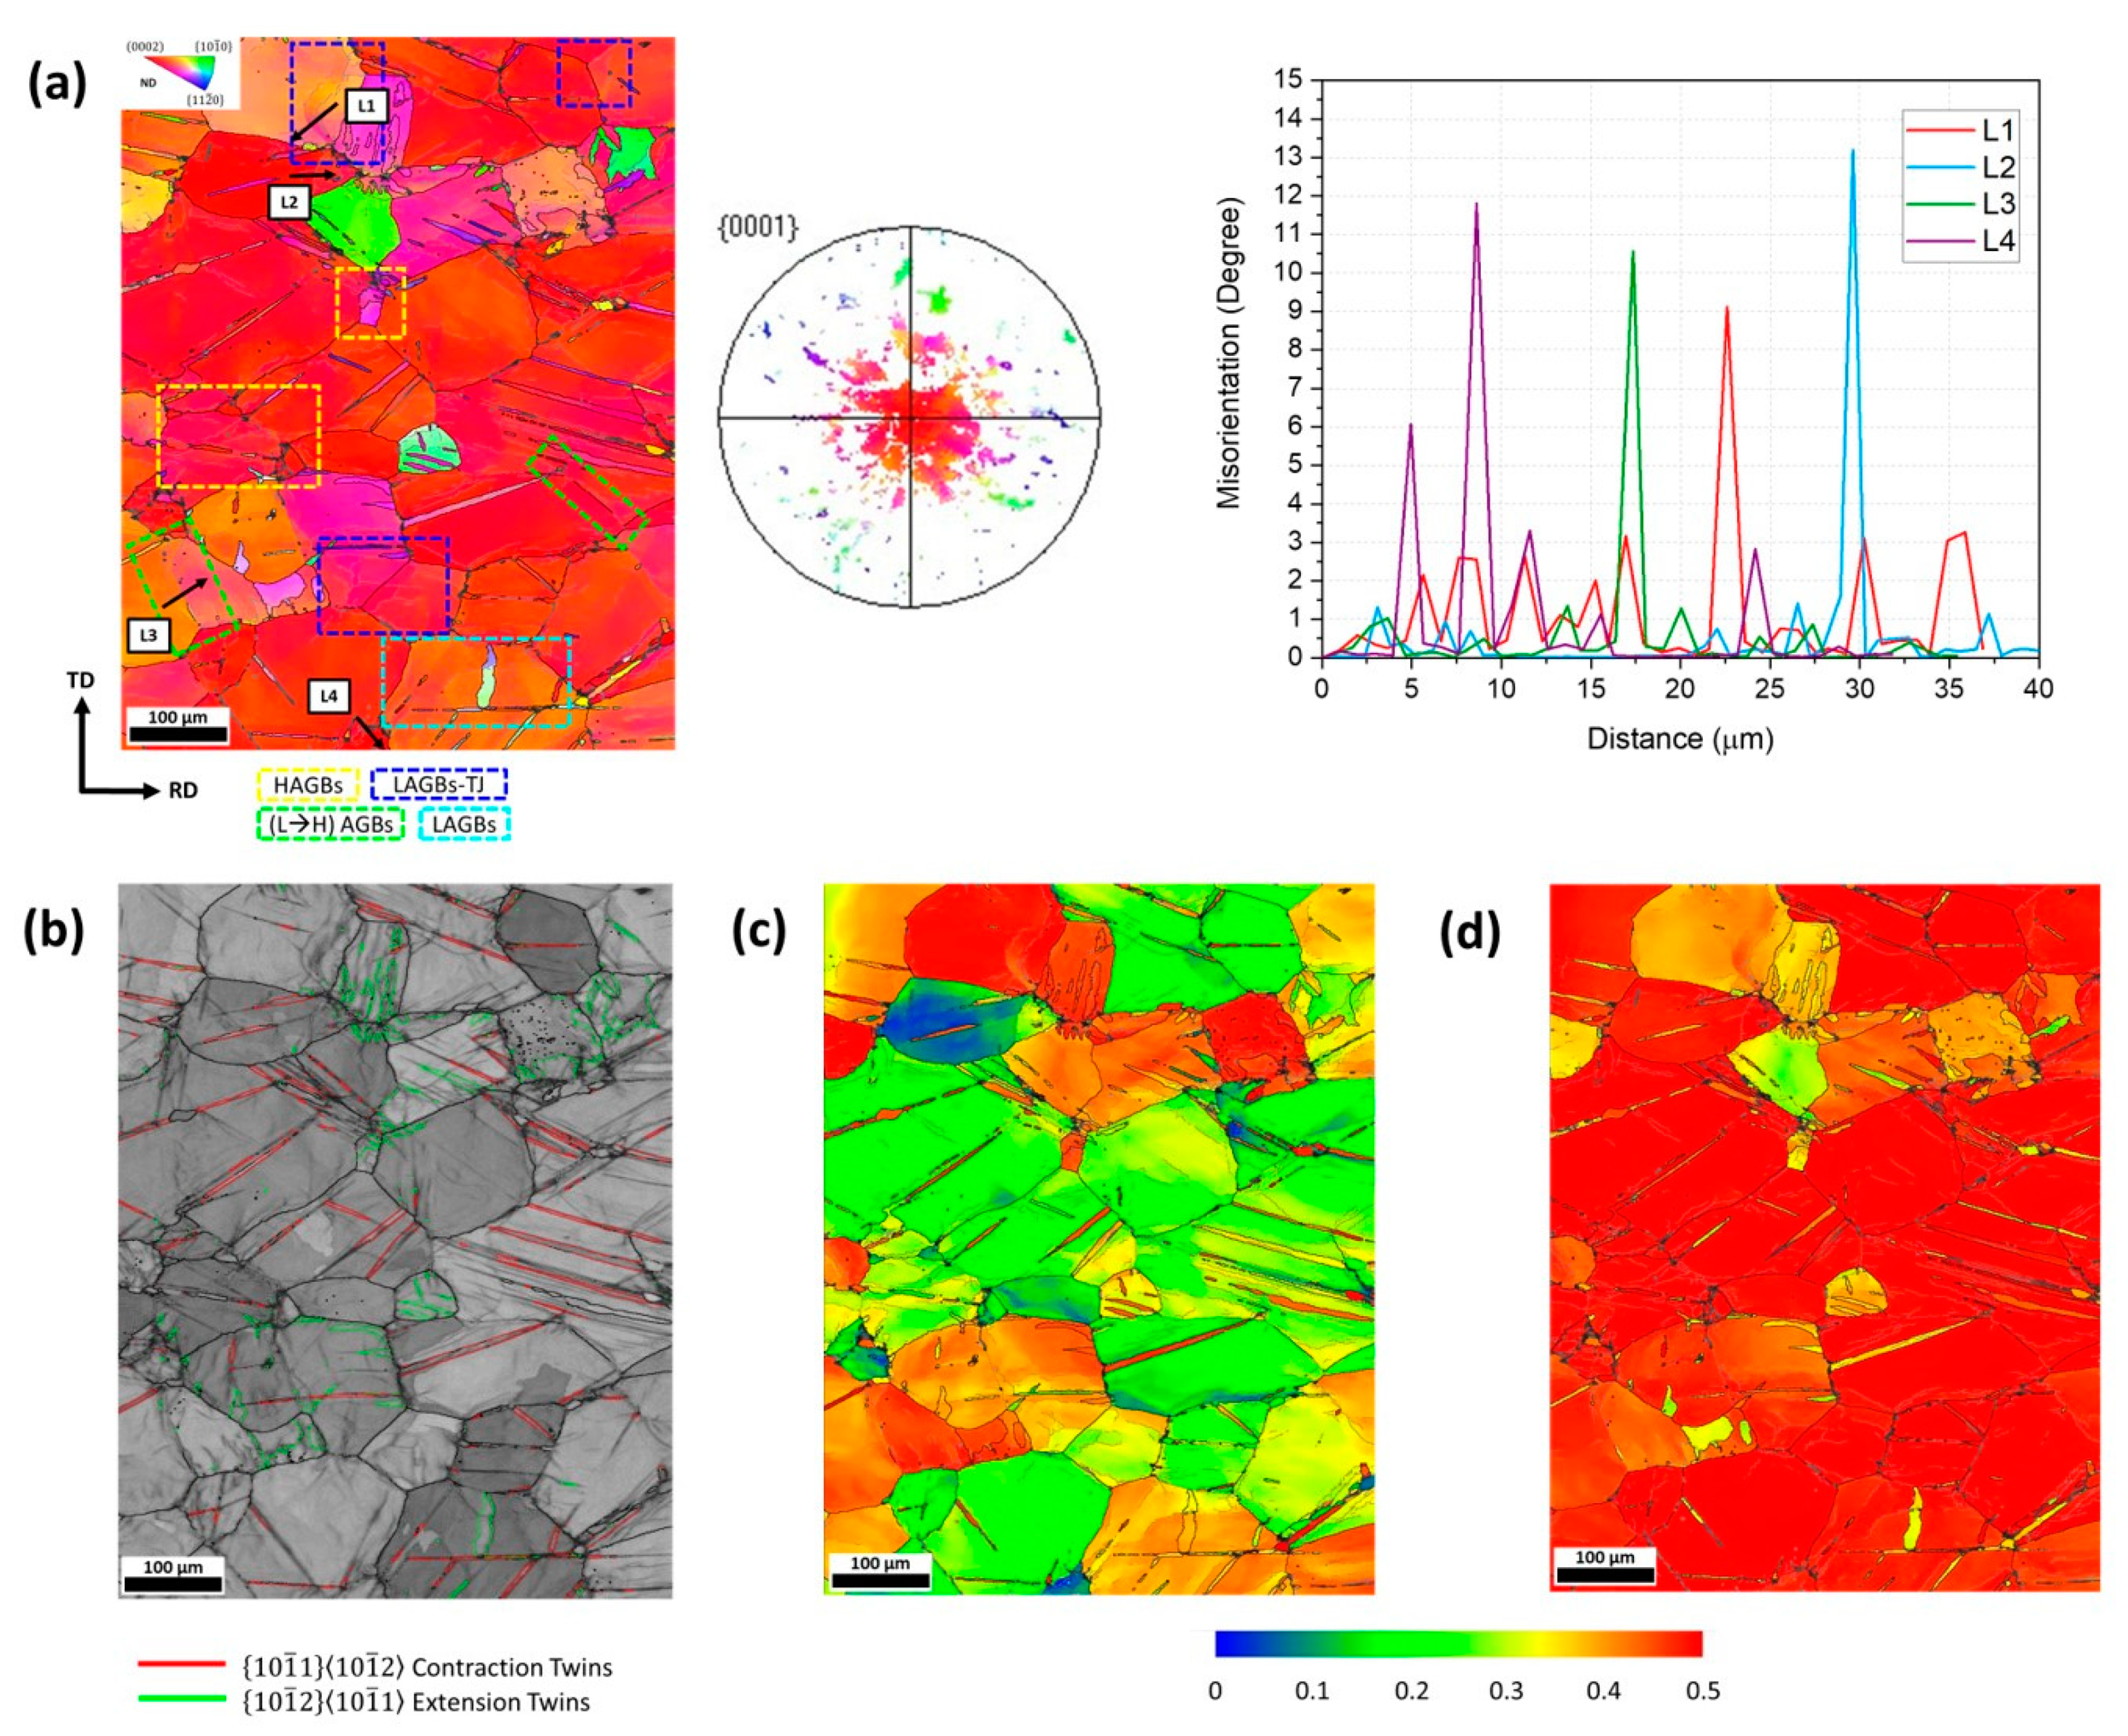
Figure 5 shows the EBSD results of the interrupted rolling at 30% of reduction of O-1. The original indexing for the mapping was 87% and was improved to 97% by noise reduction, and the map size consists of a grid of 818 × 1063 points. The area fraction of extension twins was 0.019 and 0.048 for contraction twins. In the orientation map (Figure 5a), yellow squares point to high-angle grain boundaries (HAGBs), and these belong to grains that recrystallize at the triple junctions (TJ). Blue boxes enclose low-angle grain boundaries that bulged at the triple junctions (LAGBs-TJ). The nucleation of new grains at the triple junction could be related to the discontinuous dynamic recrystallization (DDRX) mechanism occurrence [22], but it is not the purpose of this paper to address this analysis. Meanwhile, green boxes point out zones where it is possible to observe the transition from a LAGB to HAGB (gray-grain boundary to black-grain boundary), but not at the triple junctions. Cyan rectangles enclose LAGBs that completely cross an extension twin, indicating that the dislocations can slip into the parent grain, completely cross the twin, and move onto the parent grain again.
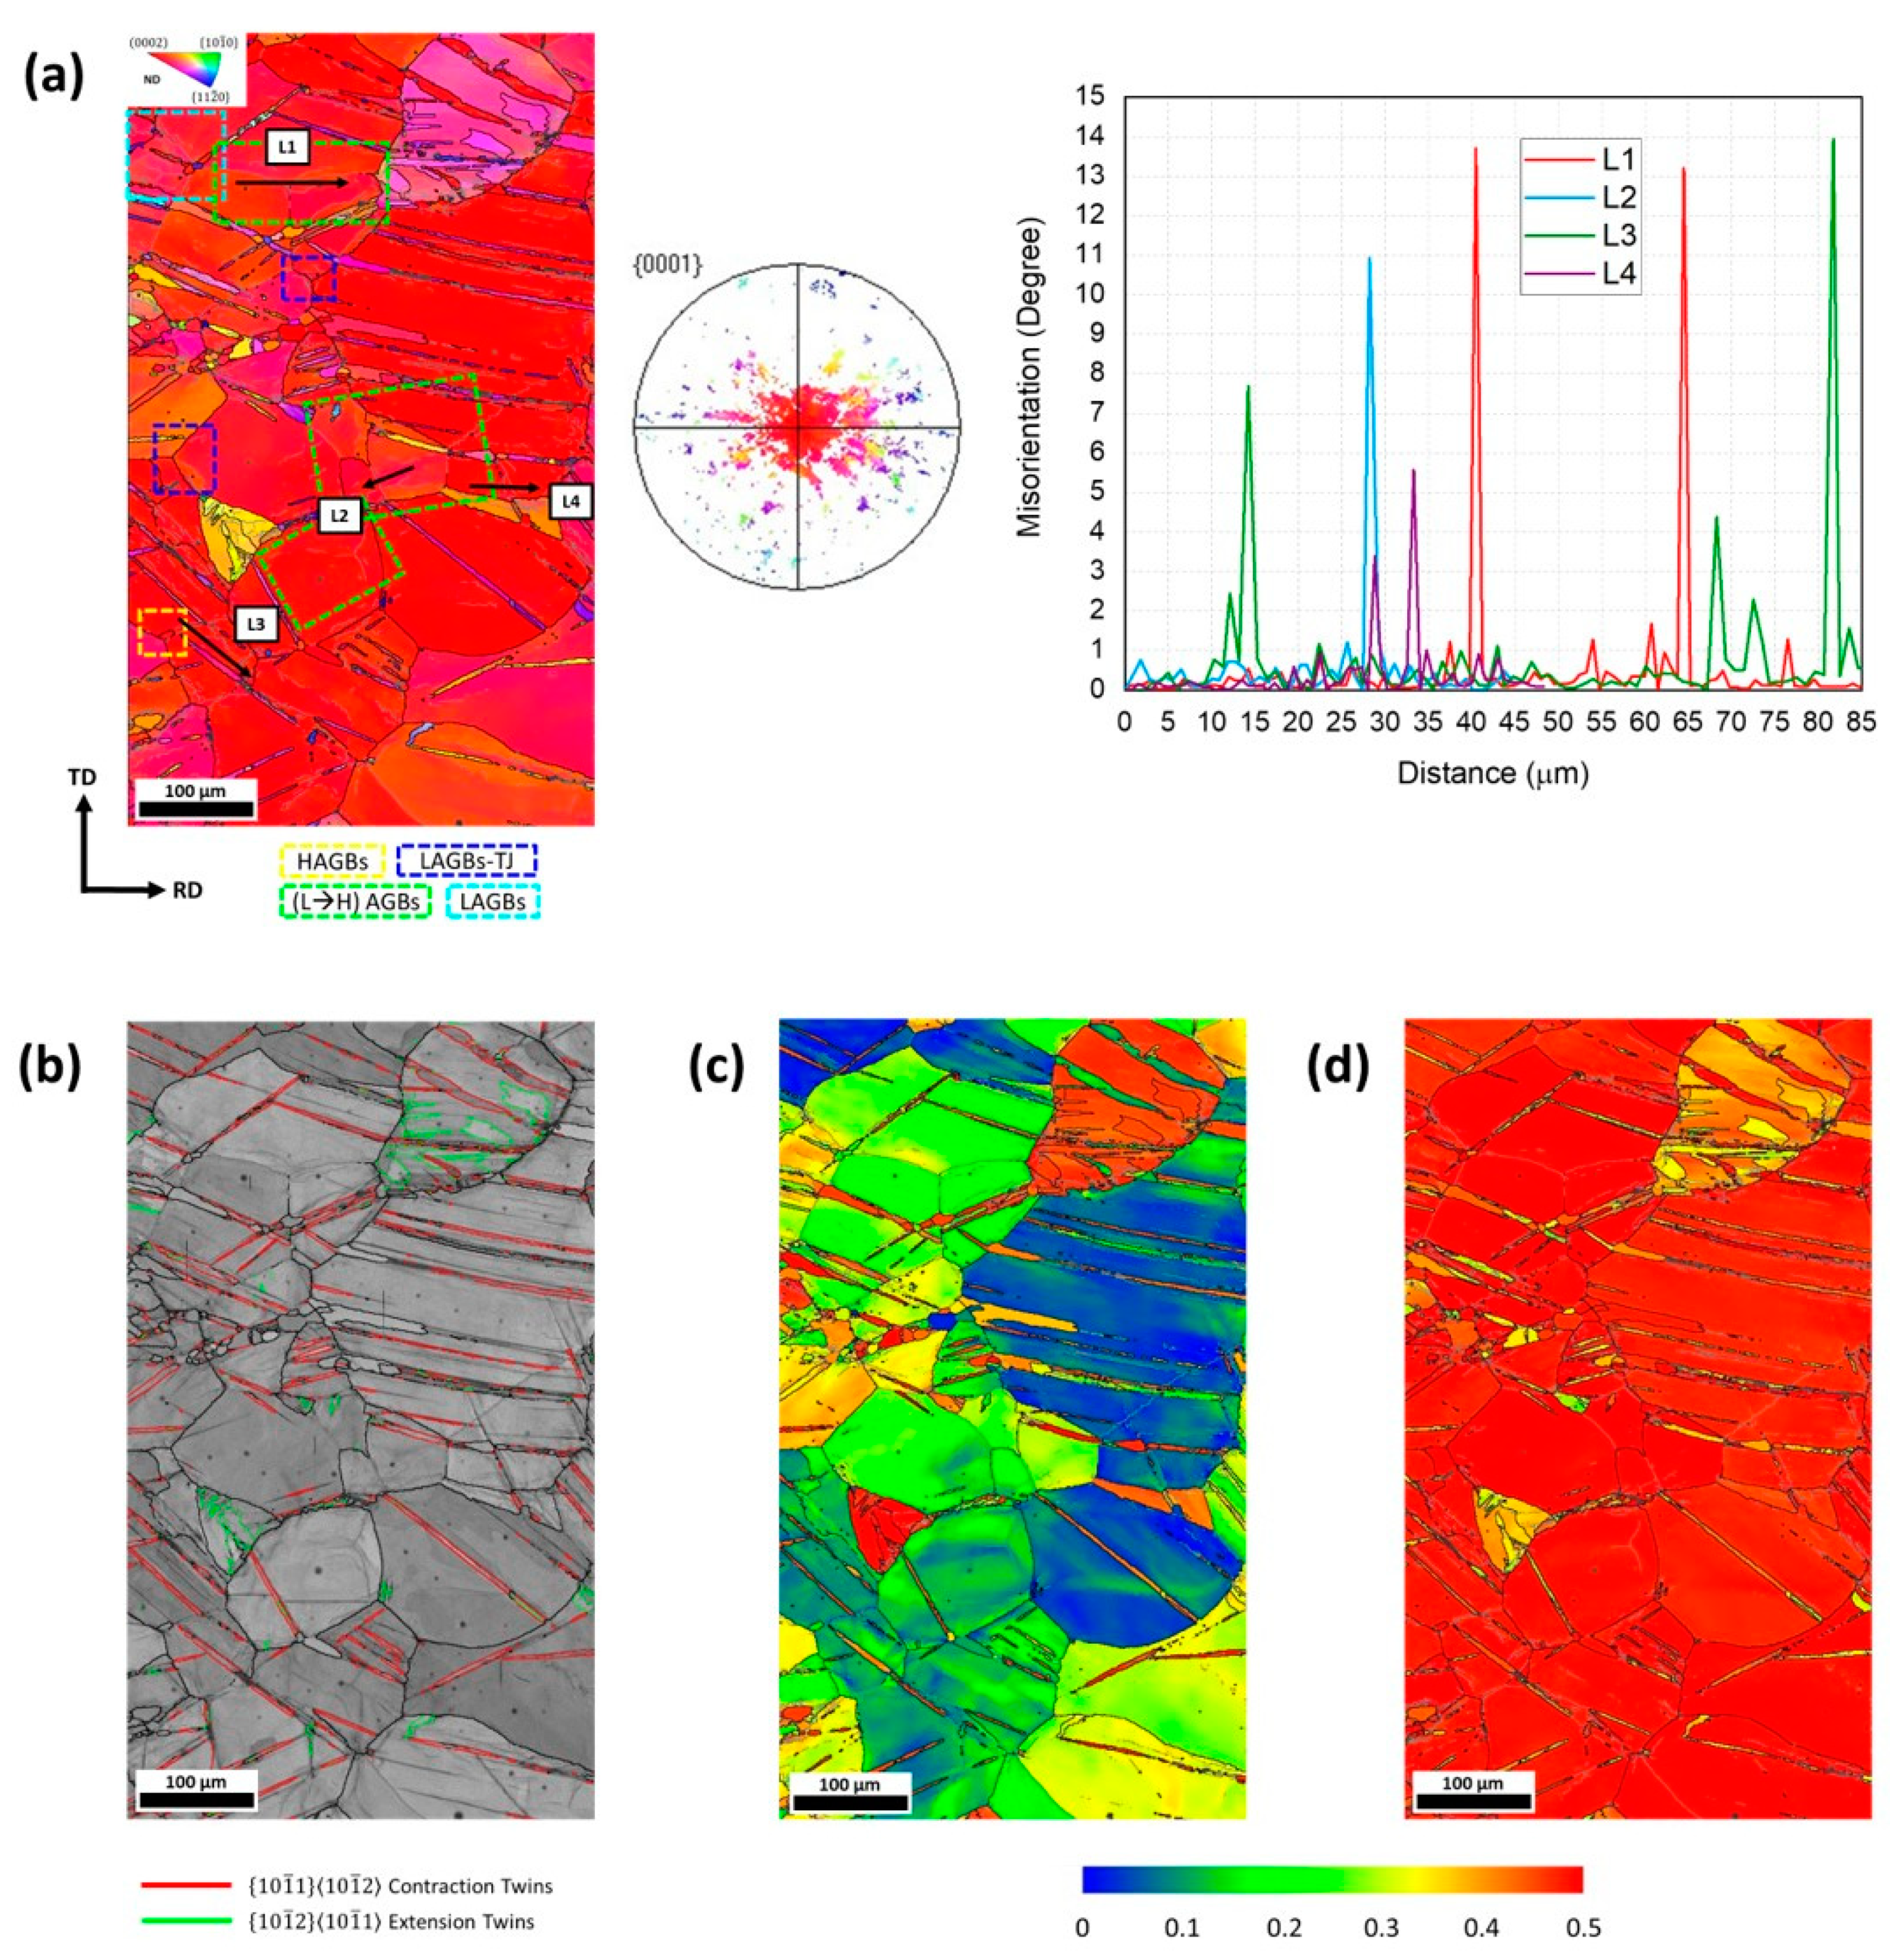
The corresponding orientation map of O-2 at is presented in Figure 6: the original indexing was 88% and was improved to 97% by noise reduction, and the map size consists of a grid of 545 × 926 points. The area fraction of extension twins was 0.009 and for contraction twins it was 0.076. In the orientation map (Figure 6a), yellow squares point to high-angle grain boundaries (HAGBs), and these belong to grains that recrystallize at the triple junctions (TJ). Blue boxes enclose low-angle grain boundaries that bulged at the triple junctions (LAGBs-TJ). Cyan rectangles enclose nets of LAGBs that do not crowd at triple junctions. Green frames show zones where the transition from a LAGB to HAGB can be observed. As in O-1, the new matrix has basal-oriented grains, and consequently, compression twins were formed inside. Compared to O-1, more contraction twins (CTs) were observed (Figure 6b), and this can be explained if we analyze the EBSD map where grains of more solid red coloration were observed, i.e., the basal plane in this orientation was aligned almost parallel to the sheet, rendering the c-axis almost parallel to the compression load induced by rolling. This can also be observed in the PFs of Figure 4, where the intensity of the basal component of O-2 is higher and sharper than O-1.
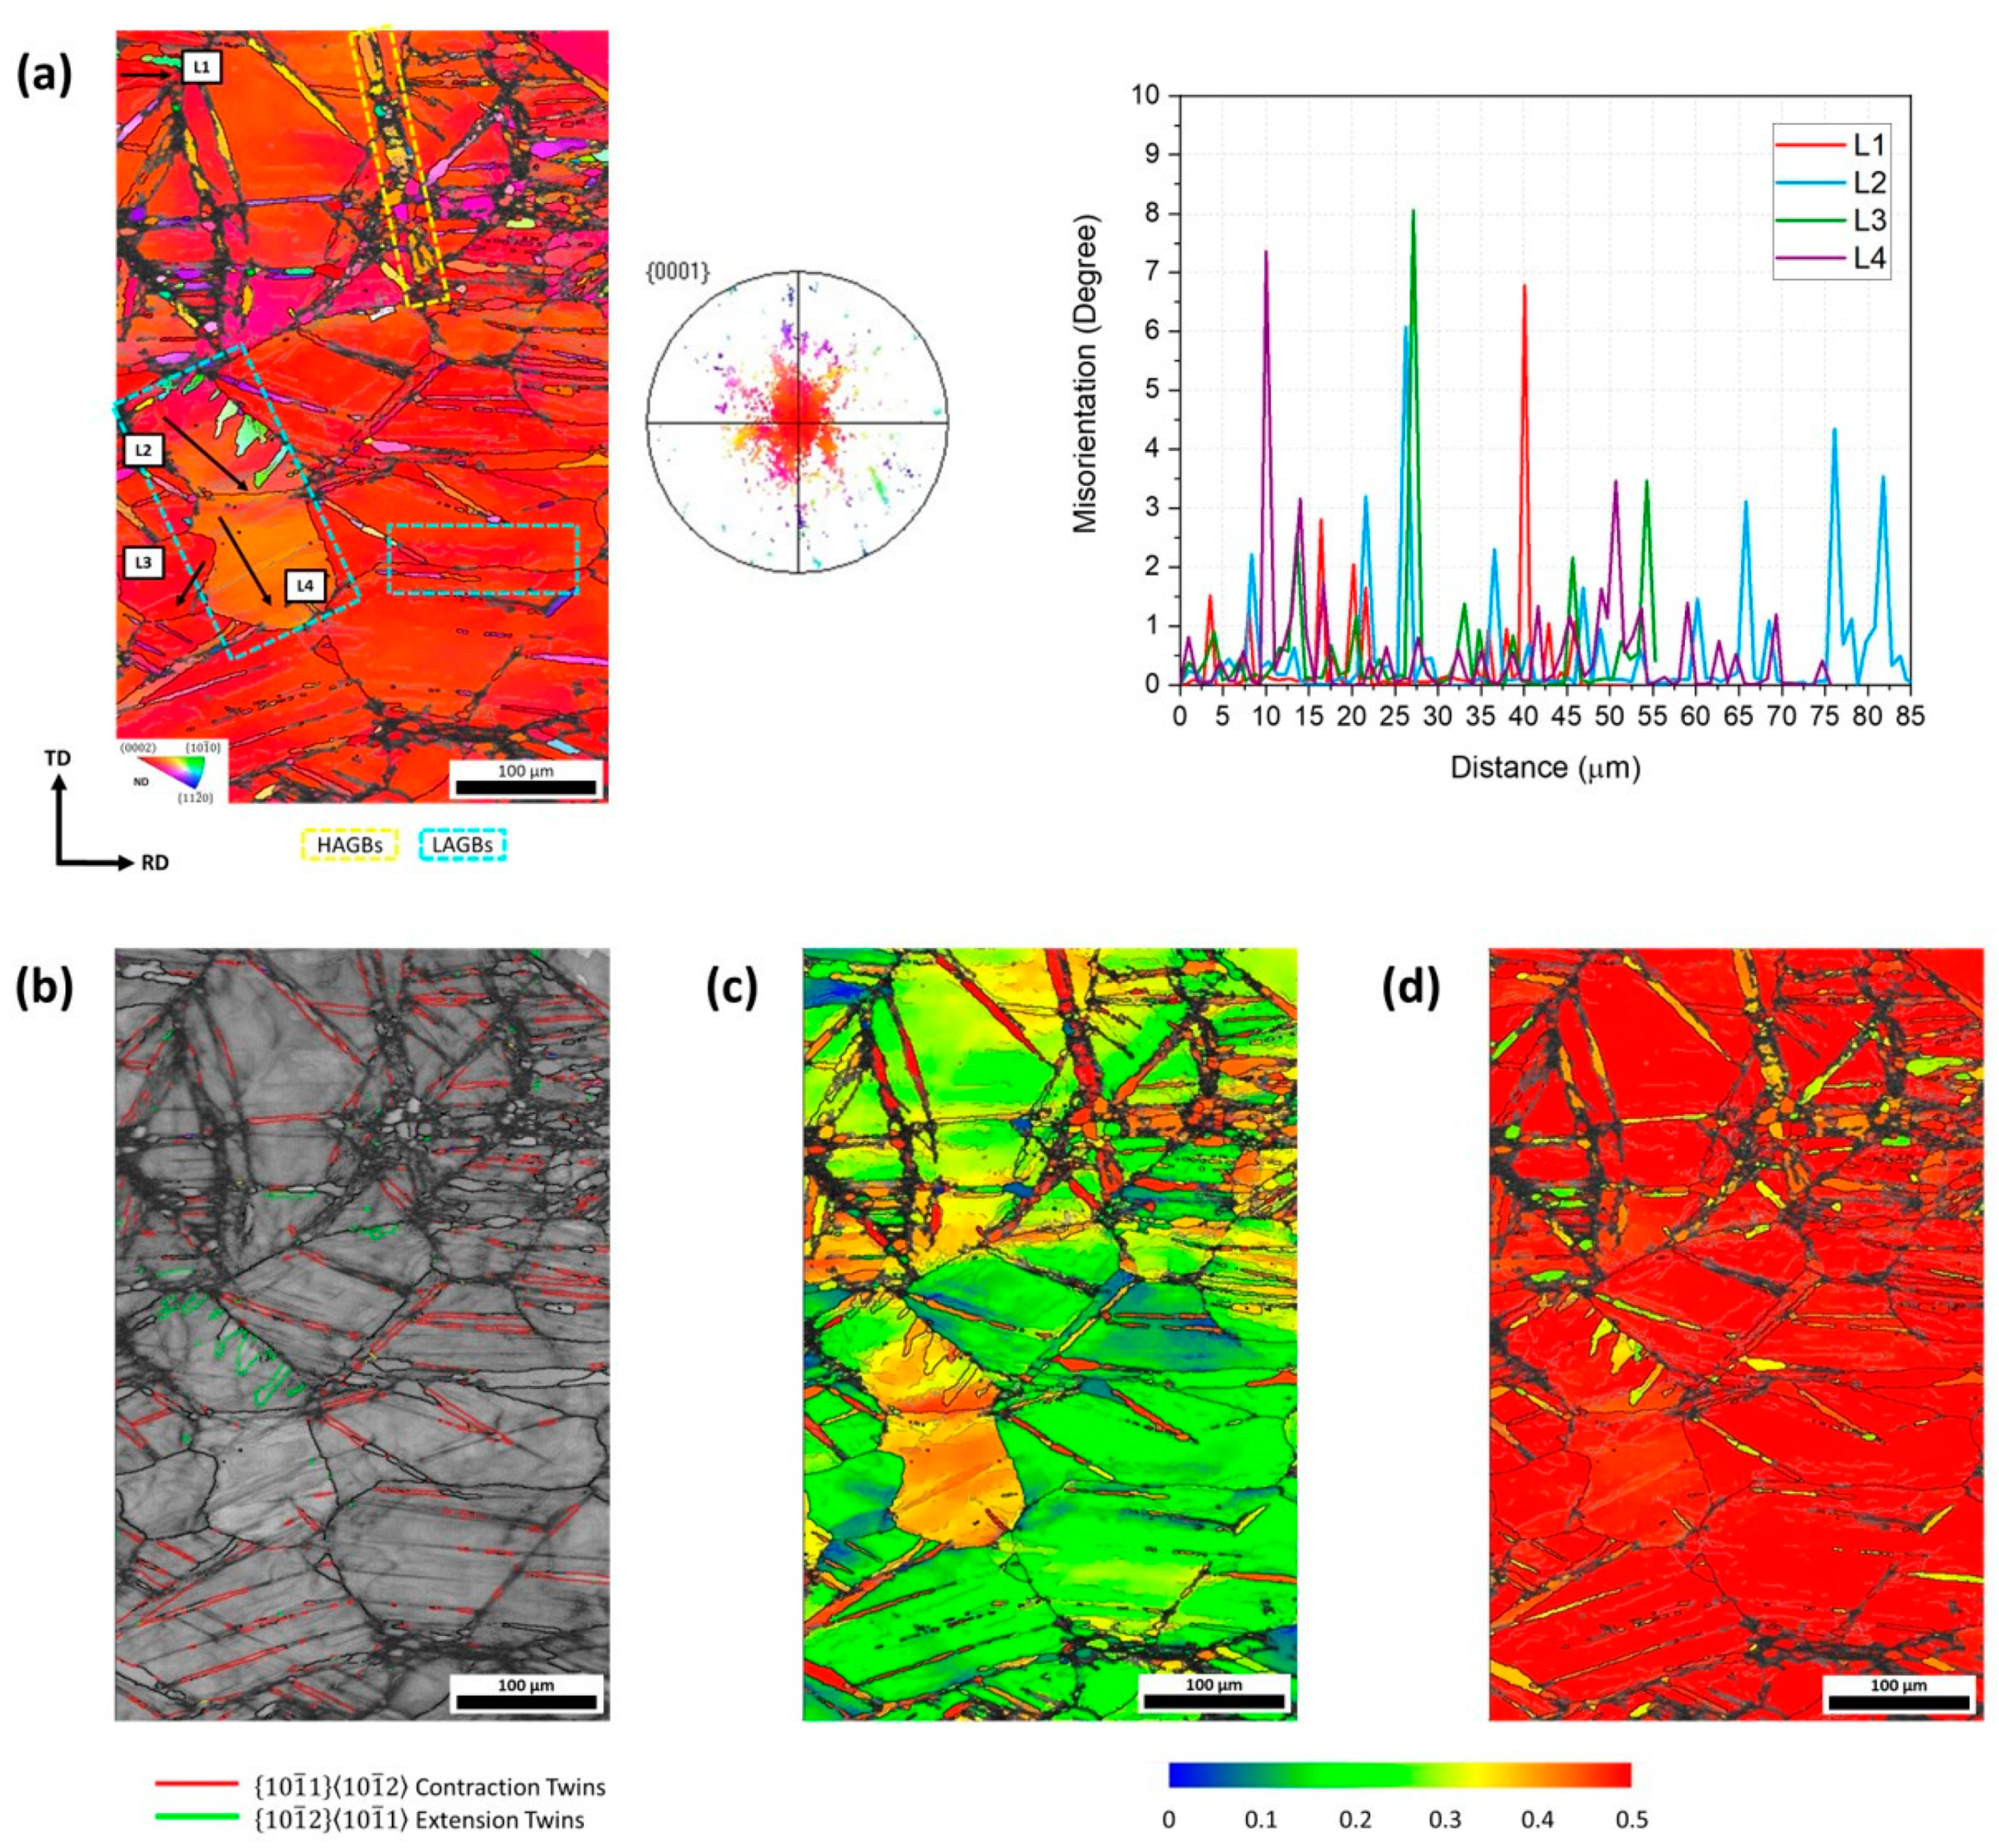
Figure 7 shows the EBSD result of O-1 at , where the original indexing of the map was 78% and was improved to 84% by noise reduction, and the map size consists of a grid of 505 × 788 points. The area fraction of extension twins of this map was 0.008 and 0.07 for contraction twins. Twin bands embedded in a ‘hard’ basal orientation matrix (c-axis nearly parallel to ND) were observed. The orientation map of Figure 7a shows thicker twin bands (some of them were recrystallized) and more low-angle grain boundaries (LAGBs) than those observed at 30%. Yellow boxes point out grains that recrystallize inside the contraction twin. There are many areas with zero solution along the bands of contraction twins, which indicate a high deformation inside them. Despite the low index ratio in these zones, fine grains can be observed inside the twin-like morphologies derived from the high concentration of plastic deformation within the twins and its subsequent partial recrystallization. Cyan rectangles enclose nets of LAGBs that do not crowd at triple junctions.
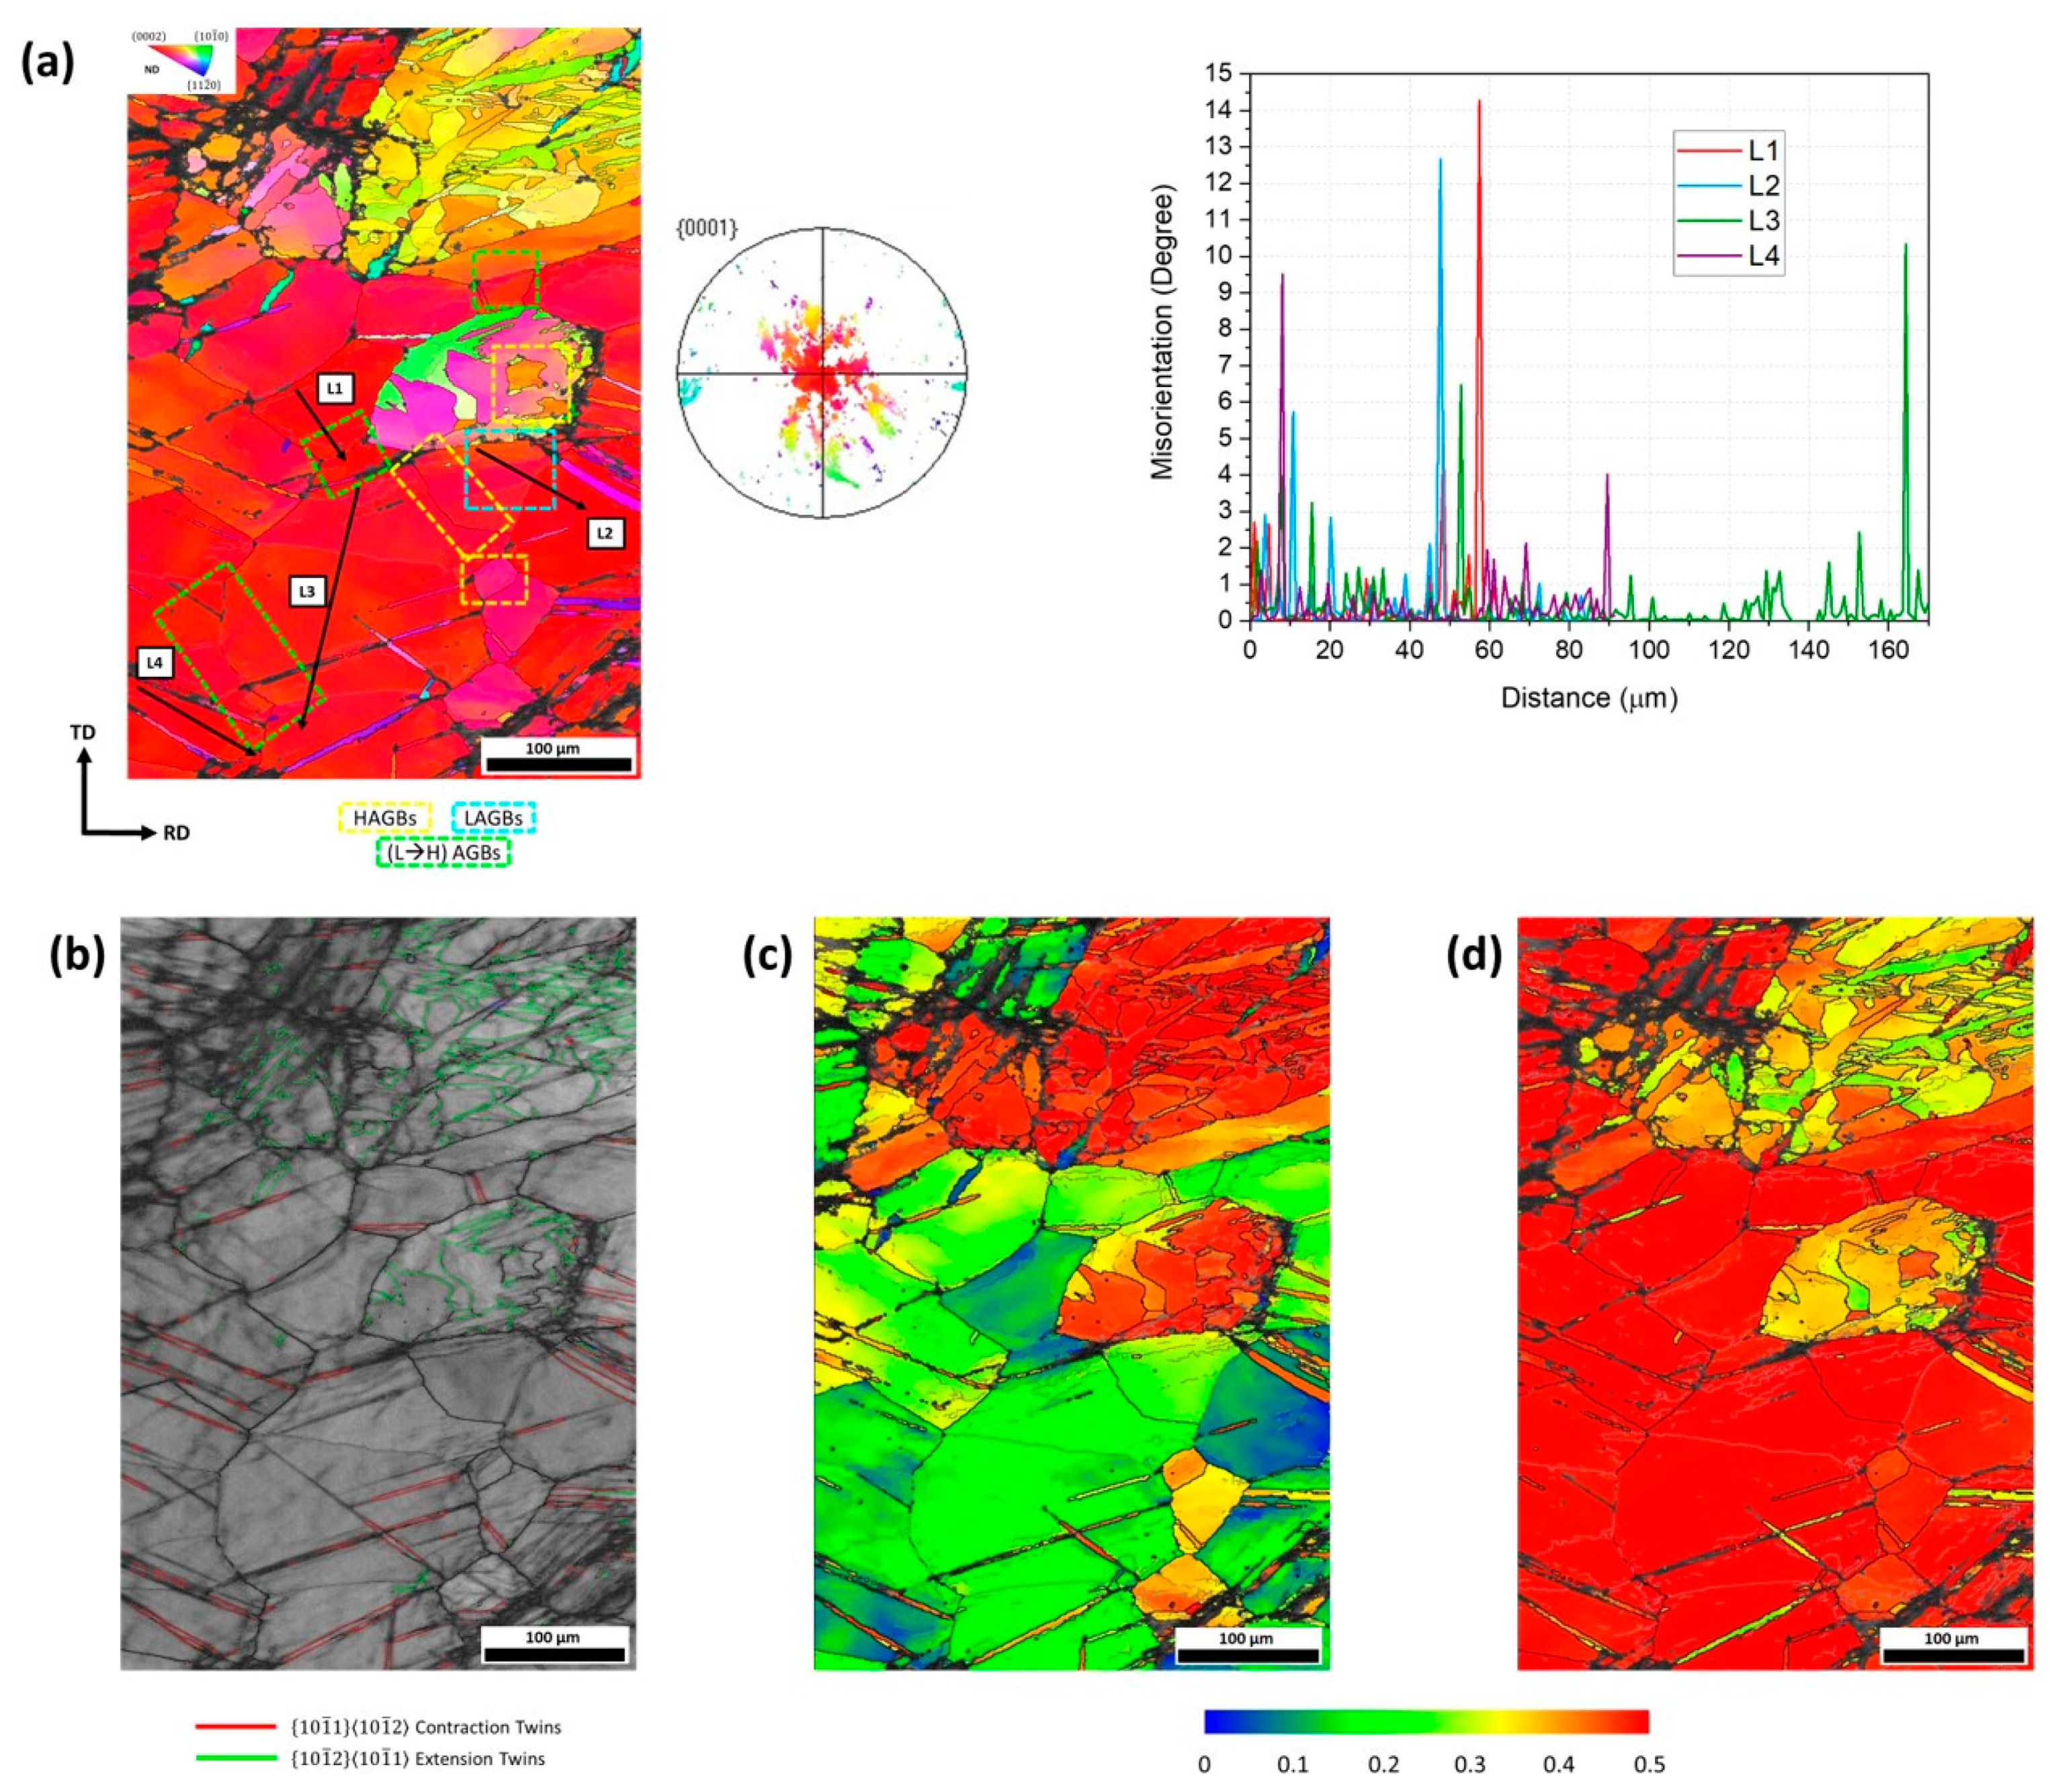
In the orientation map of O-2 at shown in Figure 8, the original indexing for the mapping was 81% and was improved to 88% by noise reduction, and the map size consists of a grid of 511 × 743 points. The area fraction of extension twins of this map was 0.12 and 0.018 for contraction twins. In the orientation map (Figure 8a), yellow squares point out high-angle grain boundaries (HAGBs) that belong to recrystallized grains subdividing the pre-existing grains. Cyan rectangles enclose nets of LAGBs that do not crowd at triple junctions. Green frames show zones where the transition from a LAGB to HAGB can be observed. Also, in this case, most of the grains have the basal plane almost parallel to the sheet plane and therefore many lenticular twins were located inside, but were thinner than those observed in O-1, and recrystallized grains are not clearly observed inside the twinned area.
Figure 9 shows an EBSD map for O-1 at of thickness reduction. The original indexing for the mapping was 89% and was improved to 98% by noise reduction, and the map size consists of a grid of 850 × 1145 points. The microstructure is not homogenous, and a typical bimodal microstructure consisting of fine and coarse grains was observed. The coarse grains belong to the basal matrix observed in the previous strains. On the other hand, most of the fine grains were originated by the DRX process inside the twins. Practically, all grains have a basal orientation or very close to it. However, some grains near to and components can also be observed inside the twin-like morphologies, although in a much smaller proportion. The map does not show twinning activity despite the same temperature of deformation and similar texture compared to 30% and 50%, but an evident smaller grain size, indicating the susceptibility of the twinning to the grain size compared to other parameters.
Finally, Figure 10 shows the EBSD map of O-2 at reduction of 80%, where the original indexing for the mapping was 71% and was improved to 78% by noise reduction, and the map size consists of a grid of 375 × 622 points. This presents partially recrystallized twin bands, leading to grains with orientations slightly deviated from and components. These bands could also be grains elongated by deformation and then recrystallized, since some of them were observed parallel to the RD in particular cases, however due to their morphology (some bands are almost perpendicular to the RD), they were considered as recrystallized twins. There is still a prominent matrix with a basal orientation, which has many LAGBs, but any twin could be found inside.
4. Discussion
4.1. Extension Twinning and Its Influence on the Basal Texture
There are different reports in the literature regarding the twinning activity during deformation of magnesium. Some works report that this activity is negligible during deformation at high temperatures [23,24,25], while others report that twinning is active at high deformation rates regardless of deformation temperature [5,26]. There are also other works that relate twinning activity at high temperatures to large grain sizes [27,28]. In the current work, twinning was an important deformation mechanism, where both high deformation temperature and very large grain size (single crystal) are investigated.
In O-1, the starting orientation was aligned for tensile twinning (Schmid factor of 0.37, compression perpendicular to c-axis). Blue areas from the original orientation () can still be observed but in a very marginal proportion, and it is important to note that most of these blue areas correspond to extension twins (ETs) according to the twin boundary misorientation map (Figure 5b), and according to the (002) PF of scattered data, these areas appear close to the RD, as in the case of initial orientation, which could indicate that these zones are leftovers of initial single crystal. In this way, we can explain how the single crystal was almost completely rotated from (blue grains) to (red grains) by means of nucleation and growth of extension twinning.
The twinned red grains now constitute a new matrix wherein contraction twinning was favorable. This is owing to the c-axis being at 30° from ND (Schmid factor of 0.49, compression load almost parallel to c-axis). At this strain, according to the orientation map, most of the grains have basal planes deviated ~30° from the sheet plane (red-orange grains), so they were subject to compression on the c-axis during rolling; consequently, they show compression twins inside.
As the O-1, the O-2 was aligned for extension twinning (SF = 0.49, compression perpendicular to c-axis), but the active variants according to Schmid’s Law were slightly different in each case. The initial orientation 2 must be colored in green according to the standard IPF, but no grains with this characteristic were detected.
It is possible that twinning explains this lattice rotation from the c-axis parallel to RD to the c-axis almost parallel to ND, and the consequent basal texture in both orientations. The activation of twinning depends on the strain path, compression perpendicular to the c-axis or tension parallel to the c-axis, and their activity is governed by the Schmid law. Usually, the twin variant with the higher Schmid Factor (SF) takes place favorably [29,30,31,32,33], but there are, of course, cases where twinning does not obey a Schmid law [11,34,35]. Therefore, in the following, the twinning behavior was analyzed with respect to the loading and crystal orientation. Its corresponding effect on the evolution of grain orientation was also discussed.
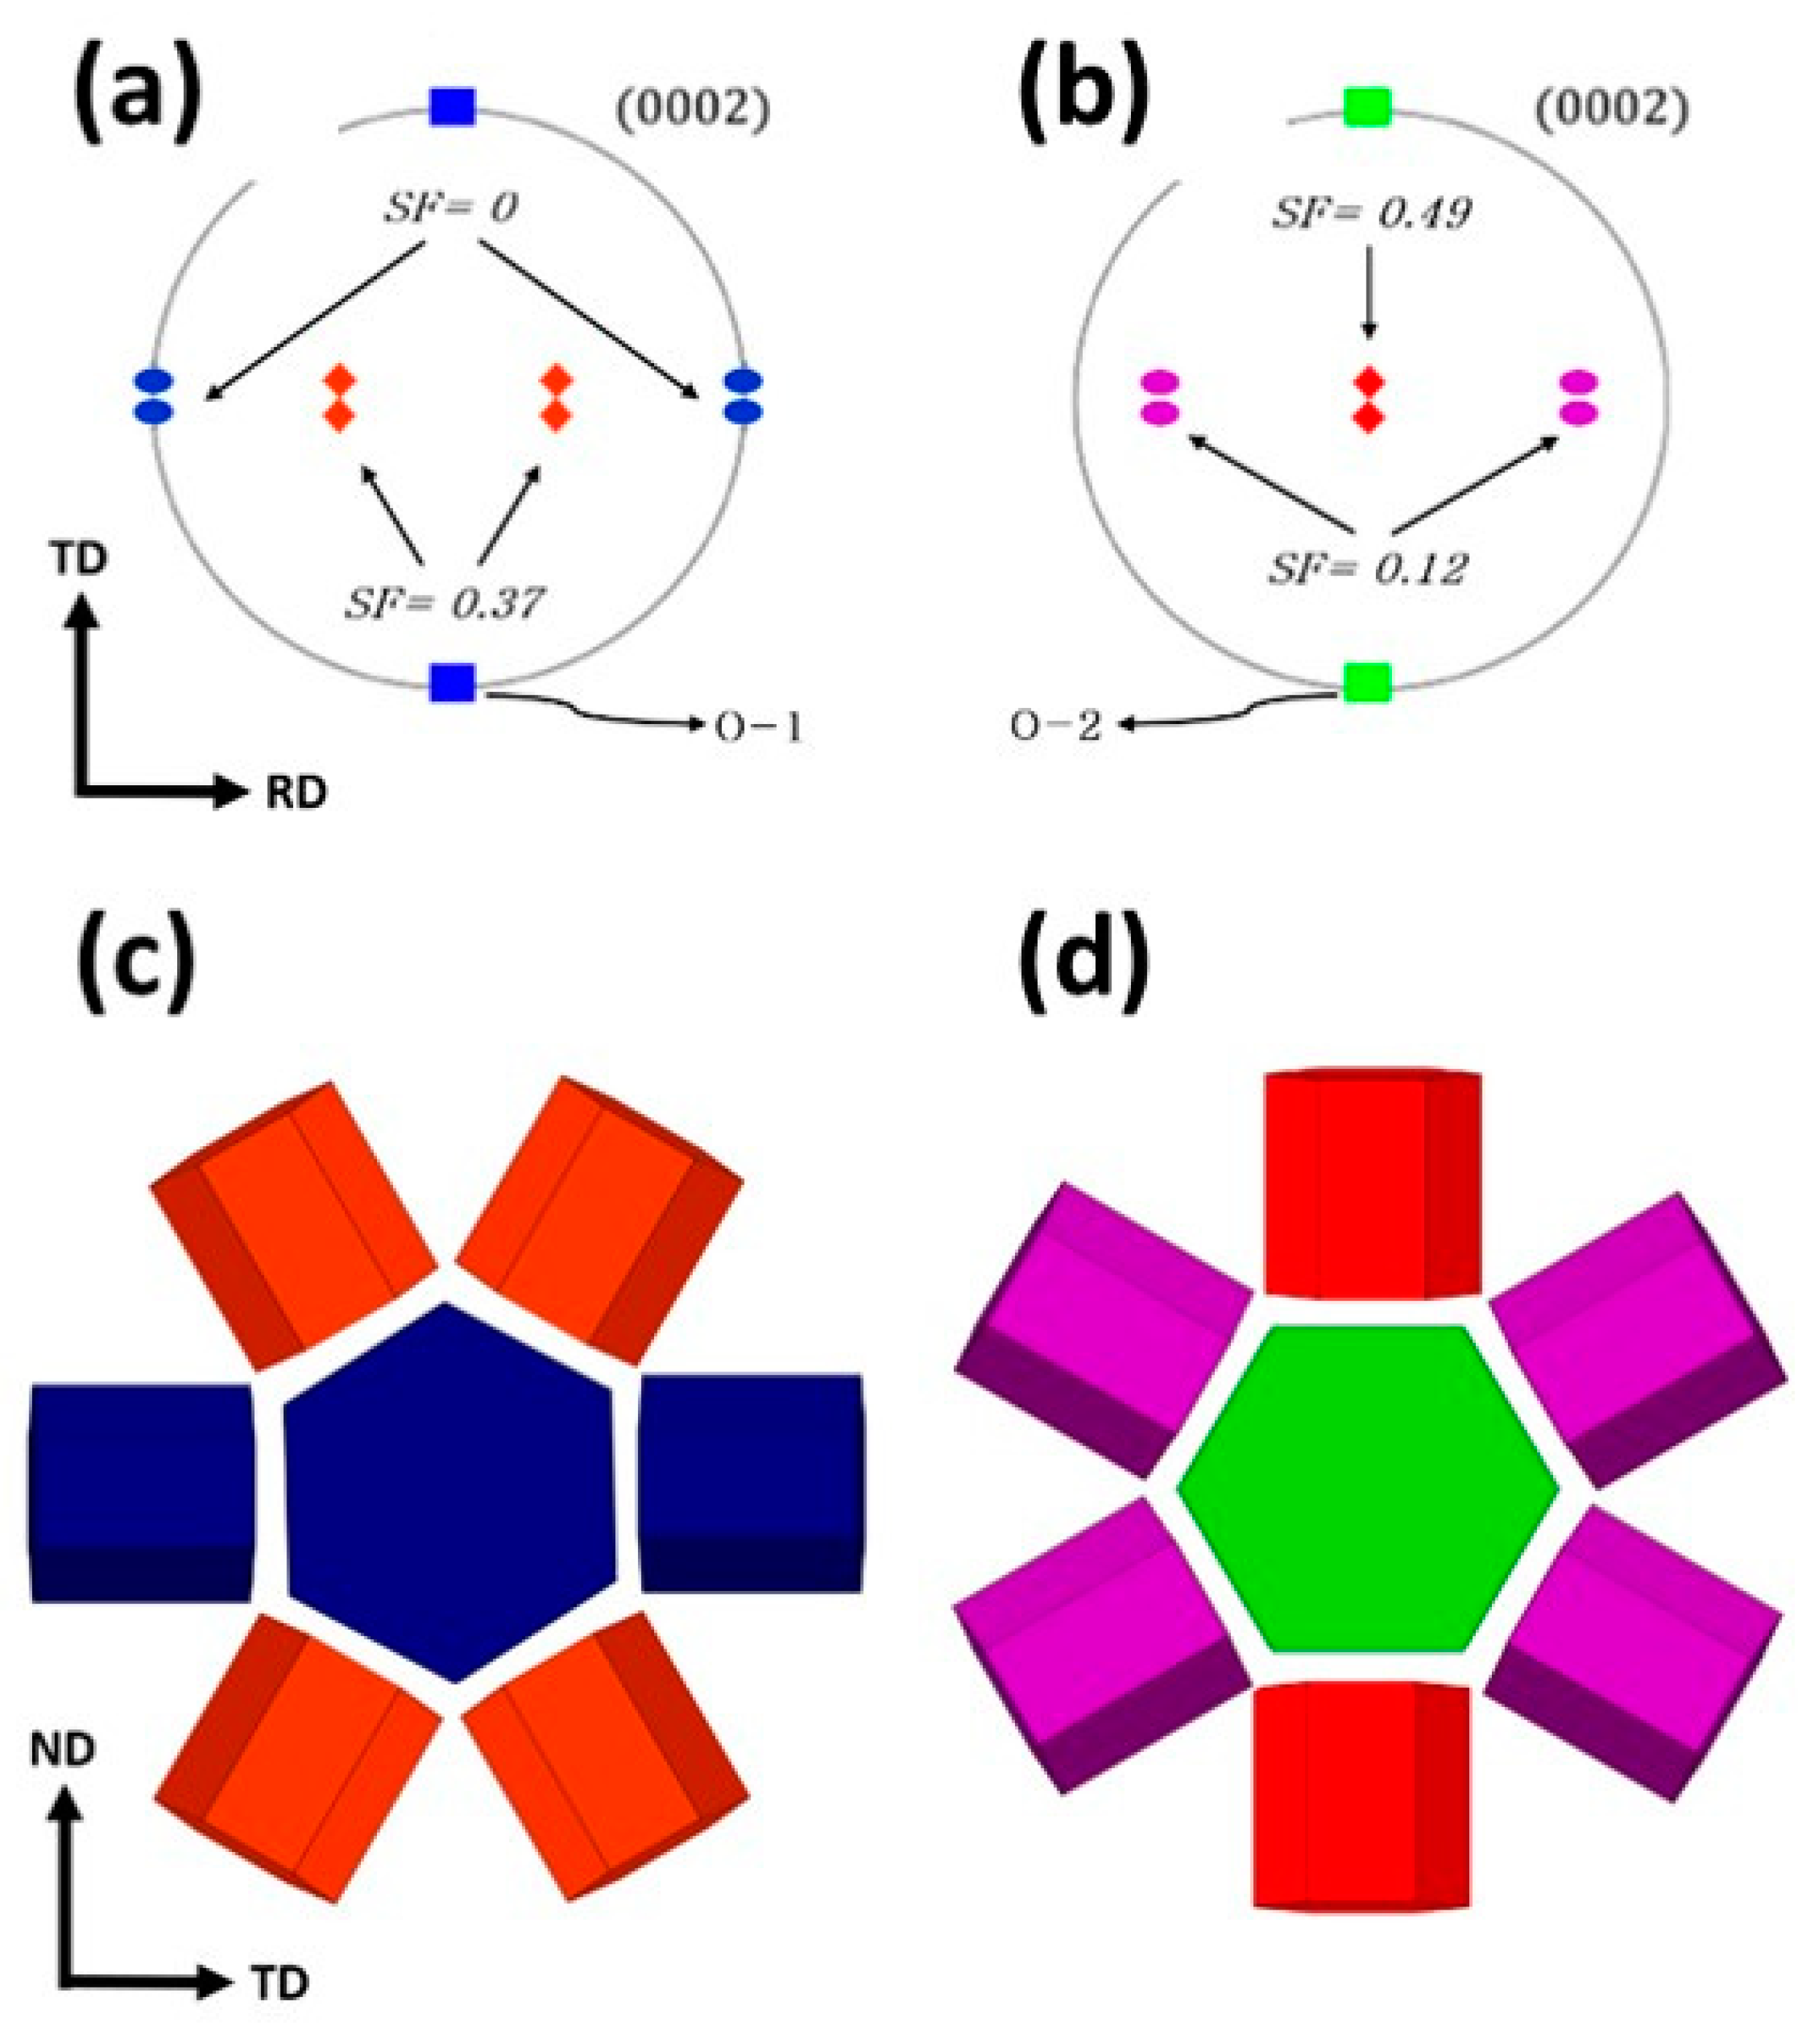
Under rolling, the initial single crystals with the c-axis parallel to the RD were favorably aligned for twinning (compression perpendicular to the c-axis). Theoretically, twinning is possible on six twin variants, , , , , and [29,30,31]. Figure 8a,b shows basal pole figures depicting the calculated extension twin orientations for the initial specimen orientations. To explain the lattice rotation during single crystals’ rolling, the following can be assumed: twins gradually consumed its parent grain (single crystal) and reoriented it by ~86.3°, with basal planes almost parallel to the RD since the early stage of deformation, contributing to the formation of the basal texture but in two very different ways:
For O-1, and variants have a SF value of 0.37, as shown in Figure 11a, making them equally active considering the Schmid law. These twin variants transformed the matrix into twin orientations with the c-axis aligned at an angle of ~30° from ND, as shown in Figure 11c. These orientations have a non-zero Schmid factor for basal, prismatic and pyramidal slip, but twinning continues to have higher SF. According to Chapuis et al. [7], the CRSS for contraction twins is estimated between 30 and 150 MPa, and it is therefore higher compared to CRSS of basal (1.5–3.6 MPa), prismatic (6–15 MPa) and pyramidal slip (20–25 MPa), and the variations depend on the temperature. Despite the high CRSS (but also a high SF), contraction twins are visible in the twin boundary misorientation map (Figure 5b).
On the other hand, regarding O-2, only and variants have a SF = 0.49 (Figure 11b) and lay the basal plane almost parallel to the sheet plane, which strengthens the basal texture (Figure 11d), converting the initial matrix into a ‘hard’ orientation, in which slip was suppressed. According to Molodov [36], the specimens under plane strain compression (PSC) with the starting orientation D (O-2) were again almost single-crystalline, with only low-angle grain boundaries after the conversion of the initial matrix by twinning, so, the crystal rotation from to by extension twinning is not baseless.
As a result of this reorientation, the intensity of the basal component in the O-2 was higher than O-1. The broadening along the RD in the texture component of (0002) PF for O-1 (Figure 4) points out that these variants: and , accommodated the basal plane ~30° rotated from the sheet plane according to the predicted poles of high SF twin variants (Figure 11a). Unlike orientation 2, where the basal component of (0002) PF is sharper (Figure 4) and again agrees with the predicted pole figures (Figure 11b).
4.2. Shear Localization on Twins and Their Influence on the DRX
At 30% of thickness reduction, the misorientation profiles along the black arrows in the EBSD maps (Figure 5 and Figure 6) reveal a continuous change of orientation inside the grains. At some points, this misorientation reaches 13°, revealing that dislocations were also active in addition to the twinning. In O-1 (Figure 5a), the line profiles L1 and L3 are inside grains with high SF for basal slip according to Figure 5c, meanwhile L2 and L4 cross areas with low SF for basal slip; however, these show a high misorientation, which indicates that not only the basal slip was active. The maps of SF for other slip systems of <a> type dislocations are not shown because the SF was close to zero in these maps. The slip system that shows a high SF inside the basal orientation grains was (Figure 5d) and this is totally in accordance with the study of Kelvin et al. [37], where the first-order (pyramidal-I) slip was presumably the more dominant slip system in c-axis compression at room temperature, with a CRSS of 54 MPa. In O-2 (Figure 6a), a similar behavior was observed, but in this case, all the line profiles (L1–L4) are inside grains with low SF for basal slip (Figure 6c), despite this, they reach misorientations of ~14°.
As mentioned above, the orientation maps of O-1 and O-2 at 50% (Figure 7a and Figure 8a, respectively) show areas with high concentration of deformation and consequently, they were not indexed. From the quality of the EBSD patterns of the matrix, we can deduce that these have not been deformed at the same magnitude as twin bands, implying that deformation is heavily concentrated in the softer twins. If we analyze the SF maps for both orientations (Figure 7c,d and Figure 8c,d), we can observe that basal slip has a high SF inside the contraction twins opposite to first-order pyramidal-I, which has a high SF in the basal-oriented grains. Considering the reported values of CRSS of slip basal ~2 MPa [7] and first-order pyramidal-I slip ~54 MPa [37], it is logical to expect that the basal slip will be the dominant mechanism due to its low CRSS, causing the high concentration of deformation within the twin bands. The line profiles L2 and L4 in Figure 7a are inside grains with high SF for basal slip according to Figure 7c, meanwhile L2 and L4 in Figure 7a and L1–L4 in Figure 8a cross areas with low SF for basal slip, however, these reach a high misorientation of 8° and 14° respectively, indicating the activation of the slip system.
In O-1 at 80% of thickness reduction (Figure 9a), the morphological features of recrystallized regions revealed band arrangements embedded within un-recrystallized zones. These kind of arrangements seem to be recrystallized twin bands (DRXed-TBs), and it is evident that the grains inside them have a non-basal orientation, unveiling the effect of contraction twins (CTs) to nucleate them. The rest of the microstructure (out of the bands) shows that most of the recrystallized grains retain a basal orientation. In large grains that presumably belong to the initial basal orientation matrix, LAGBs can be observed, and it suggests that these kind of grains were divided into recrystallized small grains that retain their basal orientation. The many LAGB and SF maps (Figure 9b,c) suggest that basal slip is active inside the grains with non-basal orientation (inside twin bands) and first-order pyramidal-I slip inside the basal-oriented grains of the matrix.
In the case of O-2 at 80% of thickness reduction (Figure 10), there was not a grain refinement, the recrystallized twin bands (DRXed TBs) were coarser and show grains with a large spread orientation (away from basal orientation), allowing the basal slip. As in O-1, there are many LAGBs and sub-grains inside the matrix and recrystallized grains. SF maps (Figure 10b,c) suggest that basal slip is active inside the grains with non-basal orientation, i.e., recrystallized grains inside twin bands and the first-order pyramidal-I slip system inside the basal matrix.
It has been widely reported that twins act as nucleation sites for DRX due to localized strain accumulation within the twin owing to the slip activity inside twin bands and difficult mobility of the twin boundaries, which is referred to as twin-induced dynamic recrystallization. This accumulation of energy produced dynamic recovery in these zones until the misorientation between the low-angle grain boundaries, by more than 15°, and became high-angle grain boundaries and acquired a definitive non-basal orientation [8,25,26,27,28,38,39,40]. Nevertheless, the grains that nucleate inside twins generally cannot grow outside the twin boundaries, so the efficacy of the twin-induced dynamic recrystallization mechanism on the final texture weakening is limited [26,27].
In this investigation, the contraction twin bands in the O-1 were thicker than O-2 at all thickness reductions. At 80%, the orientation map of O-1 (Figure 9a) clearly shows a net of twin-like band morphologies, as described above. If we compare this feature with the one observed in the orientation map of O-2 (Figure 10a), we can easily notice that there is a greater amount of twin-like band morphologies in O-1 than in O-2, which suggests a profuse compression twinning in O-1 during the last rolling step. The recrystallized grains that nucleate inside the contraction twin band without a non-basal orientation seem to have grown slightly out of the twin boundary in O-1, contrary to O-2, where no profuse twin-like morphologies and recrystallized grains inside them can be observed. This explains very well the weakening in the basal texture of O-1 at 80% of thickness reduction, where the recrystallized grains with non-basal orientation contributed to weakening the basal texture from 19.4 to 17.3 multiples of a random distribution (m.r.d,) only in O-1, and gave rise to a new double-pick component in the PF (Figure 4).
5. Conclusions
In the present study, the deformation mechanisms of commercially pure magnesium single crystal during rolling at 400 °C of 30%, 50% and 80% thickness reduction were observed. The microstructural and textural development was investigated by means of EBSD. The following conclusions were drawn:
- (1)
- The original single crystal of both orientations was almost completely rotated into a new matrix of basal grains with the c-axis almost parallel to ND of the sheet. Observations of extension twinning and Schmid Factor analysis indicate that twinning was responsible for this rotation.
- (2)
- The active extension twin variants determined the intensity of the basal texture: orientation 1 presented the weakest basal texture at all strains, its extension twin variants aligned the c-axis ~30° deviated from ND, compared to orientation 2, for which its extension twins aligned the basal plane almost parallel to the sheet plane.
- (3)
- In the new basal matrix, contraction twins were observed at of and in both orientations. These contraction twins suffered shear localization attributed to easier conditions for dislocation basal slip motion inside them compared to the ‘hard’ basal matrix, leading to twin-induced CDRX, and formed recrystallized twin bands, giving rise to new recrystallized grains with non-basal orientation. These recrystallized grains contributed to the weakening of the basal texture only in orientation 1.
Author Contributions
Conceptualization, J.A.E.-M. and T.A.-S.; methodology, J.A.E.-M.; software, J.A.E.-M.; validation, D.H.-S. and T.A.-S.; formal analysis, J.A.E.-M. and D.H.-S.; investigation, J.A.E.-M.; resources, T.A.-S. and D.H.-S.; data curation, J.A.E.-M. and D.H.-S.; writing—original draft preparation, J.A.E.-M.; writing—review and editing, D.H-S. and T.A.-S.; visualization, J.A.E.-M.; supervision, D.H.-S. and T.A.-S.; project administration, D.H-S. and T.A.-S.; funding acquisition, D.H.-S. and T.A.-S. All authors have read and agreed to the published version of the manuscript.
Funding
This research received no external funding.
Data Availability Statement
The data presented in this study are available on request from the corresponding author. The data is not publicly available due to ongoing research based on it.
Conflicts of Interest
The authors declare no conflict of interest.
References
- Xin, Y.; Wang, M.; Zeng, Z.; Huang, G.; Liu, Q. Tailoring the texture of magnesium alloy by twinning deformation to improve the rolling capability. Scr. Mater. 2011, 64, 986–989. [Google Scholar] [CrossRef]
- Agnew, S.R.; Duygulu, Ö. Plastic anisotropy and the role of non-basal slip in magnesium alloy AZ31B. Int. J. Plast. 2005, 21, 1161–1193. [Google Scholar] [CrossRef]
- Kelley, E.W.; Hosford, W.F. The Deformation Characteristics of Textured Magnesium. Trans. Metall. Soc. AIME 1968, 242, 654–661. [Google Scholar]
- Graff, S.; Brocks, W.; Steglich, D. Yielding of magnesium: From single crystal to polycrystalline aggregates. Int. J. Plast. 2007, 23, 1957–1978. [Google Scholar] [CrossRef] [Green Version]
- Wonsiewicz, B.C. Plasticity of Magnesium Crystals; Massachusetts Institute of Technology: Cambridge, MA, USA, 1966. [Google Scholar]
- Kelley, E.W.; Hosford, W. Plane-strain compression of magnesium and magnesium alloy crystals. Trans. Metall. Soc. AIME 1968, 242, 5–13. [Google Scholar]
- Chapuis, A.; Driver, J.H. Temperature dependency of slip and twinning in plane strain compressed magnesium single crystals. Acta Mater. 2011, 59, 1986–1994. [Google Scholar] [CrossRef]
- Molodov, K.D.; Al-Samman, T.; Molodov, D.A.; Gottstein, G. On the Ductility of Magnesium Single Crystals at Ambient Temperature. Metall. Mater. Trans. A 2014, 45, 3275–3281. [Google Scholar] [CrossRef]
- Molodov, K.D.; Al-Samman, T.; Molodov, D.A.; Gottstein, G. Mechanisms of exceptional ductility of magnesium single crystal during deformation at room temperature: Multiple twinning and dynamic recrystallization. Acta Mater. 2014, 76, 314–330. [Google Scholar] [CrossRef]
- Molodov, K.D.; Al-Samman, T.; Molodov, D.A. Deformation-Induced Recrystallization of Magnesium Single Crystals at Ambient Temperature. IOP Conf. Ser. Mater. Sci. Eng. 2015, 82, 12014. [Google Scholar] [CrossRef] [Green Version]
- Molodov, K.; Al-Samman, T.; Molodov, D.; Gottstein, G. On the role of anomalous twinning in the plasticity of magnesium. Acta Mater. 2016, 103, 711–723. [Google Scholar] [CrossRef]
- Molodov, K.D.; Al-Samman, T.; Molodov, D.A. On the diversity of the plastic response of magnesium in plane strain compression. Mater. Sci. Eng. A 2016, 651, 63–68. [Google Scholar] [CrossRef]
- Molodov, K.D.; Al-Samman, T.; Molodov, D.A. Profuse slip transmission across twin boundaries in magnesium. Acta Mater. 2017, 124, 397–409. [Google Scholar] [CrossRef]
- Molodov, K.D.; Al-Samman, T.; Molodov, D.A.; Korte-Kerzel, S. On the twinning shear of twins in magnesium—Experimental determination and formal description. Acta Mater. 2017, 134, 267–273. [Google Scholar] [CrossRef]
- Molodov, D.A.; Ivanov, V.A.; Gottstein, G. Low angle tilt boundary migration coupled to shear deformation. Acta Mater. 2007, 55, 1843–1848. [Google Scholar] [CrossRef]
- Bettles, C.; Barnett, M. Advances in Wrought Magnesium Alloys: Fundamentals of Processing, Properties and Applications; Elsevier: Amsterdam, The Netherlands, 2012. [Google Scholar]
- Kaiser, F.; Kainer, K.U. Magnesium Alloys and Technology; John Wiley&Sons: Hoboken, NJ, USA, 2003. [Google Scholar]
- Polmear, I.; StJohn, D.; Nie, J.-F.; Qian, M. Light Alloys: Metallurgy of The Light Metals; Butterworth-Heinemann: Oxford, UK, 2017. [Google Scholar]
- Friedrich, H.E.; Mordike, B.L. Magnesium Technology; Springer: New York, NY, USA, 2006; Volume 212. [Google Scholar]
- Hielscher, R.; Schaeben, H. A novel pole figure inversion method: Specification of the MTEX algorithm. J. Appl. Crystallogr. 2008, 41, 1024–1037. [Google Scholar] [CrossRef]
- Nave, M.D.; Barnett, M.R. Microstructures and textures of pure magnesium deformed in plane-strain compression. Scr. Mater. 2004, 51, 881–885. [Google Scholar] [CrossRef]
- Jiang, M.G.; Xu, C.; Yan, H.; Fan, G.H.; Nakata, T.; Lao, C.S.; Chen, R.S.; Kamado, S.; Han, E.H.; Lu, B.H. Unveiling the formation of basal texture variations based on twinning and dynamic recrystallization in AZ31 magnesium alloy during extrusion. Acta Mater. 2018, 157, 53–71. [Google Scholar] [CrossRef]
- Barnett, M.R.; Stanford, N.; Cizek, P.; Beer, A.; Xuebin, Z.; Keshavarz, Z. Deformation mechanisms in Mg alloys and the challenge of extending room-temperature plasticity. J. Miner. 2009, 61, 19–24. [Google Scholar] [CrossRef]
- Bettles, C.; Gibson, M. Current wrought magnesium alloys: Strengths and weaknesses. J. Miner. 2005, 57, 46–49. [Google Scholar] [CrossRef]
- Xu, S.W.; Matsumoto, N.; Kamado, S.; Homma, T.; Kojima, Y. Dynamic microstructural changes in Mg–9Al–1Zn alloy during hot compression. Scr. Mater. 2009, 61, 249–252. [Google Scholar] [CrossRef]
- Li, X.; Yang, P.; Wang, L.-N.; Meng, L.; Cui, F. Orientational analysis of static recrystallization at compression twins in a magnesium alloy AZ31. Mater. Sci. Eng. A 2009, 517, 160–169. [Google Scholar] [CrossRef]
- Levinson, A.; Mishra, R.K.; Doherty, R.D.; Kalidindi, S.R. Influence of deformation twinning on static annealing of AZ31 Mg alloy. Acta Mater. 2013, 61, 5966–5978. [Google Scholar] [CrossRef]
- Guan, D.; Rainforth, W.M.; Ma, L.; Wynne, B.; Gao, J. Twin recrystallization mechanisms and exceptional contribution to texture evolution during annealing in a magnesium alloy. Acta Mater. 2017, 126, 132–144. [Google Scholar] [CrossRef]
- Čapek, J.; Máthis, K.; Clausen, B.; Barnett, M. Dependence of twinned volume fraction on loading mode and Schmid factor in randomly textured magnesium. Acta Mater. 2017, 130, 319–328. [Google Scholar] [CrossRef] [Green Version]
- Hong, S.-G.; Park, S.H.; Lee, C.S. Role of {10–12} twinning characteristics in the deformation behavior of a polycrystalline magnesium alloy. Acta Mater. 2010, 58, 5873–5885. [Google Scholar] [CrossRef]
- Park, S.H.; Lee, J.H.; Moon, B.G.; You, B.S. Tension–compression yield asymmetry in as-cast magnesium alloy. J. Alloys Compd. 2014, 617, 277–280. [Google Scholar] [CrossRef]
- Godet, S.; Jiang, L.; Luo, A.A.; Jonas, J.J. Use of Schmid factors to select extension twin variants in extruded magnesium alloy tubes. Scr. Mater. 2006, 55, 1055–1058. [Google Scholar] [CrossRef]
- Jiang, J.; Godfrey, A.; Liu, W.; Liu, Q. Identification and analysis of twinning variants during compression of a Mg–Al–Zn alloy. Scr. Mater. 2008, 58, 122–125. [Google Scholar] [CrossRef]
- Pei, Y.; Godfrey, A.; Jiang, J.; Zhang, Y.B.; Liu, W.; Liu, Q. Extension twin variant selection during uniaxial compression of a magnesium alloy. Mater. Sci. Eng. A 2012, 550, 138–145. [Google Scholar] [CrossRef] [Green Version]
- Wang, F.; Sandlöbes, S.; Diehl, M.; Sharma, L.; Roters, F.; Raabe, D. In situ observation of collective grain-scale mechanics in Mg and Mg–rare earth alloys. Acta Mater. 2014, 80, 77–93. [Google Scholar] [CrossRef]
- Molodov, D.A. Investigation of Deformation Mechanisms in Magnesium Crystals; RWTH Aachen: Aachen, Germany, 2017. [Google Scholar]
- Xie, K.Y.; Alam, Z.; Caffee, A.; Hemker, K.J. Deformation Behavior of Mg Single Crystals Compressed Along C-Axis. In Magnesium Technology 2016; Springer: New York, NY, USA, 2016; pp. 209–211. [Google Scholar]
- Al-Samman, T.; Molodov, K.D.; Molodov, D.A.; Gottstein, G.; Suwas, S. Softening and dynamic recrystallization in magnesium single crystals during c-axis compression. Acta Mater. 2012, 60, 537–545. [Google Scholar] [CrossRef]
- Guan, D.; Rainforth, W.M.; Gao, J.; Sharp, J.; Wynne, B.; Ma, L. Individual effect of recrystallisation nucleation sites on texture weakening in a magnesium alloy: Part 1 double twins. Acta Mater. 2017, 135, 14–24. [Google Scholar] [CrossRef]
- Sabat, R.K.; Sahoo, S.K.; Panda, D.; Mohanty, U.K.; Suwas, S. Orientation dependent recrystallization mechanism during static annealing of pure magnesium. Mater. Charact. 2017, 132, 388–396. [Google Scholar] [CrossRef]
Figure 1.
Single crystal orientations (O) for the rolling experiments.

Figure 2.
Pictures of magnesium hot-rolled sheets of orientation 1 and orientation 2 at 0% (raw material) 30%, 50% and 80% of thickness reduction.
Figure 2.
Pictures of magnesium hot-rolled sheets of orientation 1 and orientation 2 at 0% (raw material) 30%, 50% and 80% of thickness reduction.

Figure 3.
Optical micrographs at 200× and 500× magnifications of the rolling direction (RD)-transversal direction (TD) plane after magnesium single crystal rolling at different strains of both studied orientations.
Figure 3.
Optical micrographs at 200× and 500× magnifications of the rolling direction (RD)-transversal direction (TD) plane after magnesium single crystal rolling at different strains of both studied orientations.

Figure 4.
Pole Figures of texture measurements of magnesium sheets at different thickness reductions for both orientations.
Figure 4.
Pole Figures of texture measurements of magnesium sheets at different thickness reductions for both orientations.

Figure 5.
Electron Backscatter Diffraction (EBSD) results obtained from an O-1 specimen at 30% of thickness reduction: (a) EBSD map in inverse pole figure (IPF) coloring relative to normal direction (ND), corresponding scattered data (0002) PF and misorientation profiles, (b) twin boundary misorientation map, (c) Schmid Factor map for slip system, (d) Schmid Factor map for slip system.

Figure 6.
Electron Backscatter Diffraction (EBSD) results obtained from an O-2 specimen at 30% of thickness reduction: (a) EBSD map in inverse pole figure (IPF) coloring relative to normal direction (ND), corresponding scattered data (0002) PF and misorientation profiles, (b) twin boundary misorientation map, (c) Schmid Factor map for slip system, (d) Schmid Factor map for slip system.

Figure 7.
Electron Backscatter Diffraction (EBSD) results obtained from an O-1 specimen at 50% of thickness reduction: (a) EBSD map in inverse pole figure (IPF) coloring relative to normal direction (ND), corresponding scattered data (0002) PF and misorientation profiles, (b) twin boundary misorientation map, (c) Schmid Factor map for slip system, (d) Schmid Factor map for slip system.

Figure 8.
Electron Backscatter Diffraction (EBSD) results obtained from an O-2 specimen at 50% of thickness reduction: (a) EBSD map in inverse pole figure (IPF) coloring relative to normal direction (ND), corresponding scattered data (0002) PF and misorientation profiles, (b) twin boundary misorientation map, (c) Schmid Factor map for slip system, (d) Schmid Factor map for slip system.

Figure 9.
Electron Backscatter Diffraction (EBSD) results obtained from an O-1 specimen at 80% of thickness reduction: (a) EBSD map in inverse pole figure (IPF) coloring relative to normal direction (ND) and corresponding scattered data (0002) PF, (b) Schmid Factor map for slip system, (c) Schmid Factor map for slip system.

Figure 10.
Electron Backscatter Diffraction (EBSD) results obtained from an O-2 specimen at 80% of thickness reduction: (a) EBSD map in inverse pole figure (IPF) coloring relative to normal direction (ND) and corresponding scattered data (0002) PF, (b) Schmid Factor map for slip system, (c) Schmid Factor map for slip system.

Figure 11.
(0002) calculated PF showing the initial orientations (a) O-1 and (b) O-2, as well as their corresponding extension twin variants. Schematic representation of twin variants for (c) O-1 and (d) O-2.
Figure 11.
(0002) calculated PF showing the initial orientations (a) O-1 and (b) O-2, as well as their corresponding extension twin variants. Schematic representation of twin variants for (c) O-1 and (d) O-2.


Table 1.
Rolling schedule.
| Rolling Pass | Deformation (φ) | Re-Heating Time | Thickness Reduction |
|---|---|---|---|
| 1 | 0.05 | 10 | 4.88 |
| 2 | 0.05 | 10 | 9.52 |
| 3 | 0.05 | 10 | 13.93 |
| 4 | 0.05 | 10 | 18.13 |
| 5 | 0.05 | 10 | 22.12 |
| 6 | 0.06 | 10 | 26.66 |
| 7 | 0.06 | 10 | 30.93 |
| 8 | 0.10 | 10 | 34.95 |
| 9 | 0.10 | 10 | 41.14 |
| 10 | 0.12 | 10 | 47.80 |
| 11 | 0.12 | 10 | 53.70 |
| 12 | 0.15 | 10 | 60.15 |
| 13 | 0.15 | 10 | 65.15 |
| 14 | 0.17 | 10 | 71.06 |
| 15 | 0.17 | 10 | 75.59 |
| 16 | 0.20 | -- | 80.01 |
Publisher’s Note: MDPI stays neutral with regard to jurisdictional claims in published maps and institutional affiliations. |
© 2021 by the authors. Licensee MDPI, Basel, Switzerland. This article is an open access article distributed under the terms and conditions of the Creative Commons Attribution (CC BY) license (http://creativecommons.org/licenses/by/4.0/).
Share and Cite
MDPI and ACS Style
Estrada-Martínez, J.A.; Hernández-Silva, D.; Al-Samman, T. Hot Rolling of Magnesium Single Crystals. Metals 2021, 11, 443. https://0-doi-org.brum.beds.ac.uk/10.3390/met11030443
AMA Style
Estrada-Martínez JA, Hernández-Silva D, Al-Samman T. Hot Rolling of Magnesium Single Crystals. Metals. 2021; 11(3):443. https://0-doi-org.brum.beds.ac.uk/10.3390/met11030443
Chicago/Turabian StyleEstrada-Martínez, José Antonio, David Hernández-Silva, and Talal Al-Samman. 2021. "Hot Rolling of Magnesium Single Crystals" Metals 11, no. 3: 443. https://0-doi-org.brum.beds.ac.uk/10.3390/met11030443
Note that from the first issue of 2016, this journal uses article numbers instead of page numbers. See further details here.