
Influence of Weld-Porosity Defects on Fatigue Strength of AH36 Butt Joints Used in Ship Structures


1
Department of Engineering, University of Messina, 98166 Messina, Italy
2
Department of Engineering and Architecture, University of Trieste, 34127 Trieste, Italy
*
Author to whom correspondence should be addressed.
Metals 2021, 11(3), 444; https://0-doi-org.brum.beds.ac.uk/10.3390/met11030444
Submission received: 4 February 2021
/
Revised: 2 March 2021
/
Accepted: 3 March 2021
/
Published: 8 March 2021
Abstract
:Experimental tests were carried out to assess the fatigue strength of four types of welded joints, made of AH36 steel and used for ship structures. The joints differ for the presence of weld defects and for the thickness value. Fatigue tests were carried out applying axial cyclic loads at a frequency of 20 Hz and at a stress ratio R = 0.5. The temperature e increment of the specimen surface was detected during the load application by means of an infrared camera. The analysis of the thermographic images allowed the assessment of both the fatigue strength of the welded joints, applying the rapid thermographic method, and the S-N curve by the energy approach. Moreover, 3D computed tomography was used for the analysis of the defective welded joints.
1. Introduction
A metallic specimen, subjected to fatigue loading, changes its temperature and the specimen heating can be considered as a fatigue indicator. Several thermal methods, based on the temperature increment during fatigue tests, were proposed in literature [1,2,3,4,5,6,7,8,9,10,11,12,13,14,15,16,17,18] since 1980 for fatigue limit evaluation and S-N curve assessment. The thermographic method (TM) [13], based on the thermographic technique, allows for a reliable assessment of the fatigue strength and of the whole fatigue curve of materials, mechanical components and structural details by means of nonexcessive time-consuming tests. This method has already been applied successfully to assess the fatigue strength of welded joints [19,20,21,22,23].
There are several studies in literature about the application of approaches for the fatigue life prediction, whereas the defect influence on fatigue strength has been studied in only few papers, which generally regard the fatigue in very high cycle regimes. Defects significantly affect the fatigue life. The fatigue life of defective materials is generally predicted in literature by applying a fracture mechanics approach, based on the assumption that the size of the largest defect is the key feature controlling the fatigue life and that the defects are considered as the initial cracks. The fatigue life of A356 cast aluminum alloy containing defects was predicted using crack-growth models [24], which gave good predictions at both low and high stress levels. The prediction using maximum defect size obtained by extreme value statistic was also satisfactory. The influence of defect position on the fatigue strength of Al-Si alloy produced by selective laser melting was investigated using artificial defects in [25]. The results of this study highlighted the great sensitivity of the fatigue strength to the thickness of the bridge of material between the defect and the specimen surface, for the case of subsurface defects. An approach to predict fatigue life of 6061 aluminum alloy based on a simplified defect model was proposed in [26] according to the following steps: firstly, a prediction model of the stress concentration factor, due to the defects, was evaluated through the support vector regression algorithm by using the defect data at different fatigue loading stages, obtained by computed tomography (CT) analyses; then, the relationship between the stress concentration factor and the fatigue life was obtained by fitting the data.
Welded joints in structural elements contain defects (like porosity, cracks, undercut, lack of fusion, lack of penetration and solid inclusion) and it is practically inevitable to avoid them. Ship hull structures consist of plating connected to longitudinal and transverse members by welded joints, which are sites of high stress concentrations, and undergo fatigue loading, which, combined with weld defects, can cause the failure of the hull structures. The defect number and the size statistics of welded joints in ship hull construction were investigated by analyzing nondestructive technique (NDT) data collected from inspection of two ships and analyzed using the maximum likelihood estimate (MLE) [27]. It was found that hybrid laser-arc welding (HLAW) process has significantly better quality in terms of defect occurrence and, consequently, the fatigue strength compared to flux-cored arc welding (FCAW) and submerged arc welding (SAW).
This paper aims to assess the fatigue strength and life of AH36 butt welded joints in presence of defects, which were extracted from a real hull-plating. The predictions, obtained by means of TM and energy approach, were verified through the results of fatigue tests performed according to the traditional procedure.
The defectiveness of the investigated welded joints was analyzed using 3D CT. The CT technique has already been applied by the authors for analyzing the quality control of specimens, made of Iroko wood [28] and Iroko wood laminates [29] used for boat structures, as well as for non-destructive quality evaluation of specimens produced by wire arc additive manufacturing (WAAM) [30] and electron beam melting (EBM) [31] technologies. Nondestructive techniques have already been applied to find a correlation between mechanical strength of welded joints, in terms of defects distribution [32,33] and geometry [34,35].
2. Materials
The specimens without defects (“perfect” welds or type-C) were manufactured in the workshop by welding two plate strips, each 100 mm wide, with the same welding process used for the hull plating. The investigated joints were welded by FCAW (flux-cored arc welding), in flat position, on a ceramic backing bar. After manufacturing, the specimen edges were polished lengthwise in order to avoid fatigue crack initiation.
As for the specimens with defects (“imperfect” welds or type-NC), they were extracted from a real hull-plating, where the defects were detected by in situ X-ray analyses.
Four different types of butt-welded joints, made of AH36 steel, which is largely used in shipbuilding, have been analyzed:
- type-C-1, butt joints without defect and thickness nominal value t = 5.5 mm;
- type-NC-2, butt joints with defect and thickness nominal value t = 5.5 mm;
- type-C-3, butt joints without defect and thickness nominal value t = 6.5 mm;
- type-NC-4, butt joints with defect and thickness nominal value t = 6.5 mm.
The specimens have dimensions slightly different with the following average values: length (l) = 300 mm, wide (b) = 45 mm.
Table 1 reports the geometrical dimensions measured for the analyzed welded joints and the defect types for the specimens with defects (type-NC), detected by in situ X-ray analyses. The “Specimen ID”, shown in Table 1, is used to identify the different specimens.
The chemical composition and the mechanical properties of AH36 steel are reported in Table 2 and Table 3. In the same tables, the minimum and maximum values, required by the Italian Shipping Register (RINA) Classification Society for AH36 steel, are also reported.
The fatigue limit of AH36 butt welded joints without defects, similar to the investigated joints without defects (type-C), was obtained from 29 constant-amplitude fatigue tests carried out according to the traditional procedure, which is reported in another paper by the authors [23]. The value of the fatigue limit as expected with the S-N curve at 5 × 10⁶ cycles ΔσeSN is equal to 157 MPa at the survival probabilities (PS) = 50% [23].
Defect Detection by Computed Tomography
Fatigue strength strongly depends on weld defects, so the specimens were investigated by means of scanning electron microscopy (SEM) and X-ray computed tomography (XCT). The latter scans were performed with a 300 μm focal spot size; voltage and current were set to 215 kV and 1.3 mA, respectively. A Cu beam filter having a thickness of 0.5 mm was put between the source and the sample. For the reconstruction, a voxel resolution of 62 μm × 62 μm × 62 μm was chosen, with a pixel resolution in tomogram of 1280 × 1280. The dataset was processes by VGStudio Max 2.0 (Volume Graphics GmbH, Heidelberg, Germany) and the rendering tools used for 3D reconstructions were X-rays and maximum projection. Both algorithms cast one ray per display pixel into the data set. The higher the integrated opacity of voxels along a ray, the brighter the corresponding pixel for the first one. The maximum intensity of the voxels along a ray determines the gray value of the corresponding pixel for the second rendering tool.
Computed tomography evaluation allowed the measurements of cumulative defects volume (V) and maximum defect size (DMAX) for some of the investigated specimens that were successively subjected to fatigue tests. The data are reported in Table 4.
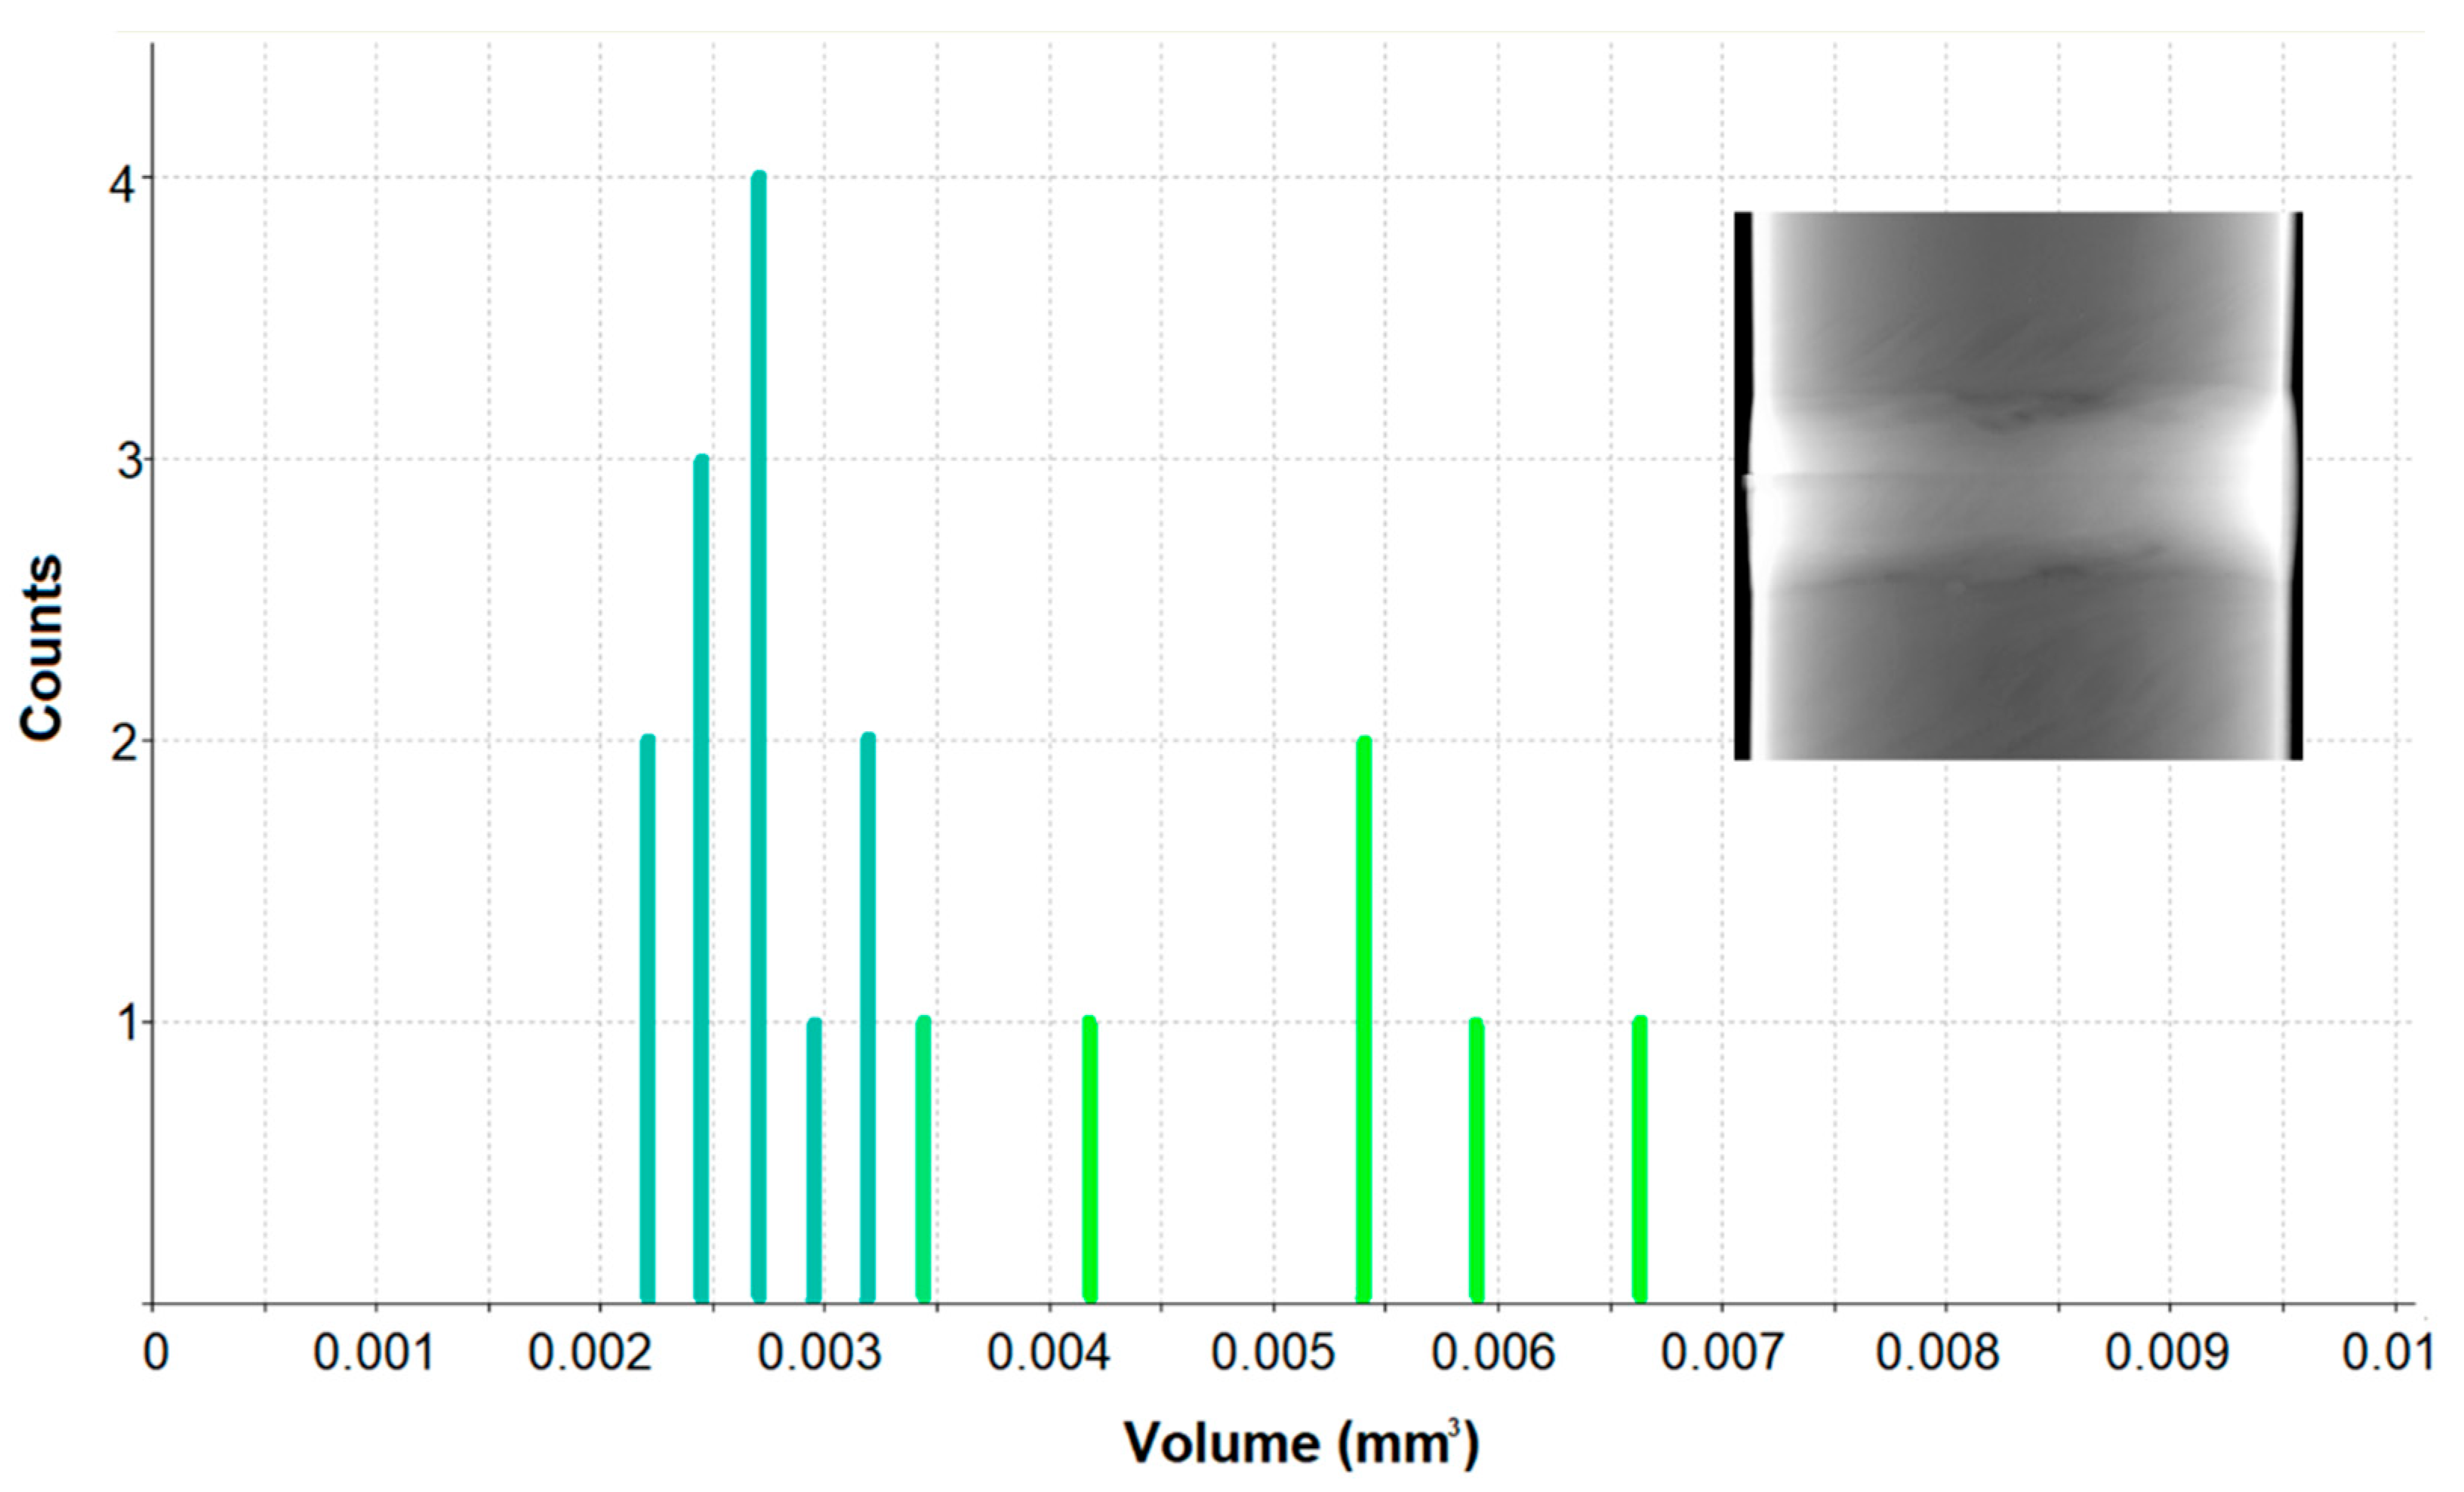
Figure 1 shows the defect size distribution for a C-1 joint specimen which was considered as being without defects. Indeed, the cumulative defects volume was very low (0.06 mm3).
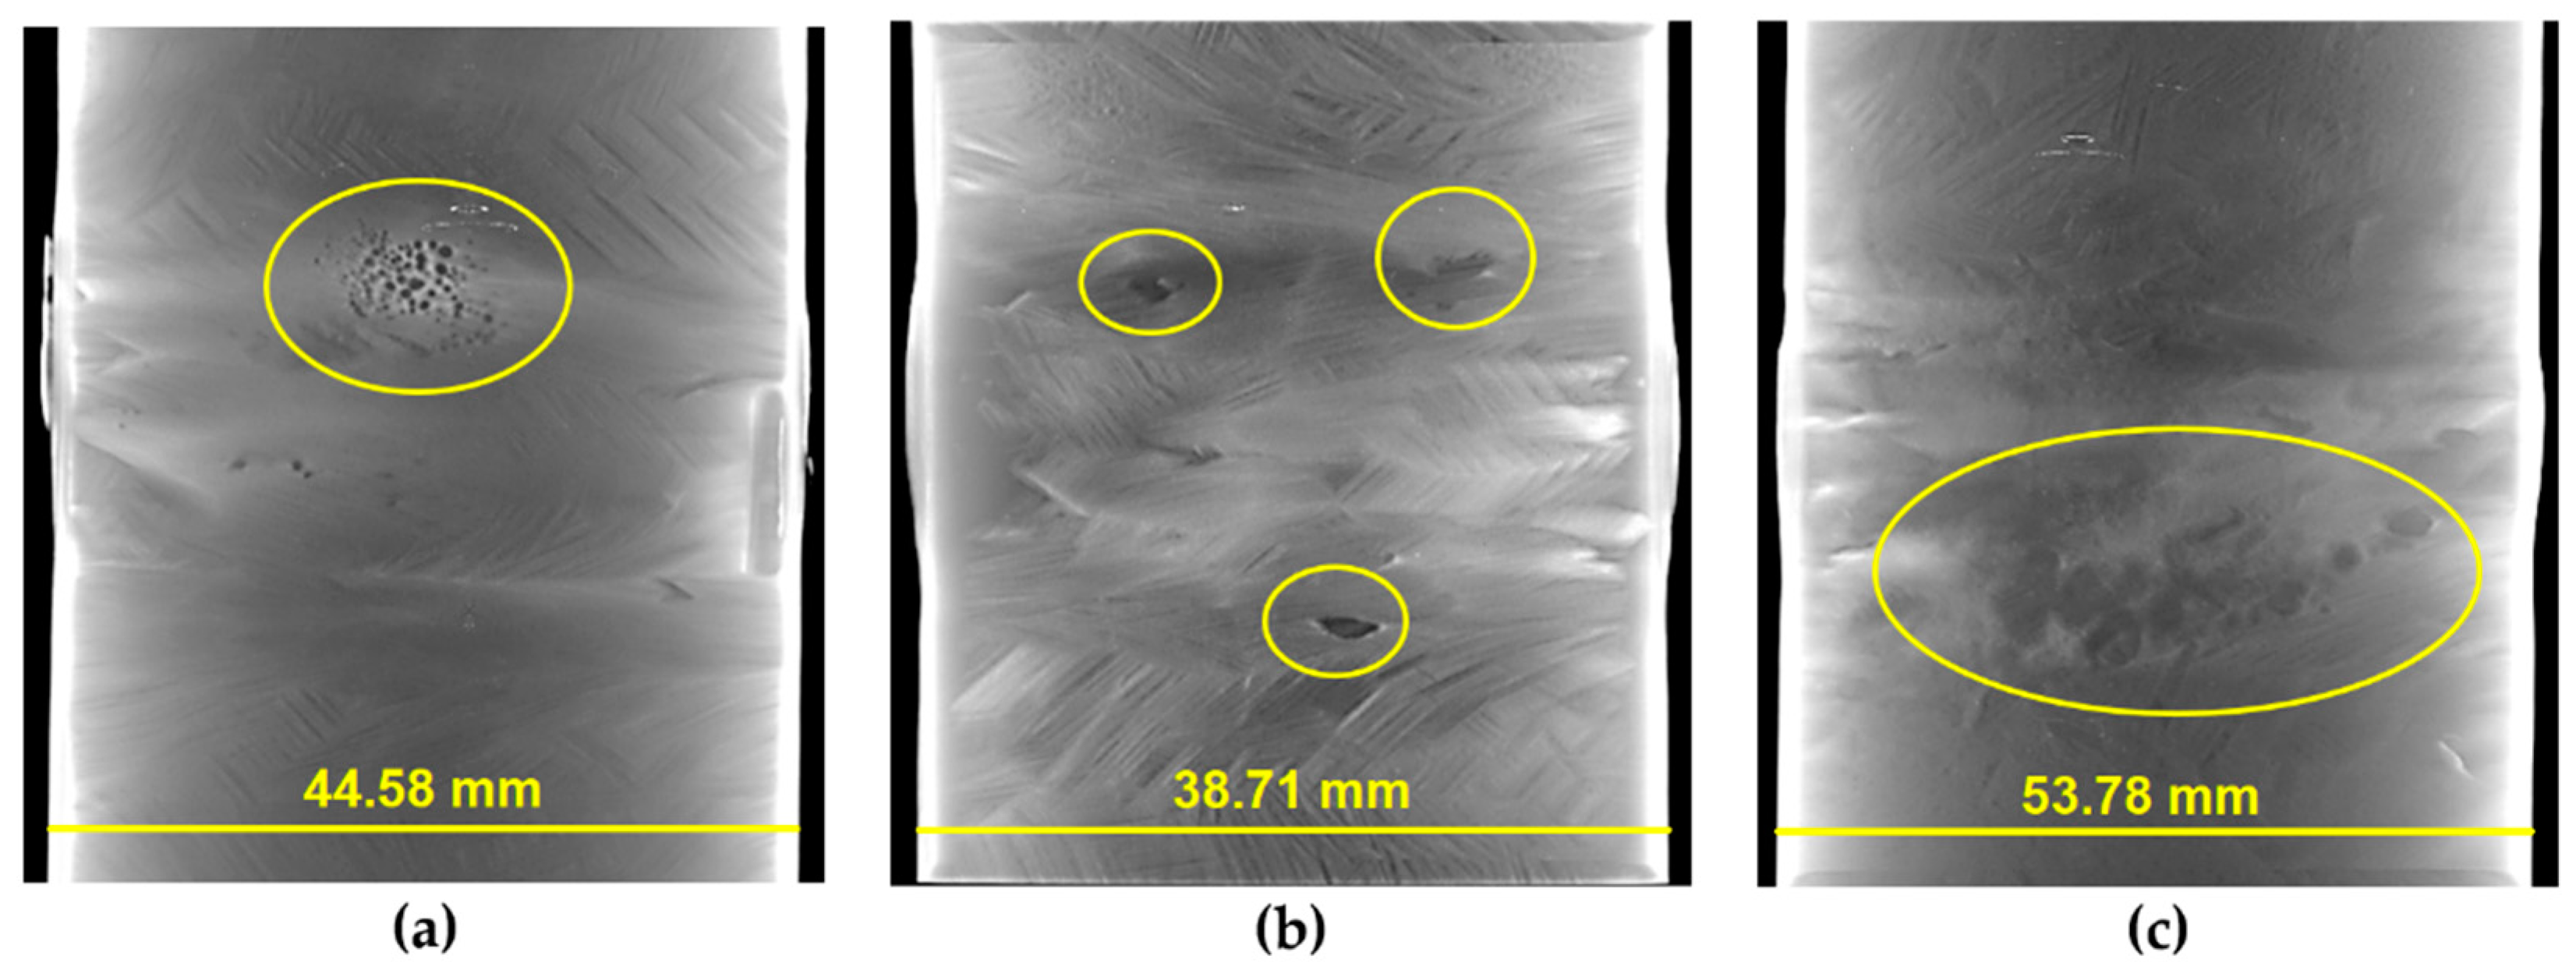
Defect evaluation was also carried out for three type-NC-2 joint specimens. Extensive defectiveness can be seen in Figure 2. The cumulative defects volume of specimen 766-2 was measured to be almost 1000 times higher than defectless specimens (5.74 mm3). It is worth mentioning that the pore clusters were evaluated for specimens 766-2 and 766-4; while for 766-3 specimens, gas cavities were found, mainly at the weld toe. The gas cavity revealed in specimen 766-4 is very severe, if compared to 766-2.
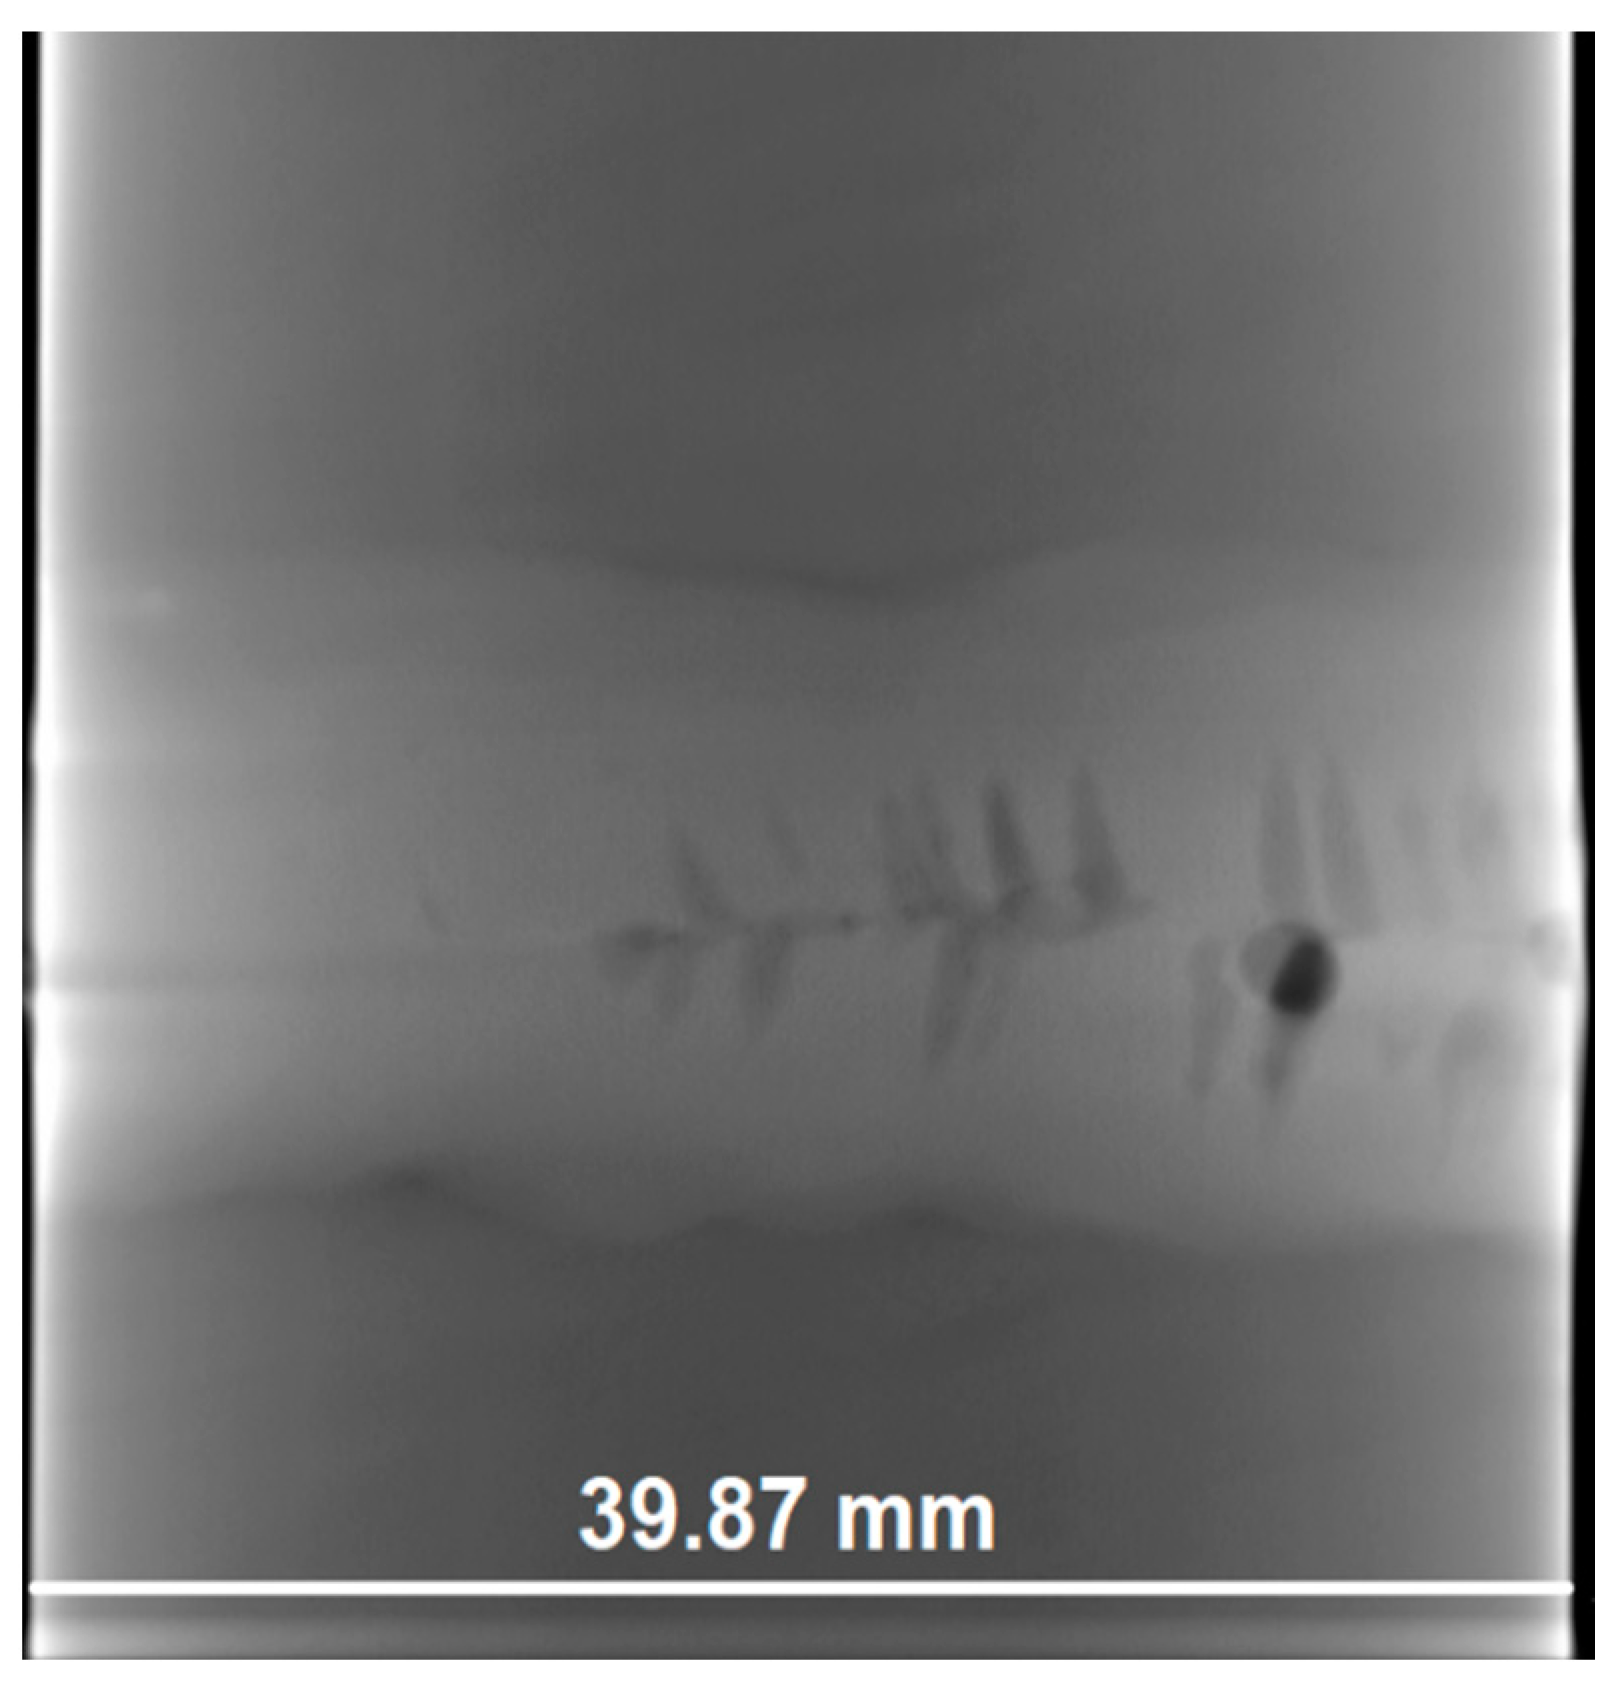
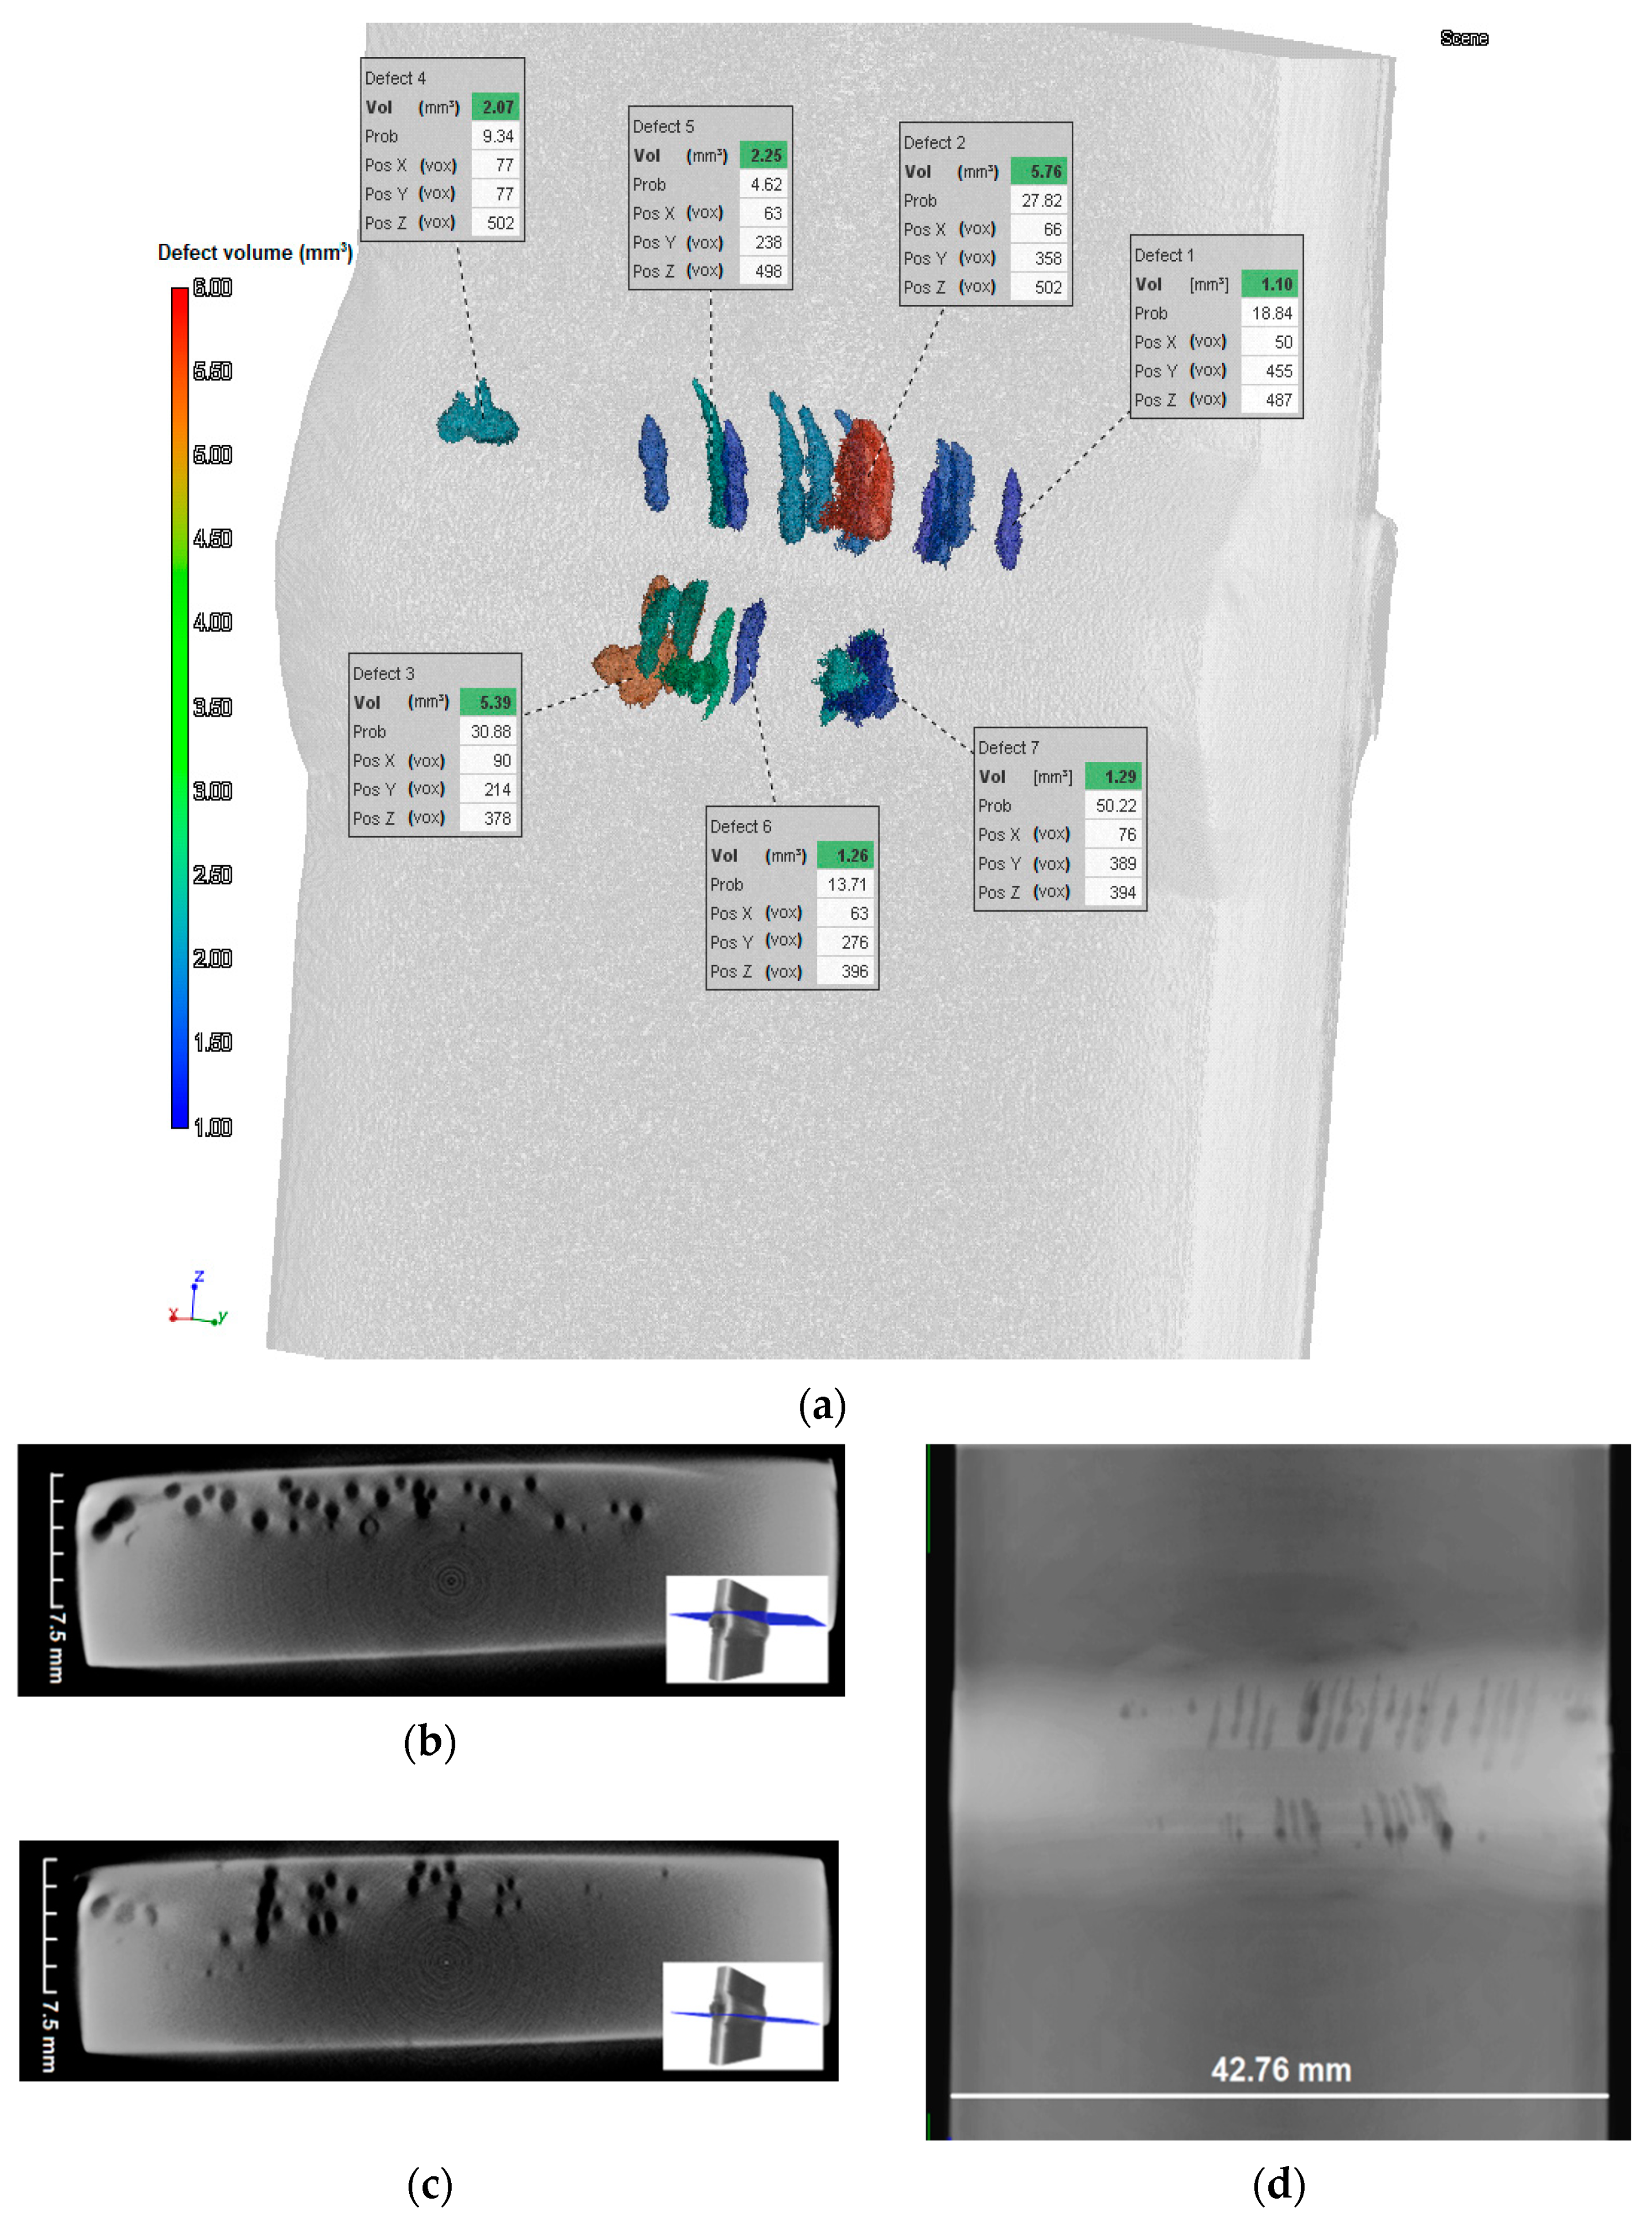
Different defect shape was evaluated for the NC-4 joint specimens, probably due to the higher thickness. Figure 3 and Figure 4 show a large defect distribution of elongated pores, generally called worm holes. As shown in Figure 4a, such defects have the shape of internal tunnels, parallel to the welding direction. The 3D reconstruction of the specimen 991-FM-2 allowed the detection of such defects as a series of voids at regular intervals across the weld length. Defect evaluation tool shows a color-bar related to the voids’ sizes. A very large defect has a volume of 5.76 mm3 and is shown in red. For specimens 991-FM-1 and 991-FM-2 the cumulative defects volume was 365.2 mm3 and 39.65 mm3, respectively.
In Figure 4b,c the tomogram of the specimen the cross-section of the 991-FM-2 specimen is depicted, which highlights that the detected worm holes are very superficial.
3. Methods
Fatigue tests were carried out by means of a servo-hydraulic testing machine (MTS 810) equipped with a 250 kN load cell. The tests were performed in accordance with the International Institute of Welding (IIW) recommendations [36], which require the application of axial fatigue loads with a stress ratio R = 0.5. The testing frequency was 20 Hz. According to the above-mentioned rapid thermographic method, tests at increasing loads were carried out by a stepwise succession (applied to the same specimen) of increasing stress ranges, starting from 100 MPa with steps of 20 MPa every 30,000 cycles.
In order to obtain a known homogenous value of emissivity, the specimens were painted with a black spray enamel. The thermograms were recorded every 25 s with a microbolometer infrared camera (Flyr System A40M, Danderyd, Sweden), with a thermal resolution lower than 0.08 °C. The infrared camera was located at a distance of 0.4 m to the specimen. A black panel was placed behind the specimen in order to get a greater thermal contrast between the specimen and environment temperatures. ThermaCAM Researcher Pro 2.10 software (FLIR Systems, Wilsonville, OR, USA) was used to analyze the thermographic images. Digitized images contained 320 × 240 pixels. By using area tools, both surface specimen and environment temperatures were plotted in real time to consider only the effect of the cyclic stress. The temperature increment (ΔT) of the hottest area of the specimen surface with respect to the temperature of the unloaded specimen was detected during the load application, and the environmental temperature increment was subtracted.
3.1. Rapid Thermographic Method
The thermographic method allows the evaluation of the fatigue limit as the highest stress value which does not produce a temperature increment.
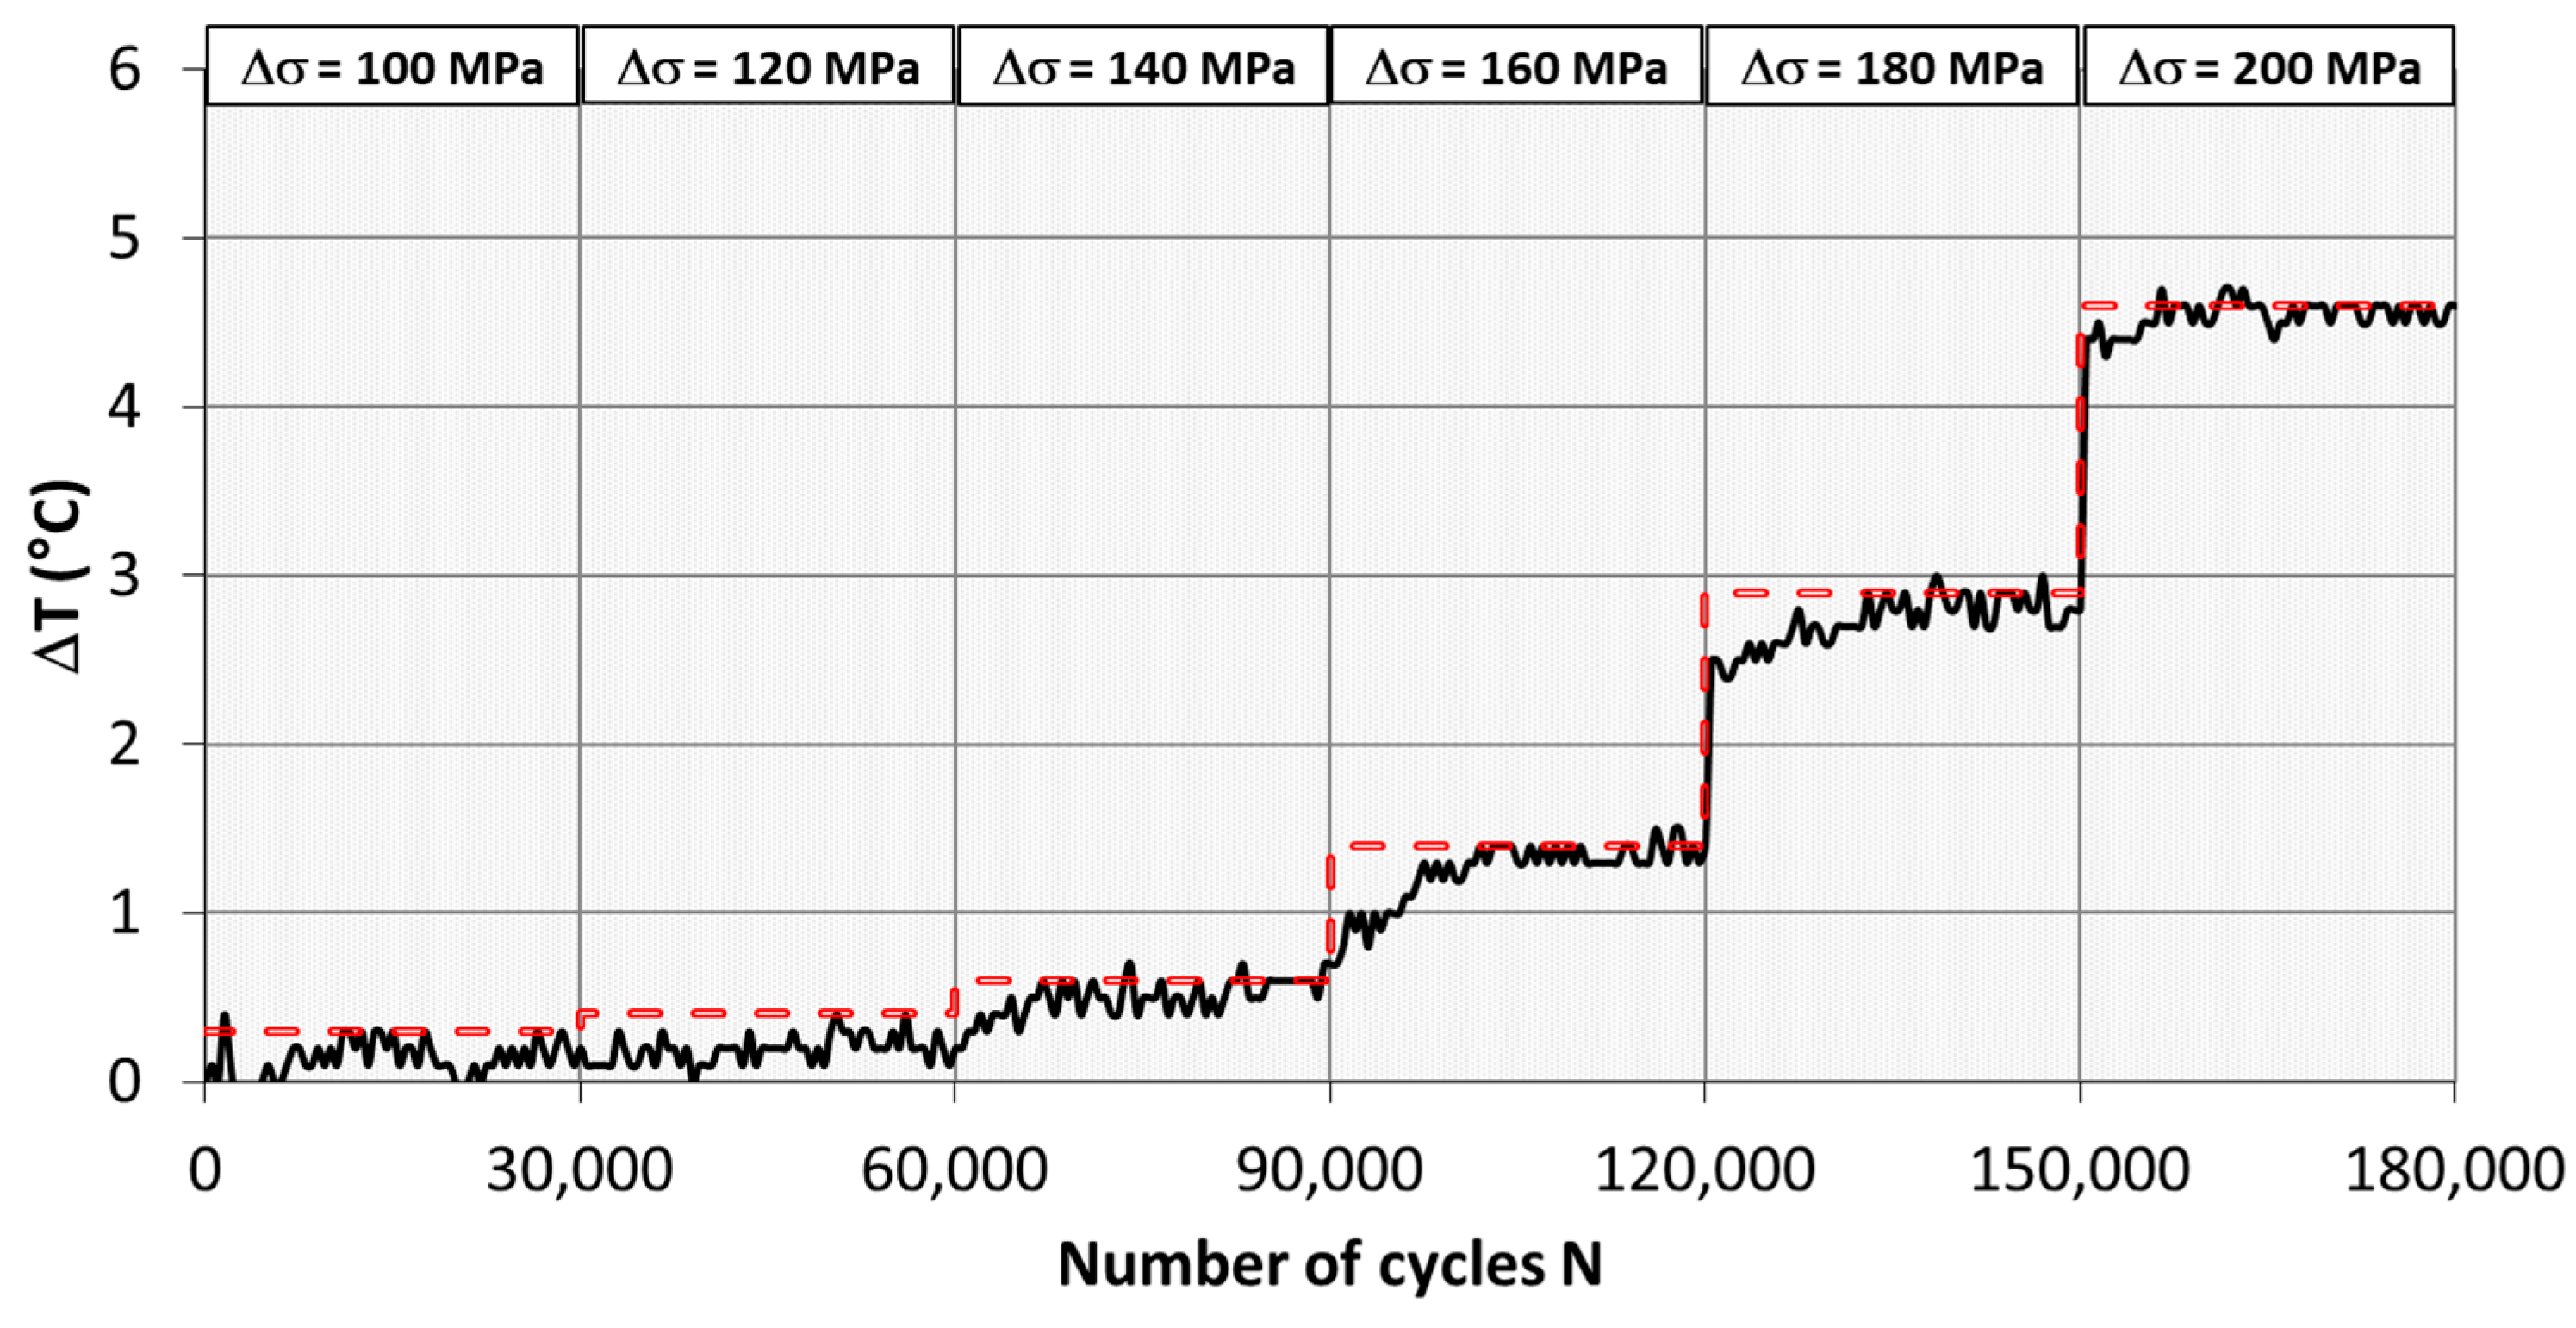
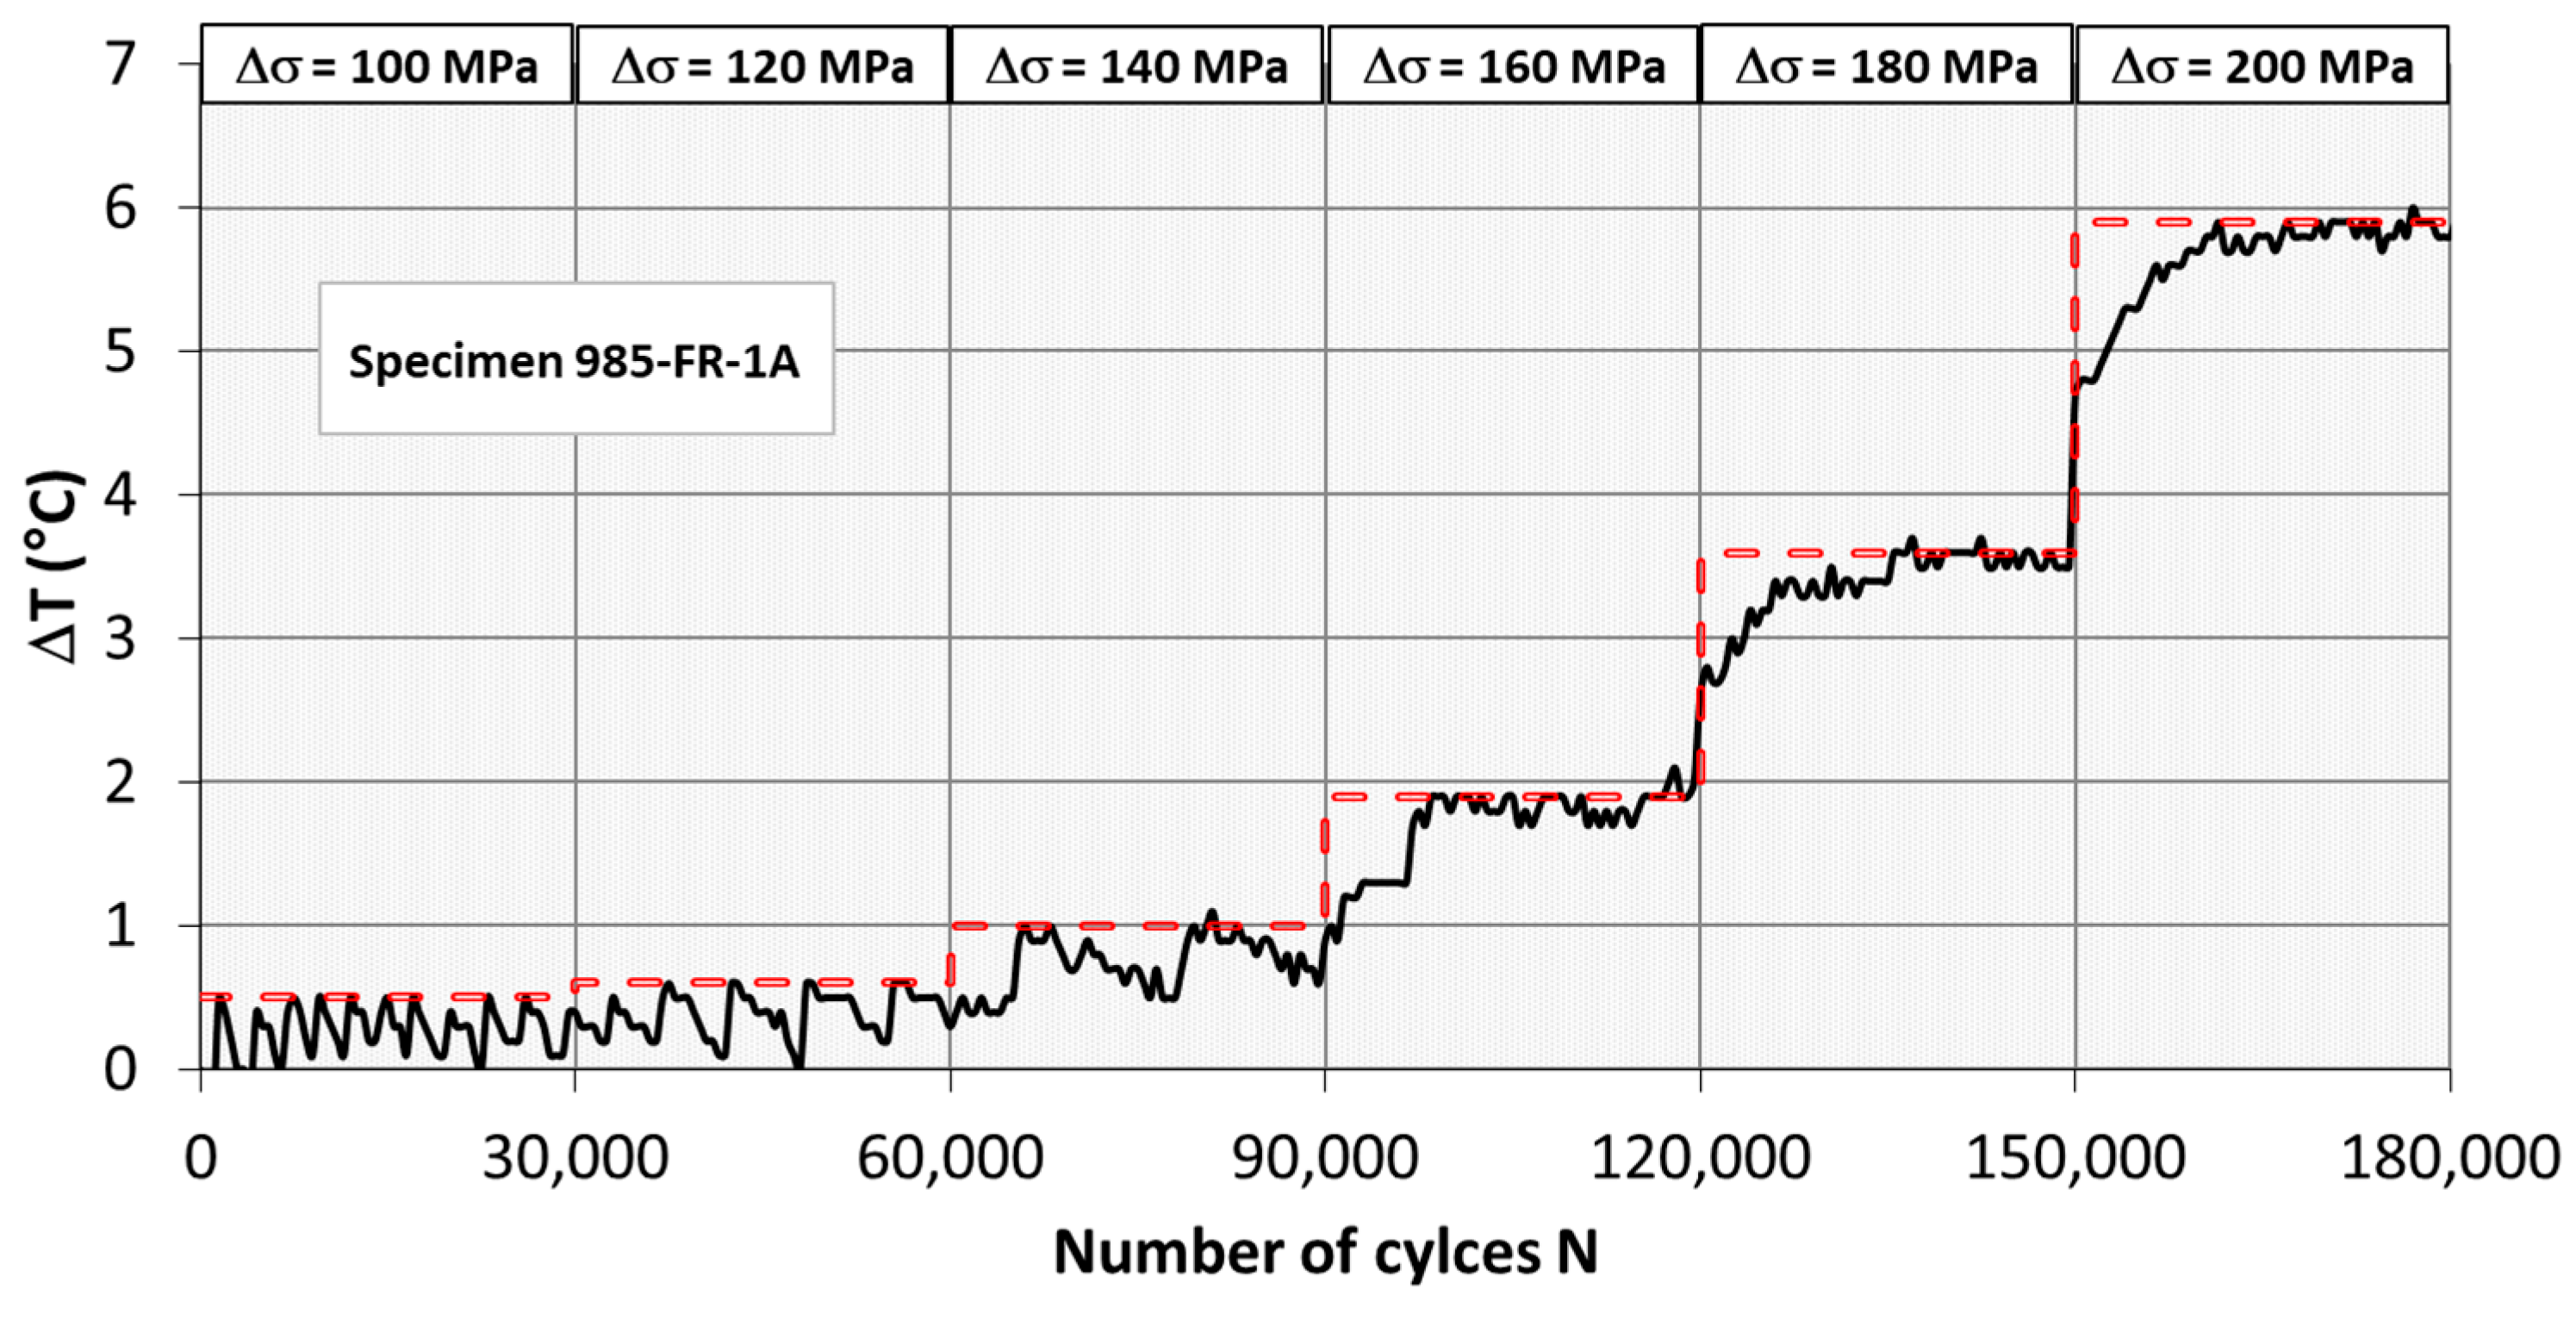
By cyclically loading a specimen over the fatigue limit, a quick temperature increment can be detected on its surface (phase 1). Successively, a stabilization of the temperature is maintained near an asymptotic value (ΔTAS) (phase 2). When plastic deformations occur, the specimen failure occurs after few cycles, producing a sudden temperature increment (phase 3). The internal microstructural changes are the cause of such a temperature trend [37].
The fatigue limit can be theoretically evaluated by just one specimen through the “stepped loading procedure” or rapid thermographic method. The method consists of the application to the same specimen of a stepwise succession of increasing stress ranges at the same frequency. Research activities have highlighted that the asymptotic temperature ΔTAS is reached shortly with respect to the failure occurrence, so it is possible to consider the temperature increment ΔTAS reached at every loading step (Δσ). As a consequence, for every load step (Δσ), ΔTAS can be recorded.
Figure 5 and Figure 6 show the ΔT-N curves, obtained by two fatigue tests at increasing stress ranges, carried out on welded joints with defects (991-FM-2 specimen and 985-FR-1A specimen).
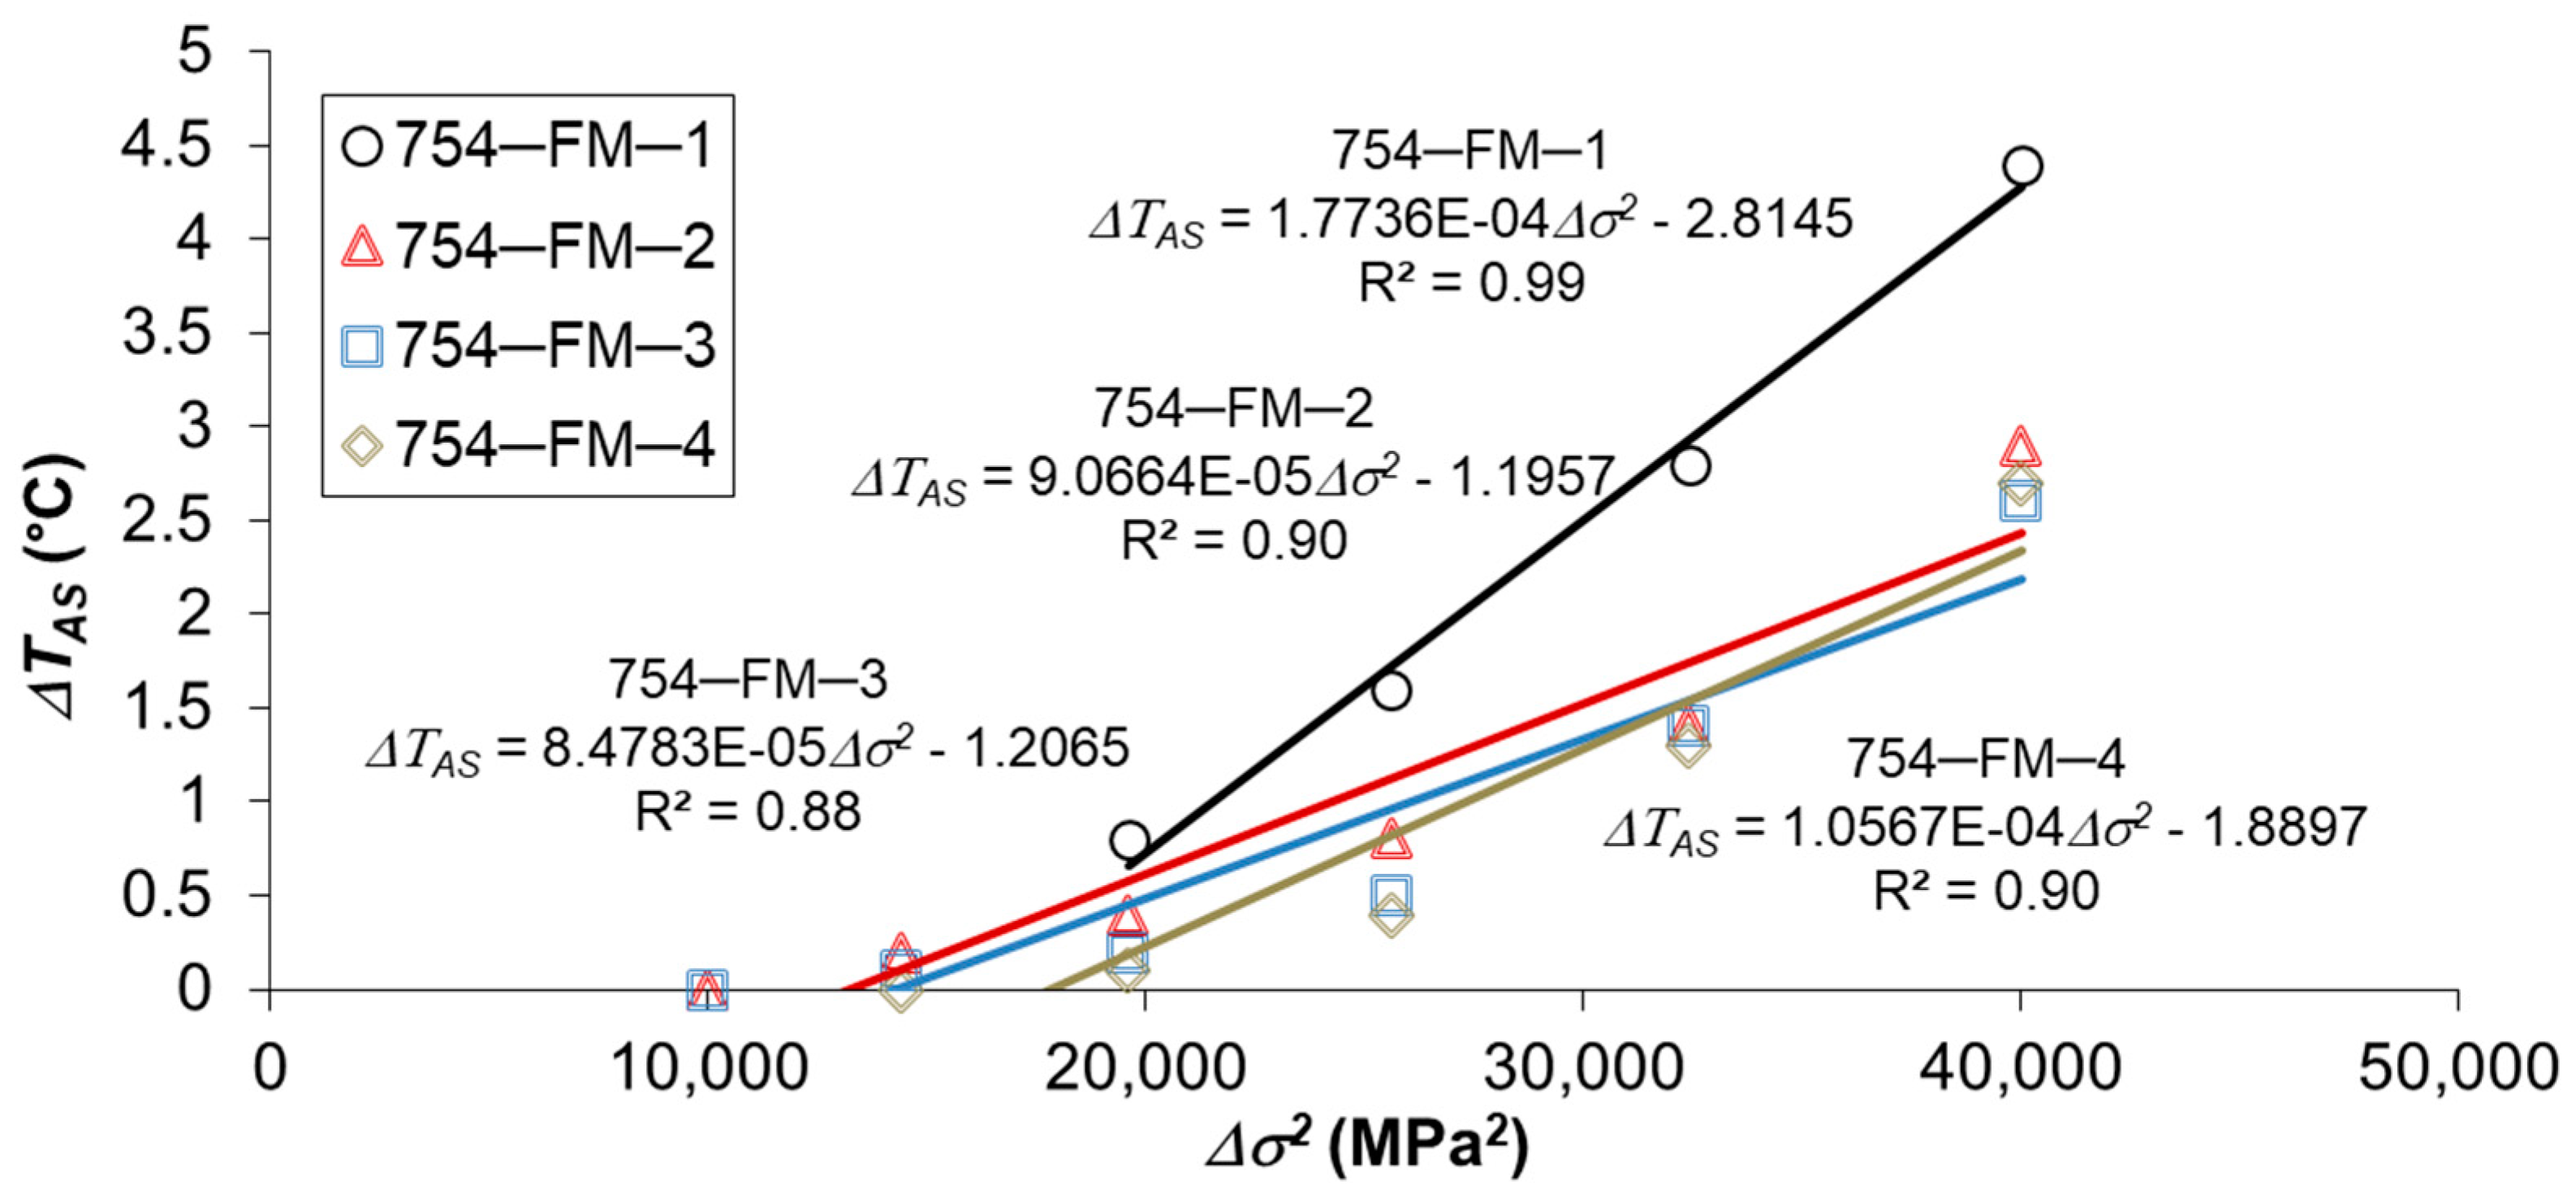
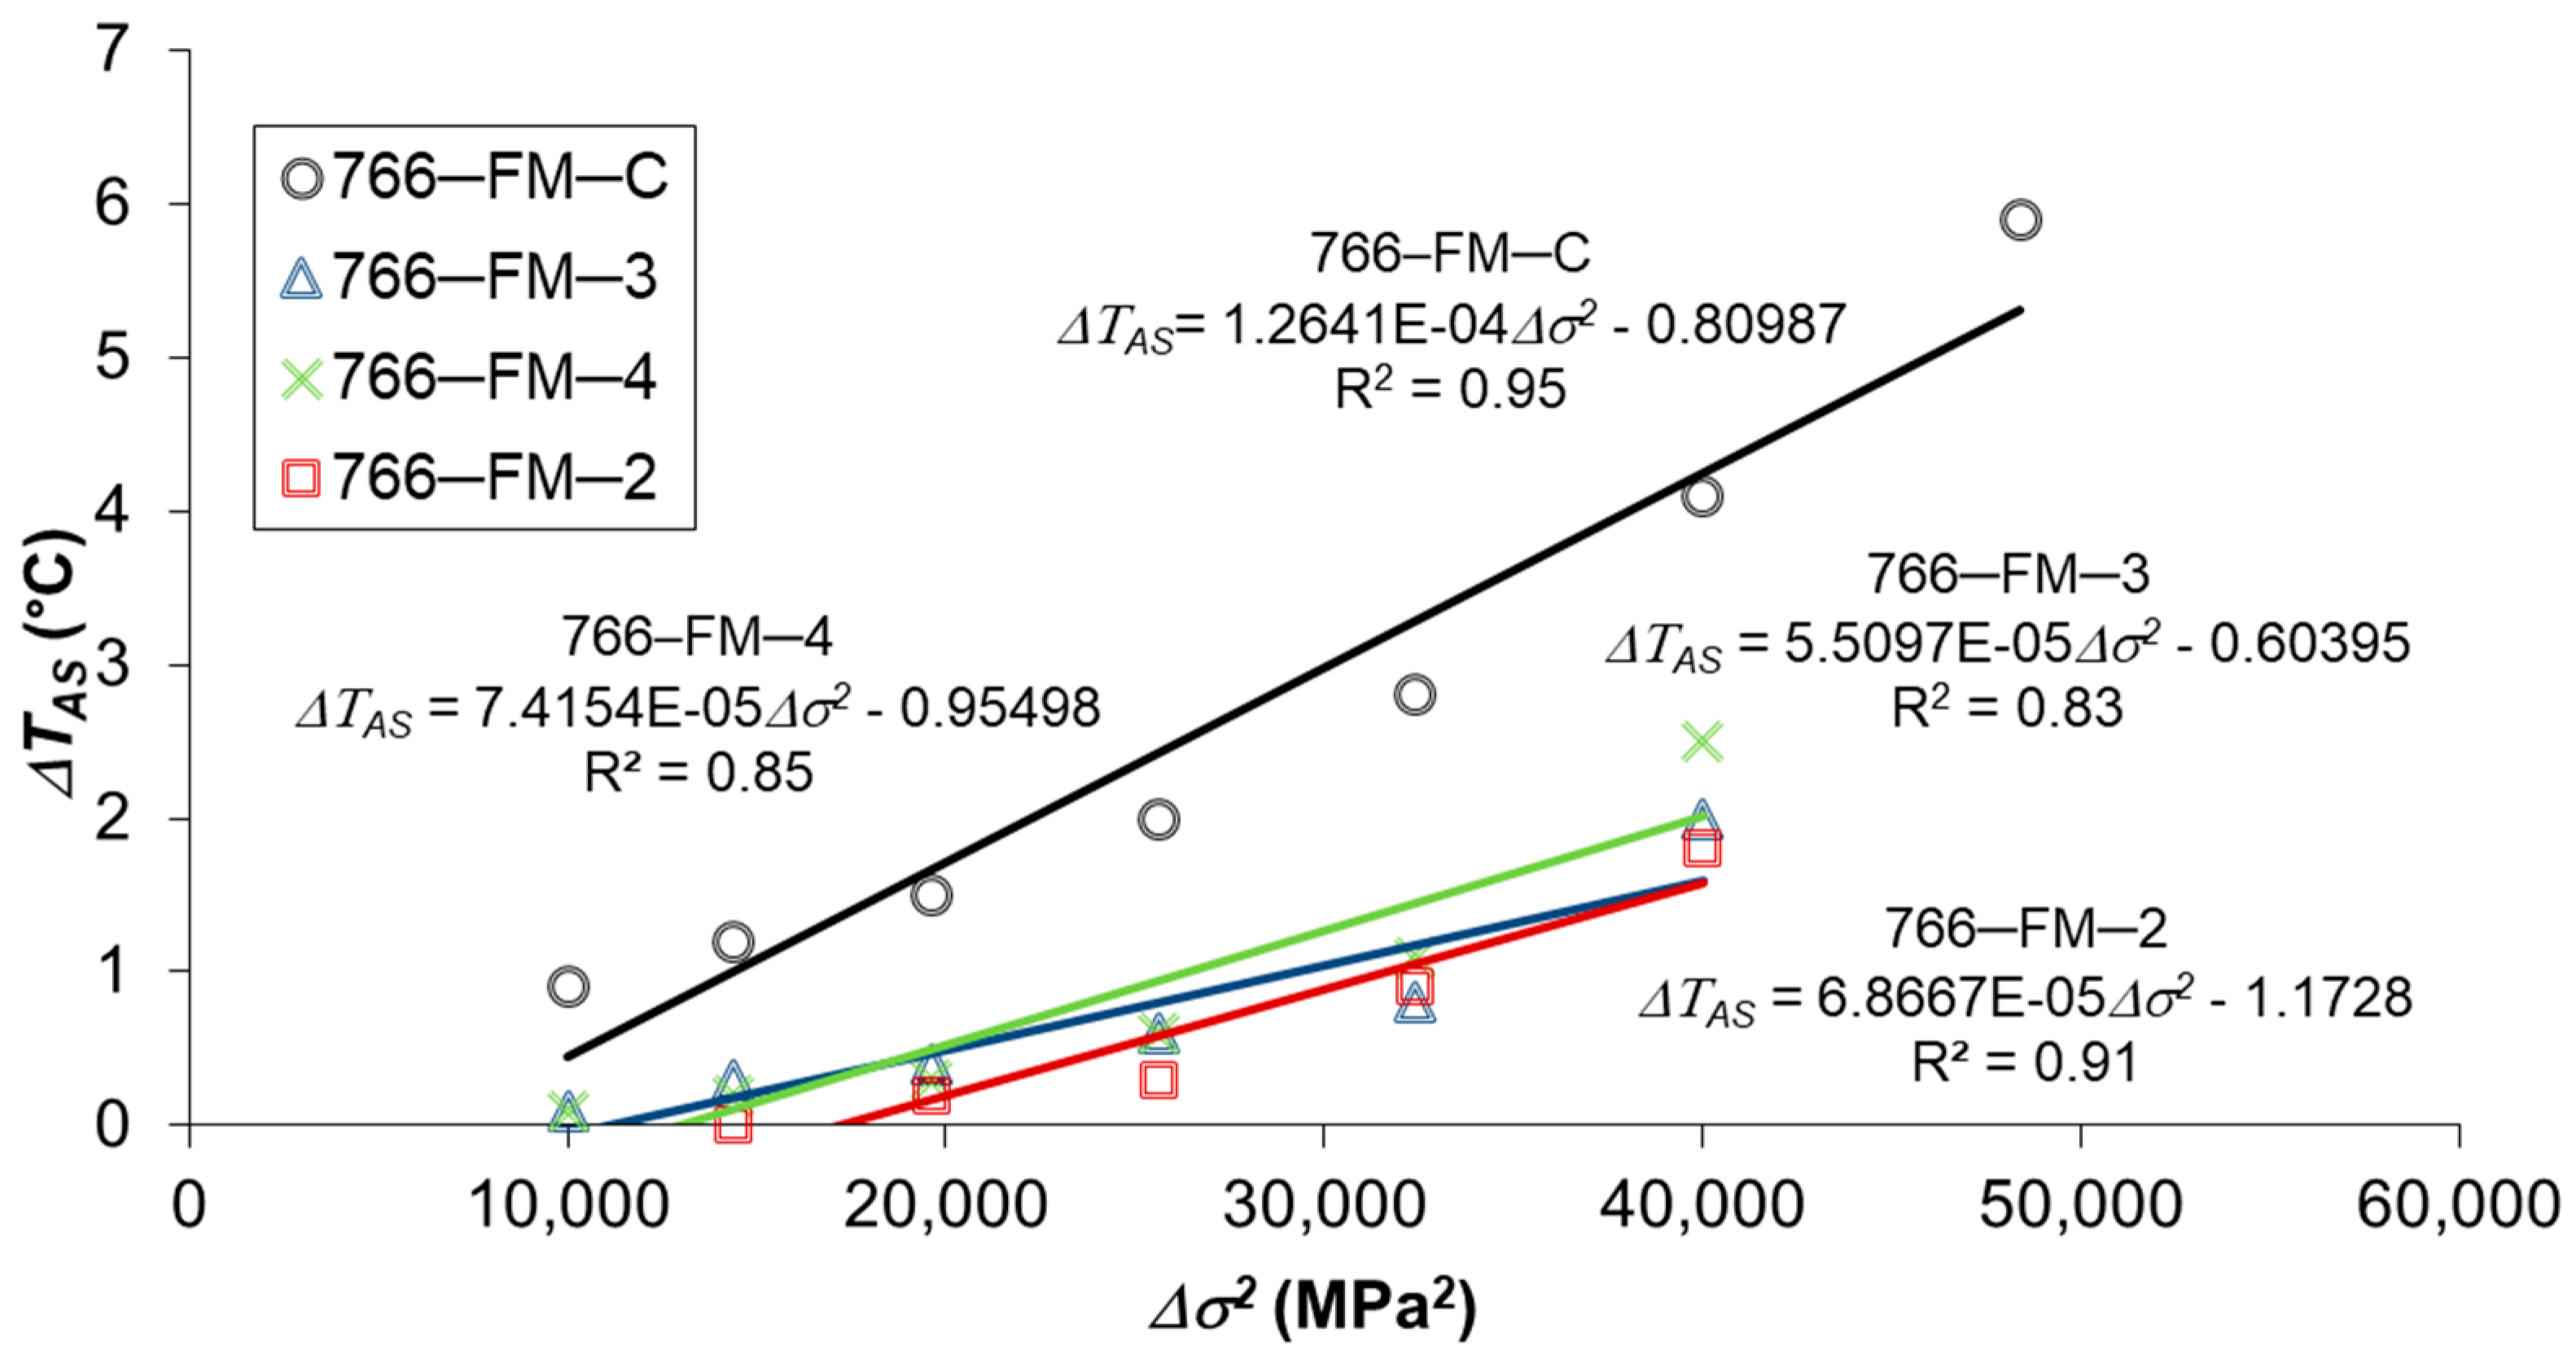
By plotting the stress range squared (Δσ2) vs. ΔTAS and performing a linear regression, the fatigue limit can be evaluated by the intersection of the regression straight line with the abscissa axis: this intersection corresponds to the highest stress range for which there is no temperature variation.
All the phases of the rapid thermographic method are reported in another paper by the authors [23] which describes the fatigue tests carried out on AH36 butt welded joints, similar to the investigated joints without defects (type-C). The predicted values of the fatigue limit are: 148, 155 and 159 MPa. They are very close to the value obtained according to the traditional procedure (157 MPa).
3.2. Energy Approach
The S-N curves are generally obtained from constant-amplitude fatigue tests, using the standard equation:
The experimental data in terms of log(N) and log(Δσ) are fitted using the following linear regression equation:
and the parameters m and log(C) are obtained.
The median S-N curve, so obtained, is related to a survival probability Ps equal to 50%. In order to obtain an S-N curve associated with a different survival probability Ps, a Gaussian log-normal distribution of the variable log(N) is assumed. The design S-N curve refers to Ps equal to 97.7% and it is obtained shifting the median curve (Ps = 50%) by two standard deviations of log(N) in abscissa direction.
The energy approach allows the rapid prediction of the whole S-N curve, considering the amount of energy involved in the fatigue crack growth. The basic assumption of this approach is that the fatigue failure occurs with the achievement of a threshold value of the absorbed energy EC, which is proportional to the integral Φ of the ΔT-N curve until failure:
where Nf is the number of cycles to failure. When a single stress range level is applied, under the assumption that the number of cycles of the phases 1 and 3 is negligible compared with that of phase 2, the integral Δσ can be simply evaluated as:
The assessment of the integral Φ and the experimental evaluation of the asymptotic stabilized temperature (ΔTAS), corresponding to each applied stress range level (Δσ), allows the prediction of the fatigue life Nf by means of Equation (4). Finally, the S-N curve can be predicted on the basis of the pairs (Δσ,Nf) so obtained.
All the phases of the energy approach are reported in another paper of the authors [23]. The S-N curve parameters (m = 5.6 ± 0.2, log C = 18.9 ± 0.3) predicted by the energy approach for AH36 butt welded joints, similar to the investigated joints without defects (type-C), are very close to the values obtained by the traditional procedure (m = 5.6 ± 2.3, log C = 19.1 ± 5.3).
4. Results and Discussion
The experimental tests have given the following results for each joint type:
- asymptotic temperature values (ΔTAS) relative to the corresponding applied stress range (Δσ);
- ΔTAS-Δσ2 curves;
- fatigue limit (ΔσeTM) (according to the thermographic method);
- S-N curve predicted by the energy approach;
- fatigue limit (ΔσeSN) (drawn from the predicted S-N curves at 5 × 10⁶ cycles).
In the cyclically loaded specimens, failure generally took place in the weld zone with the crack initiating in proximity of the weld toe, where there are high stress concentrations. All the fracture zones showed the typical fatigue fracture surface.
4.1. Fatigue Prediction by Rapid Thermographic Method
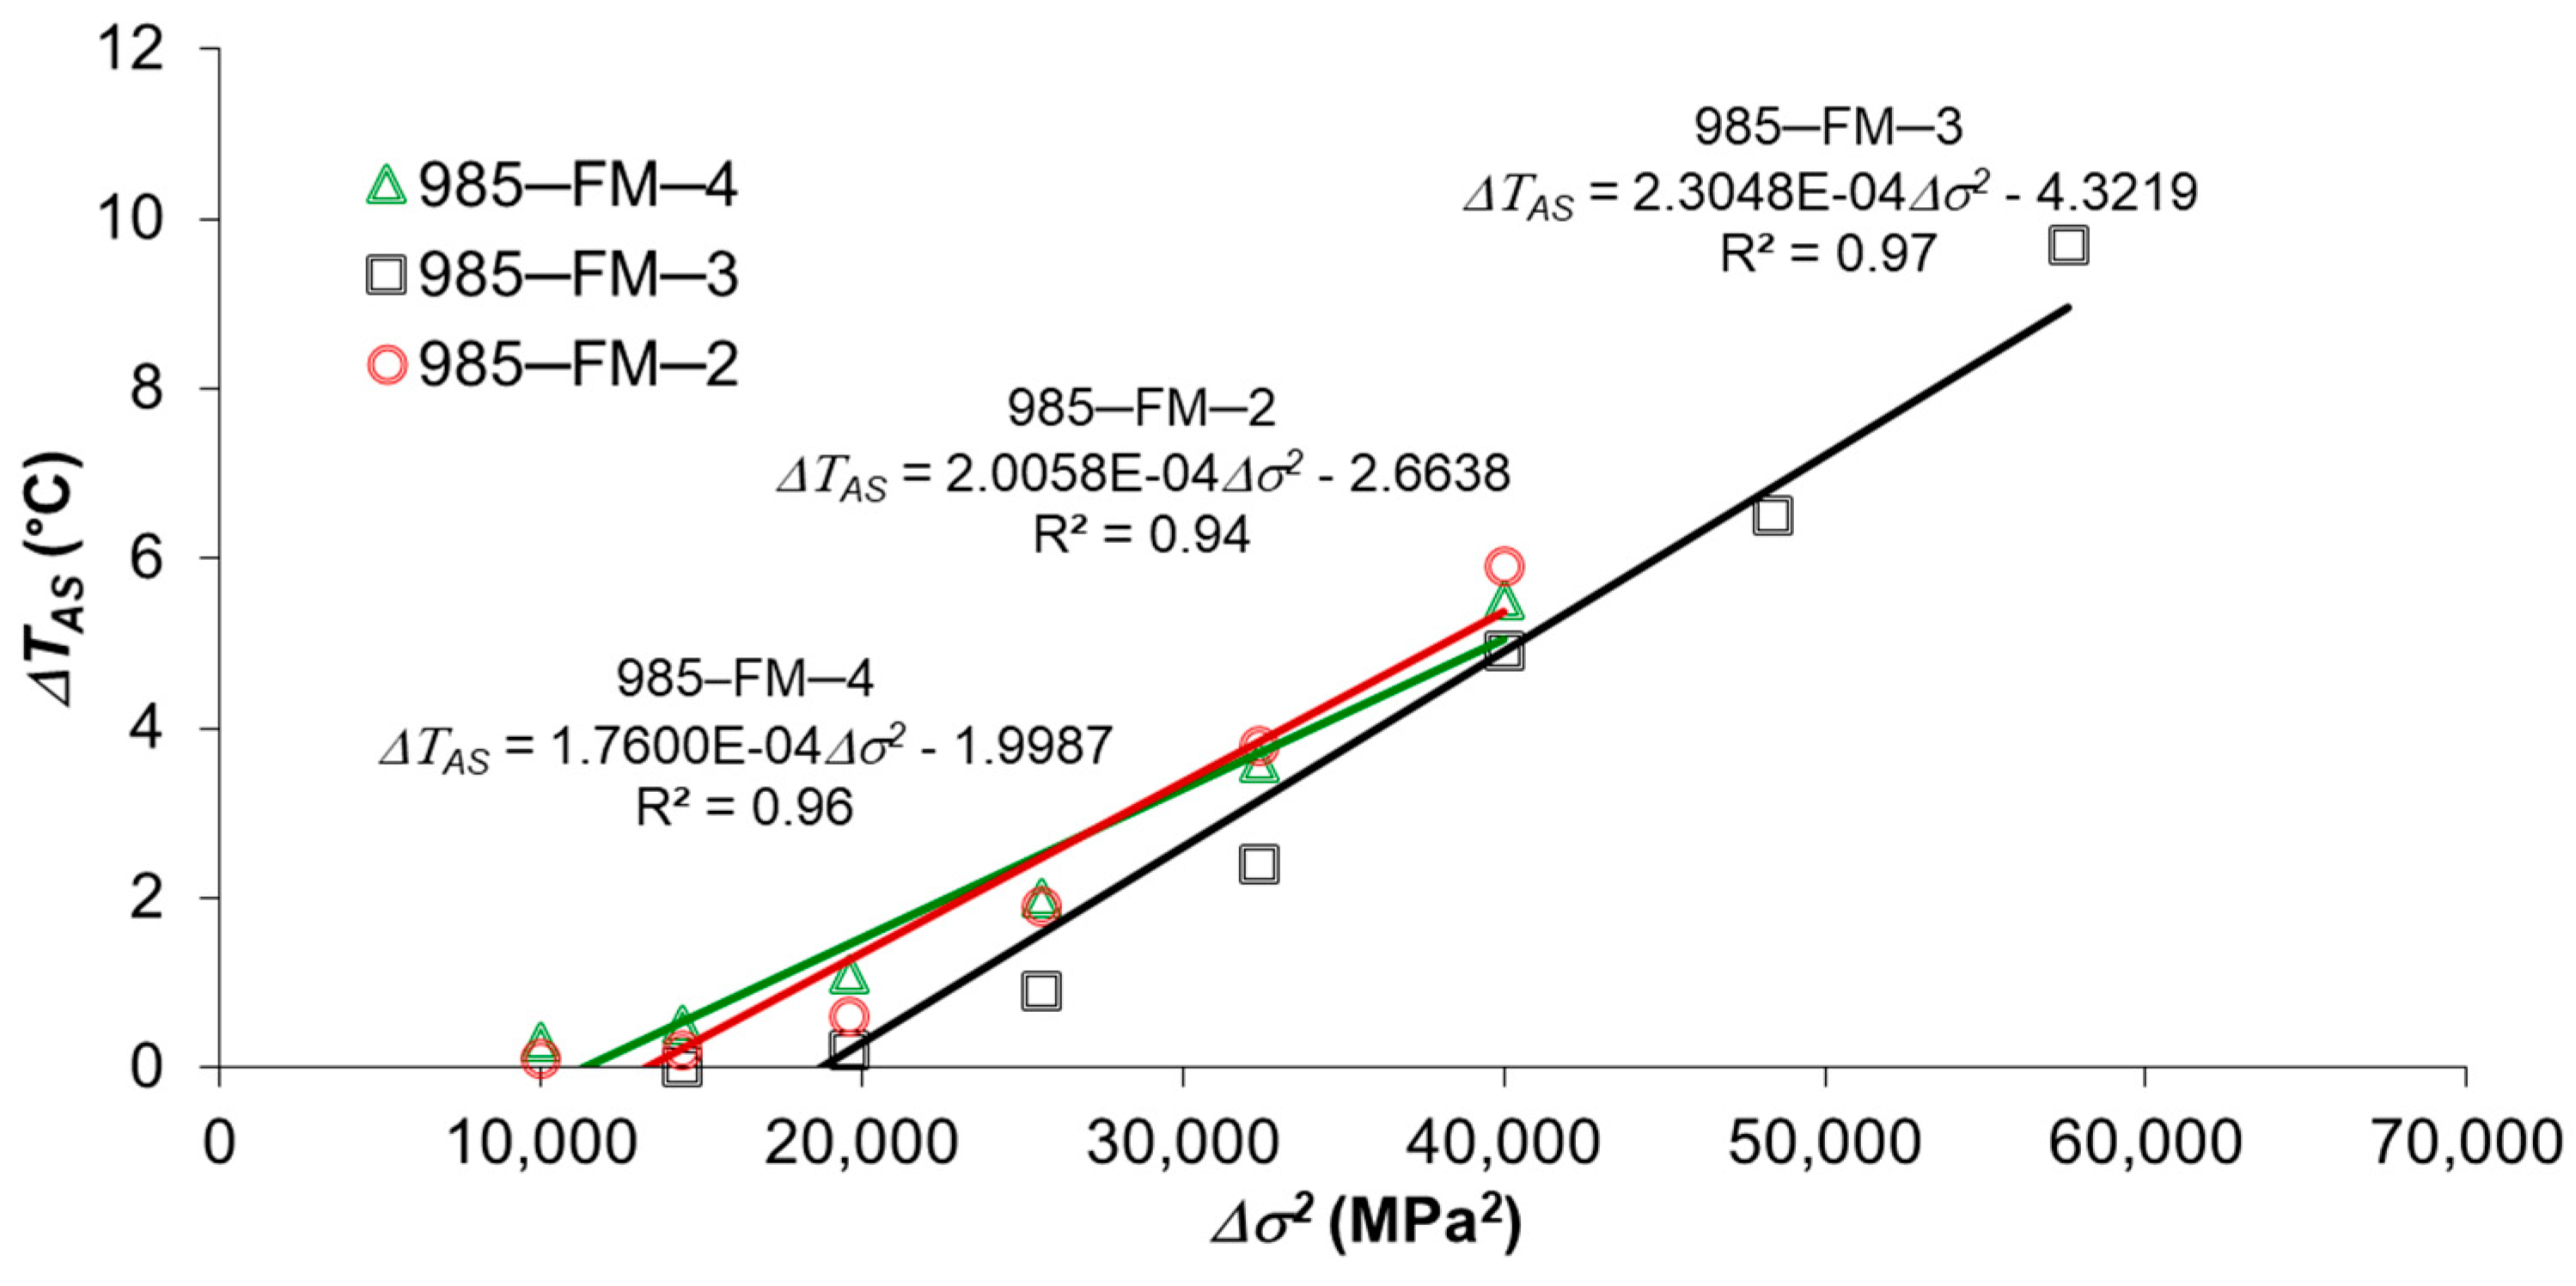
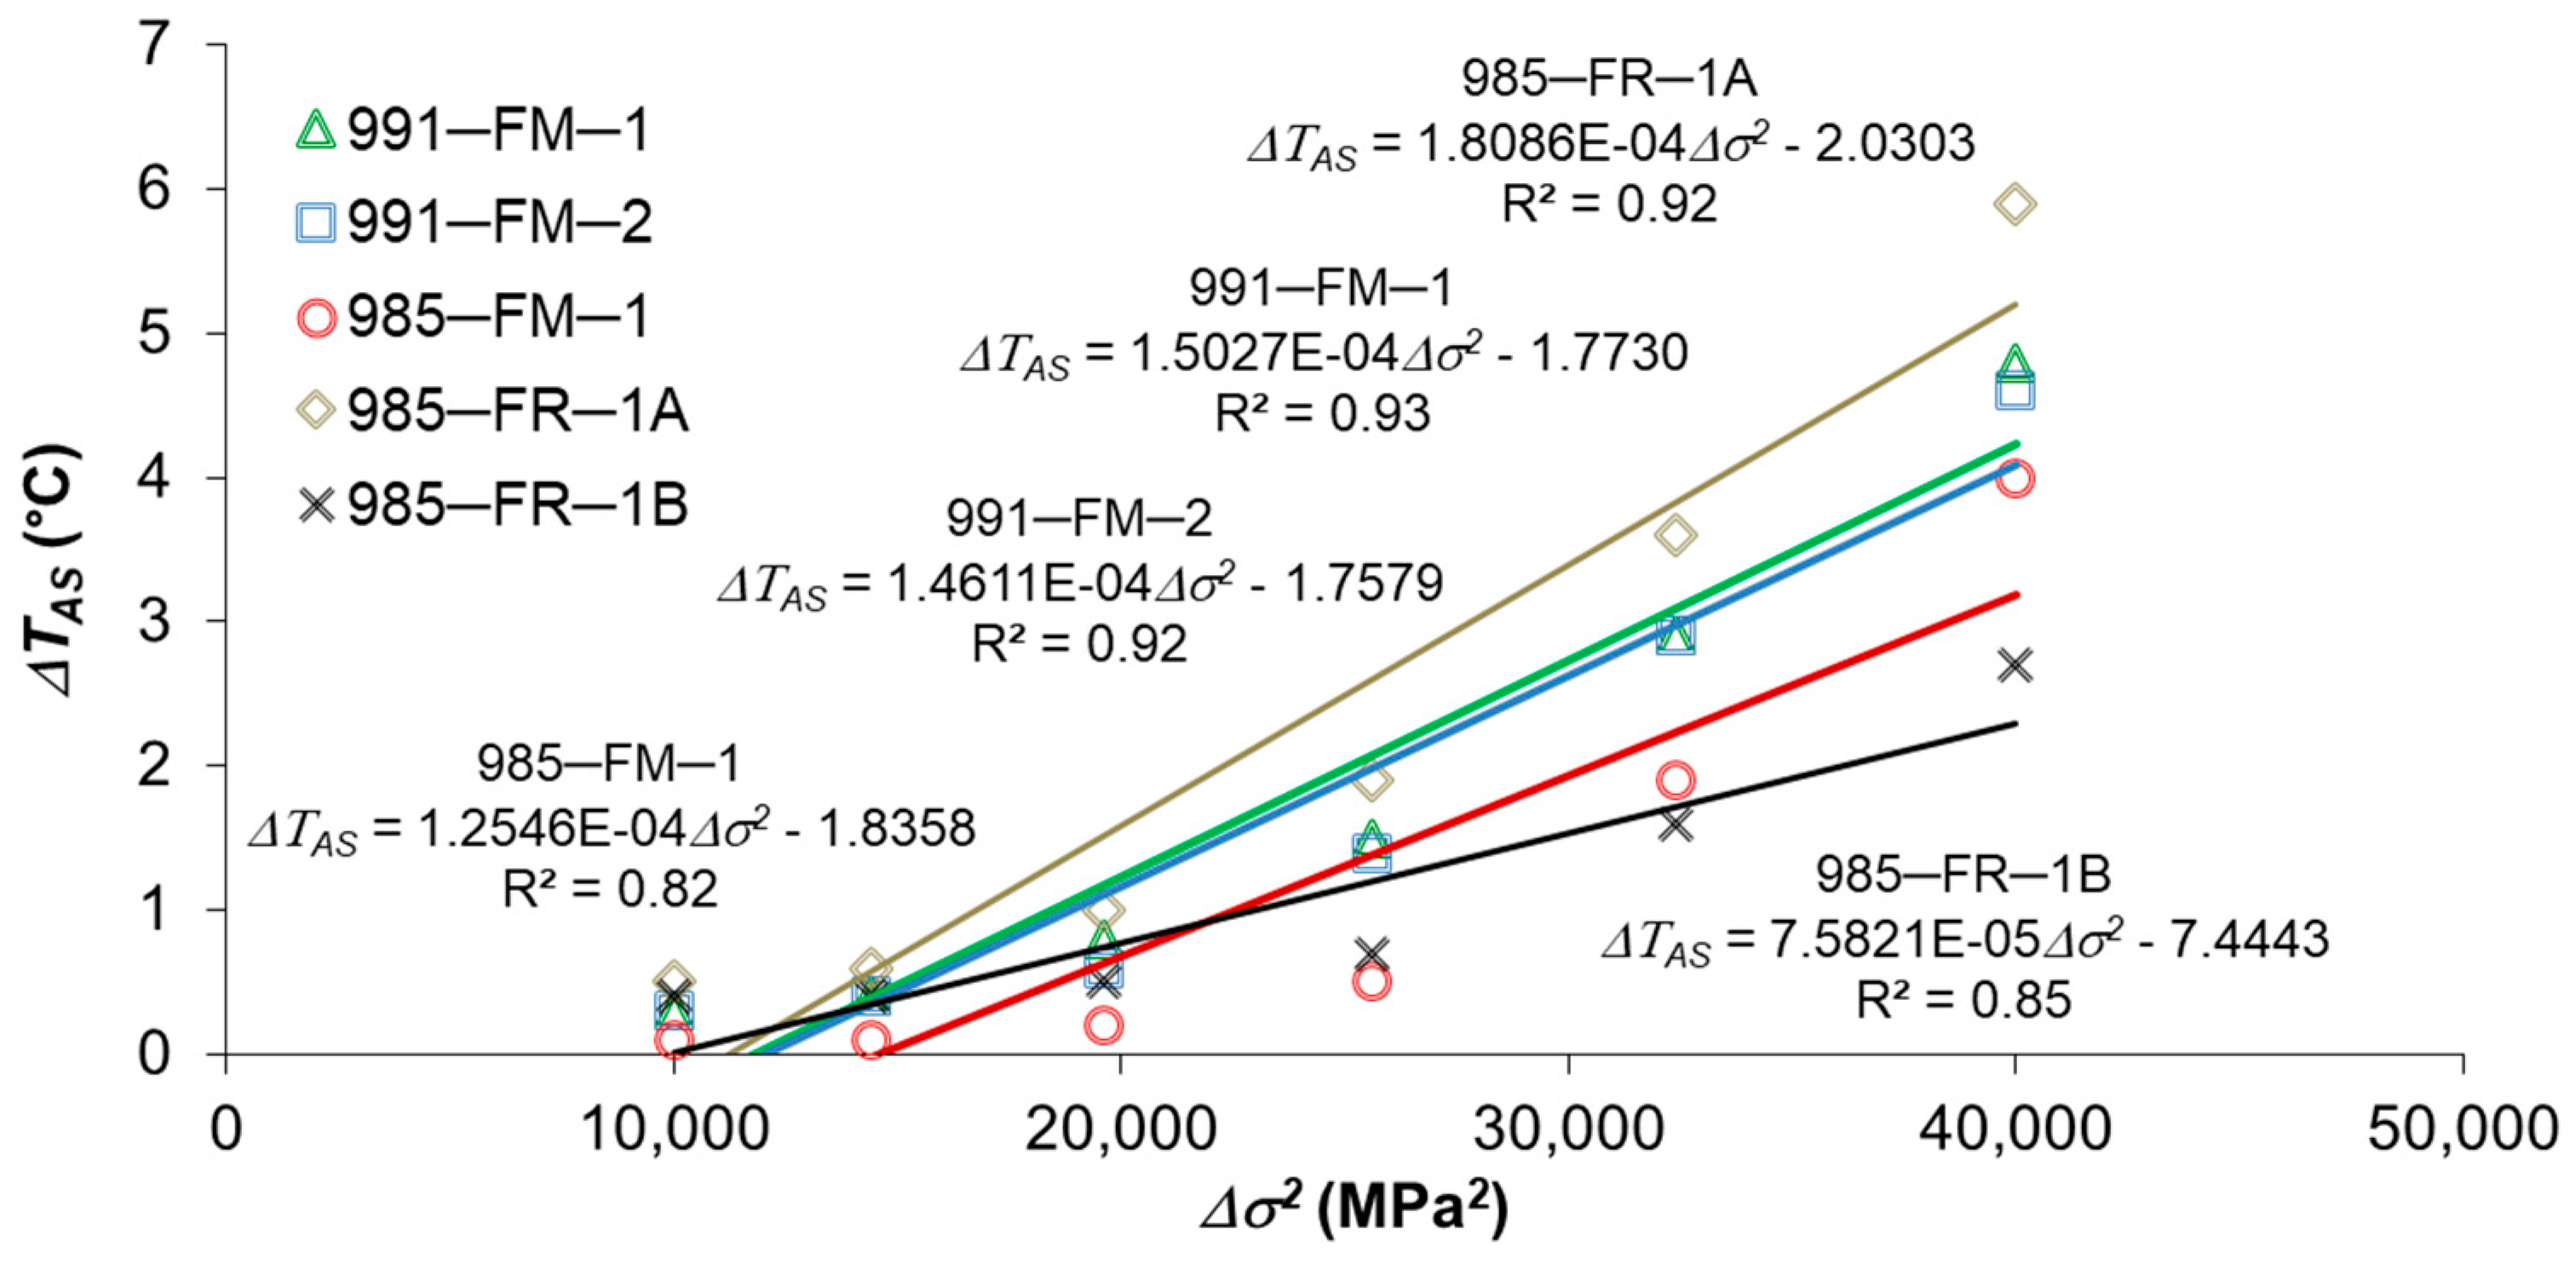
In Figure 7, Figure 8, Figure 9 and Figure 10, for each joint type, the asymptotic temperature increment (ΔTAS) is directly related to the applied stress range squared (Δσ2). The experimental data, reported in the graphs, were interpolated with a linear function, and the fatigue limits (ΔσeTM) were determined according to the TM, by the intersections of the above-mentioned straight lines with the abscissa axis. In other words, the fatigue limit is defined as the highest Δσ corresponding to no temperature increase (ΔTAS = 0).
The stepwise succession of increasing stress ranges, applied to the specimen identified by the specimen ID 754-FM1, starts from 140 MPa instead of 100 MPa as in the other tests.
Table 5 shows the values of the fatigue limits (ΔσeTM) assessed resorting to the rapid thermographic method for each investigated joint.
The values of fatigue strength predicted for the type-C-1 joints are slightly lower than the fatigue strength values (157 MPa), obtained by 29 experimental tests carried out according to the traditional procedure [23] on welded joints similar to the investigated joints.
The analysis of the results confirms that there are more kinds of defects, so the type-NC-2 joints could be classified into three categories according to the type of defect: the 766-FM2 specimen (with presence of blowing) has the same fatigue strength of the type-C-1 joints, for the 766-FM3 e 766-FM4 specimens there is a reduction of the fatigue strength, that becomes significant for the 766-FMC specimen.
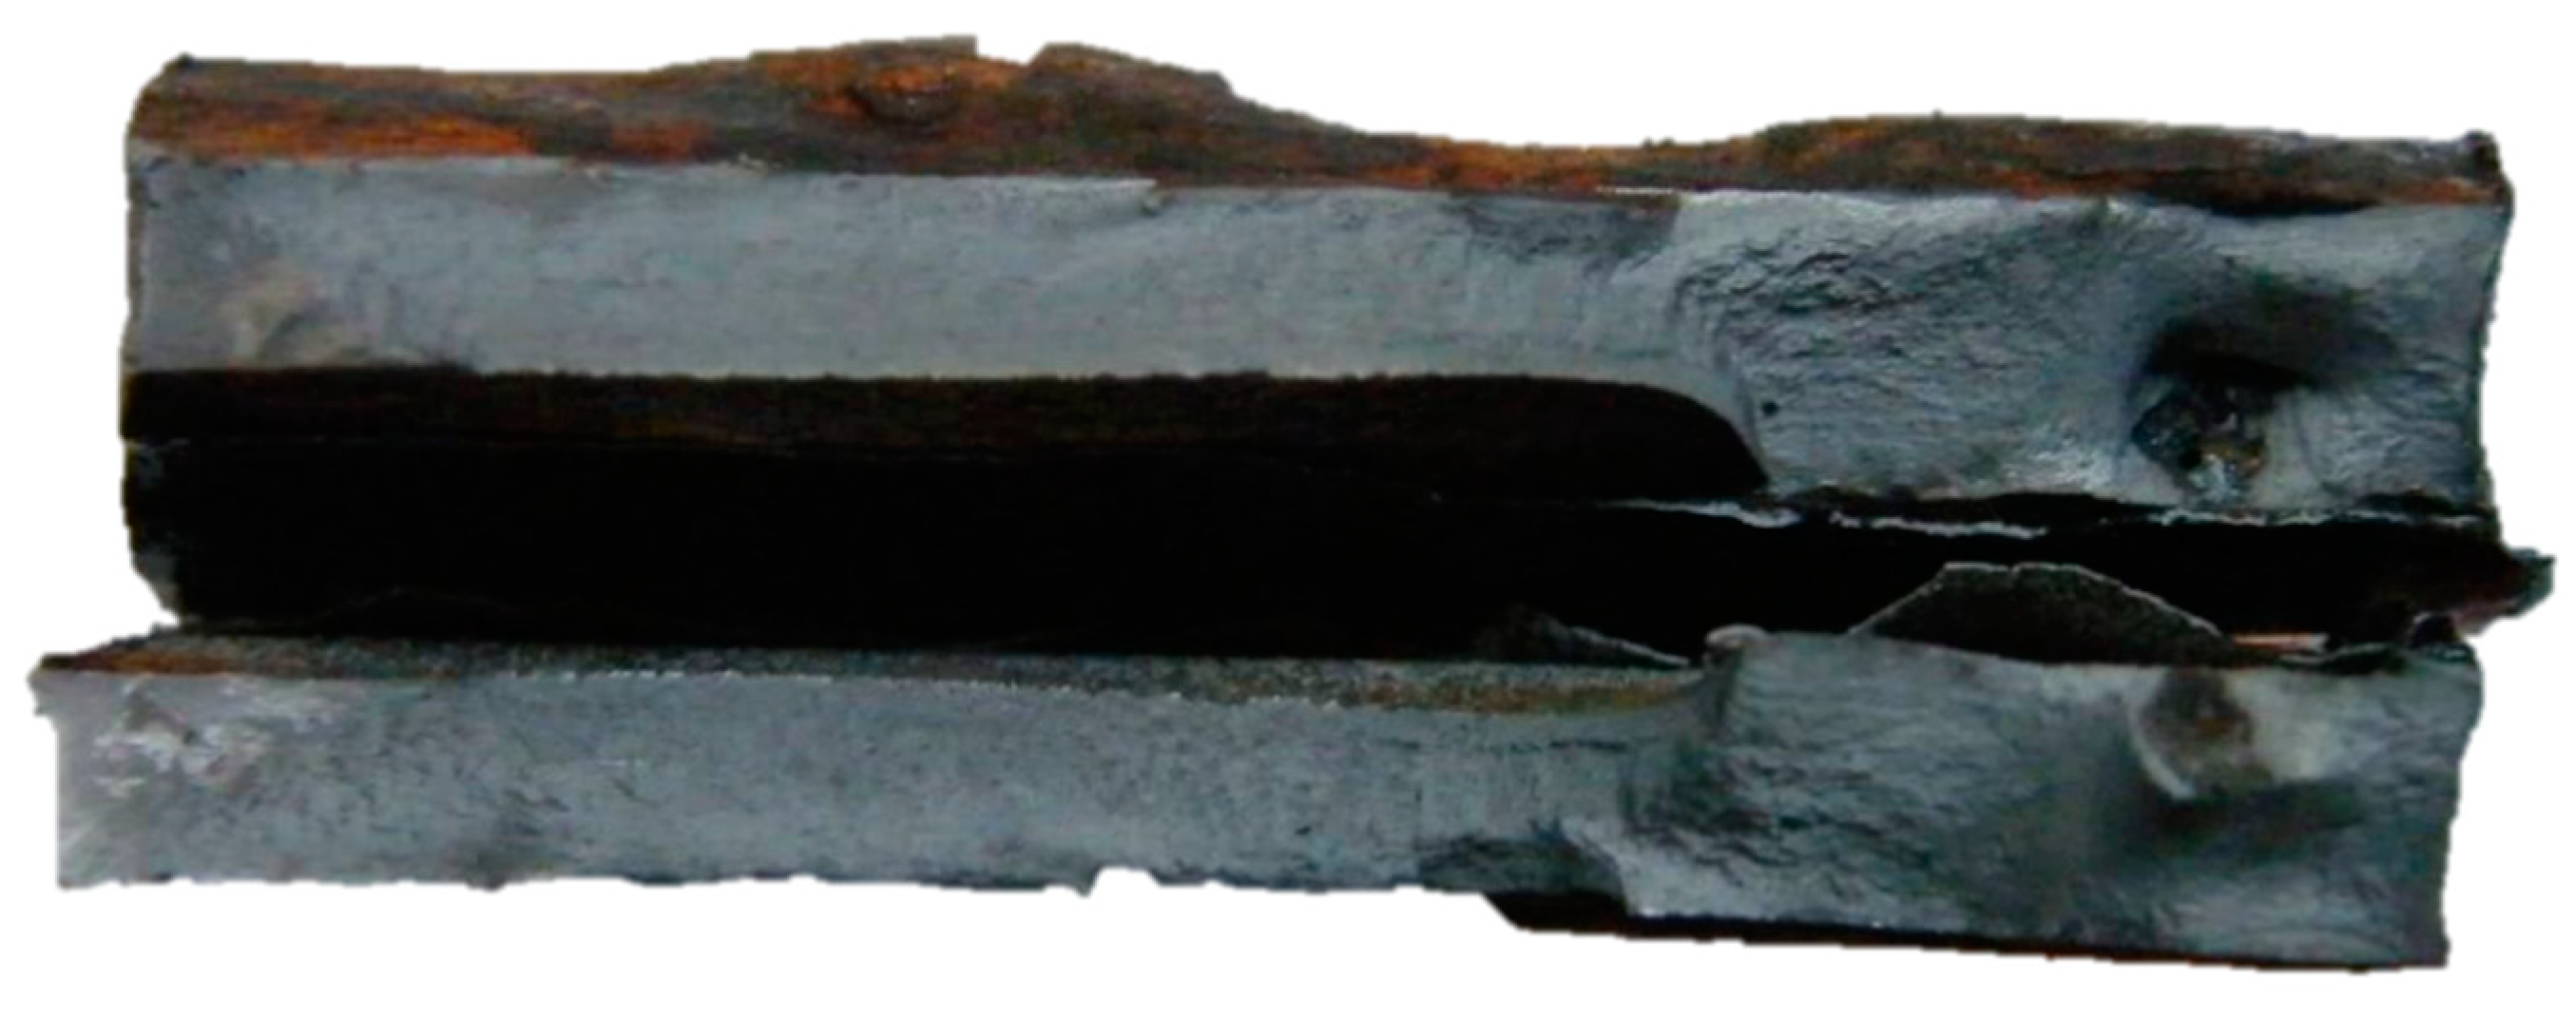
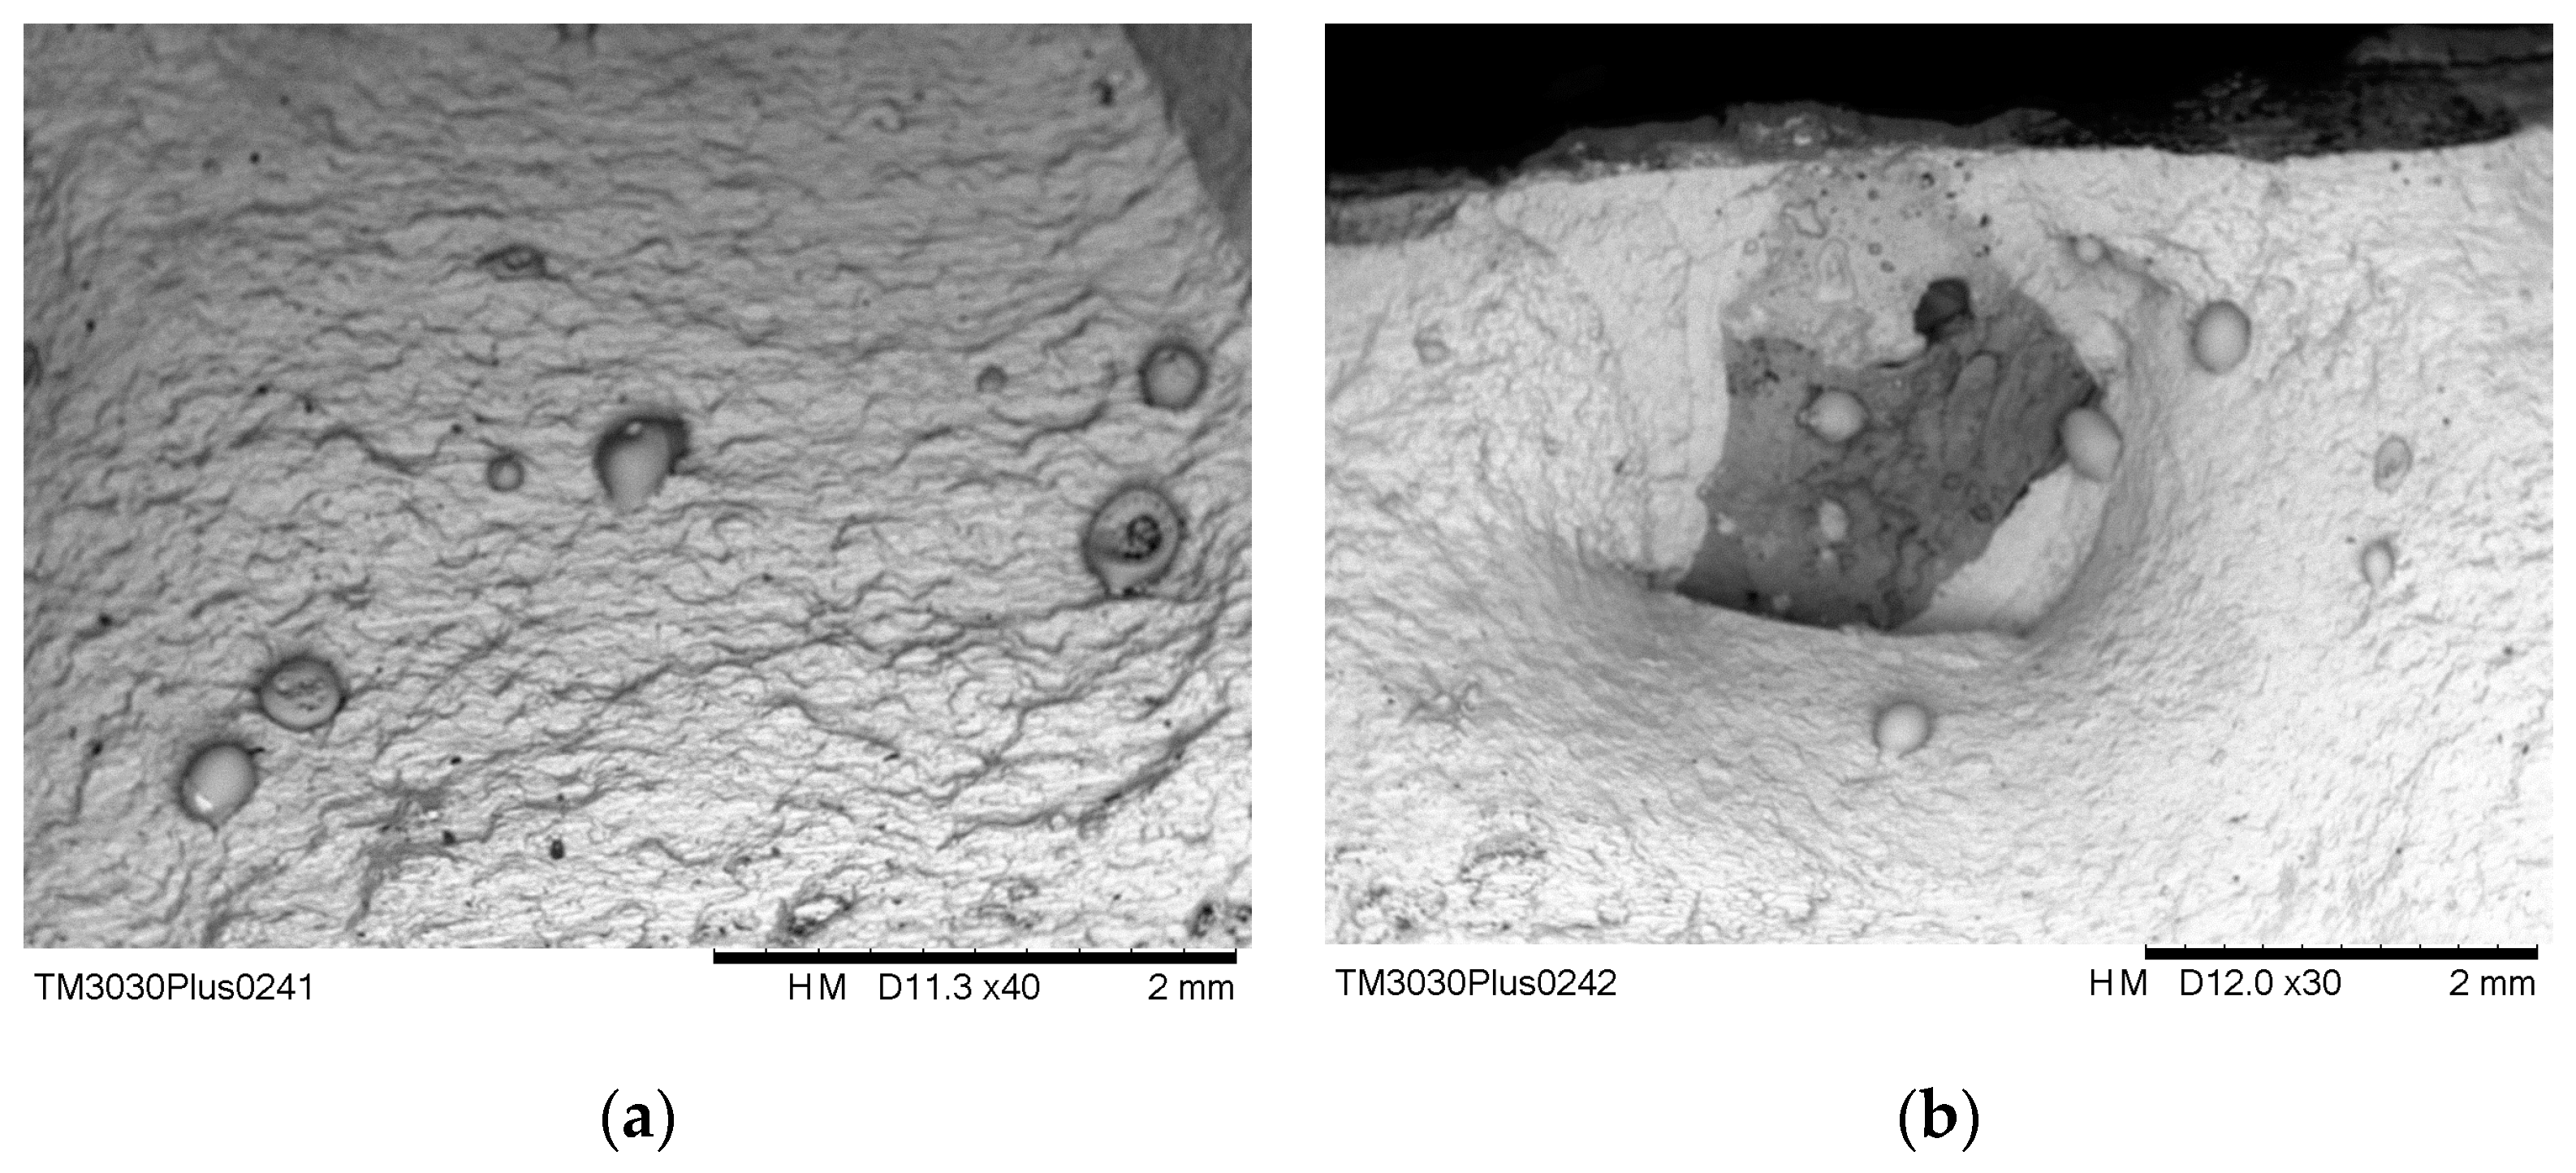
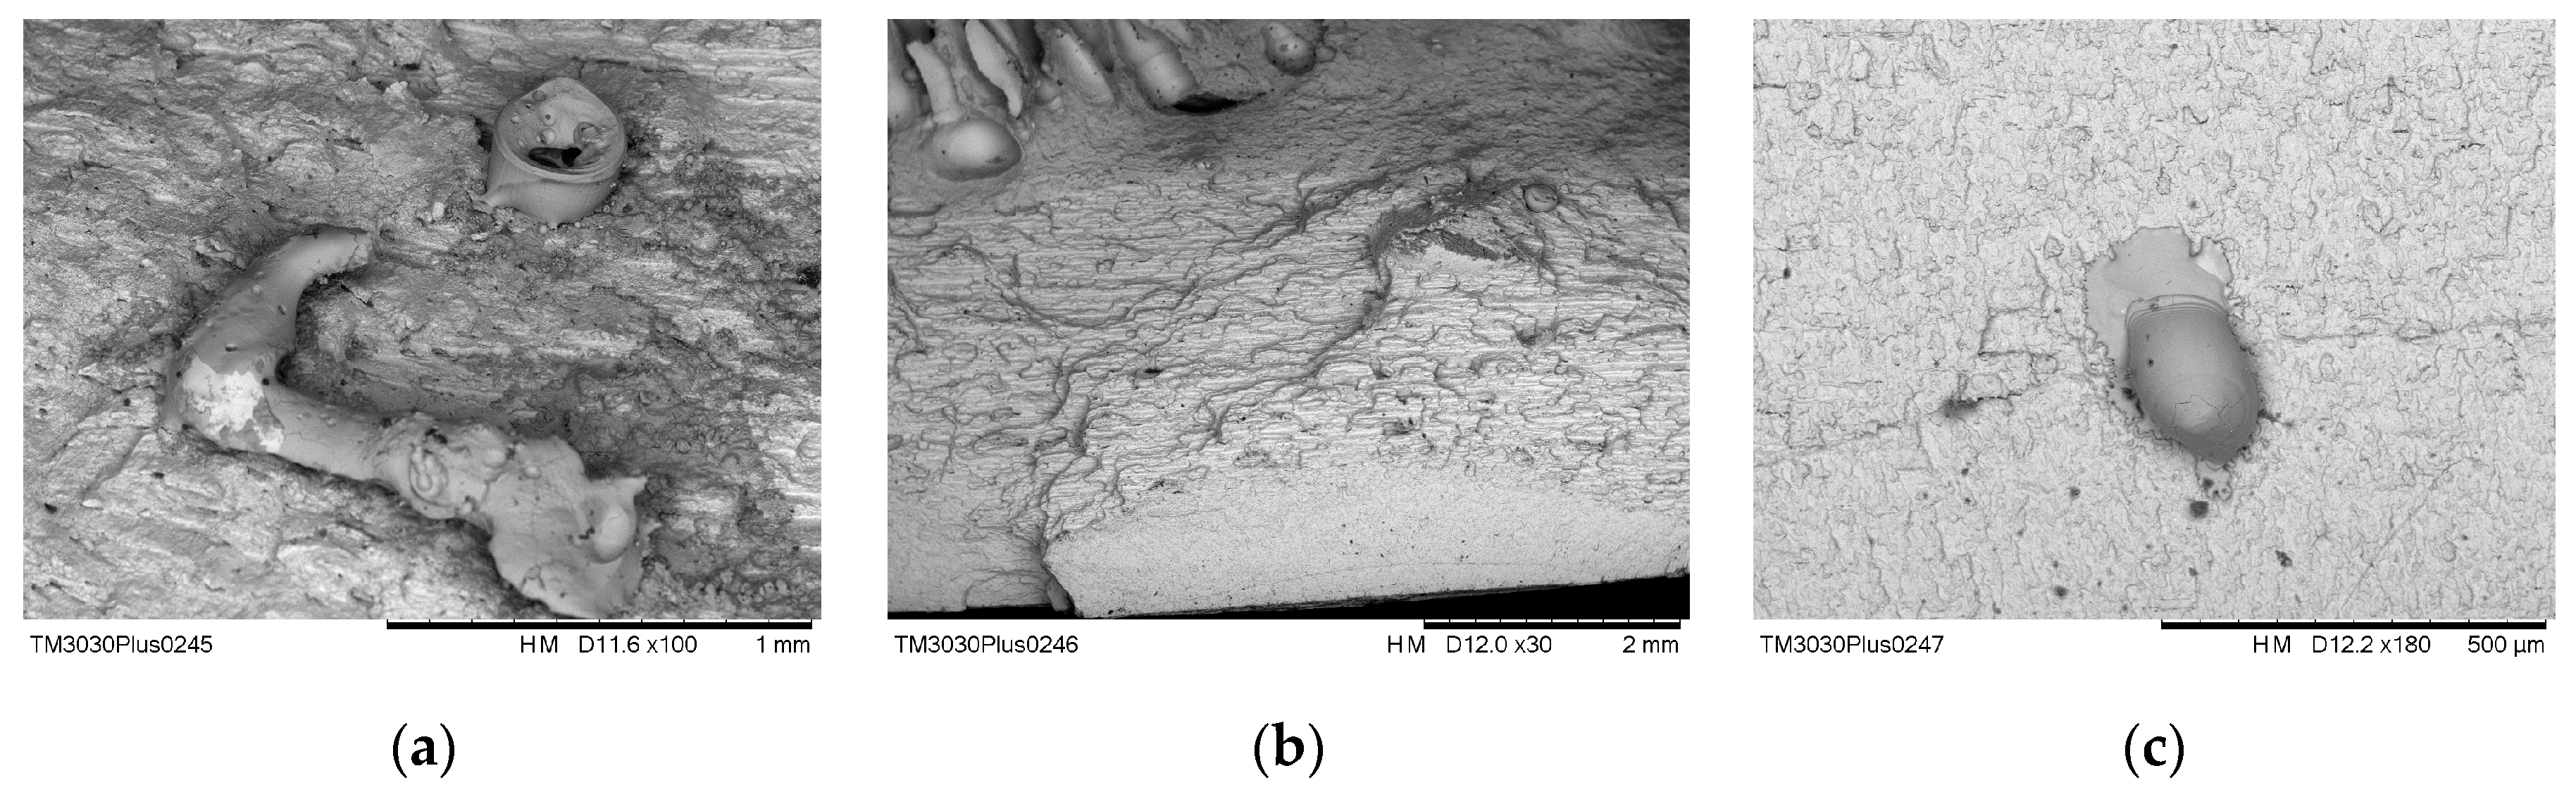
The low value of fatigue strength predicted by the rapid thermographic method for the 766-FM-C specimen (80 MPa) is confirmed by the presence of a significant defect in the weld zone clearly discernible in the fracture zone of the specimen as can be seen from the photos of Figure 11 and Figure 12.
Defects evaluation for 766-FM-2 specimen, revealed different results (Figure 13).
The analysis of the results, reported in Table 5, shows that the type-C-1 and -C-3 joints have similar fatigue strength values, so the thickness variation from 5.5 to 6.5 mm does not produce a significant variation of the fatigue strength.
The scattering of the data relative to the predicted values of fatigue strength is lower for the type-NC-4 joints, except for the 985-FM-1 specimen, which has the same fatigue strength of the type-C-3 joints.
4.2. S-N Curve Prediction by Energy Approach
The energy approach was not applied to the 754-FM1 specimen, because the test was interrupted before fracture for an improper setting of the test parameter (maximum limit of extension), and to the 754-FM2 specimen, which had a fracture for necking in a zone far from the weld zone.
The values, predicted by the energy approach, of the negative inverse slope m, the stress range at 2 × 10⁶ cycles (fatigue class (FAT)) and the stress range at 5 × 10⁶ cycles (fatigue limit (Δσe φTM)) are given for each type of joint in Table 6 with reference to 50 and 97.7% survival probabilities PS.
The S-N curves predicted for type-C-1 and -C-3 joints are similar confirming the fact that the slight variation in thickness is not significant and show a trend similar to that obtained by 29 experimental tests carried out according to the traditional procedure [23].
The values of fatigue strength, predicted by the energy approach and reported in Table 6, are similar to those predicted by the rapid thermographic method and reported in Table 5 for the type-C-1 and -C-3 joints, whereas the predictions are lower for the type-NC-2 and -NC-4 joints. This difference can be explained by the definition of the fatigue limit as extrapolation from the S-N curves at 5 × 10⁶ cycles, which can be considered valid for “perfect” welds without defects.
Moreover, the energy approach confirms the value of fatigue limit predicted by the rapid thermographic method for the 985-FM1 specimen, which has a fatigue strength similar to that of the “perfect” welds: this joint has an S-N curve with a pattern similar to that of the type-C-3 joints and different than the other type-NC-4 joints. These joints have S-N curves with slopes similar for the joints identified by similar specimens (991-FM, 985-FR). This behavior can be explained by the fact that the variation of fatigue strength values between “imperfect” welded joints is probably due to the presence of defects that differ for typology, dimension, quantity and shape.
4.3. S-N Curves with m = 3 Predicted by Energy Approach
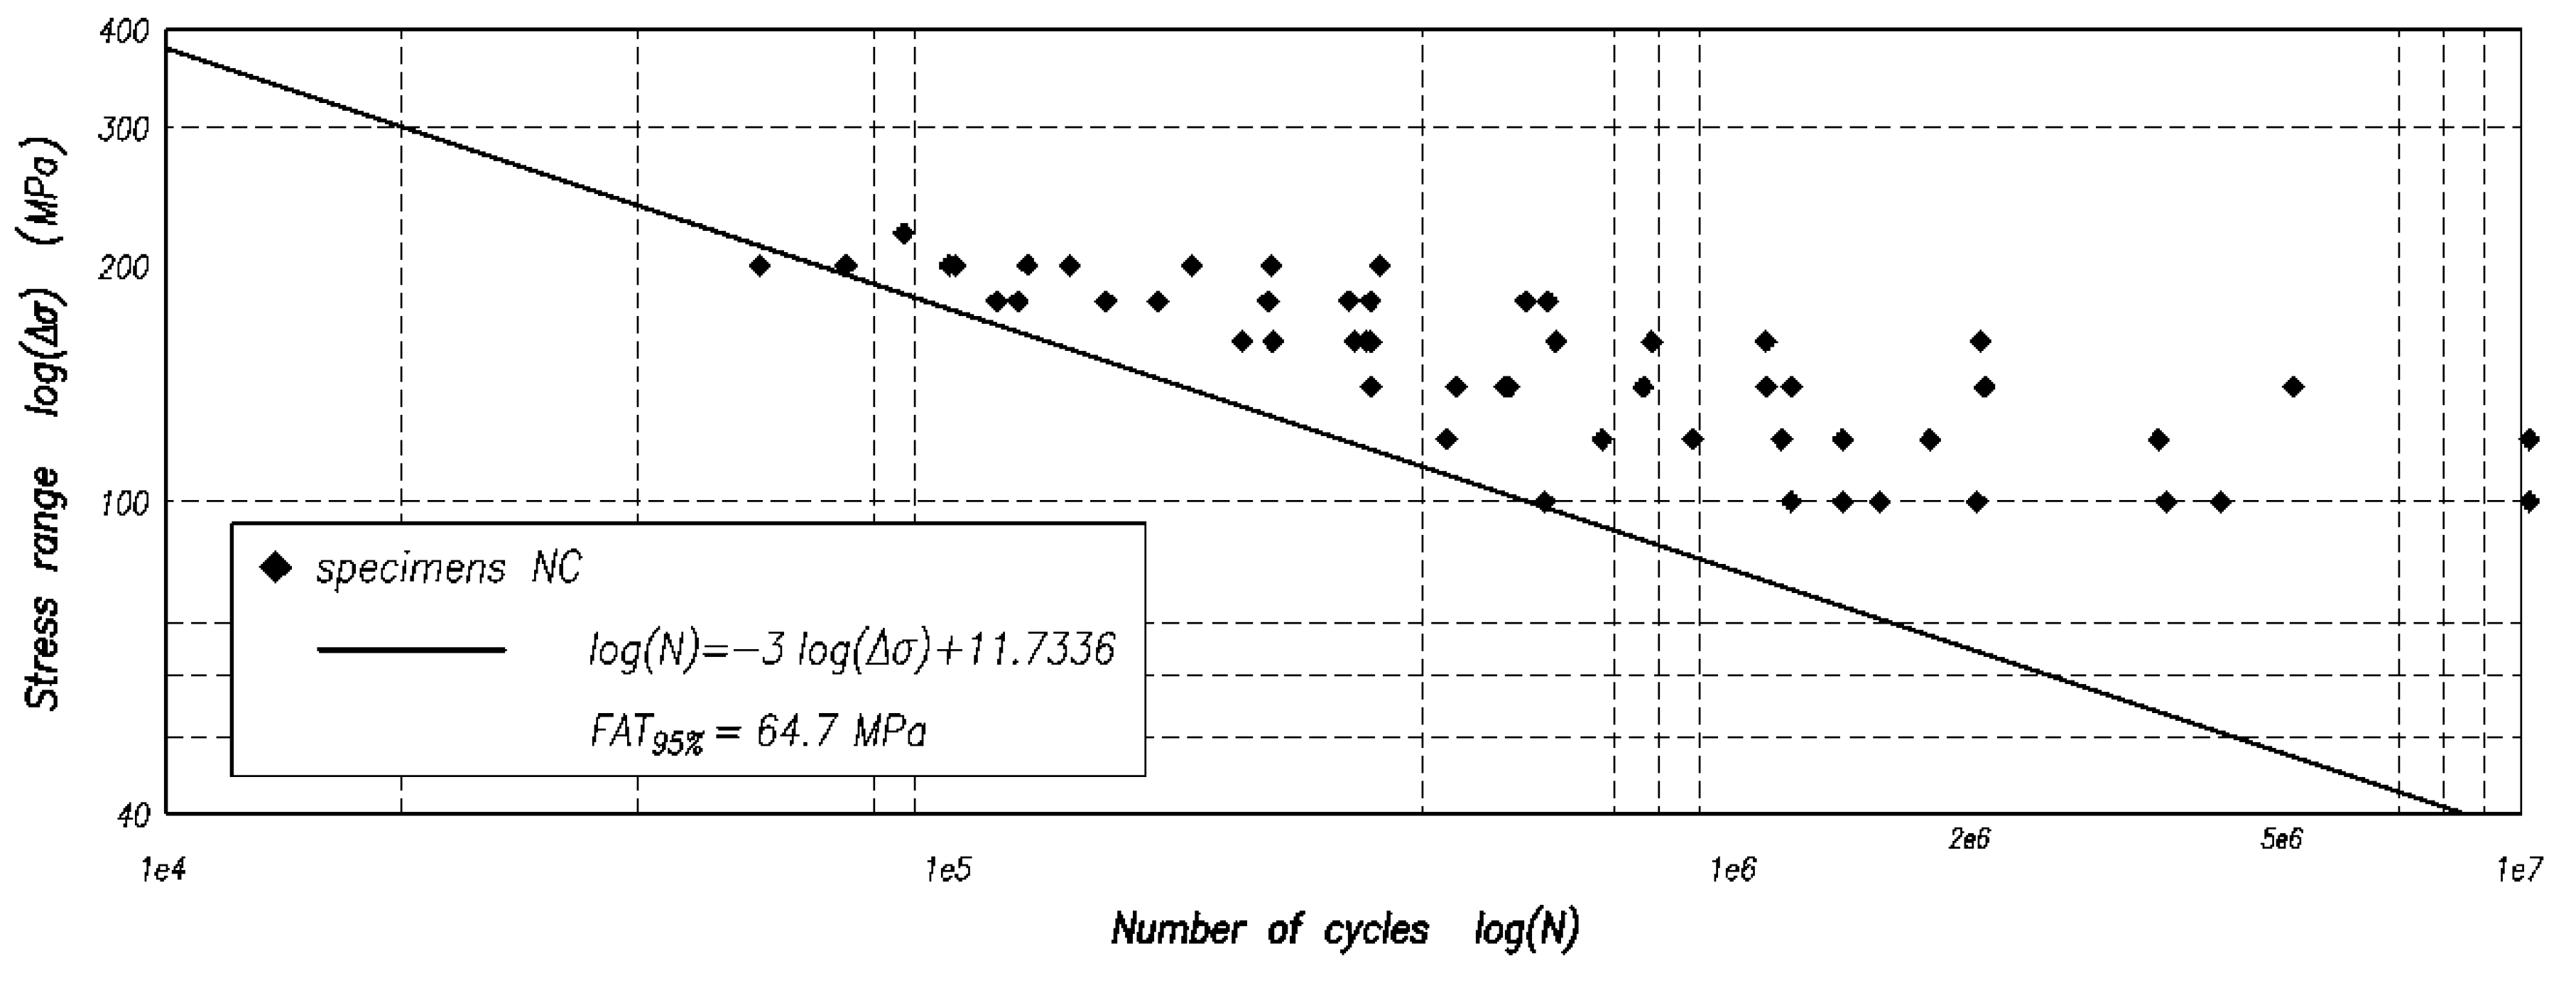
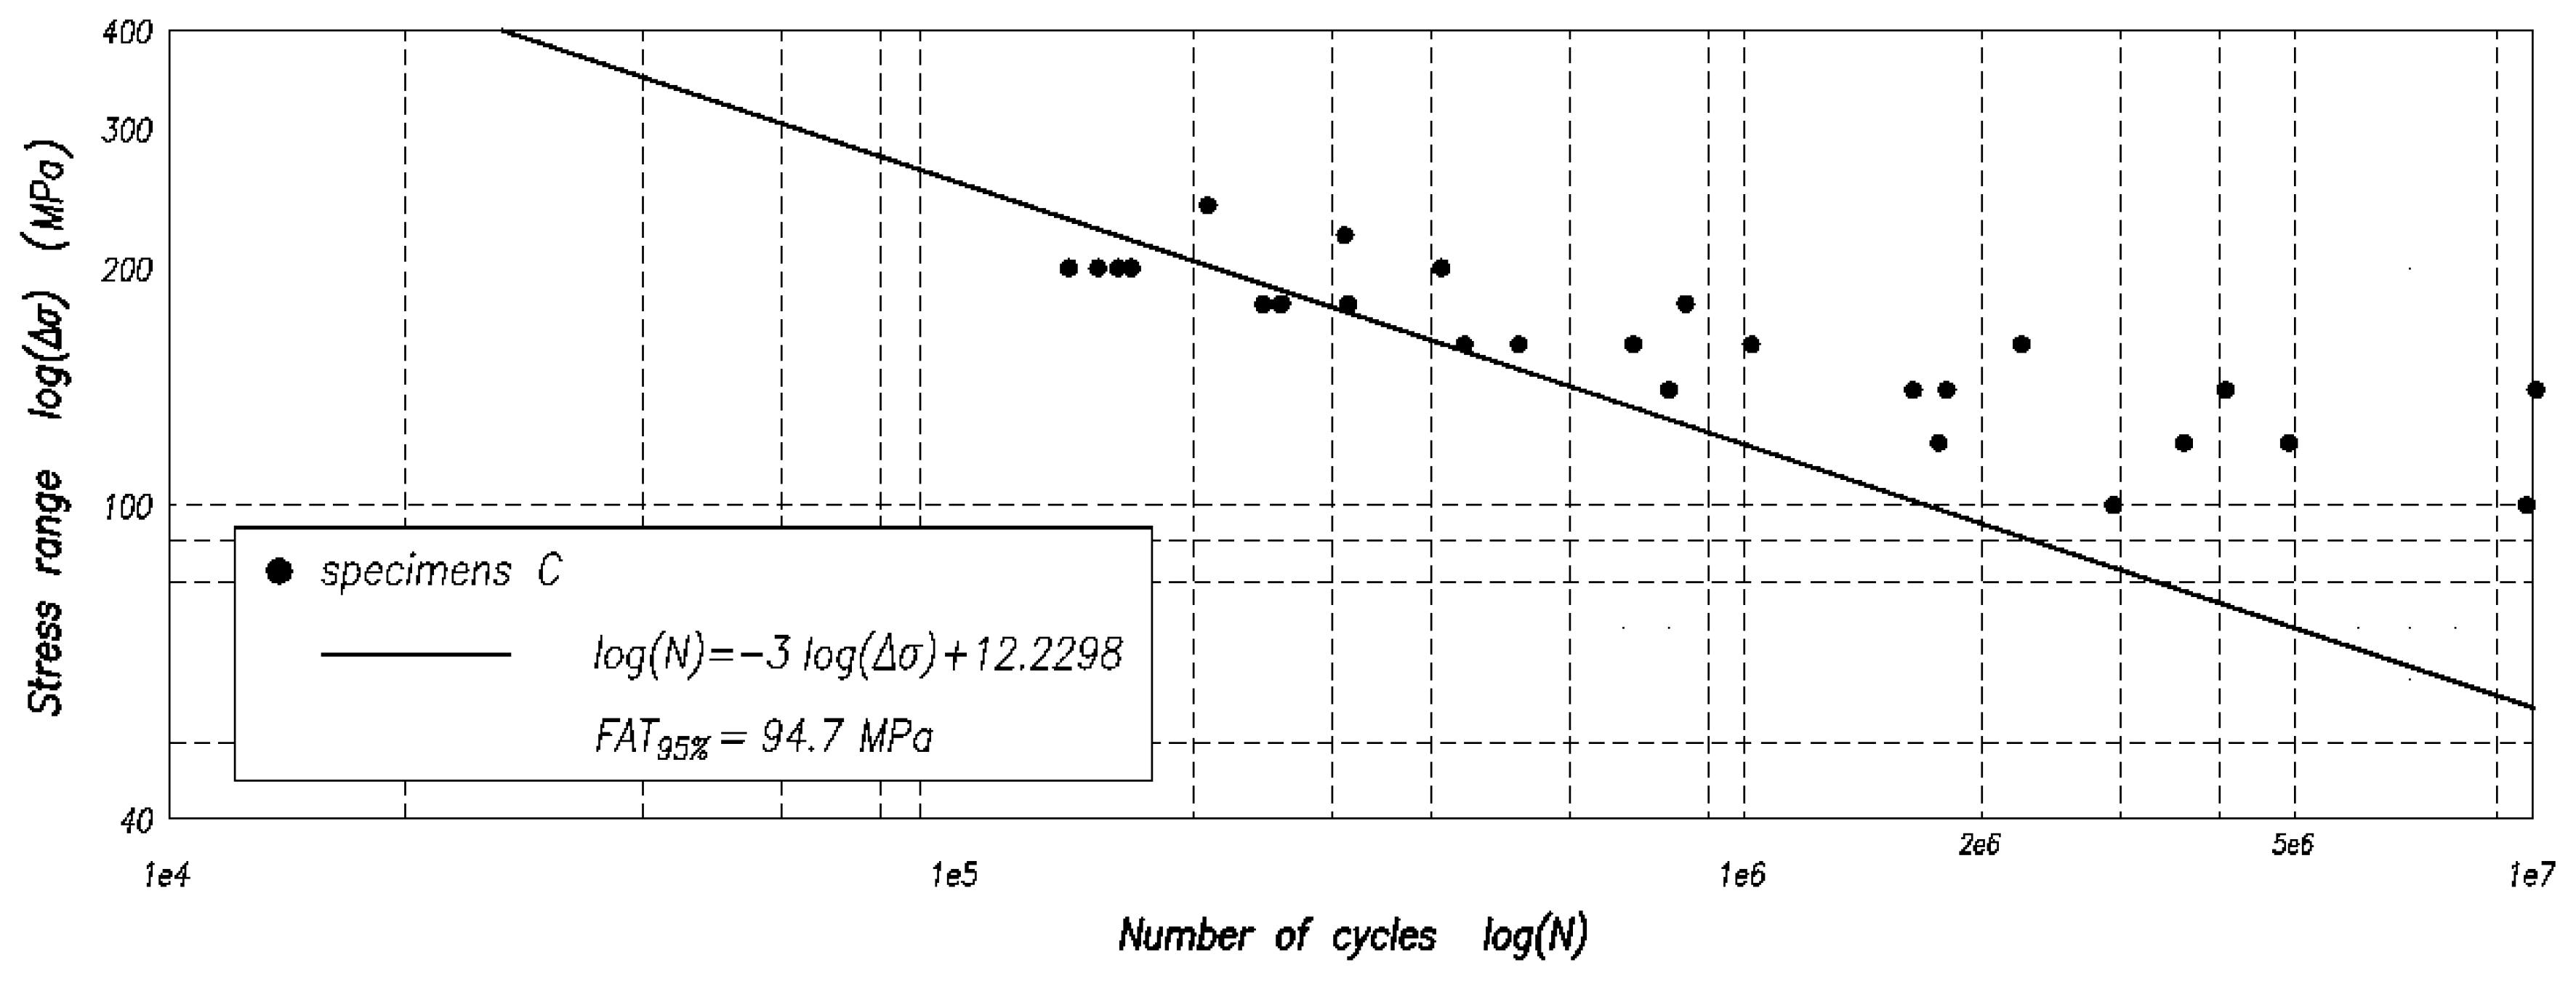
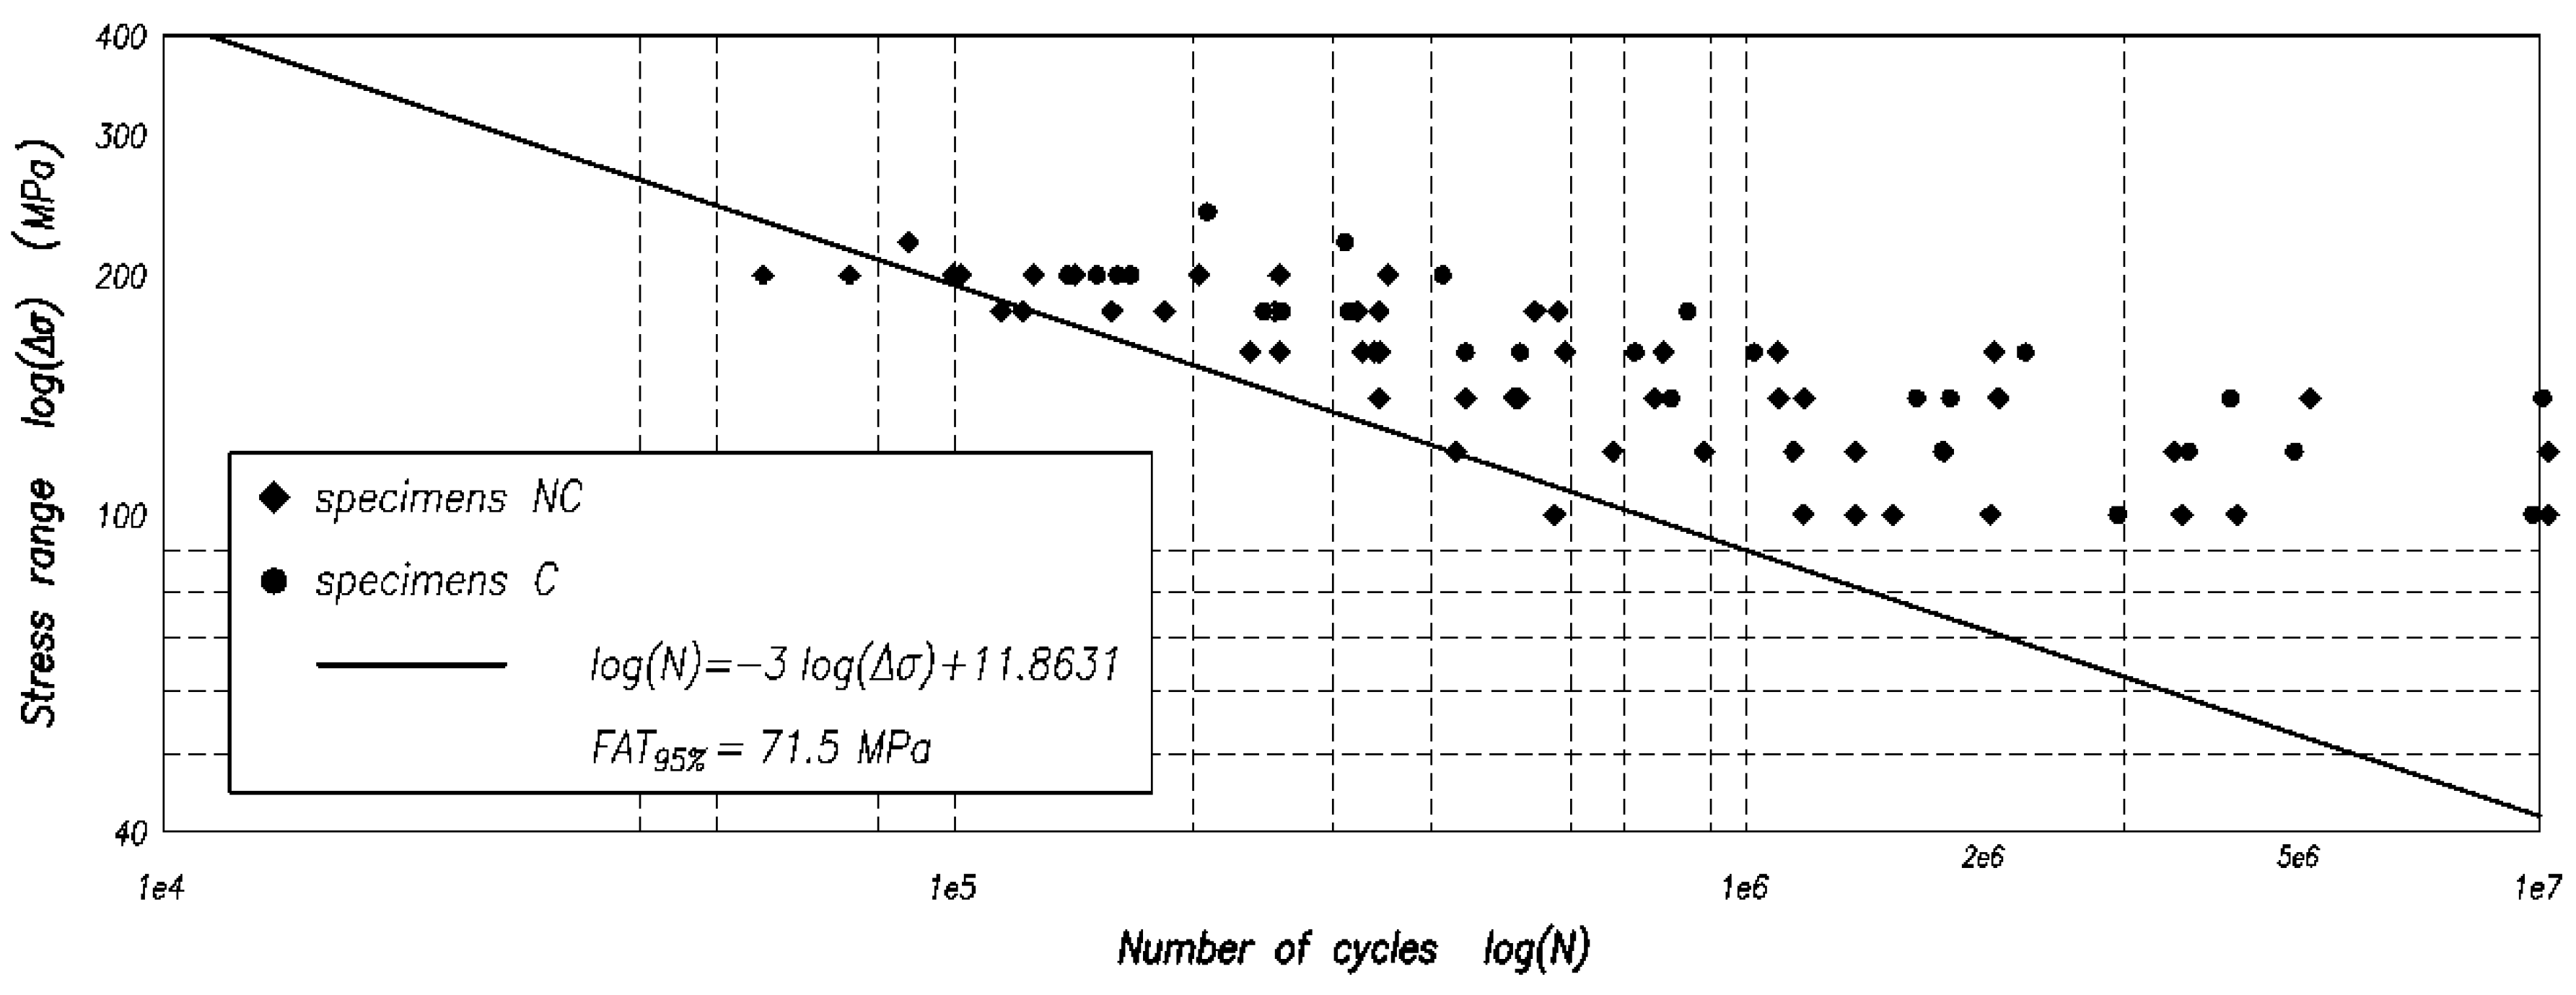
Energy approach was applied to the data relative to type-NC and -C joints and the data of both the types in order to predict the S-N curves considering a constant value of slope m = 3 and Ps = 95% according to the IIW recommendations [36]. Figure 14, Figure 15 and Figure 16 show the predicted S-N curves. The analyses of the S-N curves have given the following results:
- the type-NC joints have lower value of FAT, equal to 64.7 MPa, and, as expected, higher scatter of experimental data (standard deviation = 0.3196 MPa);
- the type-C joints have higher value of FAT, equal to 94.7 MPa, and lower scatter of experimental data (standard deviation = 0.1692 MPa);
- considering the data for both the type-NC and -C joints, the following values are obtained, FAT = 71.5 MPa and standard deviation = 0.2950 MPa.
4.4. Defects Influence on Fatigue Strength
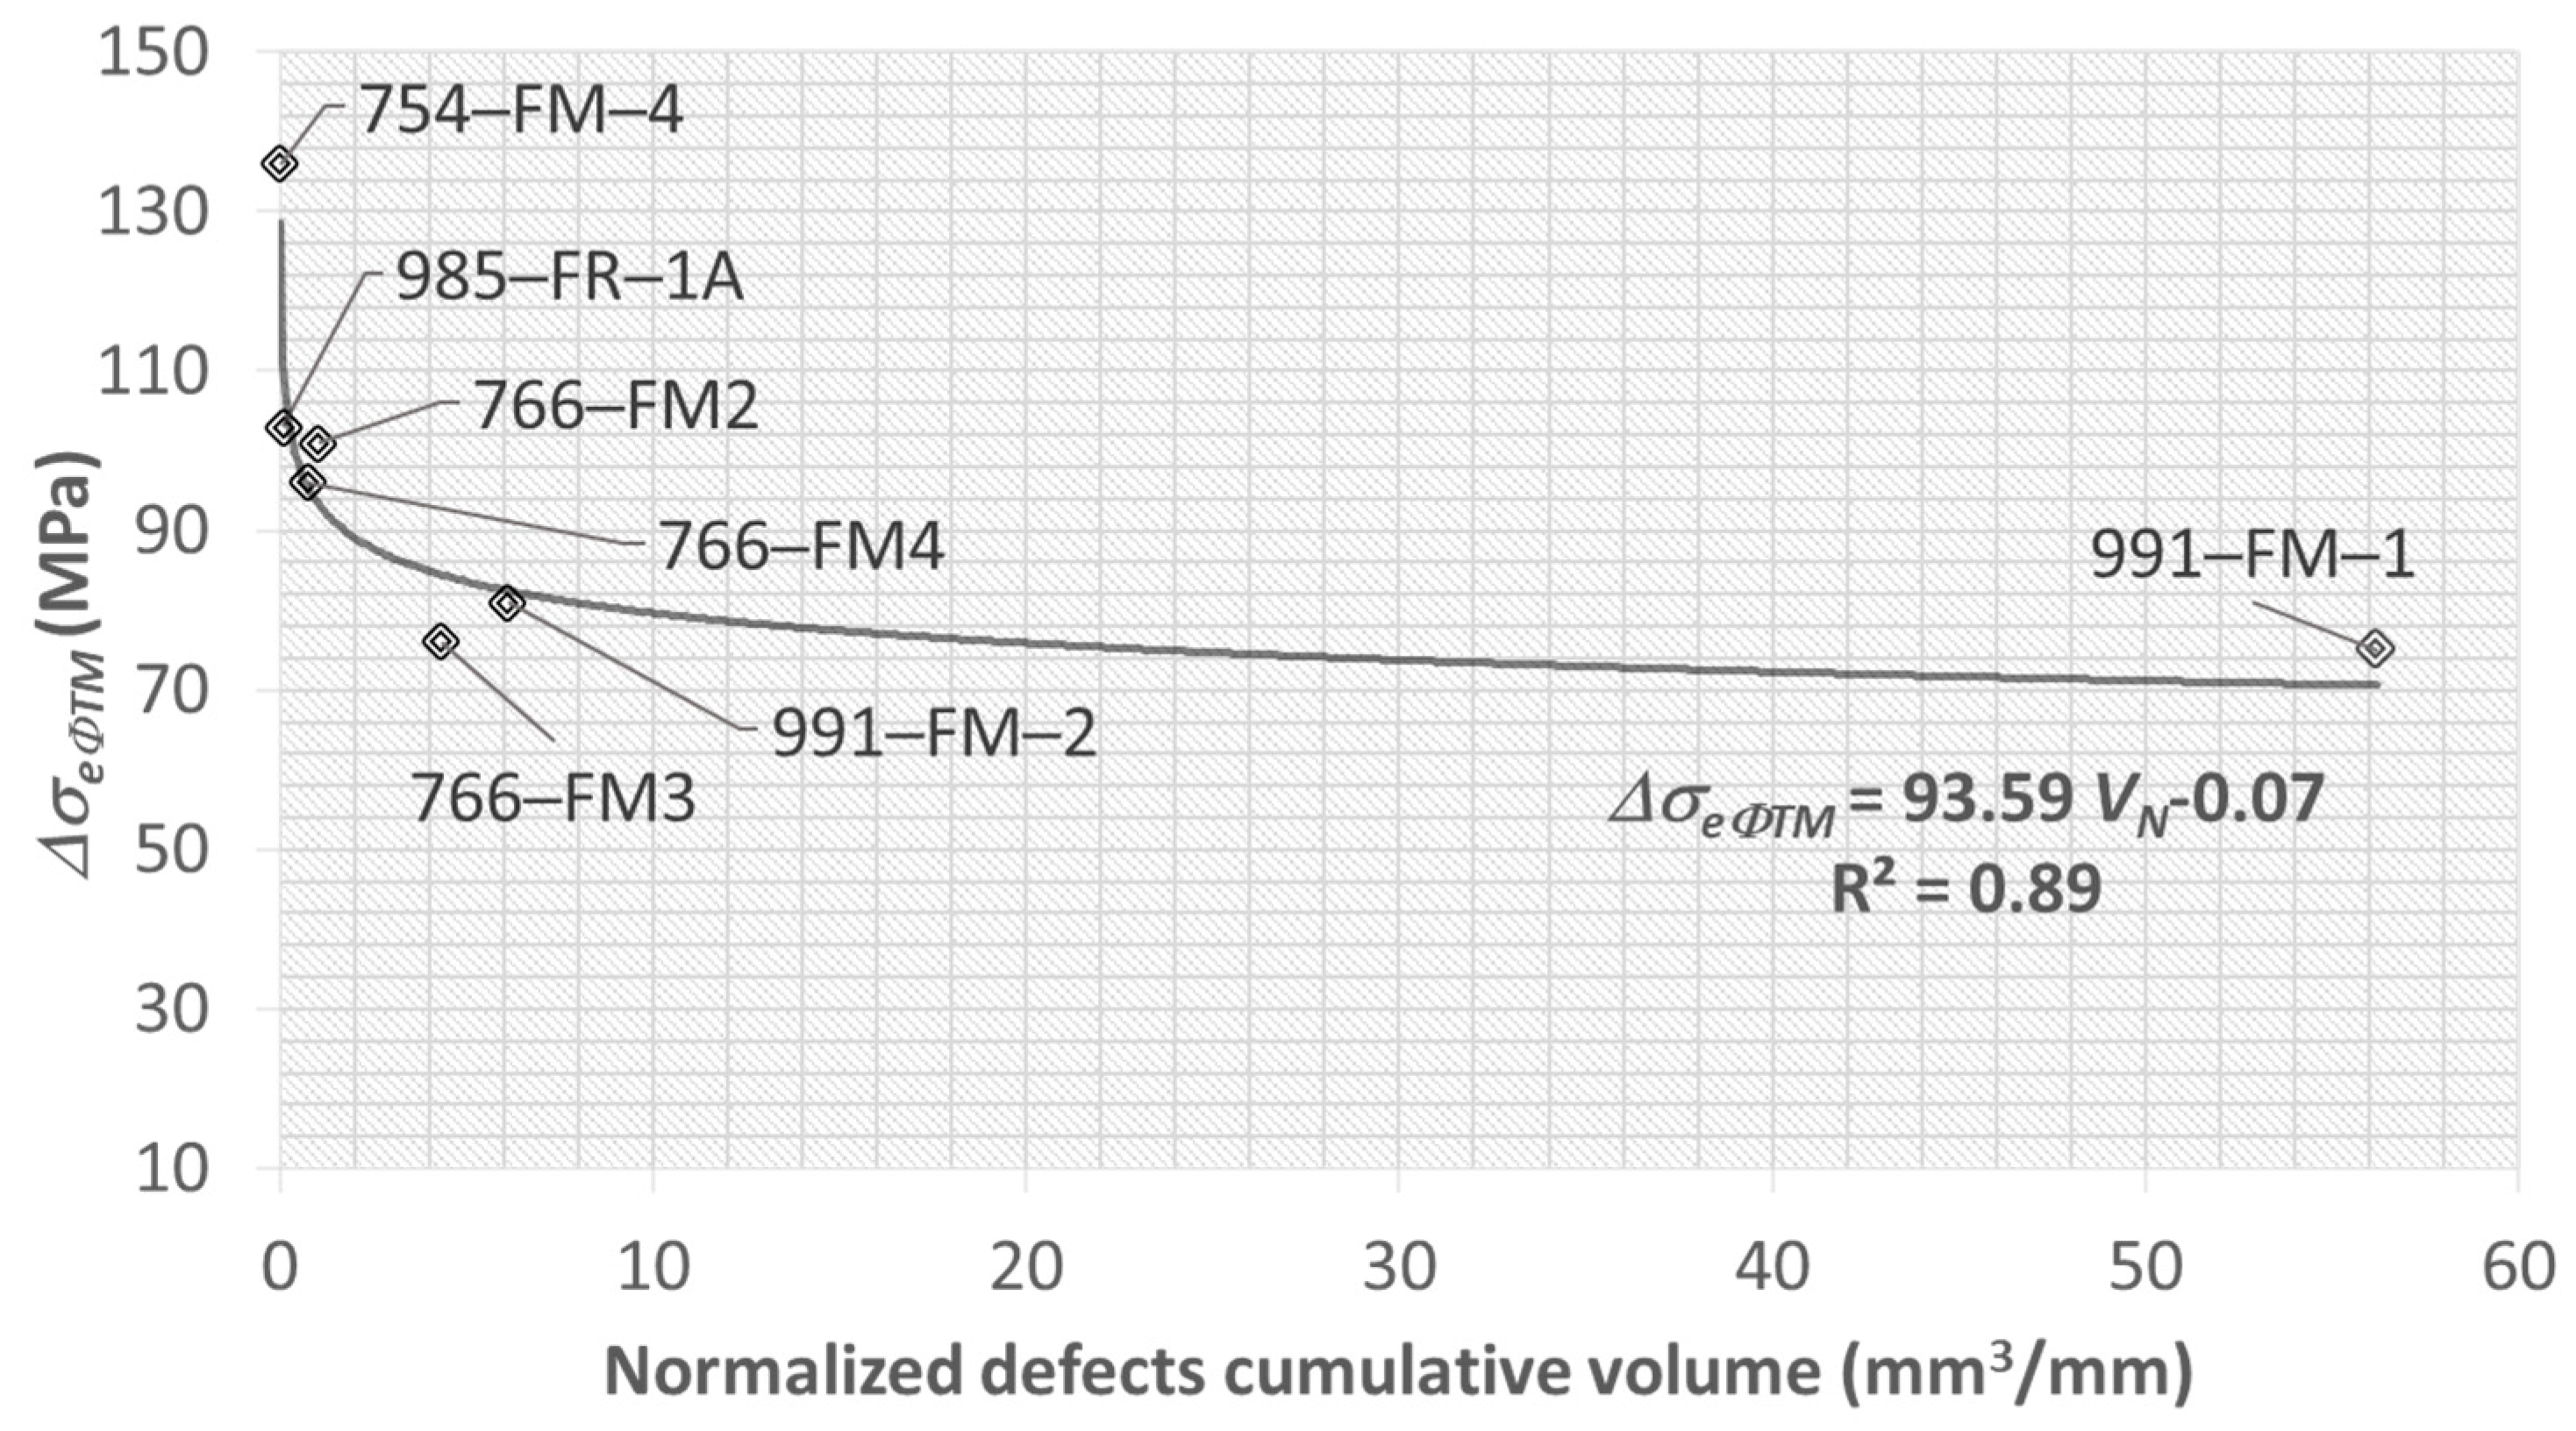
The cumulative defects volume and the maximum defect size, evaluated by CT analyses for some specimens (Table 4), were normalized with respect to the thickness of the welded joints. The worsening effect of defect volume on the fatigue strength of the investigated welded joints was evaluated correlating the defect parameters (normalized defects cumulative volume (VN) and normalized maximum defect size (DMAX,N)) with the values of the fatigue limit predicted using energy approach (ΔσeΦTM).
Figure 17 shows the values of ΔσeΦTM versus their VN. The experimental data were interpolated (R2 = 0.89) by a power relationship, which highlights the sharp decline in ΔσeΦTM value from 136 to 81 MPa for a VN increments from 0.01 to 6.1 mm3/mm. A fatigue strength decrement equal to about –55% is reached for VN increment equal to 56.18 mm3/mm.
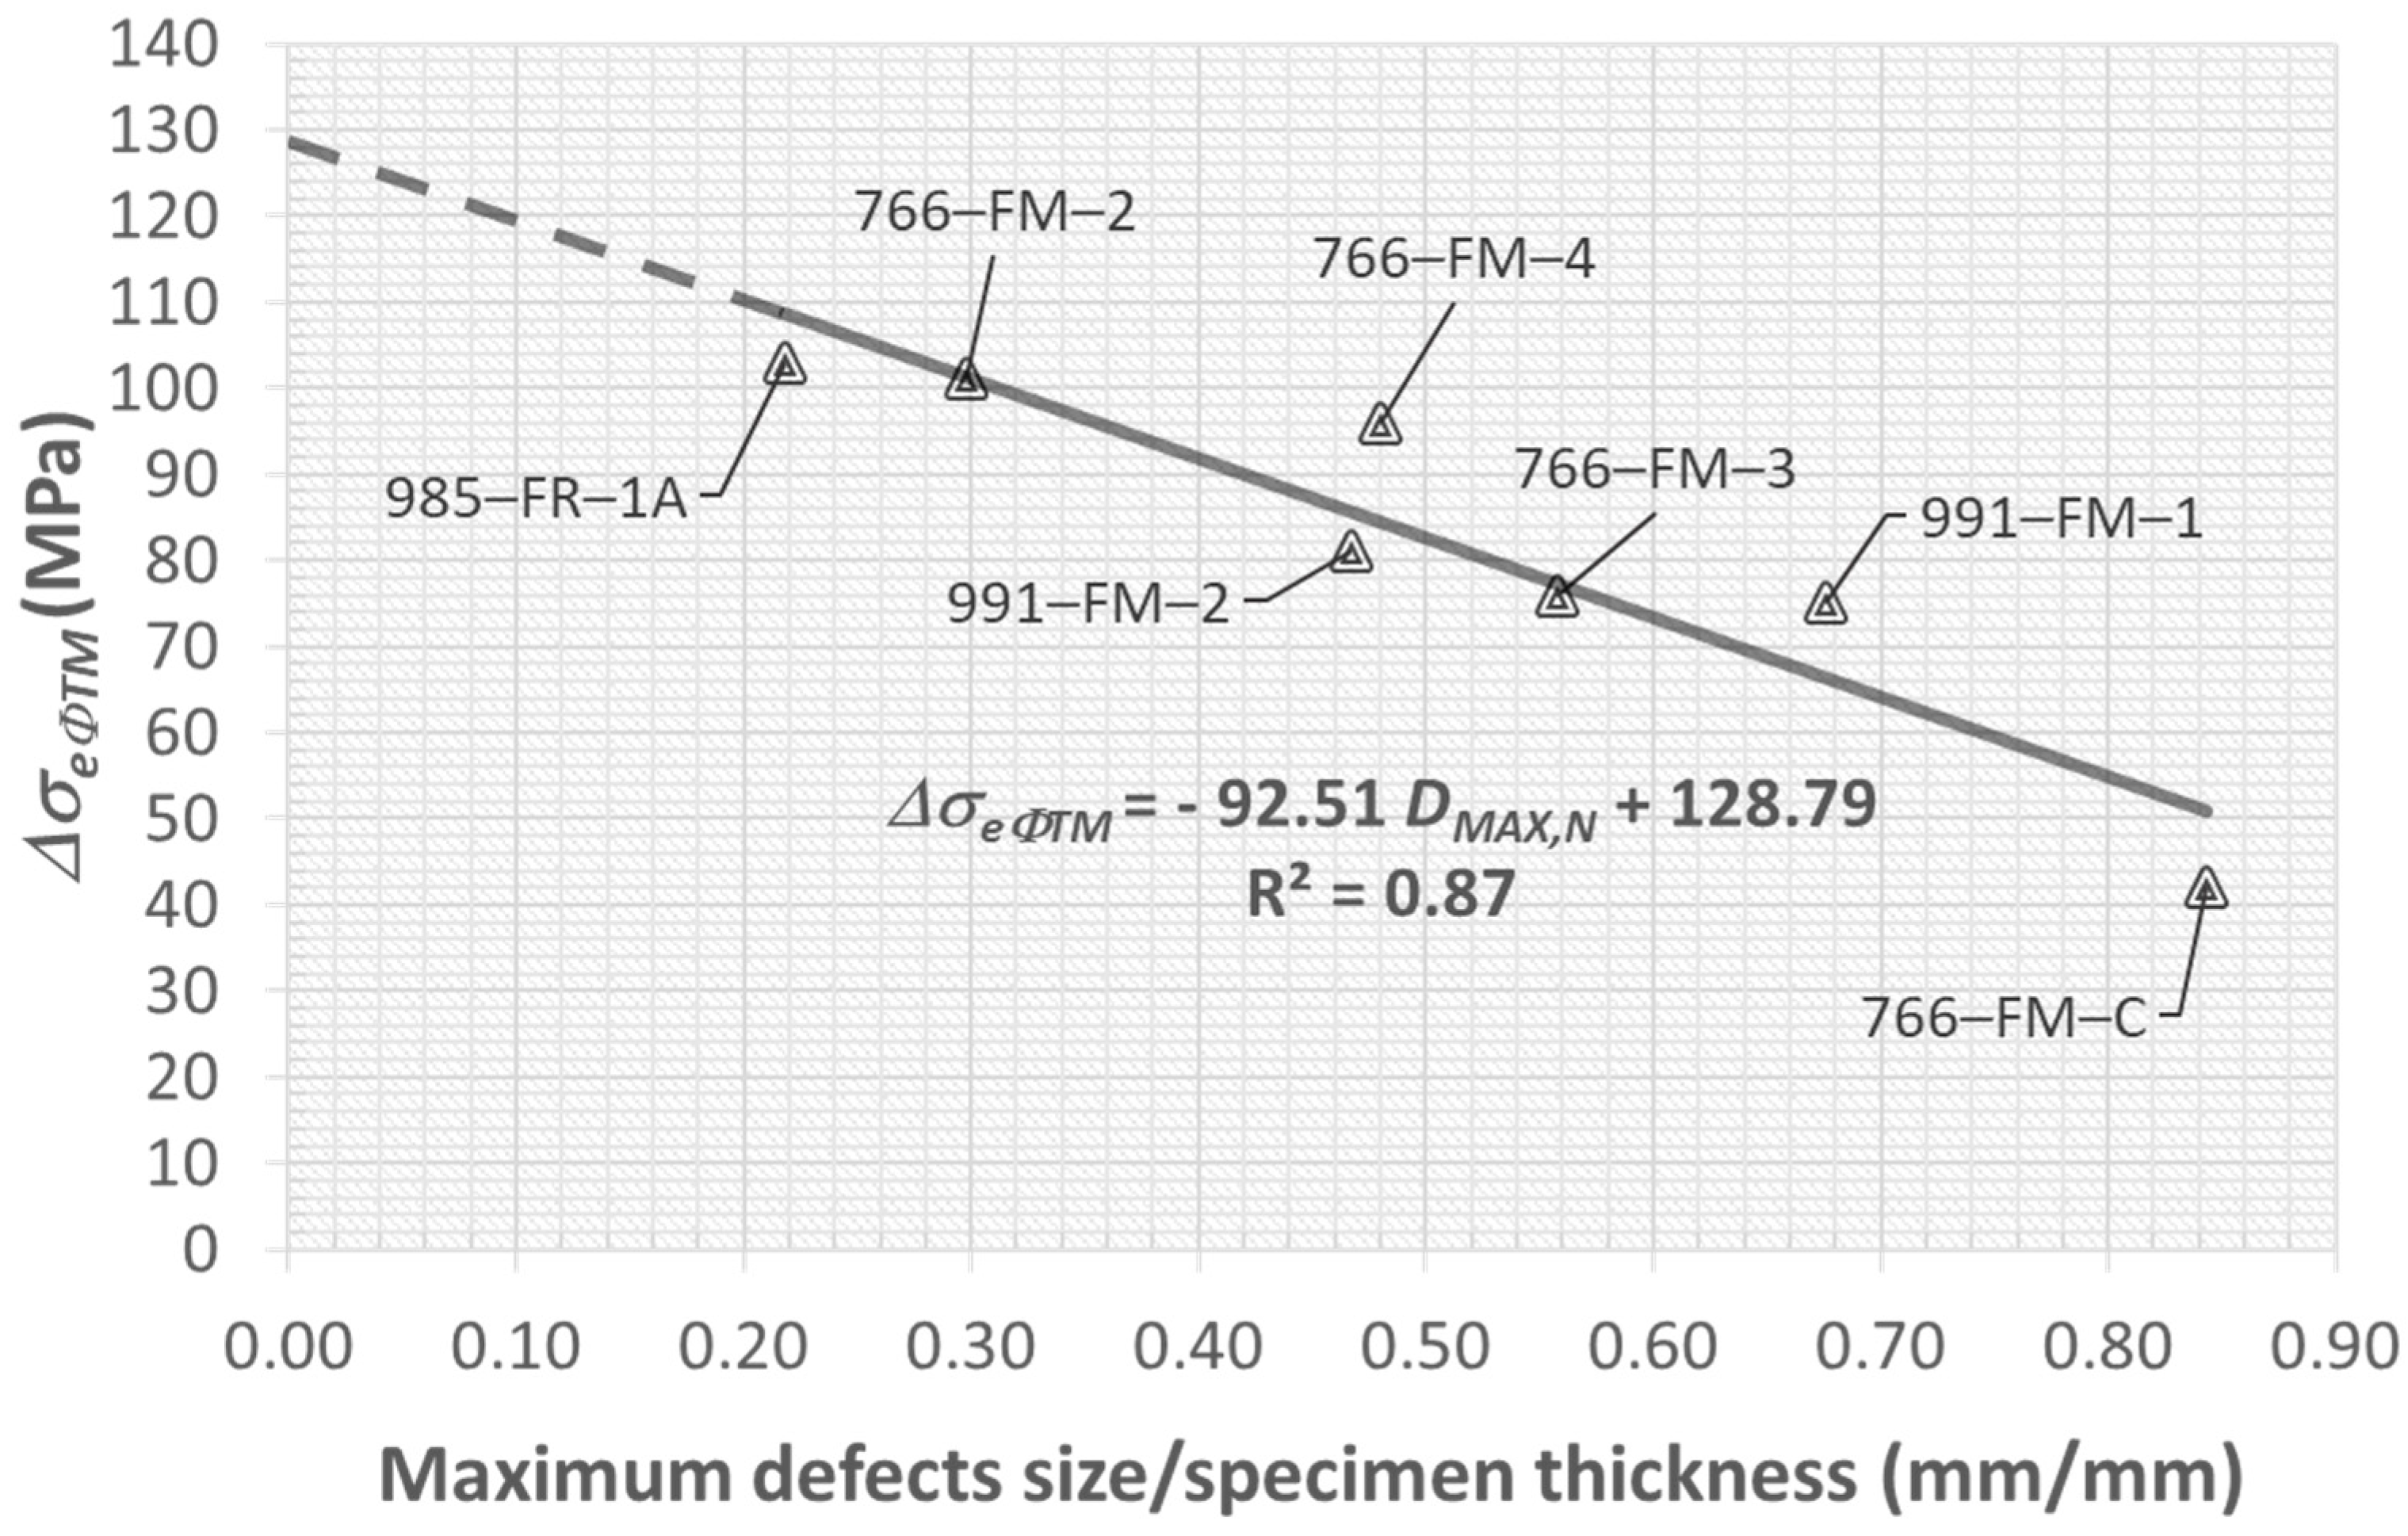
Figure 18 shows the values of ΔσeΦTM vs. DMAX,N. The experimental data were interpolated (R2 = 0.87) by a linear relationship which highlights the reduction of ΔσeΦTM from 103 to 42 MPa for a DMAX increment from 0.22 to 0.86 mm. The value of ΔσeΦTM, obtained by the intersection of this straight line with the ordinate axis, is equal to about 129 MPa and corresponds to a specimen without defect. The predicted value is close to the values of ΔσeΦTM for type-C welded joints (Table 6). A fatigue strength decrement equal to about –55% is reached for the DMAX,N increment equal to 0.86 mm.
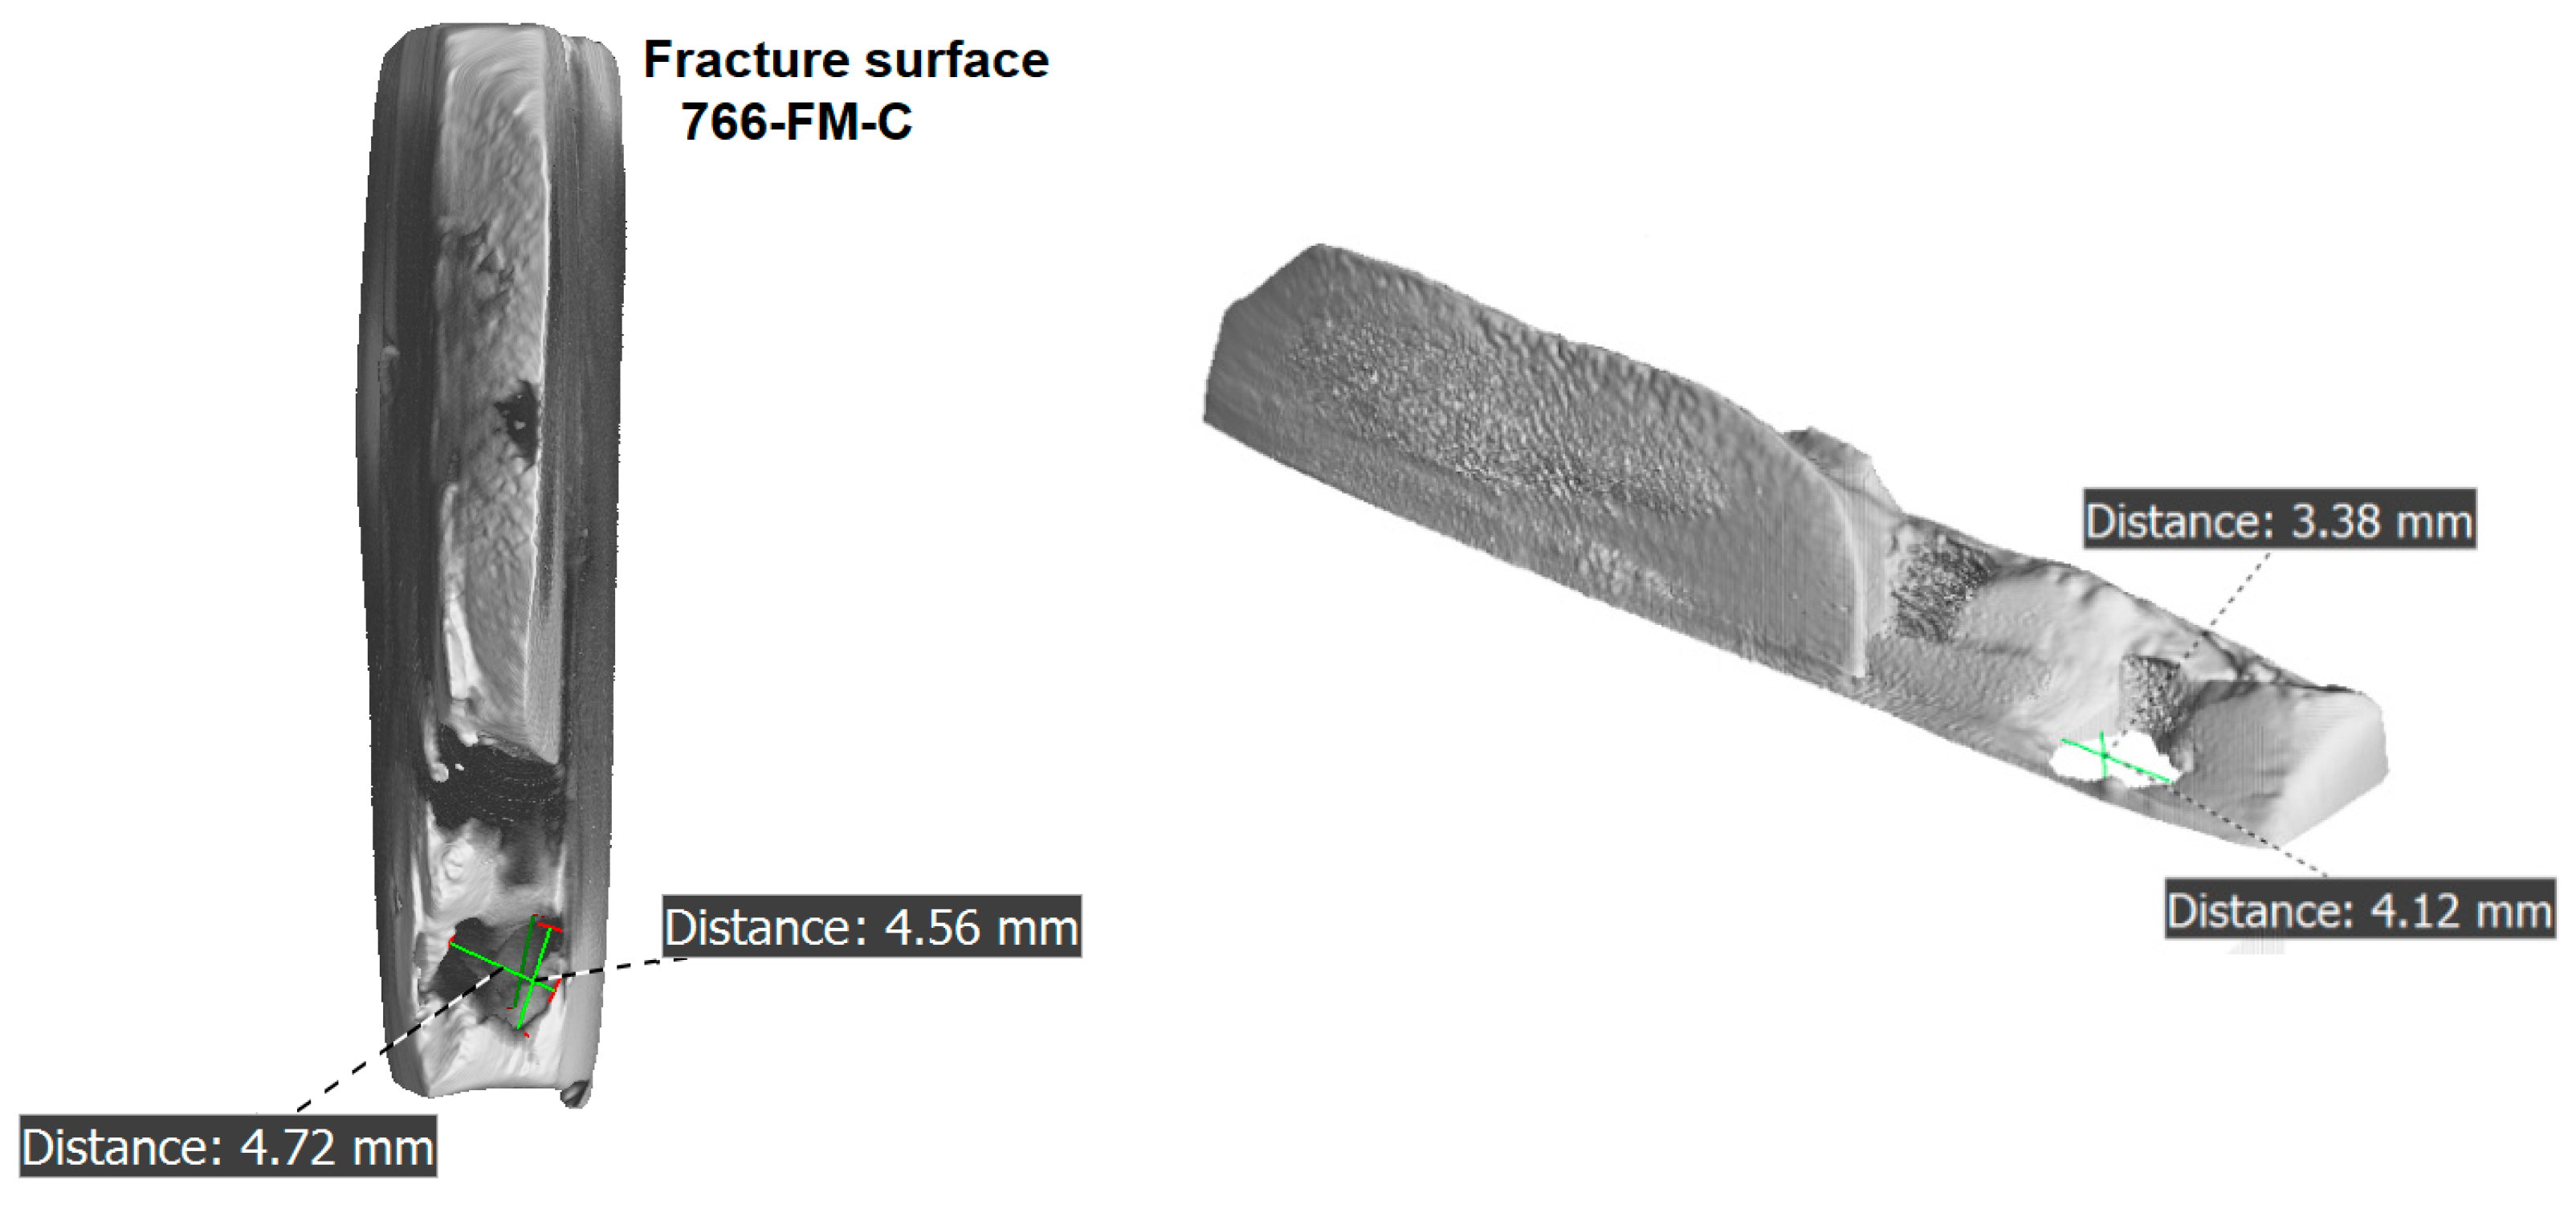
The specimen that exhibited the lowest fatigue strength (42 MPa) was 766-FM-C. The fracture surface was also analyzed by CT (Figure 19), which allowed the measurement of the defect causing crack initiation (see also Figure 11). The geometry of the defect, as shown in four different measurements, was correctly estimated by in situ X-ray radiography and can be classified as slag inclusion, having a different density from the steel constituting the specimen.
5. Conclusions
The experimental tests have allowed the assessment of the fatigue strength for the four types of investigated AH36 welded joints, which differ for the presence of weld defects and thickness value. In particular, the rapid thermographic method was applied for fatigue strength assessment and the energy approach for the S-N curve assessment, using the experimental data obtained for each specimen.
The results of the tests show that the investigated joints are not appreciably affected by the influence of thickness, which varies by only 5.5 to 6.5 mm.
The energy approach confirms the fatigue strength predictions of the rapid thermographic method for the “perfect” welds without significant and evident defects (type-C-1 and -C-3 joints), whereas it gives lower values of the fatigue strength predictions with respect to the predictions of the rapid thermographic method for the “imperfect” welds with defects (type-NC-2 and -NC-4 joints). This difference can be explained by the different definition of the fatigue limit in the two methods:
- according to the rapid thermographic method, the fatigue limit corresponds to the highest stress range (Δσ) for which there is no temperature increase at any point of a cyclically loaded specimen; this definition is correlated to the physical phenomenon;
- according to the energy approach, the fatigue limit is obtained by the S-N curve as the stress range at 5 × 10⁶ cycles; this definition leads to an “agreement” which refers implicitly to pieces that somehow can be considered homogeneous (base material, welds without defects).
The values of fatigue strength predicted by the rapid thermographic method for the “perfect” joints (C-1 and C-3 type joints) vary between 107 and 137 MPa, with an average value of about 122 MPa.
The values of fatigue strength predicted by the rapid thermographic method for the “imperfect” joints (NC-2 and NC-4 type joints) vary between 80 and 131 MPa, with an average value of about 107 MPa.
From the analysis of the investigated “imperfect” welds, the results are that the nature of defects, and consequently their influence, is not homogeneous. There are more serious defects, significantly lowering the fatigue strength, and less serious defects that do not produce significant consequences.
The TM, based on the direct detection of the superficial temperature increment of the investigated joint, gives more realistic predictions and ad hoc indications, whereas, in order to obtain the S-N curve, the traditional procedure requires a lot of experimental tests carried out on welds with the same typology of defect (detected preliminarily by a non-destructive test). If welds with different types of defects are used in the fatigue tests, the obtained results are rather scattered; consequently, the S-N curve could somehow be too generic.
3D CT was used for the analysis of the defects inside the investigated welded joints. The fatigue limit values predicted using energy approach were related to the cumulative defects volume normalized with respect to the thickness of the joint, which was evaluated by CT analyses.
Author Contributions
Conceptualization, V.C. and A.M.; methodology, V.C. and G.E.; investigation, V.C. and G.E.; resources, E.G. and A.M.; data curation, V.C., G.E. and A.M.; writing—original draft preparation, V.C., G.E. and A.M.; writing—review and editing, V.C., G.E. and A.M.; visualization, V.C., G.E. and A.M.; supervision, E.G. All authors have read and agreed to the published version of the manuscript.
Funding
This research received no external funding.
Institutional Review Board Statement
Not applicable.
Informed Consent Statement
Not applicable.
Data Availability Statement
Data sharing is not applicable to this article.
Conflicts of Interest
The authors declare no conflict of interest.
Nomenclature
| f | frequency (s−1) |
| m | inverse slope of the S-N curve in bi-logarithmic scale |
| t | thickness (mm) |
| C | constant term of the S-N curve in bi-logarithmic scale |
| DMAX | maximum defect size (mm) |
| DMAX,N | ratio between maximum defect size and specimen thickness |
| Ec | energy to failure per unit volume (J m−3) |
| FAT | fatigue class as expected with the S-N curve at 2 × 10⁶ cycles (N mm−2) |
| IIW | International Institute of Welding |
| N | number of cycles |
| Nf | number of cycles to failure |
| Ps | survival probability |
| R | stress ratio |
| RTM | rapid thermographic method |
| TM | thermographic method |
| V | defects cumulative volume (mm3) |
| VN | ratio between defects cumulative volume and specimen thickness (mm3/mm) |
| ΔT | temperature increment (°C) |
| ΔTAS | asymptotic temperature increment (°C) |
| Δσ | stress range (N mm−2) |
| ΔσeTM | fatigue limit predicted by TM (N mm−2) |
| ΔσeSN | fatigue limit as expected with the S-N curve at 5 × 10⁶ cycles (N mm−2) |
| ΔσeΦTM | fatigue limit predicted using energy approach (N mm−2) |
| Φ | thermal increment to failure (°C) |
References
- Dengel, D.; Harig, H. Estimation of the fatigue limit by progressively-increasing load tests. Fatigue Fract. Eng. Mater. Struct. 1980, 3, 113–128. [Google Scholar] [CrossRef]
- Curti, G.; La Rosa, G.; Orlando, M.; Risitano, A. Analisi Tramite Infrarosso Termico della “Temperatura Limite” in Prove di Fatica. In Proceedings of the XIV AIAS National Congress, Catania, Italy, 23–27 September 1986; pp. 211–220. [Google Scholar]
- Wang, X.G.; Crupi, V.; Jiang, C.; Feng, E.S.; Guglielmino, E.; Wang, C.S. Energy-based approach for fatigue life prediction of pure copper. Int. J. Fatigue 2017, 104, 243–250. [Google Scholar] [CrossRef]
- Guo, Q.; Guo, X.; Fan, J.; Syed, R.; Wu, C. An energy method for rapid evaluation of high-cycle fatigue parameters based on intrinsic dissipation. Int. J. Fatigue 2015, 80, 136–144. [Google Scholar] [CrossRef]
- De Finis, R.; Palumbo, D.; Ancona, F.; Galietti, U. Fatigue limit evaluation of various martensitic stainless steels with new robust thermographic data analysis. Int. J. Fatigue 2015, 74, 88–96. [Google Scholar] [CrossRef]
- Lipski, A. Rapid Determination of the S-N Curve for Steel by means of the Thermographic Method. Adv. Mater. Sci. Eng. 2016, 2016, 4134021. [Google Scholar] [CrossRef] [Green Version]
- Teng, Z.; Wu, H.; Boller, C.; Starke, P. A unified fatigue life calculation based on intrinsic thermal dissipation and microplasticity evolution. Int. J. Fatigue 2020, 131. [Google Scholar] [CrossRef]
- Acosta, R.; Wu, H.; Venkat, R.S.; Weber, F.; Tenkamp, J.; Walther, F.; Starke, P. SteBLife, a New Approach for the Accelerated Generation of Metallic Materials’ Fatigue Data. Metals 2020, 10, 798. [Google Scholar] [CrossRef]
- Guo, S.; Liu, X.; Zhang, H.; Yan, Z.; Fang, H. Fatigue Limit Evaluation of AZ31B Magnesium Alloy Based on Temperature Distribution Analysis. Metals 2020, 10, 1331. [Google Scholar] [CrossRef]
- Jirandehi, A.P.; Khonsari, M.M. Microstructure-sensitive estimation of fatigue life using cyclic thermodynamic entropy as an index for metals. Theor. Appl. Fract. Mech. 2021, 112, 102854. [Google Scholar] [CrossRef]
- Luong, M.P. Infrared thermographic scanning of fatigue in metals. Nucl. Eng. Des. 1995, 158, 363–376. [Google Scholar] [CrossRef] [Green Version]
- Luong, M.P. Fatigue limit evaluation of metals using an infrared thermographic technique. Mech. Mater. 1998, 28, 155–163. [Google Scholar] [CrossRef]
- La Rosa, G.; Risitano, A. Thermographic methodology for rapid determination of the fatigue limit of materials and mechanical components. Int. J. Fatigue 2000, 22, 65–73. [Google Scholar] [CrossRef]
- Fargione, G.; Geraci, A.; La Rosa, G.; Risitano, A. Rapid determination of the fatigue curve by the thermographic method. Int. J. Fatigue 2002, 24, 11–19. [Google Scholar] [CrossRef]
- Curà, F.; Curti, G.; Sesana, R. A new iteration method for the thermographic determination of fatigue limit in steels. Int. J. Fatigue 2005, 27, 453–459. [Google Scholar] [CrossRef]
- Meneghetti, G. Analysis of the fatigue strength of a stainless steel based on the energy dissipation. Int. J. Fatigue 2007, 29, 81–94. [Google Scholar] [CrossRef]
- Plekhov, O.A.; Saintier, N.; Palin-Luc, T.; Uvarov, S.V.; Naimark, O.B. Theoretical analysis, infrared and structural investigations of energy dissipation in metals under cyclic loading. Mater. Sci. Eng. A 2007, 462, 367–369. [Google Scholar] [CrossRef] [Green Version]
- Amiri, M.; Khonsari, M.M. Rapid determination of fatigue failure based on temperature evolution: Fully reversed bending load. Int. J. Fatigue 2010, 32, 382–389. [Google Scholar] [CrossRef]
- Wei, W.; Li, C.; Sun, Y.; Xu, H.; Yang, X. Investigation of the Self-Heating of Q460 Butt Joints and an S-N Curve Modeling Method based on Infrared Thermographic Data for High-Cycle Fatigue. Metals 2021, 11, 232. [Google Scholar] [CrossRef]
- Williams, P.; Liakat, M.; Khonsari, M.M.; Kabir, O.M. A thermographic method for remaining fatigue life prediction of welded joints. Mater. Des. 2013, 51, 916–923. [Google Scholar] [CrossRef] [Green Version]
- Fan, J.L.; Guo, X.L.; Wu, C.W.; Zhao, Y.G. Research on fatigue behavior evaluation and fatigue fracture mechanisms of cruciform welded joints. Mater. Sci. Eng. A 2011, 528, 8417–8427. [Google Scholar] [CrossRef]
- Crupi, V.; Guglielmino, E.; Risitano, A.; Taylor, D. Different Methods for Fatigue Assessment of T Welded Joints Used in Ship Structures. J. Ship Res. 2007, 51, 150–159. [Google Scholar] [CrossRef]
- Crupi, V.; Guglielmino, E.; Maestro, M.; Marinò, A. Fatigue analysis of butt welded AH36 steel joints: Thermographic Method and design S-N curve. Mar. Struct. 2009, 22, 373–386. [Google Scholar] [CrossRef]
- Nourian-Avval, A.; Fatemi, A. Fatigue life prediction of cast aluminum alloy based on porosity characteristics. Theor. Appl. Fract. Mech. 2020, 109, 102774. [Google Scholar] [CrossRef]
- Bonneric, M.; Brugger, C.; Saintier, N. Investigation of the sensitivity of the fatigue resistance to defect position in aluminium alloys obtained by Selective laser melting using artificial defects. Int. J. Fatigue 2020, 134, 105505. [Google Scholar] [CrossRef]
- Chen, Y.; He, C.; Yang, K.; Zhang, H.; Wang, C.; Wang, Q.; Liu, Y. Effects of microstructural inhomogeneities and micro-defects on tensile and very high cycle fatigue behaviors of the friction stir welded ZK60 magnesium alloy joint. Int. J. Fatigue 2019, 122, 218–227. [Google Scholar] [CrossRef]
- Amirafshari, P.; Barltrop, N.; Wright, M.; Kolios, A. Weld defect frequency, size statistics and probabilistic models for ship structures. Int. J. Fatigue 2021, 145, 106069. [Google Scholar] [CrossRef]
- Bucci, V.; Corigliano, P.; Crupi, V.; Epasto, G.; Guglielmino, E.; Marinò, A. Experimental investigation on Iroko wood used in shipbuilding. Proc. Inst. Mech. Eng. Part C J. Mech. Eng. Sci. 2017, 231, 128–139. [Google Scholar] [CrossRef]
- Corigliano, P.; Crupi, V.; Epasto, G.; Guglielmino, E.; Maugeri, N.; Marinò, A. Experimental and theoretical analyses of Iroko wood laminates. Compos. Part B Eng. 2017, 112, 251–264. [Google Scholar] [CrossRef]
- Astarita, A.; Campatelli, G.; Corigliano, P.; Epasto, G.; Montevecchi, F.; Scherillo, F.; Venturini, G. Microstructure and mechanical properties of specimens produced using the wire-arc additive manufacturing process. Proc. Inst. Mech. Eng. Part C J. Mech. Eng. Sci. 2019. [Google Scholar] [CrossRef]
- Epasto, G.; Palomba, G.; D’Andrea, D.; Guglielmino, E.; Di Bella, S.; Traina, F. Ti-6Al-4V ELI microlattice structures manufactured by electron beam melting: Effect of unit cell dimensions and morphology on mechanical behaviour. Mater. Sci. Eng. A 2019, 753, 31–41. [Google Scholar] [CrossRef]
- Han, X.; Yang, Z.; Ma, Y.; Shi, C.; Xin, Z. Porosity distribution and mechanical response of laser-MIG hybrid butt welded 6082-T6 aluminum alloy joint. Opt. Laser Technol. 2020, 132, 106511. [Google Scholar] [CrossRef]
- Wu, S.C.; Song, Z.; Kang, G.Z.; Hu, Y.N.; Fu, Y.N. The Kitagawa-Takahashi fatigue diagram to hybrid welded AA7050 joints via synchrotron X-ray tomography. Int. J. Fatigue 2019, 125, 210–221. [Google Scholar] [CrossRef]
- Hartl, R.; Vieltorf, F.; Zaeh, M.F. Correlations between the Surface Topography and Mechanical Properties of Friction Stir Welds. Metals 2020, 10, 890. [Google Scholar] [CrossRef]
- Akbulut, M. Parametric investigation into fatigue life behaviour of spot welded tensile shear test samples. Proc. Inst. Mech. Eng. Part C J. Mech. Eng. Sci. 2020. [Google Scholar] [CrossRef]
- Hobbacher, A.F. Recommendations for Fatigue Design of Welded Joints and Components; Springer: Berlin/Heidelberg, Germany, 2016; ISBN 978-3-319-23757-2. [Google Scholar]
- Fan, J.; Guo, X.; Wu, C.; Crupi, V.; Guglielmino, E. Influence of Heat Treatments on Mechanical Behavior of FV520B Steel. Exp. Tech. 2015, 39, 55–64. [Google Scholar] [CrossRef]
Figure 1.
Defect volume distribution for the specimen 754-4 (type-C-1 joint).

Figure 2.
Defects evaluation for specimens of type-NC-2 joints: (a) specimen 766-FM-2; (b) specimen 766-FM-3 and (c) specimen 766-FM-4.
Figure 2.
Defects evaluation for specimens of type-NC-2 joints: (a) specimen 766-FM-2; (b) specimen 766-FM-3 and (c) specimen 766-FM-4.

Figure 3.
Defects evaluation for specimen 991-FM-1 (type-NC-4). Some along X-rays of the joint.

Figure 4.
CT results for specimen 991-FM-2 (type-NC-4): (a) defect evaluation; (b,c) tomograms of the cross-section of the weld bead and (d) some along X-rays of the joint.
Figure 4.
CT results for specimen 991-FM-2 (type-NC-4): (a) defect evaluation; (b,c) tomograms of the cross-section of the weld bead and (d) some along X-rays of the joint.

Figure 5.
ΔT-N curve obtained by stepwise load (991-FM-2 specimen, type-NC-4).

Figure 6.
ΔT-N curve obtained by stepwise load (985-FR-1A specimen, type-NC-4).

Figure 7.
ΔTAS─Δσ2 curves for type-C-1 joints.

Figure 8.
ΔTAS─Δσ2 curves for type-NC-2 joints.

Figure 9.
ΔTAS─Δσ2 curves for type-C-3 joints.

Figure 10.
ΔTAS─Δσ2 curves for type-NC-4 joints.

Figure 11.
Fracture zone of the joint 766-FM-C.

Figure 12.
Scanning electron microscopy (SEM) of defects in the fracture zone of the specimen 766-FM-C: (a) inclusions in the propagation area; (b) large void in the crack initiation site.
Figure 12.
Scanning electron microscopy (SEM) of defects in the fracture zone of the specimen 766-FM-C: (a) inclusions in the propagation area; (b) large void in the crack initiation site.

Figure 13.
SEM of defects in the fracture zone of the specimen 766-FM2: (a) inclusions; (b) worm holes and (c) void in the propagation area.
Figure 13.
SEM of defects in the fracture zone of the specimen 766-FM2: (a) inclusions; (b) worm holes and (c) void in the propagation area.

Figure 14.
S-N curve with m = 3 for welded joints with defects (type-NC specimens).

Figure 15.
S-N curve with m = 3 for welded joints without defects (type-C specimens).

Figure 16.
S-N curve with m = 3 for welded joints with and without defects (type-C and -NC specimens, respectively).
Figure 16.
S-N curve with m = 3 for welded joints with and without defects (type-C and -NC specimens, respectively).

Figure 17.
Fatigue strength (ΔσeΦTM) vs. normalized defects cumulative volume (VN) (type-C-1, type-NC-2, type-NC-4).
Figure 17.
Fatigue strength (ΔσeΦTM) vs. normalized defects cumulative volume (VN) (type-C-1, type-NC-2, type-NC-4).

Figure 18.
Fatigue strength (ΔσeΦTM) vs. normalized maximum defect size (DMAX,N) (type-NC-2, type-NC-4).
Figure 18.
Fatigue strength (ΔσeΦTM) vs. normalized maximum defect size (DMAX,N) (type-NC-2, type-NC-4).

Figure 19.
Fracture surface reconstruction of the specimen 766-FM-C, where a large discontinuity caused a very low fatigue strength.
Figure 19.
Fracture surface reconstruction of the specimen 766-FM-C, where a large discontinuity caused a very low fatigue strength.


Table 1.
Dimensions of the welded joints.
| Joint Type | Specimen ID | Width b (mm) | Thickness t (mm) | Cross-Sectional Area A (mm2) | Defect Type |
|---|---|---|---|---|---|
| C-1 | 754-FM-1 | 46.8 | 5.6 | 262 | - |
| C-1 | 754-FM-2 | 45.8 | 5.5 | 252 | - |
| C-1 | 754-FM-3 | 39.0 | 5.5 | 215 | - |
| C-1 | 754-FM-4 | 40.6 | 5.6 | 227 | - |
| NC-2 | 766-FM-C | 45.2 | 5.6 | 253 | slag inclusions |
| NC-2 | 766-FM-3 | 39.0 | 5.5 | 215 | slag inclusions |
| NC-2 | 766-FM-4 | 53.5 | 5.5 | 294 | slag inclusions, pores |
| NC-2 | 766-FM-2 | 45.0 | 5.5 | 248 | pore clusters |
| C-3 | 985-FM-4 | 42.7 | 6.5 | 278 | - |
| C-3 | 985-FM-3 | 49.6 | 6.7 | 332 | - |
| C-3 | 985-FM-2 | 47.0 | 6.7 | 315 | - |
| NC-4 | 991-FM-1 | 40.0 | 6.7 | 268 | worm holes |
| NC-4 | 991-FM-2 | 43.0 | 6.7 | 288 | worm holes |
| NC-4 | 985-FR-1A | 47.0 | 6.7 | 315 | slag inclusions |
| NC-4 | 985-FR-1B | 47.5 | 6.7 | 318 | slag inclusions |
| NC-4 | 985-FM-1 | 43.6 | 6.6 | 288 | pores |
Table 2.
Chemical composition of the AH36 steel (% weight).
| Content | C | Mn | Si | P | S | Cu | Ni | Cr | Mo | Al | V | Nb | Ti | N | C Eq | Fe |
|---|---|---|---|---|---|---|---|---|---|---|---|---|---|---|---|---|
| % | 0.16 | 1.43 | 0.27 | 0.012 | 0.009 | 0.04 | 0.02 | 0.02 | 0.00 | 0.044 | 0.00 | 0.00 | 0.00 | 0.005 | 0.406 | balance |
| min | 0.90 | 0.015 | 0.05 | 0.02 | ||||||||||||
| max | 0.18 | 1.60 | 0.50 | 0.035 | 0.035 | 0.35 | 0.40 | 0.20 | 0.08 | 0.10 | 0.05 | 0.02 |
Table 3.
Mechanical properties of the AH36 steel.
| Yield Stress σy (MPa) | Rupture Stress σr (MPa) | Elongation A5 (%) |
|---|---|---|
| 400 | 545 | 32 |
| 355 (min) | 490/620 (min/max) | 21 (min) |
Table 4.
Defect parameters evaluated by computed tomography (CT).
| Joint Type | Specimen ID | Defect Type by X-ray | Maximum Defect Size by CT DMAX (mm) | Cumulative Volume by CT V (mm3) |
|---|---|---|---|---|
| C-1 | 754-FM-4 | - | - | 0.06 |
| NC-2 | 766-FM-C | slag inclusions | 4.72 | not available |
| NC-2 | 766-FM-3 | slag inclusions | 3.07 | 23.82 |
| NC-2 | 766-FM-4 | slag inclusions, pores | 2.64 | 4.18 |
| NC-2 | 766-FM-2 | pore clusters | 1.64 | 5.74 |
| NC-4 | 991-FM-1 | worm holes | 4.53 | 365.20 |
| NC-4 | 991-FM-2 | worm holes | 3.13 | 39.65 |
| NC-4 | 985-FR-1A | slag inclusions | 1.46 | 0.54 |
| NC-4 | 985-FR-1B | slag inclusions | not available | - |
| NC-4 | 985-FM-1 | pores | not available | - |
Table 5.
Fatigue limits as derived from the rapid thermographic method.
| Type Joint | Specimen ID | Thickness t (mm) | Fatigue Limit Predictions by RTM ΔσeTM (MPa) |
|---|---|---|---|
| C-1 | 754-FM-1 | 5.5 | 126 |
| C-1 | 754-FM-2 | 5.5 | 115 |
| C-1 | 754-FM-3 | 5.5 | 119 |
| C-1 | 754-FM-4 | 5.5 | 134 |
| NC-2 | 766-FM-C | 5.5 | 80 |
| NC-2 | 766-FM-3 | 5.5 | 105 |
| NC-2 | 766-FM-4 | 5.5 | 113 |
| NC-2 | 766-FM-2 | 5.5 | 131 |
| C-3 | 985-FM-4 | 6.5 | 107 |
| C-3 | 985-FM-3 | 6.5 | 137 |
| C-3 | 985-FM-2 | 6.5 | 115 |
| NC-4 | 991-FM-1 | 6.5 | 109 |
| NC-4 | 991-FM-2 | 6.5 | 110 |
| NC-4 | 985-FR-1A | 6.5 | 106 |
| NC-4 | 985-FR-1B | 6.5 | 99 |
| NC-4 | 985-FM-1 | 6.5 | 121 |
Table 6.
S-N curve parameters predicted by energy approach.
| Type Joint | Specimen ID | m | log(C) Ps = 50% | FAT Ps = 50% (MPa) | FAT Ps = 97.7% (MPa) | ΔσeΦTM Ps = 50% (MPa) | ΔσeΦTM Ps = 97.7% (MPa) | Std.Dev.(log(N)) |
|---|---|---|---|---|---|---|---|---|
| C-1 | 754-FM-3 | 6.6 | 20.36 | 134 | 128 | 117 | 111 | 0.0737 |
| C-1 | 754-FM-4 | 9.3 | 26.65 | 150 | 145 | 136 | 132 | 0.0631 |
| NC-2 | 766-FM-C | 2.3 | 10.51 | 62 | 55 | 42 | 37 | 0.0632 |
| NC-2 | 766-FM-3 | 3.8 | 13.84 | 97 | 85 | 76 | 67 | 0.1070 |
| NC-2 | 766-FM-4 | 4.5 | 15.57 | 118 | 107 | 96 | 87 | 0.0954 |
| NC-2 | 766-FM2 | 6.4 | 19.57 | 116 | 108 | 101 | 93 | 0.1054 |
| C-3 | 985-FM-4 | 4.4 | 15.22 | 113 | 107 | 91 | 87 | 0.0463 |
| C-3 | 985-FM-3 | 7.0 | 21.98 | 167 | 151 | 146 | 133 | 0.1500 |
| C-3 | 985-FM-2 | 6.3 | 19.65 | 133 | 124 | 115 | 107 | 0.0924 |
| NC-4 | 991-FM-1 | 4.2 | 14.54 | 94 | 85 | 75 | 68 | 0.0904 |
| NC-4 | 991-FM-2 | 4.2 | 14.63 | 101 | 88 | 81 | 71 | 0.1251 |
| NC-4 | 985-FR-1A | 3.7 | 14.21 | 132 | 115 | 103 | 90 | 0.1089 |
| NC-4 | 985-FR-1B | 2.8 | 11.88 | 100 | 76 | 72 | 55 | 0.1616 |
| NC-4 | 985-FM-1 | 5.7 | 18.63 | 150 | 123 | 127 | 104 | 0.2465 |
Publisher’s Note: MDPI stays neutral with regard to jurisdictional claims in published maps and institutional affiliations. |
© 2021 by the authors. Licensee MDPI, Basel, Switzerland. This article is an open access article distributed under the terms and conditions of the Creative Commons Attribution (CC BY) license (http://creativecommons.org/licenses/by/4.0/).
Share and Cite
MDPI and ACS Style
Crupi, V.; Epasto, G.; Guglielmino, E.; Marinò, A. Influence of Weld-Porosity Defects on Fatigue Strength of AH36 Butt Joints Used in Ship Structures. Metals 2021, 11, 444. https://0-doi-org.brum.beds.ac.uk/10.3390/met11030444
AMA Style
Crupi V, Epasto G, Guglielmino E, Marinò A. Influence of Weld-Porosity Defects on Fatigue Strength of AH36 Butt Joints Used in Ship Structures. Metals. 2021; 11(3):444. https://0-doi-org.brum.beds.ac.uk/10.3390/met11030444
Chicago/Turabian StyleCrupi, Vincenzo, Gabriella Epasto, Eugenio Guglielmino, and Alberto Marinò. 2021. "Influence of Weld-Porosity Defects on Fatigue Strength of AH36 Butt Joints Used in Ship Structures" Metals 11, no. 3: 444. https://0-doi-org.brum.beds.ac.uk/10.3390/met11030444
Note that from the first issue of 2016, this journal uses article numbers instead of page numbers. See further details here.