Article

In Vitro Degradation Behavior and Biocompatibility of Bioresorbable Molybdenum

1
Fraunhofer Institute for Manufacturing Technology and Advanced Materials IFAM, Dresden Branch Lab., Winterbergstraße 28, 01277 Dresden, Germany
2
Department of Experimental and Molecular Cardiology, Dresden University of Technology, Heart Center Dresden, 01307 Dresden, Germany
*
Author to whom correspondence should be addressed.
Shared first authorship.
Shared last authorship.
Submission received: 31 March 2021 / Revised: 26 April 2021 / Accepted: 27 April 2021 / Published: 5 May 2021
(This article belongs to the Special Issue Development and Application of Biodegradable Metals)

Abstract

:
The degradation behavior and biocompatibility of pure molybdenum (Mo) were investigated. Dissolution of powder metallurgically manufactured and commercially available Mo was investigated by ion concentration measurement after immersion in modified Kokubo’s SBF (c-SBF-Ca) for 28 days at 37 °C and pH 7.4. Degradation layers and corrosion attack were examined with optical microscopy and REM/EDX analysis. Furthermore, potentiodynamic polarization measurements were conducted. Mo gradually dissolves in modified SBF releasing molybdate anions (MoO42−). The dissolution rate after 28 days is 10 µm/y for both materials and dissolution accelerates over time. A non-passivating, uniform and slowly soluble degradation product layer is observed. Additionally, apoptosis and necrosis assays with Mo ion extracts and colonization tests with human endothelial (HCAEC) and smooth muscle cell lines (HCASMC) on Mo substrates were performed. No adverse effects on cell viability were observed for concentrations expected from the dissolution of implants with typical geometries and substrates were densely colonized by both cell lines. Furthermore, Mo does not trigger thrombogenic or inflammatory responses. In combination with its favorable mechanical properties and the renal excretion of bio-available molybdate ions, Mo may be an alternative to established bioresorbable metals.

Graphical Abstract

1. Introduction

Bioresorbable metallic materials (BMMs) have the potential to make follow-up surgeries for certain implants due to planned removal of permanent implants or unplanned complication-related revisions obsolete. In principle, implants made of BMMs provide structural support during the healing and remodeling process of tissues and gradually dissolve by corrosion degradation once the tissue is sufficiently restored. For implants performing a load-bearing role, i.e., cardiovascular or orthopedic implants, the application of BMMs is particularly beneficial due to their favorable mechanical properties compared to bioabsorbable polymers. For example, a bioresorbable stent could help avoid in-stent restenosis, chronic inflammation, and late cardiovascular thromboses associated with permanent stents while simultaneously restoring natural vasomotion of the affected blood vessel.
Currently, three physiologically occurring metals are in the focus of scientific attention: magnesium (Mg), iron (Fe), and zinc (Zn) [1]. Mg is best established due to its good resorbability, excellent biocompatibility, and osteoconductivity. The extensive research on alloying, surface engineering, manufacturing routes, and implant design to improve the degradation and mechanical properties of Mg for stent and orthopedic applications was comprehensively reviewed recently [1,2,3]. These efforts ultimately led to the market authorization of the first commercially available BMM implants like the Magnezix® bone pins and screws (Syntellix AG, Hannover, Germany) or the Magmaris® stent system (Biotronik AG, Germany). However, the generally high degradation rate and rather low mechanical strength and Young’s modulus of Mg alloys, combined with low fracture strain necessitates larger dimensions for load-bearing structures. Furthermore, Mg alloys are known for non-uniform corrosion and are prone to stress corrosion cracking [4]. Research on bioresorbable Fe and Zn is still in the preclinical stage. Despite all efforts on alloying, alternative manufacturing methods, microstructure modification, coatings, or addition of corrosion-enhancing materials, the degradation behavior of bioresorbable Fe materials does not satisfy the demands for a bioresorbable material [5,6]. In particular, the formation of mostly insoluble degradation products that retard in vivo dissolution is problematic [7,8,9]. Zn as potential bioresorbable stent material promises moderate degradation and mechanical properties paired with excellent biocompatibility [10]. However, its current lack of mechanical strength and ductility, and especially the instability of its mechanical properties due to age hardening, limits its applicability in stents and orthopedic implants [11]. Recent studies concerning alloying Zn with lithium appear to be promising, though [12].
An alternative structural bioresorbable material with high mechanical stability, slow but steady and predictable degradation without formation of bulky products, excellent biocompatibilty and clinical handling, as well as suitability for magnetic resonance imaging (MRI) is still desirable. Molybdenum (Mo), previously rarely investigated, may just fulfill these requirements. Hot-worked, pure molybdenum exhibits higher strength than 316L stainless steel (UTS of 1386 MPa vs. 340 MPa). Its high Young’s modulus (E of 324 GPa vs. 193 GPa for 316L) is very favorable for delicate structures in general and, in view of the necesssary radial strength and recoil behavior, for stents in particular [13]. Furthermore, elongation to failure of up to 50% for stress-relieved, fine-grained Mo is reported [14]. For comparison, an elongation of at least 18% should be provided by a stent material [10].
Recently, our group described the potential of commercially available pure Mo for structural bioresorbable implant applications [15]. Dissolution rates of 0.6–18 µm/y and electrochemical corrosion rates of 5–13 µm/y were measured in various physiological solutions. These rates are in agreement with the corrosion rates for pure Mo of 0.32–9.47 µm/y reported by other groups [16,17,18,19,20] and close to the commonly referenced corrosion benchmark of 20 µm/y for a stent material [10]. The overall anodic dissolution reaction for molybdenum is:
Mo + 4 H 2 O     MoO 4 2 + 8 H + + 6 e
However, at pH 7.4 molybdenum forms a thin, non-passivating, uniform degradation product layer [15,16] that slowly dissolves by a complex reaction cascade [21,22].
At pH > 6, the predominantly dissolved species is the molybdate ion MoO42− [23] which is also the metabolizable form incorporated as a cofactor into a number of human enzymes [24]. Excess Mo is excreted mainly via urine (10–16 μg/L). This allows for an adequate resorption behavior, i.e., sufficiently quick dissolution and clearance without accumulation of Mo [25]. Adverse effects toward humans were reported only for high Mo uptakes of 10–15 mg/d by mine workers, who experienced reversible gout-like symptoms [26]. A relatively high NOAEL (No Observed Adverse Effect Level) of 0.9 mg/d per kg body weight was derived from a rat model that led to a recommended dietary UL (upper intake level) of 0.6–2 mg/d for humans [27]. Furthermore, the United States Pharmacopeia allows Mo impurity levels in pharmaceutical products of 3 mg/d and 1.5 mg/d for oral and parenteral intake, respectively. In comparison, the average daily dietary intake in eleven countries lies between 0.083 mg/d and 0.247 mg/d [28].
Furthermore, Mo was shown to be neither mutagenic, cancerogenic, or teratogenic even at high intake levels [29,30], but no data on thrombogenicity, colonizability, and inflammatory response exist so far. However, this knowledge is essential for the prevention of severe complications like acute or late cardiovascular thrombosis and stent-induced narrowing of the vessel (in-stent restenosis). Furthermore, previous studies on the viability on fibroblasts and osteoblasts [31,32,33] demonstrated no cytotoxic effects at concentrations below 119 mg/L (corresponding to 1.24 mM), suggesting Mo to be a suitable bone implant material. However, no data on the physiological effect of Mo on vascular cells have been published.
The aim of the present study is to close some of the gaps in the comprehension of the physiological behavior of molybdenum, with a focus on stent applicability. Therefore, electrochemical and static immersion degradation measurements on commercially available and powder metallurgically (PM) manufactured Mo were conducted in modified SBF based on Kokubo’s c-SBF [31]. Powder metallurgically produced PM Mo was tested in comparison to the commercially available (CA) hot-worked Mo to account for the ongoing trend of additive manufacturing and implant personalization. To fill the gaps concerning biocompatibility of molybdenum, in vitro apoptosis and necrosis assays for human coronary artery endothelial cells (HCAEC) and human coronary artery smooth muscle cells (HCASMC) were conducted using a concentration series of Mo trioxide extracts (MoO3) in cell culture medium. The same concentration series was used to examine the inflammatory response of human THP-1 monocytes. Furthermore, cell colonization tests for HCAEC and HCASMC on PM Mo were conducted versus a PM 316L reference. Additionally, the thrombogenicity of commercially available Mo and 316L wire was tested.

2. Materials and Methods

2.1. Material Preparation

The composition and impurity levels of commercially manufactured materials used are summarized in Table 1. Molybdenum powder (mean particle diameter 5 µm, H.C.Starck, Goslar, Germany) was consolidated to form samples with 20 mm diameter and 19 mm height by spark plasma sintering (SPS) for 10 min at 1600 °C and 51 MPa under Ar atmosphere (HPD-05, FCT Systeme GmbH, Frankenblick, Germany). As reference for cell colonization tests, 316L powder (mean particle size 6 µm, Atmix, Hachinohe, Japan) was consolidated via SPS for 5 min at 1200 °C and 47 MPa to form a sample with 20 mm diameter and 19 mm height. For electrochemical measurements, a PM Mo sample was cut into a rectangular block of approx. 13 × 13 × 19 mm3 with an alumina disk saw (Acutom 50, Struers, Kopenhagen, Denmark). This block was further cut into slices of 13 × 13 × 1 mm3. The surfaces of the slices were wet ground with 1200 grit SiC paper, ultrasonically cleaned in ethanol, and dried in warm air prior to electrochemical experiments.
For immersion and cell colonization tests, columns of 5 × 5 × 19 mm3 were cut from the SPS samples by wire EDM (FA10S, Mitsubishi Electric, Tokyo, Japan). The long sides were ground with 1200 grit SiC paper to remove the contaminations and the heat-affected zone created by wire EDM. The columns were further cut to small slices of approx. 5 × 5 × 0.5 mm3 with an alumina disk saw. For immersion corrosion tests, four Mo samples were affixed to a quartz sample holder with quartz wax (OCON-200, Logitech LTD, Glasgow, UK) and wet ground with 2500 grit SiC paper using a lapping machine (LP40, Logitech LTD, Glasgow, UK). For cell colonization tests, ten Mo and ten 316L samples were polished with 1 µm diamond suspension. The samples were detached with acetone, rinsed three times in fresh acetone, ultrasonically cleaned in ethanol and dried in warm air.
As a reference for electrochemical and static immersion corrosion tests, commercially available, hot-rolled molybdenum foil (CA Mo) with a thickness of 0.095 mm was used (H.C.Starck, Goslar, Germany). The foil was cut by wire EDM into samples of 15 × 15 × 0.095 mm3 and the heat-affected zones were removed by grinding. Prior to the tests, the surface was ground with 2500 grit SiC paper, samples were cleaned in ethanol and dried in warm air.
Thrombogenicity tests were performed with commercially available Mo wire (Plansee India High Performance Materials Pvt. Ltd., Mysore, India) and 316L wire (Goodfellow GmbH, Friedberg, Germany), both with 0.25 mm diameter. The wires were cut into pieces of 15 cm length, cleaned with ethanol, and twisted into a spiral around a glass rod to fit into the culture vessels.

2.2. Electrolyte Preparation

The electrolyte was aerated, modified corrected simulated body fluid (c-SBF-Ca) as introduced by Kokubo et al. [34] with the composition summarized in Table 2. The amount of CaCl2 was reduced by half in comparison to Kokubo’s c-SBF to better approximate the concentration in human blood serum and body fluid of approx. 1.2 mM Ca. Kokubo’s SBF was originally used to assess apatite formation on implants. Thus, its Ca concentration corresponds to the total amount of 2.5 mM that is partially bound to proteins and other anions. The medium was buffered by a TRIS-HCl buffer with 1 M HCl to pH 7.4 at 37 °C.

2.3. Electrochemical Characterization

Electrochemical polarization tests were carried out in a three-electrode cell using a multifunctional potentiostat (Metrohm PGSTAT302N). The specimen, a platinum wire electrode, and a saturated calomel electrode (SCE) were set as working, auxiliary, and reference electrode. The Luggin capillary was positioned approx. 1 mm from the sample surface. The round flask housing the measurement cell was filled with 500 mL of c-SBF-Ca and kept at 37 °C in a water bath. The temporal temperature variation during the measurements was ±0.5 K. The medium was stirred at <100 rpm during all measurements. The open circuit potential (OCP) was recorded over a period of 3600 s. Afterwards, linear sweep voltammetry tests (LSV) were carried out from –150 mV to +150 mV vs. OCP at a scanning rate of 1 mV/s. All measured potentials are given versus SCE. The corrosion current density icorr was derived from Tafel plot evaluation. The electrochemical corrosion rate was calculated according to Faraday’s law in terms of penetration rate (µm/y) from the measured current density icorr (A/cm2) and material density ρMo:
v corr , e = i corr · M Mo F · z · ρ Mo
MMo refers to the atomic weight of molybdenum, F is the Faraday constant, and z = 6 the valency of Mo in molybdate anions.

2.4. Static Immersion Test

Immersion tests were carried out based on ASTM-G31–72 [35]. Four samples each of PM Mo and CA Mo were placed in PVC bottles on a polymer holder. The samples were immersed in c-SBF-Ca with a ratio of 10 mL per cm2 surface area at 37 °C in an incubator (VWR International GmbH, Incu-Line IL 23). The spatial and temporal temperature deviations were ±0.5 K each at 37 °C. The c-SBF-Ca was changed two times a week in alternating 4- and 3-day intervals. Used medium was sampled for ion concentration measurements. A slight increase of pH of about 0.1–0.2 was observed before each medium change, independent of the time interval. The increase is attributable to a shift in the hydrogen carbonate/carbon dioxide equilibrium in the carbonate-enriched SBF under aerated conditions.
After 28 days, the samples were removed from the medium, rinsed with distilled water and ethanol, and dried in air. The concentrations of Mo, copper (Cu), calcium (Ca), and phosphorous (P) in the sampled immersion medium were analyzed by inductively coupled plasma optical emission spectroscopy (ICP-OES, iCAP 6000, ThermoFisher Scientific). Specific mass loss in mg/cm2 was calculated and plotted against time of immersion:
Δ m Mo , i =   c Mo , i   ·   V medium A sample = c Mo , i ·   0.01 L cm 2
Corrosion rates from ion concentrations were calculated in µm/y by summation of concentrations:
v corr , i =   365   d y   · i Δ m Mo , i   ·   10 4   µ m cm t   ·   ρ Mo

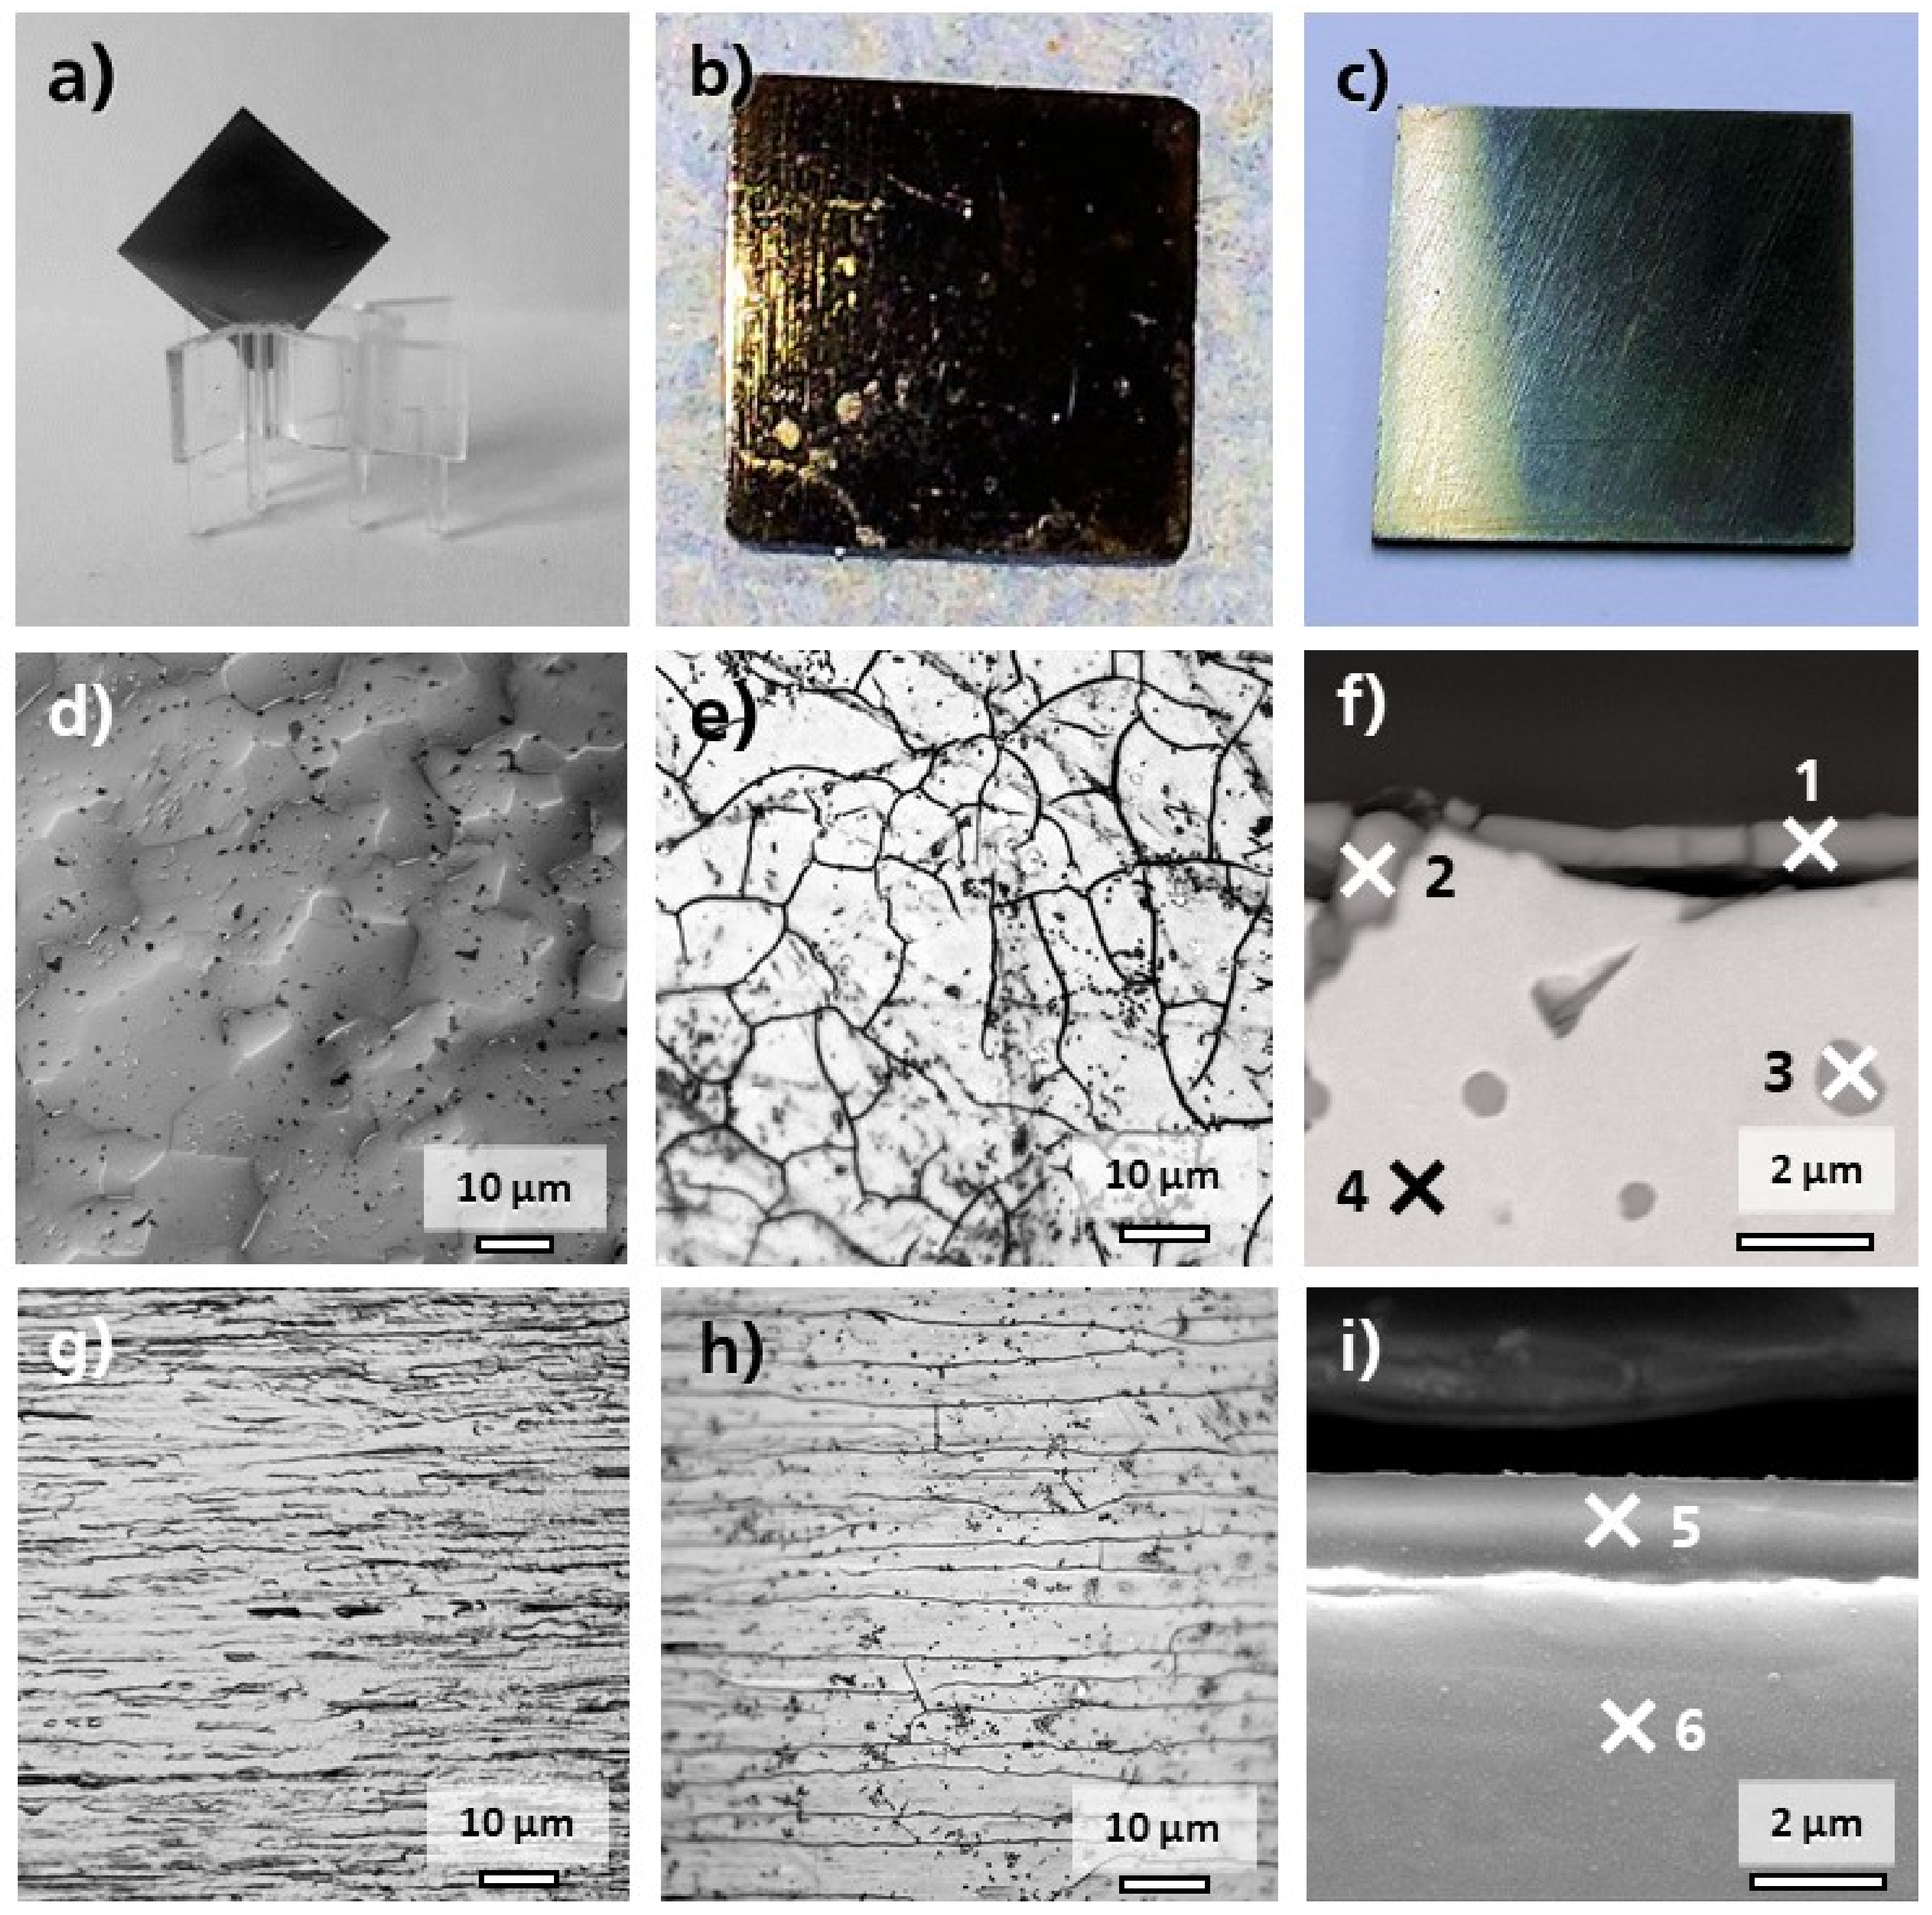
2.5. Microstructural and Corrosion Product Characterization

To assess the surface morphology of the degradation products after immersion, no further preparation was undertaken. Afterwards, cross sections of uncorroded and corroded PM Mo and CA Mo samples were prepared by embedding in epoxy, wet grinding using abrasive SiC paper up to 2500 grit and polishing first with diamond suspension (3 and 1 µm) and then alumina suspension (0.1 µm). Samples were rinsed in water, ultrasonically cleaned in ethanol, and dried in warm air. For investigation of the microstructure, the samples were subjected to Murakami etching.
The microstructure and the degradation products were investigated by optical microscopy (OM, Reichert MEF4A) and scanning electron microscopy (SEM, Jeol JSM-IT800). The elemental composition of the materials and degradation layers was evaluated by energy dispersive x-ray analysis (EDX, Bruker XFlash Detektor 6/30).

2.6. Cell Culture

Human coronary artery endothelial cells (HCAEC), human coronary artery smooth muscle cells (HCASMC), and human THP-1 cells were purchased from PromoCell (PromoCell GmbH, Heidelberg, Germany). HCAEC were cultured in Endothelial Cell Growth Medium MV (C-22020, PromoCell), HCASMC in Smooth Muscle Cell Growth Medium 2 (C-22062, PromoCell), and THP-1 cells in RPMI 1640 medium (FG1215-BC, Merck KGaA, Darmstadt, Germany) at 37 °C in a humidified incubator supplied with 5% CO2 and 95% air. At a confluence of ~90%, the cells were subcultured. All experiments were performed with cells from passages 3–6.

2.7. Time and Concentration Series

In preliminary experiments, the time- and concentration-dependent impact of Mo on the vitality of HCAEC was analyzed. Therefore, 0.6 g/L MoO3 (99.5% purity, Alfa Aesar) was mixed in the respective cell media for 24 h. MoO3 was chosen as the starting material because it is sufficiently soluble to reach the maximum Mo concentration (molybdate anions MoO42−) in a short time. It adequately represents the soluble degradation products of metallic Mo since MoO3 is the end product of the dissolution reaction cascade of Mo in aqueous media [22,23]. Remaining solid MoO3 was removed by centrifugation and the Mo ion concentration was measured via ICP-OES. In all media, a Mo concentration of 2.5 ± 0.03 mM (corresponding to 240 ± 3 mg/L) was measured. The media were used as parent solutions which were diluted with fresh medium to obtain a concentration series. HCAEC were cultured for 24, 48, or 72 h in medium without Mo (control) or with 0.16, 0.31, 0.63, 1.25, or 2.5 mM Mo (corresponding to 15, 30, 60, 120, 240 mg/L). Vitality of the cells was subsequently visually assessed by differences in adherence, cell size, and granularity.

2.8. Determination of Mo Induced Apoptosis and Necrosis

HCAEC and HCASMC were incubated with increasing Mo concentrations (0.16 mM, 0.63 mM, 1.25 mM) for different time periods and subsequently detached from the culture plate by Accutase® (A-6964, Merck KGaA, Darmstadt, Germany). Apoptosis and necrosis were determined by a fluorescence-/luminescence assay (RealTime-Glo™ Annexin V Apoptosis and Necrosis Assay, Promega, Walldorf, Germany) which was used according to the manufacturer’s instructions.

2.9. Thrombogenicity Assay

Platelets were isolated from human citrated blood of a healthy, non-anticoagulated donor and placed in PBS. The cells were divided into three specimens, which all were incubated at 37 °C for 30 min: (1) positive control (Pos-con): TRAP-6 (Thrombine receptor activator peptide 6, 20 µM in PBS (3497-Tocris Bioscience, Wiesbaden-Nordenstadt, Germany); (2) 316L stainless steel wire, and (3) Mo wire. After 30 min, each specimen was divided into two parts, which were incubated with fluorescently labeled antibodies for either CD62P (550888, BD Biosciences, Heidelberg, Germany) or CD63 (556020, BD Biosciences, Heidelberg, Germany), both platelet activation markers. After fixation of the cells with formalin, the measurement was performed using flow cytometry (fluorescence-activated cell sorting, FACS).

2.10. Determination of Inflammation

Human THP-1 monocytes were incubated for 24 h in the medium without Mo (control) or with 0.16, 0.31, 0.63, 1.25, or 2.5 mM Mo. Incubation of THP-1 cells with TNF-α (10 ng/mL) served as the positive control. Subsequently, RNA was isolated and quantitative real-time PCR was performed using primers for inflammation markers (IL-1β, IL-10, TNF-α).

2.11. RNA Isolation and Quantitative Real-Time PCR

Total RNA was isolated from THP-1 monocytes using Qiazol reagent and miRNeasy Mini Kit (Qiagen, Hilden, Germany) following the standard protocols. cDNA was synthesized with the Revert AID™ H Minus First Strand Synthesis Kit (Thermo Fisher Scientific, Berlin, Germany) using oligo-dT primers. Real-time PCR was performed using the CFX384TM Real Time PCR System (BioRad, Hercules, CA, USA) and Maxima SYBR Green qPCR Kit (Thermo Fisher Scientific, Germany). PCR program for all primer sets (see Table 3) was as follows: 95 °C for 8 min prior to 40 amplification cycles, each consisting of 95 °C for 10 s, 58 °C for 15 s, and 72 °C for 30 s with a final extension step at 72 °C for 2 min. Melting point analysis was performed to verify the identity of the PCR products. Relative quantification of gene expression was calculated by ΔΔCT method with HPRT1 as the housekeeping gene using BioRad CFX Manager software (BioRad, USA). The expression of specific genes was normalized to their expression in the untreated negative control.

2.12. Colonization of Metal Slices

Slices of molybdenum or 316L stainless steel (control) were placed in cell culture plates, covered by cell culture medium containing HCAEC or HCASMC and incubated for 4–6 h at 37 °C. Afterwards, the metal slices were removed, stained with phalloidin (actin-filament-binding, A12380, Thermo Fisher Scientific, Bremen, Germany) and DAPI (DNA-binding, A10019010, AppliChem GmbH, Darmstadt, Germany) and examined for adherent cells using a fluorescence microscope.

2.13. Statistics Section

Electrochemical measurements were conducted at least three times for each sample condition. Figure 1 shows the representative measurement curves. The corrosion rates given in the results section are indicated with experimental measurement deviations. At least four samples were tested for each sample condition in the immersion corrosion tests. Systematic relative maximum errors were estimated by propagation of uncertainty methods. Errors were estimated to be <1% for the high precision method of ICP-OES mass loss measurement. Experimental measurement deviations are much higher and are therefore depicted as error bars.
Cell culture data are presented as mean ± SEM (standard error of the mean). At each time point in the respective cell culture experiments, untreated cells were compared to each approach by 2-sided Student’s t-test of equal variances. A p-value below 0.05 was considered as statistically significant.

3. Results and Discussion

3.1. Degradation Properties

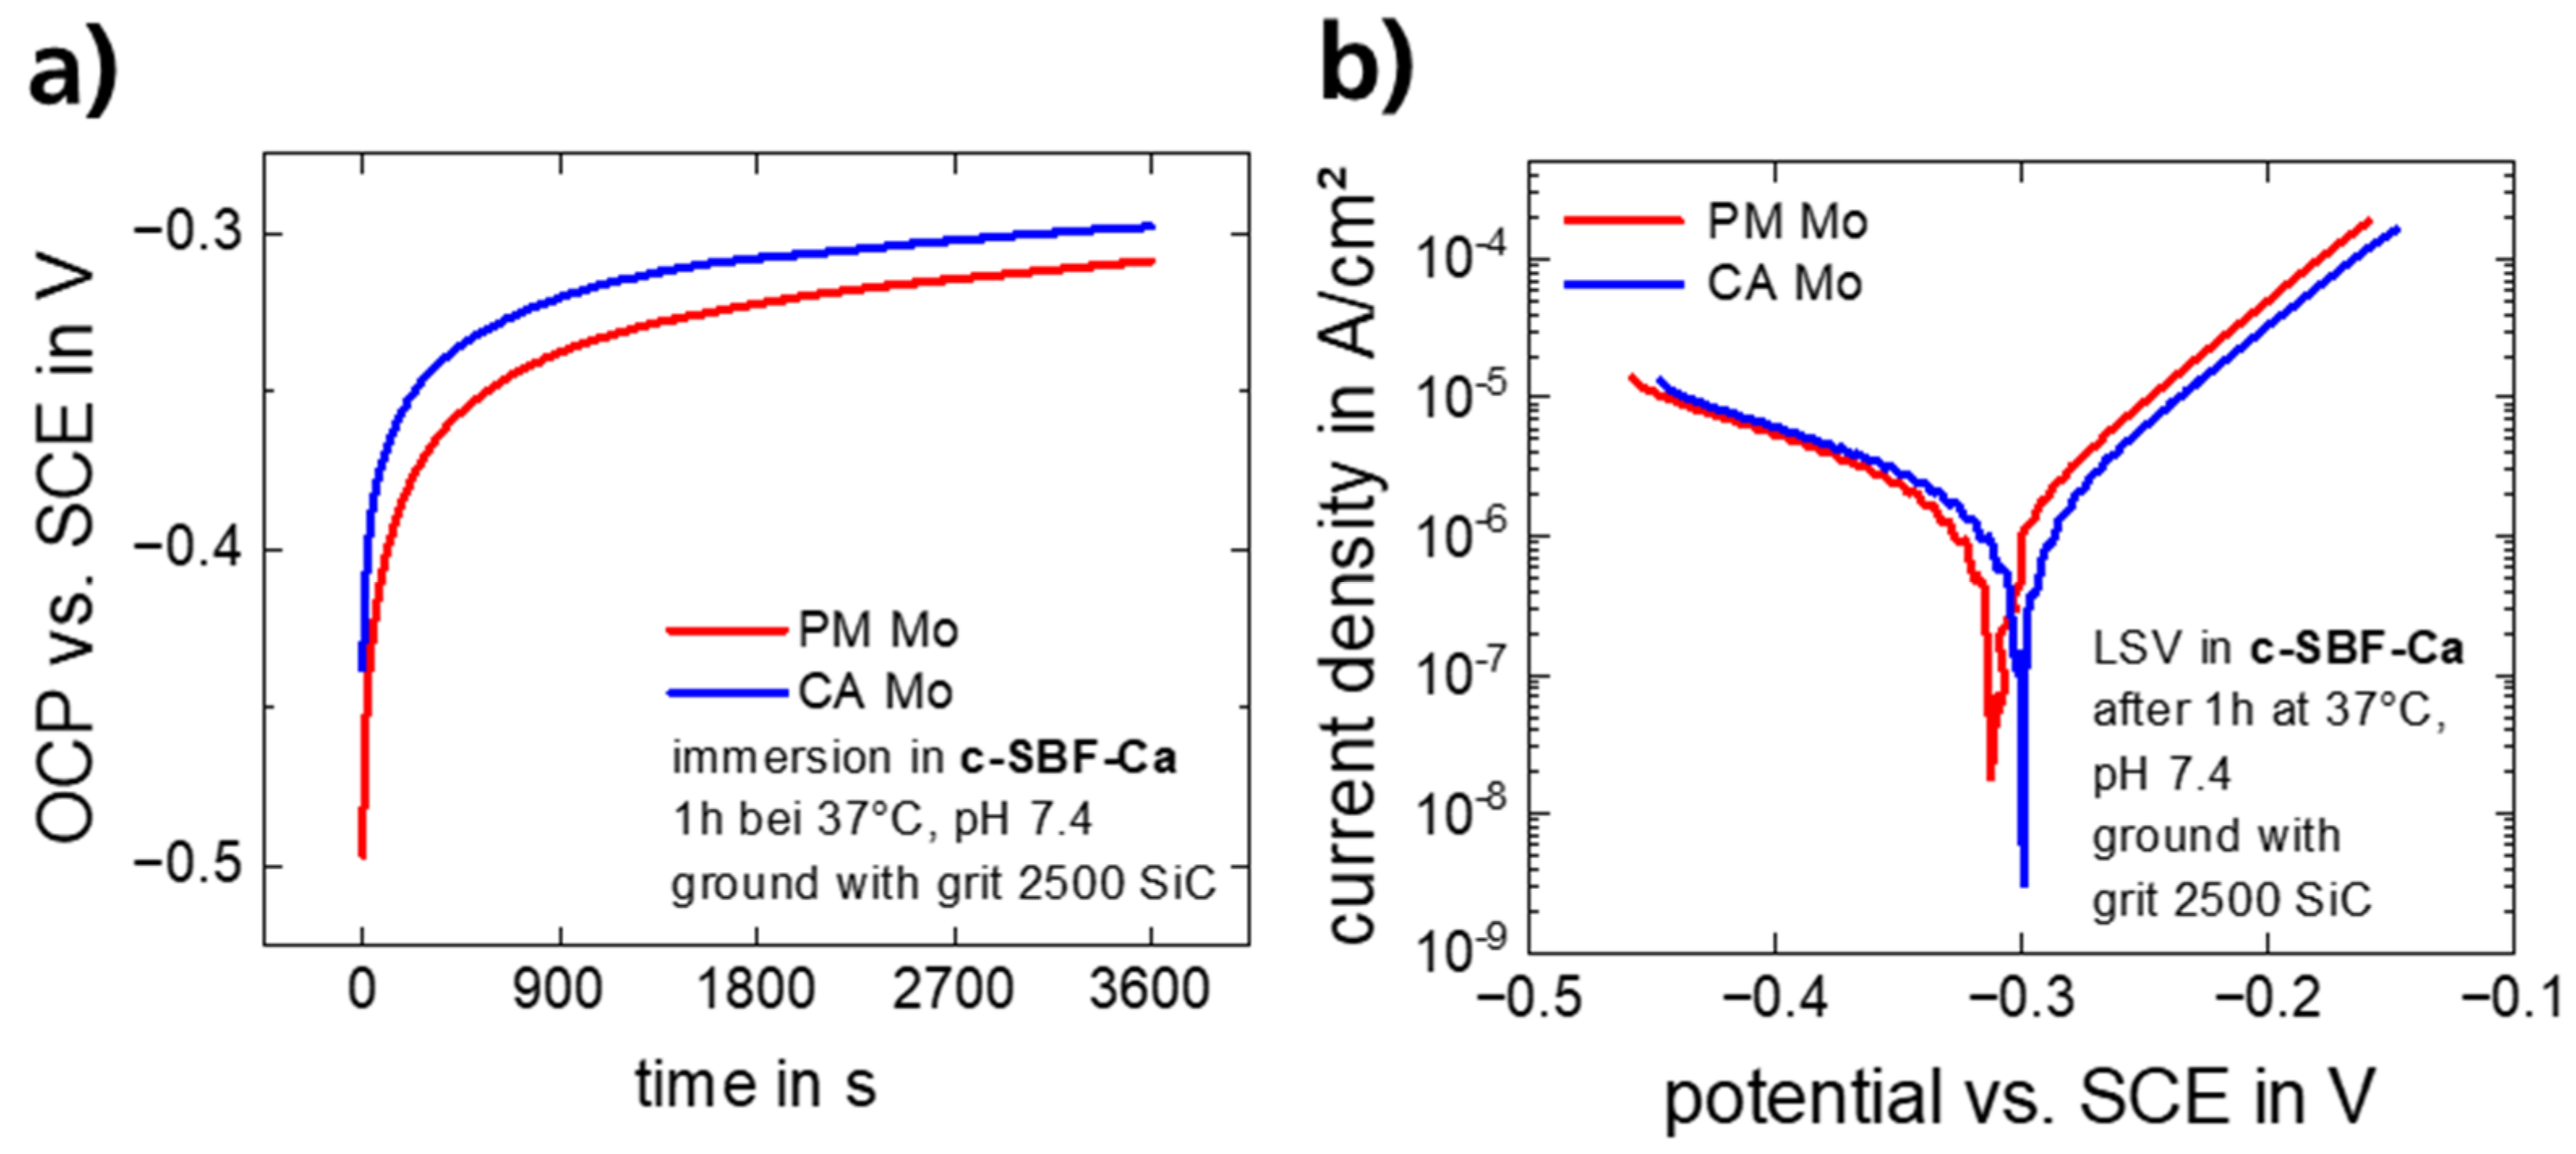
3.1.1. Electrochemical Corrosion Behavior

Figure 1a shows the OCP progression of a freshly prepared, pure Mo sample immersed in c-SBF-Ca for 1 h. The results of the electrochemical measurements are summarized in Table 4. The curve shape is similar for PM Mo and CA Mo, starting with rapidly increasing values in the first minutes. The OCP stabilizes at values of approx. −320 mV and −340 mV for CA Mo and PM Mo, respectively, after about 900 s. Afterwards, the OCP steadily and slowly approaches -302 mV for CA Mo and −310 mV for PM Mo after 3600 s. Figure 1b shows representative curves of LSV measurements. The final OCP values correspond well with the corrosion potentials of CA Mo and PM Mo. Electrochemical corrosion rates of 5.7 ± 1.2 µm/y and 7.1 ± 0.1 µm/y were derived by Tafel analysis. The cathodic branches of the LSV curves are practically identical whereas the anodic branches have similar slopes, but are shifted in potential by −10 mV for PM Mo compared to CA Mo.
The probable mechanism of corrosion was described in our previous study [15]. In short, the initial rapid increase in OCP can be attributed to the quick formation of tetravalent MoO2 that approaches a stable mixed potential with the cathodic oxygen reduction reaction. However, no stable condition is achieved, and potentials continue to rise slowly due to the increasing influence of the formation of V- and VI-valent oxides. In the last step, MoO3 dissolves and molybdate anions MoO42− are released from the sample at pH > 6 [36]. The complex reaction cascade is described elsewhere [21,22]. Remarkably, neither the ionic or the electronic transport to and through the product layer and nor the oxygen diffusion to the surface appear to be rate-determining, but rather the dissolution reactions themselves.
The OCP values, corrosion potentials, and electrochemical corrosion rates for PM Mo and CA Mo correspond well with the previously reported data for commercially available hot-formed and stress-relieved Mo immersed in buffered c-SBF and NaCl [15]. The values also agree with electrochemical dissolution rates reported in other studies [17,18,19]. The slightly lower potential and slightly higher electrochemical corrosion rate for PM Mo compared to CA Mo may be attributed to the different microstructures (see Figure 2d,g). Particularly the oxides that formed at the grain boundaries of PM Mo may play a role. However, their influence on the corrosion mechanism has not yet been studied in detail.

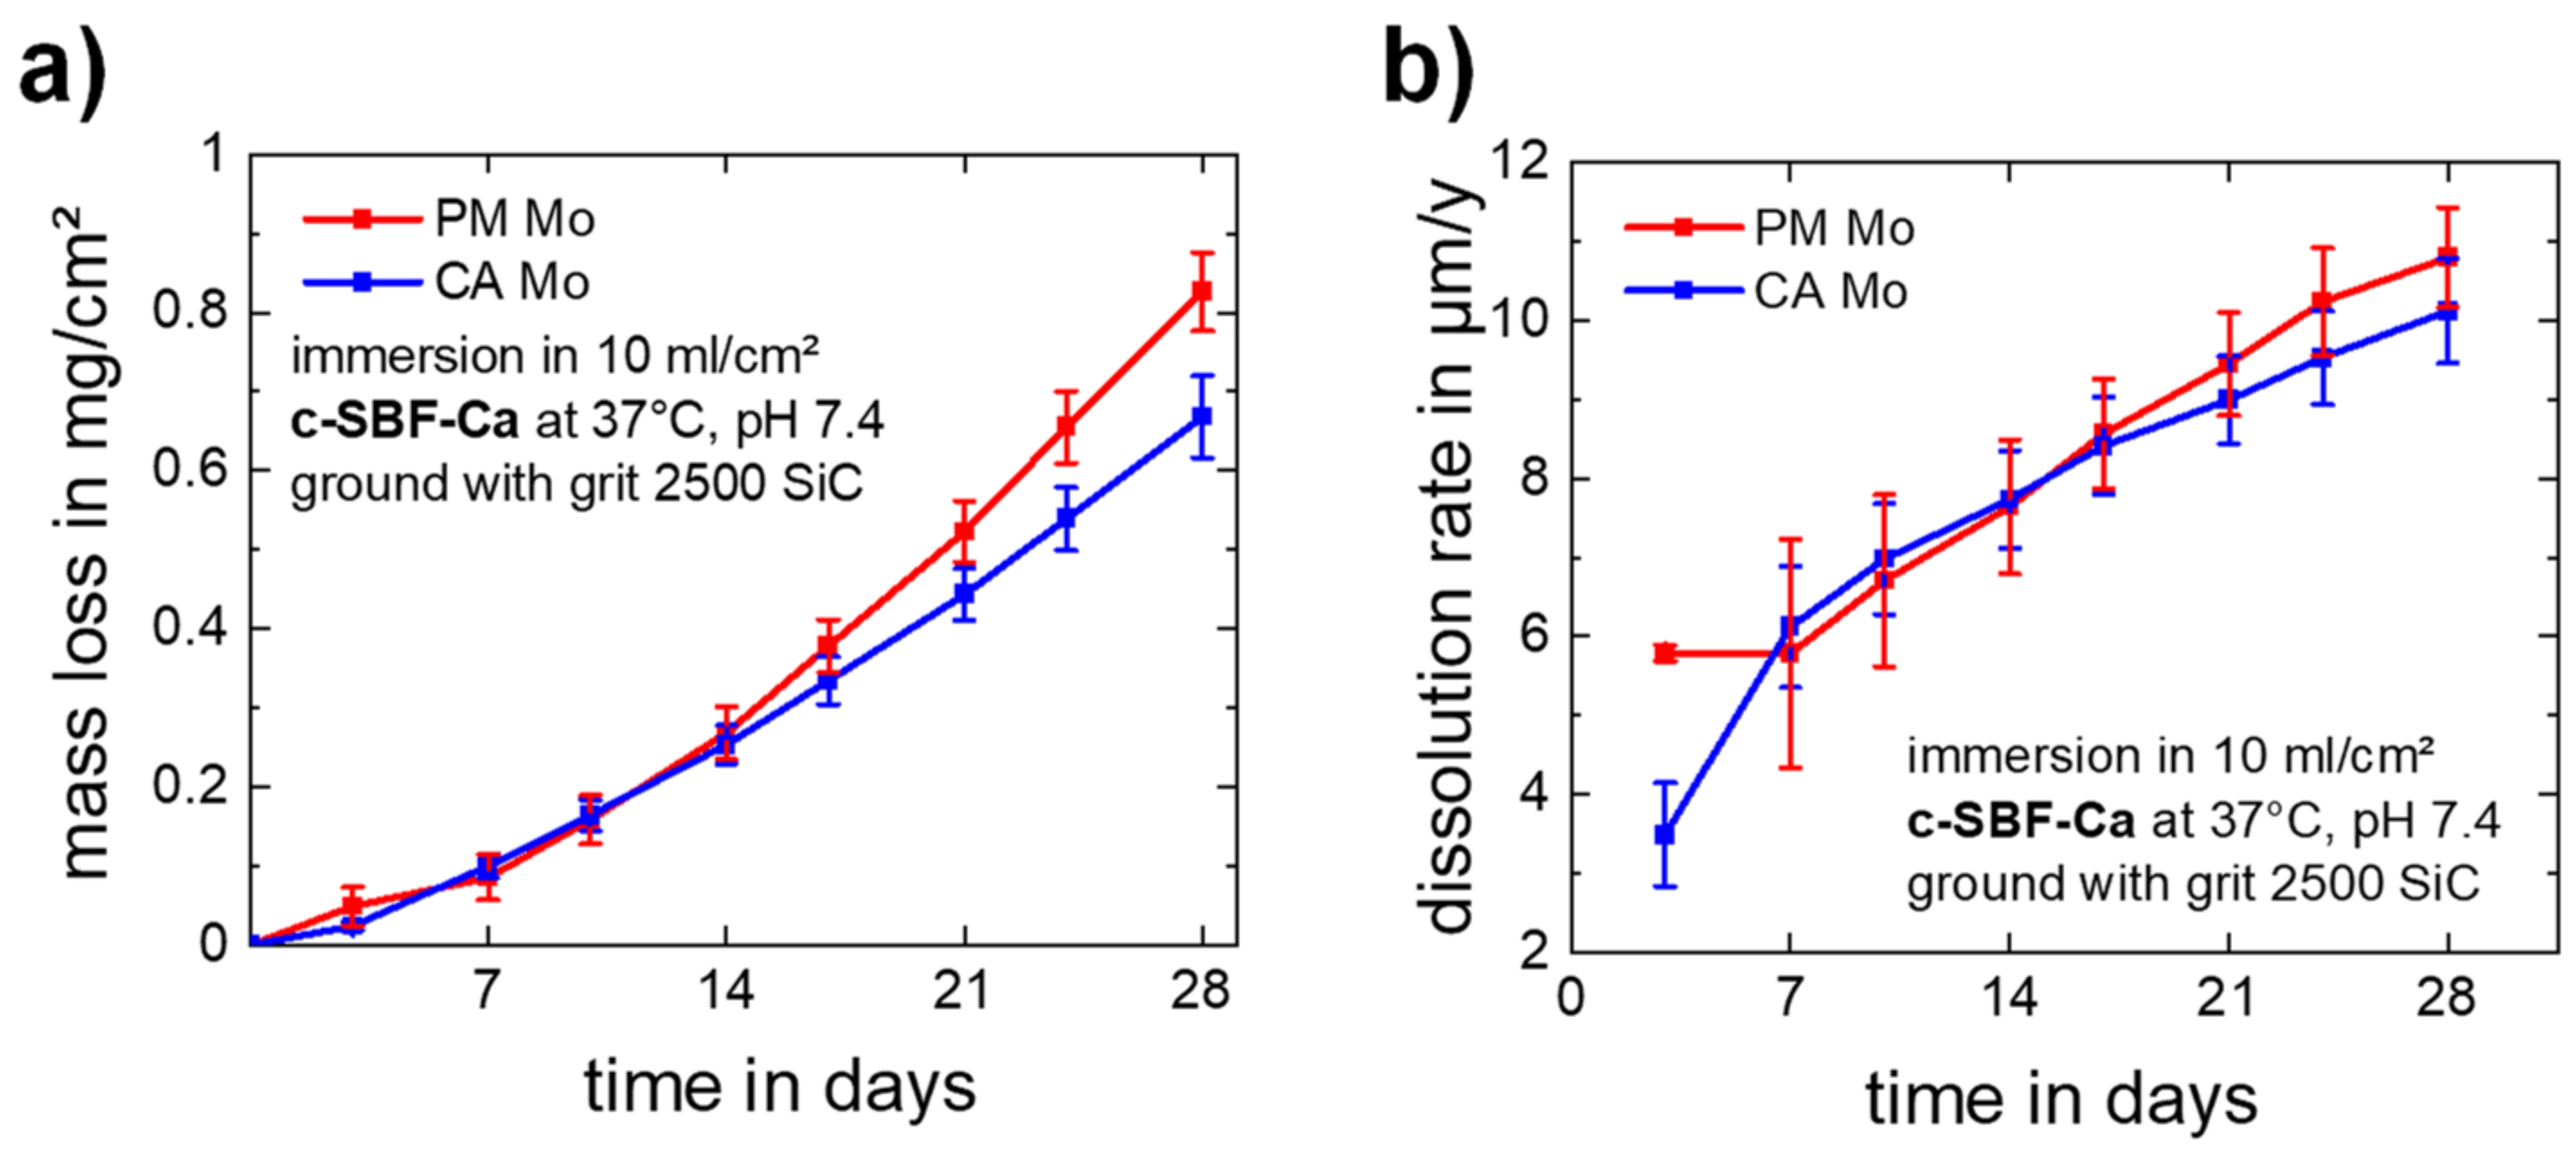
3.1.2. Static Immersion Corrosion Behavior

Both CA Mo and PM Mo immersed in c-SBF-Ca as shown in Figure 2a go through a rapid color change from metallic to a dark bluish-grey luster within the first 3 days. The change of color is associated with the gradual formation of solid degradation products on the sample surface. After reaching a thickness of several hundred nanometers, the layer appears as shown in Figure 2b,c. The coloration does not change appreciably afterwards. The same behavior was observed for commercially hot-worked and stress-relieved Mo in several other aqueous media [15].
The microstructure of PM Mo shown in Figure 2d consists of globular grains of about 5 µm diameter that partially resemble the original powder particles. However, some powder particles apparently have merged to form larger grains of approx. 20 µm diameter. The dark phase distributed throughout the microstructure contains Mo oxides probably originating from surface oxides of the Mo powder (see data on Mo powder in Table 1). The presence of oxygen is detected by EDX (points 2 and 3 in Figure 2f), whereas the matrix consists of pure Mo. The results of the respective EDX analyses are summarized in Table 5. The corroded surface of the PM Mo sample is covered with a dense layer of degradation products that is traversed by fine cracks (Figure 2e). The layer appears yellowish and translucent under the microscope. The distribution and size of the cracks correspond to the arrangement of grain boundaries of the sample. The cross section of a corroded PM Mo sample reveals a product layer thickness of approx. 1 µm (data point 1 in Figure 2f).
The microstructure shows signs of localized corrosion attacks in the vicinity of the incorporated oxides, e.g., at point 2. Furthermore, the product layer is interrupted in these areas of localized attack. The degradation products are most likely solid Mo oxides since they consist mostly of molybdenum and oxygen. However, the layer differs in composition from the microstructural oxides at points 2 and 3 since it contains about 2 wt.% P and 4.2 wt.% Ca, indicating the presence of small quantities of calcium phosphates (CaP) with a P-to-Ca-ratio of approx. 1:2.
The microstructure of hot-worked CA Mo shown in Figure 2g comprises elongated grains typical for a rolled metal. The corroded surface is shown in Figure 2h. The appearance of the products (yellowish and translucent) is very similar to that found on PM Mo. However, the distribution of the cracks appears directional and resembles the underlying elongated grain structure. The cross-sectional view in Figure 2i reveals that the product layer has an approximate thickness of 1.5 µm and is of uniform thickness (data point 5). The corrosion attack is similarly uniform and there are no signs of locally enhanced corrosion. Furthermore, the layer is dense and in close contact with the underlying Mo. The composition of the degradation products is similar to the one found on PM Mo. The predominant Mo oxide species are infiltrated by a considerable amount of P (3.3 wt.%) and Ca (6.7 wt.%). Apparently, small amounts of Na and Mg from the electrolyte are also incorporated. In comparison with PM Mo, CA Mo shows a more uniform corrosion attack and thicker, more uniform degradation product layers containing more Ca, P, and oxygen.
The appearance and thickness of the solid degradation products are very similar for PM Mo and CA Mo and resembles the product layers observed after immersion in other electrolytes like NaCl solution and c-SBF [15]. Therefore, it is safe to assume that the basic degradation mechanism described above and in [15] is the same in all investigated media. From the data published so far, it appears likely that the same mechanism that results in dense, uniform, and slowly dissolving products is also valid for in vivo environment [15,16,21,22].
Molybdenum ion concentration-derived mass losses and dissolution rates are depicted in Figure 3. According to the ICP-OES data, mass losses are very similar for PM Mo and CA Mo in the first 14 days of immersion. Thereafter, PM Mo dissolves slightly faster up to a total mass loss of 0.83 ± 0.05 mg/cm2 after 28 days of immersion in c-SBF-Ca compared to CA Mo with 0.67 ± 0.05 mg/cm2. The progression of the mass loss is not linear but rather exponential. This results in linearly increasing dissolution rates without flattening of the curves over the course of 28 days immersion. The overall dissolution rates for PM Mo and CA Mo are similar on day 28 with 10.8 ± 0.6 µm/y and 10.1 ± 0.7 µm/y, respectively.
The measured dissolution rates in c-SBF-Ca are in good agreement with the rates reported in the literature [16,20] and comparable to the rates measured in our previous study [15]. Like the electrochemical corrosion rates, the dissolution rate of PM Mo is slightly higher than for CA Mo. This is most likely due to the different microstructure and especially the incorporated oxides in PM Mo. Nevertheless, the effect on the degradation behavior is small. However, occurrence of oxygen above 40 ppm or oxides in the microstructure may drastically deteriorate the ductility of molybdenum and should be avoided [37].
The use of modified Kokubo’s c-SBF with lower Ca concentration has a significant effect on the dissolution rates and the composition of the degradation products. Thick CaP layers that formed in standard c-SBF did not occur in c-SBF-Ca. Thus, dissolution rates increased from 0.7 µm/y to more than 10 µm/y. However, both in c-SBF and c-SBF-Ca, Ca and P were incorporated into the degradation product layer, which slows the dissolution in comparison to 18 µm/y measured in Ca- and P-free NaCl solution [15].
The dissolution rate of 10 µm/y is still lower than the benchmark of 20 µm/y for bioresorbable stent materials [10]. However, the dissolution rates increase and do not reach a constant level throughout the investigated period of 28 days. A long-term immersion degradation test is needed to determine the long-term behavior of bioresorbable molybdenum. Furthermore, the value of 20 µm/y is based on a stent with 80 µm strut thickness that completely dissolves in 2 years. However, with a high-strength material like Mo which exceeds the Young’s modulus and UTS of 316L and CoCr alloys, a strut thickness of 50 µm or even less appears to be realistic, lowering the needed dissolution rate.

3.2. Biocompatibility

3.2.1. Dissolution Model for a Hypothetical Mo Stent

To allow for a first assessment of the biological impact of a corroding Mo stent on its direct vicinity, the mass loss from a stent structure is estimated based on the measured mass losses after 28 days of immersion of 0.83 mg/cm2 for PM Mo and 0.67 mg/cm2 for CA Mo. In the case of a hypothetical cardiovascular Mo stent with a weight of 40 mg, a density of 10.28 g/cm3, a strut thickness of 80 µm, and a square strut profile, the total strut length of the stent would be approx. 60 cm with an initial surface area of approx. 2 cm2. The calculated average daily mass loss is thus 61 µg/d (0.64 µmol) or 48 µg/d (0.50 µmol) for PM Mo or CA Mo, respectively. Calculating the required daily mass loss for the desired complete dissolution of a 40 mg stent in 2 years results in a very similar rate of 55 µg/d. This approximation is limited by the time-variable dissolution rates, the change in surface area over time, and the current lack of in vivo degradation data.

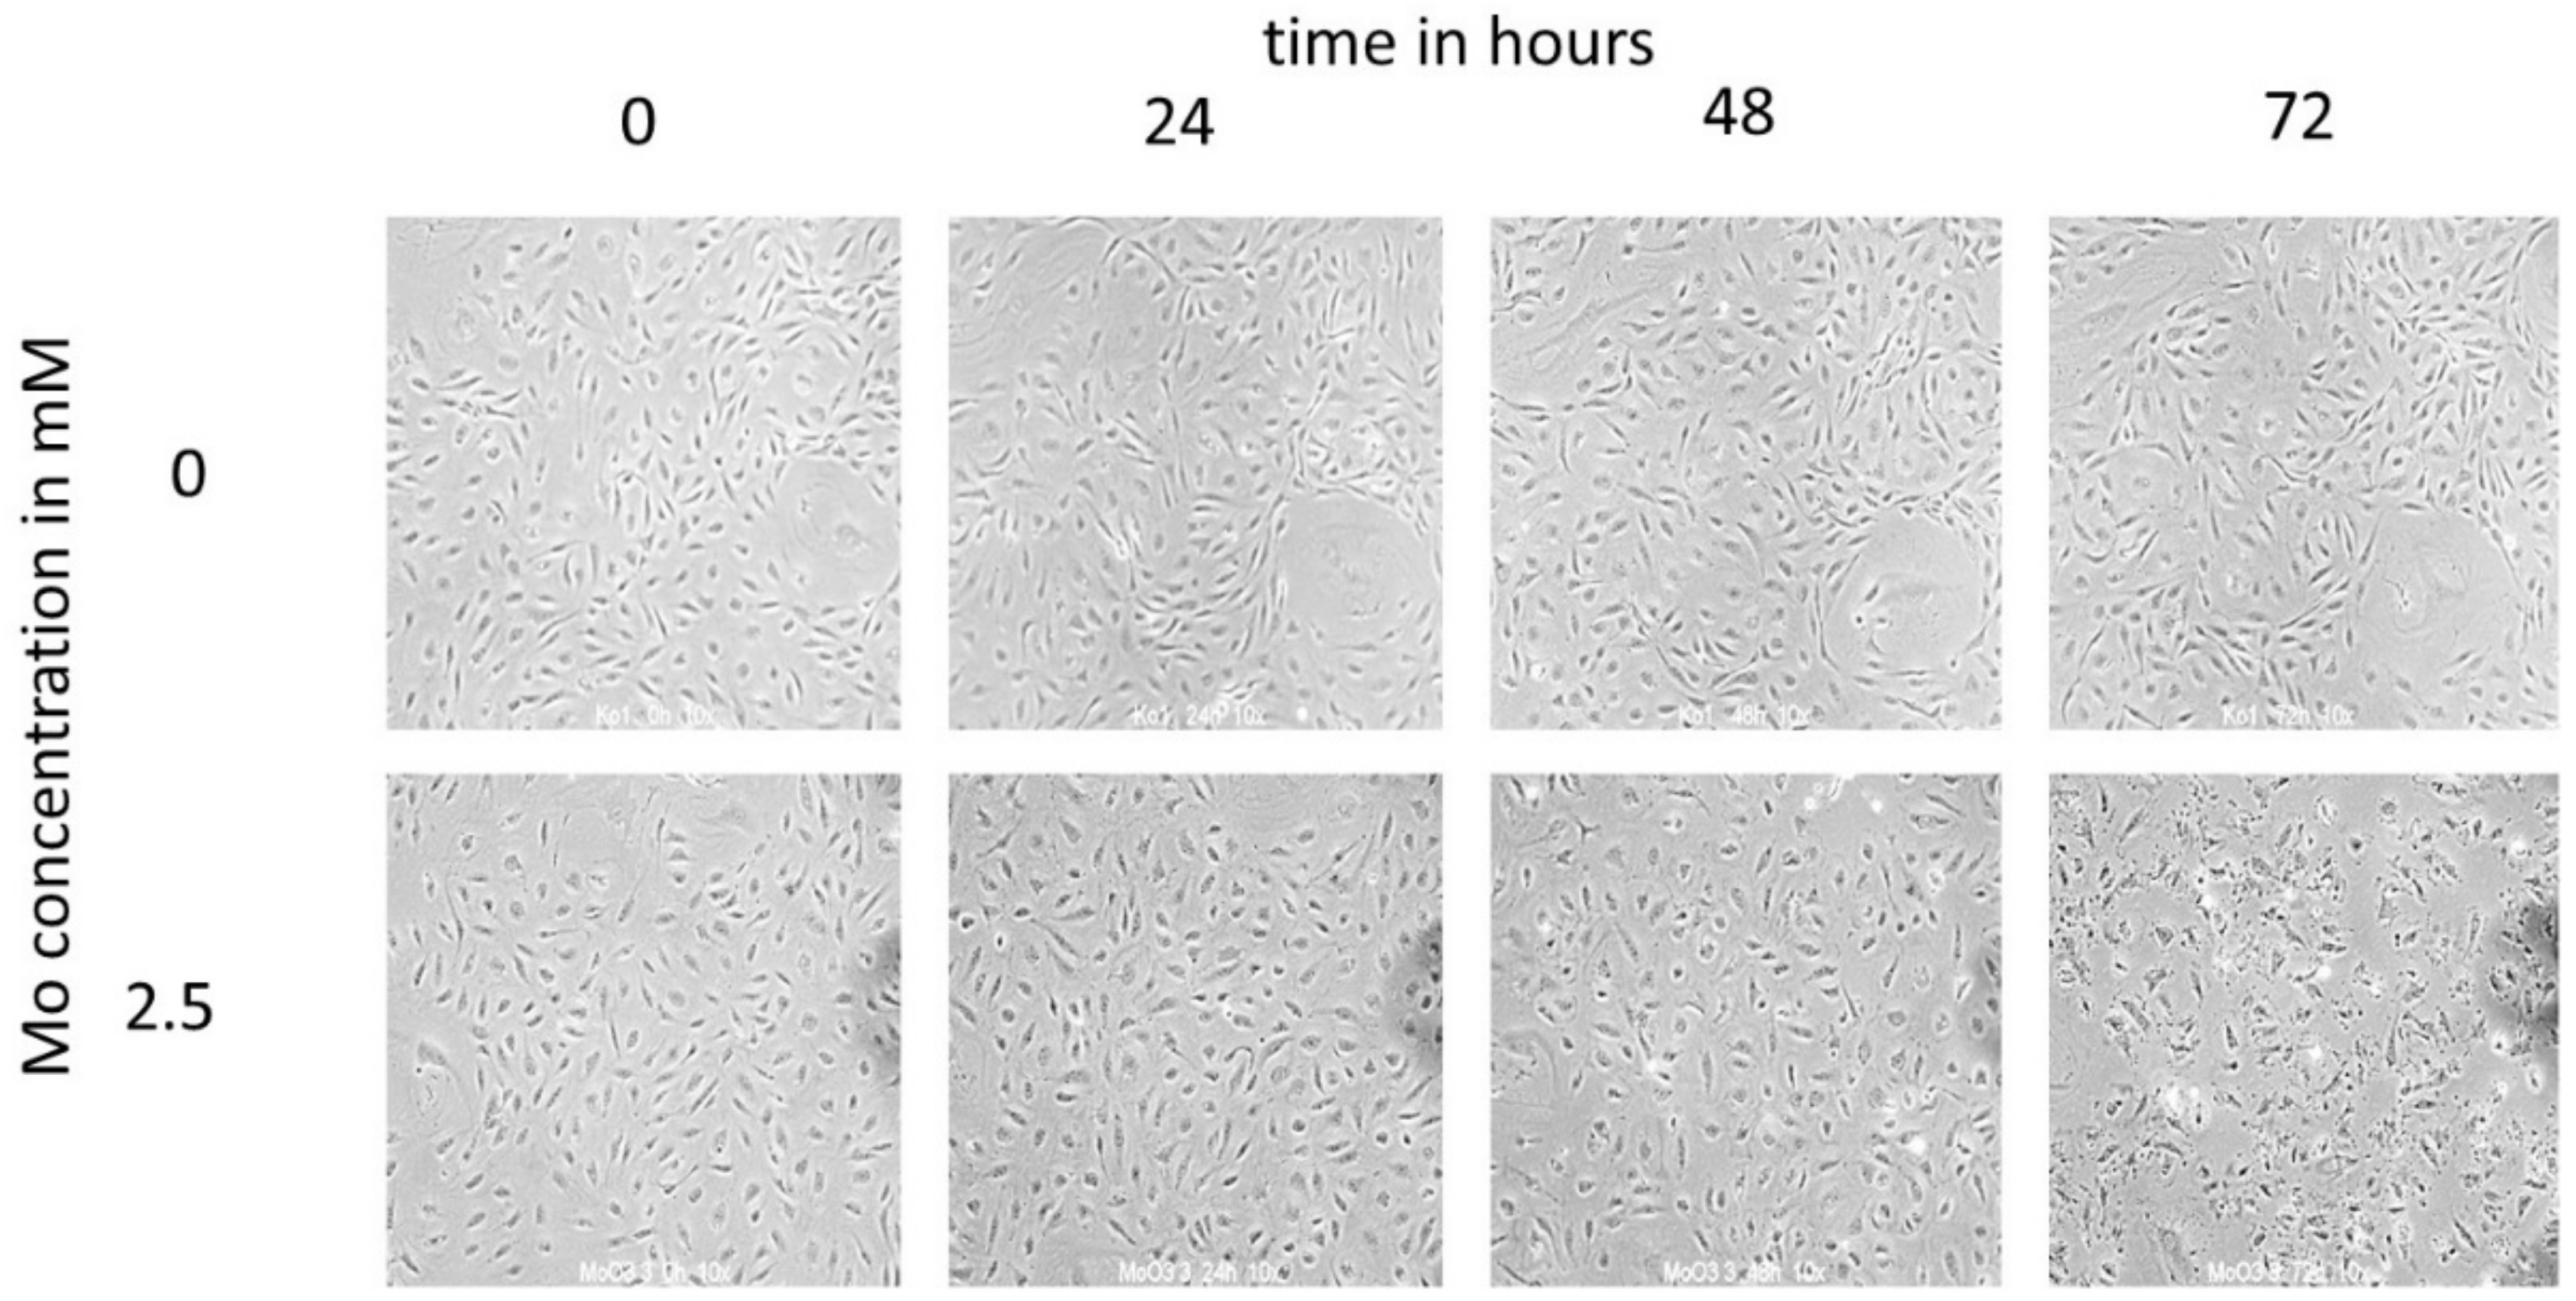
3.2.2. Cytotoxicity Time and Concentration Series

HCAECs cultured with different Mo ion concentrations at 37 °C for 0, 24, 48, and 72 h are depicted in Figure 4. While no difference was found between cells incubated with 0.16 mM, 0.63 mM, or 1.25 mM of Mo (15, 60, and 120 mg/L dissolved Mo, respectively) and untreated cells at all time points, the maximum Mo concentration of 2.5 mM (240 mg/L dissolved Mo) resulted in signs of beginning of cell death at 48 h (increased granularity) and signs of progressed cell death (shrinking, detaching) at 72 h. Since the only Mo concentration causing cell death is more than 3000-fold the calculated daily mass loss of PM Mo immersed in c-SBF-Ca (61 µg/d (0.64 µmol)), HCAECs seem to tolerate Mo well.

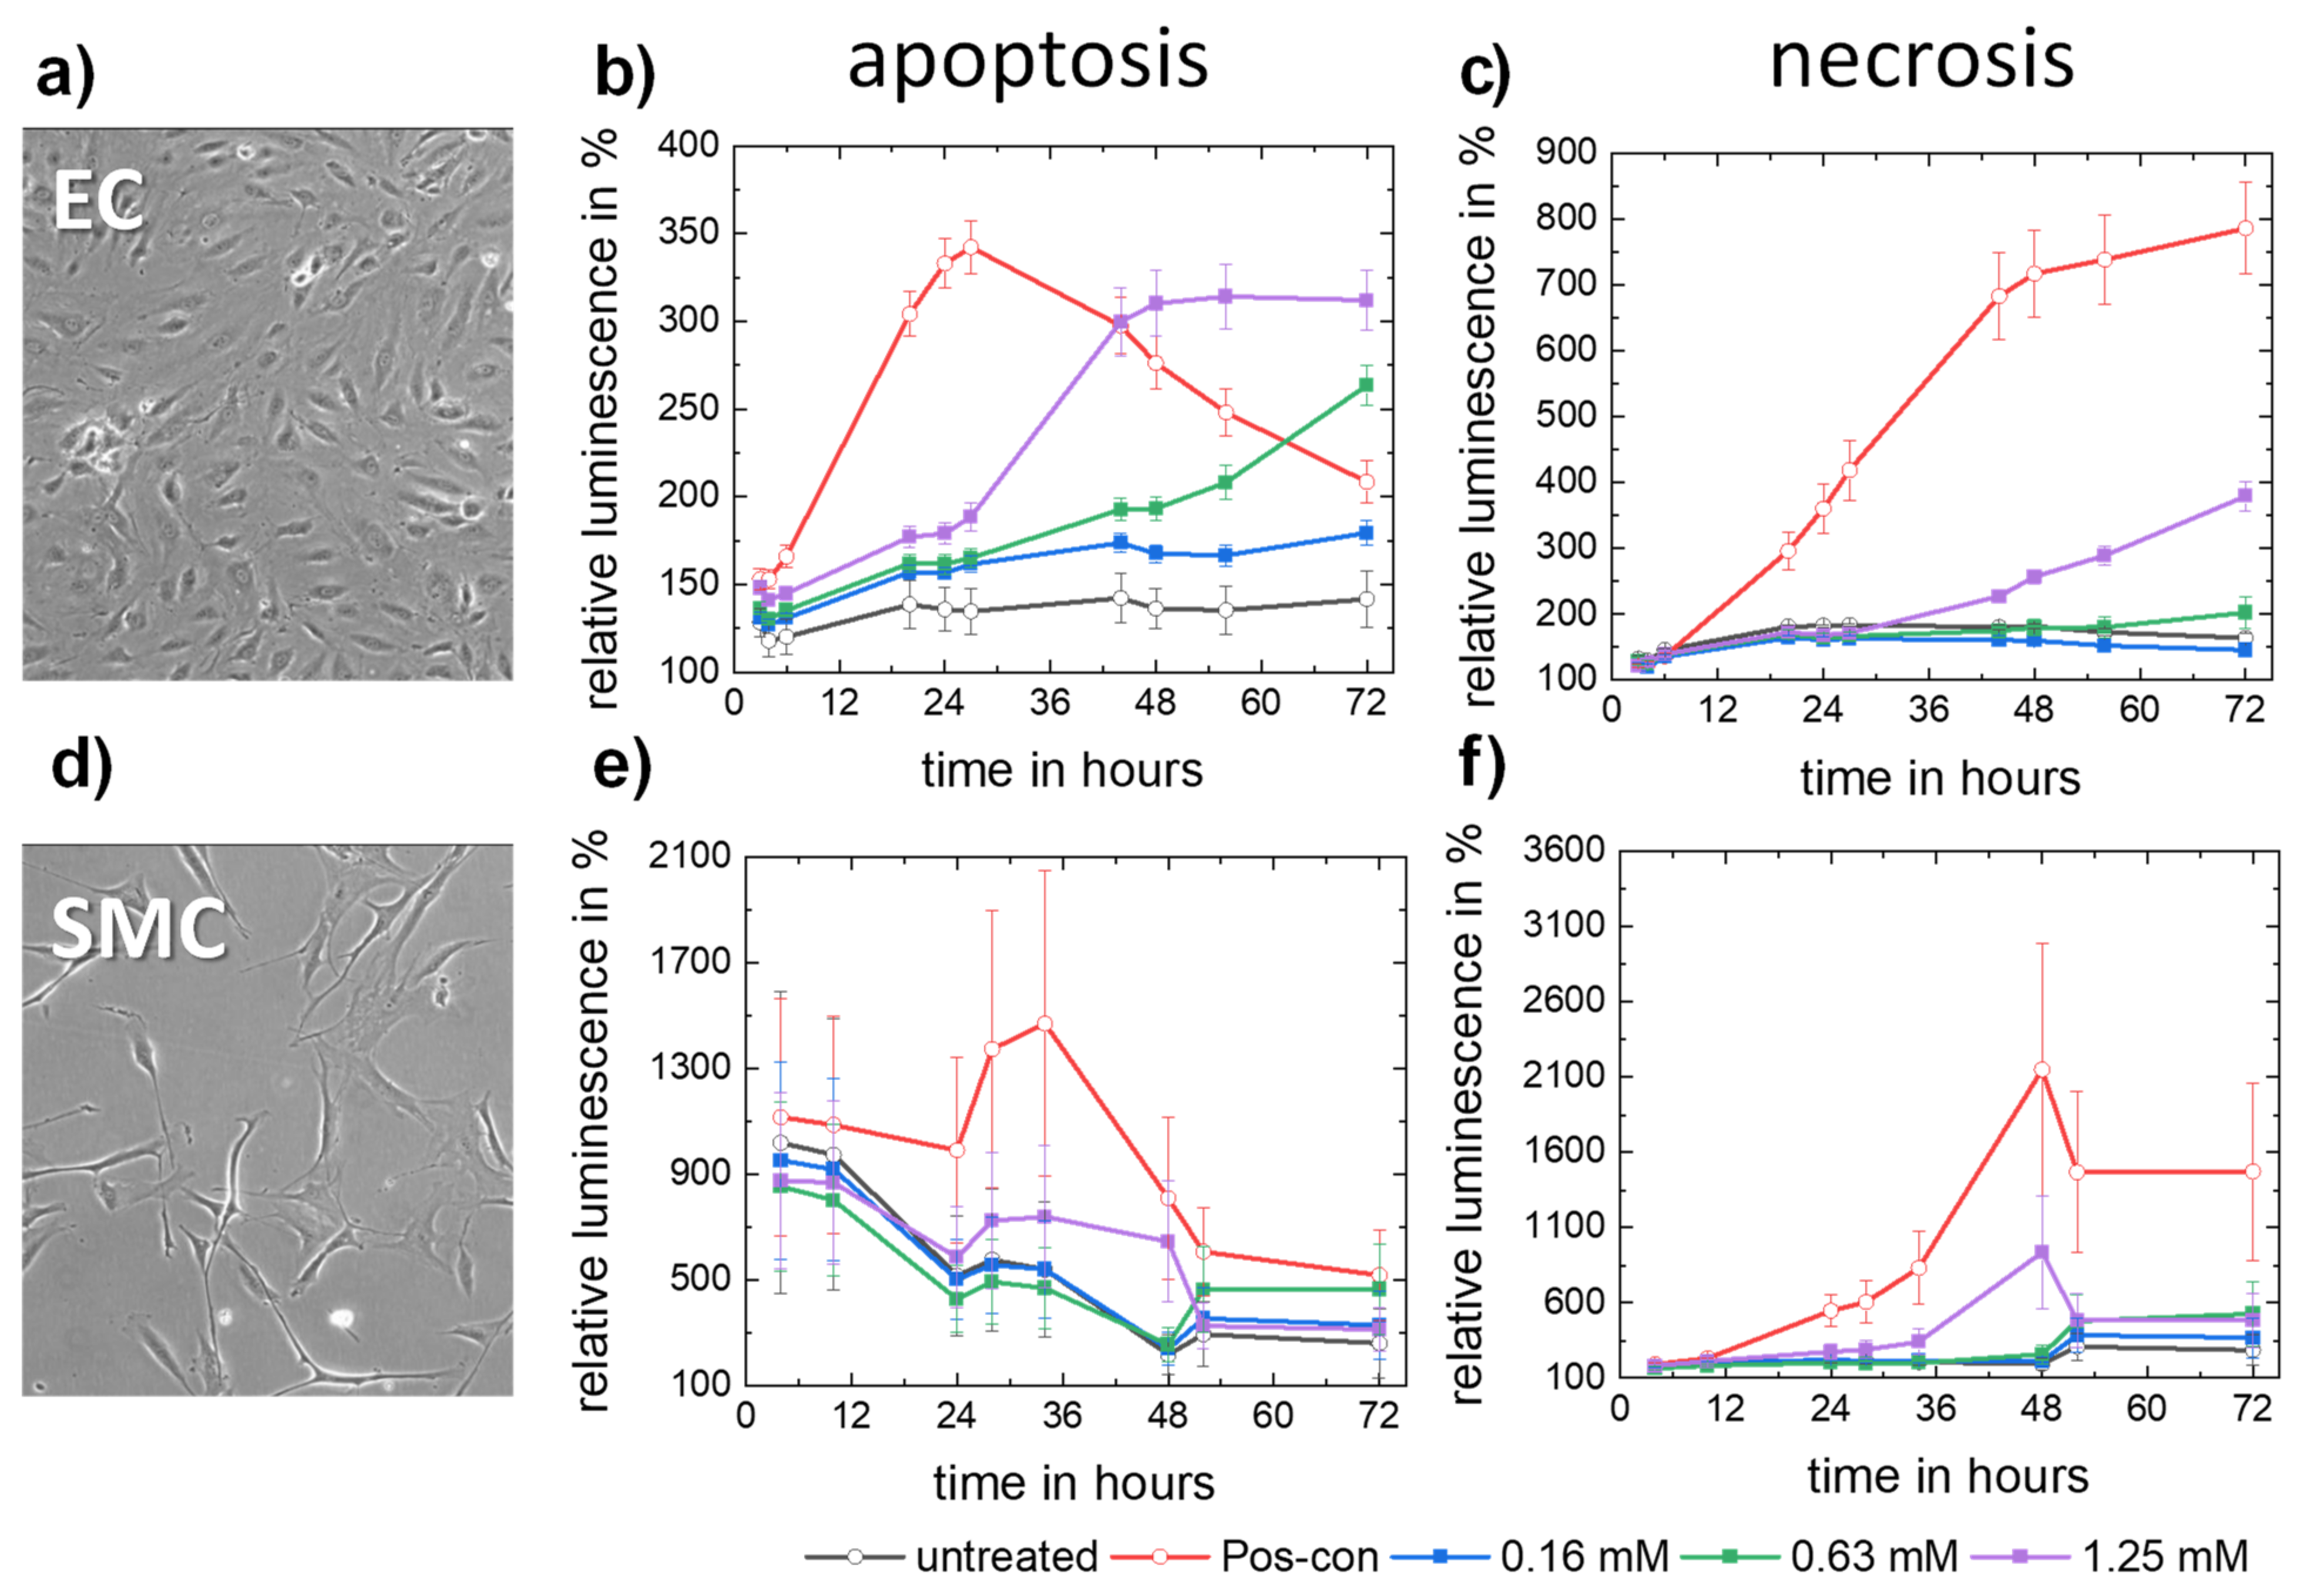
3.2.3. Apoptosis and Necrosis

Apoptosis and necrosis of HCAECs and HCASMCs were measured after different periods of incubation in cell medium with three different Mo ion concentrations. In the HCAEC culture (Figure 5a), the specimen incubated with the highest Mo concentration (1.25 mM) showed increased apoptosis compared to the untreated control, starting at the first time point of the measurement and becoming highly significant after 44 h (Figure 5a). Cells incubated with the second highest Mo concentration (0.63 mM) showed increased apoptosis after 44 h while the specimen incubated with the lowest Mo concentration (0.16 mM) did not differ from the untreated control. Increased necrosis was detected only for the specimen incubated with the highest Mo concentration after 44 h (Figure 5c).
In the HCASMC culture (Figure 5d), the apoptotic rate did not differ between the untreated and Mo-incubated cells (Figure 5e). A potentially increased apoptosis of HCASMCs incubated with the highest Mo concentration after 34 h was not significant due to large scattering of the values. Necrosis was slightly but non-significantly increased after 48 h of treatment with the highest Mo concentration (Figure 5f). Regarding HCAECs, enhanced apoptosis and necrosis were only observed at 1000-fold (0.63 mM) higher Mo concentrations compared to the calculated daily mass loss of PM Mo immersed in c-SBF-Ca (61 µg/d (0.64 µmol)). HCASMCs incubated with Mo did not differ from untreated control cells regarding apoptosis and necrosis at any time points and concentrations. These results suggest that Mo does not trigger cell death at physiologically relevant concentrations.

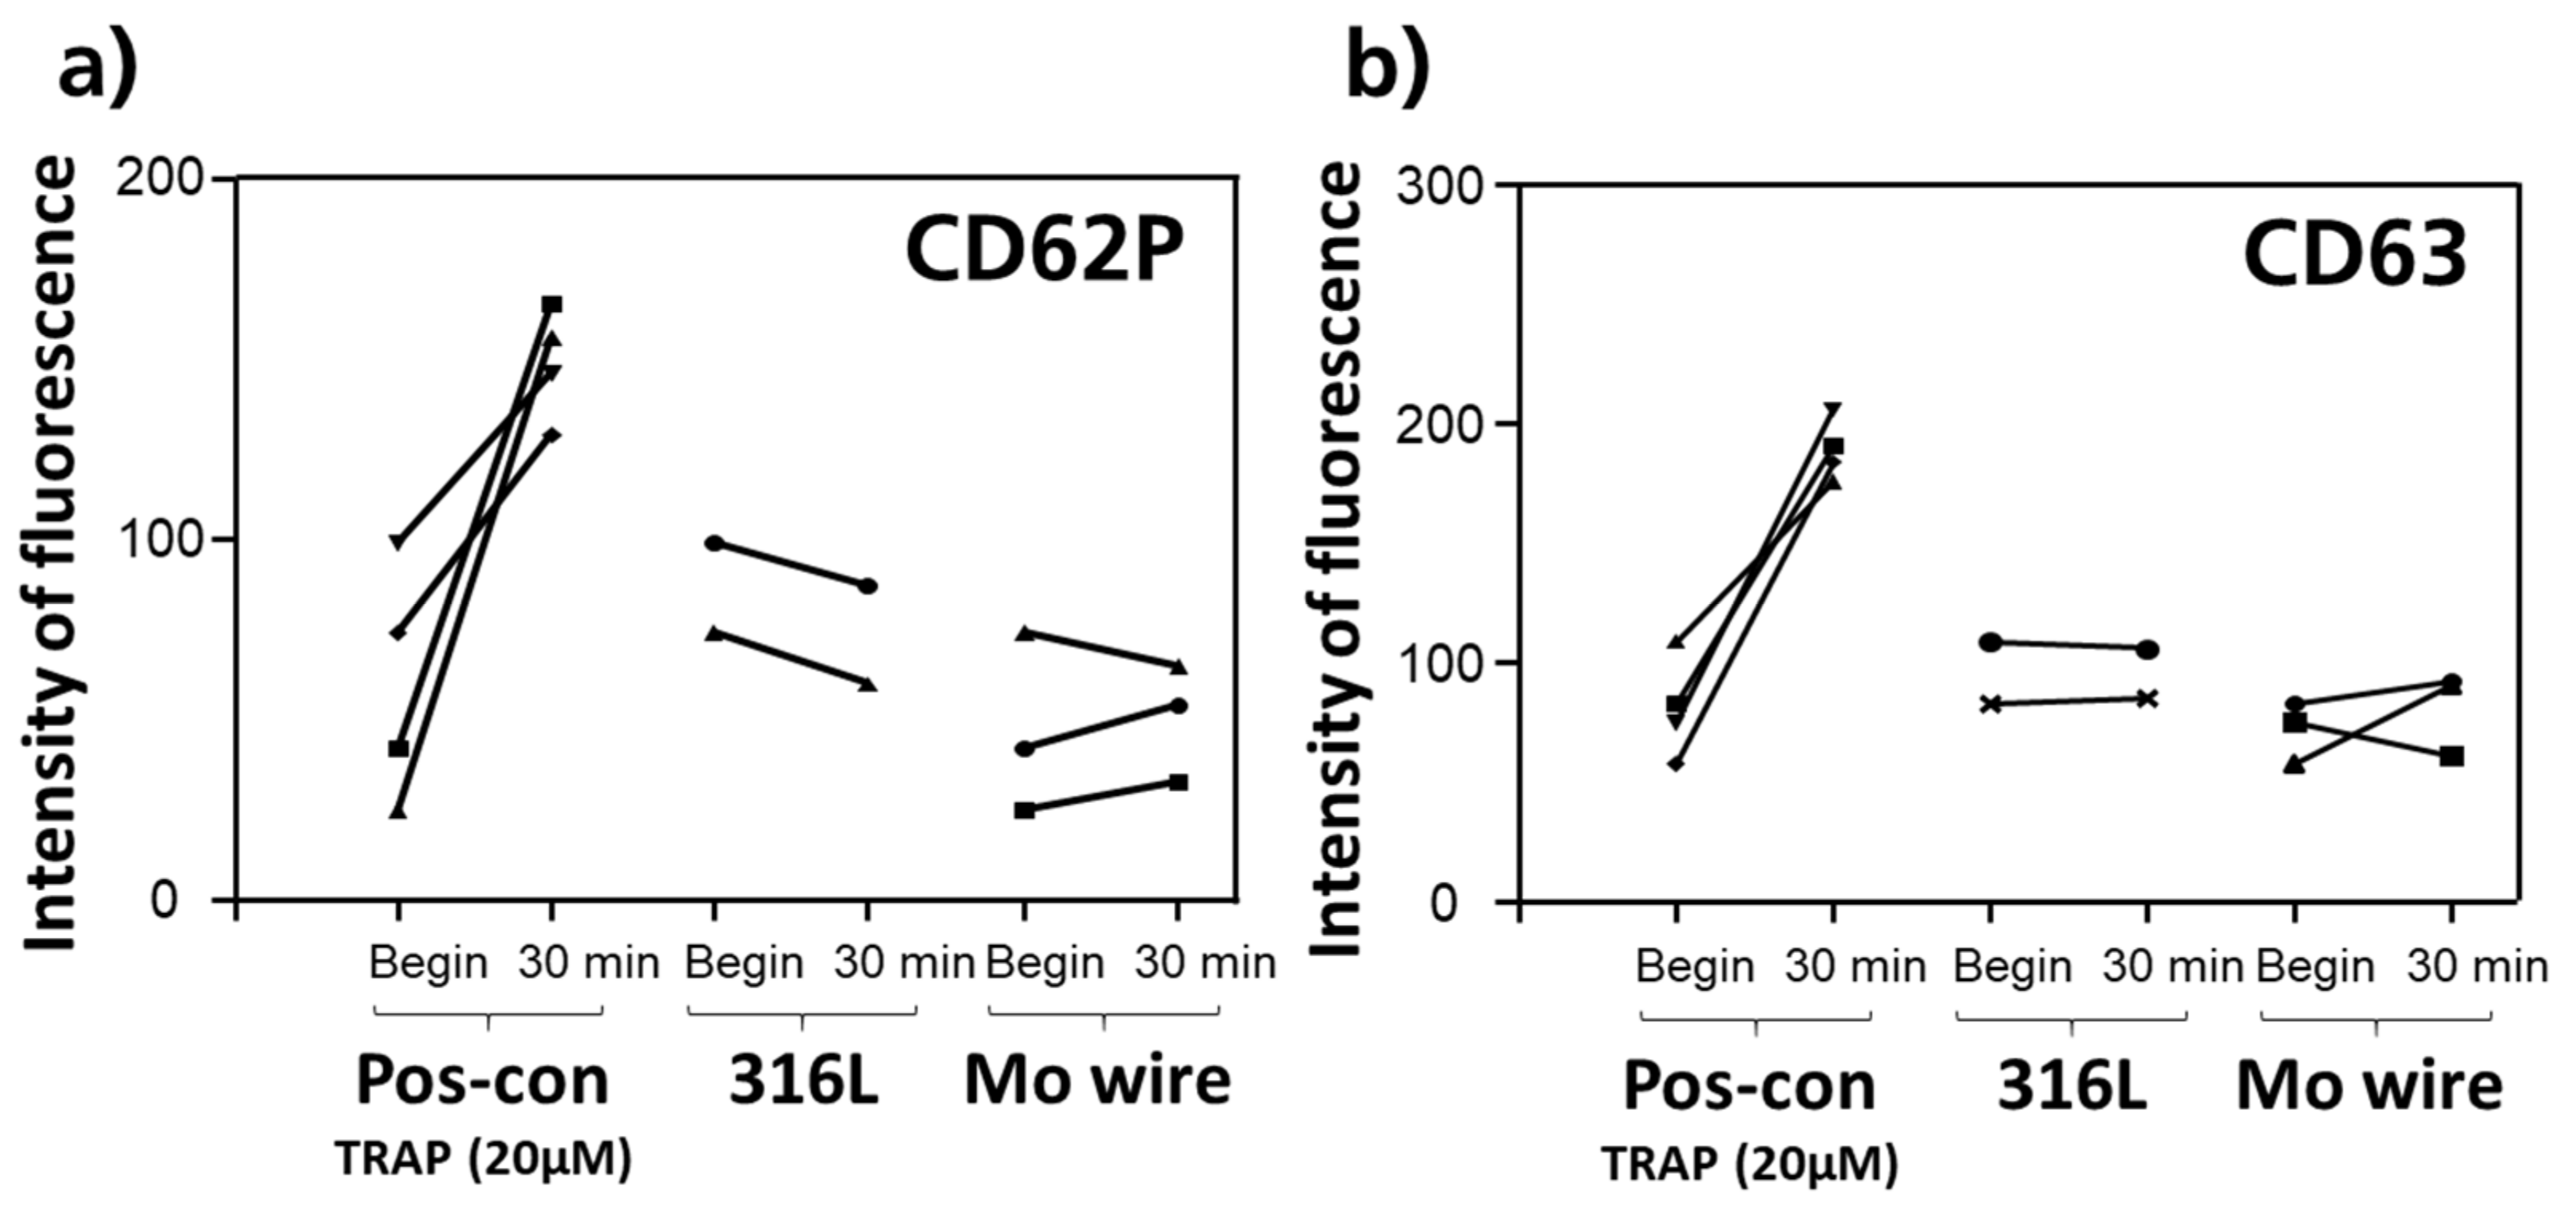
3.2.4. Thrombogenicity

Figure 6 shows the response of freshly isolated human thrombocytes toward 316L wire, Mo wire, and TRAP reference. Neither CD62P (Figure 6a) nor CD63 expression (Figure 6b) was stimulated by exposure to the metals, indicating no thrombocyte activation by 316L or Mo. These results are of particular importance regarding a potential use of Mo as a stent material since platelet activation after stenting is an early step in the initiation of neointimal hyperplasia. This term describes the uncontrolled migration and proliferation of smooth muscle cells at the site of stenting that can lead to a re-narrowing of the stented vessel (in-stent restenosis).

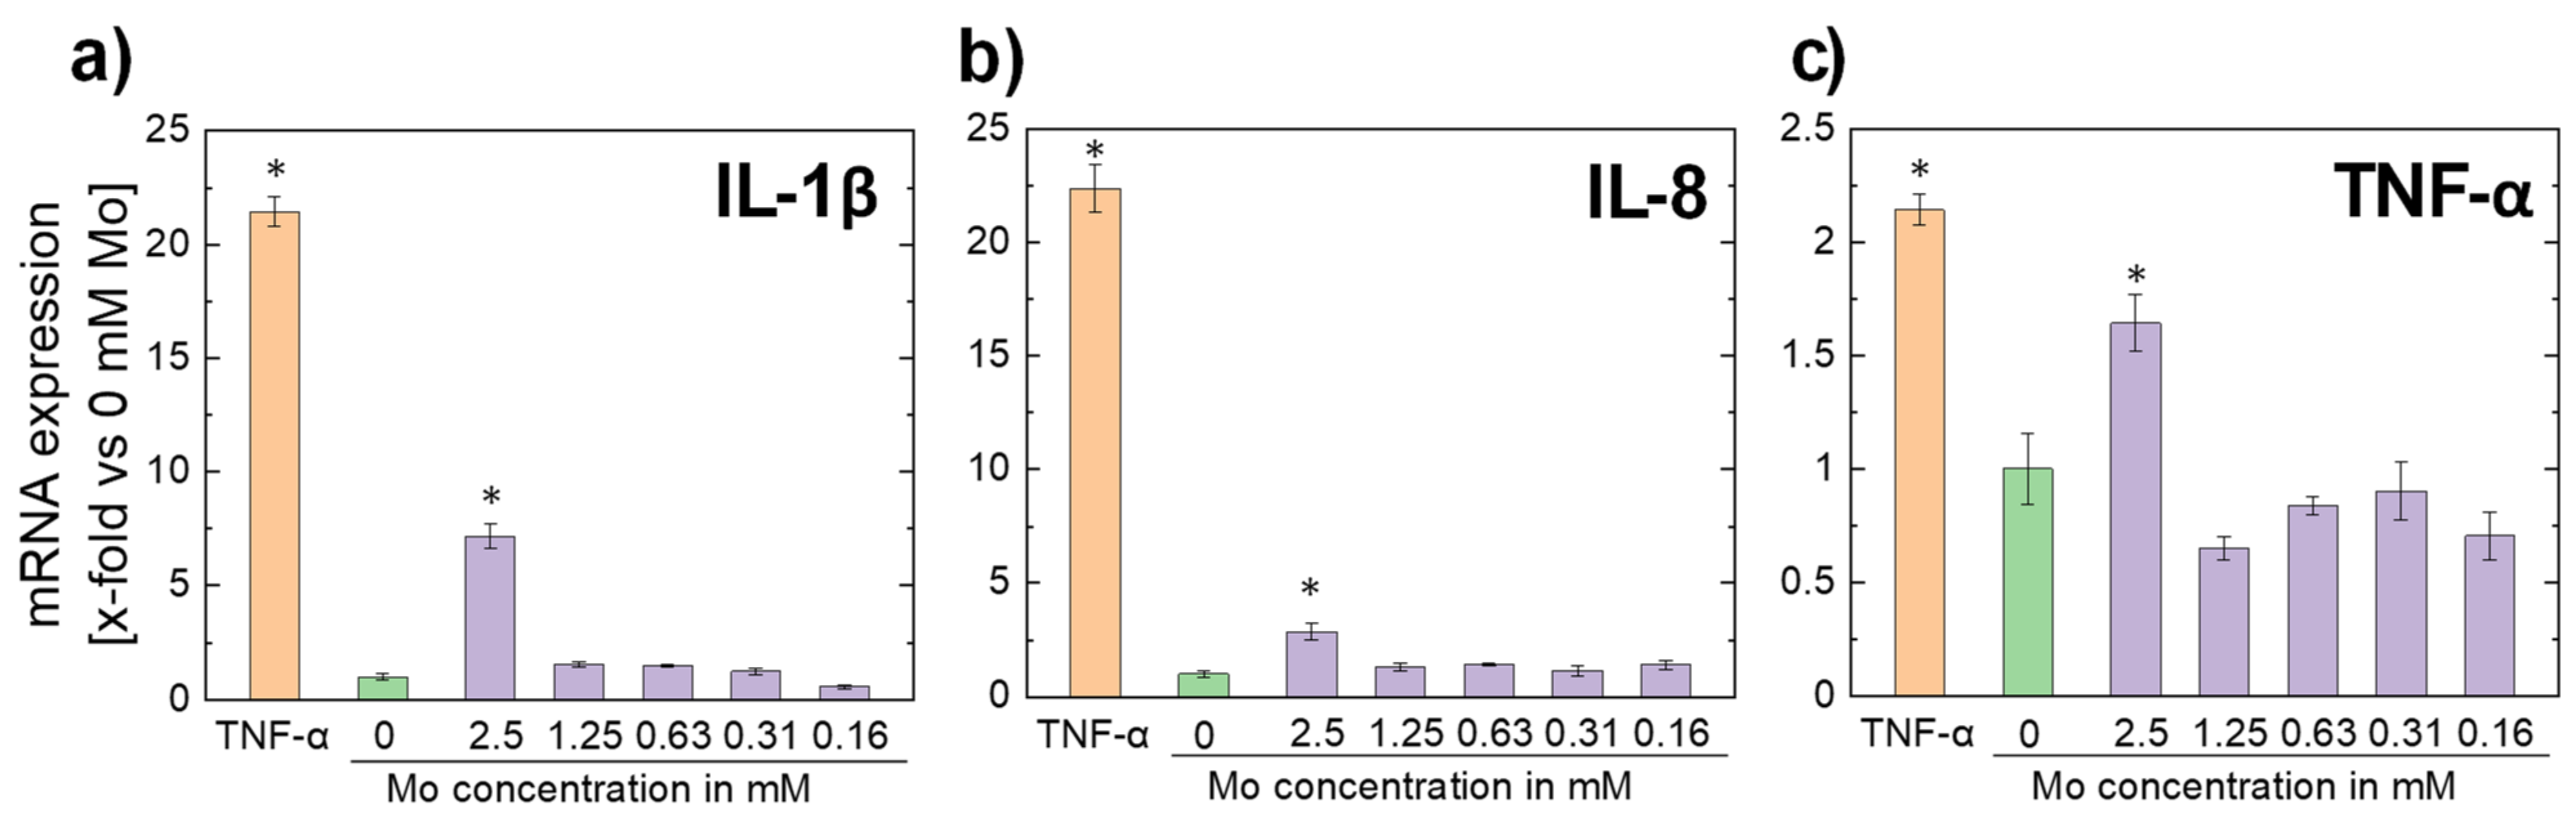
3.2.5. Inflammatory Response
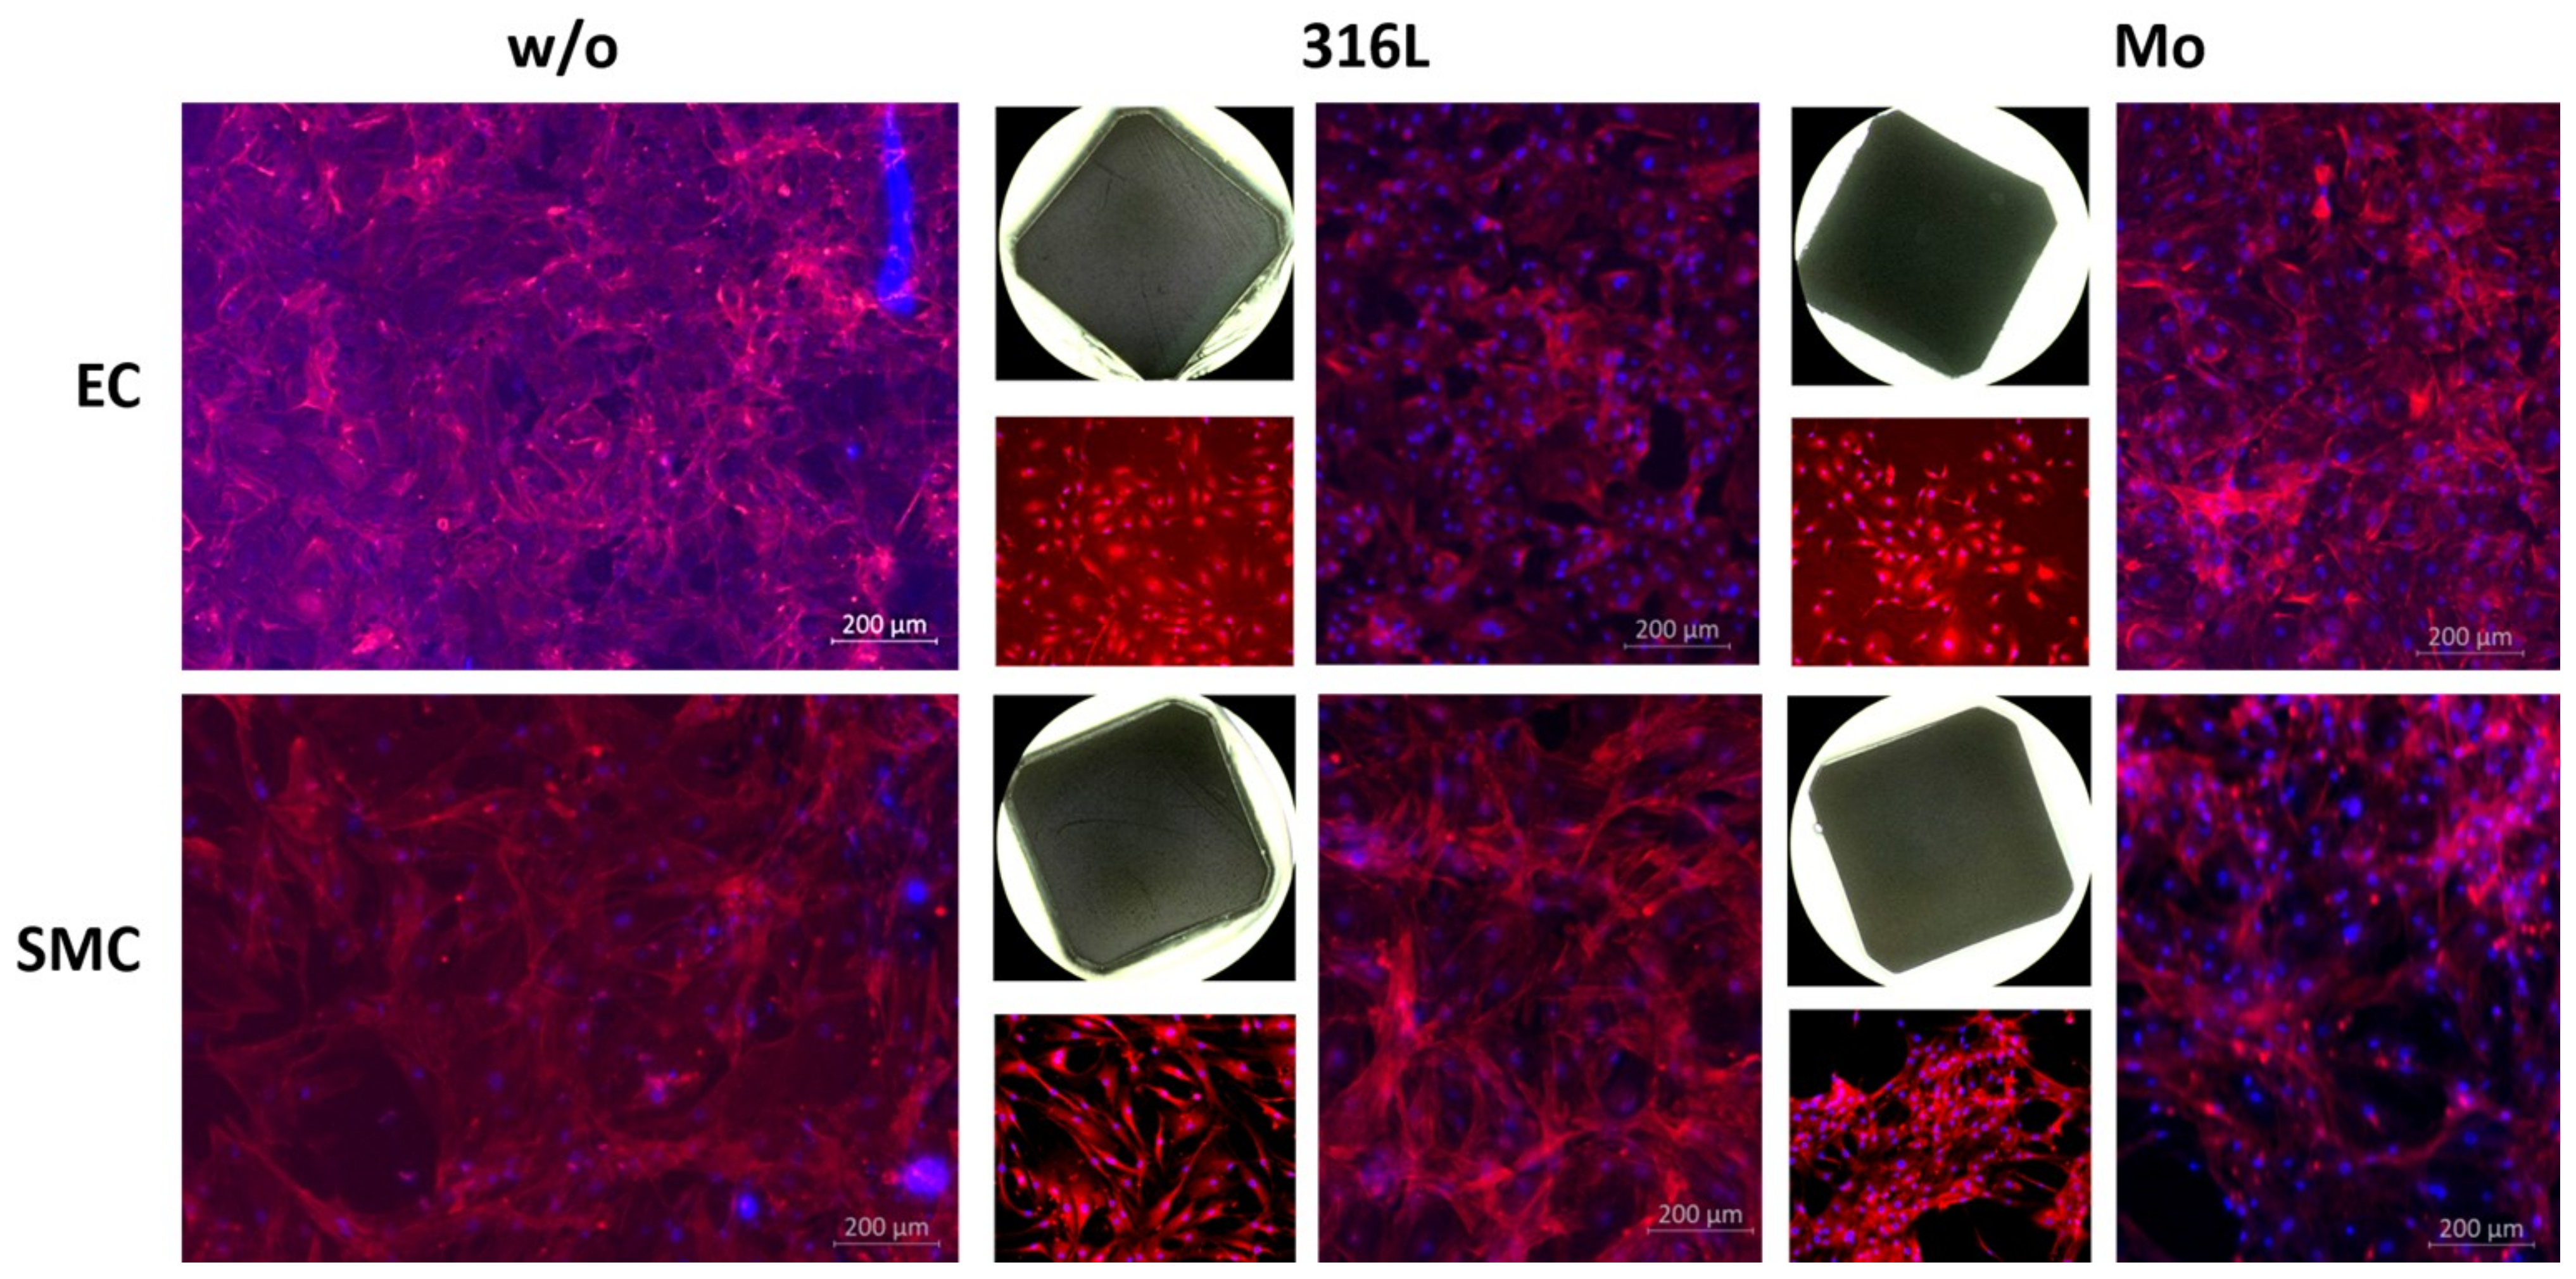
Figure 7 summarizes the expression of inflammatory markers of human monocytes (THP-1) incubated with different Mo ion concentrations for 24 h. Only cells treated with the highest Mo ion concentration (2.5 mM) showed increased expression of mRNA of all three cytokines. All specimens treated with lower Mo ion concentrations did not differ from the untreated control in terms of cytokine expression. Contrary to our results, Doghaither et al. demonstrated increased inflammation caused by 120 µM Mo in a murine pancreatic beta cell line after 24 h of incubation [38]. This discrepancy may be due to the different cell lines studied, but further studies on inflammatory responses triggered by Mo, preferably in vivo, will be necessary.

3.2.6. Colonization

Figure 8 shows the culture dishes either without metallic samples (reference) or with slices of PM 316L or PM Mo, incubated for 6 h with HCAECs or HCASMCs. Fluorescence microscopy reveals that cells of both types attach to the Mo and the 316L slices. This indicates a good colonizability of Mo which allows for the quick integration of a stent into the vessel wall. This is important because protruding stent struts disturb the blood flood which may cause clotting and lead to late stent thrombosis.

4. Conclusions

This study substantiates the following conclusions regarding the degradation behavior and biocompatibility of Mo:
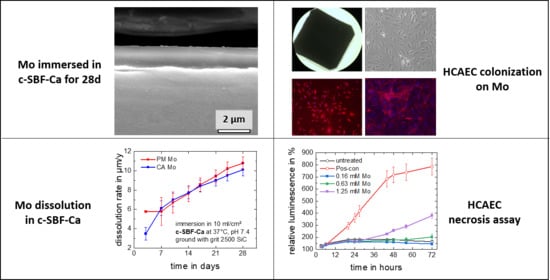
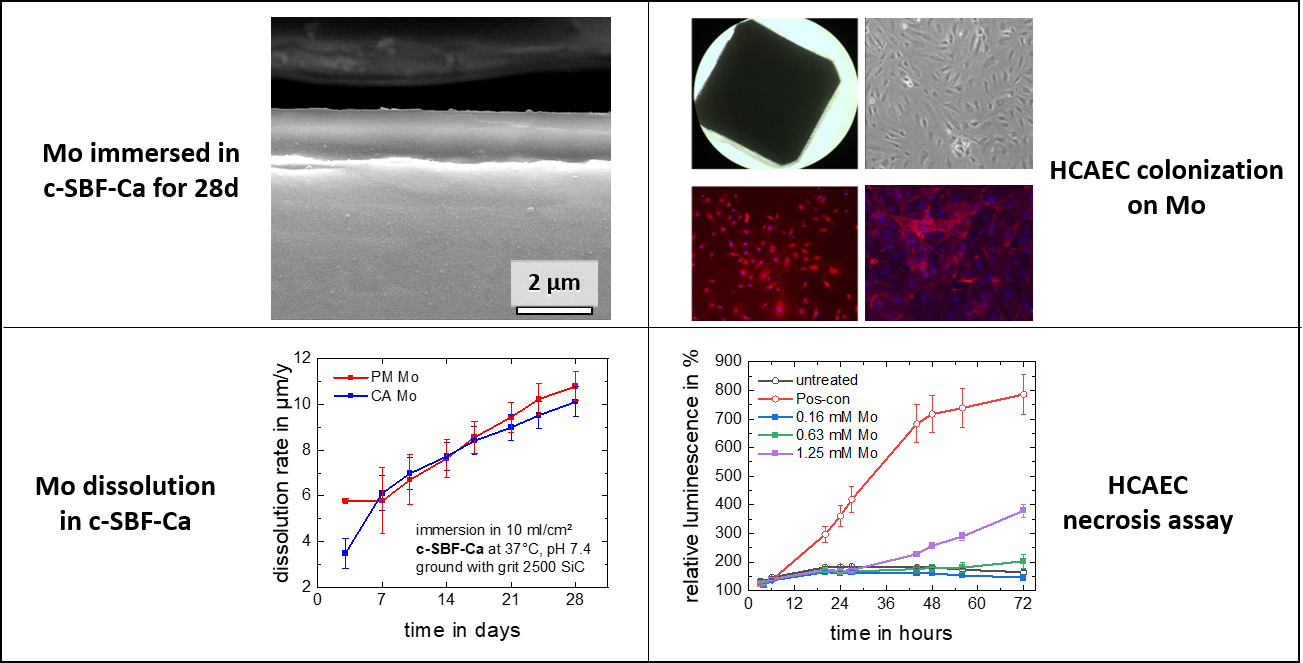
  • The corrosion attack on commercially available and powder metallurgically manufactured Mo in simulated physiological solution (c-SBF-Ca) is uniform over a period of 28 days and results in the formation of thin and non-passivating degradation product layers.
  • Mo dissolution rates increase over time and reach a rate of approx. 10 µm/y after 28 days of immersion in c-SBF-Ca for both materials. This is the suitable order of magnitude for an application in stents.
  • Molybdenum ion concentrations in the order of magnitude expected for a dissolving pure Mo stent do not trigger apoptosis or necrosis of human endothelial or smooth muscle cells.
  • Molybdenum does not activate thrombocytes, i.e., no significant thrombogenicity is expected for a Mo implant.
  • Molybdenum ion concentrations in the order of magnitude expected for a dissolving pure Mo stent do not trigger cytokine expression, i.e., an excessive immune reaction triggered by a Mo implant is unlikely.
  • Molybdenum is colonizable by human endothelial and smooth muscle cells, i.e., a Mo stent might become well integrated into the (cardiovascular) vessel walls.
In conclusion, molybdenum should be considered a promising material for bioresorbable implant applications due to the unique combination of extraordinary mechanical properties, uniform degradation, and good biocompatibility. Research on bioresorbable molybdenum should be advanced by long-term degradation assays and a first proof-of-principle animal study. Additional options for structural implant applications of Mo should also be investigated.

Author Contributions

Conceptualization, C.R. and A.S.; methodology, C.R., A.S., and G.P.; validation, J.S., P.B., and A.M.; data curation, C.R., A.S., and V.A.; writing—original draft preparation, C.R. and A.S.; writing—review and editing, G.P., V.A., P.Q.; visualization, C.R. and A.S.; supervision, A.L. and T.W.; project administration, P.Q., V.A.; funding acquisition, P.Q. All authors have read and agreed to the published version of the manuscript.

Funding

The authors gratefully acknowledge funding by the Sächsisches Staatsministerium für Wissenschaft, Kultur und Tourismus (SMWK) and Sächsische Aufbaubank (SAB) with European Financial Resources (EFRE), grant number 100345839.

Institutional Review Board Statement

Not applicable.

Informed Consent Statement

Not applicable.

Data Availability Statement

The data presented in this study are available on request from the corresponding author.

Conflicts of Interest

The authors declare no conflict of interest.

References

  1. Zheng, Y.F.; Gu, X.N.; Witte, F. Biodegradable metals. Mater. Sci. Eng. R. Rep. 2014, 77, 1–34. [Google Scholar] [CrossRef]
  2. Ding, Y.; Wen, C.; Hodgson, P.; Li, Y. Effects of alloying elements on the corrosion behavior and biocompatibility of biodegradable magnesium alloys: A review. J. Mater. Chem. B 2014, 2, 1912–1933. [Google Scholar] [CrossRef]
  3. Wang, J.-L.; Xu, J.-K.; Hopkins, C.; Chow, D.H.-K.; Qin, L. Biodegradable Magnesium-Based Implants in Orthopedics-A General Review and Perspectives. Adv. Sci. 2020, 7, 1902443. [Google Scholar] [CrossRef]
  4. Jafari, S.; Harandi, S.E.; Singh Raman, R.K. A Review of Stress-Corrosion Cracking and Corrosion Fatigue of Magnesium Alloys for Biodegradable Implant Applications. JOM 2015, 67, 1143–1153. [Google Scholar] [CrossRef]
  5. Francis, A.; Yang, Y.; Virtanen, S.; Boccaccini, A.R. Iron and iron-based alloys for temporary cardiovascular applications. J. Mater. Sci. Mater. Med. 2015, 26. [Google Scholar] [CrossRef]
  6. Gorejová, R.; Haverová, L.; Oriňaková, R.; Oriňak, A.; Oriňak, M. Recent advancements in Fe-based biodegradable materials for bone repair. J. Mater. Sci. 2019, 54, 1913–1947. [Google Scholar] [CrossRef]
  7. Pierson, D.; Edick, J.; Tauscher, A.; Pokorney, E.; Bowen, P.; Gelbaugh, J.; Stinson, J.; Getty, H.; Lee, C.H.; Drelich, J.; et al. A simplified in vivo approach for evaluating the bioabsorbable behavior of candidate stent materials. J. Biomed. Mater. Res. B Appl. Biomater. 2012, 100, 58–67. [Google Scholar] [CrossRef]
  8. Kraus, T.; Moszner, F.; Fischerauer, S.; Fiedler, M.; Martinelli, E.; Eichler, J.; Witte, F.; Willbold, E.; Schinhammer, M.; Meischel, M.; et al. Biodegradable Fe-based alloys for use in osteosynthesis: Outcome of an in vivo study after 52 weeks. Acta Biomater. 2014, 10, 3346–3353. [Google Scholar] [CrossRef] [PubMed]
  9. Wegener, B.; Sichler, A.; Milz, S.; Sprecher, C.; Pieper, K.; Hermanns, W.; Jansson, V.; Nies, B.; Kieback, B.; Müller, P.E.; et al. Development of a novel biodegradable porous iron-based implant for bone replacement. Sci. Rep. 2020, 10. [Google Scholar] [CrossRef] [PubMed]
  10. Bowen, P.K.; Drelich, J.; Goldman, J. Zinc exhibits ideal physiological corrosion behavior for bioabsorbable stents. Adv. Mater. 2013, 25, 2577–2582. [Google Scholar] [CrossRef] [PubMed]
  11. Venezuela, J.; Dargusch, M.S. The influence of alloying and fabrication techniques on the mechanical properties, biodegradability and biocompatibility of zinc: A comprehensive review. Acta Biomater. 2019, 87, 1–40. [Google Scholar] [CrossRef] [PubMed] [Green Version]
  12. Yang, H.; Jia, B.; Zhang, Z.; Qu, X.; Li, G.; Lin, W.; Zhu, D.; Dai, K.; Zheng, Y. Alloying design of biodegradable zinc as promising bone implants for load-bearing applications. Nat. Commun. 2020, 11. [Google Scholar] [CrossRef] [Green Version]
  13. Poncin, P.; Proft, J. Stent Tubing: Understanding the Desired Attributes. Mater. Proc. Med. Dev. Conf. 2003. [Google Scholar] [CrossRef]
  14. Leichtfried, G.; Schneibel, J.H.; Heilmaier, M. Ductility and impact resistance of powder-metallurgical molybdenum-rhenium alloys. Metal. Mat. Trans. A 2006, 37, 2955–2961. [Google Scholar] [CrossRef]
  15. Redlich, C.; Quadbeck, P.; Thieme, M.; Kieback, B. Molybdenum—A biodegradable implant material for structural applications? Acta Biomater. 2020, 104, 241–251. [Google Scholar] [CrossRef]
  16. Yin, L.; Cheng, H.; Mao, S.; Haasch, R.; Liu, Y.; Xie, X.; Hwang, S.-W.; Jain, H.; Kang, S.-K.; Su, Y.; et al. Dissolvable Metals for Transient Electronics. Adv. Funct. Mater. 2014, 24, 645–658. [Google Scholar] [CrossRef]
  17. Badawy, W.A.; Al-Kharafi, F.M. Corrosion and passivation behaviors of molybdenum in aqueous solutions of different pH. Electrochim. Acta 1998, 44, 693–702. [Google Scholar] [CrossRef]
  18. Shaldaev, V.S.; Malofeeva, A.N.; Davydov, A.D. Determination of corrosion rate of molybdenum, rhenium and their alloys in sodium chloride solution by the method of Tafel extrapolation. Russ. J. Electrochem. 2014, 50, 994–998. [Google Scholar] [CrossRef]
  19. De Rosa, L.; Tomachuk, C.R.; Springer, J.; Mitton, D.B.; Saiello, S.; Bellucci, F. The wet corrosion of molybdenum thin film–. Part I: Behavior at 25 °C. Mater. Corros. 2004, 55, 602–609. [Google Scholar] [CrossRef]
  20. Mörsdorf, A.; Odnevall Wallinder, I.; Hedberg, Y. Bioaccessibility of micron-sized powder particles of molybdenum metal, iron metal, molybdenum oxides and ferromolybdenum--Importance of surface oxides. Regul. Toxicol. Pharmacol. 2015, 72, 447–457. [Google Scholar] [CrossRef] [Green Version]
  21. Petrova, M.; Bojinov, M.; Zanna, S.; Marcus, P. Mechanism of anodic oxidation of molybdenum in nearly-neutral electrolytes studied by electrochemical impedance spectroscopy and X-ray photoelectron spectroscopy. Electrochim. Acta 2011, 56, 7899–7906. [Google Scholar] [CrossRef]
  22. Johnson, J.W.; Chi, C.H.; Chen, C.K.; James, W.J. The Anodic Dissolution of Molybdenum. Corrosion 1970, 26, 338–342. [Google Scholar] [CrossRef]
  23. Pourbaix, M. (Ed.) Atlas of Electrochemical Equilibria in Aqueous Solutions, 2nd ed.; NACE International: Houston, TX, USA, 1974; ISBN 0915567989. [Google Scholar]
  24. Schwarz, G.; Mendel, R.R.; Ribbe, M.W. Molybdenum cofactors, enzymes and pathways. Nature 2009, 460, 839–847. [Google Scholar] [CrossRef]
  25. Turnlund, J.R.; Keyes, W.R.; Peiffer, G.L.; Chiang, G. Molybdenum absorption, excretion, and retention studied with stable isotopes in young men during depletion and repletion. Am. J. Clin. Nutr. 1995, 61, 1102–1109. [Google Scholar] [CrossRef] [PubMed]
  26. Kovalskii, V.V.; Iarovaia, G.A.; Shmavonyan, D.M. Modification of human and animal purine metabolism in conditions of various molybdenum bio-geochemical areas. Zhurnal Obs. Biol. 1961, 22, 179–191. [Google Scholar]
  27. Vyskočil, A.; Viau, C. Assessment of molybdenum toxicity in humans. J. Appl. Toxicol. 1999, 19, 185–192. [Google Scholar] [CrossRef]
  28. Molčilović, B. (Ed.) Dietary intakes of trace elements and related nutrients in eleven countries: Preliminary results from an International Atomic Energy Agency (IAEA) coordinated research programme. In Trace Elements in Man and Animals 7; Inst. for Medical Research and Occupational Health, University Zaqreb: Zagreb, Croatia, 1991; ISBN 8681477021. [Google Scholar]
  29. Caicedo, M.; Jacobs, J.J.; Reddy, A.; Hallab, N.J. Analysis of metal ion-induced DNA damage, apoptosis, and necrosis in human (Jurkat) T-cells demonstrates Ni2+ and V3+ are more toxic than other metals: Al3+, Be2+, Co2+, Cr3+, Cu2+, Fe3+, Mo5+, Nb5+, Zr2+. J. Biomed. Mater. Res. Part A 2008, 86, 905–913. [Google Scholar] [CrossRef]
  30. Daley, B.; Doherty, A.T.; Fairman, B.; Case, C.P. Wear debris from hip or knee replacements causes chromosomal damage in human cells in tissue culture. J. Bone Jt. Surg. 2004, 86, 598–606. [Google Scholar] [CrossRef]
  31. Okazaki, Y.; Rao, S.; Asao, S.; Tateishi, T. Effects of Metallic Concentrations Other Than Ti, Al and V on Cell Viability. Mater. Trans. JIM 1998, 39, 1070–1079. [Google Scholar] [CrossRef] [Green Version]
  32. Yamamoto, A.; Honma, R.; Sumita, M. Cytotoxicity evaluation of 43 metal salts using murine fibroblasts and osteoblastic cells. J. Biomed. Mater. Res. 1998, 39, 331–340. [Google Scholar] [CrossRef]
  33. Hallab, N.J.; Vermes, C.; Messina, C.; Roebuck, K.A.; Glant, T.T.; Jacobs, J.J. Concentration- and composition-dependent effects of metal ions on human MG-63 osteoblasts. J. Biomed. Mater. Res. 2002, 60, 420–433. [Google Scholar] [CrossRef] [PubMed]
  34. Kokubo, T.; Takadama, H. How useful is SBF in predicting in vivo bone bioactivity? Biomaterials 2006, 27, 2907–2915. [Google Scholar] [CrossRef]
  35. ASTM G31-72. Standard Practice for Laboratory Immersion Corrosion Testing of Metals; ASTM: West Conshohocken, PA, USA, 2004. [Google Scholar]
  36. Nikolaychuk, P.A.; Tyurin, A.G. The Revised Pourbaix Diagram for Molybdenum. Butl. Commun. 2011, 24, 101–105. [Google Scholar]
  37. Kumar, A.; Eyre, B.L. Grain boundary segregation and intergranular fracture in molybdenum. Proc. R. Soc. Lond. A 1980, 370, 431–458. [Google Scholar] [CrossRef]
  38. Al Doghaither, H.; Elmorsy, E.; Al-Ghafari, A.; Ghulam, J. Roles of oxidative stress, apoptosis, and inflammation in metal-induced dysfunction of beta pancreatic cells isolated from CD1 mice. Saudi J. Biol. Sci. 2021, 28, 651–663. [Google Scholar] [CrossRef] [PubMed]
Figure 1. Representative OCP (a) and LSV measurements (b) for CA and PM Mo in c-SBF-Ca.
Metals 11 00761 g001
Figure 2. PM Mo sample in sample holder (a), photographs of corroded PM Mo (b) and CA Mo (c), optical micrographs of microstructure (d,g), corroded surface (e,h), and cross section (f,i) of PM Mo and CA Mo, respectively, after 28 days immersion in c-SBF-Ca.
Metals 11 00761 g002
Figure 3. Ion concentration-derived progression of mass loss (a) and dissolution rates (b) for CA Mo and PM Mo over 28 days of immersion in c-SBF-Ca.
Metals 11 00761 g003
Figure 4. Time series of untreated HCAECs (upper row) and HCAECs treated with 2.5 mM Mo ion concentration (lower row). ECs first showed visible signs of cell death, like increased granularity, after 48 h. Signs of progressed cell death (shrinking, detaching) were observed after 72 h of incubation at this concentration.
Metals 11 00761 g004
Figure 5. Apoptosis and necrosis of HCAECs and HCASMCs after incubation with Mo ion-containing cell media. HCAEC ((a), Brightfield microscopy) showed a three-fold increased apoptotic rate after 48 h incubation with the highest Mo concentration (b) while necrosis was first enhanced at 44 h (c). In HCASMC ((d), Brightfield microscopy) apoptosis is slightly enhanced after 34 h at the highest Mo concentration (e) while a slightly but non-significantly enhanced necrotic rate was only observed at 48 h at the highest Mo concentration (f). n = 6.
Metals 11 00761 g005
Figure 6. Thrombogenicity assay with human thrombocytes. The expression of the activation markers CD62P (a) and CD63 (b) was not triggered by a 30-min incubation with 316L wire or Mo wire. n = 2–4.
Metals 11 00761 g006
Figure 7. Expression of inflammation markers by human monocytes 24 h after incubation with different Mo ion concentrations. Significantly enhanced expression levels of IL-1β (a), IL-8 (b), and TNF-α (c) were only measured in cells treated with the highest Mo ion concentration (2.5 mM), while all cells incubated with lower Mo ion concentrations did not differ from the untreated control. Incubation with TNF-α (10 ng/mL) served as the positive control (n = 2, * p < 0.05 vs. 0 mM Mo).
Metals 11 00761 g007
Figure 8. Colonialization of metal slices (Mo and 316L) by HCAECs or HCASMCs compared to culture dishes without metallic samples (w/o). In case of either metal, fluorescence microscopy reveals attached cells after 6 h of incubation.
Metals 11 00761 g008
Table 1. Composition of commercially available material used (as specified by the manufacturer). If not otherwise indicated, values are given as ppm.
MaterialAlCrCuFeMnNiSiWOMo
Mo powder <50 <100 <50<30 2500Bal.
CA Mo<20<50<20<50<10<20<30 Bal.
Mo wire<10<20<20<20 <10<20<300<40Bal.
316L powder 17.72% Bal.0.09%12.23%3400 28002.08%
316L wire 17.34%540Bal.1.86%13.68%4900 2.9%
Table 2. Composition of c-SBF-Ca.
Reagent [g/L]Ion Concentration [mM]
NaCl7.996Na+142.0
NaHCO30.350K+5.0
KCl0.224Mg2+1.5
K H2PO4·3H2O0.228Ca2+1.2
MgCl2·6H2O0.305Cl147.8
CaCl20.139HCO34.2
Na2SO40.071HPO42−1.0
TRIS (CH2OH)3CNH26.057SO42−0.5
1 M HCl40 ml
Table 3. List of primers for qRT-PCR.
Gene Primer 1Primer 2Gene Bank ID
IL-1βCAG TGG CAA TGA GGA TGA CATC GTG CAC ATA AGC CTC GNM_000576
IL-8GGA CAA GAG CCA GGA AGA AAC CCTT CAA AAA CTT CTC CAC AACXM_031289
TNF-αGGCAGT CAG ATC ATC TTC TCGAT AGA TGG GCT CAT ACC AGNM_000594
HPRT-1CTT TGC TGA CCT GCT GGA TTA CTTG CGA CCT TGA CCA TCT TTGNM_000194
Table 4. Measurement data for electrochemical analyses on pure molybdenum.
MaterialOCP [mV]Ekorr [mV]ikorr [µA/cm2]vkorr [µm/y]ba [mV/dec]bk [mV/dec]
CA Mo−302 ± 2.7−306.3 ± 4.91.11 ± 0.315.7 ± 1.271.3 ± 1.5 −149.0 ± 8.4
PM Mo−310.3 ± 1.2−312.3 ± 0.81.39 ± 0.047.1 ± 0.171.7 ± 1.5−139.6 ± 6.4
Table 5. Results of EDX analyses at locations indicated in Figure 2f,i.
wt. %ONa MgPCaMo
113.8 2.04.280.0
212.4 87.6
310.7 89.3
4 100.0
519.80.90.83.36.768.5
6 100.0
Publisher’s Note: MDPI stays neutral with regard to jurisdictional claims in published maps and institutional affiliations.

