
Effect of Scanning Strategy in the L-PBF Process of 18Ni300 Maraging Steel


1
Department of Industrial Engineering, School of Engineering, University of Bologna, Viale del Risorgimento 2, 40136 Bologna, Italy
2
Materials and Manufacturing, School of Engineering, Jönköping University, P.O. Box 1026, 551 11 Jönköping, Sweden
3
Product Development, School of Engineering, Jönköping University, P.O. Box 1026, 551 11 Jönköping, Sweden
*
Author to whom correspondence should be addressed.
Metals 2021, 11(5), 826; https://0-doi-org.brum.beds.ac.uk/10.3390/met11050826
Submission received: 22 February 2021
/
Revised: 5 May 2021
/
Accepted: 12 May 2021
/
Published: 18 May 2021
(This article belongs to the Section Additive Manufacturing)
Abstract
:Maraging steels are good candidates for the laser powder bed fusion process (L-PBF), also known as Selective Laser Melting, due to excellent weldability and resistance to quench cracking. Powders physical and chemical characteristics dominate the final microstructure and properties of the printed parts, that are also heavily influenced by the process parameters. In this study, the effects of the scanning strategies on dimensions, average surface roughness, density and material hardness were evaluated, keeping the powder type and the volumetric energy density (Andrew number) constant. The effects of the scanning strategy on these properties are far less understood than on other important ones, like residual stresses and distortion, strongly affected by the scanning strategy. In this study, parallel stripes, chessboard and hexagonal pattern strategies were studied, keeping the Andrew number constant but varying the interlayer rotation. In general, the hexagonal strategy underperformed compared to the chessboard and the stripes ones.
1. Introduction
1.1. Effect of Energy Input in L-PBF Processing
Maraging steels are good candidates for the laser powder bed fusion (L-PBF) process because of the excellent weldability, resulting from the lack of interstitial alloy elements, and the resistance to quench cracking, resulting from the low carbon content. The microstructure of the L-PBF produced parts depends on the powder chemical composition and properties, but it is mainly related to the values of the process parameters used to print.
In the model of the L-PBF process, the laser acts as a moving Gauss heat source, leading to multi-mode heat and mass transfer [1]. There are many models to define the amount of energy delivered by the laser to the powder bed, trying to characterize the process conditions [2].
Linear Energy Density: Wang et al. [3] combined laser power P and scan speed v into linear energy density:
Surface Energy Density: Campanelli et al. [4] combined power P, scan speed v and laser beam diameter σ in the definition of surface energy density:
Increasing the surface energy density resulted in a broader and deeper melt pool. Casalino et al. [5] correlated relative density, ultimate tensile strength, hardness and average surface roughness Ra. Their main conclusion was that mechanical properties increase with an increased surface energy density, as the relative density follows the same relationship. Bai et al. [6] observed similar relationships replacing the laser beam diameter with scanning hatch spacing δ:
Volumetric Energy Density: Nowadays, the most used model is the volumetric energy density (or Andrew number) [7,8]:
This equation does not include factors as powder absorptivity, heat of fusion, heat accumulation, laser spot size and other relevant parameters and provides a simplistic approach considering only the power P, scan speed v, hatch spacing δ, and layer thickness h.
1.2. The Shortcomings of Andrew Number as a Sufficient Measure for Process Control
Interestingly, Cacace et al. [2] confirmed that under steady-state conditions, volumetric energy density () alone determines density and tensile properties. Scipioni Bertoli et al. [9] concluded that is a valid design parameter but limited to a narrow band of applicability, being not capable to capture the complex physics of the melt pool. is a thermodynamic quantity, not able to capture effects related to Marangoni flow, hydrodynamic instabilities and recoil pressure that drive heat and mass transport in different portions of the melt pool, defining the final morphology [9].
There have been several more efforts to characterize additive manufacturing using a simplistic approach by Ciurana et al. [10] and De Souza et al. [11], with slight differences. Suzuki et al. [12] studied the relationship between laser power and scan speed as inputs, and relative density, melt pool depth and Vickers hardness as outputs. Other topics have also been studied, including build orientation and resulting anisotropy in properties [13].
Kempen et al. [14] and Campanelli et al. [15] concluded that the optimal Andrew Number for L-PBF processing of maraging steel 18Ni300 was 92.59 J/mm3. Furthermore, it has been concluded that the manufacturing time is influenced by laser speed and layer thickness, with the layer thickness having a more significant impact on the manufacturing time than the laser speed [16].
In order to effectively produce components using additive manufacturing, the process must be performed in a stable and repeatable fashion to obtain predictable results. Suzuki et al. [12], producing many samples keeping the volumetric energy density constant, proved that constant is a necessary but not sufficient condition.
The physical phenomenon of heat absorption of the powder bed is complex and challenging to model, so different powder batches could lead to different results. Gusarov et al. [17] studied this problem and created a step-by-step model, generalizing the conditions at every step, starting with Mie scattering [18]. The powder bed consists of metal particles, so there are reflection and refraction. Because of the opaque nature of the particles, radiation must be concentrated in the pores, so the particle size and shape and powder bed density are critical parameters [17]. The laser power affects the energy input into the powder bed and the different energy density measures could struggle to describe the phenomenon, highlighting the limits of Andrew number [12].
Different scanning strategies lead to different thermal gradient, affecting mechanical properties, microstructure, residual stresses and overall quality of the L-PBF produced parts [19,20,21,22,23]. In particular, a large temperature gradient can result in high residual stresses, which can cause low mechanical properties, like strength, ductility and fatigue life [24].
In addition, many defects can be controlled and reduced using a suitable scanning strategy [25,26]. The scanning strategy comprehends scanning directions, scanning sequence, scanning vector rotation angle, scanning vector length, scanning time and hatch space. The most common scanning strategies are uni-directional, bi-directional, island (chessboard), cross-directional and helix. It is possible to develop any strategy, even random or fractal, or use any combination of the previous ones. There are also re-scanning strategies, generally used to refine microstructure, improve mechanical properties and reduce surface roughness, defects and pores [27,28,29,30,31,32,33,34].
The length of the scanning vector is related to the scanning strategy and affects the mechanical properties of the printed parts. For example, uni-directional and bi-directional strategies usually involve a long scanning vector, while chessboard and helix present a shorter scan vector. It is important to notice that long scanning lines cause excessive stresses in the part, resulting in a lower final quality. Moreover, when the scan vector length is over 3 mm, the scanning strategy becomes less critical considering residual stresses, while distribution and orientation of the scan vectors become more critical at the macro-scale [35].
Mutua et al. [36] studied the effect of overlap on the produced parts. Keeping all the other parameters constant, the absorbed energy per unit volume increases with decreasing pitch. In fact, a too small pitch implies too much energy, which may deteriorate surface quality and decrease relative density [36]. Low relative density (98.3%) was obtained with a 75% overlap because a large overlap rate causes multiple remelting of scan tracks.
Moreover, some powder particles may vaporize, favouring the formation of keyholes or pores [36]. In addition, insufficient fusion causes the formation of distinct scan tracks with visible gaps.
Another effect to be considered is the balling effect, which can lead to some spherical powder particles on the surface. Therefore, overlapping remelting and timing of the scan paths probably have significant influence and they are determined by the scan strategy. Bhardwaj et al. [37] obtained higher density and better surface finish using the cross-directional scanning strategy, compared to the bi-directional one. A bi-directional strategy leads to a quite low temperature gradient: after the first vector, the following one impacts a higher temperature region, compared to the uni-directional strategy [38].
Guo et al. [39] and Wang et al. [40] concluded that parts fabricated with the island scanning path had better mechanical properties than those using the uni-directional strategy. Each island can be considered as a radiating unit with multiple radiation directions, resulting in an overall smaller temperature gradient [41]. Lu et al. [42] studied island scanning strategies with different dimensions and they found out that amount and size of pores decreased significantly with an increasing island size. The island scanning strategy presents a short scanning vector so the scanning time interval between two adjacent scanning vectors is reduced, resulting in a smaller temperature gradient [43] and lower residual stresses of the printed part [44].
Furthermore, Yan et al. [45] showed that the overall stresses using the island scanning strategy were smaller than those related to the uni-directional strategy, while Zaeh [23] concluded that the part produced using the island strategy had the lowest level of stress compared to both uni- and bi-directional scanning strategies. Parry et al. [38] state that long scan vectors should be avoided in the printing process from a residual stress standpoint. However, it cannot be simply concluded that the island size and the length of the scanning vectors are negatively related to quality and performance of the final parts. In fact, too small islands could exhibit more pores due to excessive un-melted powder.
The conclusion from literature must be that the length of the scanning vector should be within a reasonable range and there is an optimum length for each scanning strategy.
In industrial applications, the build time can exceed several days. The parts could reach the size of the build chamber, which for modern industrial systems varies between 0.01 and 0.06 m3. Considering a volume of 10−6 m3, the total length of the scanned tracks could easily reach 3 km. Hence, there is a high probability of defect formation within the process [46]. The scanning strategy primarily affects the distribution of heat and temperature. Generally, shorter scan vectors are beneficial to reduce residual stresses and improve mechanical properties [23,39,40,47]. Island, helix and fractal scanning strategies usually have a shorter scan vector. Scanning direction and sequences are also important [48] and the right choice could reduce heat accumulation and temperature gradient. Sometimes, remelting is beneficial to obtain fine microstructure, good mechanical properties and reduced residual stresses [49,50,51,52].
Unlike most previous publications, this study aims to investigate the effect of the scanning strategy, keeping all the other parameters constant. The effects related to the volumetric energy density (Andrew number) have been thoroughly studied, while the effects of the scanning strategy of the printing process are still not completely understood.
2. Experimental
2.1. Materials
Samples of 18Ni300 Maraging steel were built using gas atomized powders produced by Höganäs (Amperprint® 1556.074), whose nominal and certified chemical compositions (wt.%) are reported in Table 1.
Based on previous investigations carried out by the authors, powders were characterized by a mean diameter of the particle equal to D50 = 12 µm and the diameter corresponding to 95% cumulative particle size distribution was D95 = 21 µm. The powders were characterized by an apparent density equal to 3.50 g/cm3 (ASTM B 212) and flowability in the range 15–25 s/50 g (ASTM B 213), as reported in the datasheet from Höganäs.
2.2. Process Planning and Variation
Four different prints were run using the same powders and the same L-PBF machine (ProX DMP 300, 3DSystems, Rock Hill, SC, USA). Inside the sealed printing chamber, nitrogen gas flew from right to left and the oxygen level was kept below 1000 ppm.
The build plate was made of ferritic stainless steel (AFNOR Z8C17) with a relatively rough surface, being finished by grinding. The plate was cleaned using 99.5% alcohol and oriented with the grinding direction perpendicular to the powder spreading direction to improve spreading and bonding. The software 3DXpert (3DSystems, Rock Hill, SC, USA) was used to set up the prints. The plate was not preheated and the specimens were vertically oriented on it (Z-orientation).
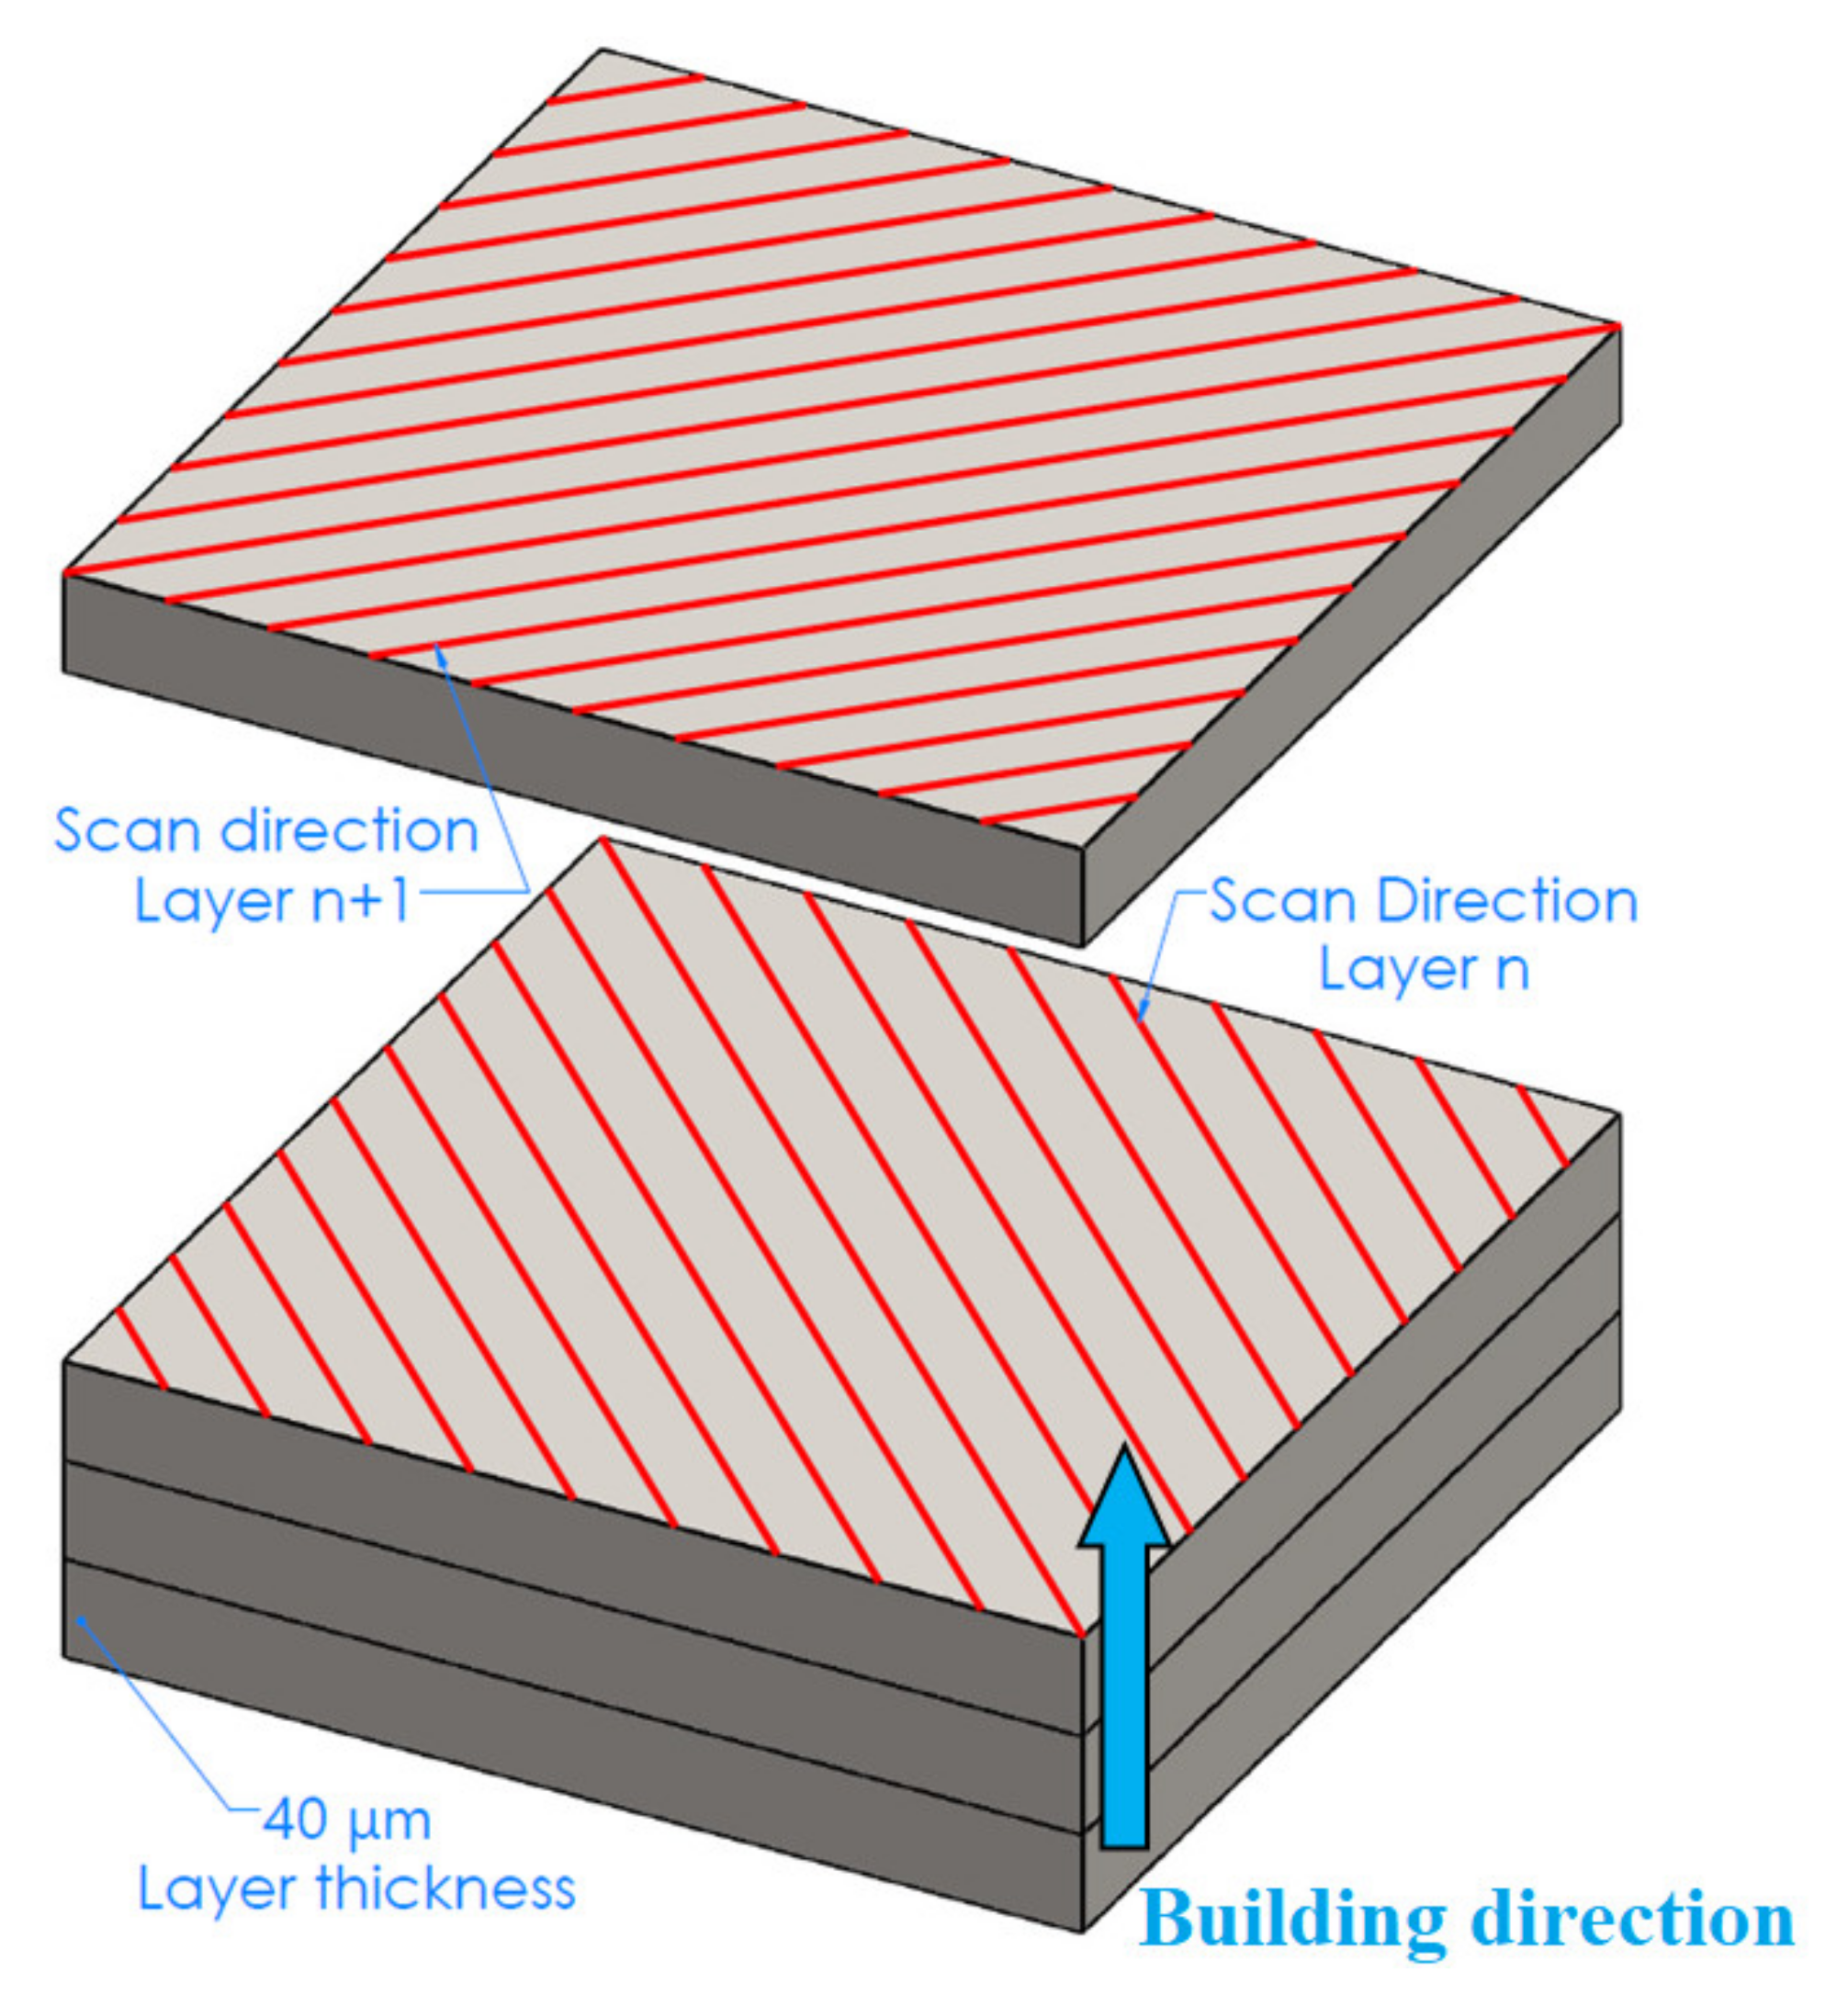
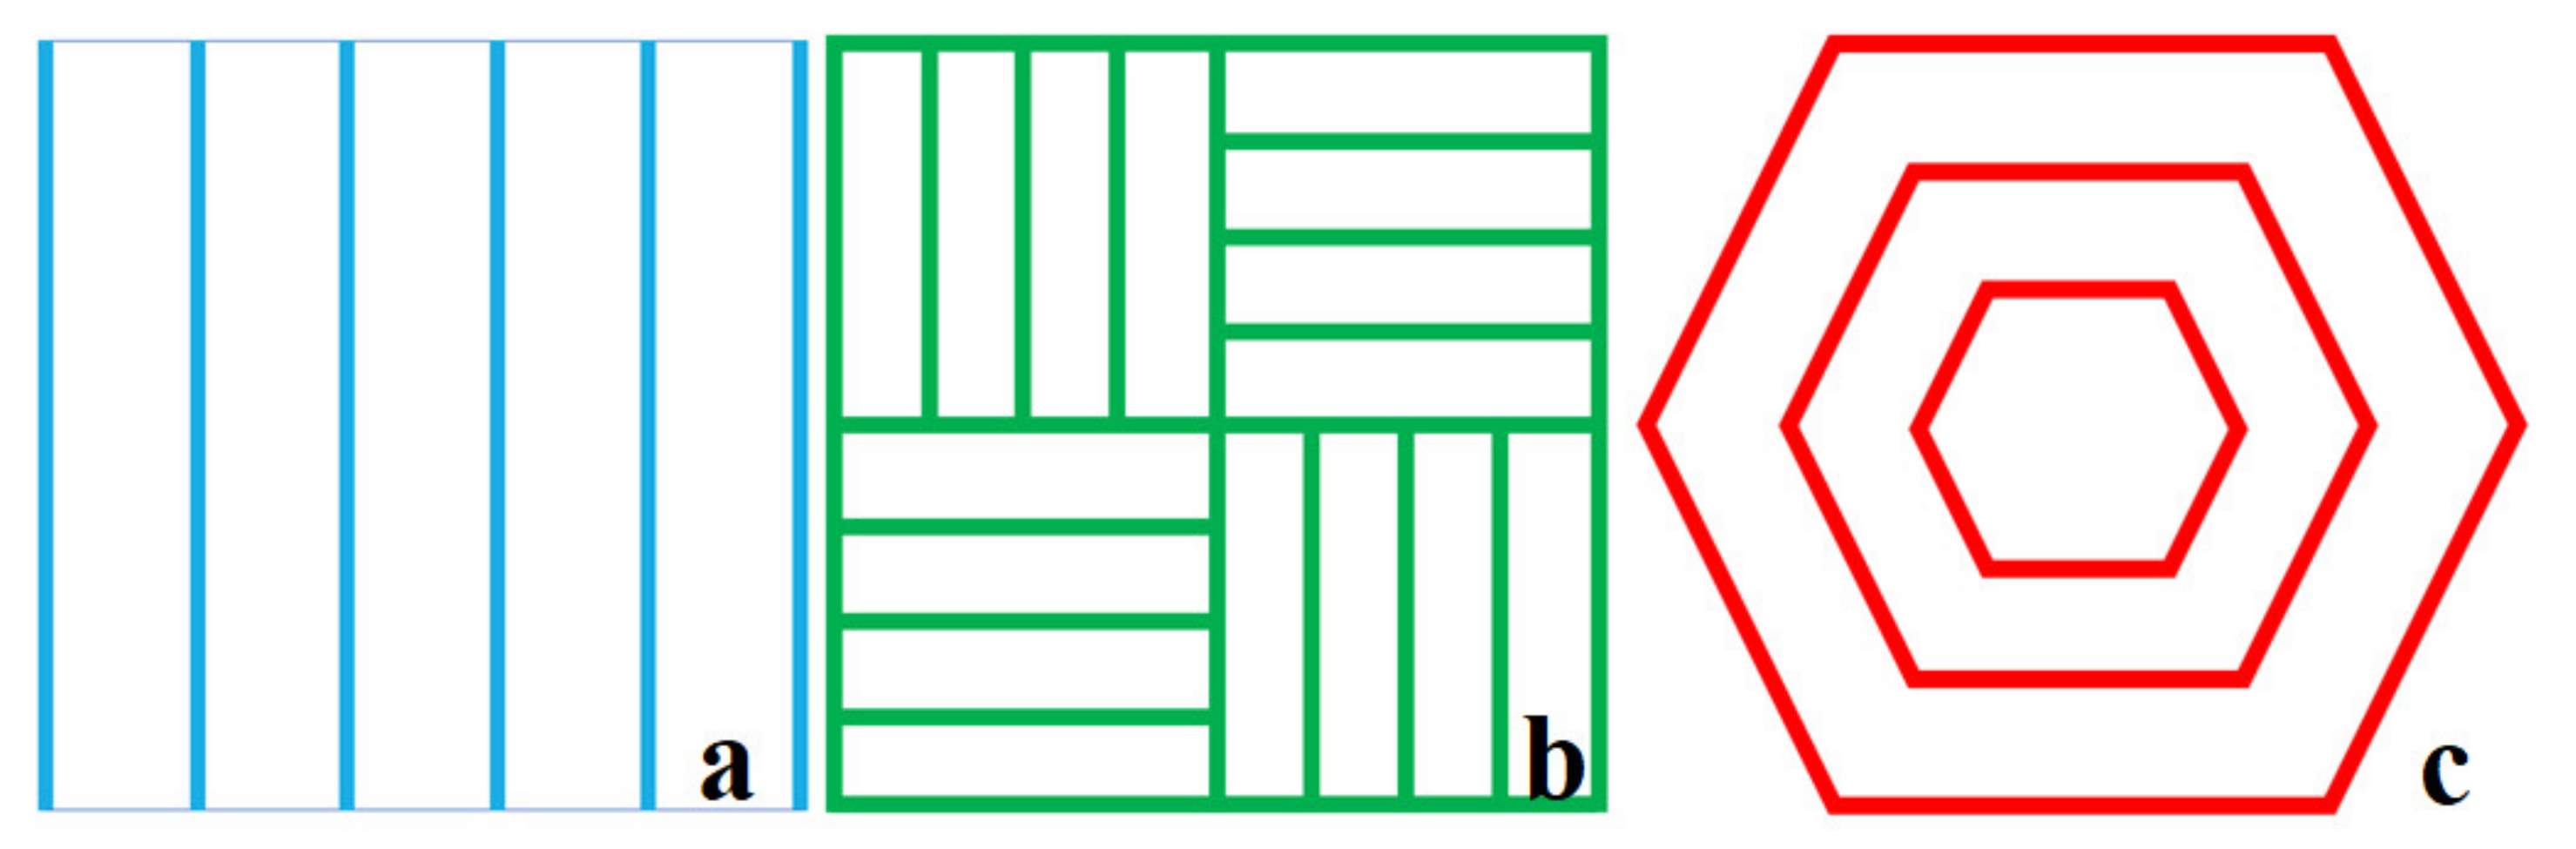
The process parameters adopted for L-PBF printing are shown in Table 2. The layer thickness () was set equal to 40 µm while the rotation angle between adjacent layers was variable, as schematically shown in Figure 1. The energy density (E) and the laser power (P) were kept constant and equal to = 89 J/mm3 and P = 160 W respectively, based on the results of previous optimization and investigations. Scanning speed (v) and hatch spacing (h) were changed in a dependent way to keep constant the energy density. Three scanning strategies, schematically shown in Figure 2, were considered: parallel stripes (a), chessboard (b) and hexagonal (outside-in verse) (c). The stripes scanning pattern is conventional and straightforward, the chessboard pattern involves two types of regions with 90° symmetry and the hexagonal pattern has a 60° symmetry. Regarding the hexagonal strategy, the outside-in method was chosen because it could theoretically lead to compressive and beneficial residual stresses in the as-built specimens [53].
The continuous numerical variables are (A) v scan speed (mm/s), (B) h hatch spacing (mm) and (C) inter-layer rotation (°) while the discrete variable is (D) scan pattern, considering the values S for the parallel stripes, C for the chessboard and H for hexagonal patterns. ANOVA Analysis outputs will display the deviation from a Reference Point in actual values or coded factors varying from −1 to 1, based on the experimental window:
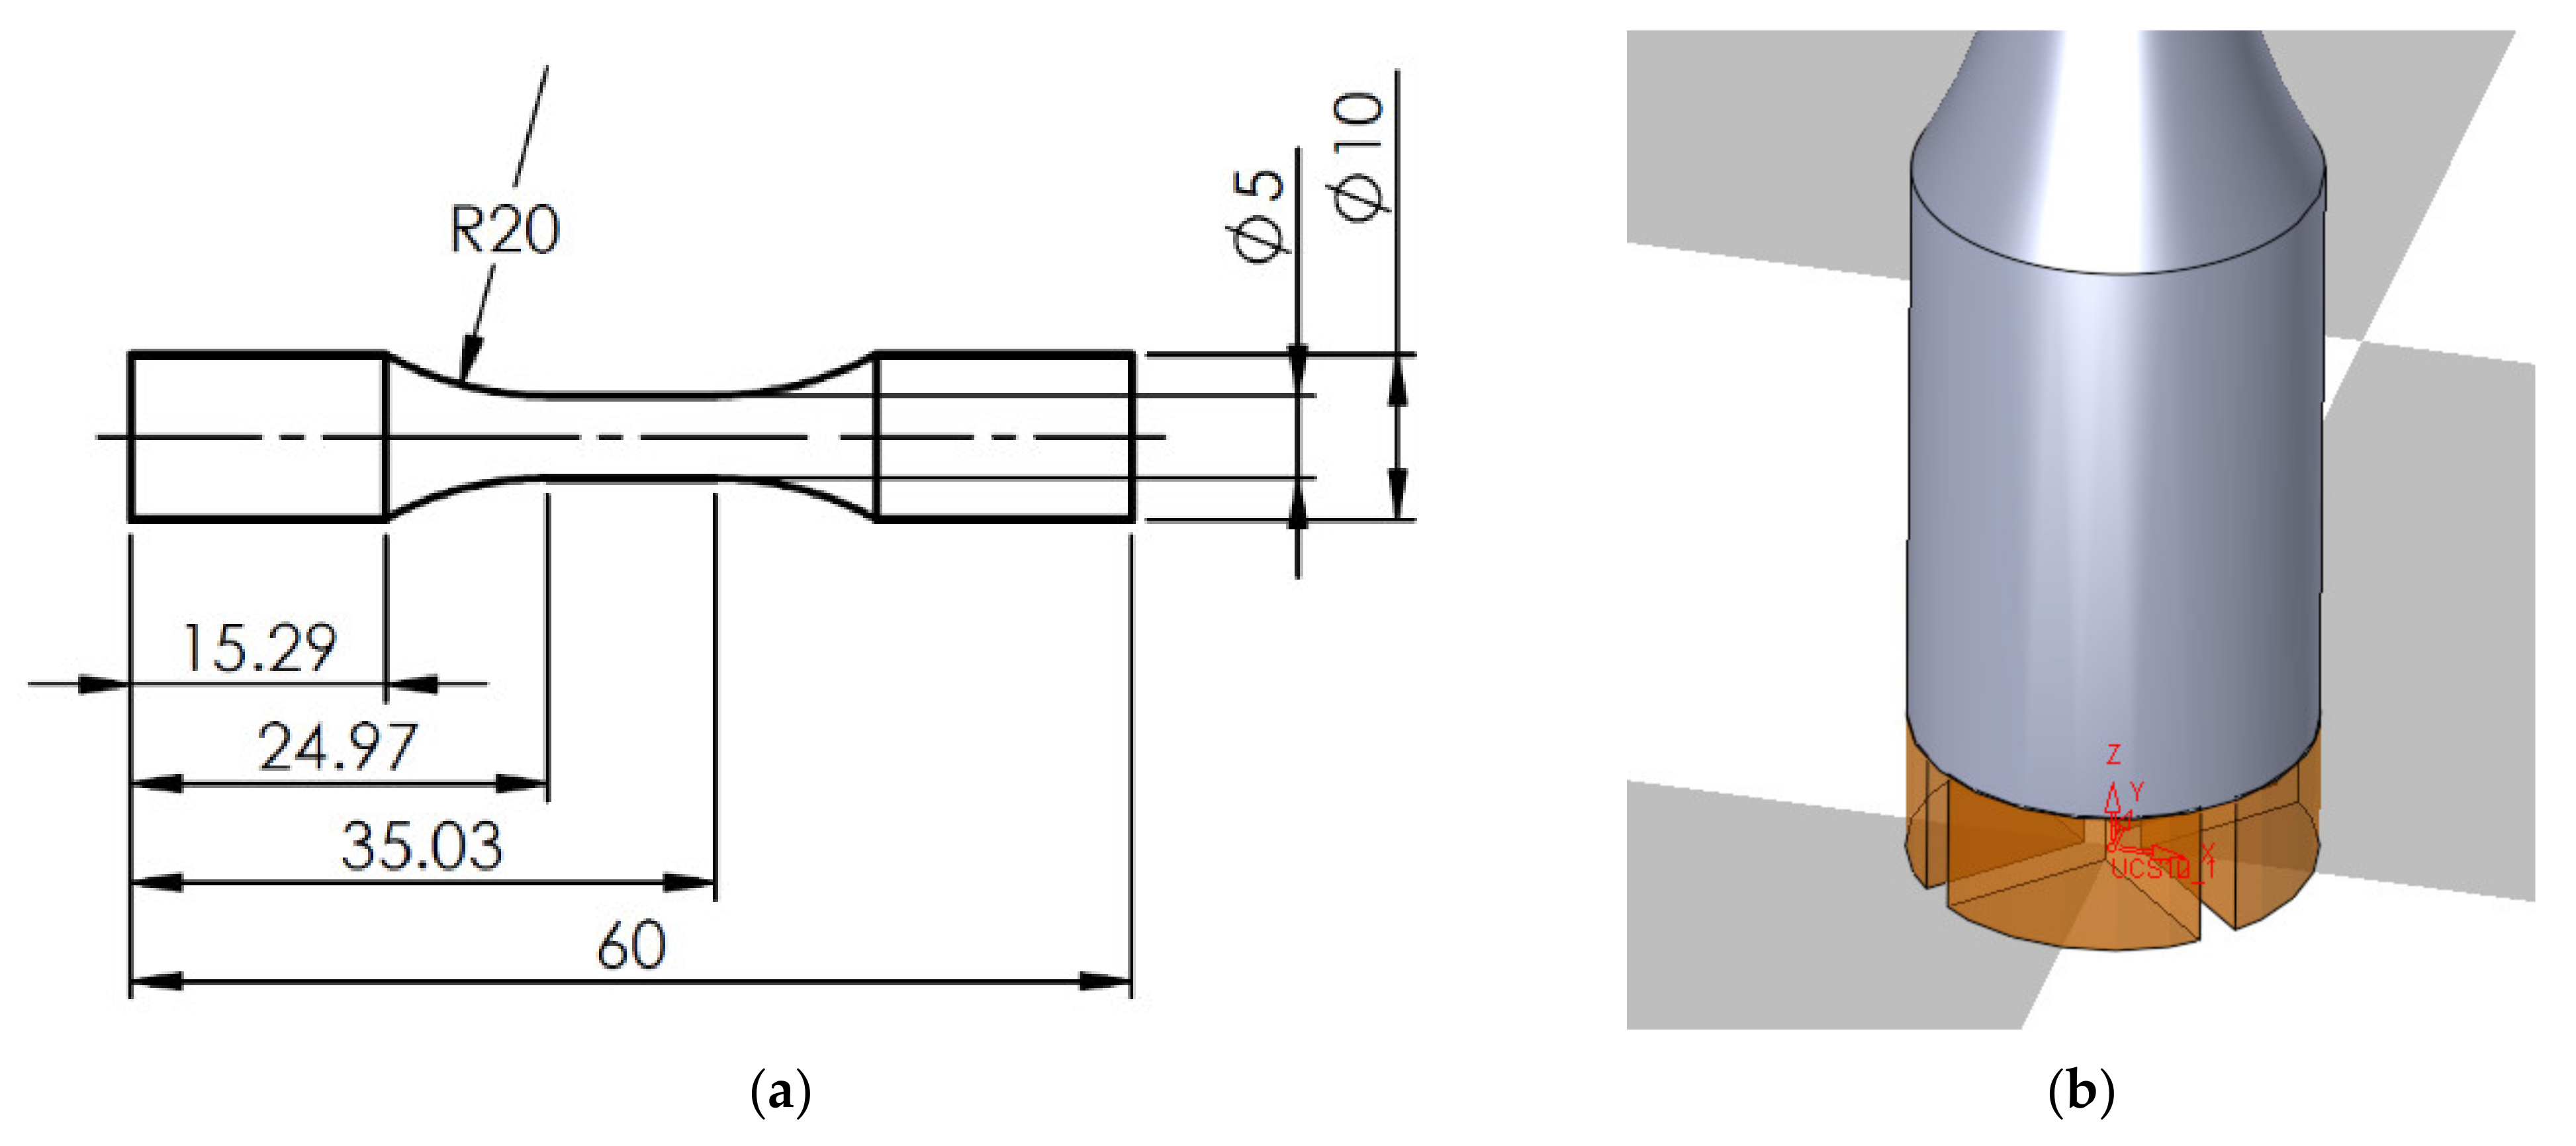
As previously stated, four prints were made, keeping the Andrew number constant. In the first three prints, the specimens, whose shape and dimensions are shown in Figure 3, were grouped in twenty-seven sets related to different parameters combinations, according to Table 3. Each set was composed of eight similar specimens and the total number of specimens on the plate was 216 for each print. The fourth print was made with a reduced set of samples ad there were interruptions during the printing process due to base plate distortion. All the results reported in this study refer to the first three prints.
The supports between the specimens and the plate were fully solid, with two orthogonal diametral through-all extruded cuts. In print 1, the height of the supports was 4 mm and the extruded cuts were 1 mm wide. In print 2 and 3, the height of the supports was 10 mm and the extruded cuts were 1.8 mm wide.
2.3. Characterization
The results were processed using the software DesignExpert™ v 12.0.12.0 (Stat-Ease inc., Minneapolis, MN, USA) to carry out an ANOVA analysis using a Two Factor Interaction (2FI) model. Four input variables were considered: laser speed, hatch spacing, inter-layer rotation between adjacent layers as continuous numeric variables and scan strategy as a categoric variable.
2.3.1. Sample Dimension
The external diameter was measured using a micrometer screw gauge (Mitutoyo, Kawasaki, Japan). Three measurements were carried out on each specimen, rotating the sample every time around the longitudinal axis.
2.3.2. Average Surface Roughness Ra
The average surface roughness (Ra) of the as-built specimens was checked using the Surftronic 3+ stylus profilometer (Taylor Hobson Ltd., Leicester, UK). The length evaluated for the test was 4 mm along the building direction and the precision of the instrument was ±0.2 µm. Because of the cylindrical geometry of the specimens, modelling clay has been used to constrain the samples and fasten them to the table. Three measurements were performed on each specimen, rotating the sample every time around the longitudinal axis.
2.3.3. Density
The density value of each specimen was measured with a Kern ABS-A02 digital precision scale (Kern & Sohn Gmbh, Balingen, Germany) using Archimedes’ method, consisting in weighing the sample in air and subsequently in demineralized water (ASTM B 962). Three measurements were carried out on each specimen.
2.3.4. Microscopy
Metallographic samples were prepared to study the pore structure and to measure the nano-hardness. They were cut from the as-built L-PBF specimens perpendicularly to the building direction (transverse cross-section). Standard metallographic procedures were used for grinding and polishing. The samples were then observed with the Olympus GX71™ (Olympus Pte Ltd., Kawasaki, Japan) optical microscope.
2.3.5. Nano Hardness
The Micro Materials NanoTest Vantage equipment (Micro Materials, Wrexham, UK) and a Berkovich triangular pyramid indenter were used to perform nano-hardness tests. Matrixes of 12 × 12 and 20 × 20 indentations were defined, with 7 µm distance between every indentation and the load was set to 25 mN.
3. Results
3.1. External Diameter
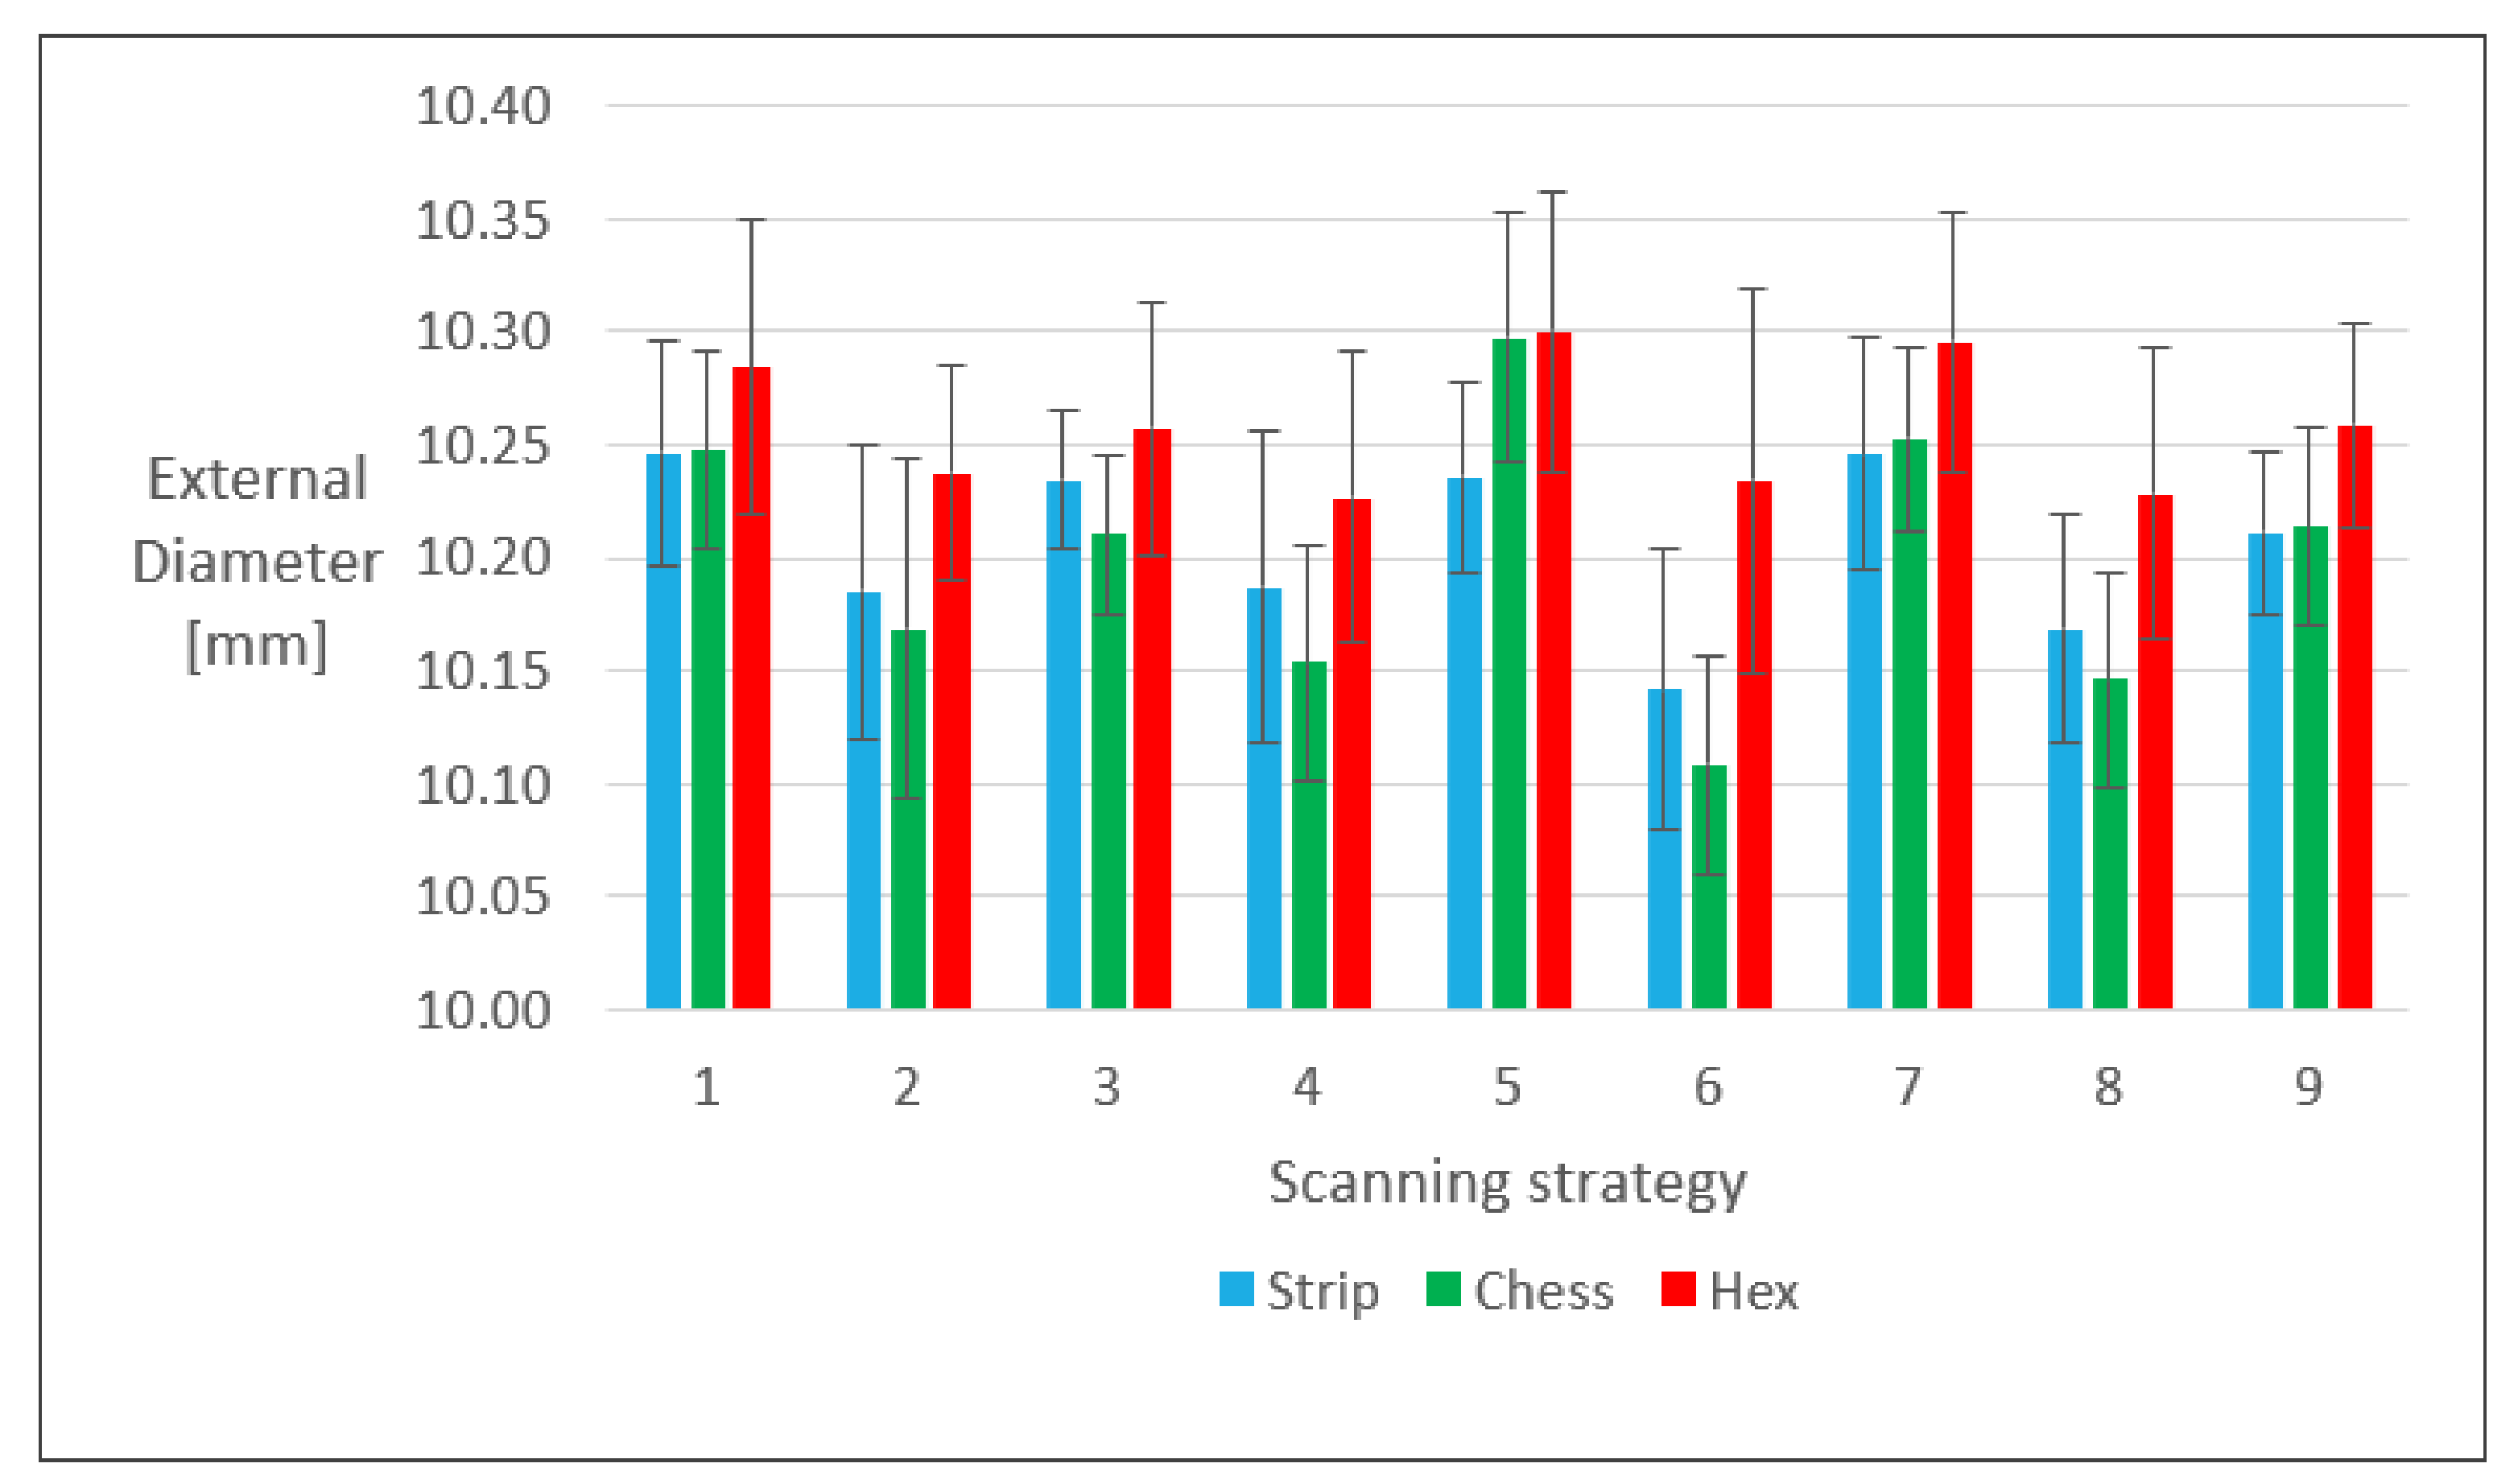
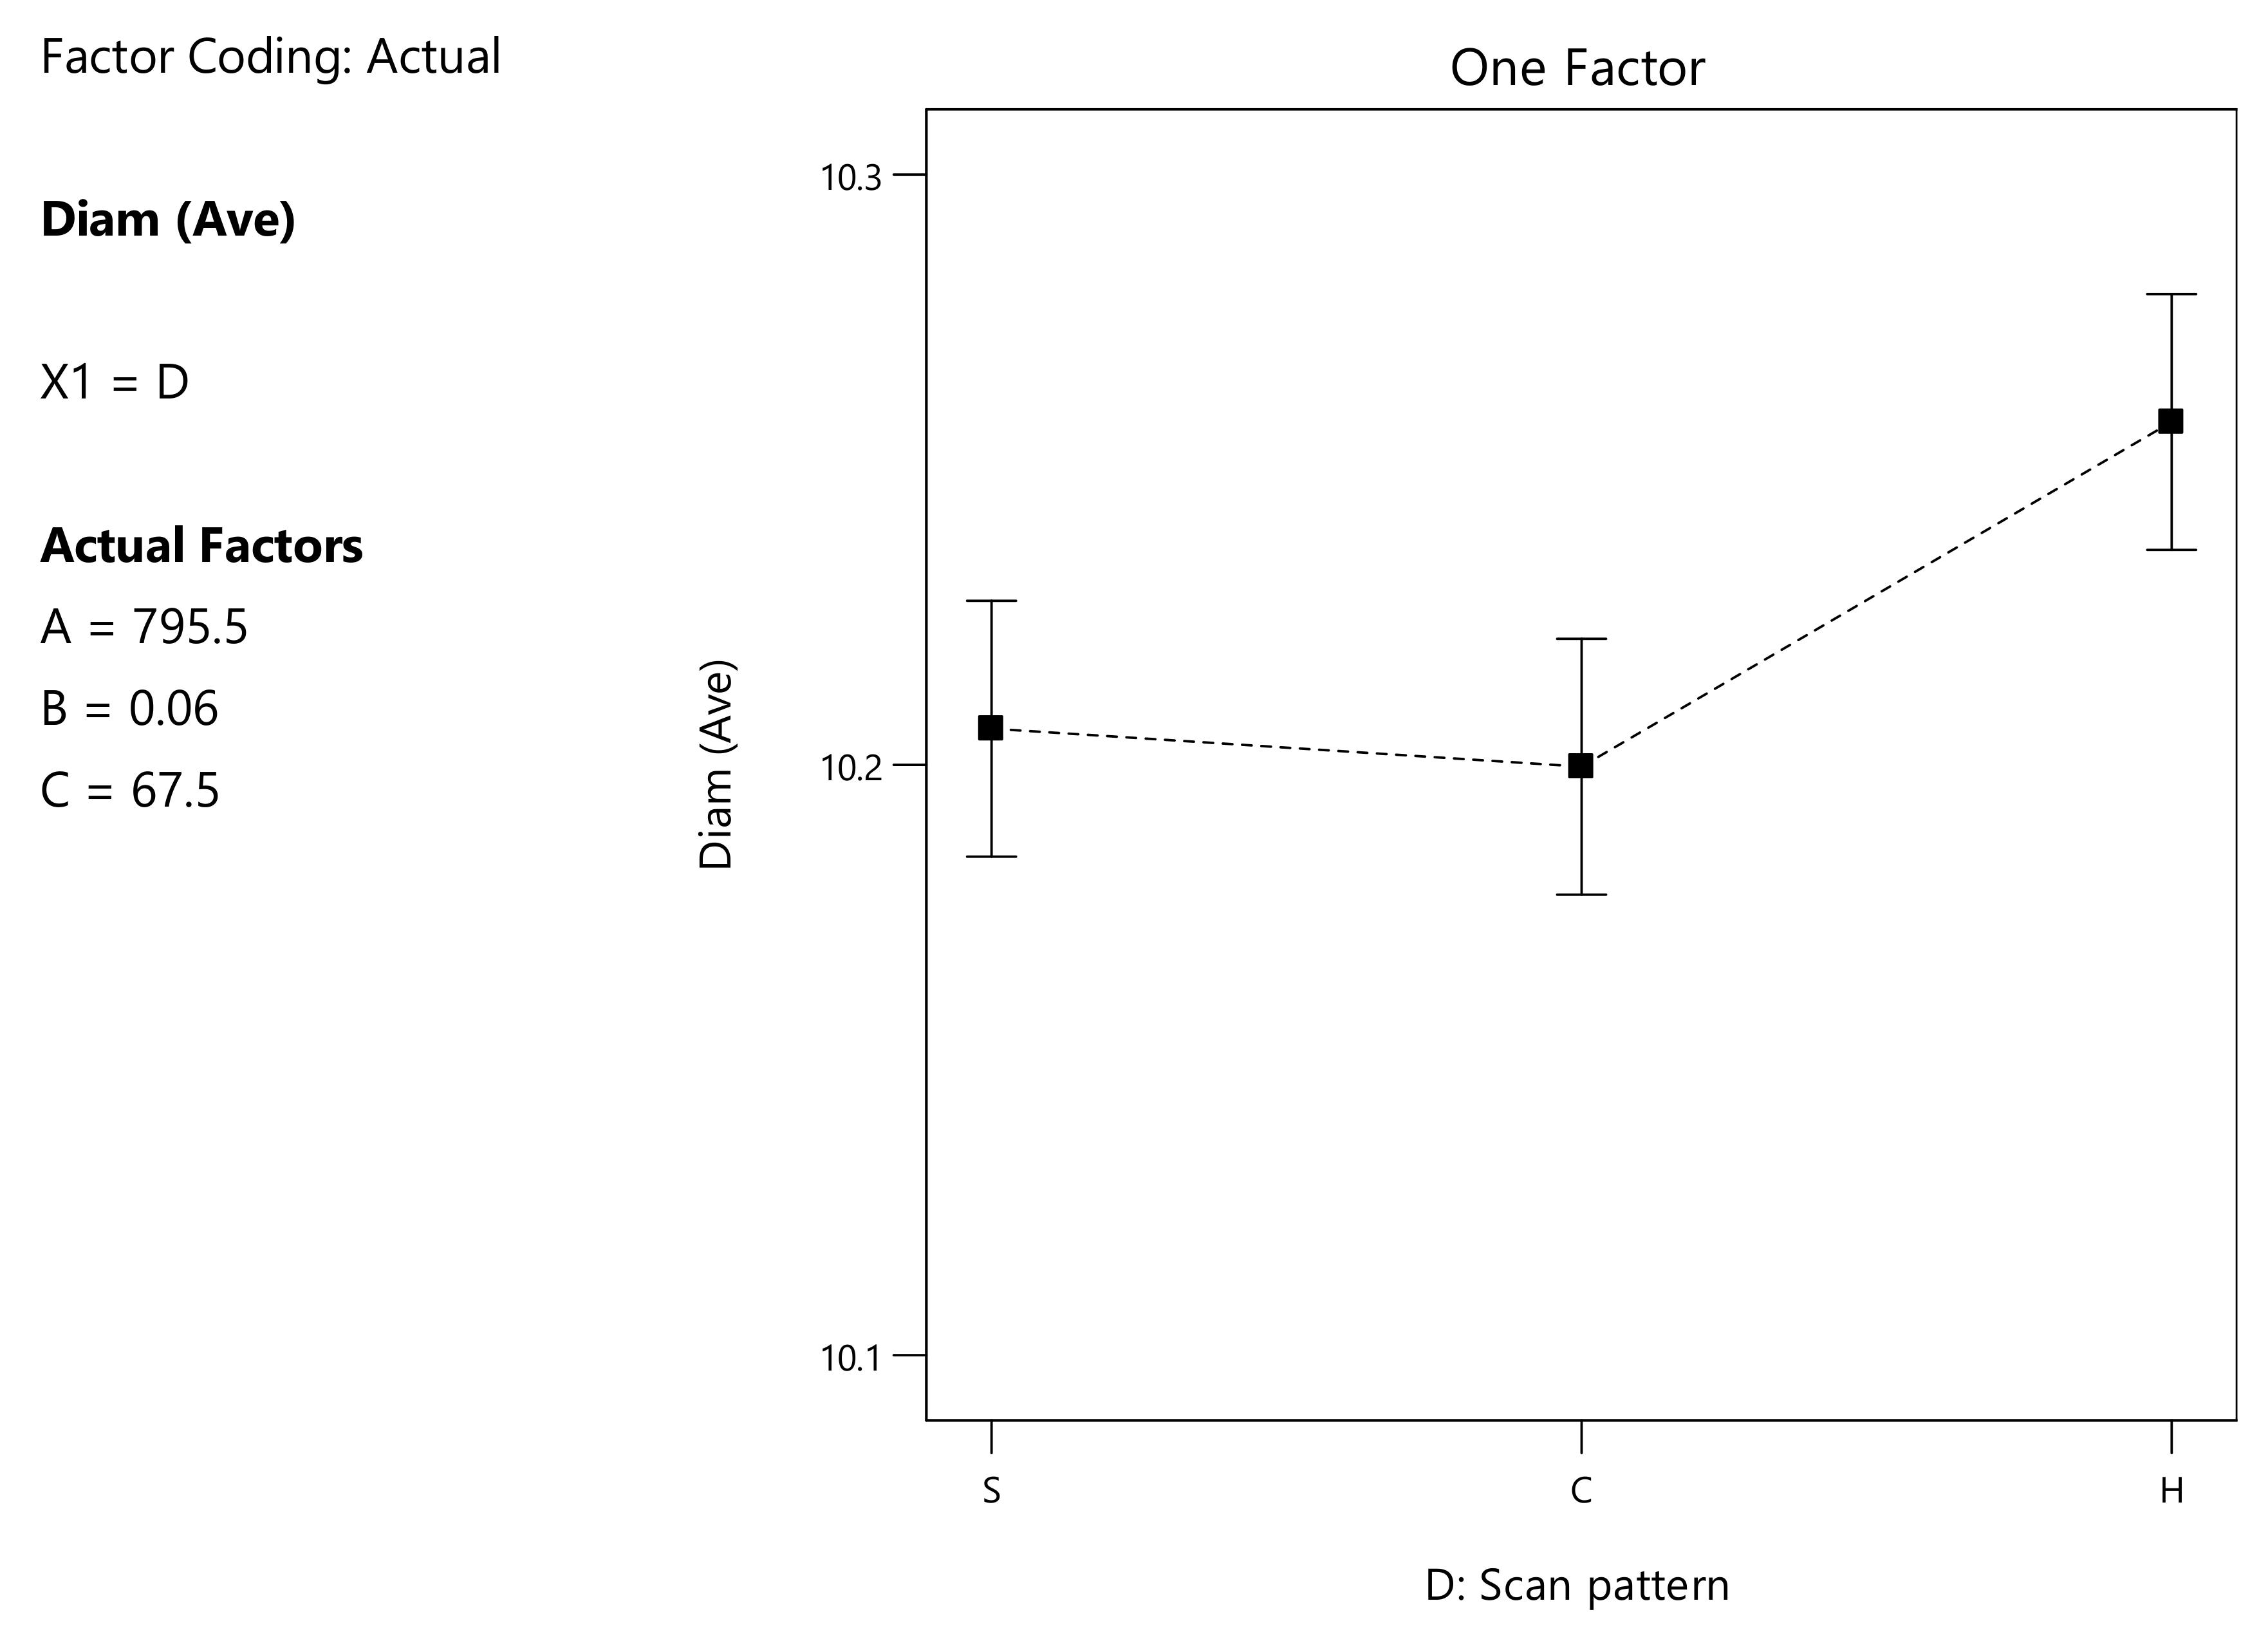
Figure 4 shows the effect of the scanning strategy on the external diameter of the as-built specimens, comparing the average and standard deviation values for each printed set. It is worth noting that all the diameters were larger than the targeted 10 mm, starting value of the y-axis, and the hexagonal strategy always led to the largest ones. A tendency for the smallest deviation for the chessboard strategy can also be seen.
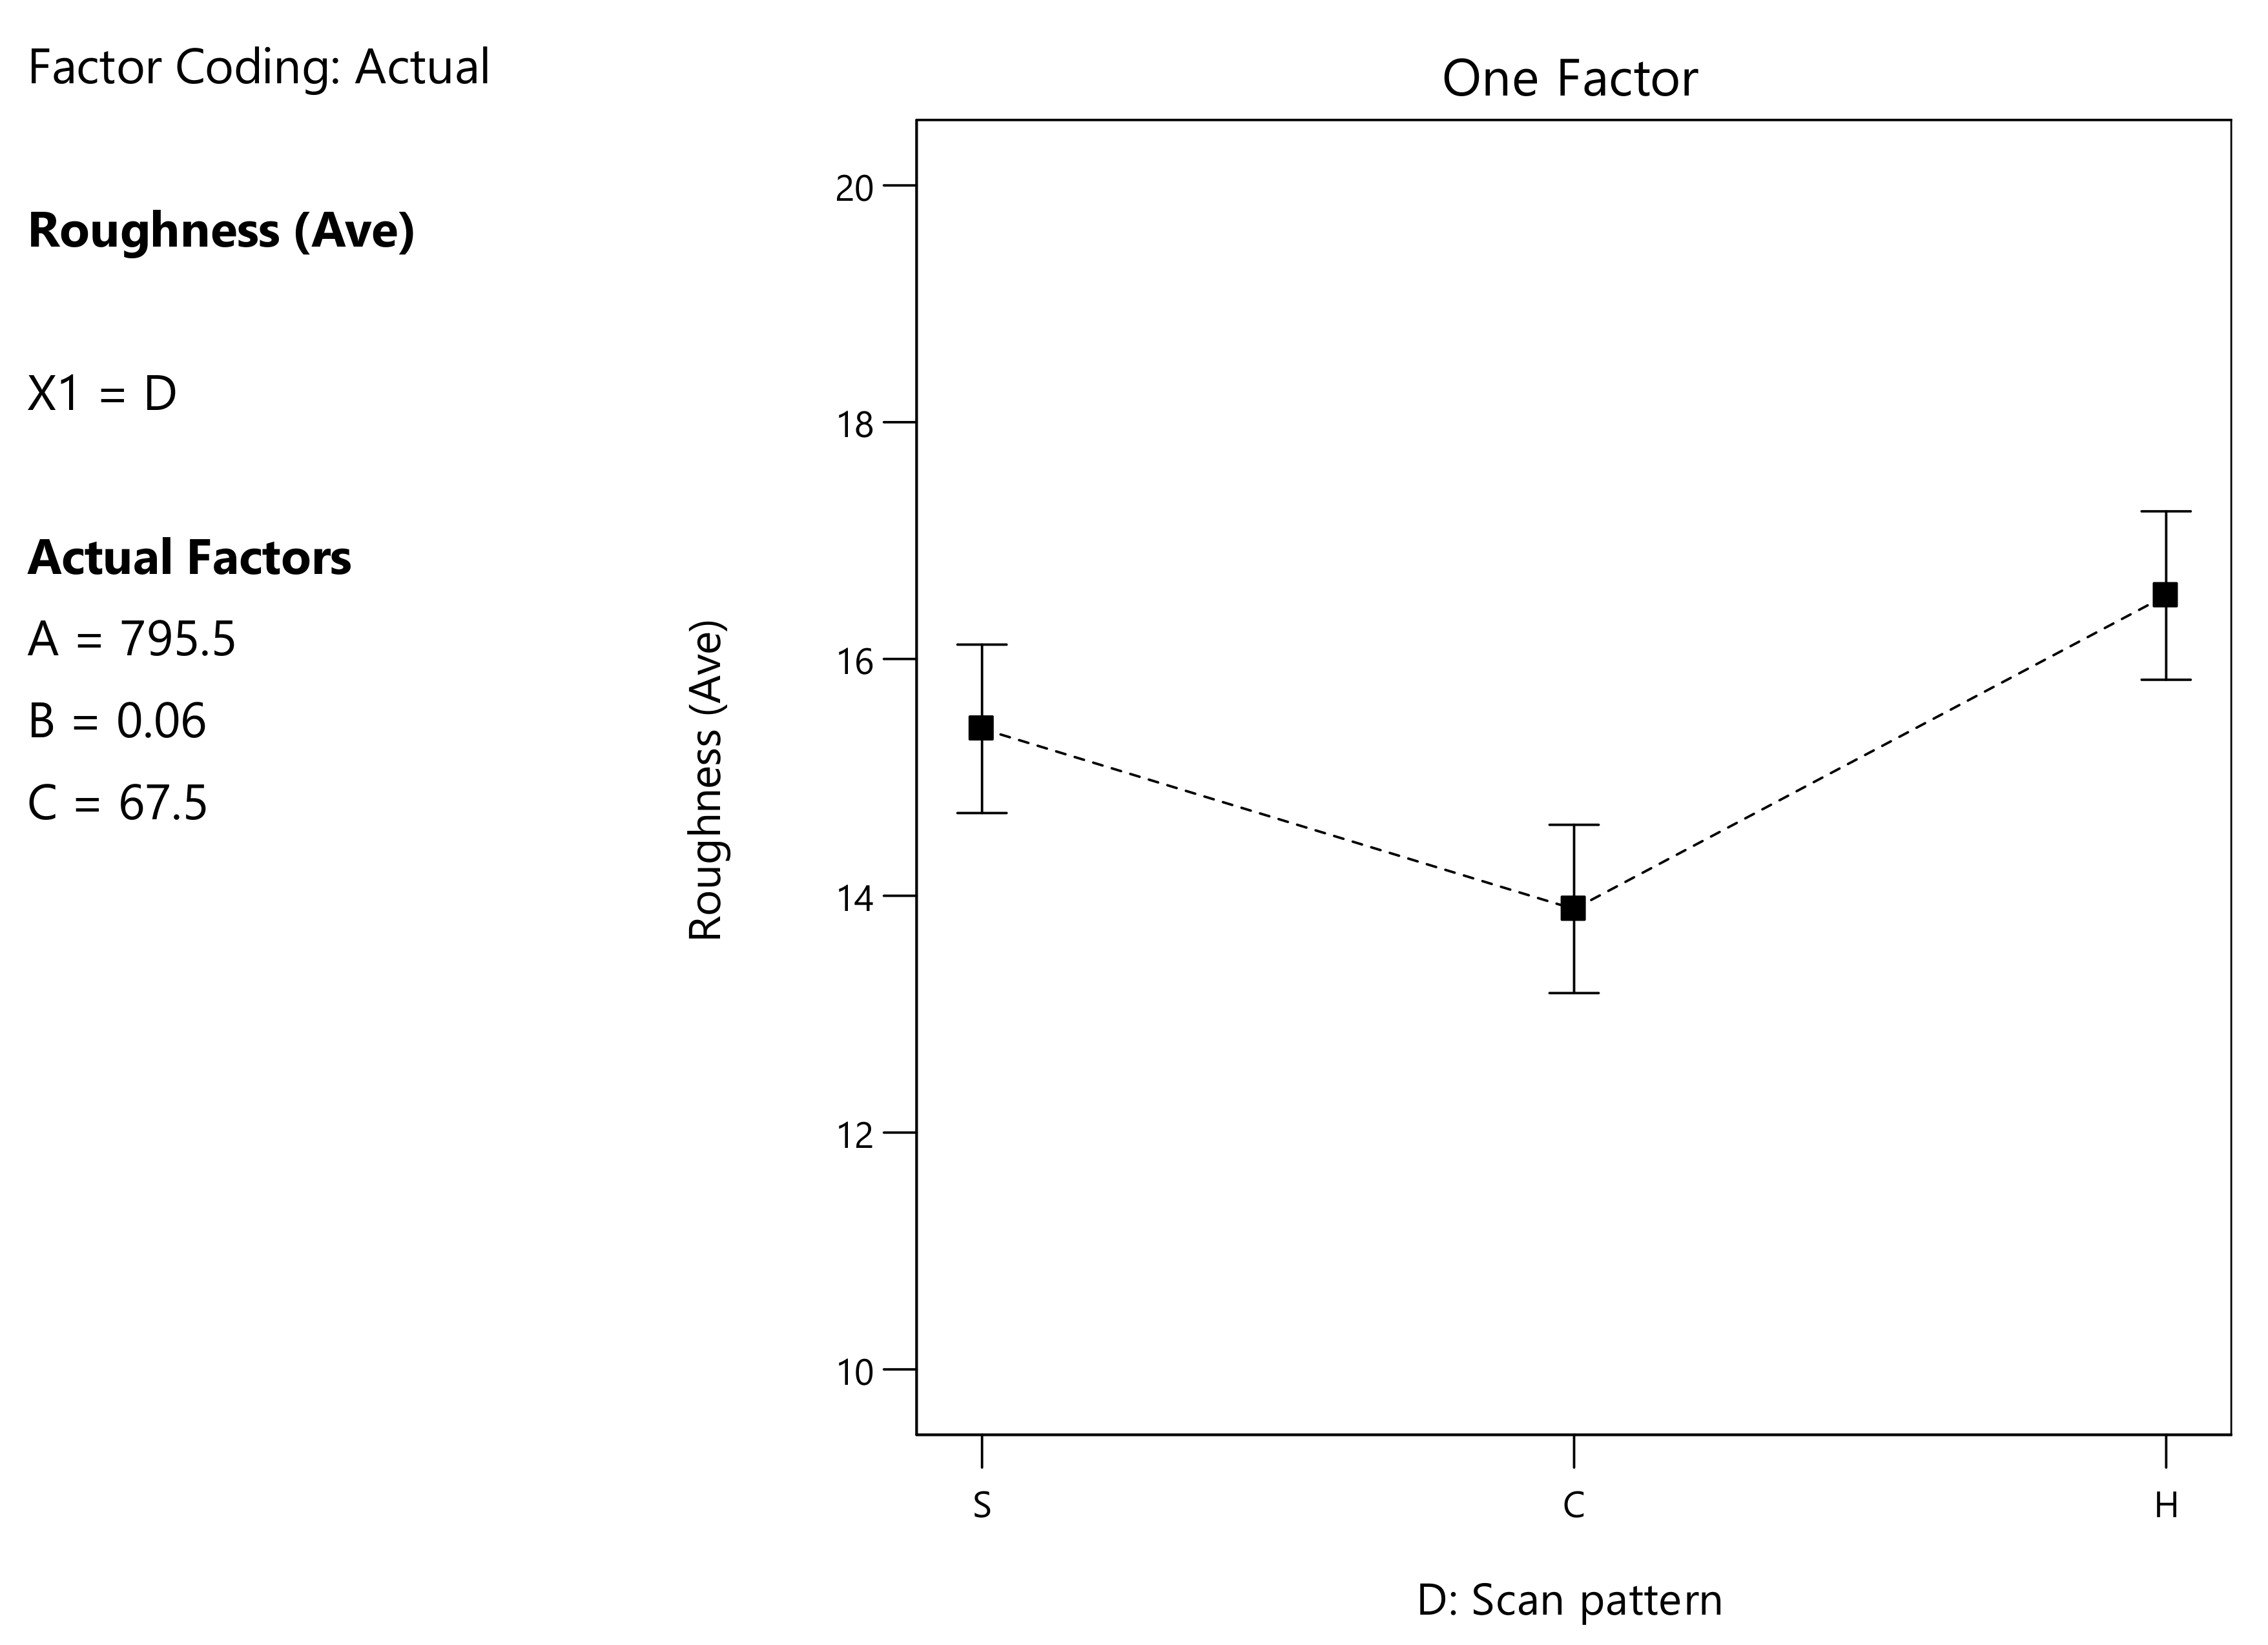
3.2. Average Surface Roughness Ra
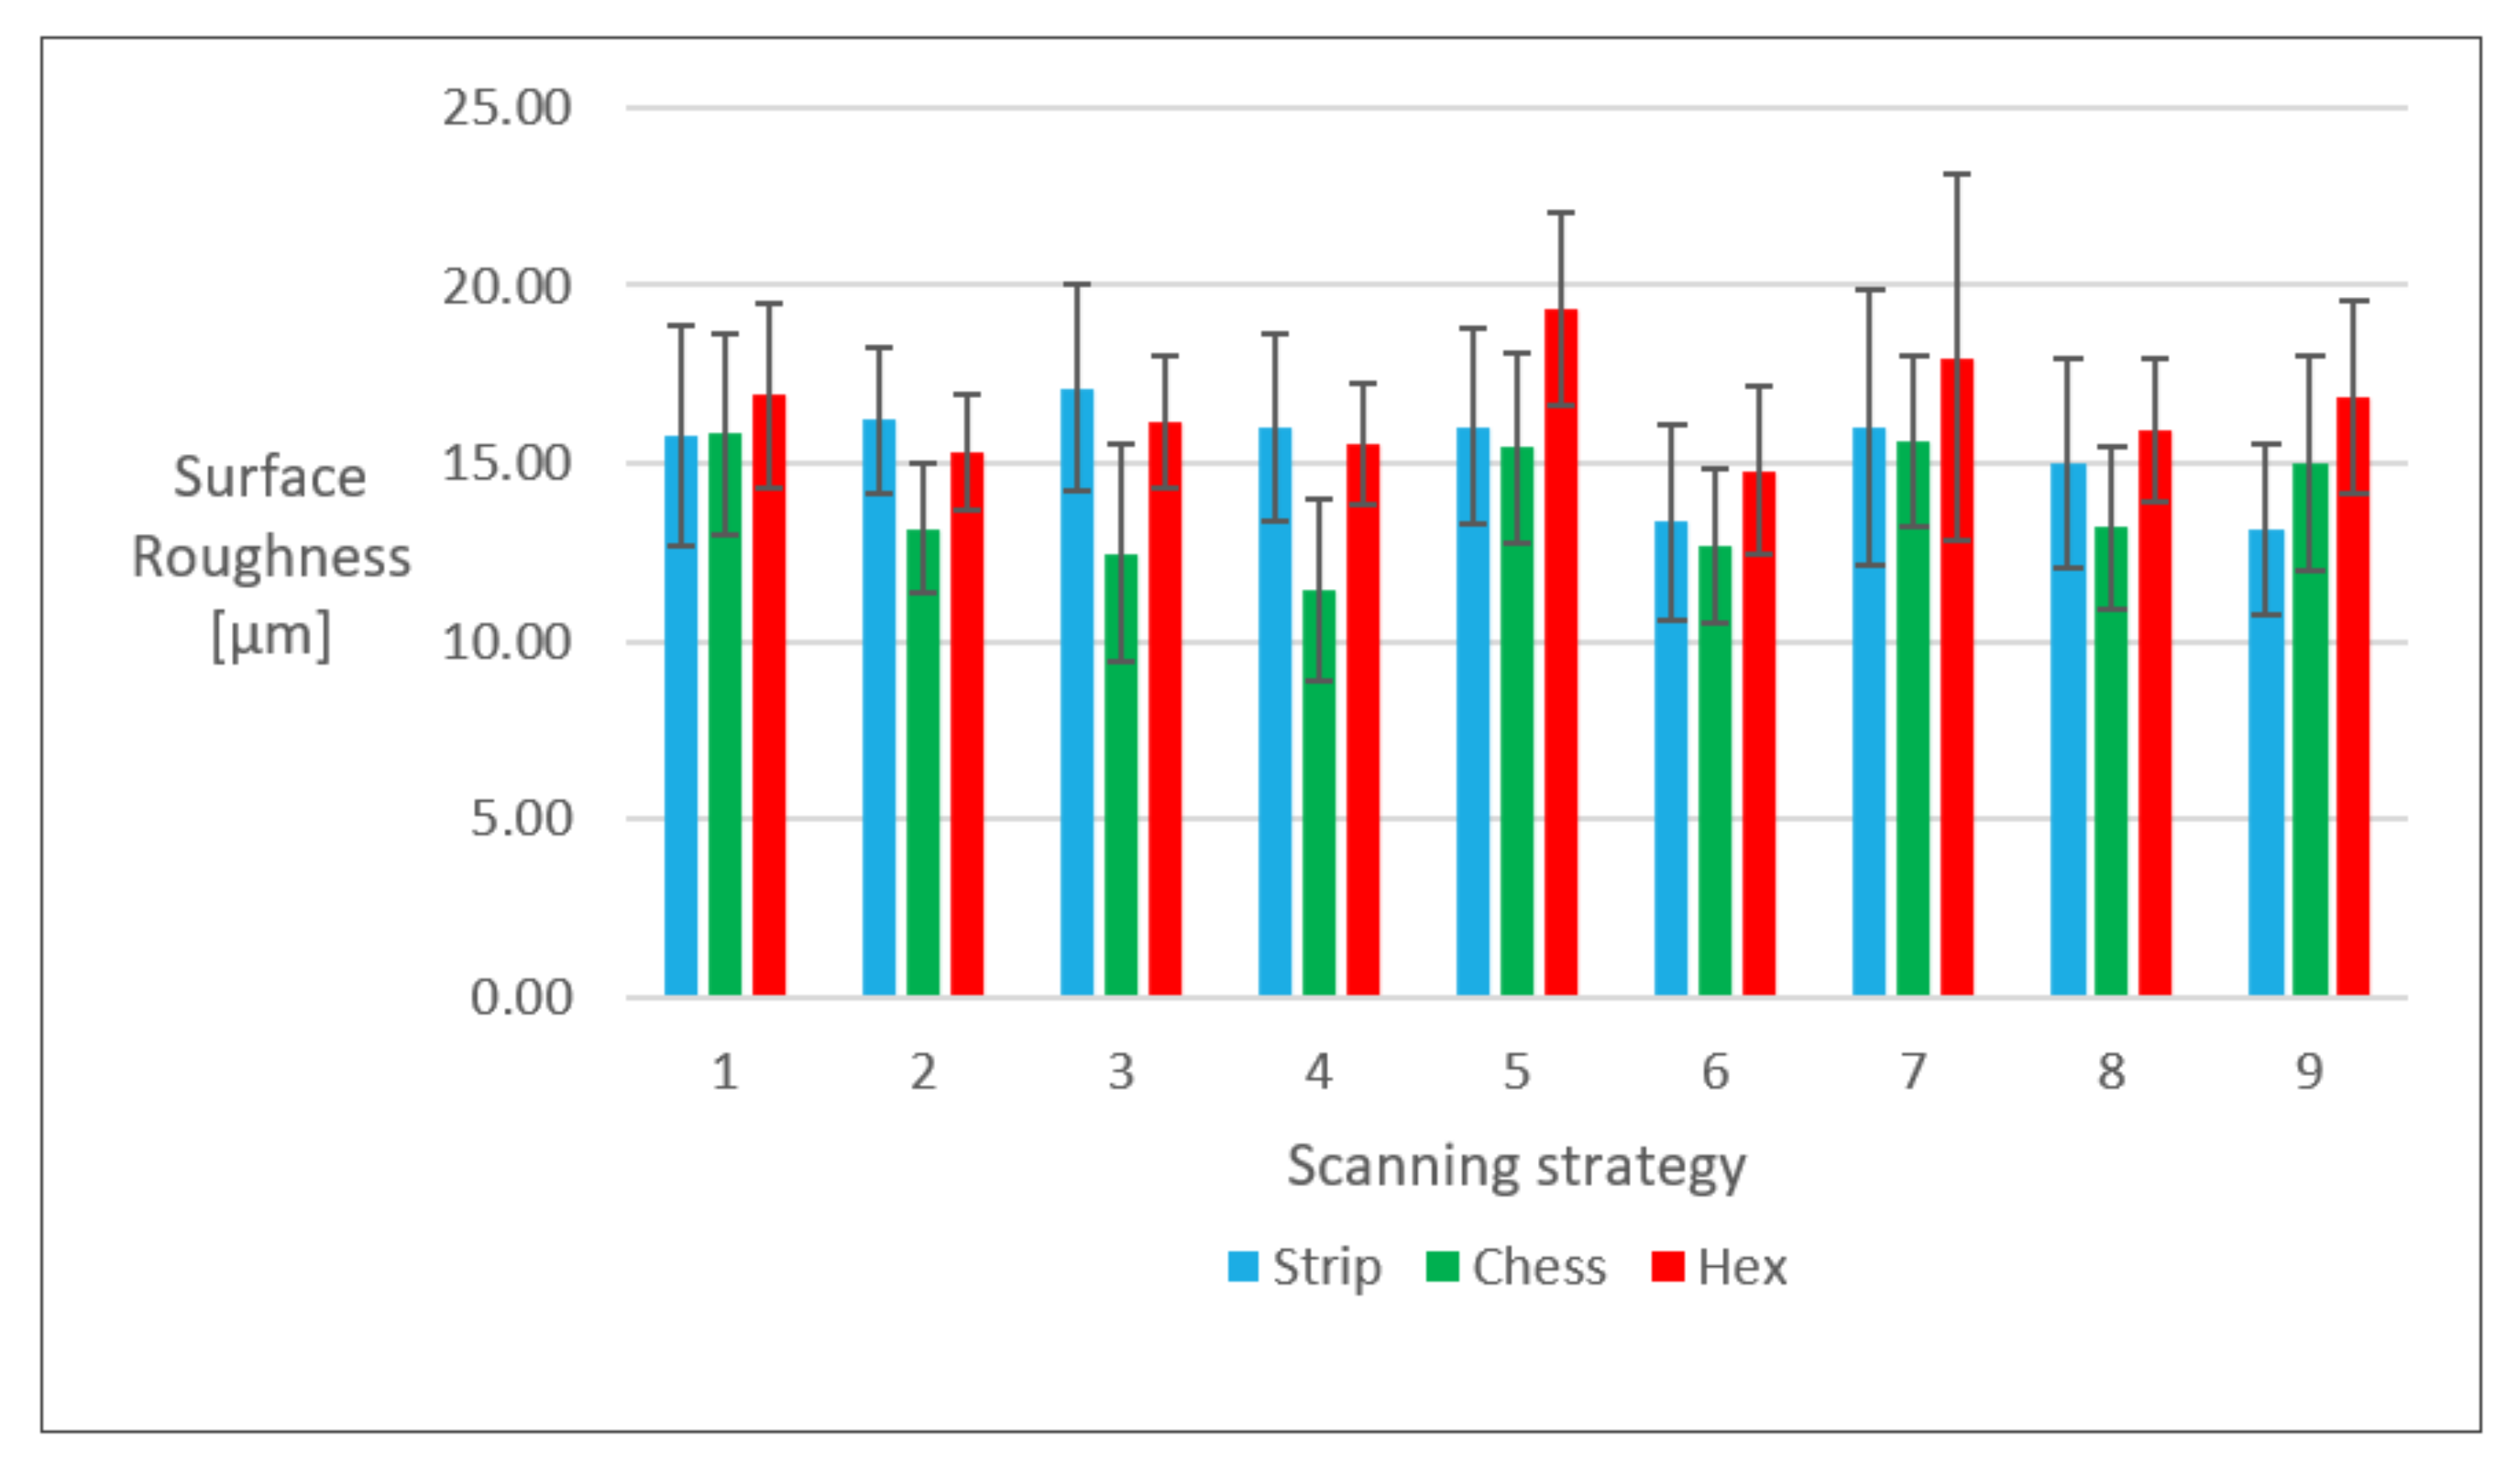
The average value and standard deviation of average surface roughness Ra, measured on the lateral surface, are shown in Figure 5, highlighting the effect of the scanning strategy. It is possible to notice that the hexagonal strategy almost always led to the highest average surface roughness values, while the chessboard strategy almost always led to the lowest average surface roughness.
3.3. Density
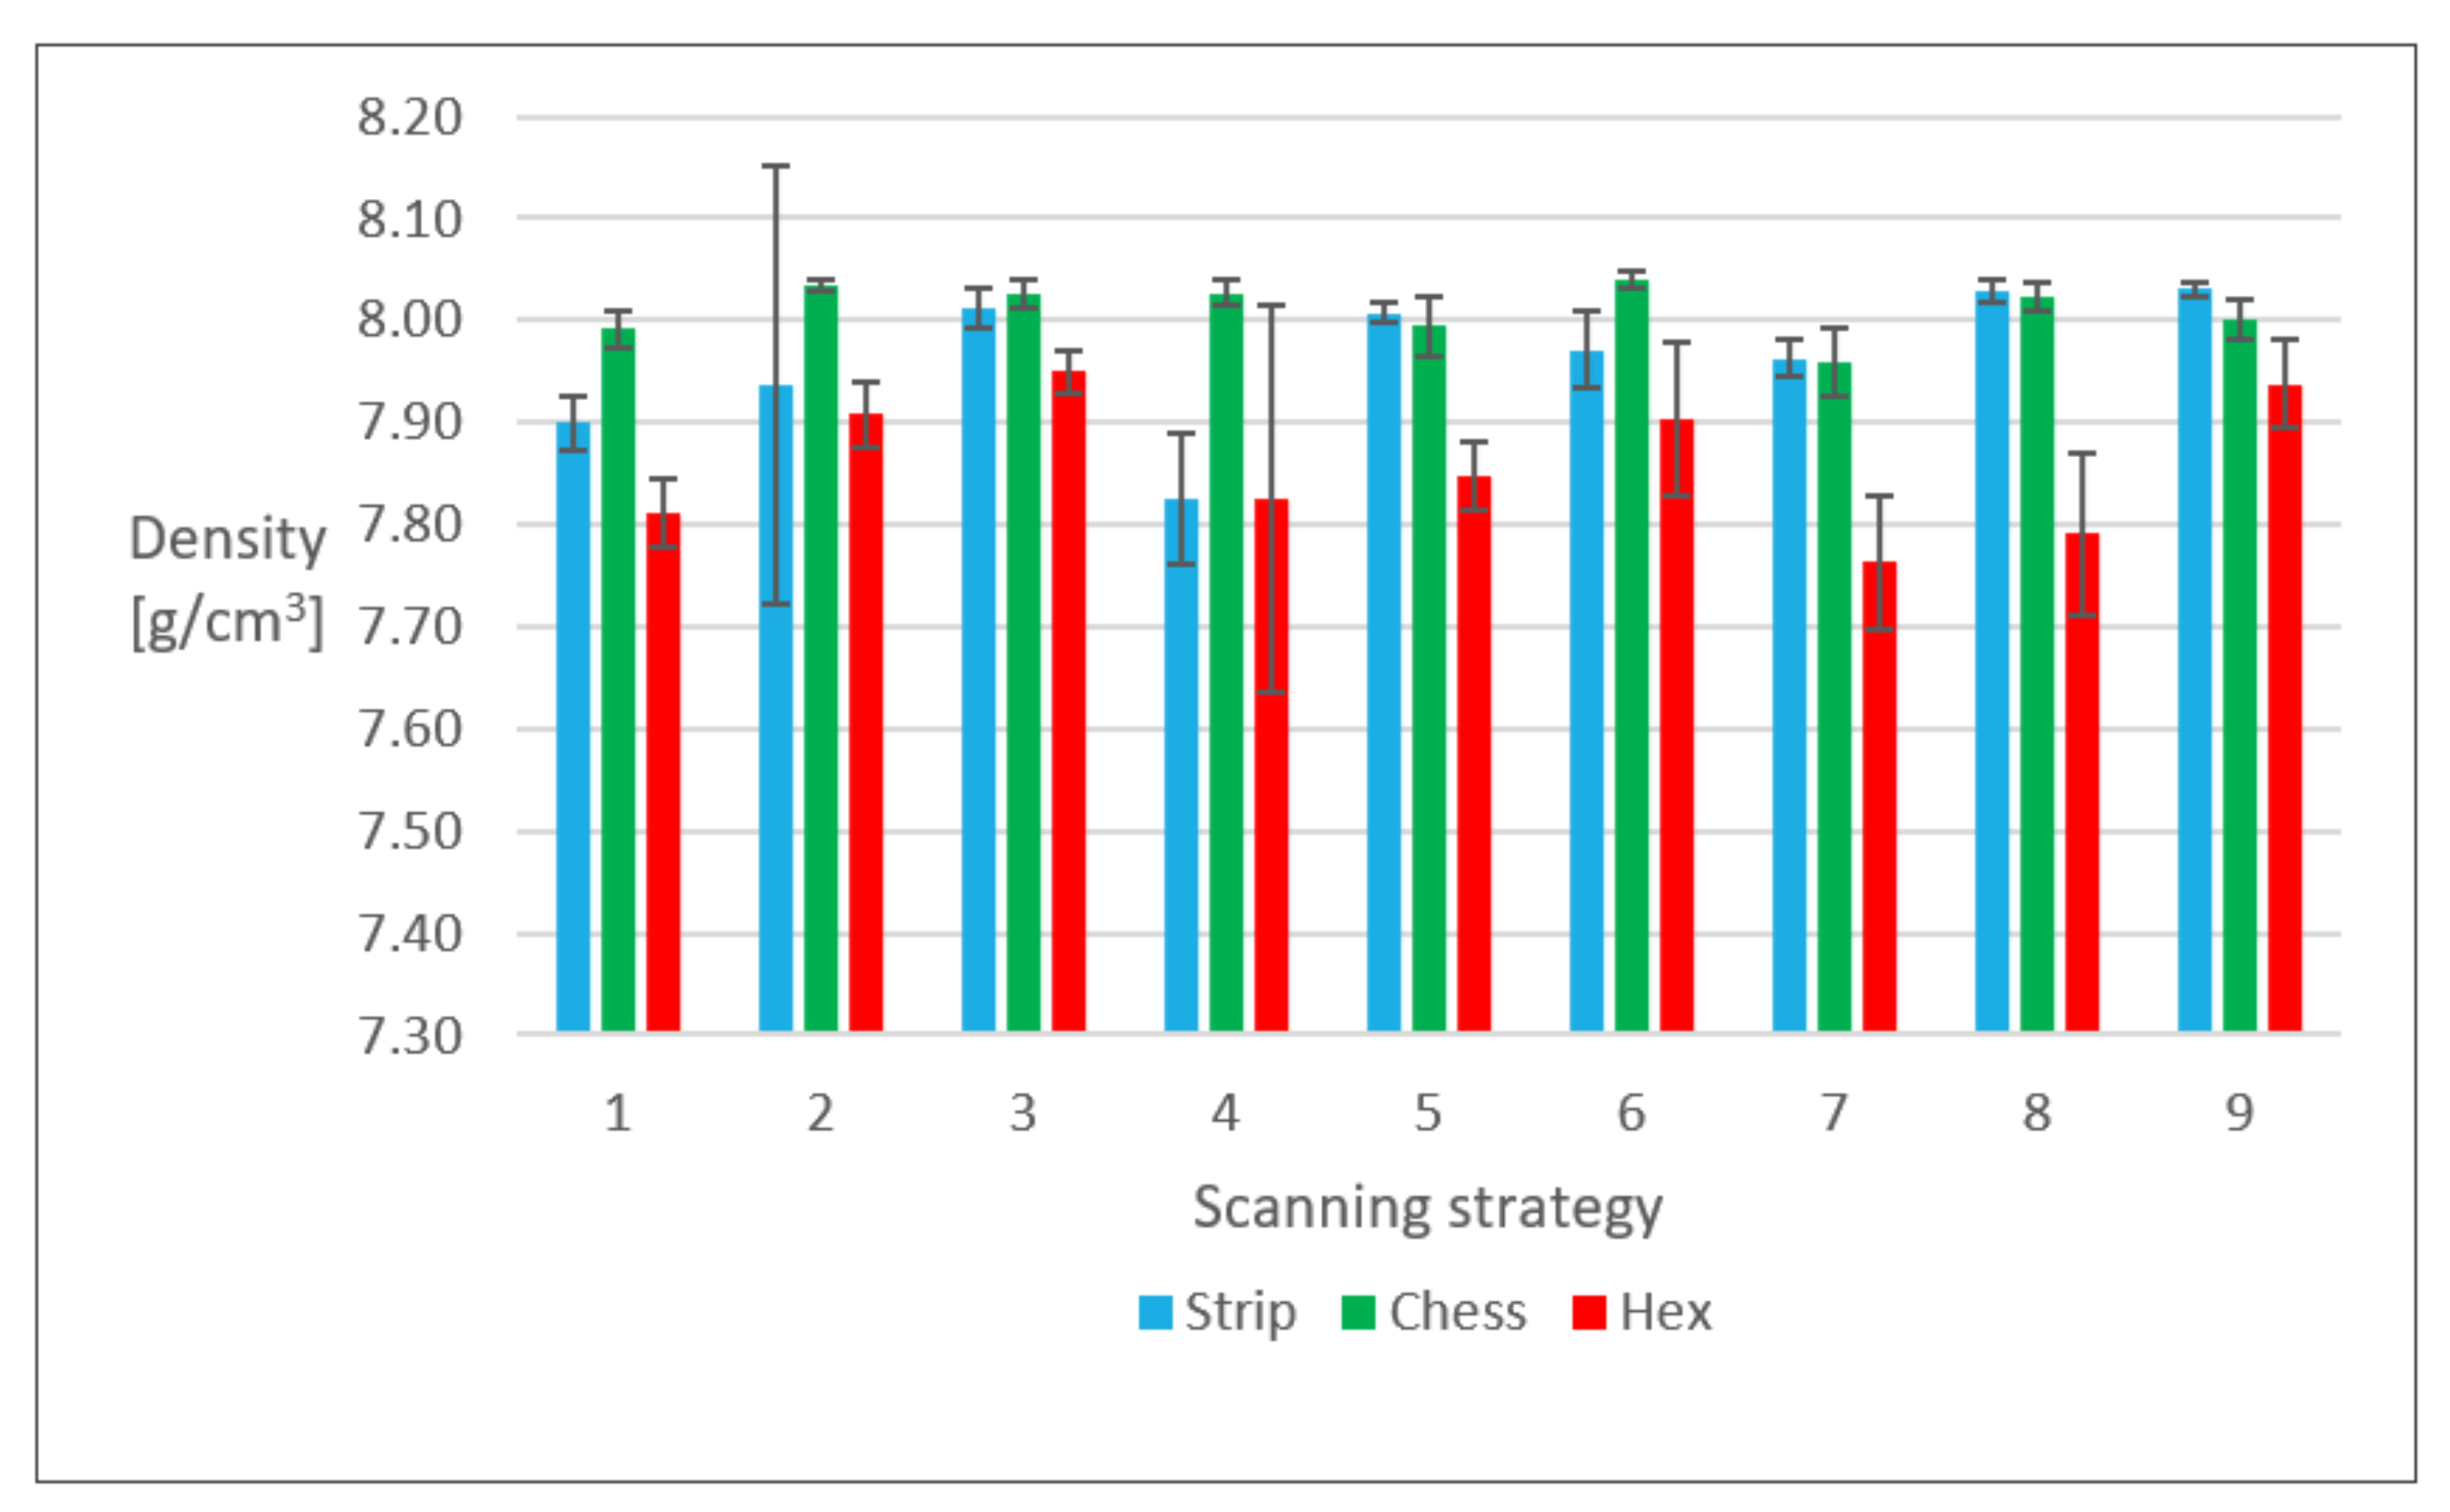
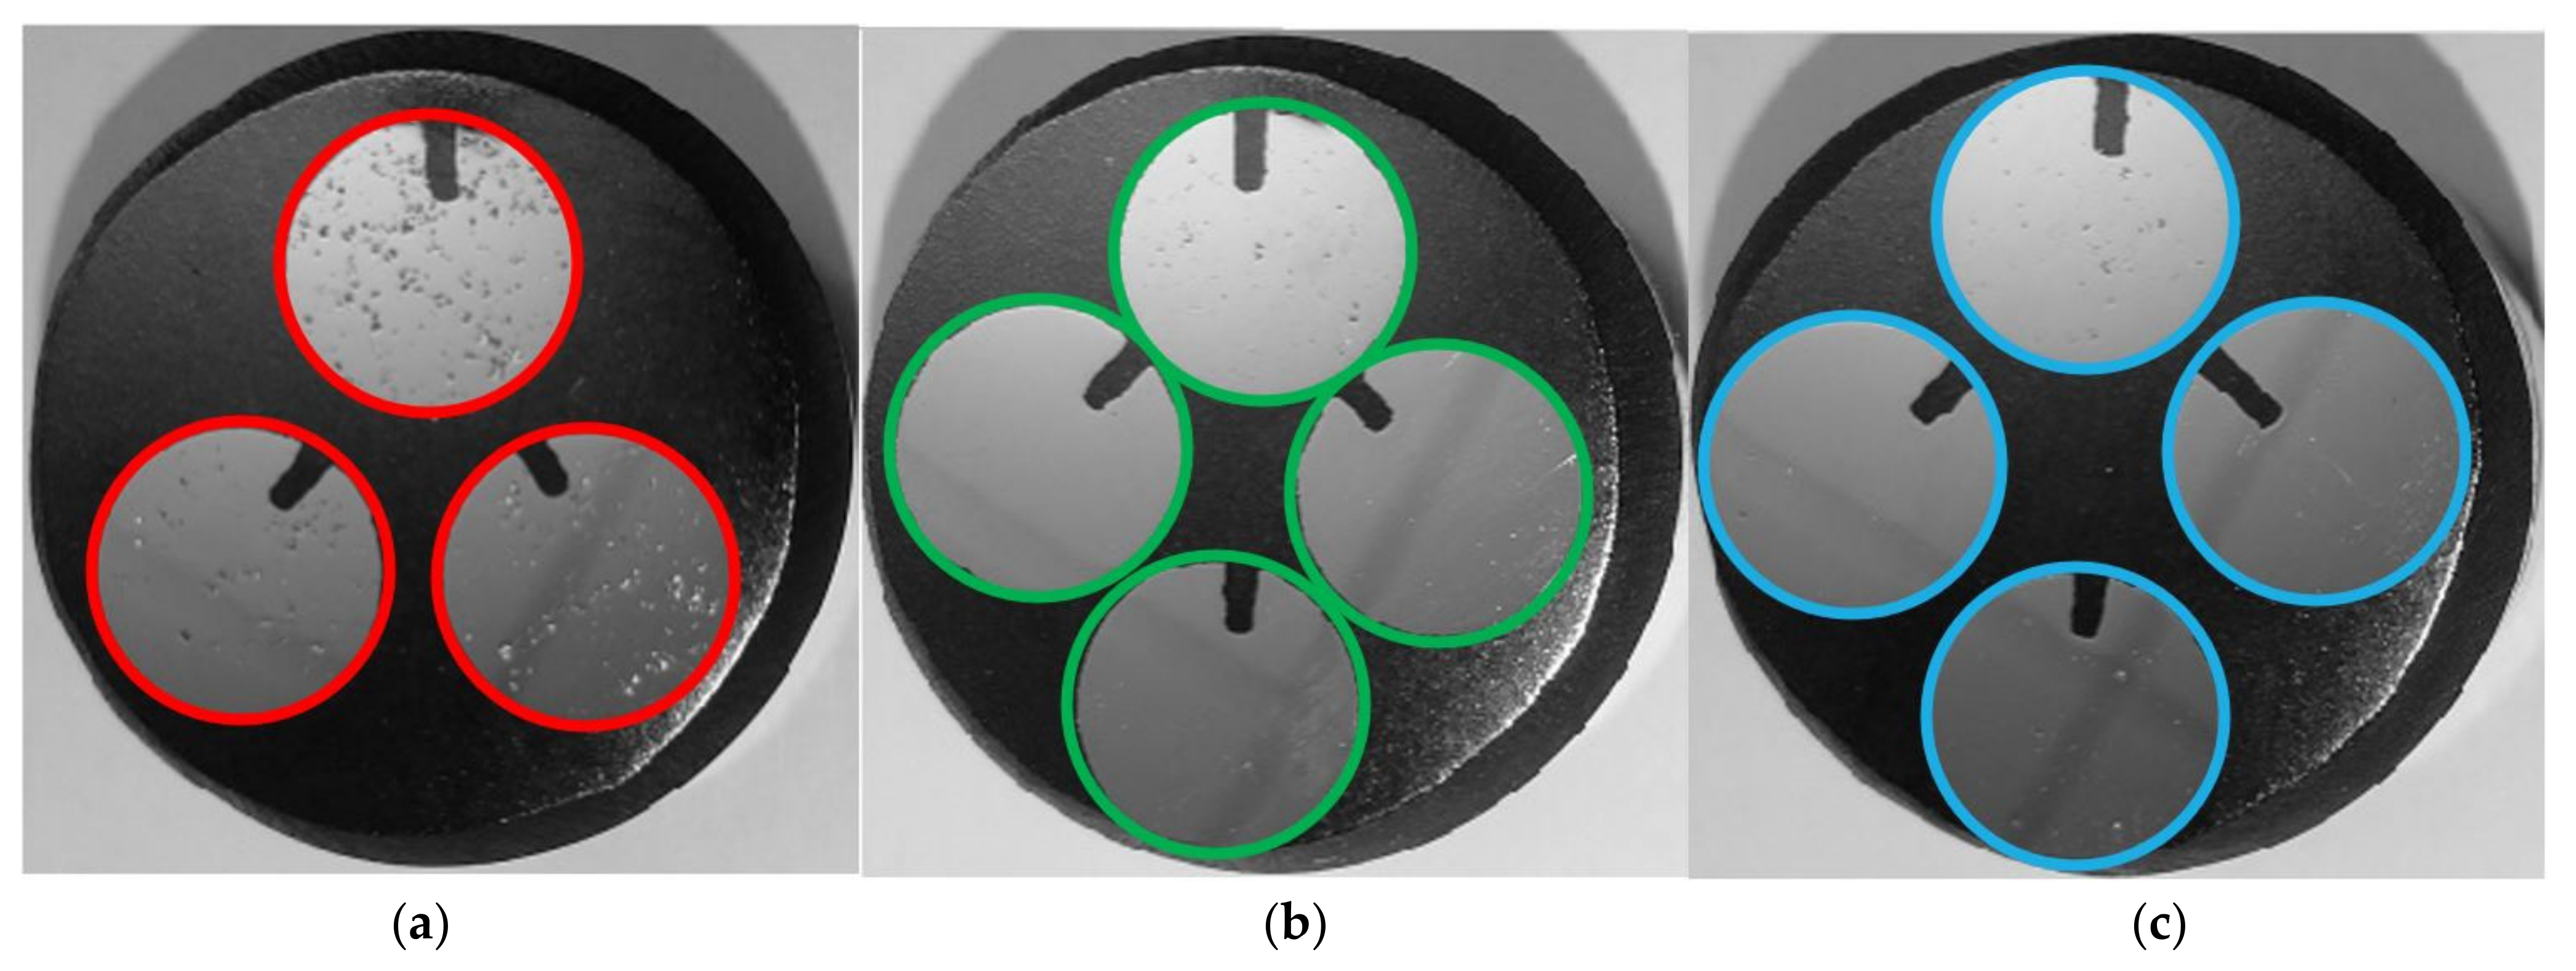
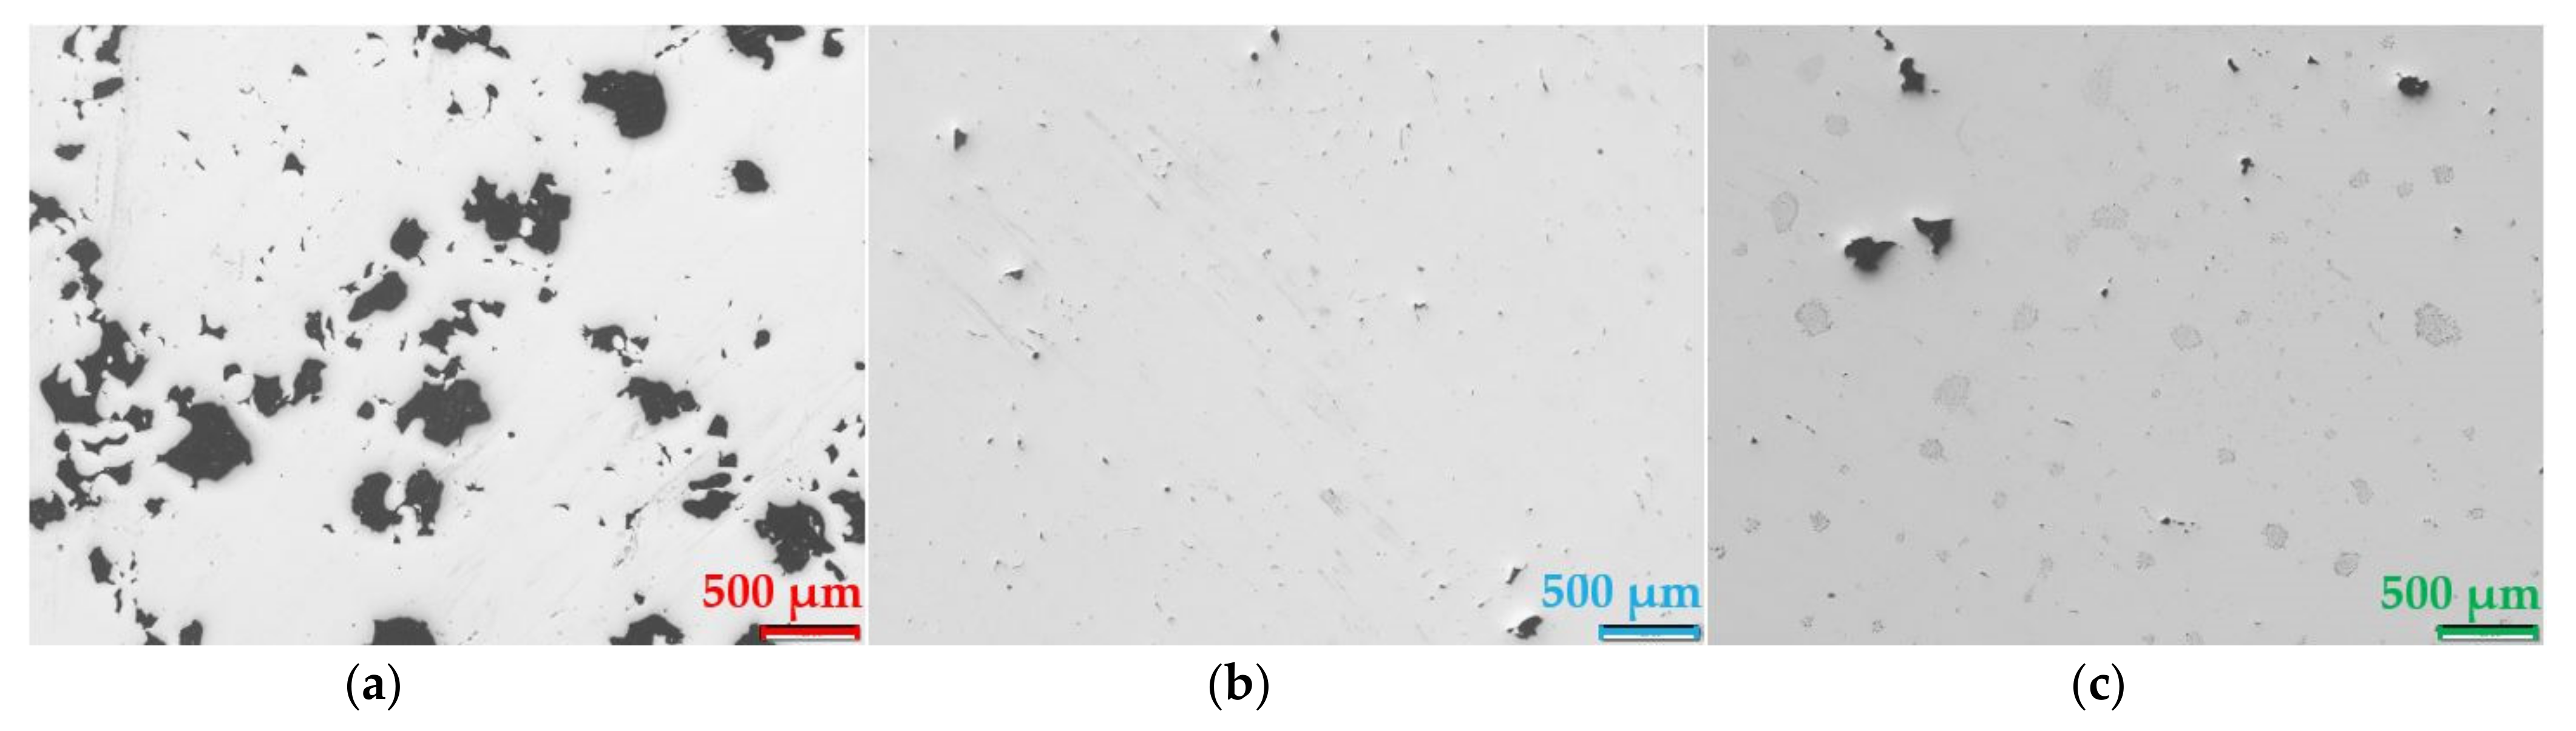
Figure 6 shows the average value and standard deviation of density for each specimen set, produced with different scanning strategies. It is possible to notice that the hexagonal strategy always led to the lowest value, while the chessboard strategy usually led to the highest density. The difference in porosity content can also be noticed with naked eyes (Figure 7) and it becomes even more evident observing the optical micrographs (Figure 8).
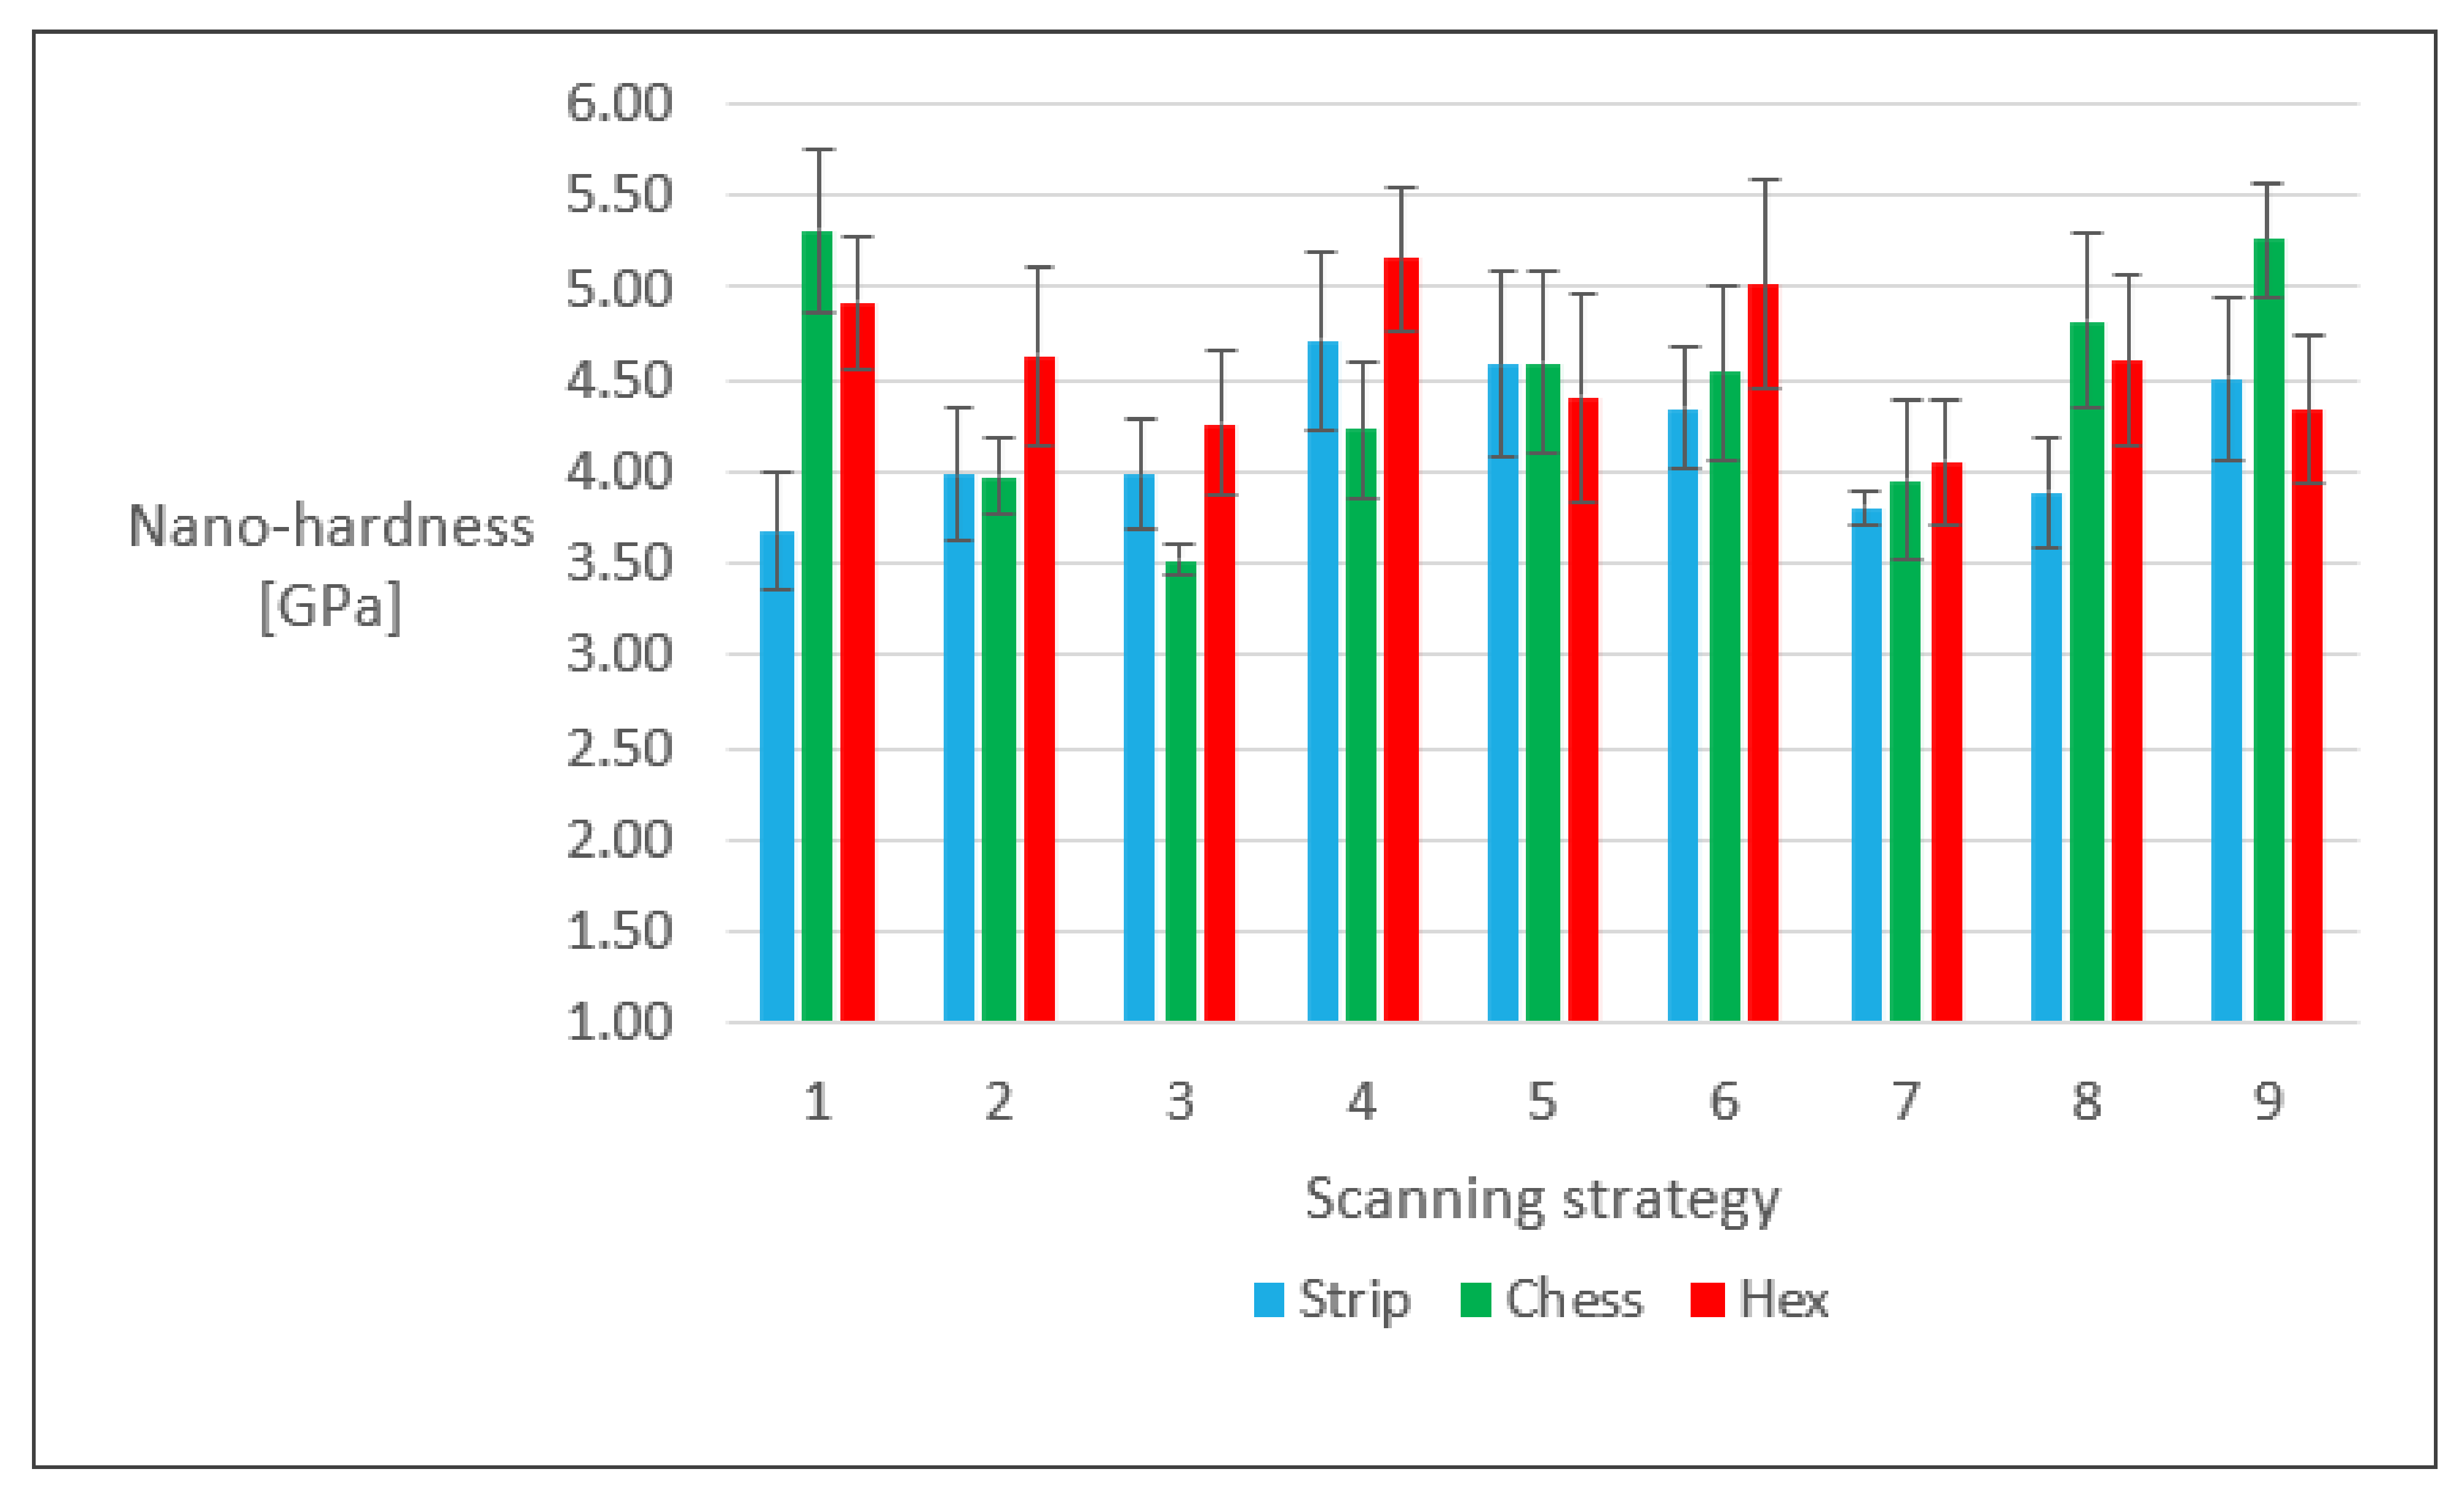
3.4. Nano-Hardness
Matrixes of 12 × 12 and 20 × 20 indentations were carried out on the transverse cross-section of the mounted samples (Figure 7), using a Berkovich triangular pyramid indenter. The distance between every indentation was set to 7 µm and the load was set to 25 mN. Figure 9 shows the values of nano-hardness for each set, relatively to the different scanning strategies. It is not possible to easily distinguish a trend or define which strategy performed better.
4. Discussion
Regression analysis and analysis of variance were performed on the results of the tests. The details of the analyses and the associated quality assertion are found in Appendix A.
As previously reported, the volumetric energy density was kept constant for all the 18Ni300 specimens of all the prints. In particular:
where P is the laser power (W), δ is the layer thickness (mm), h is the hatch spacing (mm) and v is the scan speed (mm/s). P and δ were set as constant, as shown in Table 2, so h and v were proportionally changed to maintain the volumetric energy density constant. Defocus was not considered, even though it is an important process parameter. Regarding the hexagonal strategy, the outside-in method was chosen because it could theoretically lead to compressive and beneficial residual stress in the as-built specimens [53].
4.1. External Diameter
First, it should be noted that there were only oversized dimensions and the stripes and chessboard strategies led to similar deviation values, as shown in Figure 10. The hexagonal pattern showed a greater deviation: 0.26 mm compared to approximately 0.2 mm of stripes and chessboard strategies.
4.2. Average Surface Roughness Ra
Figure 11 shows significant variations in average surface roughness Ra, with the chessboard strategy showing the lowest values and the hexagonal pattern the highest ones. Moreover, the hexagonal pattern showed the highest deviation values. Considering that the density was lower for the hexagonal pattern, there could be a connection between the rough surface and the melting process, resulting in a more porous structure.
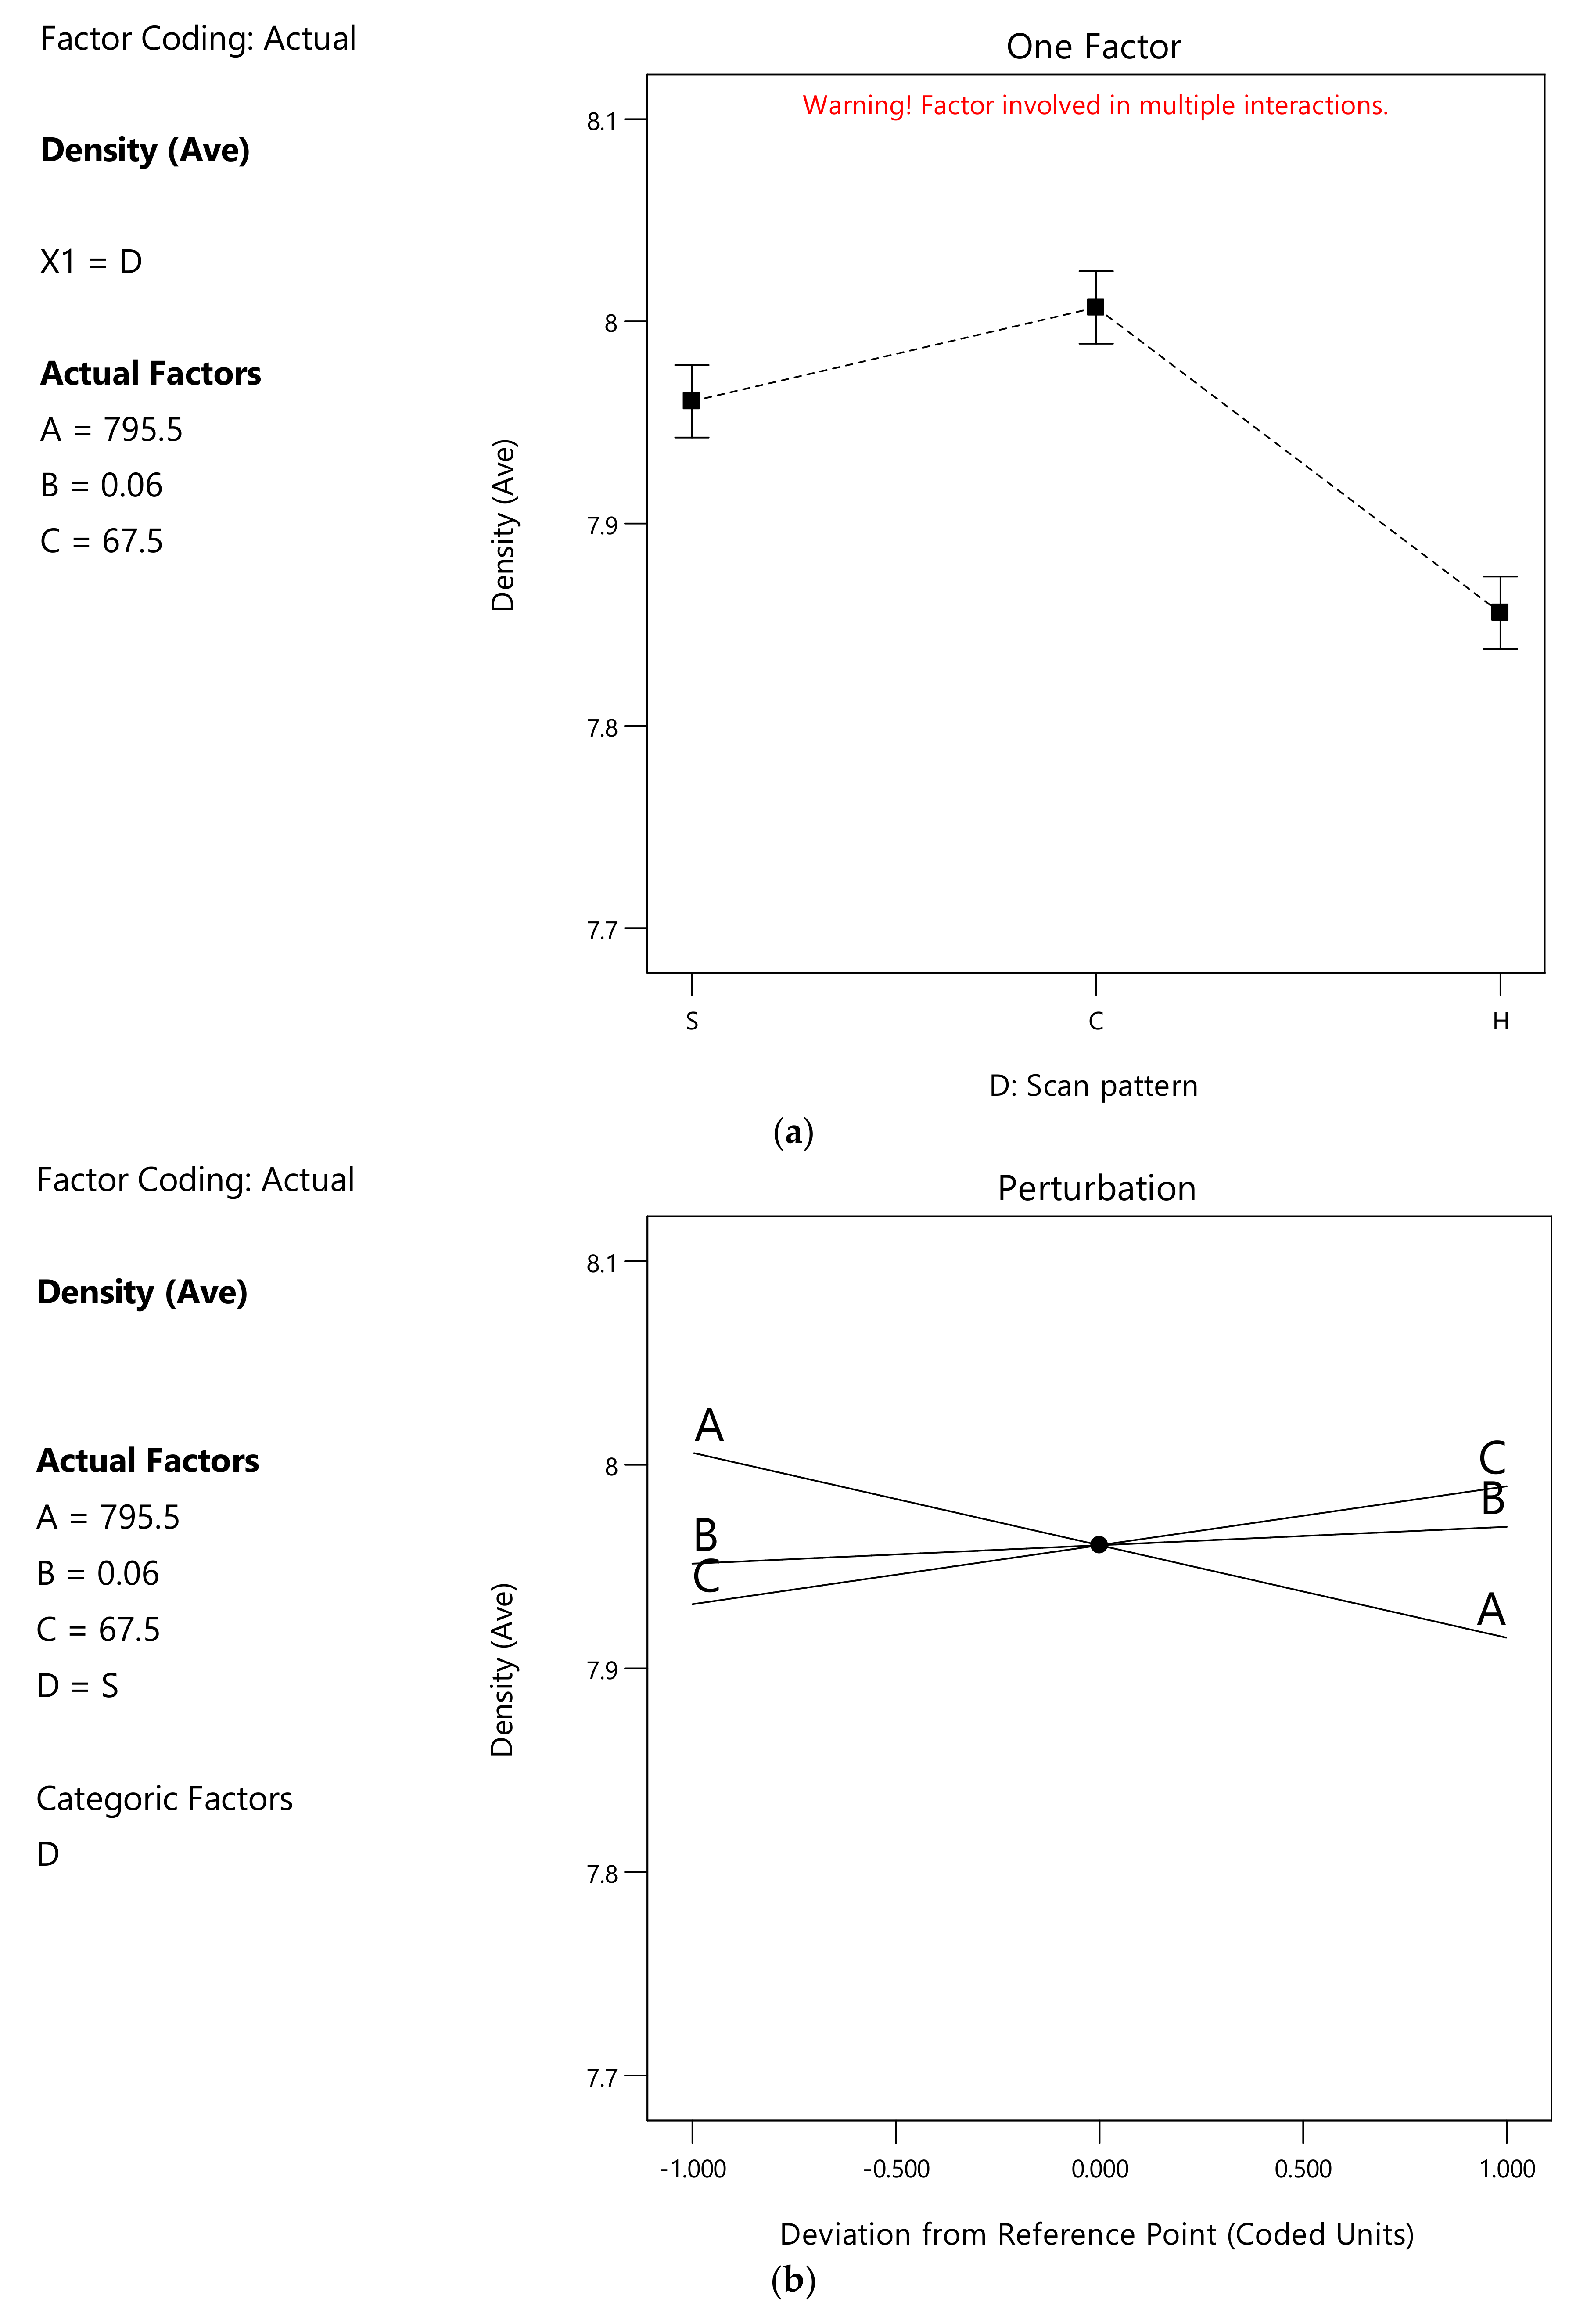
4.3. Density
The variations in density follow the same pattern observed analyzing dimensions and average surface roughness Ra. The chessboard strategy led to the lowest average surface roughness Ra and the highest density. On the other hand, the hexagonal pattern led to the highest average surface roughness Ra, the lowest density and the largest external diameters (Figure 12a). It is possible to state that the location on the plate had no significant influence on the outcomes. These experiments were also done simultaneously, so there was no influence of the powder batch, being the same for all the printed parts.
Therefore, it is possible to affirm that the scanning strategy changes the nature of interaction due to the different thermal history and the structure of the substrate (already printed part), leading to an average surface roughness Ra that may affect the application of the subsequent powder layer.
In the density model, the interaction between the scan strategy, the hatch spacing and the interlayer rotation were considered statistically significant. The influence of the parameters on the density for the stripes pattern is shown in Figure 12b. The density increases with increasing hatch spacing (B) and interlayer rotation (C). Considering the constant Andrew number and the same build height, there is a linear dependence between hatch spacing and scan speed, but scan speed was not statistically significant. Figure 12c shows the influence of the parameters on the density considering the chessboard pattern. The density decreases while increasing the hatch spacing (B) and interlayer rotation (C), highlighting an opposite behavior compared to the stripes strategy. Figure 12d shows the influence of the parameters on the density considering the hexagonal pattern. It is possible to appreciate that hatch spacing and interlayer rotation have opposite effects on density: an increase in hatch spacing (B) increases density while an increase in interlayer rotation (C) results in a density decrease.
The nature of this interaction could not be thoroughly explained and additional investigation would be required.
4.4. Nano-Hardness
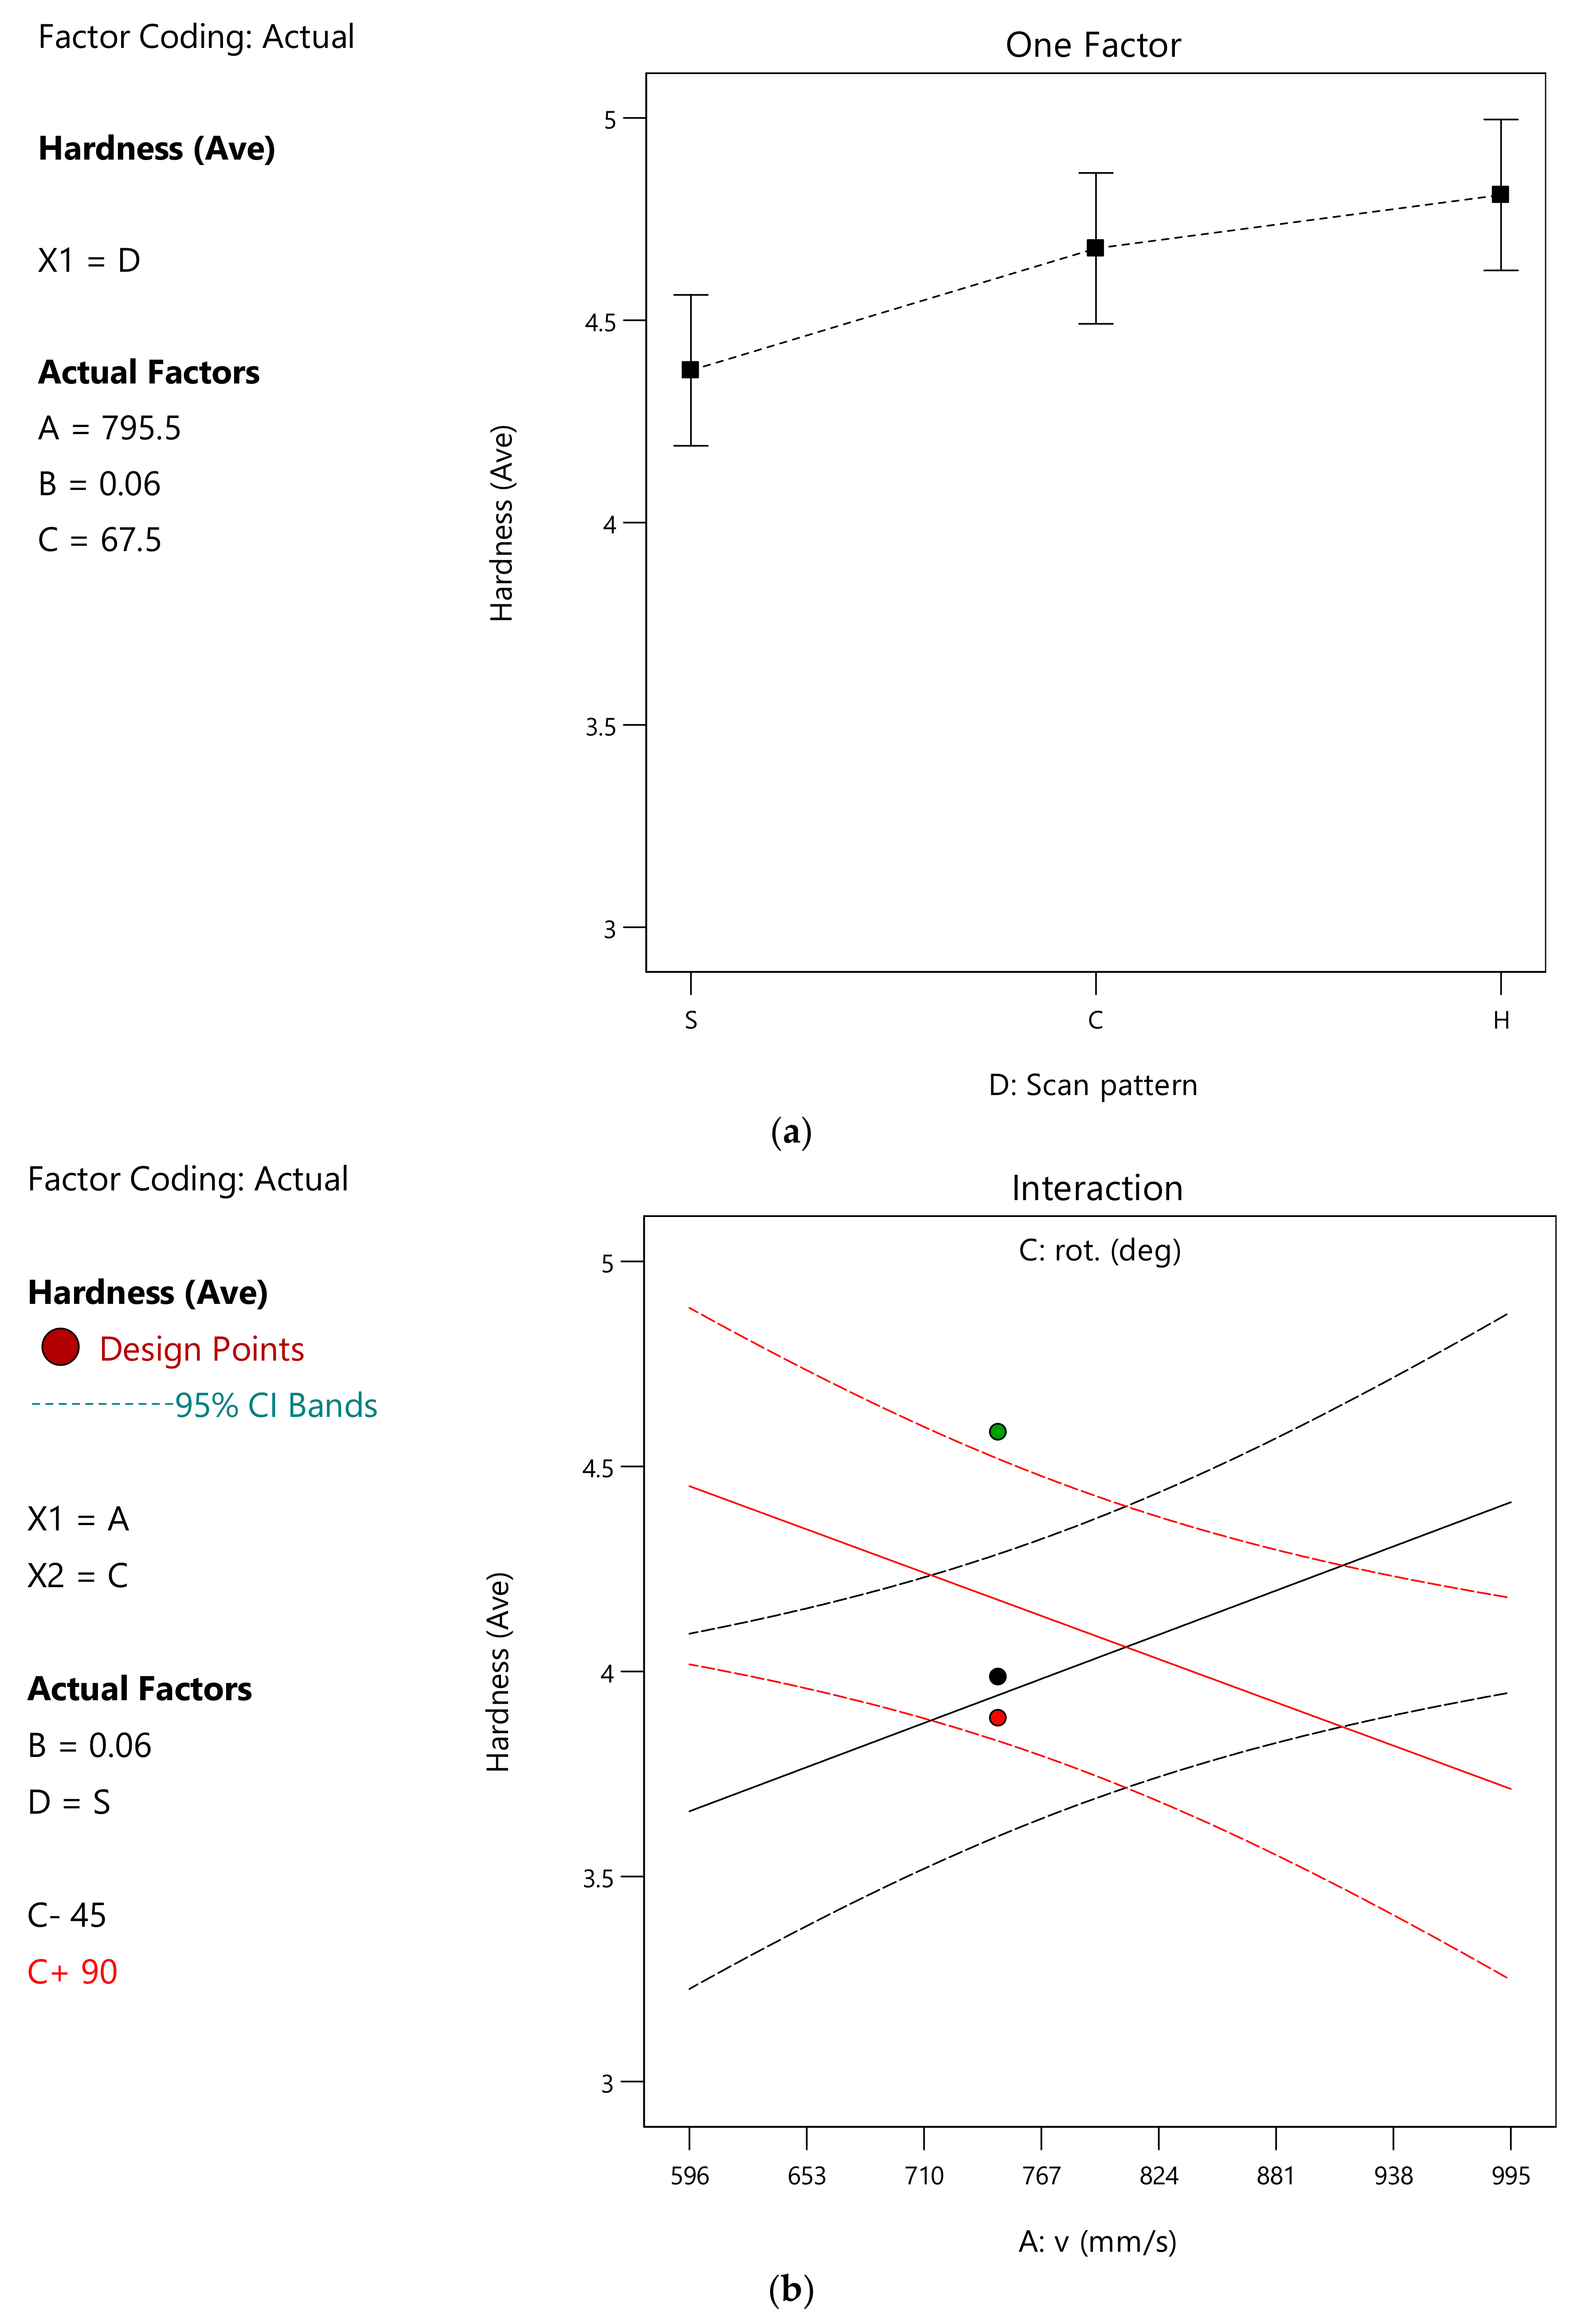
The scanning pattern seems to influence the average hardness but it is only a tendency with significant uncertainty. Figure 13a shows the tendency for the hexagonal pattern to lead to the highest hardness, followed by the chessboard and the stripes strategies. This may be due to the balance between the martensite formation and the retained and reverted austenite that may form due to the different thermal histories [54]. This also suggests that the hexagonal pattern cools slightly more and is reheated to a slightly lower temperature for a shorter time, which is consistent with the slightly higher porosity and lower density. These observations also suggest that there is a significant sensitivity to the thermal history.
Moreover, considering the stripes strategy scanning each square from left to right, a rotation of the scanning pattern would shift the scan into an area scanned earlier or later, depending on the rotation degrees. Figure 13b shows the interaction between the scanning speed and the interlayer rotation: the −45° rotation gives an increasing hardness with an increasing scanning speed, whereas for the +90° rotation there is the opposite correlation.
Considering Figure 5, Figure 6 and Figure 9, it is possible to notice that the hexagonal scanning strategy always performed worse than the other two. A possible reason why the hexagonal strategy induced bigger external diameter, higher average surface roughness Ra and higher porosity could be an increased spatter effect. This increased spatter could be induced by the longer path needed to scan the area related to the single specimen. With the hexagonal strategy, the time elapsed between the scan of adjacent tracks was slightly longer than with the other two strategies, leading to variations in the local thermal distribution, affecting the final quality of the part and inducing lack of fusion porosities. This observation is also supported by the tendency towards a higher hardness, implying lower amounts of retained and reverted austenite because the already scanned track would tend to be lower in temperature than the counterparts related to the other strategies. When the laser scanned the adjacent track, more heat was required to heat the surroundings, leading to an increased spatter effect. Moreover, the spatter led to the shadow effect, preventing the proper melting of the powders below the spattered particles.
5. Conclusions
This work aimed to investigate the effect of scanning strategy and the main process parameters on the 18Ni300 maraging steel parts produced through the L-PBF process.
The volumetric energy density (Andrew number), the laser power and the layer thickness were kept constant so scan speed and hatch spacing changed in a dependent way. In addition, the rotation between adjacent layers and the scan strategy were changed. The main objective was to study the interaction between the process parameters and the chosen scan strategy, considering the parallel stripes, the chessboard and the hexagonal ones, to better understand Andrew number shortcomings as a sufficient materials quality index.
In general, the hexagonal strategy underperformed compared to the chessboard and the stripes ones. In fact, the hexagonal strategy led to lower density, higher average surface roughness Ra and larger diameter. One possible cause of this could be that the hexagonal pattern involves a longer time lapse between the scan of two adjacent tracks compared to the other two strategies. So, the previously scanned tracks would be cooler than their counterparts of other strategies. The hardness of the material produced using the hexagonal pattern was also higher, supporting the idea of a higher cooling rate because of the increased time, on average, between each scan track. Unfortunately, increased spatter is an outcome. Spatter would cause shadowing, preventing proper melting of the powders below the spattered particles, obtaining greater average surface roughness Ra and lower density.
In particular, there are two effects due to the increased spatter: the optical shadowing and the increase of the local thickness of the layer. Both are preventing the proper penetration of the laser through the underlying layer and some particles surfaces could be prevented from heating by shadows of other particles or by the particles themselves, with detrimental effects. Moreover, the melting of the shadowed particle would be not simultaneous, affecting the final quality of the part. Melting larger particle clusters requires time, so an increased scan speed resulted for all scan strategies in a decreased density, providing further evidence to the hypothesis.
It is important to understand that short scanning vector length and the scanning time interval between two adjacent scanning vectors change the in-plane temperature gradient but, considering the volume of the part and its overall thermal history, the scanning pattern and its rotation will have significant effects. Parry et al. [38] state that long scan vectors should be avoided. This was implicitly seen in the hardness data and the sensitivity to the scan directions in Figure 13b with longer scan vectors resulted in higher hardness values which can be attributed to the associated higher cooling rates.
The sensitivity to the thermal history was furthermore highlighted by the influence of the interlayer rotation. Changing the interlayer rotation from 45° to 90° resulted in an opposite effect of scan speed on hardness: scanning perpendicularly to the previous layer caused a hardness reduction, while a diagonal scan caused a hardness increase.
Another important topic related to the patterns involving parallel scan lines in the layer (hexagonal and stripes patterns) is that the increased hatch spacing had a positive influence on density. On the other hand, the chessboard pattern was dominated by the islands, so the same effect was not seen and an increased hatch spacing resulted in a reduced density. This could be related to the findings by Lu et al. [42], where the amount and size of pores decreased significantly with increasing the island size. The reason for this is still not fully understood and requires further investigation.
Author Contributions
For the current paper, the contributions were: conceptualization, A.E.W.J. and R.S.; methodology, F.R., A.E.W.J. and R.S.; investigation, F.R.; writing—original draft preparation, F.R. and A.E.W.J.; writing—review and editing, F.R., A.E.W.J., R.S. and L.C.; supervision, A.E.W.J. and L.C.; project administration, A.E.W.J. and L.C. All authors have read and agreed to the published version of the manuscript.
Funding
This research received no external funding.
Data Availability Statement
The data presented in this study are available on request from the corresponding author. The data are not publicly available due to third party disclosure restrictions in a collaboration agreement.
Acknowledgments
3D Systems and the PLM Group are acknowledged for troubleshooting printing issues.
Conflicts of Interest
The authors declare no conflict of interest.
Appendix A. Details of the ANOVA Analysis
The details of the ANOVA analysis are reported in this appendix, including the analysis of data quality.
Appendix A.1. ANOVA Analysis of the External Diameter
A significant model could be established to model the external diameter, whose details are reported in Table A1. The F-value equal to 4.65 implies that the model is significant and there is only a 1.97% chance that an F-value this large could occur due to noise. p-Values lower than 0.0500 mean that the model terms are significant, while values greater than 0.1000 mean that the model terms are not significant. In this case, D is a significant model term.

Table A1.
ANOVA results: External Diameter.
| (a) ANOVA for Reduced Linear model Response 1: Diam (Ave). | ||||||
| Source | Sum of Squares | df | Mean Square | F-Value | p-Value | Comment |
| Model | 0.0185 | 2 | 0.0092 | 4.65 | 0.0197 | significant |
| D-Scan pattern | 0.0185 | 2 | 0.0092 | 4.65 | 0.0197 | significant |
| Residual | 0.0476 | 24 | 0.002 | - | - | - |
| Cor Total | 0.0661 | 26 | - | - | - | - |
| (b) ANOVA Quality measures for Reduced Linear model Response 1: Diam (Ave). | ||||||
| Entity | Value | Entity | Value | |||
| Std. Dev. | 0.0445 | R2 | 0.2793 | |||
| Mean | 10.22 | Adjusted R2 | 0.2192 | |||
| C.V.% | 0.4358 | Predicted R2 | 0.0878 | |||
| - | - | Adeq Precision | 3.9327 | |||
Considering the quality of determination, Table A1 reports the Predicted R2 equal to 0.0878 and the Adjusted R2 equal to 0.2192, so, being the difference less than 0.2, there is no significant effect from grouping the results.
The Adeq Precision measures the signal to noise ratio and a ratio of 3.93 indicates an inadequate signal, so the model lacks a quantitative capability and it should not be used to navigate the design space (only qualitative analysis is possible). This is also related to the low R2, equal to 0.2793.
It is vital to notice that, with a constant Andrew number, the chosen scanning strategy alone influenced the external dimensions.
The resulting regression formula for the external diameter (mm) was:
where:
- -
- SP is 1 for the stripes pattern, otherwise it is equal to 0.
- -
- CP is 1 for the chessboard pattern, otherwise it is equal to 0.
- -
- HP is 1 for the hexagonal scanning strategy, otherwise it is 0.
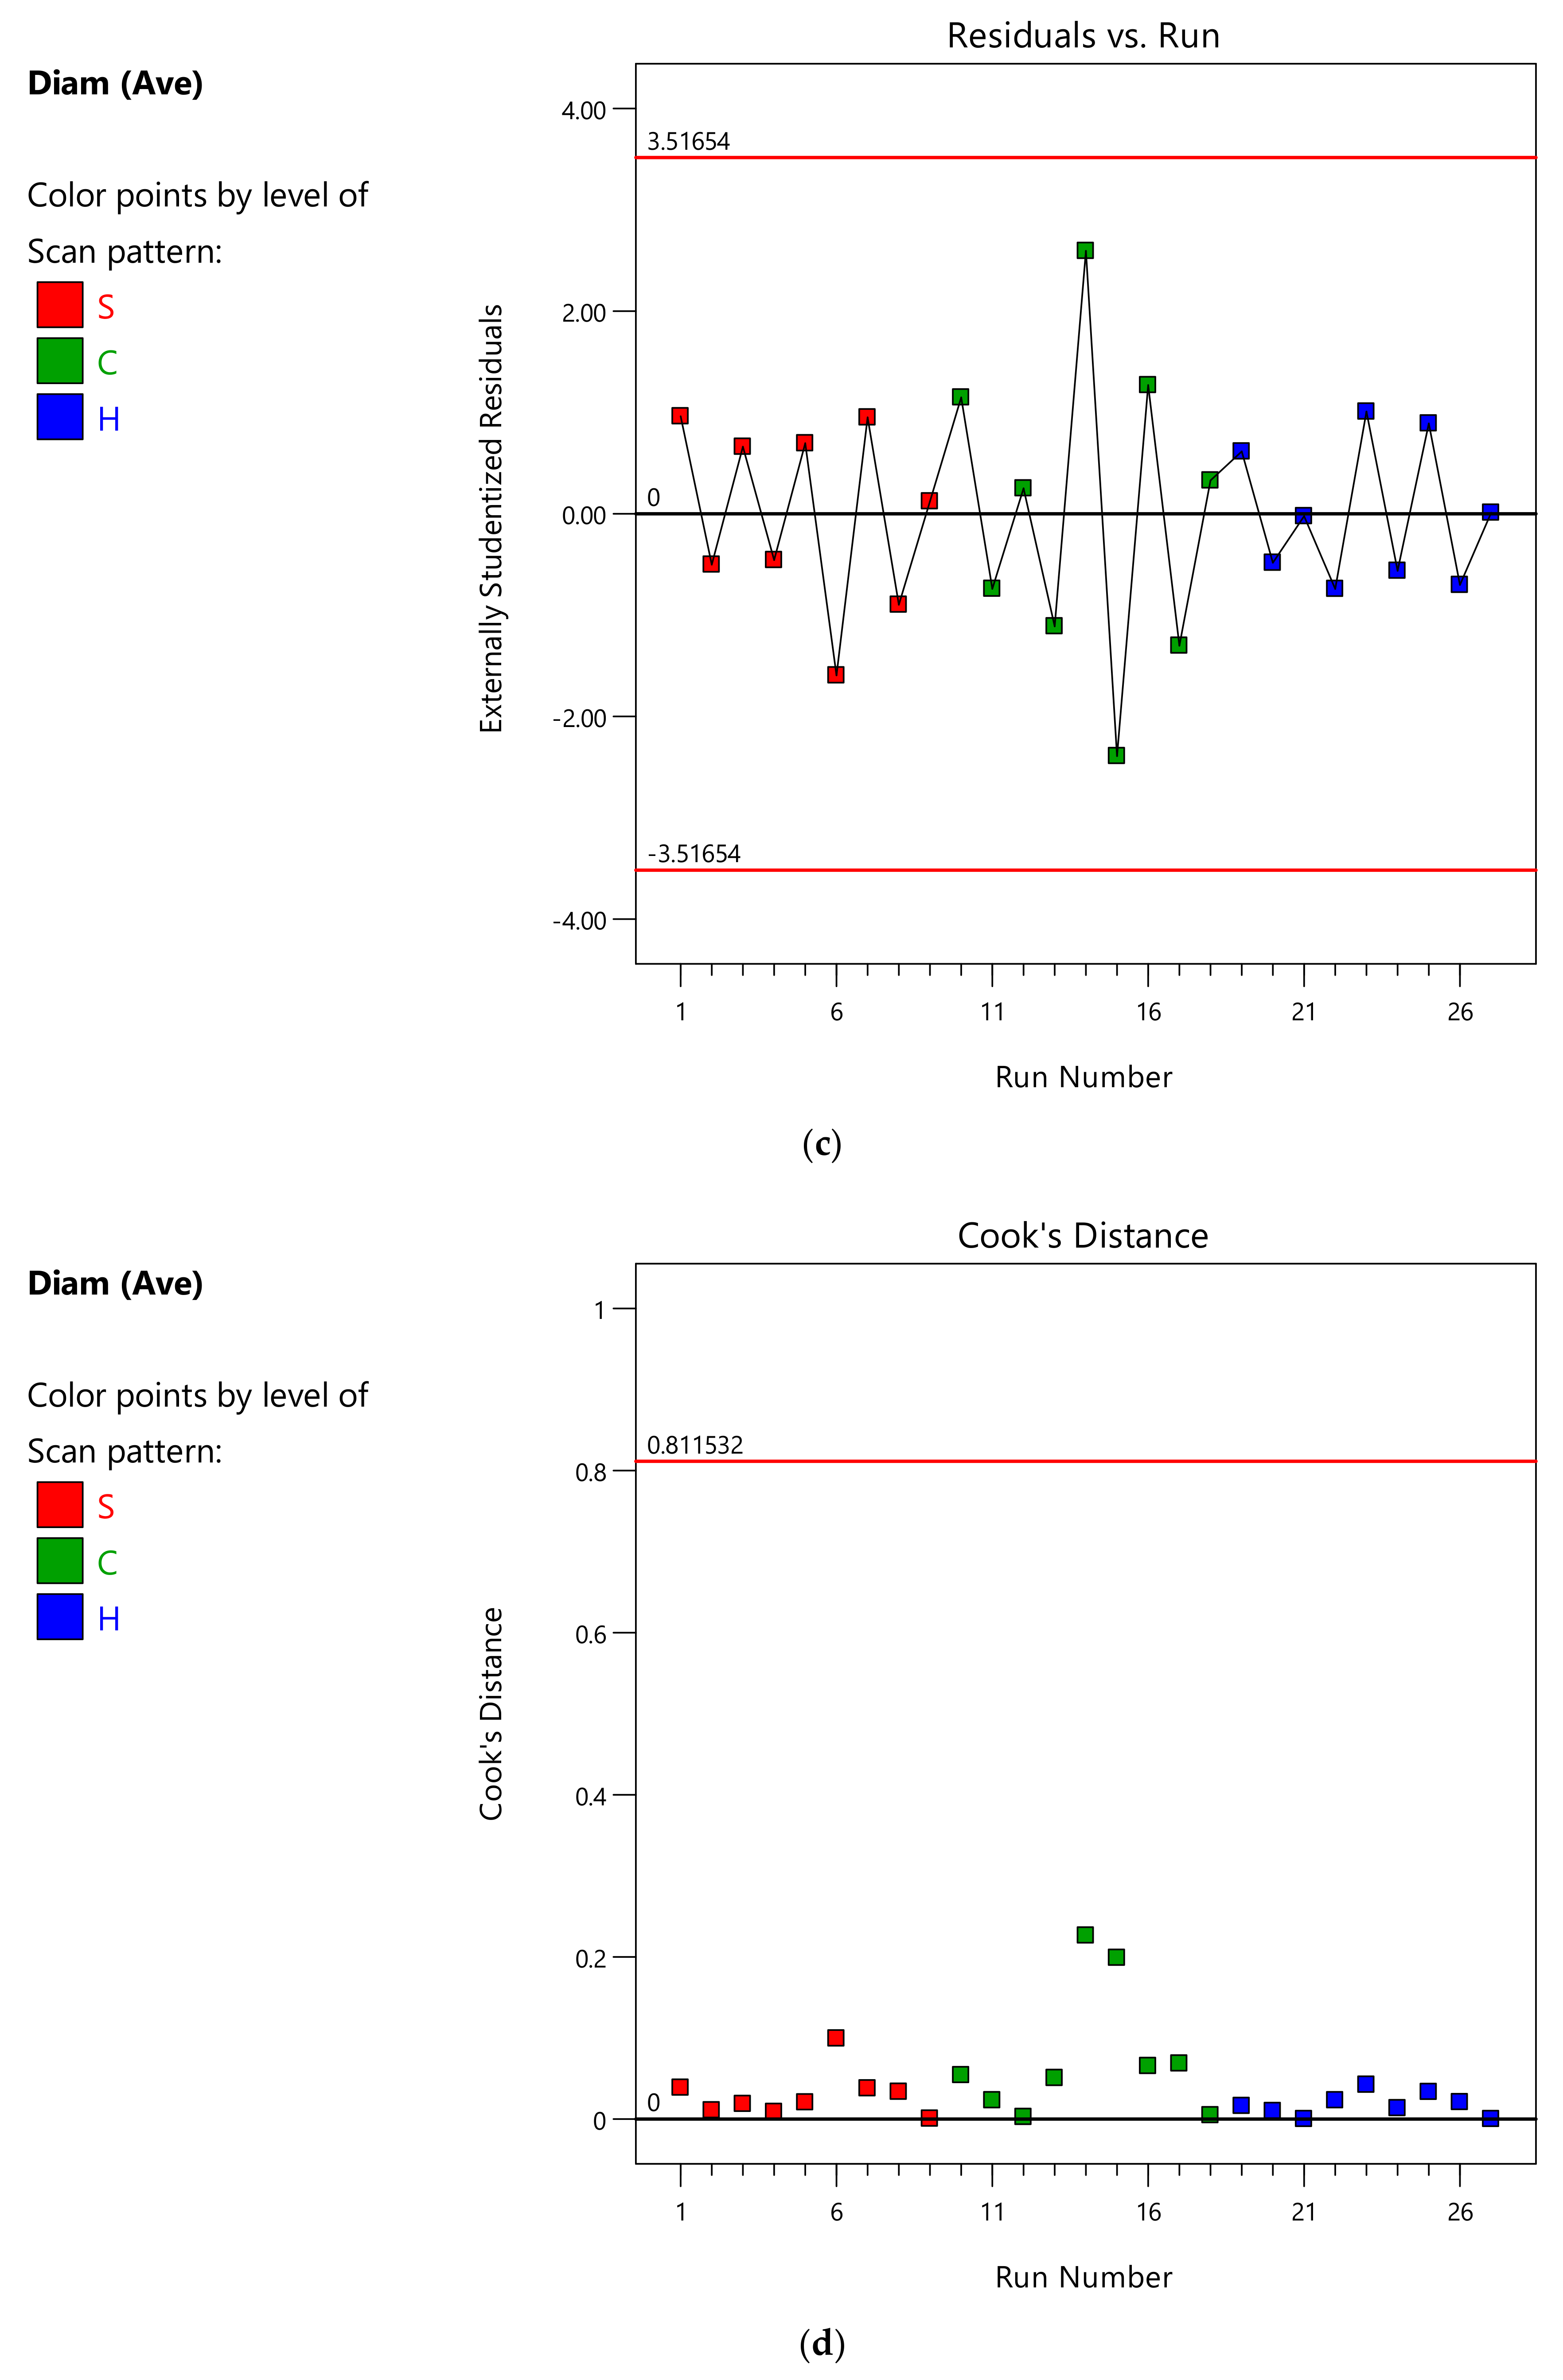
Concerning the statistical quality assertion of the results, the first criterion consists of random errors around the model, with residuals having a Gaussian distribution. Figure A1a shows a good fit. The residuals should also be independent of the magnitude of the predicted value and this is shown in Figure A1b. However, the result was noise dominated, having studied only one diameter. Moreover, the residuals should be independent of the location and sequence of the experiments, and Figure A1c correctly shows no visible pattern.
Figure A1d shows the outliers that must be studied because they tend to skew and dominate the results, but the results were acceptable.
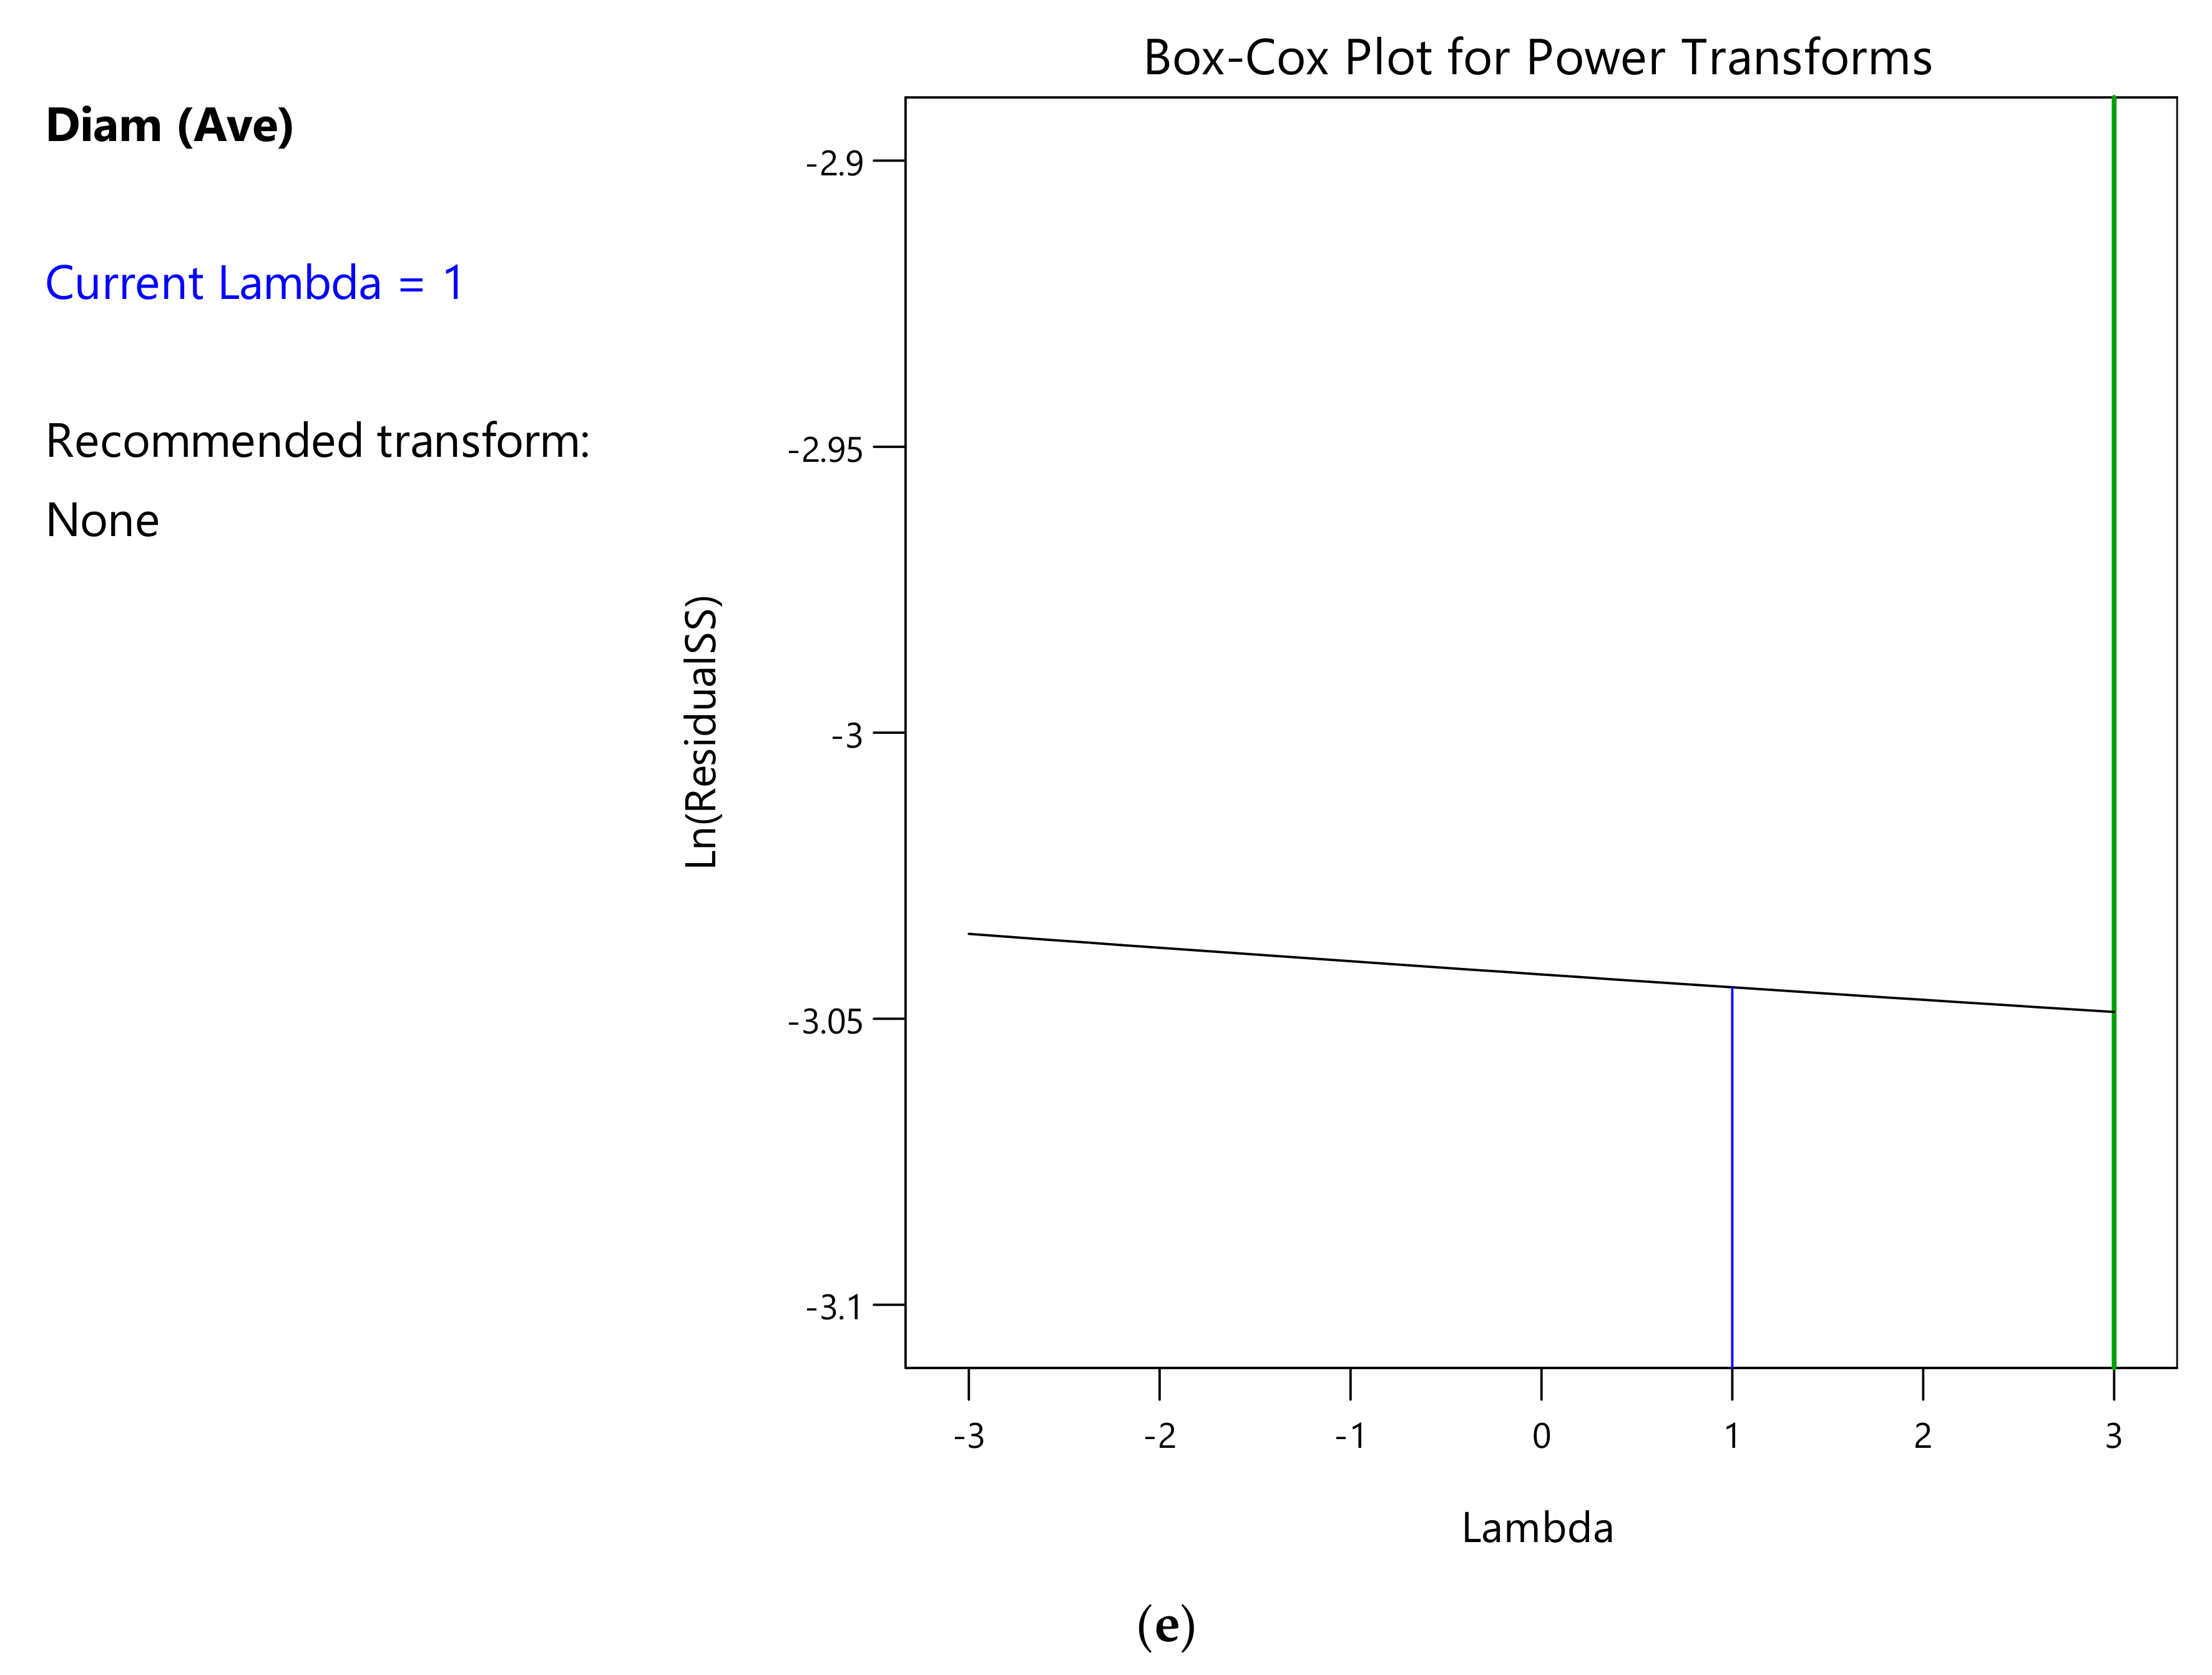
Figure A1e is a Box-Cox plot and it is used to check the need for a transformation when a non-linear correlation or to the power of an integer occurs. This was not necessary for the analysis of the diameter.
Figure A1.
Statistical quality assertion: (a) Half-Normal plot vs. Externally studentized residuals for random error check, (b) Residuals vs. predicted value for independent residuals, (c) Residual vs. run for the absence of variation from printing location, (d) Cook’s distance plot for identification of outliers and (e) Box-Cox plot to identify any need of a transformation of the response.


Appendix A.2. ANOVA Analysis of the Average Surface Roughness Ra
A significant model could be established to model the average surface roughness Ra, with an F-value equal to 7.44. Table A2 shows all the relevant values. In particular, there is only a 0.31% chance that an F-value this large could occur due to noise, so the scan strategy is a significant model term.
Table A2.
ANOVA results: Average surface roughness Ra.
| (a) ANOVA for Reduced Linear model Response 1: Average surface roughness Ra. | ||||||
| Source | Sum of Squares | df | Mean Square | F-Value | p-Value | Comment |
| Model | 31.78 | 2 | 15.89 | 7.44 | 0.0031 | significant |
| D-Scan pattern | 31.78 | 2 | 15.89 | 7.44 | 0.0031 | significant |
| Residual | 51.26 | 24 | 2.14 | - | - | - |
| Cor Total | 83.03 | 26 | - | - | - | - |
| (b) ANOVA Quality measures for Reduced Linear model Response 1: Average surface roughness Ra. | ||||||
| Entity | Value | Entity | Value | |||
| Std. Dev. | 1.46 | R2 | 0.3827 | |||
| Mean | 15.28 | Adjusted R2 | 0.3312 | |||
| C.V.% | 9.56 | Predicted R2 | 0.2187 | |||
| - | - | Adeq Precision | 5.4346 | |||
Considering the quality of determination, Table A2 reports the Predicted R2 equal to 0.2187 and the Adjusted R2 equal to 0.3312, so, being the difference less than 0.2, there is no significant effect from grouping the results. However, the Adeq Precision is equal to 5.435, exceeding the required threshold of 4.
As the external dimensions, the average surface roughness Ra is dominated by the scan strategy, being the Andrew number constant.
The resulting regression formula for average surface roughness (Ra) (µm) was:
Where:
- -
- SP is 1 for the stripes pattern, otherwise it is equal to 0.
- -
- CP is 1 for the chessboard pattern, otherwise it is equal to 0.
- -
- HP is 1 for the hexagonal scanning strategy, otherwise it is 0.
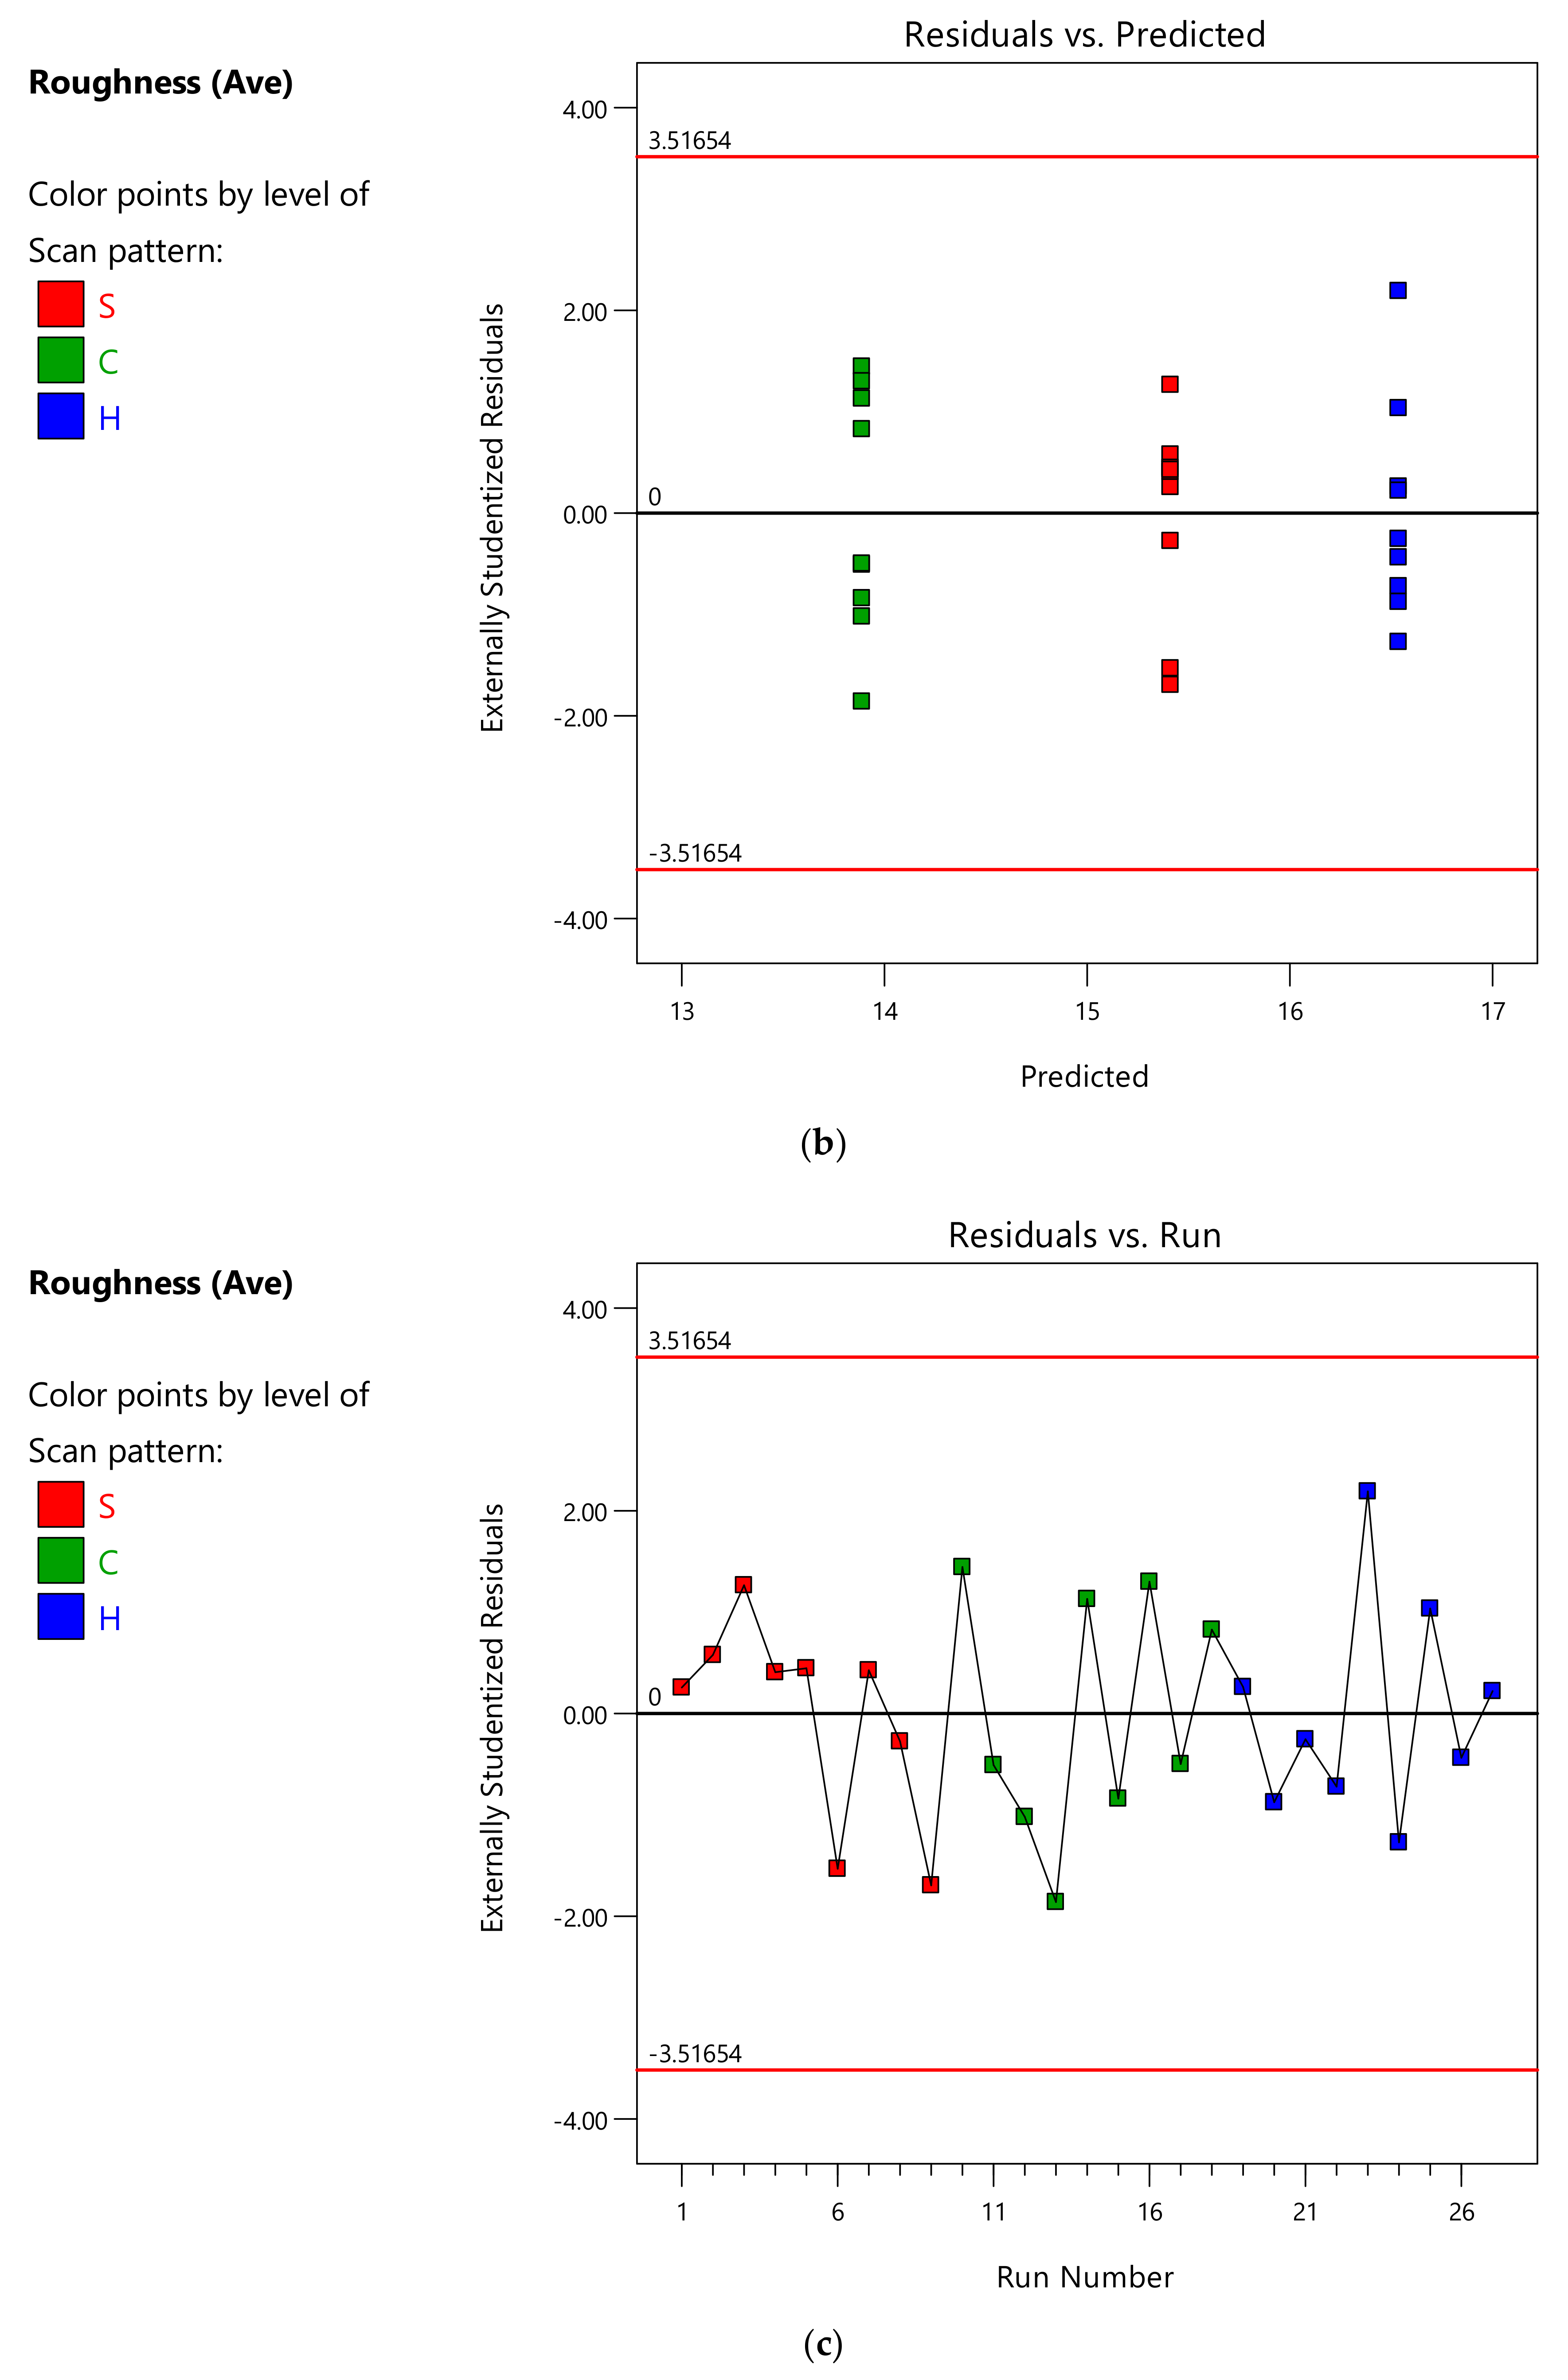
Figure A2a shows that residuals almost fit the Gaussian distribution.
Figure A2b shows that the residuals were also independent of the magnitude of the predicted value. The absence of patterns means that no influence of the locations can be assumed, as shown in Figure A2c. Moreover, no outliers could be found (Figure A2d) and the Box-Cox plot (Figure A2e) also revealed a near-optimum model.
Figure A2.
Statistical quality assertion: (a) Half-Normal plot vs. Externally studentized residuals for random error check, (b) Residuals vs. predicted value for independent residuals, (c) Residual vs. run for the absence of variation from printing location, (d) Cook’s distance plot for identification of outliers and (e) Box-Cox plot to identify any need of a transformation of the response.


Appendix A.3. ANOVA Analysis of the Density
A significant model could be established to model the density, whose details are reported in Table A3. The F-value is equal to 14.06, with only a 0.01% chance that an F-value this large could occur due to noise. As before, the scan strategy was a significant model term.
Compared to the models related to external dimensions and average surface roughness, the interaction between the interlayer rotation and the scan strategy was a significant term. The interaction between hatch spacing and the scan strategy (BD) was not significant, having a p-Value equal to 0.0614. However, since the p-Value was not greater than 0.1000, it should not be disregarded. This suggests a change of the physics due to the scan strategy and the parameters. For instance, single-track experiments cannot fully describe the interactions, as the conditions of the adjacent track will affect the outcome and the conditions of the layer below. It should be noted that the individual contribution of scan speed, hatch spacing and interlayer rotation were all non-significant, as their p-Values were all greater than 0.1000, but they were kept for demonstrative purpose.
Considering the quality of determination, Table A3 reports the Predicted R2 equal to 0.7200 and the Adjusted R2 equal to 0.8188, so, being the difference less than 0.2, there is no significant effect from grouping the results. The density model had an R2 equal to 0.8815, which is relatively high, and the Adeq Precision equal to 12.916.
Table A3.
ANOVA results: Density.
| (a) ANOVA for Reduced Linear model Response 1: Density. | ||||||
| Source | Sum of Squares | df | Mean Square | F-Value | p-Value | Comment |
| Model | 0.1642 | 9 | 0.0182 | 14.06 | 3.12 × 10⁻⁶ | Significant |
| A-v | 0.0008 | 1 | 0.0008 | 0.593 | 0.4518 | Hierarchy |
| B-h | 3.74 × 10⁻⁸ | 1 | 3.74 × 10⁻⁸ | 0 | 0.9958 | Hierarchy |
| C-rot. | 0.0003 | 1 | 0.0003 | 0.2337 | 0.635 | Hierarchy |
| D-Scan pattern | 0.1074 | 2 | 0.0537 | 41.35 | 2.95 × 10⁻⁷ | Significant |
| BD | 0.0086 | 2 | 0.0043 | 3.3 | 0.0614 | Not insignificant |
| CD | 0.0108 | 2 | 0.0054 | 4.16 | 0.0339 | Significant |
| Residual | 0.0221 | 17 | 0.0013 | - | - | - |
| Cor Total | 0.1863 | 26 | - | - | - | - |
| (b) ANOVA Quality measures for Reduced Linear model Response 1: Density. | ||||||
| Entity | Value | Entity | Value | |||
| Std. Dev. | 0.036 | R2 | 0.8815 | |||
| Mean | 7.94 | Adjusted R2 | 0.8188 | |||
| C.V.% | 0.4535 | Predicted R2 | 0.72 | |||
| - | - | Adeq Precision | 12.9156 | |||
The resulting regression formula for density (g/cm3) was:
where:
- -
- SP is 1 for the stripes pattern, otherwise it is equal to 0.
- -
- CP is 1 for the chessboard pattern, otherwise it is equal to 0.
- -
- HP is 1 for the hexagonal scanning strategy, otherwise it is 0.
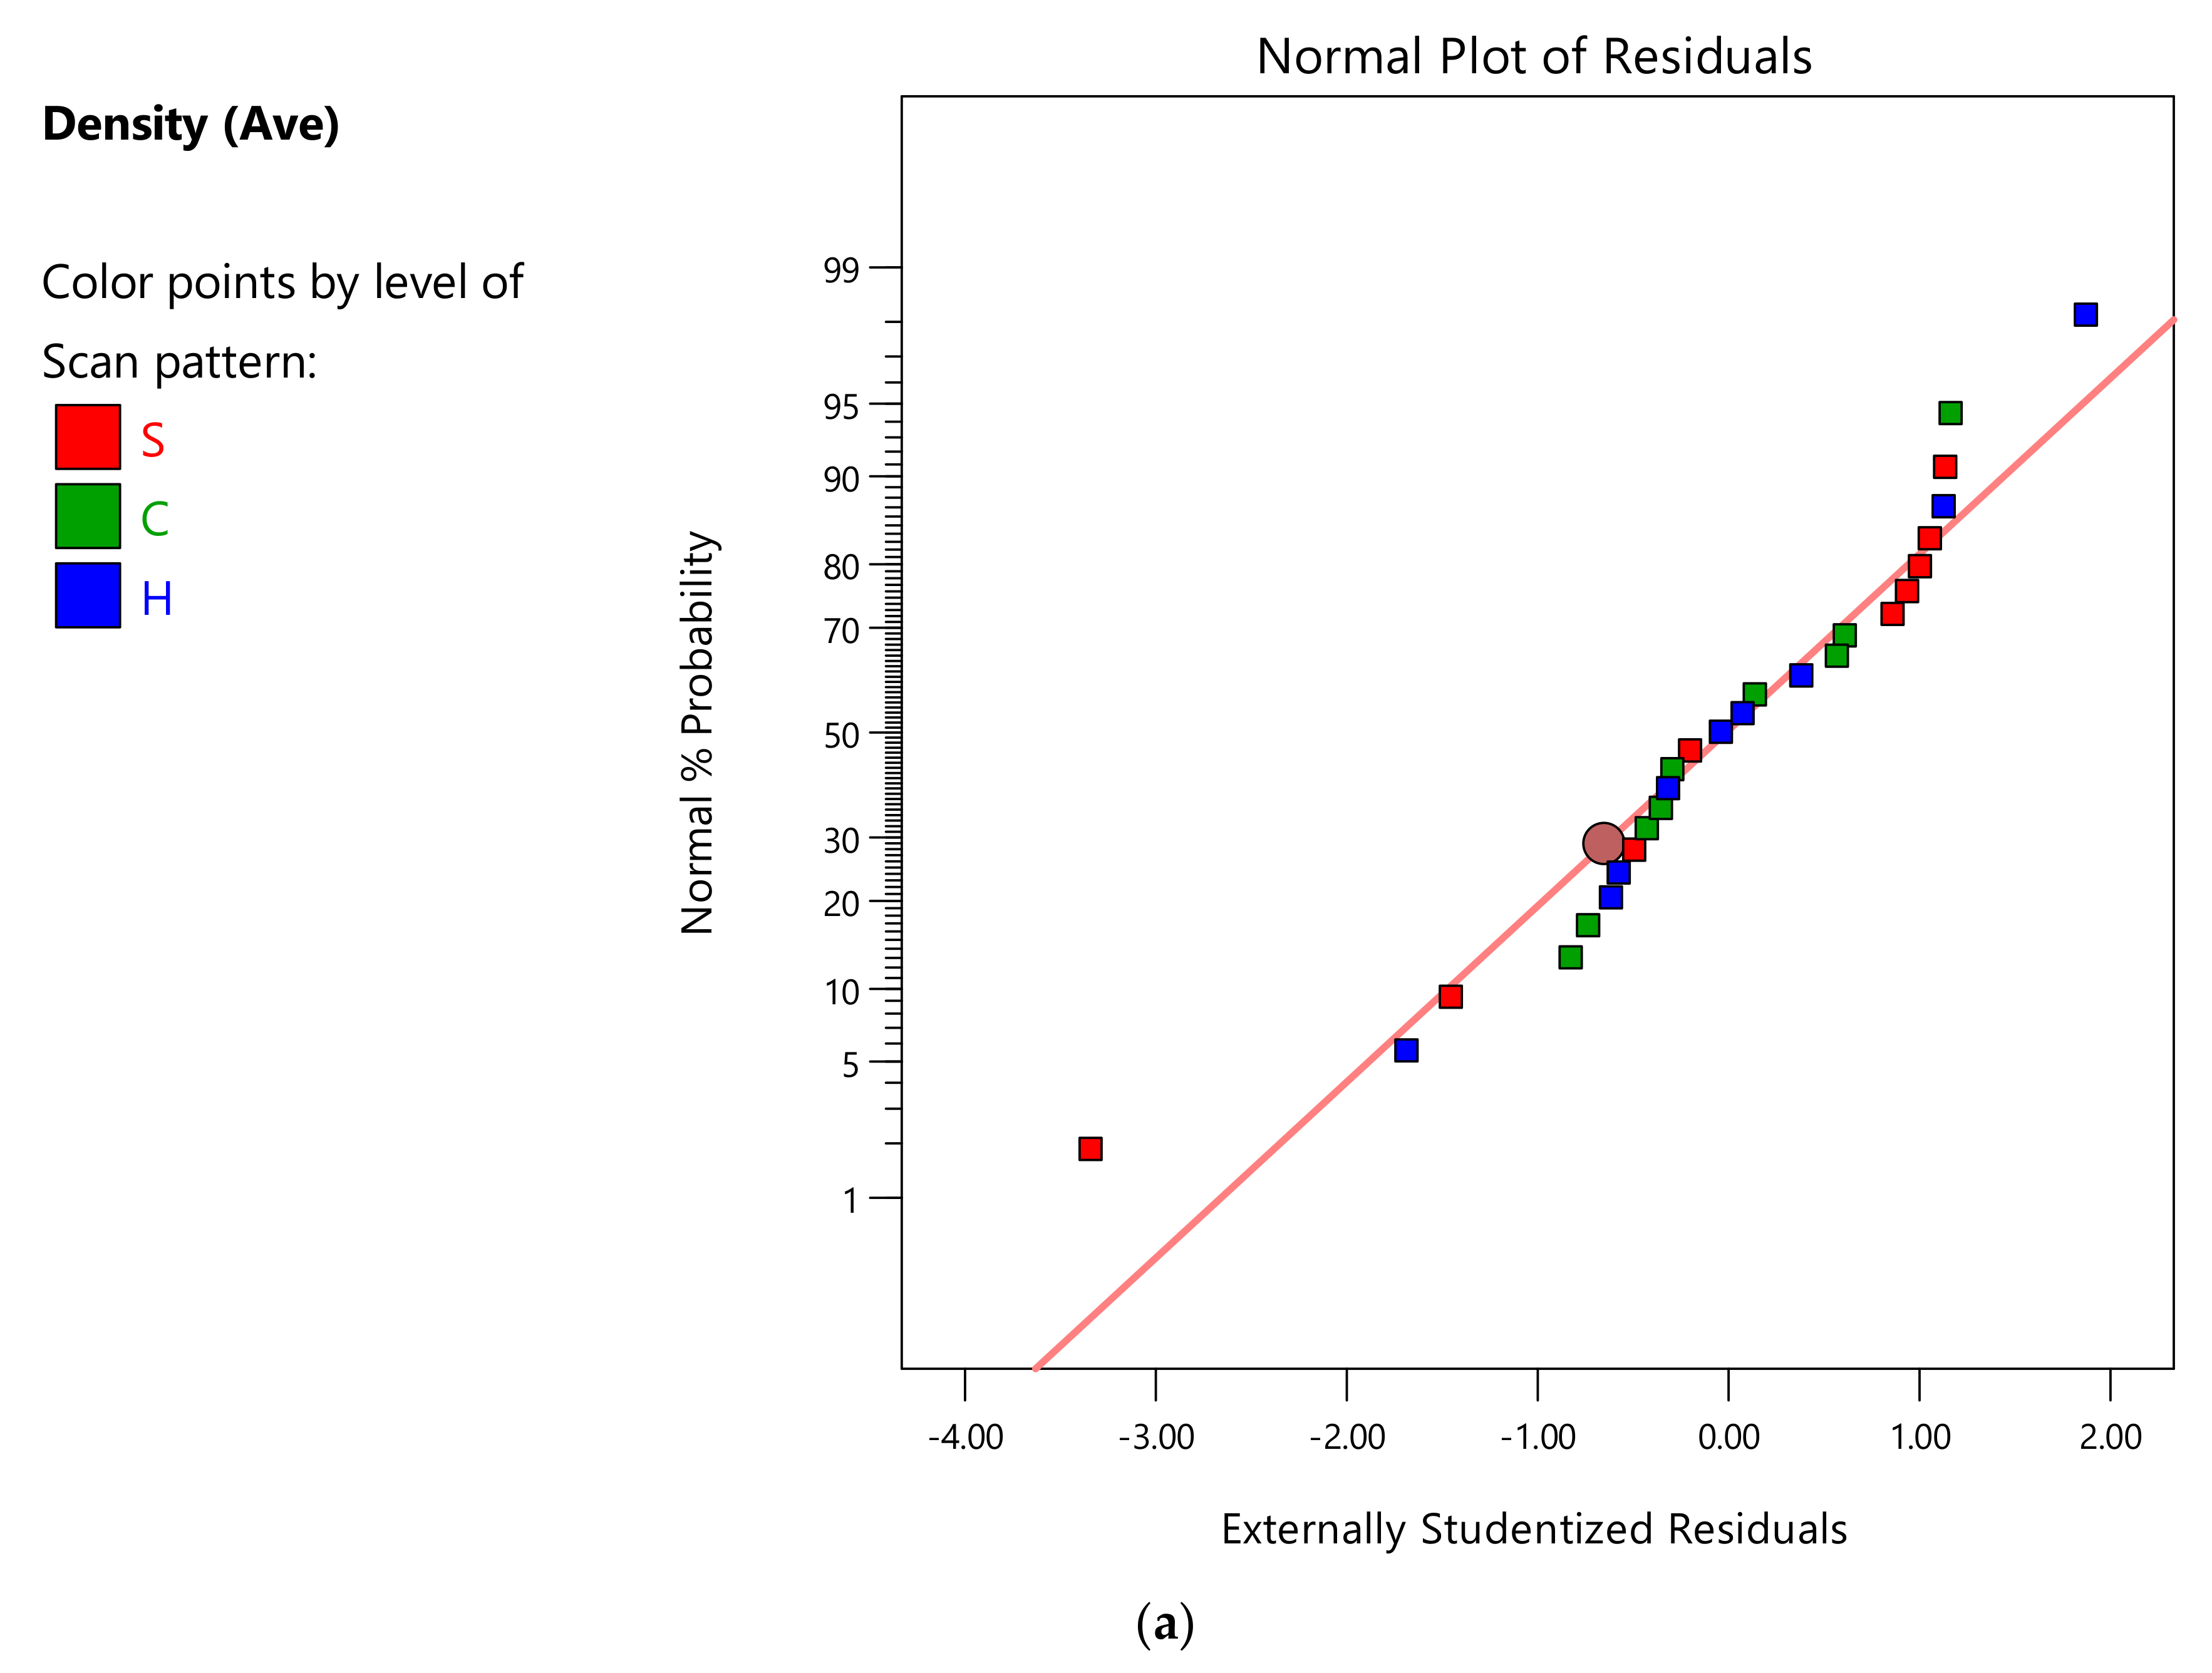
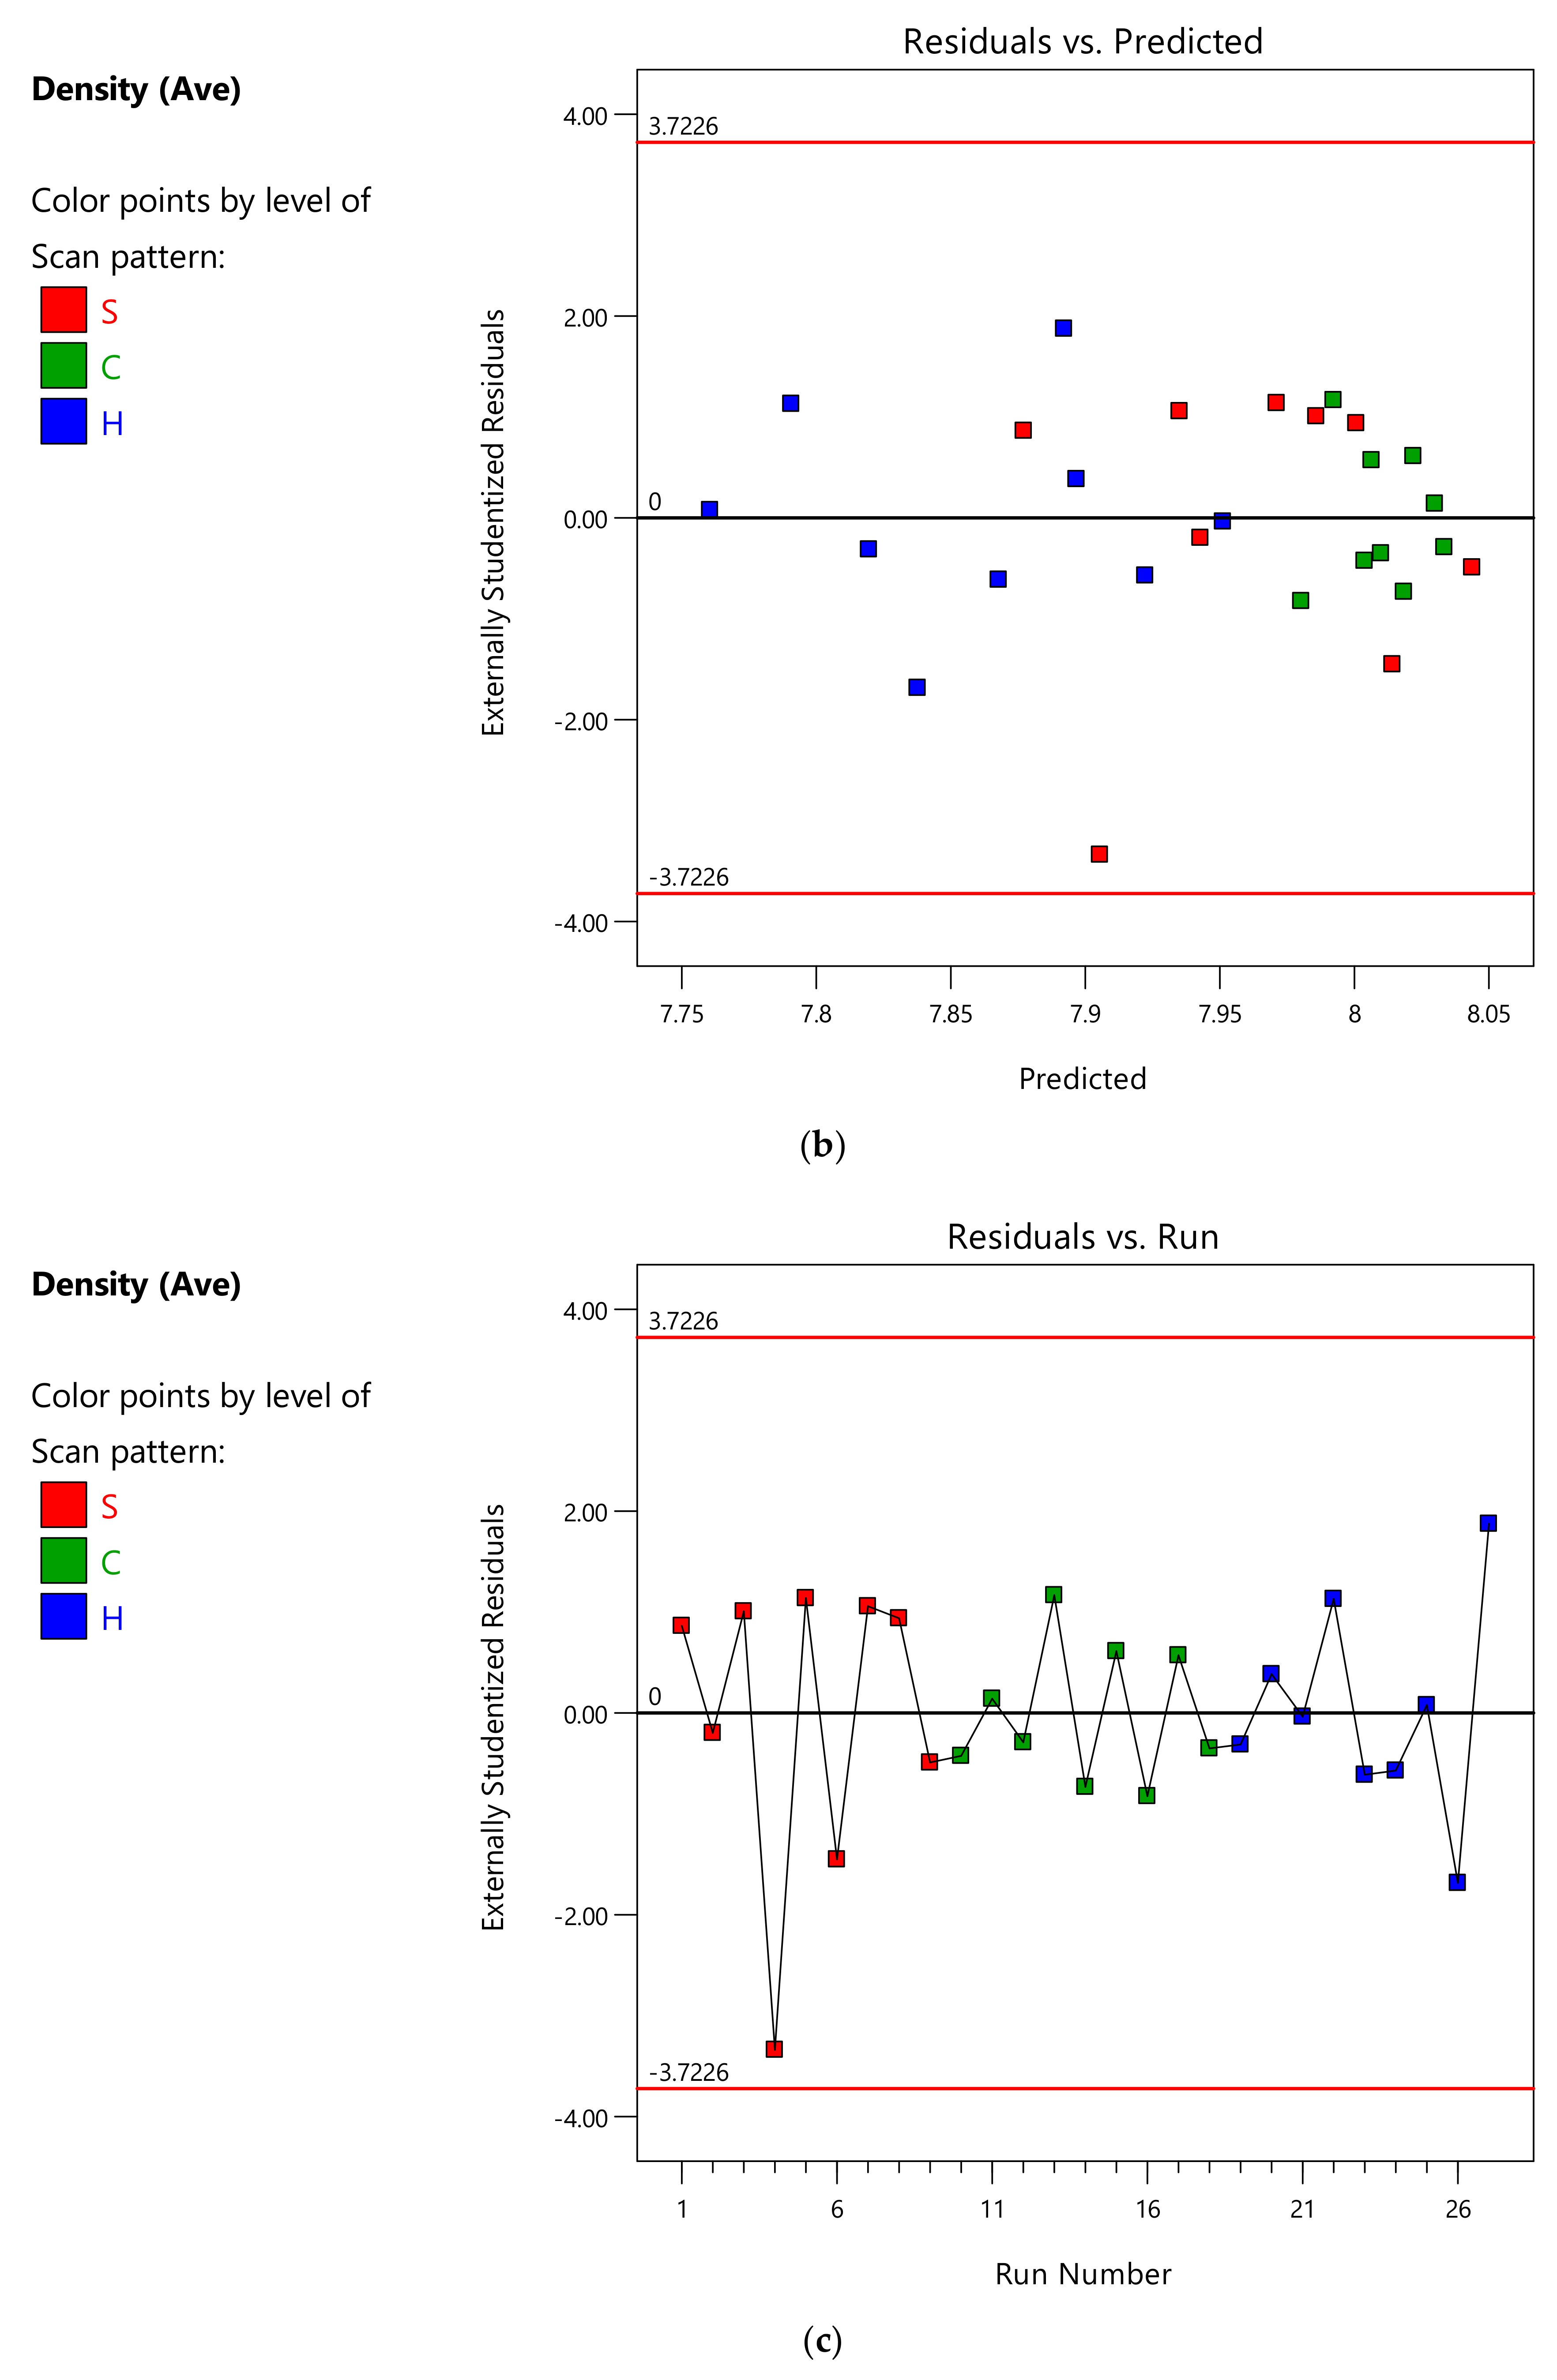
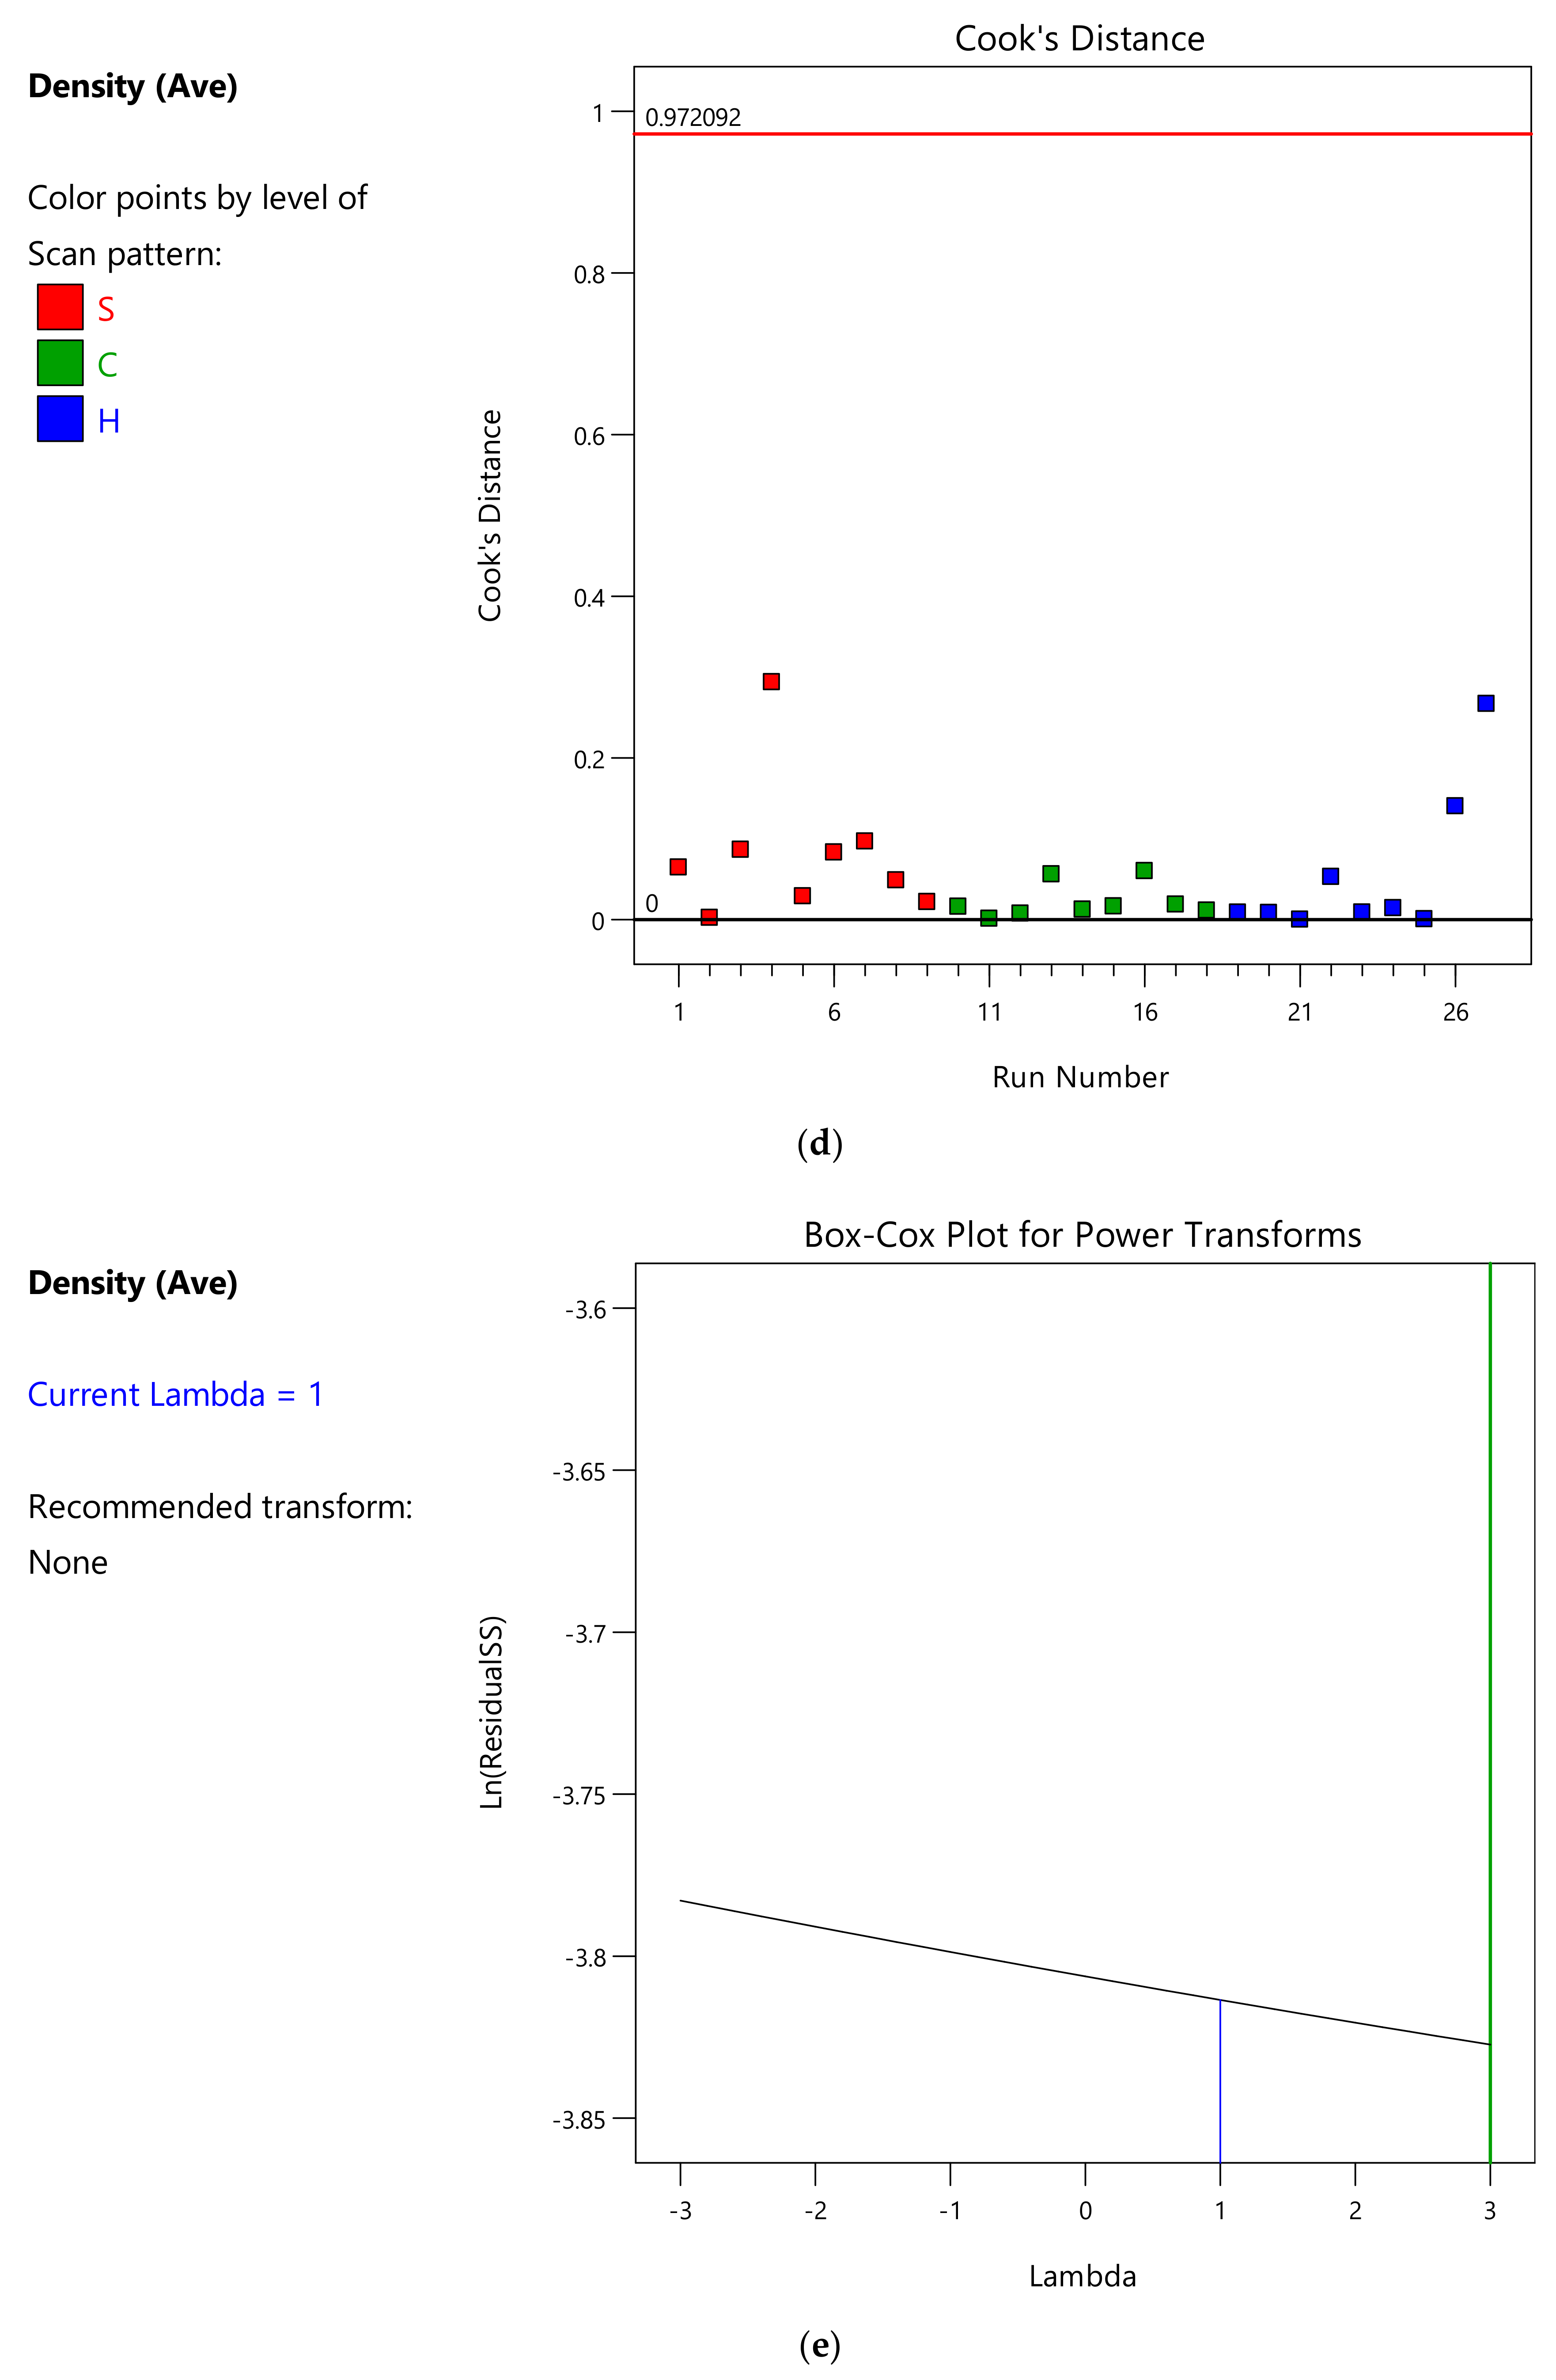
Figure A3a shows an imperfect fit of the residuals and the Gaussian distribution, but the residuals were independent of the magnitude of the predicted value, as shown in Figure A3b. Two samples showed a deviation, but no clear pattern could be seen in the residuals, shown in Figure A3c. No outliers were found (Figure A3d) and no improvement was possible through a transformation, according to the Box-Cox plot (Figure A3e).
Figure A3.
Statistical quality assertion: (a) Half-Normal plot vs. Externally studentized residuals for random error check, (b) Residuals vs. predicted value for independent residuals, (c) Residual vs. run for the absence of variation from printing location, (d) Cook’s distance plot for identification of outliers and (e) Box-Cox plot to identify any need of a transformation of the response.


Appendix A.4. ANOVA Analysis of the Nano-Hardness
A significant model could be established to model the nano-hardness, whose details are reported in Table A4. The F-value equal to 3.75 implies the model is significant, with only a 1.16% chance that an F-value this large could occur due to noise.
p-Values less than 0.0500 indicate the model terms are significant, while values greater than 0.1000 indicate the terms are not significant. In this case, the interaction between scan speed (A) and can rotation (C), creating the product AC, is a significant model term.
Considering the quality of determination, Table A4 reports the Predicted R2 equal to 0.0670 and the Adjusted R2 equal to 0.3878. The difference is more than 0.2, highlighting a large block effect. Adeq Precision measures the signal to noise ratio and a ratio greater than 4 is desirable. The ratio of 6.333 indicates an adequate signal, so the model can be used to navigate the design space.
Table A4.
ANOVA results: Nano-hardness.
| (a) ANOVA for Reduced Linear model Response 1: Nano-hardness. | ||||||
| Source | Sum of Squares | df | Mean Square | F-Value | p-Value | Comment |
| Model | 3.23 | 6 | 0.5391 | 3.75 | 0.0116 | Significant |
| A-v | 0.0008 | 1 | 0.0008 | 0.0055 | 0.9414 | Hierarchy |
| C-rot. | 0.048 | 1 | 0.048 | 0.3332 | 0.5702 | Hierarchy |
| D-Scan pattern | 0.8881 | 2 | 0.4441 | 3.09 | 0.068 | Not insignificant |
| AC | 1.7 | 1 | 1.7 | 11.78 | 0.0026 | significant |
| C2 | 0.6021 | 1 | 0.6021 | 4.18 | 0.0542 | Not insignificant |
| Residual | 2.88 | 20 | 0.1439 | - | - | - |
| Cor Total | 6.11 | 26 | - | - | - | - |
| (b) ANOVA Quality measures for Reduced Linear model Response 1: Nano-hardness. | ||||||
| Entity | Value | Entity. | Value | |||
| Std. Dev. | 0.3794 | R2 | 0.5291 | |||
| Mean | 4.41 | Adjusted R2 | 0.3878 | |||
| C.V.% | 8.6 | Predicted R2 | 0.067 | |||
| - | - | Adeq Precision | 6.3327 | |||
The resulting regression formula for the nano-hardness (GPa) was:
where:
- -
- SP is 1 for the stripes pattern, otherwise it is equal to 0.
- -
- CP is 1 for the chessboard pattern, otherwise it is equal to 0.
- -
- HP is 1 for the hexagonal scanning strategy, otherwise it is 0.
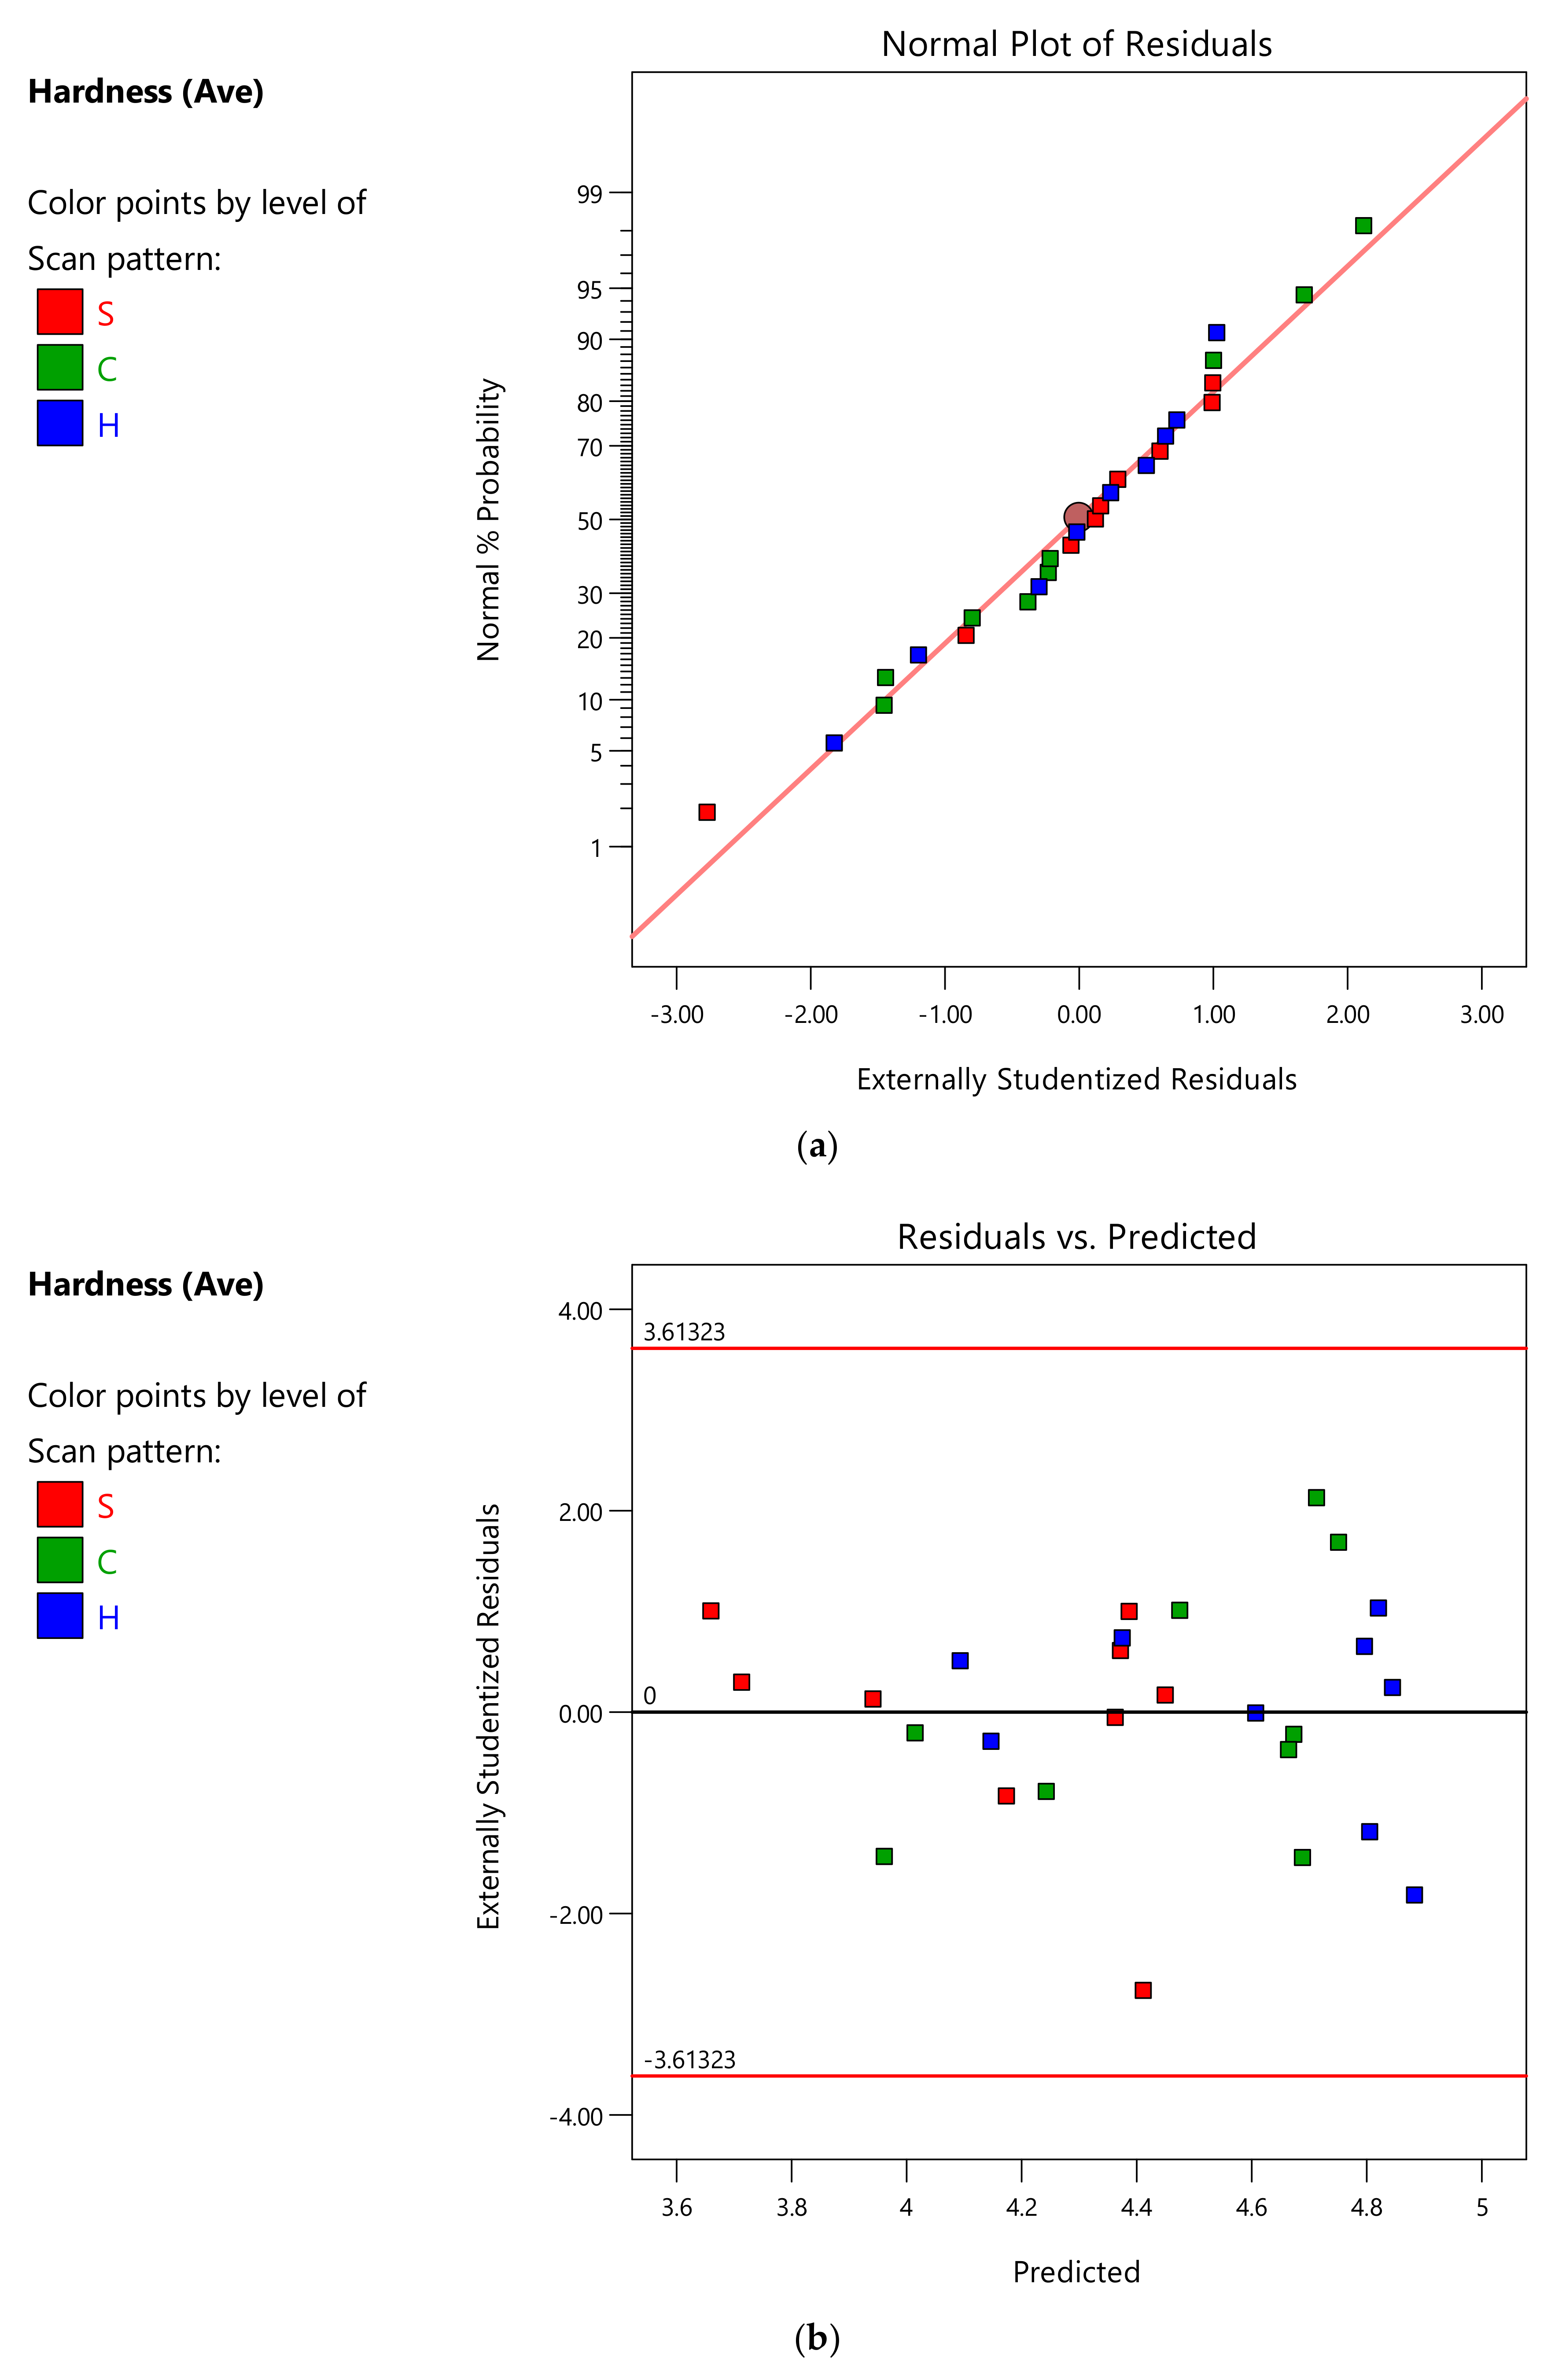
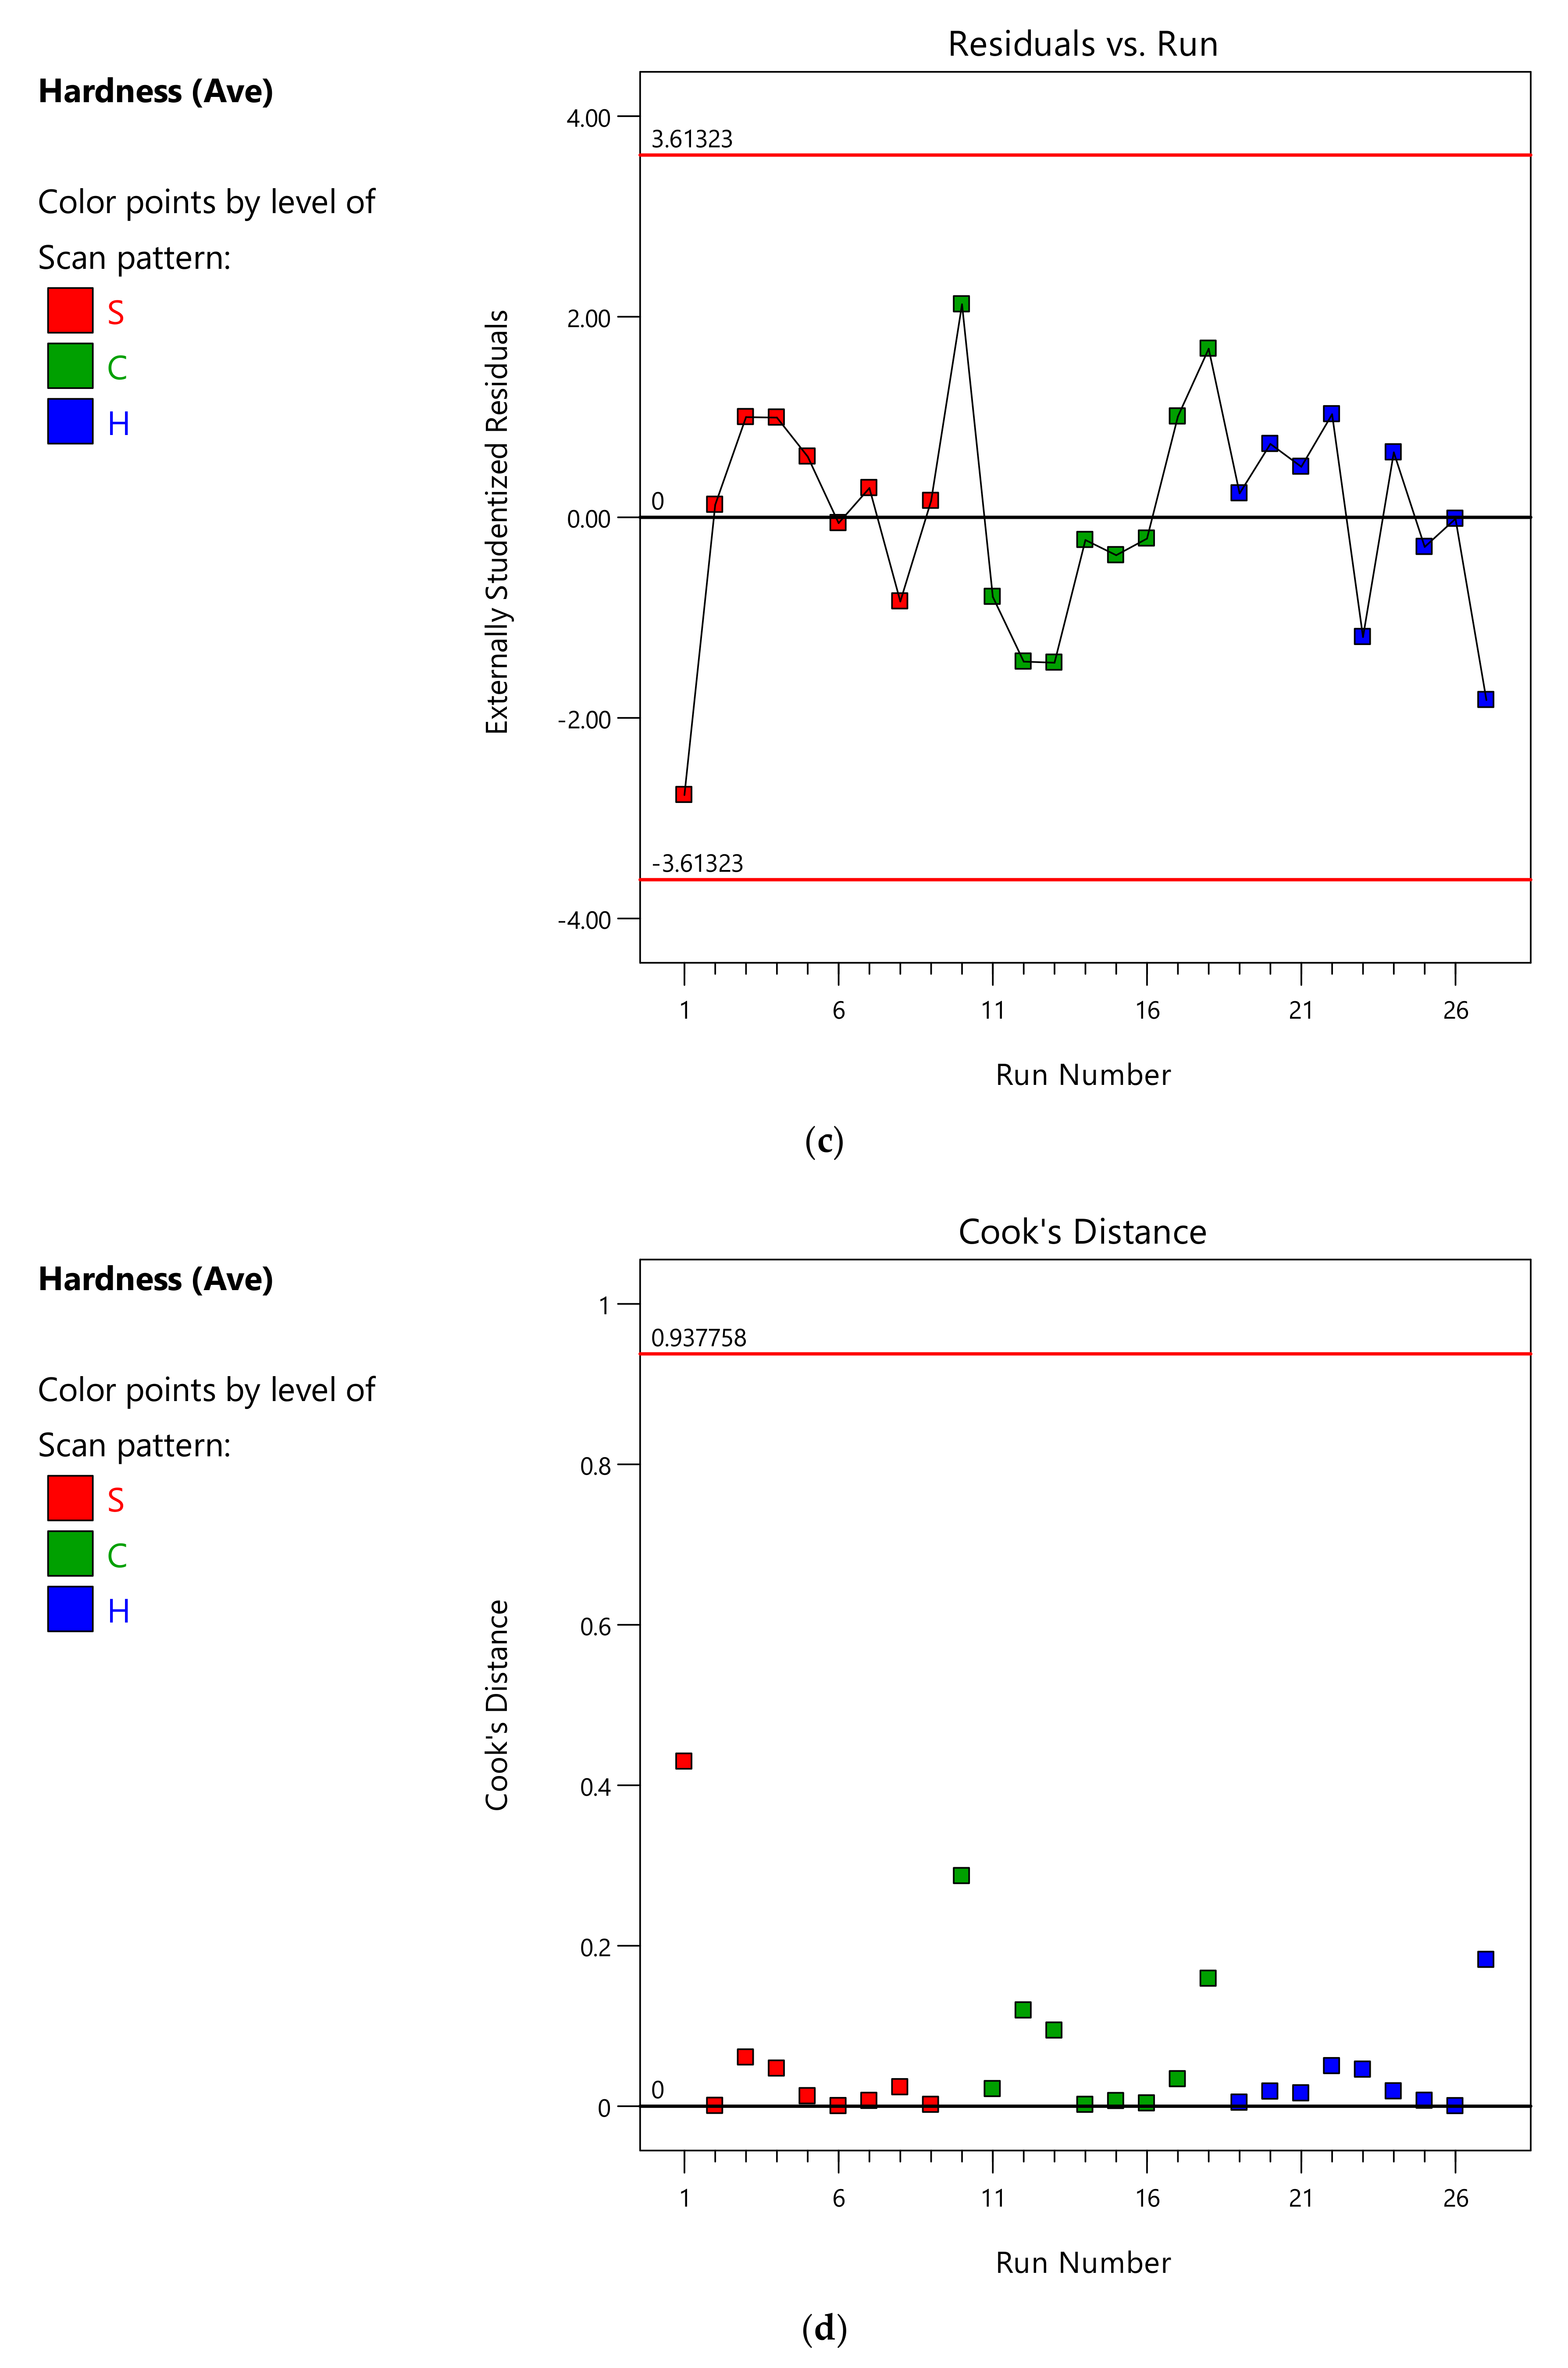
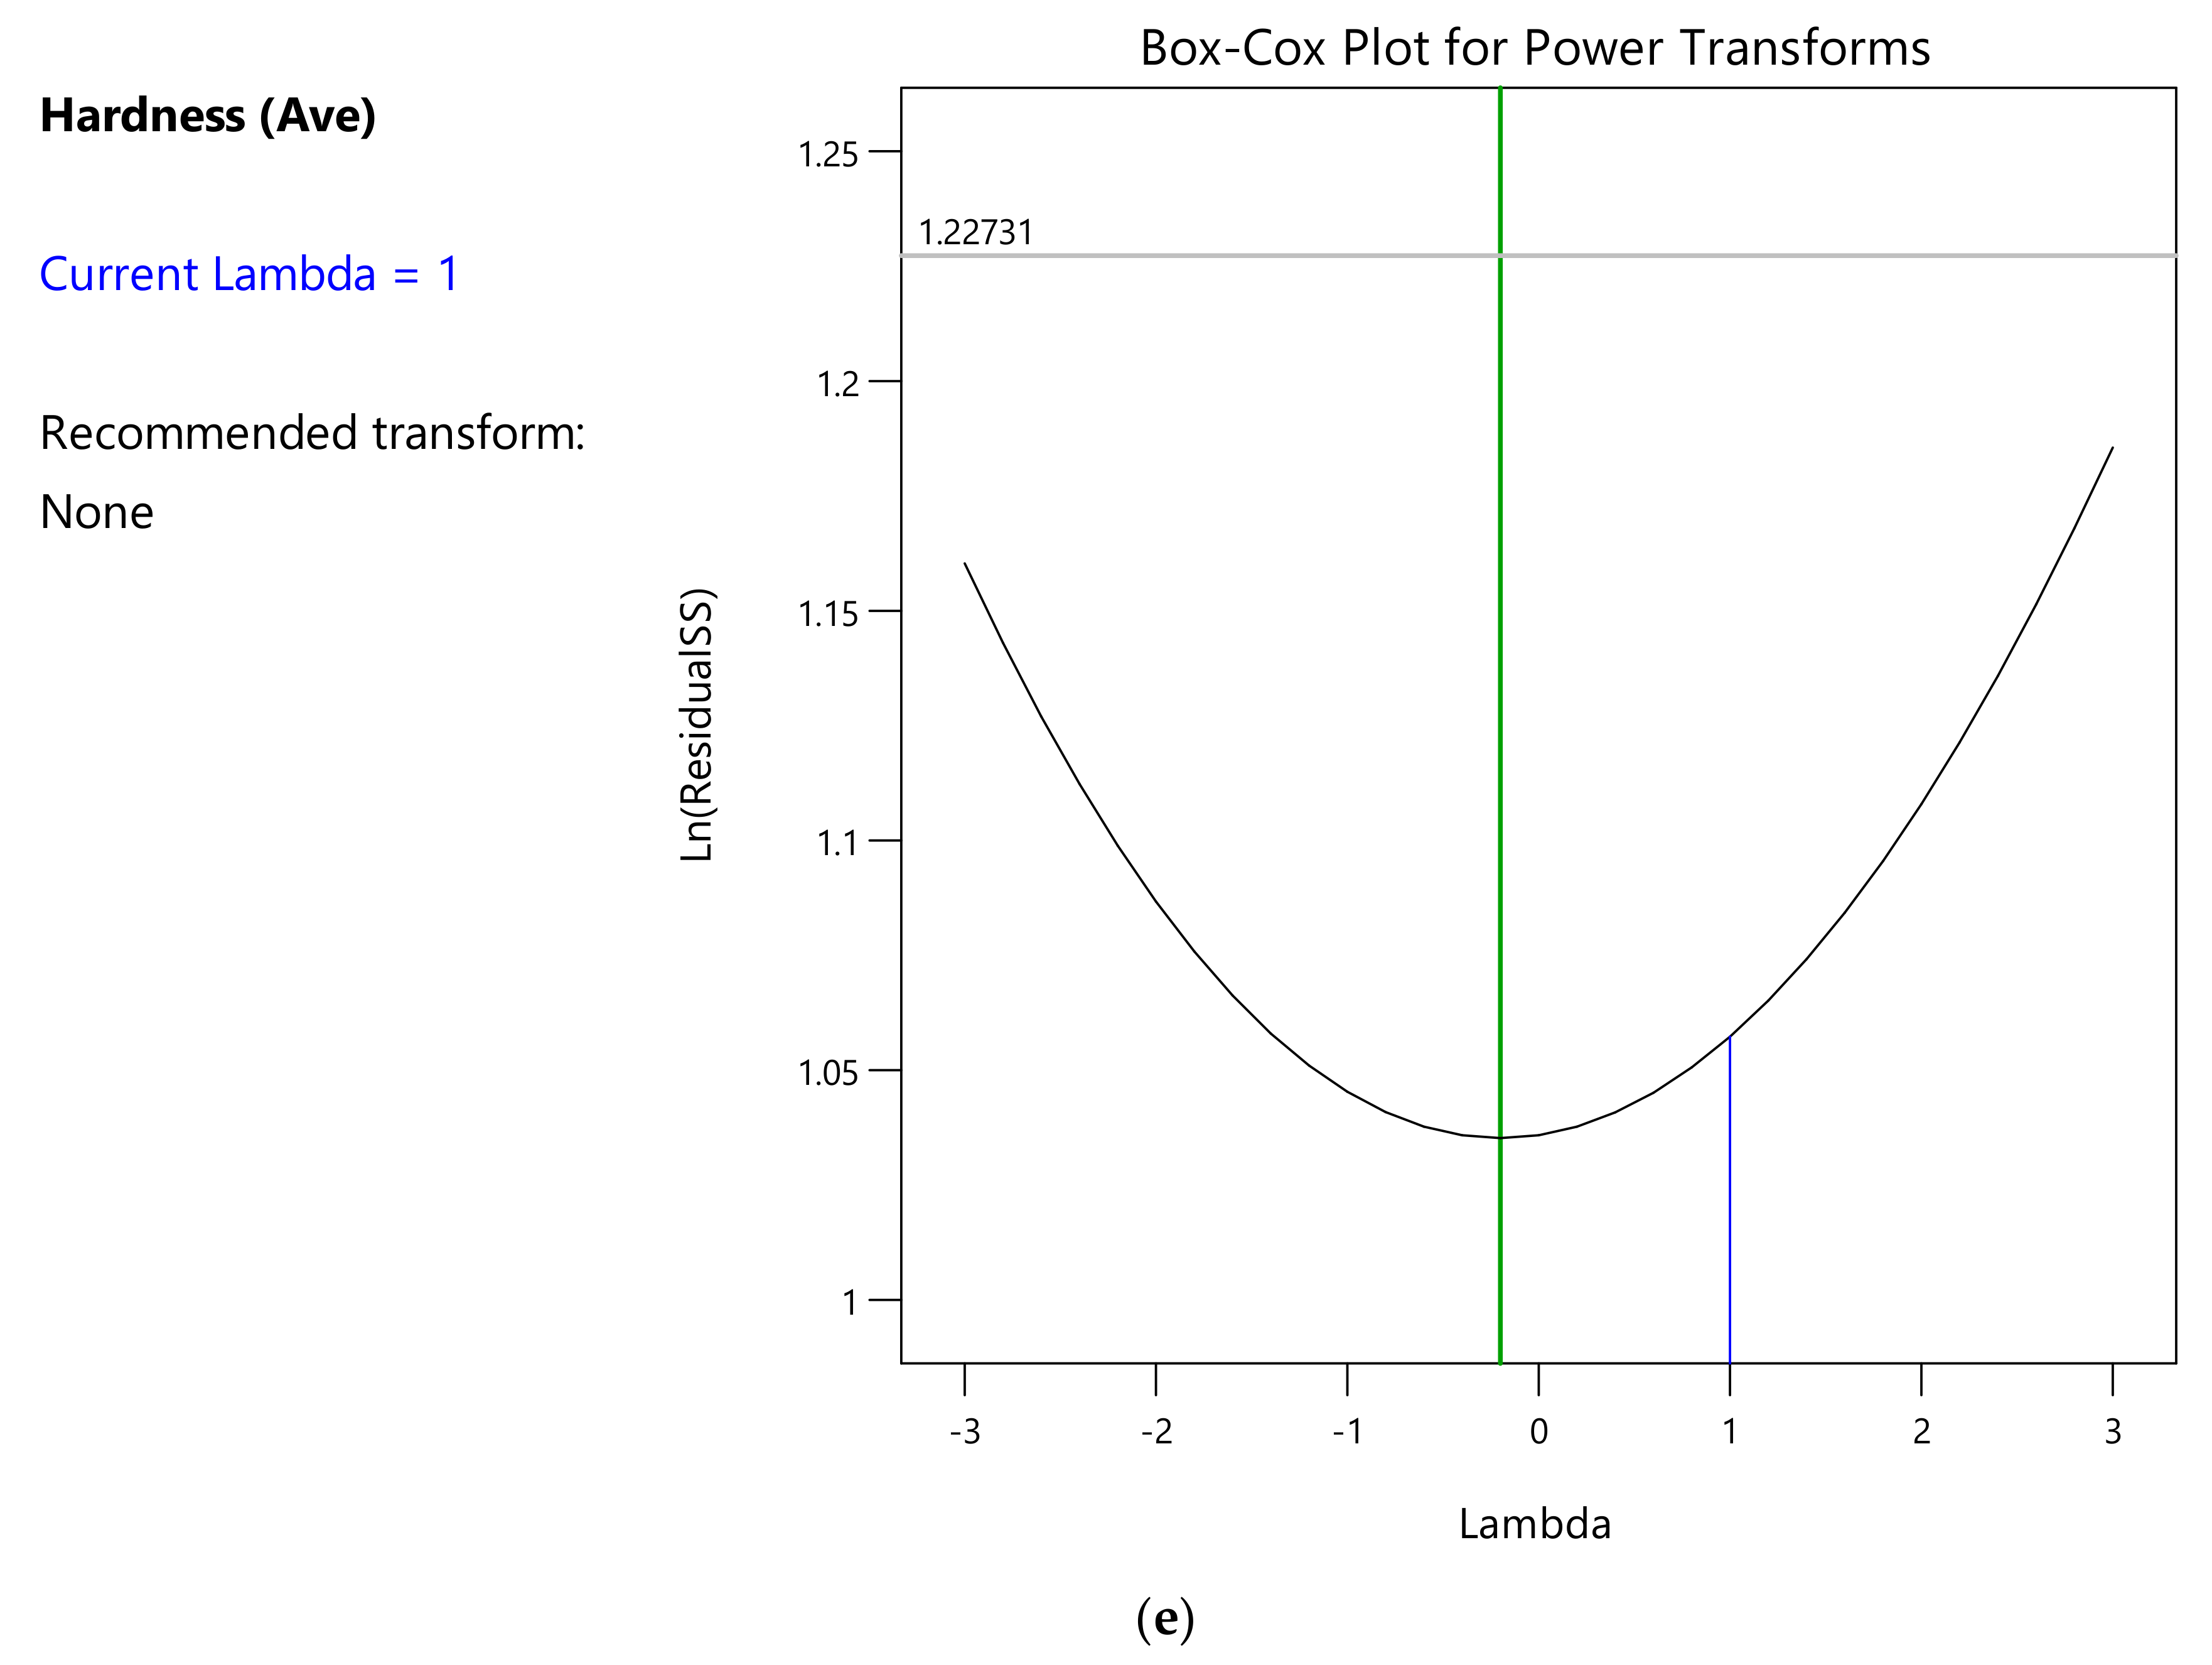
Figure A4a shows the residuals fitting the Gaussian distribution with a high degree of randomness, while Figure A4b shows that the residuals were reasonably independent of the magnitude of the predicted value. Figure A4c shows no clear pattern in the residuals. No outliers were found, as shown in Figure A4d, and no improvement was possible through a transformation in the Box-Cox plot, as shown in Figure A4e.
Figure A4.
Statistical quality assertion: (a) Half-Normal plot vs. Externally studentized residuals for random error check, (b) Residuals vs. predicted value for independent residuals, (c) Residual vs. run for the absence of variation from printing location, (d) Cook’s distance plot for identification of outliers and (e) Box-Cox plot to identify any need of a transformation of the response.


References
- Li, R.; Shi, Y.; Wang, L.; Liu, J.; Wang, Z. The Key Metallurgical Features of Selective Laser Melting of Stainless Steel Powder for Building Metallic Part. Powder Metall. Met. Ceram. 2011, 50, 141–150. [Google Scholar] [CrossRef]
- Cacace, S.; Semeraro, Q. About Fluence and Process Parameters on Maraging Steel Processed by Selective Laser Melting: Do They Convey the Same Information? Int. J. Precis. Eng. Manuf. 2018, 19, 1873–1884. [Google Scholar] [CrossRef] [Green Version]
- Wang, L.; Wei, Q.S.; Shi, Y.S.; Liu, J.H.; He, W.T. Experimental Investigation into the Single-Track of Selective Laser Melting of IN625. Adv. Mater. Res. 2011, 233–235, 2844–2848. [Google Scholar] [CrossRef]
- Campanelli, S.L.; Casalino, G.; Contuzzi, N.; Angelastro, A.; Ludovico, A.D. Analysis of the Molten/Solidified Zone in Selective Laser Melted Parts. In Proceedings of the SPIE, High-Power Laser Materials Processing: Lasers, Beam Delivery, Diagnostics, and Applications III, San Francisco, CA, USA, 20 February 2014; Volume 8963. [Google Scholar]
- Casalino, G.; Campanelli, S.L.; Contuzzi, N.; Ludovico, A.D. Experimental Investigation and Statistical Optimisation of the Selective Laser Melting Process of a Maraging Steel. Opt. Laser Technol. 2015, 65, 151–158. [Google Scholar] [CrossRef]
- Bai, Y.; Yang, Y.; Wang, D.; Zhang, M. Influence Mechanism of Parameters Process and Mechanical Properties Evolution Mechanism of Maraging Steel 300 by Selective Laser Melting. Mater. Sci. Eng. A 2017, 703, 116–123. [Google Scholar] [CrossRef]
- Goodridge, R.; Ziegelmeier, S. Powder bed fusion of polymers. In Laser Additive Manufacturing; Brandt, M., Ed.; Woodhead Publishing: Sawston, UK, 2017; pp. 181–204. ISBN 9780081004333. [Google Scholar]
- Nozar, M.; Zetková, I.; Hronek, O. Searching for Favourable Powder Bed Fusion Settings in Sintering of Maraging Steel MS1. In Annals of DAAAM and Proceedings of the International DAAAM Symposium; DAAAM International: Vienna, Austria, 2018; Volume 29, pp. 777–785. ISSN 1726-9679. ISBN 978-3-902734-20-4. [Google Scholar]
- Scipioni Bertoli, U.; Wolfer, A.J.; Matthews, M.J.; Delplanque, J.P.R.; Schoenung, J.M. On the Limitations of Volumetric Energy Density as a Design Parameter for Selective Laser Melting. Mater. Des. 2017, 113, 331–340. [Google Scholar] [CrossRef] [Green Version]
- Ciurana, J.; Hernandez, L.; Delgado, J. Energy Density Analysis on Single Tracks Formed by Selective Laser Melting with CoCrMo Powder Material. Int. J. Adv. Manuf. Technol. 2013, 68, 1103–1110. [Google Scholar] [CrossRef]
- De Souza, A.F.; Al-Rubaie, K.S.; Marques, S.; Zluhan, B.; Santos, E.C. Effect of Laser Speed, Layer Thickness, and Part Position on the Mechanical Properties of Maraging 300 Parts Manufactured by Selective Laser Melting. Mater. Sci. Eng. A 2019, 767, 138425. [Google Scholar] [CrossRef]
- Suzuki, A.; Nishida, R.; Takata, N.; Kobashi, M.; Kato, M. Design of Laser Parameters for Selectively Laser Melted Maraging Steel Based on Deposited Energy Density. Addit. Manuf. 2019, 28, 160–168. [Google Scholar] [CrossRef]
- Delcuse, L.; Bahi, S.; Gunputh, U.; Rusinek, A.; Wood, P.; Miguelez, M.H. Effect of Powder Bed Fusion Laser Melting Process Parameters, Build Orientation and Strut Thickness on Porosity, Accuracy and Tensile Properties of an Auxetic Structure in IN718 Alloy. Addit. Manuf. 2020, 36, 101339. [Google Scholar] [CrossRef]
- Kempen, K.; Yasa, E.; Thijs, L.; Kruth, J.P.; Van Humbeeck, J. Microstructure and Mechanical Properties of Selective Laser Melted 18Ni-300 Steel. Phys. Procedia 2011, 12, 255–263. [Google Scholar] [CrossRef] [Green Version]
- Campanelli, S.L.; Contuzzi, N.; Ludovico, A.D. Manufacturing of 18 Ni Marage 300 Steel Samples by Selective Laser Melting. Adv. Mater. Res. 2010, 83–86, 850–857. [Google Scholar] [CrossRef]
- Leuders, S.; Vollmer, M.; Brenne, F.; Tröster, T.; Niendorf, T. Fatigue Strength Prediction for Titanium Alloy TiAl6V4 Manufactured by Selective Laser Melting. Metall. Mater. Trans. A Phys. Metall. Mater. Sci. 2015, 46, 3816–3823. [Google Scholar] [CrossRef]
- Gusarov, A.V.; Kruth, J.P. Modelling of Radiation Transfer in Metallic Powders at Laser Treatment. Int. J. Heat Mass Transf. 2005, 48, 3423–3434. [Google Scholar] [CrossRef]
- Van de Hulst, H.C. Light Scattering by Small Particles. Q. J. R. Meteorol. Soc. 1958, 84, 198–199. [Google Scholar] [CrossRef]
- He, K.; Zhao, X. 3D Thermal Finite Element Analysis of the SLM 316L Parts with Microstructural Correlations. Complexity 2018, 2018. [Google Scholar] [CrossRef] [Green Version]
- Kruth, J.P.; Froyen, L.; van Vaerenbergh, J.; Mercelis, P.; Rombouts, M.; Lauwers, B. Selective Laser Melting of Iron-Based Powder. J. Mater. Process. Technol. 2004, 149, 616–622. [Google Scholar] [CrossRef]
- Trevisan, F.; Calignano, F.; Lorusso, M.; Pakkanen, J.; Aversa, A.; Ambrosio, E.P.; Lombardi, M.; Fino, P.; Manfredi, D. On the Selective Laser Melting (SLM) of the AlSi10Mg Alloy: Process, Microstructure, and Mechanical Properties. Materials 2017, 10, 76. [Google Scholar] [CrossRef] [Green Version]
- Thijs, L.; Verhaeghe, F.; Craeghs, T.; van Humbeeck, J.; Kruth, J.P. A Study of the Microstructural Evolution during Selective Laser Melting of Ti-6Al-4V. Acta Mater. 2010, 58, 3303–3312. [Google Scholar] [CrossRef]
- Zaeh, M.F.; Branner, G. Investigations on Residual Stresses and Deformations in Selective Laser Melting. Prod. Eng. 2010, 4, 35–45. [Google Scholar] [CrossRef]
- Nadammal, N.; Cabeza, S.; Mishurova, T.; Thiede, T.; Kromm, A.; Seyfert, C.; Farahbod, L.; Haberland, C.; Schneider, J.A.; Portella, P.D.; et al. Effect of Hatch Length on the Development of Microstructure, Texture and Residual Stresses in Selective Laser Melted Superalloy Inconel 718. Mater. Des. 2017, 134, 139–150. [Google Scholar] [CrossRef]
- Tolochko, N.K.; Mozzharov, S.E.; Yadroitsev, I.A.; Laoui, T.; Froyen, L.; Titov, V.I.; Ignatiev, M.B. Balling Processes during Selective Laser Treatment of Powders. Rapid Prototyp. J. 2004, 10, 78–87. [Google Scholar] [CrossRef]
- Jhabvala, J.; Boillat, E.; Antignac, T.; Glardon, R. On the Effect of Scanning Strategies in the Selective Laser Melting Process. Virtual Phys. Prototyp. 2010, 5, 99–109. [Google Scholar] [CrossRef]
- Salman, O.O.; Brenne, F.; Niendorf, T.; Eckert, J.; Prashanth, K.G.; He, T.; Scudino, S. Impact of the Scanning Strategy on the Mechanical Behavior of 316L Steel Synthesized by Selective Laser Melting. J. Manuf. Process. 2019, 45, 255–261. [Google Scholar] [CrossRef]
- Biffi, C.A.; Fiocchi, J.; Ferrario, E.; Fornaci, A.; Riccio, M.; Romeo, M.; Tuissi, A. Effects of the Scanning Strategy on the Microstructure and Mechanical Properties of a TiAl6V4 Alloy Produced by Electron Beam Additive Manufacturing. Int. J. Adv. Manuf. Technol. 2020, 107, 4913–4924. [Google Scholar] [CrossRef]
- Yasa, E.; Kruth, J.P. Microstructural Investigation of Selective Laser Melting 316L Stainless Steel Parts Exposed to Laser Re-Melting. Procedia Eng. 2011, 19, 389–395. [Google Scholar] [CrossRef]
- Yasa, E.; Deckers, J.; Kruth, J.P. The Investigation of the Influence of Laser Re-Melting on Density, Surface Quality and Microstructure of Selective Laser Melting Parts. Rapid Prototyp. J. 2011, 17, 312–327. [Google Scholar] [CrossRef]
- Huang, S.; Yeong, W.Y. Laser Re-Scanning Strategy in Selective Laser Melting for Part Quality Enhancement: A Review. In Proceedings of the 3rd International Conference on Progress in Additive Manufacturing (Pro-AM), Nanyang Executive Centre, Singapore, 14–17 May 2018; pp. 413–419. [Google Scholar] [CrossRef]
- Xie, J.W.; Fox, P.; O’Neill, W.; Sutcliffe, C.J. Effect of Direct Laser Re-Melting Processing Parameters and Scanning Strategies on the Densification of Tool Steels. J. Mater. Process. Technol. 2005, 170, 516–523. [Google Scholar] [CrossRef]
- Tian, Y.; Tomus, D.; Rometsch, P.; Wu, X. Influences of Processing Parameters on Surface Roughness of Hastelloy X Produced by Selective Laser Melting. Addit. Manuf. 2017, 13, 103–112. [Google Scholar] [CrossRef]
- Beevers, E.; Brandão, A.D.; Gumpinger, J.; Gschweitl, M.; Seyfert, C.; Hofbauer, P.; Rohr, T.; Ghidini, T. Fatigue Properties and Material Characteristics of Additively Manufactured AlSi10Mg—Effect of the Contour Parameter on the Microstructure, Density, Residual Stress, Roughness and Mechanical Properties. Int. J. Fatigue 2018, 117, 148–162. [Google Scholar] [CrossRef]
- Parry, L.A.; Ashcroft, I.A.; Wildman, R.D. Geometrical Effects on Residual Stress in Selective Laser Melting. Addit. Manuf. 2019, 25, 166–175. [Google Scholar] [CrossRef]
- Mutua, J.; Nakata, S.; Onda, T.; Chen, Z.C. Optimization of Selective Laser Melting Parameters and Influence of Post Heat Treatment on Microstructure and Mechanical Properties of Maraging Steel. Mater. Des. 2018, 139, 486–497. [Google Scholar] [CrossRef]
- Bhardwaj, T.; Shukla, M. Effect of Laser Scanning Strategies on Texture, Physical and Mechanical Properties of Laser Sintered Maraging Steel. Mater. Sci. Eng. A 2018, 734, 102–109. [Google Scholar] [CrossRef]
- Parry, L.; Ashcroft, I.A.; Wildman, R.D. Understanding the Effect of Laser Scan Strategy on Residual Stress in Selective Laser Melting through Thermo-Mechanical Simulation. Addit. Manuf. 2016, 12, 1–15. [Google Scholar] [CrossRef] [Green Version]
- Guo, M.; Ye, Y.; Jiang, X.; Wang, L. Microstructure, Mechanical Properties and Residual Stress of Selective Laser Melted AlSi10Mg. J. Mater. Eng. Perform. 2019, 28, 6753–6760. [Google Scholar] [CrossRef]
- Wang, L.; Jiang, X.; Zhu, Y.; Ding, Z.; Zhu, X.; Sun, J.; Yan, B. Investigation of Performance and Residual Stress Generation of AlSi10Mg Processed by Selective Laser Melting. Adv. Mater. Sci. Eng. 2018, 2018, 7814039. [Google Scholar] [CrossRef] [Green Version]
- Dimitrov, D.; Becker, T.H.; Yadroitsev, I.; Booysen, G. On the impact of different system strategies on the material performance of selective laser melting- manufactured ti6al4v components. S. Afr. J. Ind. Eng. 2016, 27, 184–191. [Google Scholar] [CrossRef]
- Lu, Y.; Wu, S.; Gan, Y.; Huang, T.; Yang, C.; Junjie, L.; Lin, J. Study on the Microstructure, Mechanical Property and Residual Stress of SLM Inconel-718 Alloy Manufactured by Differing Island Scanning Strategy. Opt. Laser Technol. 2015, 75, 197–206. [Google Scholar] [CrossRef]
- Promoppatum, P.; Yao, S.C. Influence of Scanning Length and Energy Input on Residual Stress Reduction in Metal Additive Manufacturing: Numerical and Experimental Studies. J. Manuf. Process. 2020, 49, 247–259. [Google Scholar] [CrossRef]
- Liu, Y.; Yang, Y.; Wang, D. A Study on the Residual Stress during Selective Laser Melting (SLM) of Metallic Powder. Int. J. Adv. Manuf. Technol. 2016, 87, 647–656. [Google Scholar] [CrossRef]
- Yan, X.; Pang, J.; Jing, Y. Ultrasonic Measurement of Stress in SLM 316L Stainless Steel Forming Parts Manufactured Using Different Scanning Strategies. Materials 2019, 12, 2719. [Google Scholar] [CrossRef] [PubMed] [Green Version]
- Demir, A.G.; Previtali, B. Investigation of Remelting and Preheating in SLM of 18Ni300 Maraging Steel as Corrective and Preventive Measures for Porosity Reduction. Int. J. Adv. Manuf. Technol. 2017, 93, 2697–2709. [Google Scholar] [CrossRef]
- Catchpole-Smith, S.; Aboulkhair, N.; Parry, L.; Tuck, C.; Ashcroft, I.A.; Clare, A. Fractal Scan Strategies for Selective Laser Melting of ‘Unweldable’ Nickel Superalloys. Addit. Manuf. 2017, 15, 113–122. [Google Scholar] [CrossRef]
- Zou, S.; Xiao, H.; Ye, F.; Li, Z.; Tang, W.; Zhu, F.; Chen, C.; Zhu, C. Numerical Analysis of the Effect of the Scan Strategy on the Residual Stress in the Multi-Laser Selective Laser Melting. Results Phys. 2020, 16, 103005. [Google Scholar] [CrossRef]
- AlMangour, B.; Grzesiak, D.; Yang, J.M. Scanning Strategies for Texture and Anisotropy Tailoring during Selective Laser Melting of TiC/316L Stainless Steel Nanocomposites. J. Alloys Compd. 2017, 728, 424–435. [Google Scholar] [CrossRef]
- Nandwana, P.; Lee, Y. Influence of Scan Strategy on Porosity and Microstructure of Ti-6Al-4V Fabricated by Electron Beam Powder Bed Fusion. Mater. Today Commun. 2020, 24, 100962. [Google Scholar] [CrossRef]
- Aboulkhair, N.T.; Everitt, N.M.; Ashcroft, I.; Tuck, C. Reducing Porosity in AlSi10Mg Parts Processed by Selective Laser Melting. Addit. Manuf. 2014, 1, 77–86. [Google Scholar] [CrossRef]
- Lee, Y.S.; Kirka, M.M.; Ferguson, J.; Paquit, V.C. Correlations of Cracking with Scan Strategy and Build Geometry in Electron Beam Powder Bed Additive Manufacturing. Addit. Manuf. 2020, 32, 101031. [Google Scholar] [CrossRef]
- Klingbeil, N.W.; Beuth, J.L.; Chin, R.K.; Amon, C.H. Residual Stress-Induced Warping in Direct Metal Solid Freeform Fabrication. Int. J. Mech. Sci. 2002, 44, 57–77. [Google Scholar] [CrossRef]
- Conde, F.F.; Escobar, J.D.; Oliveira, J.P.; Jardini, A.L.; Bose Filho, W.W.; Avila, J.A. Austenite Reversion Kinetics and Stability during Tempering of an Additively Manufactured Maraging 300 Steel. Addit. Manuf. 2019, 29, 100804. [Google Scholar] [CrossRef]
Figure 1.
Graphical representation of interlayer rotation between adjacent layers.

Figure 2.
Graphical representation of the studied scanning strategies: (a) parallel stripes, (b) chessboard and (c) hexagonal.
Figure 2.
Graphical representation of the studied scanning strategies: (a) parallel stripes, (b) chessboard and (c) hexagonal.

Figure 3.
(a) Shape and dimensions (mm) of L-PBF specimens of prints 1, 2 and 3; (b) Graphical representation of the support structure.
Figure 3.
(a) Shape and dimensions (mm) of L-PBF specimens of prints 1, 2 and 3; (b) Graphical representation of the support structure.

Figure 4.
External diameter (average values and standard deviation) of the as-built specimens belonging to different sets of prints 1, 2 and 3.
Figure 4.
External diameter (average values and standard deviation) of the as-built specimens belonging to different sets of prints 1, 2 and 3.

Figure 5.
The average surface roughness Ra (average values and standard deviation) of the as-built specimens belonging to different sets of prints 1, 2 and 3.
Figure 5.
The average surface roughness Ra (average values and standard deviation) of the as-built specimens belonging to different sets of prints 1, 2 and 3.

Figure 6.
Density (average results and standard deviation) of the as-built specimens belonging to different sets of prints 1, 2 and 3.
Figure 6.
Density (average results and standard deviation) of the as-built specimens belonging to different sets of prints 1, 2 and 3.

Figure 7.
Mounted samples showing different porosity content of specimens belonging to prints 1, 2 and 3, produced with (a) hexagonal, (b) chessboard and (c) parallel stripes strategies.
Figure 7.
Mounted samples showing different porosity content of specimens belonging to prints 1, 2 and 3, produced with (a) hexagonal, (b) chessboard and (c) parallel stripes strategies.

Figure 8.
Optical micrographs of unetched L-PBF 18Ni300 as-built samples printed with (a) hexagonal, (b) parallel stripes and (c) chessboard strategies.
Figure 8.
Optical micrographs of unetched L-PBF 18Ni300 as-built samples printed with (a) hexagonal, (b) parallel stripes and (c) chessboard strategies.

Figure 9.
Nano-hardness (average values and standard deviation) of the as-built specimens belonging to different sets.
Figure 9.
Nano-hardness (average values and standard deviation) of the as-built specimens belonging to different sets.

Figure 10.
Influence of the scanning strategy on the external dimensions (mm) of the specimens.

Figure 11.
Influence of the scanning strategy on the average surface roughness Ra (µm) of the specimens.
Figure 11.
Influence of the scanning strategy on the average surface roughness Ra (µm) of the specimens.

Figure 12.
Influence of the scanning strategy on the density (g/cm3) considering: (a) the scan pattern, (b) the process parameters and the stripes patten, (c) the process parameters and the chessboard pattern, (d) the process parameters and the hexagonal pattern.
Figure 12.
Influence of the scanning strategy on the density (g/cm3) considering: (a) the scan pattern, (b) the process parameters and the stripes patten, (c) the process parameters and the chessboard pattern, (d) the process parameters and the hexagonal pattern.


Figure 13.
(a) Average nano-hardness (GPa) depending on the scanning strategy; (b) Influence of the interaction between the scanning speed and the interlayer rotation on the nano-hardness (GPa).
Figure 13.
(a) Average nano-hardness (GPa) depending on the scanning strategy; (b) Influence of the interaction between the scanning speed and the interlayer rotation on the nano-hardness (GPa).

Table 1.
Nominal and certified composition (wt.%) of the 18Ni300 maraging steel powders produced by Höganäs (Amperprint® 1556.074).
Table 1.
Nominal and certified composition (wt.%) of the 18Ni300 maraging steel powders produced by Höganäs (Amperprint® 1556.074).
| Ni. | Co | Mo | Ti | Al | C | Mn | N | O | P | S | Si |
|---|---|---|---|---|---|---|---|---|---|---|---|
| 17.0–19.0 | 8.5–10.0 | 4.50–5.20 | 0.50–1.00 | 0.05–0.15 | <0.03 | <0.15 | <0.02 | <0.035 | <0.010 | <0.010 | <0.10 |
| 18.5 | 9 | 4.84 | 0.64 | 0.07 | <0.01 | 0.03 | 0 | 0.034 | 0.005 | 0.002 | <0.01 |
Table 2.
Process parameters adopted for the L-PBF prints.
| Entity, (Unit) | Value |
|---|---|
| Energy density, E (J/mm3) | 89 |
| Laser power, P (W) | 160 |
| Layer thickness, t (mm) | 0.04 |
| Scan speed, v (mm/s) | variable |
| Hatch spacing, h (mm) | variable |
| Inter-layer rotation, angle (°) | variable |
Table 3.
Process parameters combinations used for prints 1, 2, and 3.
| Stripes | Chessboard | Hexagonal | |||||||||
|---|---|---|---|---|---|---|---|---|---|---|---|
| set | v (mm/s) | h (mm) | Angle (°) | set | v (mm/s) | h (mm) | Angle (°) | set | v (mm/s) | h (mm) | Angle (°) |
| Strip1 | 995 | 0.045 | 45 | Chess1 | 995 | 0.045 | 45 | Hex1 | 995 | 0.045 | 45 |
| Strip2 | 746 | 0.060 | 45 | Chess2 | 746 | 0.060 | 45 | Hex2 | 746 | 0.060 | 45 |
| Strip3 | 597 | 0.075 | 45 | Chess3 | 597 | 0.075 | 45 | Hex3 | 597 | 0.075 | 45 |
| Strip4 | 995 | 0.045 | 67 | Chess4 | 995 | 0.045 | 67 | Hex4 | 995 | 0.045 | 67 |
| Strip5 | 746 | 0.060 | 67 | Chess5 | 746 | 0.060 | 67 | Hex5 | 746 | 0.060 | 67 |
| Strip6 | 597 | 0.075 | 67 | Chess6 | 597 | 0.075 | 67 | Hex6 | 597 | 0.075 | 67 |
| Strip7 | 995 | 0.045 | 90 | Chess7 | 995 | 0.045 | 90 | Hex7 | 995 | 0.045 | 90 |
| Strip8 | 746 | 0.060 | 90 | Chess8 | 746 | 0.060 | 90 | Hex8 | 746 | 0.060 | 90 |
| Strip9 | 597 | 0.075 | 90 | Chess9 | 597 | 0.075 | 90 | Hex9 | 597 | 0.075 | 90 |
Publisher’s Note: MDPI stays neutral with regard to jurisdictional claims in published maps and institutional affiliations. |
© 2021 by the authors. Licensee MDPI, Basel, Switzerland. This article is an open access article distributed under the terms and conditions of the Creative Commons Attribution (CC BY) license (https://creativecommons.org/licenses/by/4.0/).
Share and Cite
MDPI and ACS Style
Rivalta, F.; Ceschini, L.; Jarfors, A.E.W.; Stolt, R. Effect of Scanning Strategy in the L-PBF Process of 18Ni300 Maraging Steel. Metals 2021, 11, 826. https://0-doi-org.brum.beds.ac.uk/10.3390/met11050826
AMA Style
Rivalta F, Ceschini L, Jarfors AEW, Stolt R. Effect of Scanning Strategy in the L-PBF Process of 18Ni300 Maraging Steel. Metals. 2021; 11(5):826. https://0-doi-org.brum.beds.ac.uk/10.3390/met11050826
Chicago/Turabian StyleRivalta, Francesco, Lorella Ceschini, Anders E. W. Jarfors, and Roland Stolt. 2021. "Effect of Scanning Strategy in the L-PBF Process of 18Ni300 Maraging Steel" Metals 11, no. 5: 826. https://0-doi-org.brum.beds.ac.uk/10.3390/met11050826
Note that from the first issue of 2016, this journal uses article numbers instead of page numbers. See further details here.