
Mechanical Behavior Evaluation of Tempcore and Hybrid Reinforcing Steel Bars via a Proposed Fatigue Damage Index in Long Terms


Laboratory of Technology and Strength of Materials, Department of Mechanical Engineering & Aeronautics, University of Patras, 26500 Patras, Greece
*
Author to whom correspondence should be addressed.
Metals 2021, 11(5), 834; https://0-doi-org.brum.beds.ac.uk/10.3390/met11050834
Submission received: 23 April 2021
/
Revised: 16 May 2021
/
Accepted: 17 May 2021
/
Published: 19 May 2021
(This article belongs to the Special Issue Corrosion Effects on Durability of RC Structures)
Abstract
:As it is widely known, corrosion constitutes a major deterioration factor for reinforced concrete structures which are located in coastal areas. This phenomenon, combined with repeated loads and, especially, intense seismic events, negatively affect their useful service life. It is well known that the microstructure of steel reinforcing bars has a significant impact either on their corrosion resistance or on their fatigue life. In the present manuscript, an effort has been made to study the effect of corrosive factors on fatigue response for two types of steel reinforcement: Tempcore steel B reinforcing bars and a new-generation, dual-phase (DP) steel F reinforcement. The findings of this experimental study showed that DP steel reinforcement’s rate of degradation due to corrosion seemed apparently lighter than Tempcore B with respect to its capacity to bear repeated loads to a satisfactory degree after corrosion. For this purpose, based on a quality material index that characterizes the mechanical performance of materials, an extended damage material indicator for fatigue conditions is similarly proposed for evaluating and classifying these two types of rebars in terms of material quality and durability. The outcomes of this investigation demonstrated the feasibility of fatigue damage indicators in the production cycle as well as at different exposure times, once corrosion phenomena had left their mark in steel reinforcement.
1. Introduction
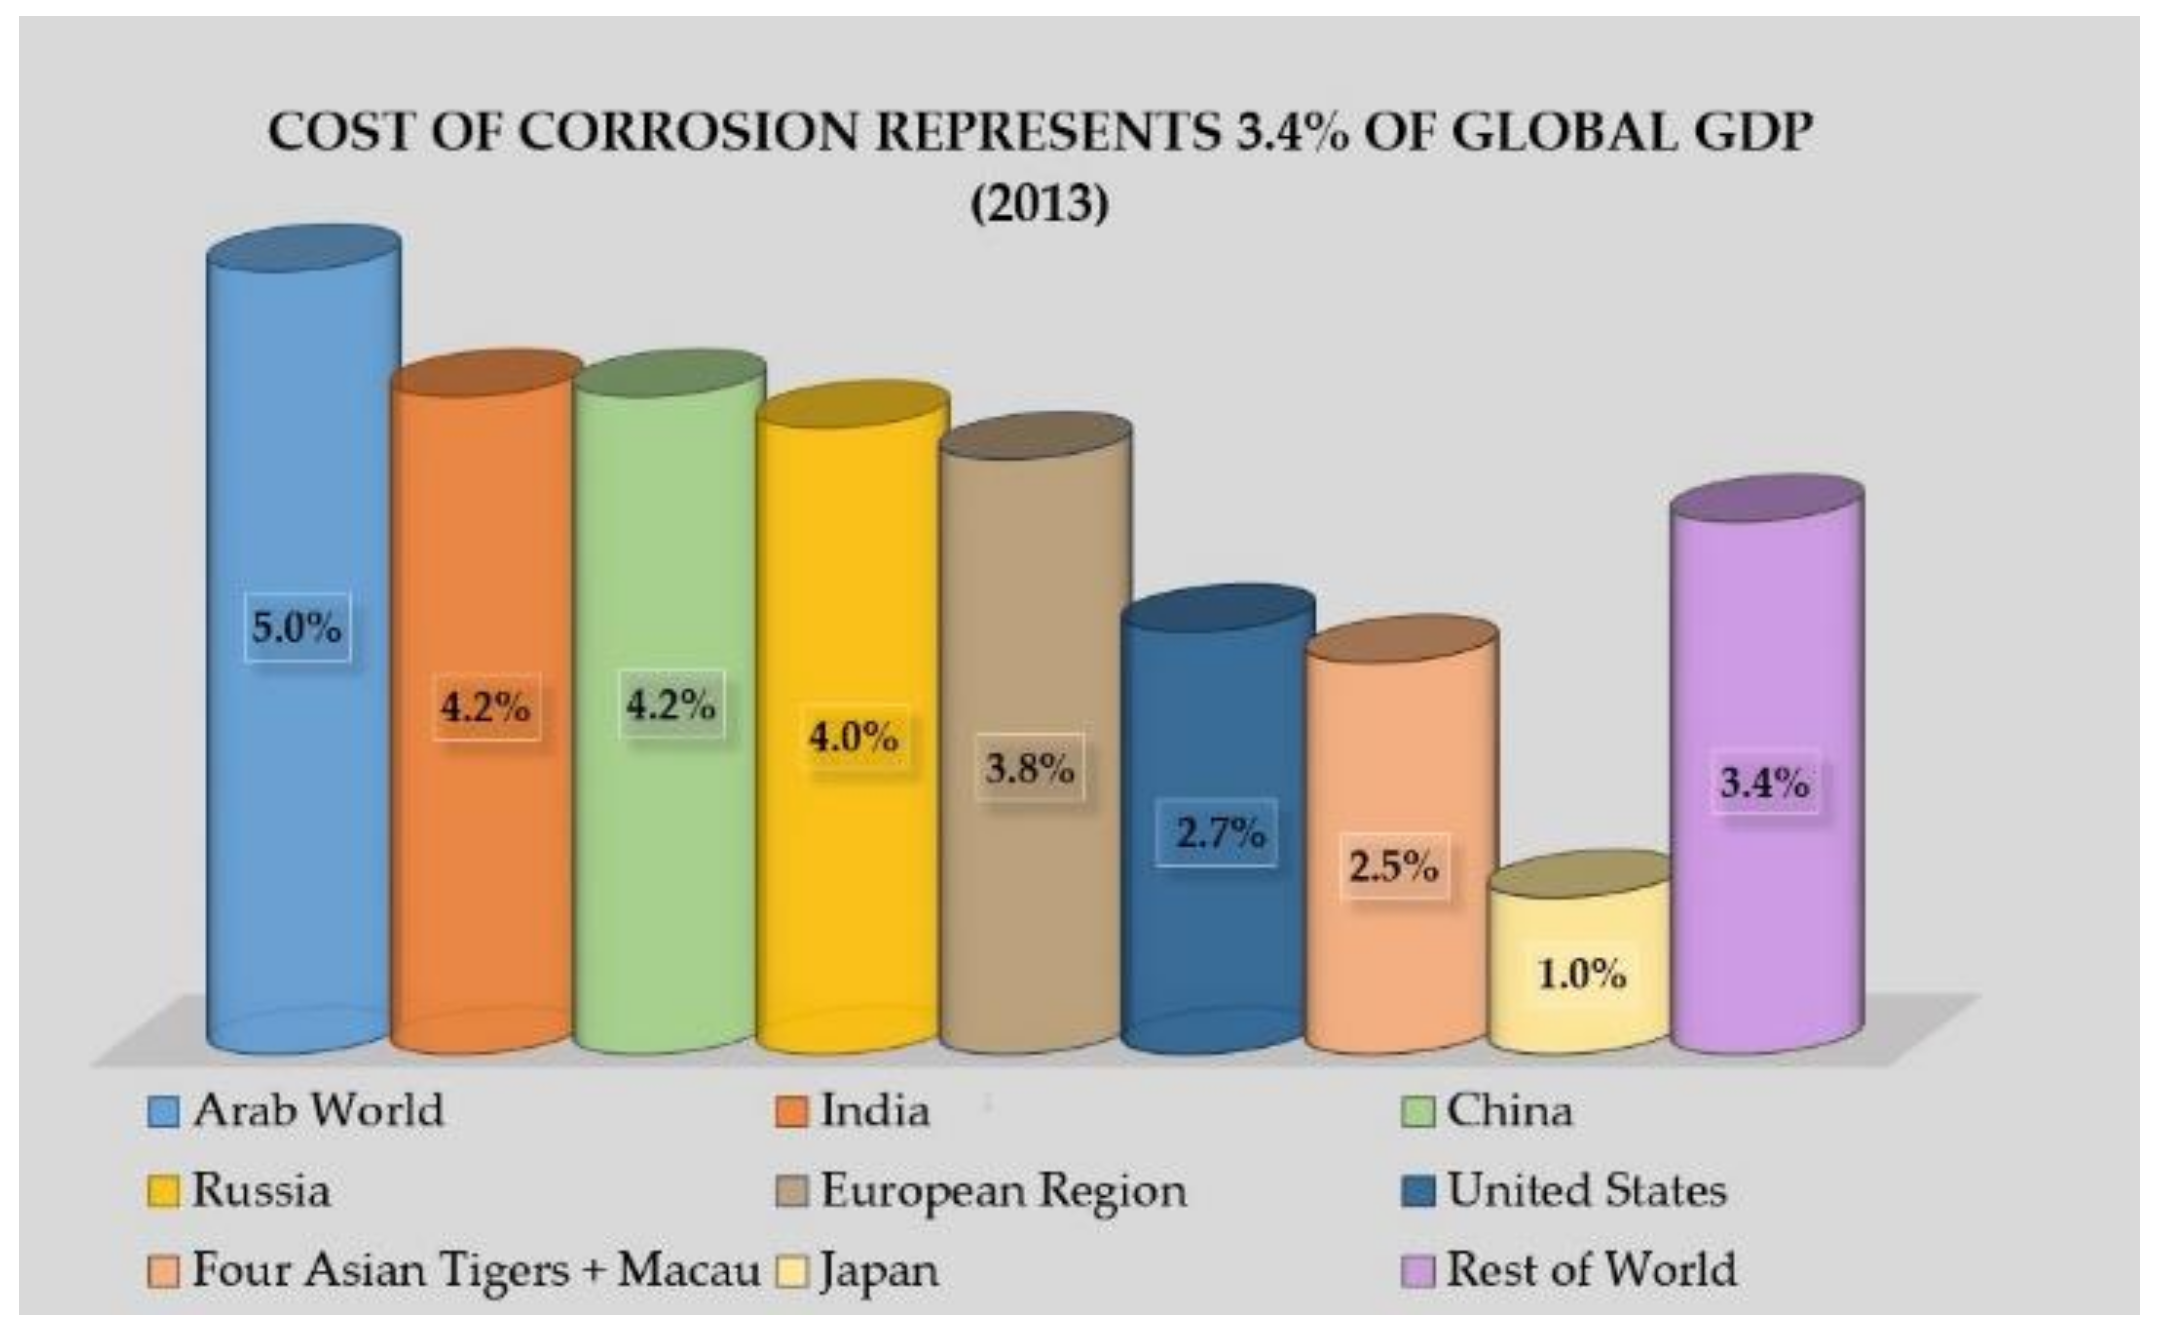
Reinforced concrete (RC) comprises the most widely used construction material of existing building stock, providing high bearing capacity and ductility compared to its low production costs. However, the durability of RC structures is adversely affected due to the corrosion of steel reinforcements because it degrades the mechanical properties of materials, mainly the ductility, which plays a key role in ensuring the bearing capacity of elements and, therefore, the whole structural performance in earthquake prone areas. From a financial perspective, corrosion is a considerable challenge and one of the most significant costs faced across the world, with enormous costs for repairing damaged structures (Figure 1), indicated by several reports, [1,2,3]. Recently, in France [3], environmental material degradation had an estimated cost of 84 billion euros in 2019 in addition to more than 2500 billion dollars worldwide, based on the usually acknowledged cost of about 3.5 percent of the global gross domestic product (GDP).
In that sense, it is straightforward that corrosion has an impact on the useful service lives of RC structures, even for low levels of corrosion, wherein cracking and spalling of concrete is visible, indicating the onset of corrosion due to aggressive factors. In addition to a loss of concrete cover and prior to a decrease in mechanical properties of reinforcement due to the cross sectional area of reinforcing bars, corrosion influences the bond mechanism between steel and concrete, which plays a key role in the design of RC members. Subsequent development of the relative slip between the two components leads to bond loss, seriously affecting the residual bond strength and, therefore, the durability of both newly designed and existing aging structures.
As it is known, in earthquake-prone areas, where RC buildings are likely subjected to dynamic loads due to intense seismic events, more stringent design provisions are required based on international design codes [4,5,6], with minimum required values of the ductility parameters of steel reinforcement. Strong earthquakes cause high plastic deformation amplitudes beyond the elastic limit; in the presence of corrosion, several studies have highlighted [7,8,9,10] that structures seem to demonstrate values of deformation below the minimum requirements imposed by standards, and this remains a concern for reinforcing bars’ capacity. Thus, the overall response of structures depends on the inelastic behavior of bearing elements in terms of rotation (μθ), on cross section ductility capacity, in terms of bending moment and curvature relationship (M-φ diagram), and on material ductility, in terms of strain and energy absorption. Hence, the mechanical properties of reinforcing bars are crucial parameters for the anti-seismic resistance of RC structures. Many researchers have studied corrosion phenomena and their negative consequences in terms of material [7,11,12,13,14,15,16,17], cross section [18,19,20,21] and element [14,22,23,24]. More specifically, scientific works have highlighted reduced cross section and the drop in the mechanical properties of materials [10,11,12,14], the severe reduction of fatigue cycles in the presence of corrosion [7,14,16,17], and the cracking and spalling of concrete cover, which leads to bond loss between steel and concrete [18,19,20,21]. Furthermore, RC elements subjected to corrosion phenomena demonstrated degraded bearing and rotational capacity [14,22,23,24].
In continuance, structures are subjected to an increased number of cycles in the inelastic range, and the coupled fatigue phenomena affect their mechanical performance over their lifetime. Previous studies have indicated that seismic events can be simulated by low-cycle fatigue tests on steel reinforcement [25]. Furthermore, several researchers have demonstrated degradation of the useful service life of reinforcing bars due to low-cycle fatigue [26,27,28,29,30]. The above mentioned studies have also showed the different stress–strain behavior of reinforcing bars in cyclic toward monotonic loading. In that manner, the loading history of rebars is capable of appreciably reducing their strength and ductility. Yet, current European and international regulations mainly provide design values from monotonic loading (quasi-static loading), despite the fact that cumulative damage due to fatigue loading is explicitly stated due to seismic events. In actuality, all inelastic cycles must be considered to be contributors to damage because they constitute the material’s strain history, which can be termed significant in cases of intense earthquakes; hence, quite a few researchers have studied fatigue damage accumulation in terms of energy absorption [31,32].
In the case of structures located in coastal regions (or marine environments) where high chloride contents are indicated, steel reinforcement degrades due to chloride-induced corrosion. According to what has been presented in the existing literature, corrosion impairs the mechanical response and the useful life of reinforcing bars. More specifically, the experimental data do not outline any consequences additional to those that are already known, namely the percentage of mass loss and reduced cross-sectional area, the development of pits responsible for the development of stress concentration points, and the degradation of the mechanical behavior of reinforcing bars, as well as the cracking and spalling of concrete cover and reduced bond strength between steel and concrete. Thus, many researchers have paid attention to the coupled effect of dynamic loading along with the corrosive environment in RC structures [16,19,33,34,35,36,37]. The overall current research indicates that the simultaneous actions of aggressive environmental effects and repeated loading increase the vulnerability of RC structures and diminish their bearing capacity. Hence, the need to attain a certain level of ductility, as defined by European standards, is at risk, leading to unexpected brittle failure of the whole structure.
To date, the degradation of mechanical properties of steel bars and the loss of structural integrity of RC structures does not correlate with the degree of corrosion damage because of the lack of quantification of the phenomenon. Nonetheless, while the theoretical framework is well-established, there is neither a verified established model nor a certain, reliable prediction method for corrosion damage because inherent uncertainties exist in the electrochemical corrosion process and the associated material and environmental conditions; as a matter of fact, these uncertainties are strictly related to their own microstructure. Tempcore steel reinforcement, which is commonly used across Europe, shows excellent deformation capacity (ductility) through its ferritic core and adequate strength through its external martensitic layer. Yet, it has been demonstrated that this type of steel reinforcement is strongly affected by corrosive factors, starting with damage of the external martensite layer. For that reason, the scientific community’s interest is directed toward new typologies of steel reinforcement, with improved mechanical performance in the presence of aggressive environmental conditions. Herein, a newly developed typology of reinforcing bars is presented, so-called Dual Phase steel F (DPF), with a mixed microstructure that enhances both mechanical behavior under monotonic and cyclic loading in corrosive conditions.
2. Experimental Study
The present manuscript, as a part of a specialized, targeted extension in the margins of the recent research European project “NEWREBAR: NEW Dual Phase steel REinforcing BARs for enhancing capacity and durability of anti-seismic moment resisting frames”, demonstrates the outcomes of experimental tests assessing the mechanical behavior of two different types of steel reinforcing bars, related to their microstructures, in different aggressive environmental conditions. The first type of tested steel reinforcement was Tempcore, which has been widely used over the last decades in civil engineering construction, and it was compared to a second type of a newly proposed Dual Phase (DP) reinforcement, used as an alternative to current steel reinforcements. In order to examine the corrosion resistance of both materials, accelerated corrosion tests were carried out via the impressed current density corrosion method. Upon completion of the corrosion tests, tensile and low-cycle fatigue tests were performed to fully assess the mechanical performance of both types of steel reinforcements.
2.1. Materials
According to the design rules for reinforced concrete structures in seismic-prone areas, global ductile behavior should be met, so as to allow high plastic deformations without relevant losses of the strength and stiffness of bearing elements. Thus, it is of great importance that all components have adequate ductility with regard to the dissipative energy of structure, element, and material ductility. Within this framework, current European and international design codes define three ductility classes for steel reinforcing bars [5], namely, A, B, and C, with minimum requirements of yield stress Rp, ultimate stress Rm, strain at yielding point εy, and total plastic strain at maximum load Ag. Furthermore, Eurocode 8 makes the use of class C for high ductility mandatory. However, the rapid depletion of ductility may occur in steel reinforcements due to corrosion damage under strong stresses, degrading the deformation capacity of reinforcing bars below the minimum requirements imposed by standards.
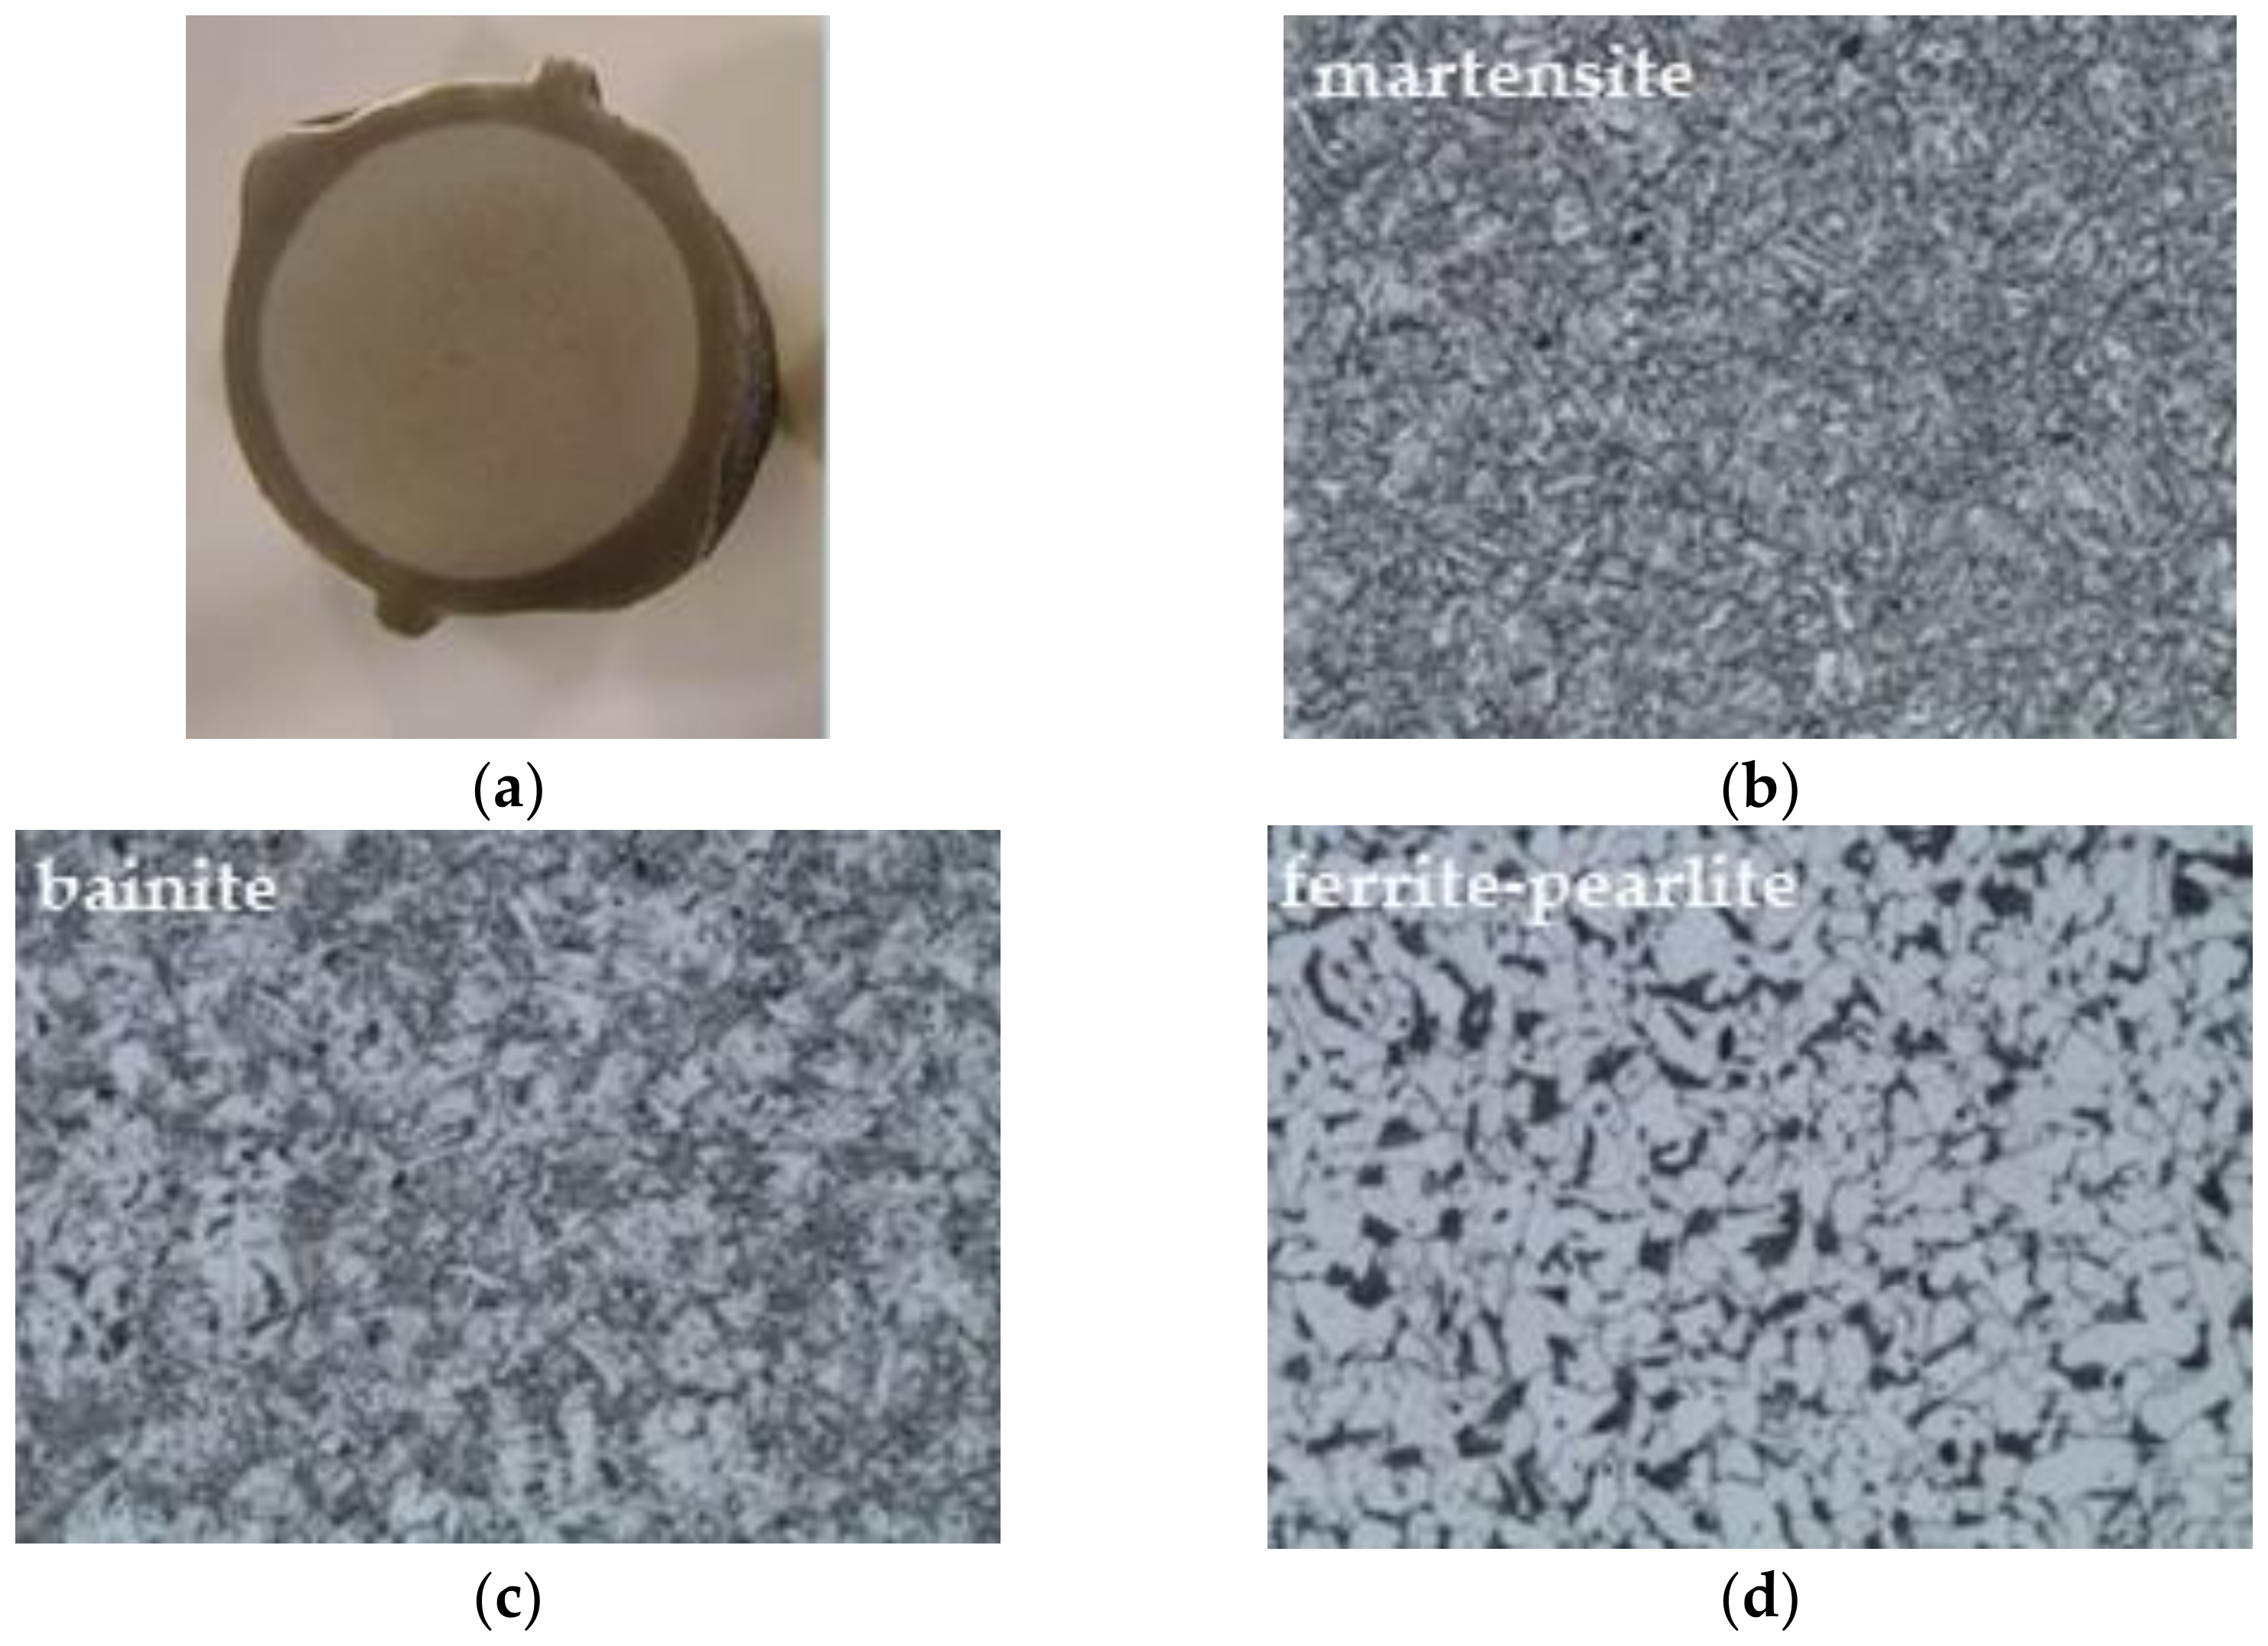
Over the last decades, Tempcore has been the predominant and most widespread typology of steel rebars in the majority of existing RC structures because it provides adequate ductility and good strength properties vs. moderate production costs. The typical Tempcore microstructure exhibits a composite microstructure consisting of three discrete phases, as shown in Figure 2a: a tempered martensite layer on the surface (Figure 2b), the main phase responsible for strength capacity, an intermediate layer of bainite (Figure 2c), and a ferrite–pearlite core (Figure 2d), which provides excellent deformation capacity. Yet, as has been reported by previous scientific work [14,38,39,40], the relatively high C content of this external martensitic layer is inherently sensitive to corrosion, which leads to a drop of the deformation capacity of the material itself and subsequently, affects the structural integrity of RC members. Recently, in several studies, Apostolopoulos [39,41,42] claimed that the susceptibility of the external martensite layer was additionally owed to the fact that Tempcore steel was made of scrap metal. As it has been proved, large quantities of non-metallic sulfide compounds (MnS, FeS) have been detected therein, reacting selectively to the presence of chlorides. Thus, internal microcracks within steel microstructures occur, leading to pitting corrosion and therefore, degradation of material performance.
Due to this fact, there is a need for the development of a new generation of reinforcing steel, enhancing its capacity for aggressive environmental conditions. For this purpose, a new pilot steel grade was constructed, namely Dual Phase (DP), in the microstructure of which a mixture of phases of martensite and ferrite coexist in a unique matrix, as shown in Figure 3. The diffuse presence of martensite in the core of the rebar is deemed to enhance the anti-corrosive resistance of the material. Moreover, the lack of a well-defined interface prevents dislocations that are free to move in the ferrite phase to be blocked on the martensite region.
Dual Phase steel F achieved through intercritical re-heating and quenching at 740 °C and tempering at 600 °C was selected for the application of the industrial treatment on its coils. The lower IQ temperature was selected because it was associated with a higher-performing DP microstructure, with a lower amount of martensite (35% vs. 50%), respectively, to 740 °C [38,43,44,45]. All reinforcing bars were produced in the same steel mill.
Hence, the mechanical performances of both grades of reinforcement was ere experimentally investigated in monotonic and cyclic loading and evaluated by exploiting the performance indices concept. The main goal of the present study is to describe the influence of various levels of corrosion on different reinforcing steel bars and to evaluate the degradation of their mechanical performance, focusing on their microstructure.
Both materials were delivered in the form of ribbed bars, 1 m long and of nominal diameter, equal to 16 mm. With the aim to understand the mechanical behavior of steel reinforcing bars based on the corresponding ISO standards for tensile and fatigue tests [46], the specimens were divided into two groups, with total lengths equal to 200 mm or 500 mm, as the case may have been. Moreover, each group was subdivided into seven groups, exactly as many as the cases of the tested corrosion exposure times, namely non-corroded, 100 h, 200 h, 300 h, 400 h, 600 h, 800 h, and 1000 h, respectively. Prior to the accelerated corrosion tests, the total length and initial mass of each specimen were recorded.
Each tested specimen had its own unique label; the first digit of the label referred to the steel type: B for Tempcore steel and F for Dual Phase steel. Following that, the next digit referred to the electro-corrosion exposure time: 0 for non-corroded specimens and 100, 200, 300, 400, 600, 800, and 1000 for the corresponding hours of accelerated corrosion. There was more than one specimen in each group at the same exposure time. Thus, the last digit referred to the number of specimens at the same electro-corrosion time. For instance, the F-400-1 specimen corresponded with a specimen of Dual Phase steel F after 400 h of accelerated corrosion, and was the first (in a row) of the group at the same corrosion time.
In addition, the chemical composition of both steel grades is summarized in Table 1.
2.2. Accelerated Corrosion Technique
It is common knowledge that natural corrosion is a relatively slow process, with a long period needed for the outbreak of the phenomenon, even in marine environments. Hence, accelerated methods are performed in the laboratory so as to reduce time and simultaneously simulate the consequences of corrosion on steel reinforcing bars.
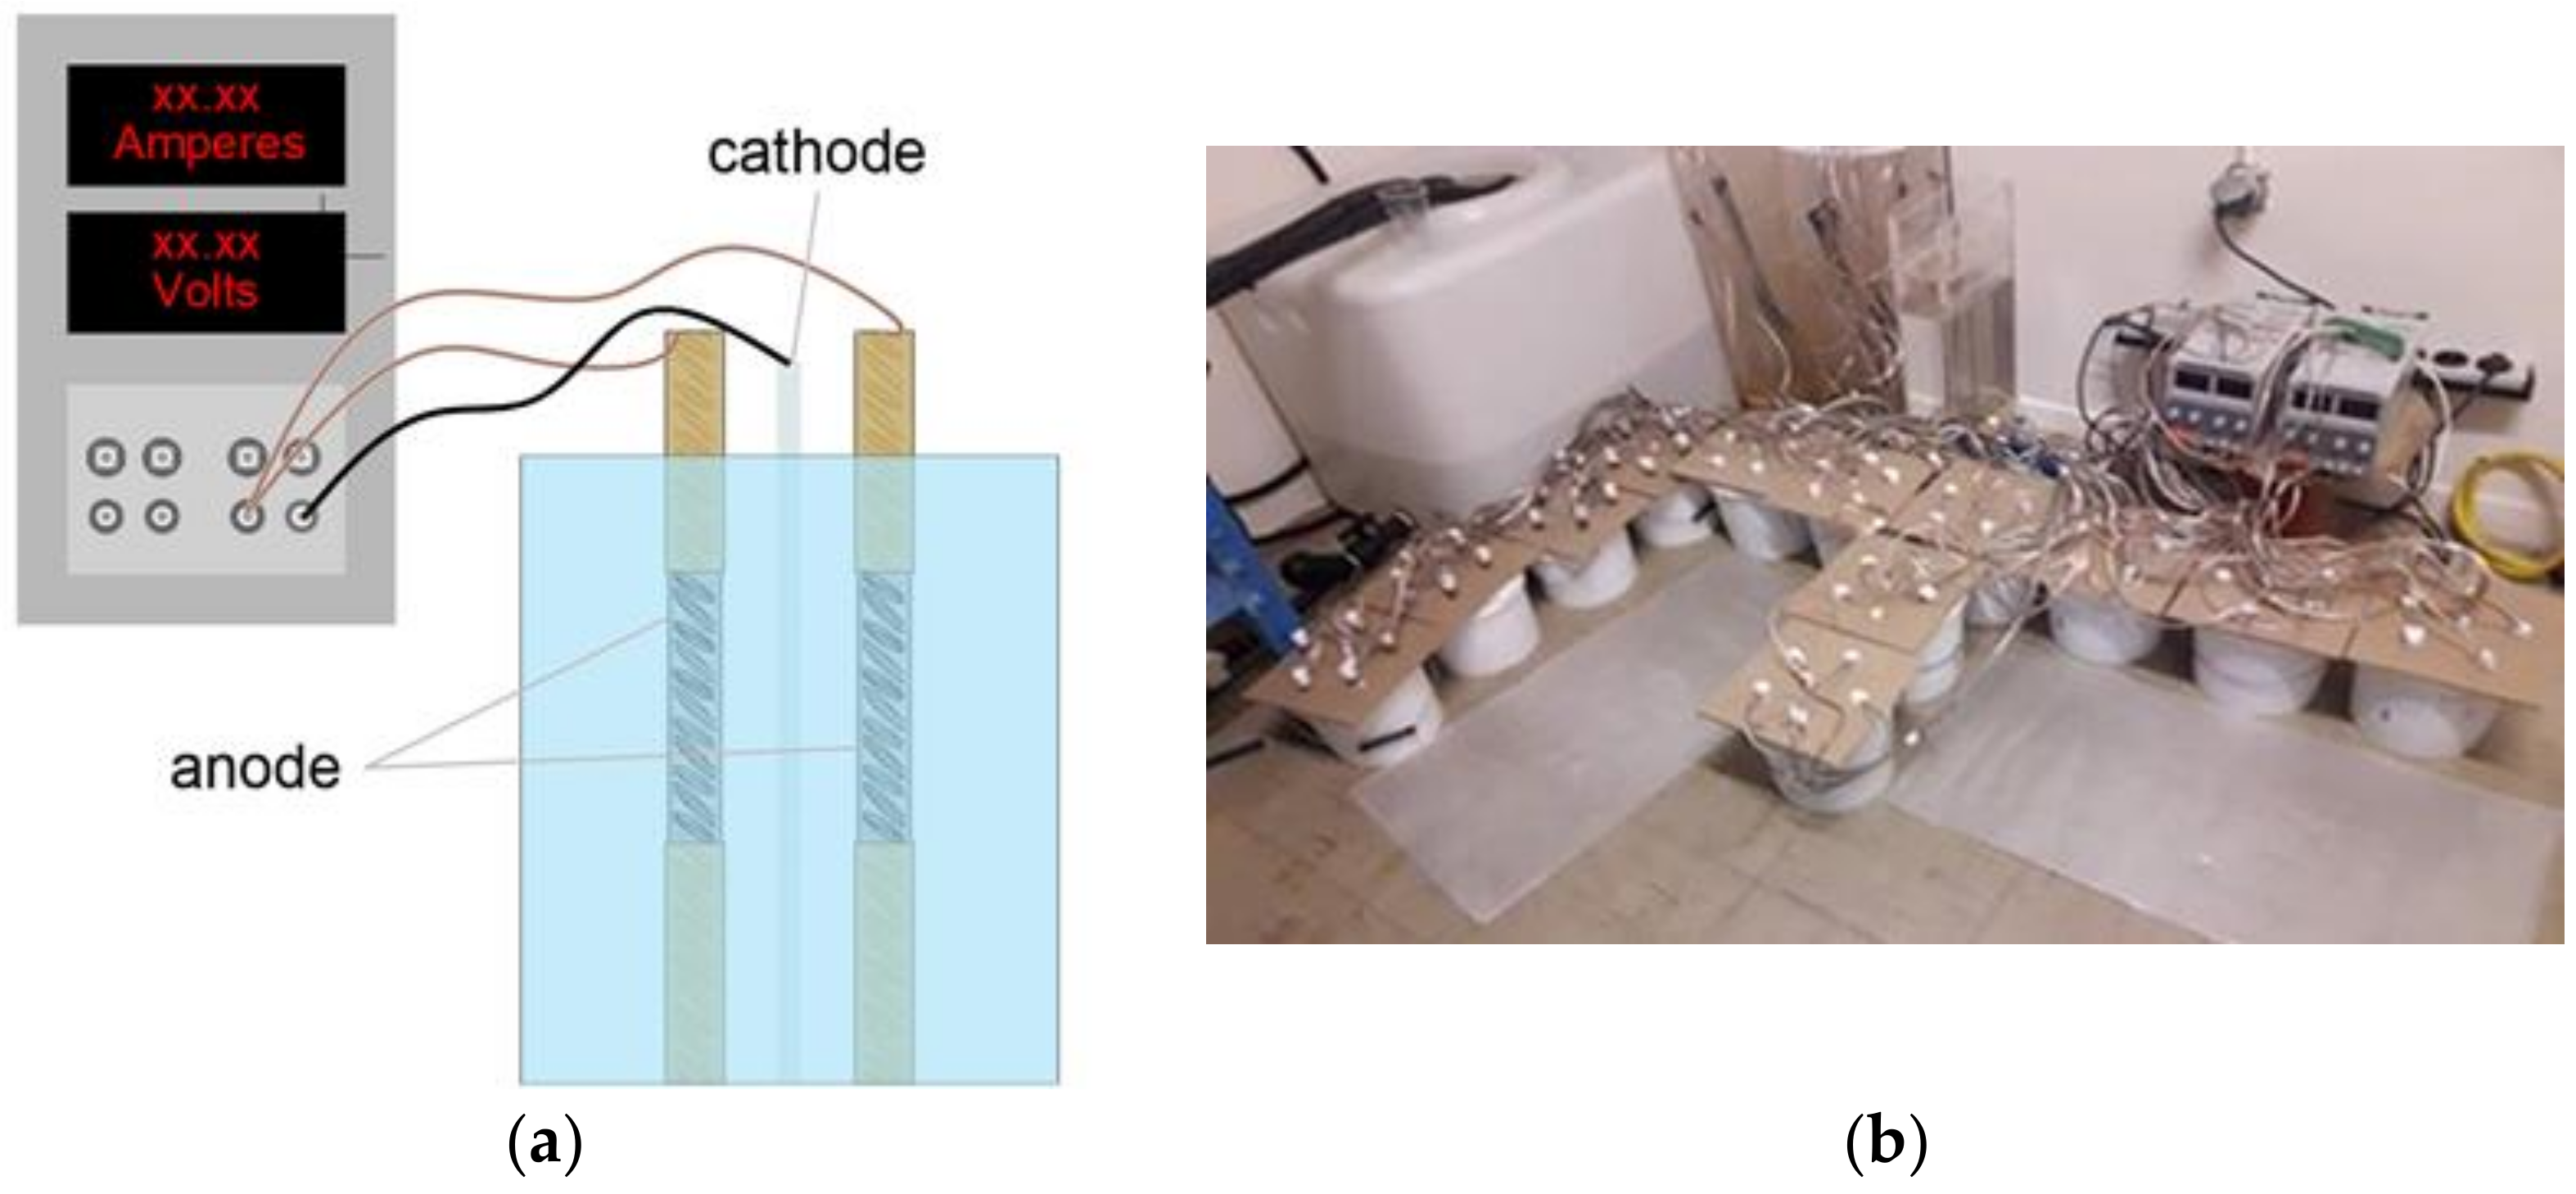
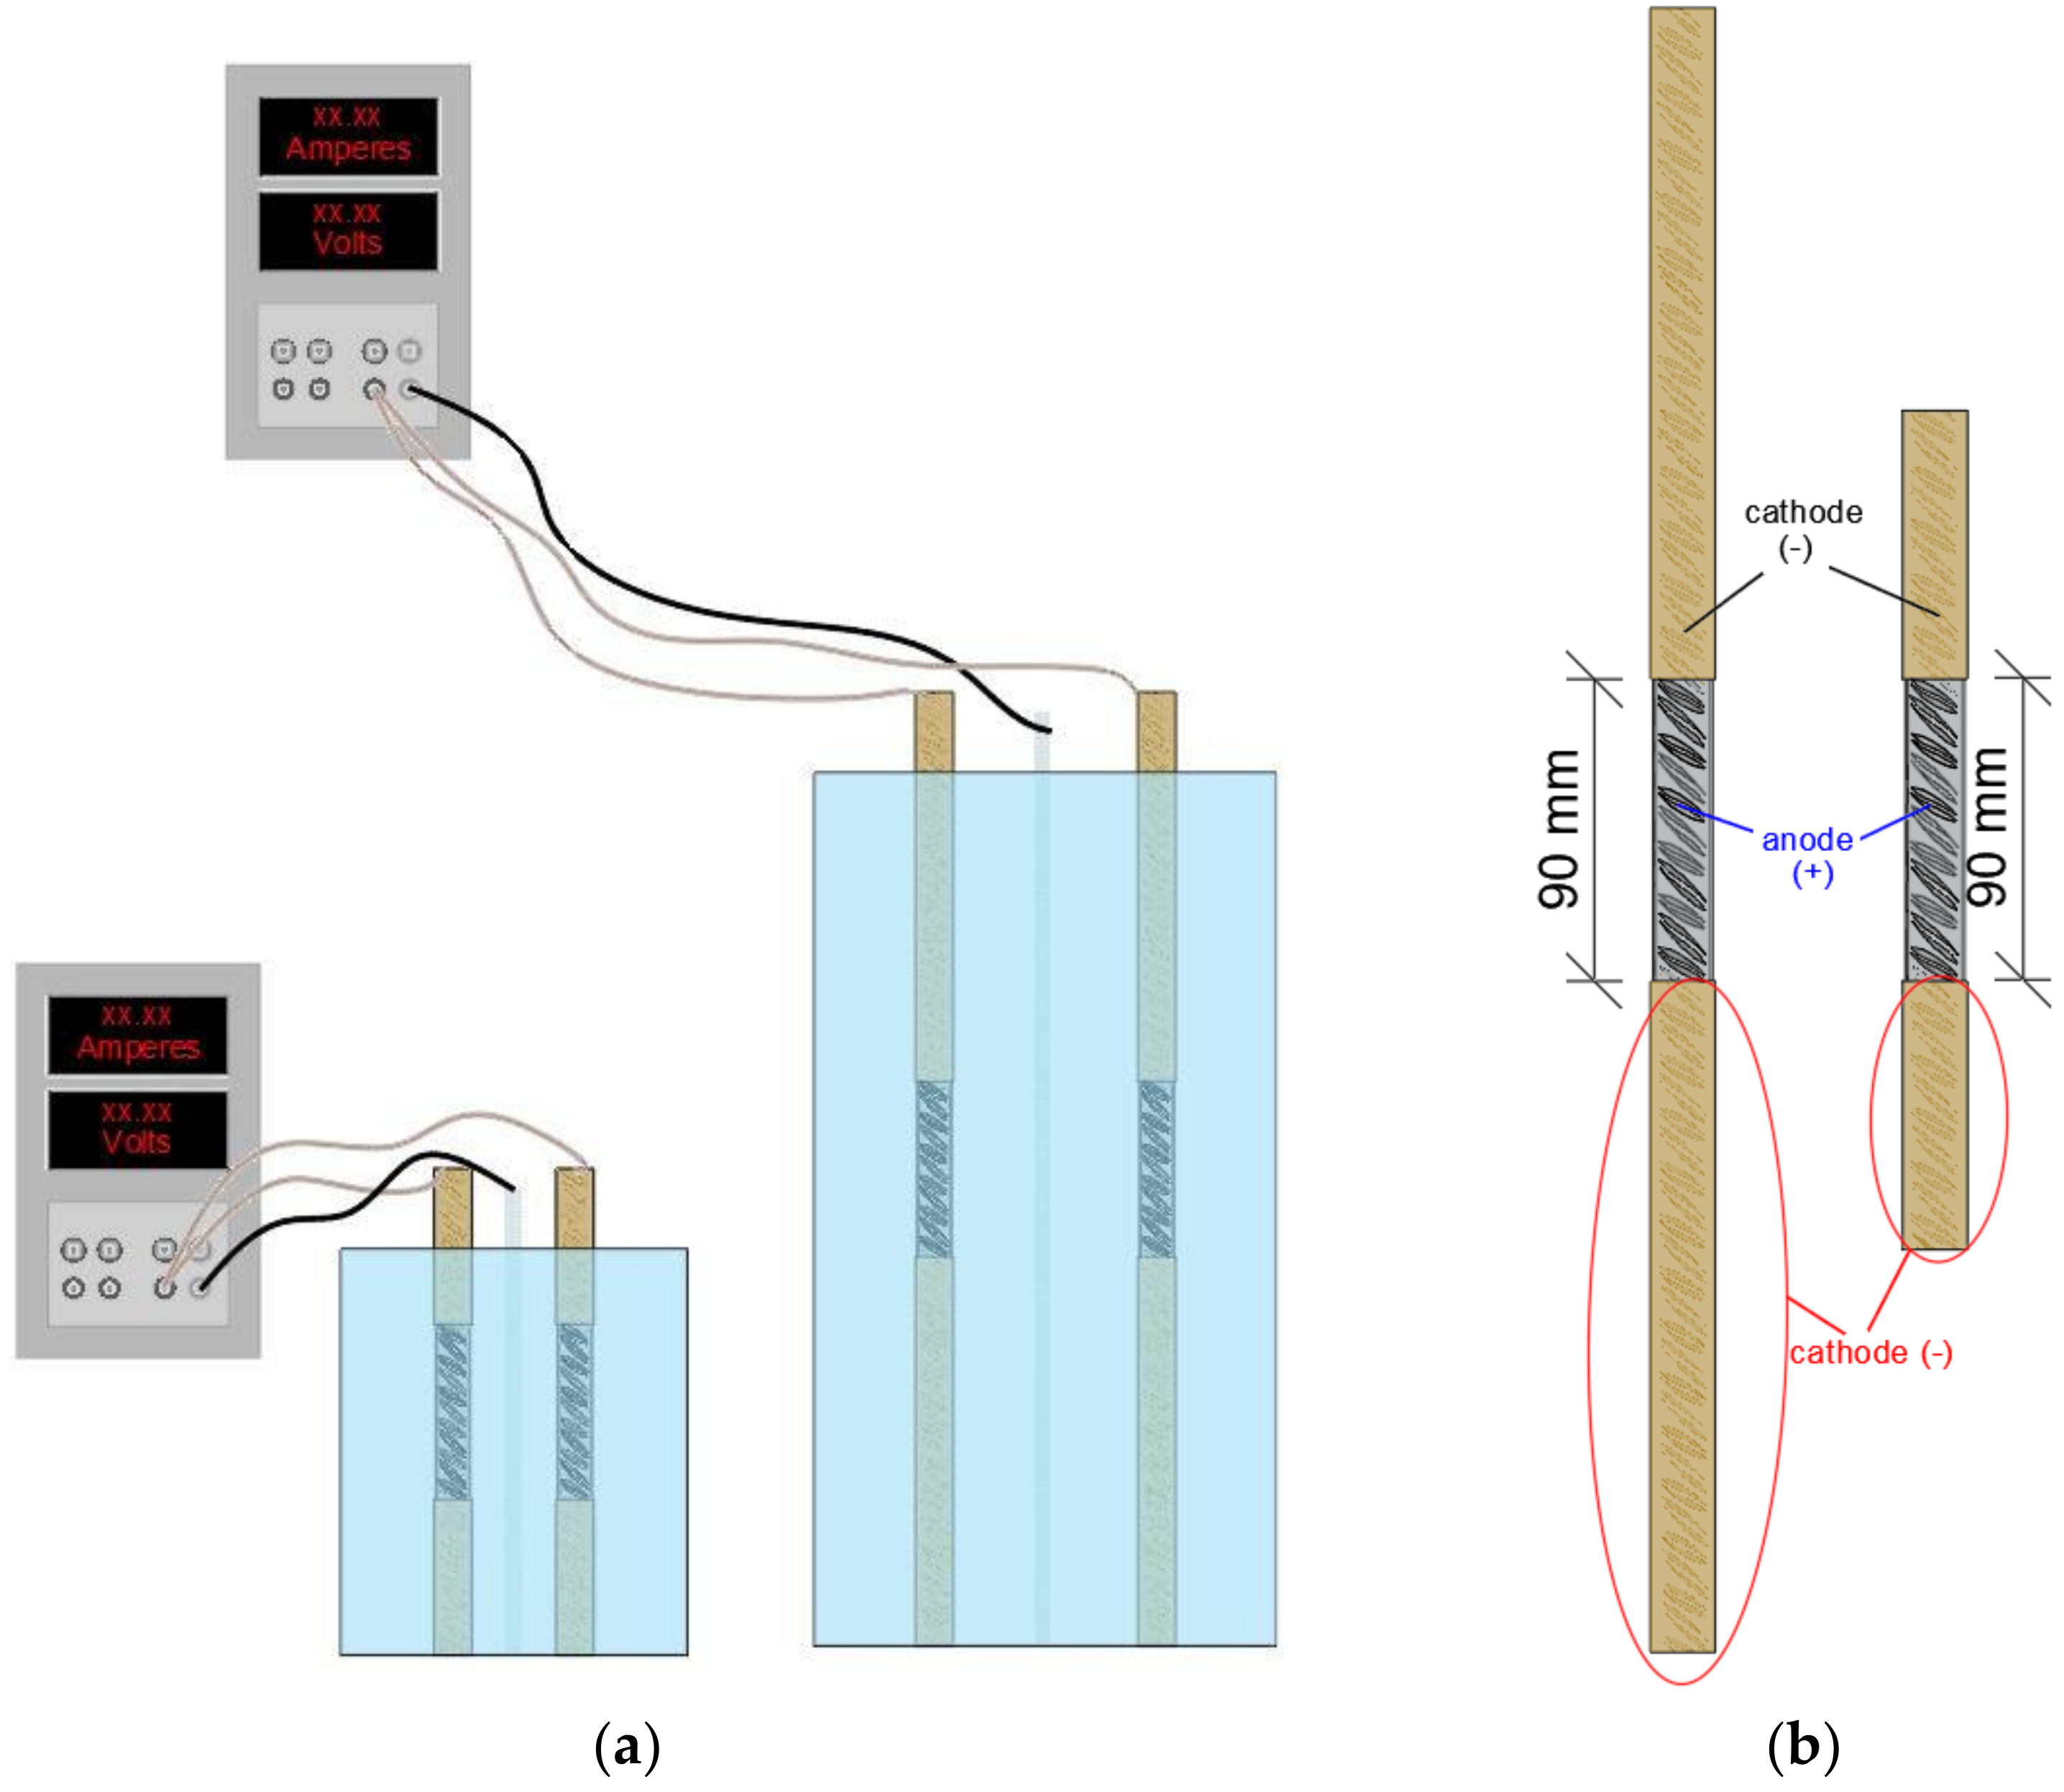
One of the most widely used accelerated techniques, adopted in the present experimental study, is the Impressed Current Density Corrosion method (ICDC), in which a power supply is used to induce corrosion by applying a direct electric current to steel rebars, which act as anodes. Within the present experimental study, the specimens were immersed in electro-corrosion cells filled with 5% sodium chloride (NaCl) solution, by weight of water, in the presence of a stainless steel bar (cathode of the circuit), which was positioned in the same direction as the rebars, as shown in Figure 4. In order to accelerate the corrosion process, the imposed current density was equal to 1.0 mA/cm2, with six different exposure times, equal to 100, 200, 300, 400, 600, 800, and 1000 h, respectively.
Moreover, the content of the NaCl solution represents accurately the case in Mediterranean countries, where the hot climate results in higher salinity of the seawater, in contrast to northern countries. Furthermore, in Mediterranean countries, the salinity of the sea increases during the summer periods, given the high temperatures recorded [21].
For a more accurate approach corresponding to real coastal conditions, during the corrosion periods of the specimens, ponding cycles of wetting and drying conditions were enforced because splash and tidal environments were the most aggressive among the three cases, given the high chloride concentrations [21,47]. Specifically, in light of the current climatic conditions in the Mediterranean basin, a cyclic exposure was adopted, with 9 h wet in the electrolyte and 15 h in dry mode. The full immersion of the electrolyte with the parallel current imposition was a necessary condition among other stable parameters such as temperature and pH, which guaranteed the results’ accuracy throughout the corrosion process [22].
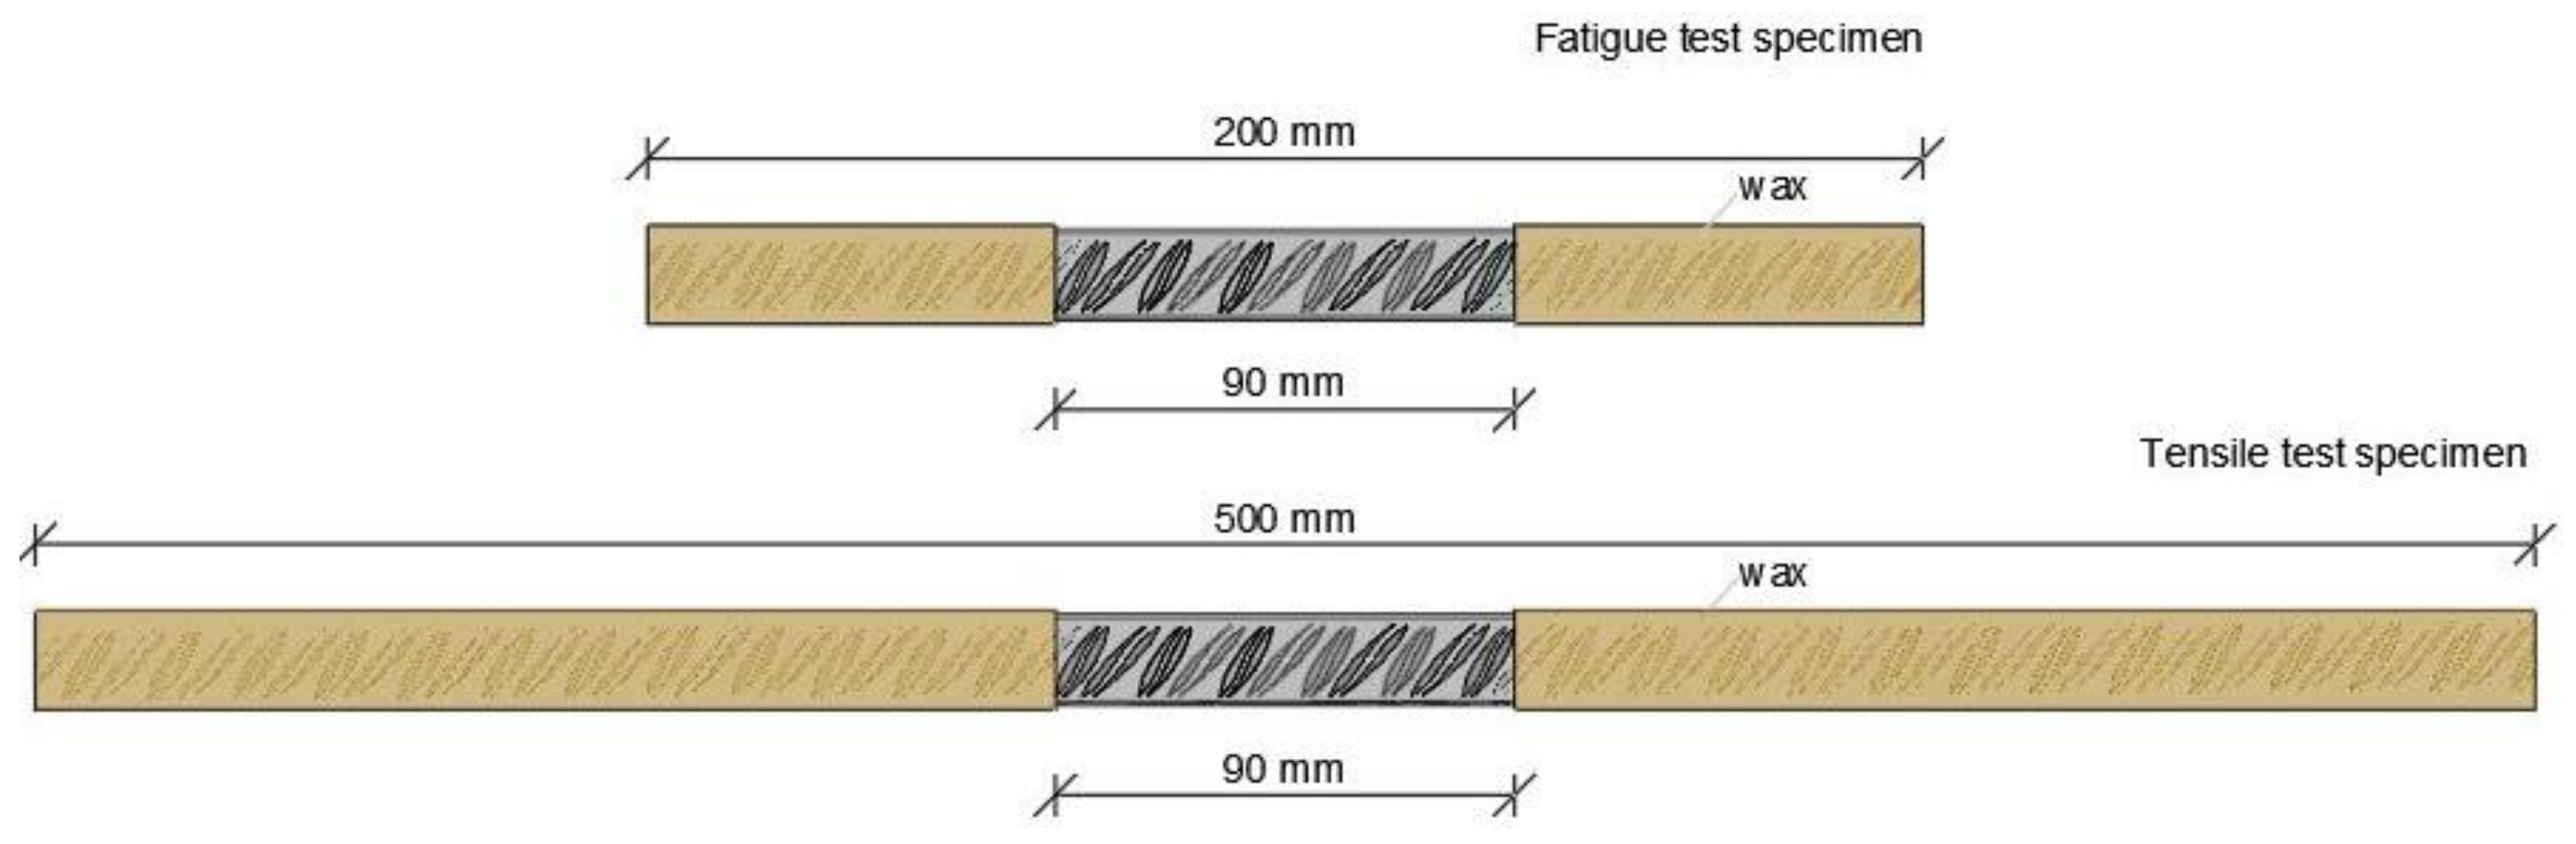
Existing literature [48] has demonstrated that the exposed-to-corrosion length as well as the total length of the reinforcing bar has significant influence on corrosion damage. Hence, for the purpose of the experimental tests, in each specimen of 500 mm length overall for tensile specimens and of 200 mm length overall for low cycle fatigue specimens, the central section of 90 mm was selected as the exposed-to-corrosion length, while the rest of it was protected and carefully covered by wax, as depicted in Figure 5. For the evaluation of corrosion damage, only the exposed surface was examined.
Upon completion of the corrosion process, the specimens were washed with clean water to remove any salt deposits from their surfaces and then were dried. The oxide layer was removed from the specimens’ surfaces using a bristle brush, according to the ASTM G1-03 [49], so as to estimate the level of corrosion damage. The percentage mass loss (referring to the exposed-to-corrosion length of 90 mm) was calculated as shown in Equation (1).
where Mref and Mcor are the mass of the non-corroded (reference) and corroded specimens, respectively.
2.3. Mechanical Tests
For the purpose of the present study, a significant number of specimens able to stabilize the results were considered for both monotonic (tensile) and cyclic (LCF) tests, as shown in Table 2. Traditional Tempcore B and Dual Phase DPF rebars were tested under the same conditions for comparison. More specific, 150 mechanical tests were conducted, 34 of which were tensile tests and 116 cycle fatigue tests. Moreover, a total of 120 corrosion tests were conducted.
Initially, in order to estimate the class of each steel category and its mechanical properties, tensile tests were performed under reference (non-corroded) and corroded conditions. Furthermore, to make a more comprehensive study of the mechanical behavior of rebars other than tensile tests, additional low cycle fatigue tests were conducted so as to simulate the seismic response of rebars.
For all mechanical tests, a servohydraulic MTS 250 kN machine was used. In particular, monotonic tensile tests were carried out on non-corroded and corroded specimens for up to 300 h according to the ISO 15630-1 Standard [46], which could be used as an initial assessment of the corrosion damage of materials, and each specimen had a total length of 500 mm. The employed displacement rate was set to 2 mm/min. The values of yield strength (Rp), ultimate strength (Rm), plastic strain at maximum force (Ag), and the energy absorption per volume until the corresponding value at plastic strain at maximum force (Ud) were determined for each tensile test.
Moreover, cycle fatigue tests were also conducted under displacement control on non-corroded and all cases of corroded reinforcing bars, with a preliminary protocol for low-cycle fatigue tests after Spain’s and Portugal’s standards [50,51]. The elaboration of a common procedure for the assessing of LCF behavior of rebars needs the definition of four main parameters: the level of imposed deformation (ε), the frequency used (f), the number of cycles to execute (Nc), and the free length of the specimen (L0). Hence, a protocol for the execution of LCF tests on the selected representative steel reinforcements was elaborated [14]; the testing frequency used in the mechanical tests was fixed equal to 2.0 Hz, with a stress ratio equal to 1. Two levels of imposed deformation were adopted for the execution of hysteretic cycles: on one hand, equal to ±2.5%, in order to limit the buckling phenomena, and on the other hand, ±4.0%, so as to simulate intense seismic loadings. Furthermore, the free length of the sample was assumed equal to be 6 times the bar’s diameter (6Ø), namely 96 mm, in order to perfectly represent the conditions of longitudinal rebars in RC elements of buildings designed in high ductility classes, according to Eurocode 8 [4].
2.4. Fatigue Damage Index
The ability of a material and its mechanical performance cannot be characterized by a single material property but reflect, rather, the combination of strength and ductility provided by the material. The selection of the steel grade with the highest mechanical performance from among a number of steel products is not a straightforward decision. Therefore, the use of performance indices has been proven to be a very useful tool for material selection in engineering applications.
In the previous works of authors [52,53,54,55], a static damage index QD was introduced to evaluate the ability of materials for mechanical performance in relation to monotonic loading, and on this basis, rank them with regard to their tensile properties, by means of a single quantity. Furthermore, the introduction of reduced tensile properties due to corrosion gave an accumulative index of mechanical performance due to corrosion damage. On the pretext of these presentations, as a supplement to the research gap, a fatigue damage index is introduced to assess the response to dynamic loadings, in contrast with the corresponding factors from monotonic loadings. More specifically, as is already the case for seismic-prone areas, a structure is forced to absorb energy; a dynamic indicator factor is then introduced so as to attempt to reflect the history loading and the corresponding absorbed energy.
In the present manuscript, an effort has been made to evaluate the performance of both types of steel bars, expressed in the form of the quality index QF (Equation (2), in a similar manner as the quality indexes proposed in [48,52,53,54,55]. More specifically, a fatigue damage indicator, QF, is introduced, a detailed description of which follows underneath. The fatigue damage indicator QF is determined as:
where the dimensionless factor KF is defined as shown in Equation (3):
In the above equation, σmax,i and σ80,i are the maximum receiving stress values of the fatigue test (in the anion branch) and the corresponding values at the lower limit of 80 percent of the maximum loads of the non-corroded steel bars of the i corroded specimens, respectively, while σmax,ref is the maximum stress value derived among all reference specimens of the same strain range, as shown in Figure 6. Due to the different mechanical responses of structural elements under tension and compression in several research papers [21,56], rebar’s sufficiency was thought to be acceptable, as it could bear up to 80 percent of the maximum loading point.
The quantity Q0 is formulated as:
In the quantity, Q0 and N80,i account for the maximum value of number of cycles to failure derived among all reference specimens of the same strain range and beneficial number of cycles of the i specimen at the corresponding value of 80 percent of the maximum load of the i corroded specimen, respectively. Moreover, Wd,max accounts for the maximum strain energy density value corresponding to an individual loading cycle derived among all reference specimens, while Wd,i accounts for the strain energy density of the i specimen corresponding to an individual loading cycle, respectively. The strain energy density Wd may be evaluated from the area under the true stress–strain curve.
It is also worth noting that under the current standards, the bearing capacity of rebar is considered to be unchanged throughout the entire lifetime of a reinforced concrete structure, typically exceeding 50 years, although it has been clearly recognized that during this period, considerable corrosion damage, as well as fatigue damage, can be accumulated at the reinforcing steel bar.
3. Results and Discussion
Scanning electron microscopy (SEM) and energy dispersive X-ray (EDX) analyses were executed before and after the corrosion experiments both on Tempcore steel B and Dual Phase steel F samples and upon completion of the experimental procedure, all results were compiled and summarized, depending on the class of steel reinforcement and the type of mechanical test. More specifically, for the case of tensile tests, yield strength Rp, ultimate strength Rm, uniform deformation Ag, and strain energy density Ud were recorded. Moreover, for the case of fatigue tests, the number of cycles N, maximum stress σmax, minimum stress σmin, and fatigue energy density Wd were recorded for ±2.5% and ±4.0% strain-controlled tests, respectively. For all corroded specimens, mass loss was also estimated for each corrosion exposure time.
3.1. SEM and EDX Analyses
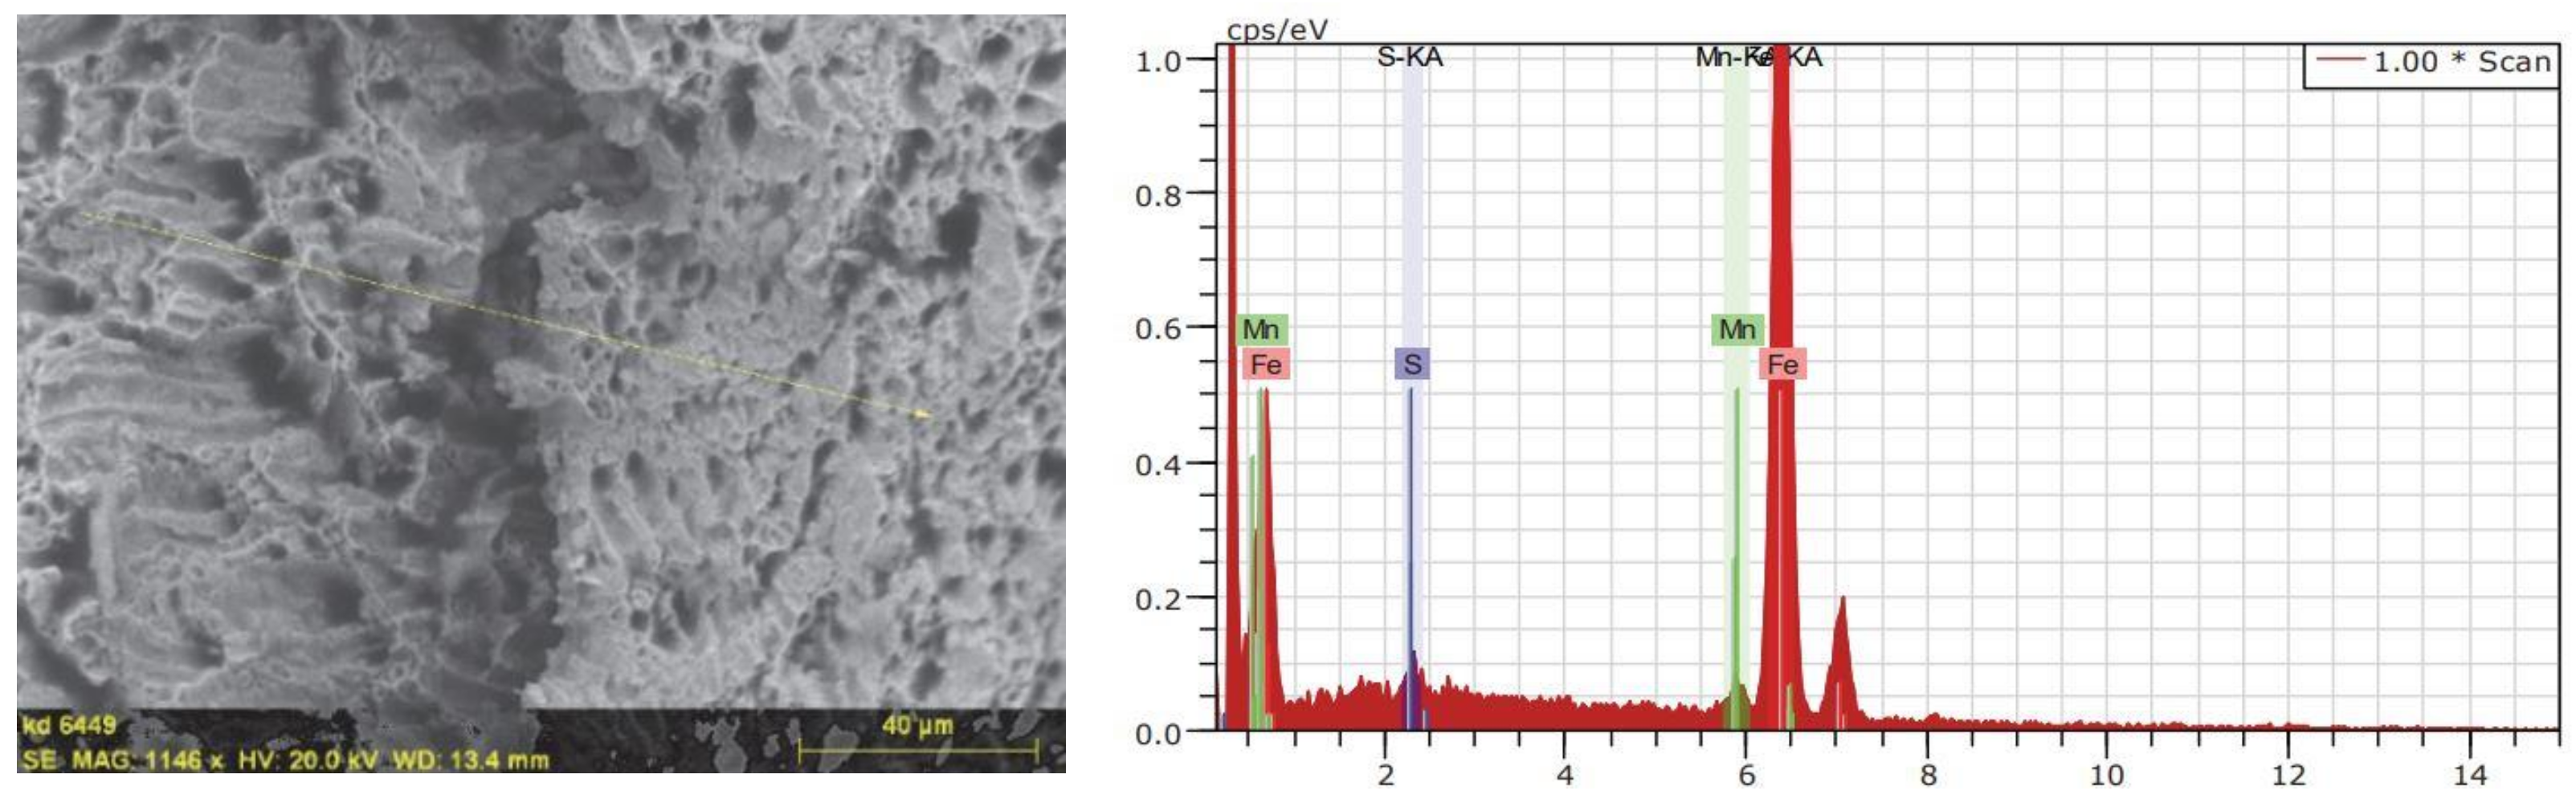
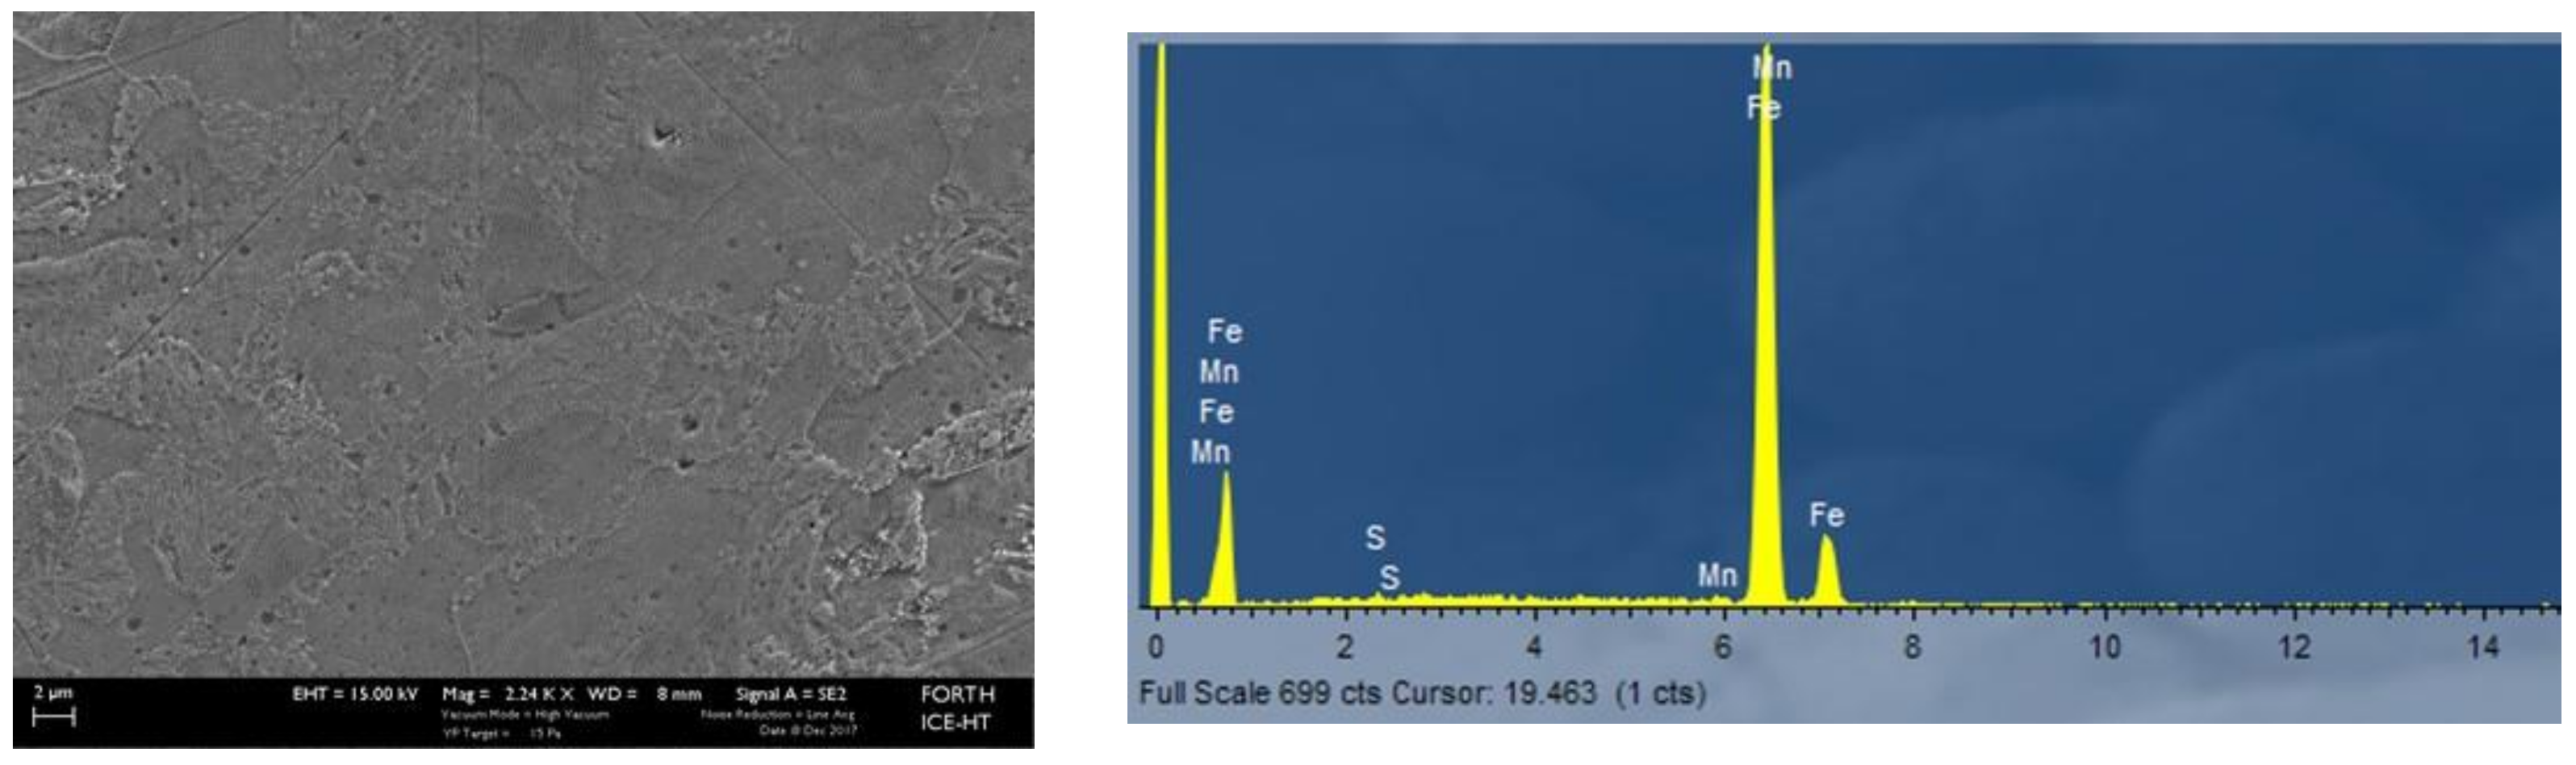
As it is known, the cumulative effects of fatigue and corrosion impair the mechanical performance of steel reinforcement, a fact directly linked with the microstructure of each class of steel reinforcement. Especially in fatigue conditions, it is known that crack nucleation is taking place at the areas where sulfides, FeS, and MnS can be found, leading to sub-surface crack propagation, interacting with external pits. For the goals of the present manuscript, SEM and EDX analyses were executed both on Tempcore steel B and Dual Phase steel F samples so as to evaluate their corrosion resistances and correlate the contribution of microstructure to their mechanical responses. The corresponding figures for both classes of steel reinforcement are presented below.
According to these findings, the area depicted in Figure 7 was rich in MnS and FeS compounds, a composition which gradually leads to local decomposition and, inevitably, to the failure of the material. To the contrary, in Figure 8, no areas with defects were detected that were accentuated by corrosion, beneficially for the mechanical performance of corroded Dual Phase steel F.
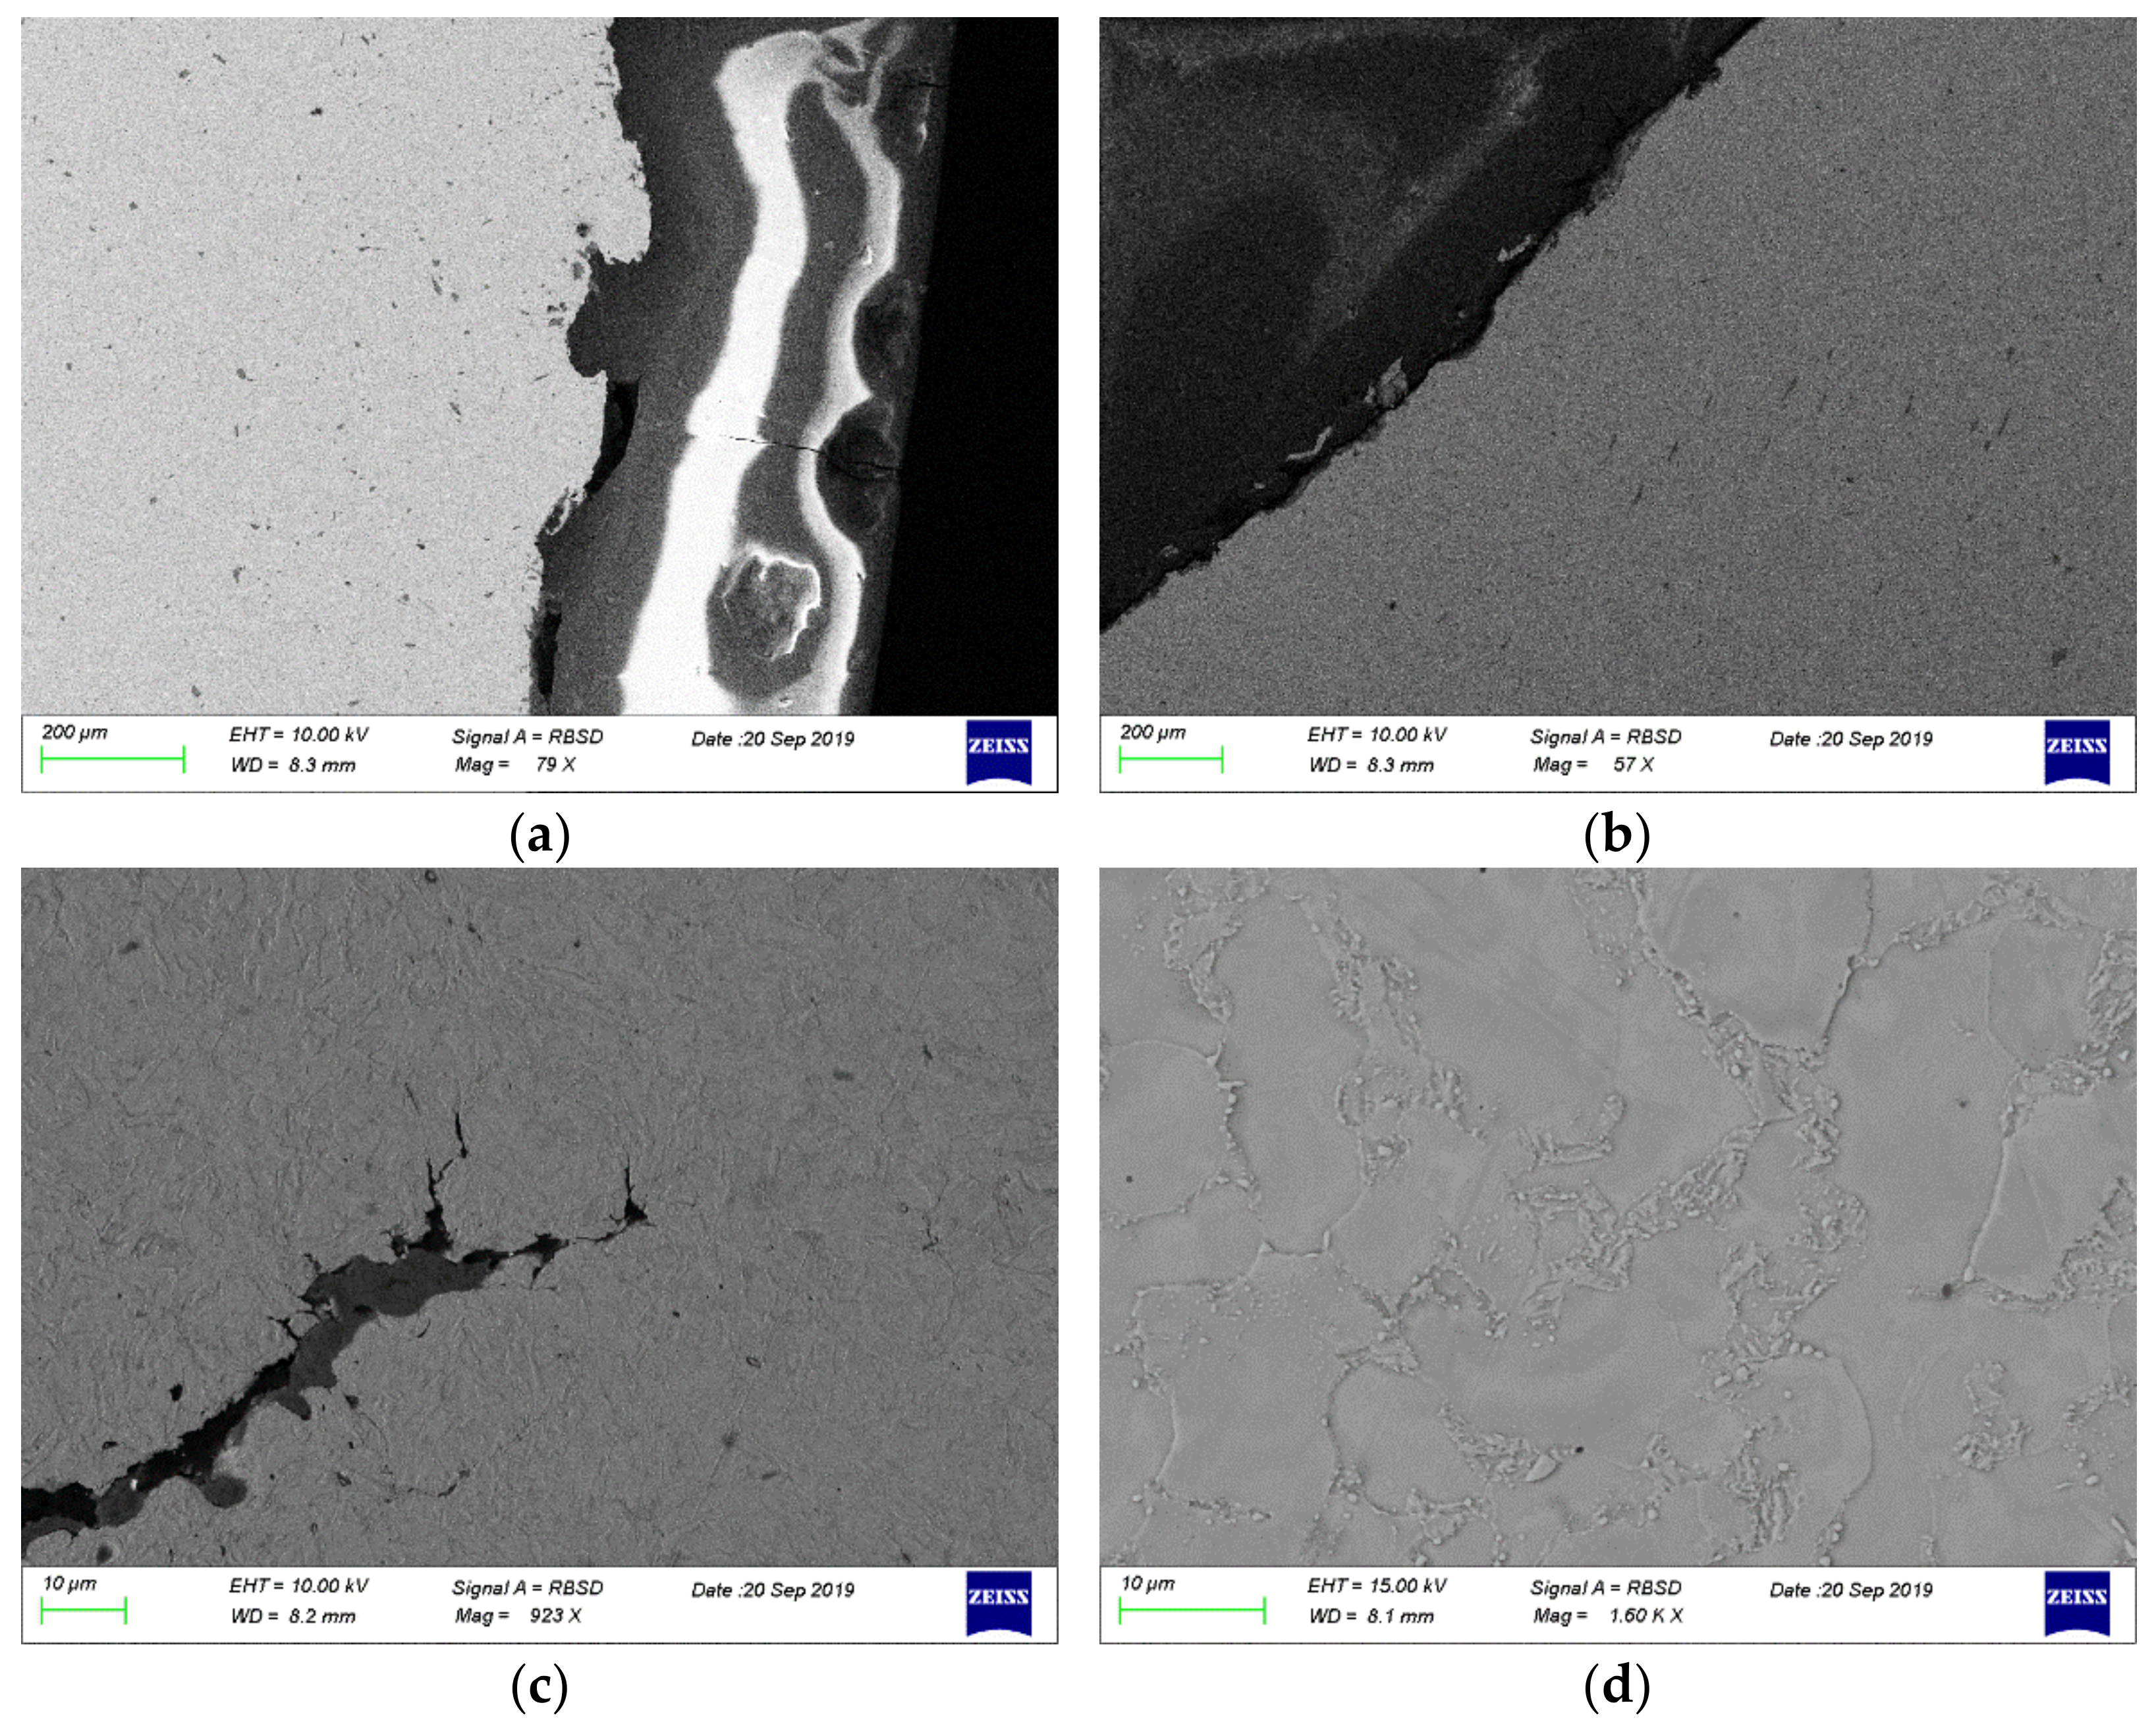
From the above mentioned, it could be concluded that the philosophy of martensite’s diffusion in the entire microstructure of steel F was clearly associated with an improved performance of F against corrosion damage, in contrast to Tempcore B, wherein the presence of martensite around the outer layer of its cross section crucially affected the mechanical performance of corroded Tempcore steel B. The above mentioned can be easily understood by examining the cross sections of steels Tempcore B and F, in Figure 9, wherein the surface defects of both steel grades under equal-exposure corrosion times are compared. As shown, the rupture of the outer layer incited the progressive evolution of microcracks toward the inner core of steel Tempcore B (Figure 9a,c). Being well-known that the failure of steel reinforcement due to low cycle fatigue commences from the outer layer, it became obvious that Tempcore steel B displayed significant heterogeneity such as defects, pits, etc., a fact that presaged its deteriorated response under fatigue loading contrary to Dual Phase steel F, which rendered a more lenient surface.
3.2. Mass Loss
As mentioned in the previous section, the corrosion damage of all tested reinforcing bars was estimated upon the completion of the accelerated corrosion process. The recorded values are presented in detail in the following Table 3 and Table 4, for tensile specimens (with 500 mm total length) and fatigue specimens (with 200 mm total length), respectively, and are depicted for all cases in Figure 10.
For the case of tensile specimens up to 100 h corroded conditions and of fatigue specimens up to 300 h corroded conditions, both types of steel reinforcement demonstrated similar percentage mass loss. As a matter of fact, it has been experimentally proven [57] that immediately upon the onset of corrosion, the percentage mass loss of rebars is assumed to increase in a similar way for a certain period. This critical period constitutes the necessary time that corrosion needs from its onset to its full extent so as to enable each metallic material to develop its corrosion resistance or vulnerability. However, over greater levels of corrosion exposure time, Tempcore steel B demonstrated lower percentage mass loss compared to Dual Phase steel F, for both cases. More specific, Tempcore steel B recorded 29% lower mass loss than Dual Phase steel F for tensile specimens of 300 h corrosion time and 31% for fatigue specimens of 1000 h corrosion time, respectively. Hence, by the end of the corrosion time for both groups of specimens–tensile and fatigue–Dual Phase steel F recorded generally higher values of percentage mass loss vs. Tempcore steel B.
Moreover, besides the accelerated corrosion technique via the development of an electrical closed circuit (Figure 11a), the exposed-to-corrosion length and covered length (geometry) of reinforcing bars played a key role in the caused corrosion damage. During the electro-corrosion process, wherein electric current was imposed on the steel rebar, a parallel open circuit was developed in its own material, dependent on its geometry: in particular, the exposed-to-corrosion length (anode) and the protected-with-wax length (cathode). Thus, the phenomenon of differentiate aeration corrosion affected and distinguished the rate of corrosion process.
In continuance, the observations extracted from Figure 11b highlight the differential aeration corrosion referred to each specimen, different parts of which were exposed to different concentrations of oxygen. Clearly, then, the part of the reinforcing bar with the smallest concentration of oxygen became the anode, and the rest became the cathode, leading to the creation of a galvanic element.
In a similar way, as already demonstrated in the previous work of the authors [48,58], specimens with a shorter exposed length showed greater mass loss in comparison with specimens of the same total length but with longer exposed length, as the corrosion phenomenon was limited to a smaller area. Similar to the above mentioned, in the present manuscript, tensile specimens, wherein the parts with an oxygen deficit were larger than those of the fatigue specimens, denoted a higher percentage of mass loss for both categories of steel reinforcement.
3.3. Results of Tensile Tests
In light of the fact that tensile tests are considered the initial assessment tools to classify different types of materials and, subsequently, steel reinforcement, either in terms of yield strength Rp and ultimate strength Rm or in terms of deformation Ag, current regulations determine the design and analysis of RC structures, based on the determined above mentioned values.
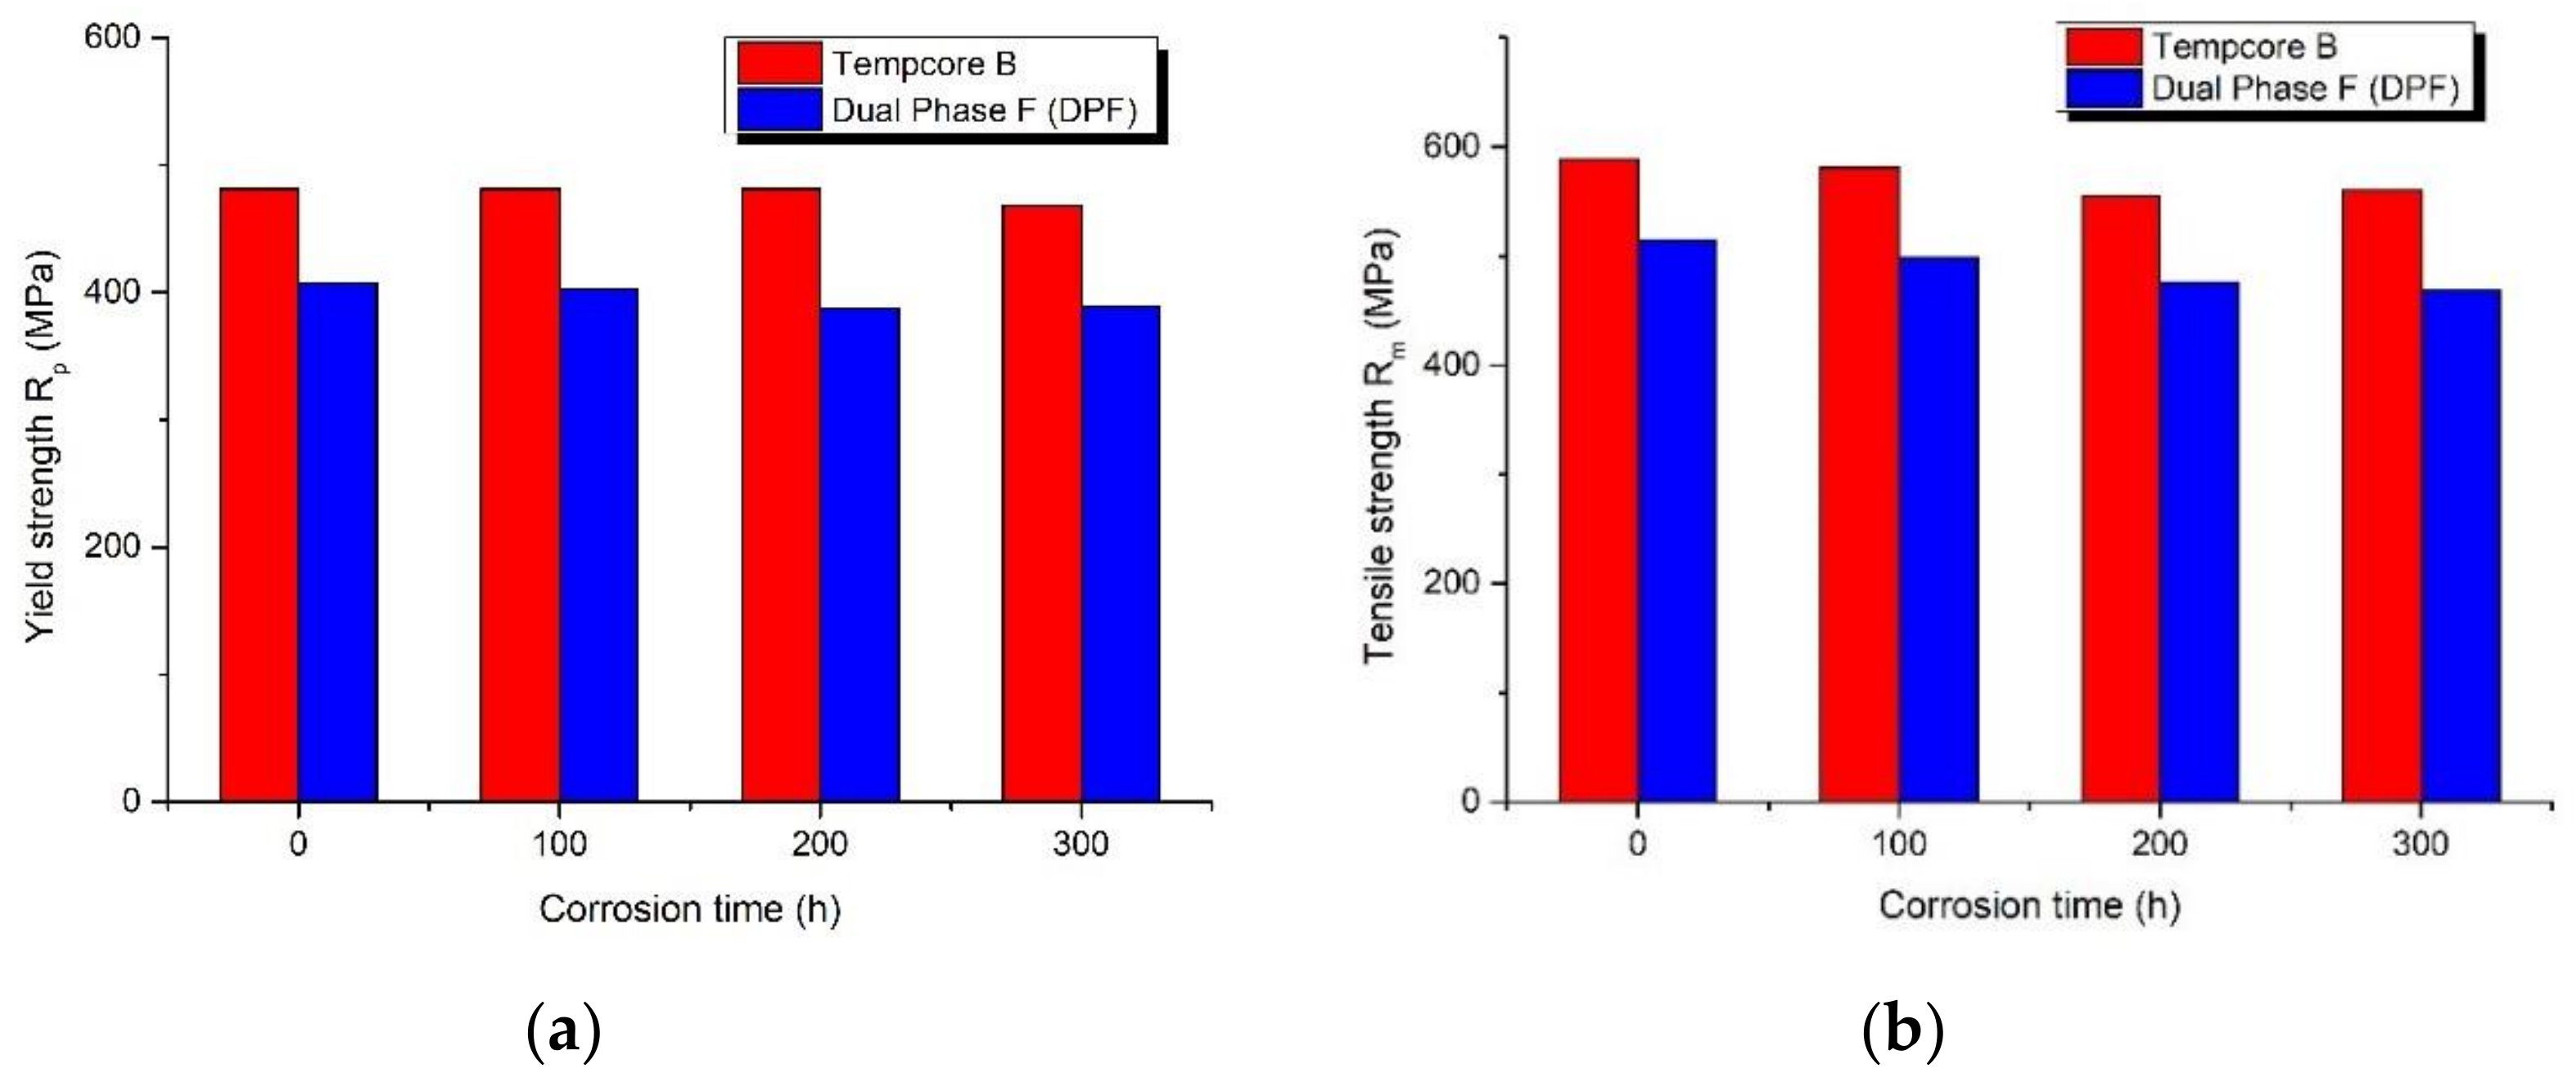
Taking into account the results of the tensile tests (Table 5 and Figure 12 and Figure 13), it was clear that Tempcore steel B and Dual Phase steel F were of different technical classes because the average value of yield strength Rp in non-corroded conditions was 481 MPa for Tempcore steel B and 407 MPa for Dual Phase F, respectively. Similarly, the ultimate strength Rm was in line with the yield strength, as Tempcore steel B demonstrated a value of 589 MPa and Dual Phase F a value of 515 MPa, respectively. In terms of ductility, Tempcore steel B showed deformation equal to 14.85% and Dual Phase F equal to 14.17%, whereas energy density Ud was 81.89 MPa and 70.37 MPa for Tempcore steel B and Dual Phase steel F in non-corroded conditions. Yet, both types of steel displayed a slight reduction of 10%, in terms of strength, for corresponding mass losses equal to 5.81% and 8.19%, in 300-h corroded conditions, as reflected in Figure 12. Similarly, Tempcore steel B demonstrated a decrease of about 60%, both for deformation and energy density, compared to Dual Phase steel F, which showed a drop of 75% for both the above mentioned values in 300-h corroded conditions.
In regard to ductility, in terms of plastic deformation Ag corresponding to maximum force, Tempcore steel B reported 14.85% and Dual Phase F 14.17%, whereas the corresponding energy density was equal to 81.89 MPa and 70.37 MPa, respectively, in non-corroded conditions. However, in 300-h corroded conditions, both types of steel displayed a rapid drop, equal to 61% for Tempcore steel B, with corresponding mass loss 5.81%, and 72% for Dual Phase F, with corresponding mass loss 8.19%, which was significant to the reduction of the ductility capacity of steel to elongate beyond its elastic limit, as reflected in Figure 13. The above mentioned outcomes were in good agreement with other experimental studies, which had indicated the significant impact of corrosion on the ductility properties of steel bars, contrary to the reduction in bearing capacity, in terms of strength, wherein the drop was broadly in line with the recorded percentage mass loss [7,8,9,12,13].
To conclude, an initial assessment of monotonic behavior displayed that even though Tempcore steel B was of a greater technical class than Dual Phase steel F, both types of steel reinforcement reported similar levels of reduction in their mechanical properties in corroded conditions. The greater mechanical performance of steel B was deemed to be due to the distinct, well-formed phase of martensite in the outer layer of the cross section, which was responsible for the bearing capacity of the material, especially in the case of low levels of loading rates in tensile tests. However, the influence of corrosion on the ductility properties of the tested specimens raised issues regarding their corrosion resistance. For this purpose, it appears necessary to investigate the microstructure of both types of steel reinforcement and further study the degree of influence of corrosion on dynamic loading (on higher strain).
3.4. Results of Fatigue Tests
The damage of materials due to fatigue is directly linked with their microstructure because the development and propagation of microcracks toward the inner part of the material is crucial for mechanical performance. In this framework, a complementary study by means of load-bearing capacity and ability for energy absorption was established to assess the impact of loading history on the mechanical performance of steel reinforcement; thus, low-cycle fatigue tests were conducted to simulate the consequences of seismic loadings on steel rebars, as already indicated by several studies [25,37]. The results are demonstrated in Table 6 and Table 7 for each tested specimen, along with the corresponding mass loss.
Moreover, the mean values of the above results for each class of steel reinforcement are summarized in Table 8 and Table 9 for all corrosion exposure times and for each imposed strain amplitude. The total cycles to failure Nf, the total fatigue energy density Wd, and the recorded maximum stress of the ascending branch σmax are presented. The normalized fatigue energy density and the normalized maximum stress, compared to the non-corroded conditions, were also calculated, in order to directly compare both steel types, which were of different technical classes.
Contrary to what has already been demonstrated from monotonic pseudo-static loading, the diagrams, which follow in Figure 14, depict the degradation in bearing capacity of each class of reinforcement, in terms of maximum stress, owing to the loading history of the materials.
In particular, it can be easily observed that the fatigue damage accumulation reduced the recorded maximum stress corresponding to the ascending branch of each fatigue loop of both steel grades Tempcore B and Dual Phase F and limited their service life. In addition to the decrease in bearing capacity due to strain loading history, corrosion was identified as a considerable factor in the reduction of the service lifetime because it reduced the number of cycles to failure. However, there were differences in the damage accumulation of the two materials (B and F) in corroded specimens, which were due to their microstructures. As shown by the curves of Figure 14, the degradation of the maximum stress in fatigue tests with a strain amplitude of ±2.5% indicated that corroded Tempcore B deviated from its non-corroded conditions, contrary to the corresponding behavior of Dual Phase F. More specifically, for similar mass loss, although the range of maximum stress difference Δσmax of Tempcore B was narrower than that of Dual Phase F (125 MPa against 166 MPa), the values of cycles to failure for each class differed between non-corroded and corroded conditions. More precisely, ΔΝ equal to 25 cycles stood for Tempcore B and ΔΝ equal to 12 cycles stood for Dual Phase F. Moreover, since the average value of yield strength Rp in non-corroded conditions was 481 MPa for Tempcore steel B and 407 MPa for Dual Phase F, the recorded maximum stress in corroded conditions corresponded to 84% and 81% of yield strength Rp, respectively. These divergences between the two types of steel grades raised issues of the capacity of corroded steel reinforcement in dynamic loadings of Tempcore B compared to Dual Phase F.
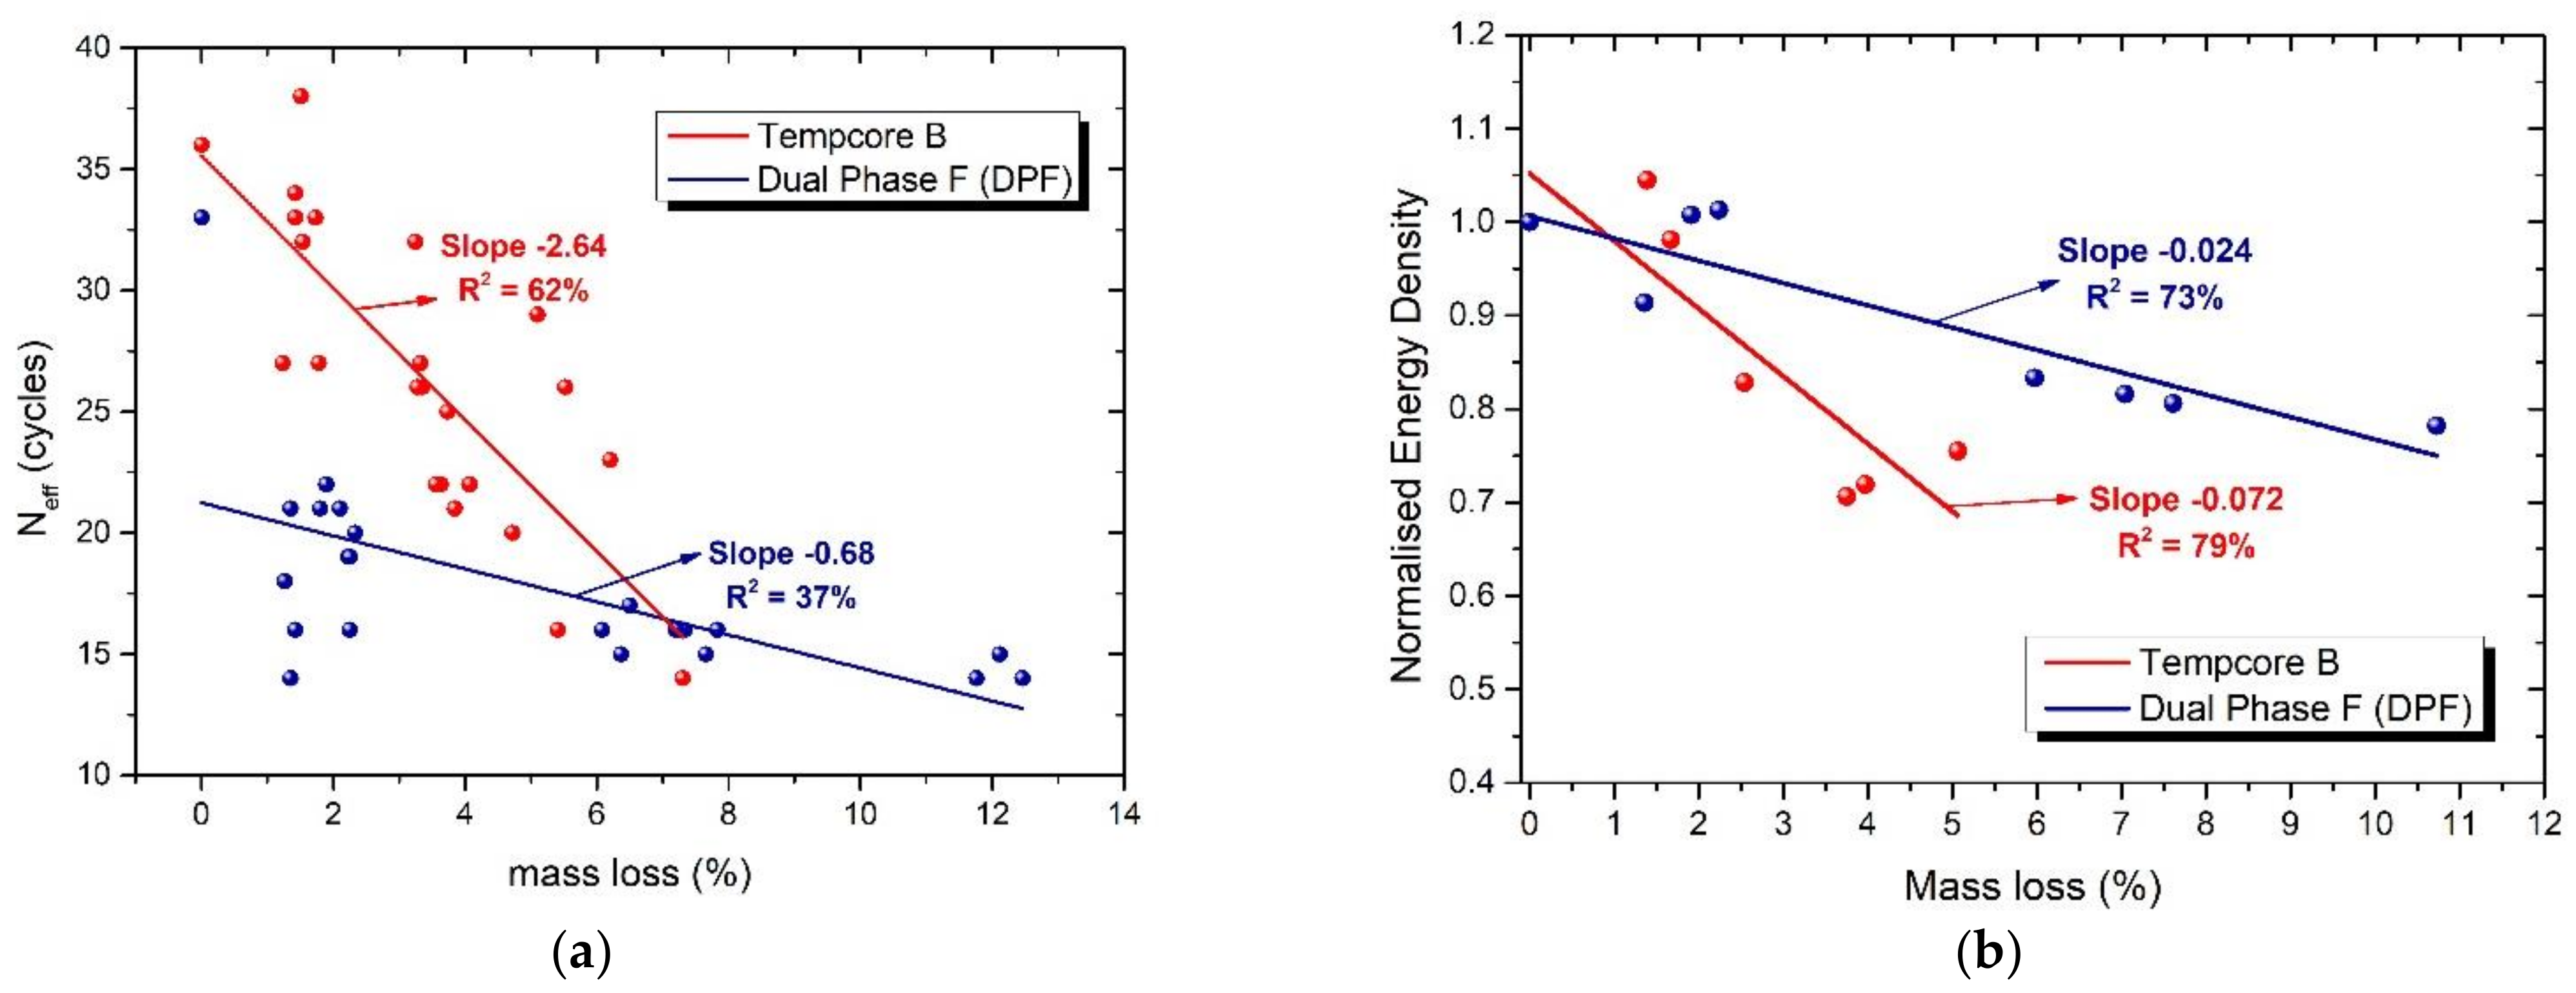
At this point, it is worth mentioning that Tempcore steel B, mainly used in RC structures in compliance with design rules, is expected to carry a constant load throughout its service life because the imposed loadings of elements remain fairly constant over time. However, the coupled effects of fatigue and corrosion damage reduce the bearing capacity of steel reinforcement. Hence, in the light of evaluating the performance of both steel categories, a lower limit of 80 percent of the maximum load of non-corroded steel bar was defined as an acceptable threshold, which stood for the ability of the material to safely carry the developed stresses. The beneficial number of cycles Neff was then calculated up to this threshold so as to estimate the beneficial service life of the material [21,56]. Herein, Figure 15a illustrates the reduction of beneficial number of cycles Neff vs. percentage mass loss for ±2.5% strain amplitude, where Tempcore steel B showed a sharper drop in beneficial service life than Dual Phase steel F, raising issues of the performance of Tempcore steel B in terms of its ductility properties. In particular, Tempcore steel B recorded a sharp decrease, from 36 to 14 cycles, for a corresponding percentage mass loss of 5.94%, whereas Dual Phase steel F demonstrated a milder reduction, from 33 to 14 cycles, for a corresponding percentage mass loss of 12.11%, respectively.
Taking into account that the reduction of service life was higher in the case of Tempcore steel B than that of Dual Phase steel F for similar percentage mass loss, a comparison was conducted in terms of normalized energy density. A linear regression analysis was performed for both steel types so as to extract the degradation rate of the beneficial number of cycles Neff and energy supplies due to corrosion, based on the following equation:
where η accounts for the percentage mass loss. The outcomes of regression analyses are summarized in Table 10, along with the value of parameters a and b and the corresponding values of the R2 coefficient.
As reflected by the slopes of the fitting curves in Figure 15b, Dual Phase steel F preserved its capacity to absorb energy as opposed Tempcore steel B, even with considerable levels of corrosion damage.
3.5. Proposed Fatigue Index
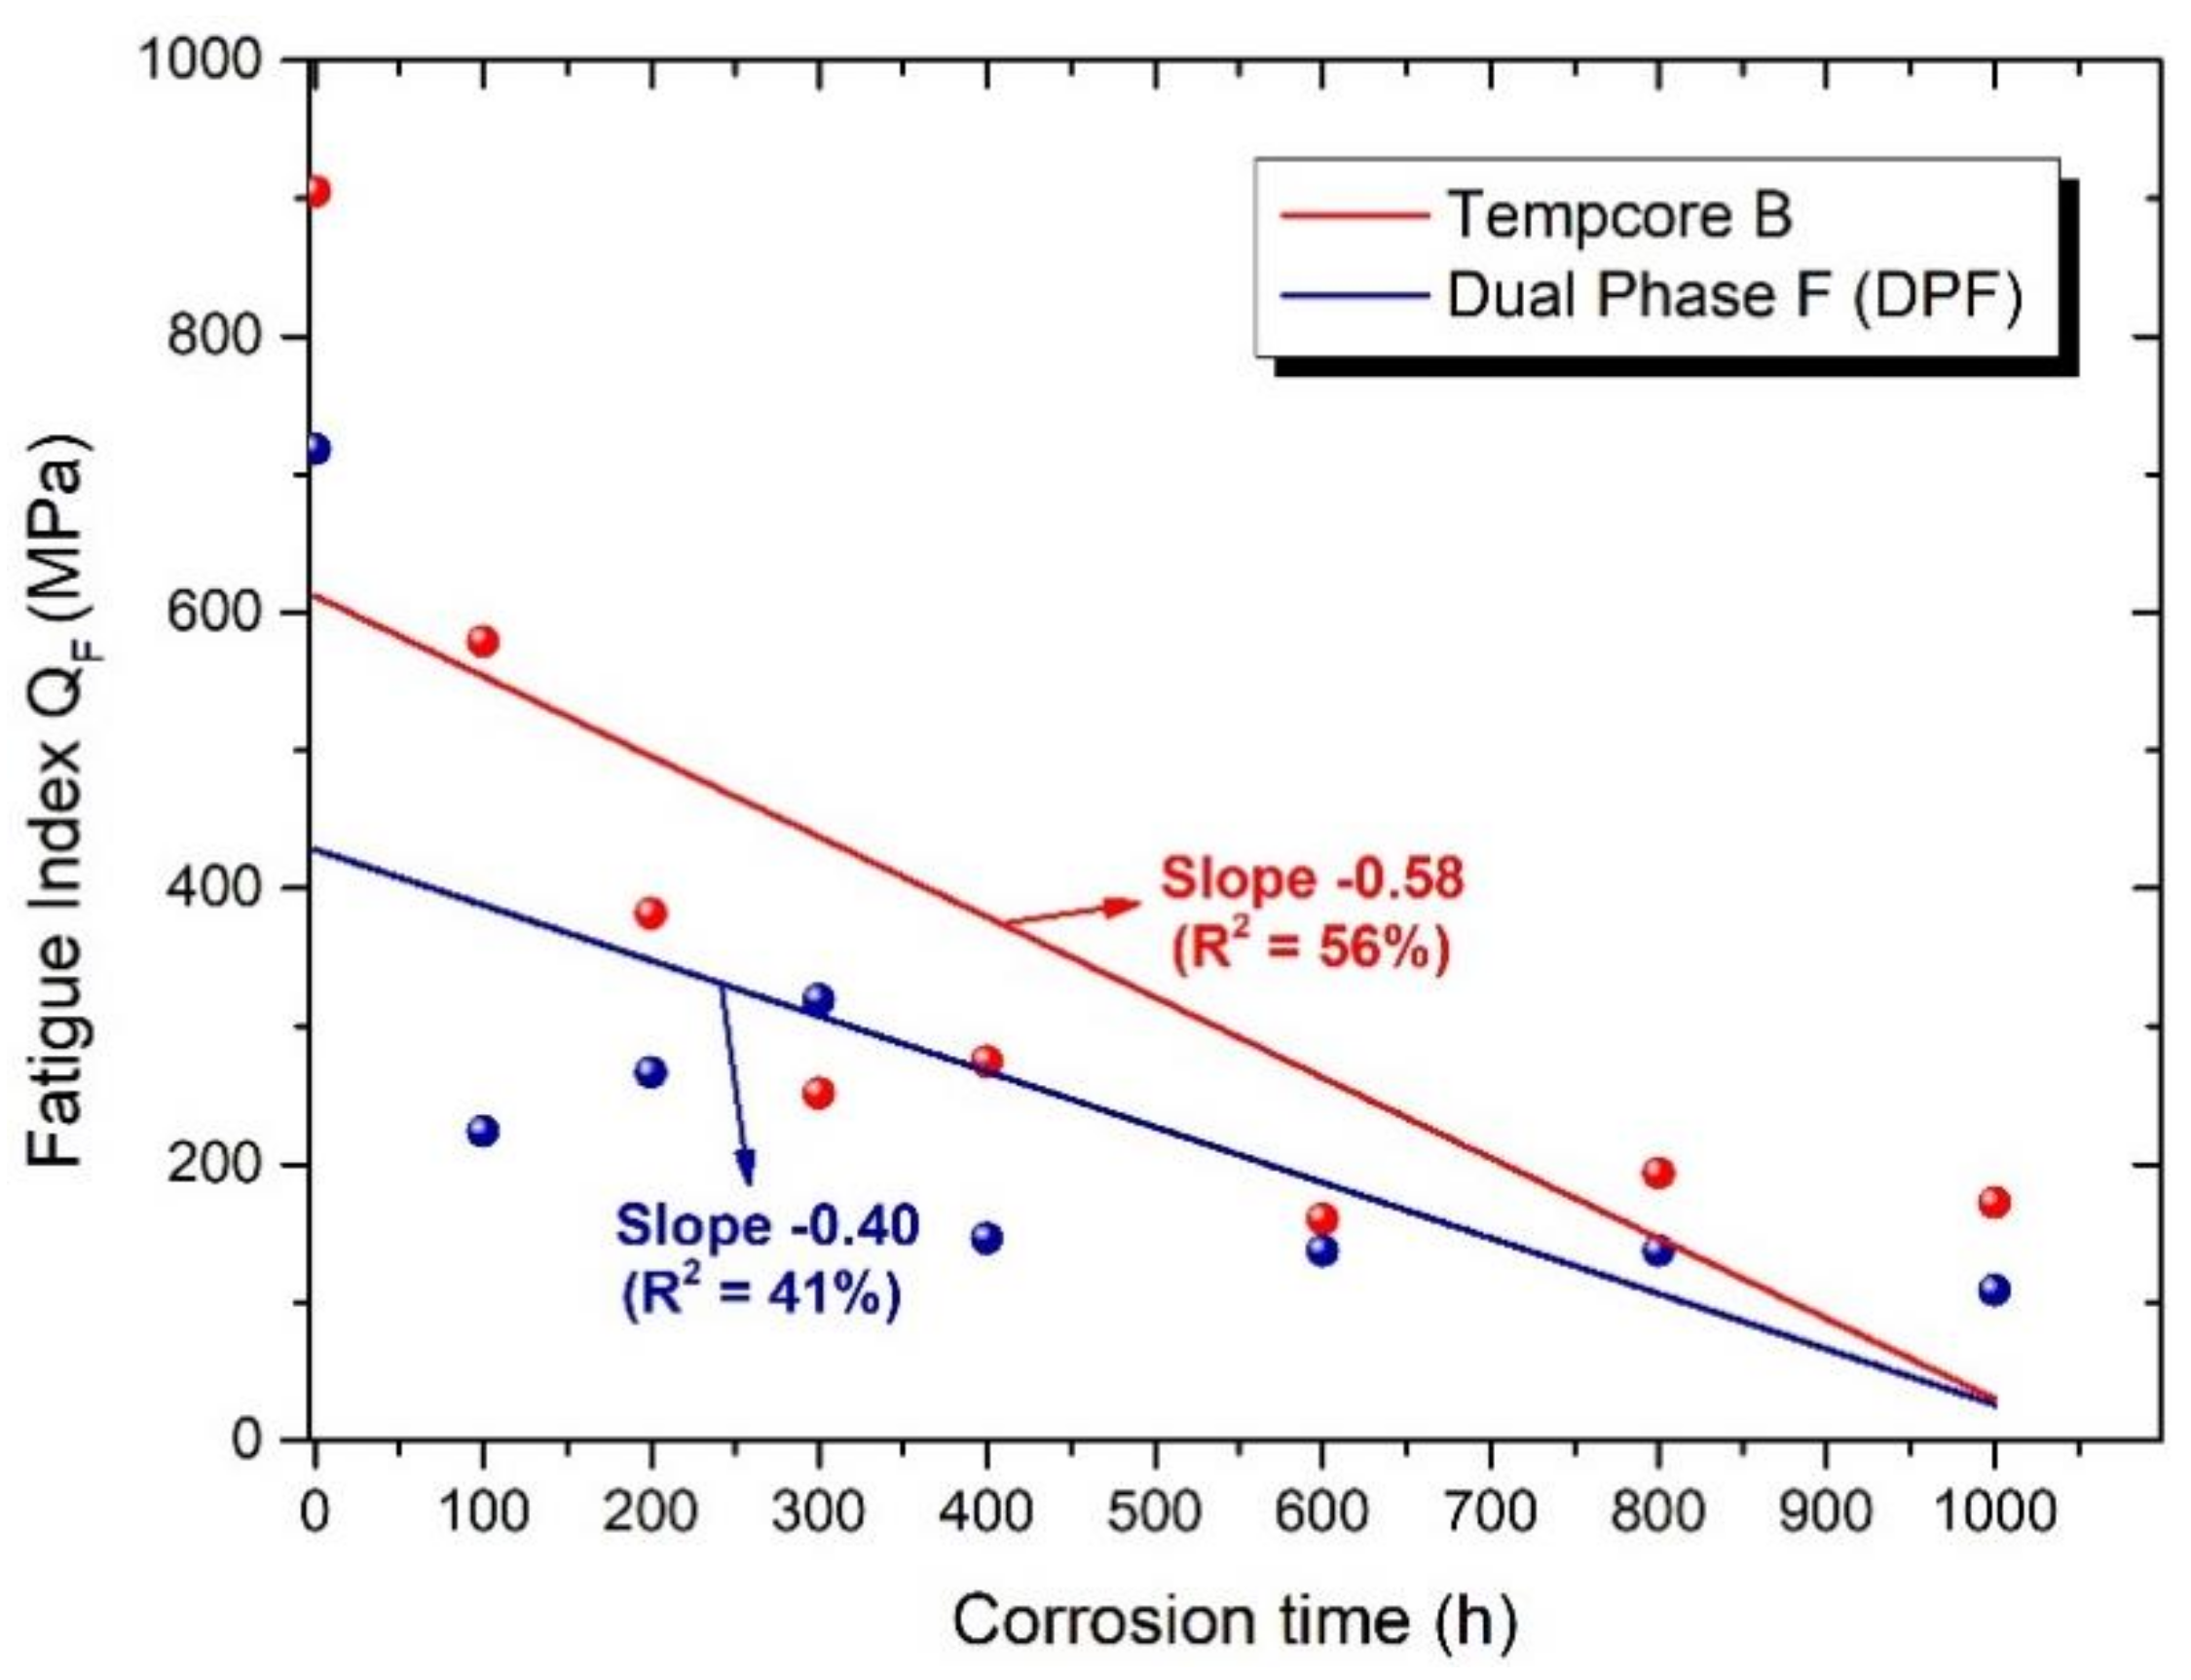
The purpose of introducing a dynamic performance index, namely the fatigue damage indicator, QF, was to evaluate and compare the fatigue response of different materials when corrosion damage was involved. Based on the above mentioned in Section 2.4, a linear regression analysis was conducted to the derived values of the fatigue damage index of both steel types. Moreover, the values of the R2 coefficient are presented in Figure 16, wherein the fitting curves were exported so as to depict the favorable trend of hybrid Dual Phase steel F vs. Tempcore steel B in a corrosive environment in long terms, with the derived equations as presented below:
where c accounts for the corrosion time. The outcomes of regression analyses for each type of steel reinforcement are summarized in Table 11, along with the values of parameters a and b and the corresponding values of the R2 coefficient.
With regard to the obtained quality evaluation, as depicted in Figure 16, both indexes showed similar trends because when increasing the corrosion exposure time, the mechanical response, and subsequently, the life expectancy of the material, was steadily decreased for both types of steel. It can be also noted that even though Dual Phase steel F demonstrated lower levels of bearing capacity in reference conditions than Tempcore steel B, nevertheless, under corroded conditions, in the case of ±2.5% imposed deformation, it sustained its mechanical properties and the ability to carry out repeated loading. The quality assessment of the tested reinforcing steel bars via the proposed fatigue damage index, taking into account both strength and ductility properties, indicated the better mechanical performance of Dual Phase steel F vs. Tempcore B in long terms. The differences in the microstructure of the materials were deemed to be crucial for the overall fatigue response and corrosion resistance. In continuance, the interactive morphology of the martensite and the ferrite phases in the entire microstructure of steel F were directly linked with the delayed propagation of fatigue damage, leading to the overall improved mechanical performance of Dual phase steel F vs. Tempcore steel B.
4. Conclusions
In the current manuscript, the impacts of the combined effects of fatigue and corrosion damage on two different classes of reinforcing steel regarding their mechanical responses and vulnerability to corrosive environments were studied within the frame of an ongoing extensive experimental program. In addition, based on an existing static index, a dynamic fatigue index was proposed in order to evaluate the mechanical performance in long terms of materials. The following remarks can be drawn:
- Upon the completion of the corrosion time for both groups of specimens—tensile and fatigue—Dual Phase steel F recorded generally higher values of percentage mass loss than Tempcore steel B.
- In addition to the exposed-to-corrosion length, the total length of tested specimens influenced the corrosion rate during the accelerated corrosion tests. The diversity of results was affected by differential aeration corrosion, wherein different parts of each specimen were exposed to different concentration of oxygen.
- In both steel categories, a slight mechanical degradation was recorded due to corrosion in terms of yield and tensile strength, while ductility and dissipated energy were dramatically diminished.
- Examining the seismic loadings of both steel categories under LCF tests, it was clear that the loading history degraded the mechanical performance because fatigue damage accumulation reduced the recorded maximum stress and the service life for both steel categories. However, for similar mass loss, although the range of maximum stress difference Δσmax of Tempcore steel B was narrower than that of Dual Phase steel F, Dual Phase steel F seemed to have greater service life in corroded conditions.
- A new fatigue damage index QF for steel reinforcement was introduced in the present manuscript to evaluate the overall mechanical performance of metallic materials, taking into account both strength capacity and ductility. The proposed fatigue index can be utilized also to assess material performance in long terms.
- On the basis of this index, both types of steel reinforcement were compared: Tempcore B, which is already extensively used in RC structures, and a new hybrid steel, namely Dual Phase F, which has been produced with lower mechanical performance (mechanical properties such as Rp, Rm, and Ag) with respect to traditional Tempcore B. The outcomes obtained by the fatigue index were in good agreement with the experimental results, wherein Dual Phase steel F was deemed to have more credible fatigue performance in long terms.
- Considering the significant impact of the environmental corrosion effect, the need for preventing the degradation of the mechanical properties in steel reinforcement should be a matter of priority for further investigation because the hybrid Dual Phase F is rather promising regarding its service life, despite the fact that in reference conditions, it is of a lower class.
Author Contributions
Methodology, M.B, C.A., M.B. performed the preparation of specimens and the experimental procedure; investigation, M.B., C.A.; writing—original draft preparation, M.B.; writing—review and editing, C.A.; supervision, C.A. All authors have read and agreed to the published version of the manuscript.
Funding
This research received no external funding.
Informed Consent Statement
Not applicable.
Acknowledgments
The present research was developed in the framework of the European Research project NEWREBAR “New Dual-Phase steel reinforcing bars for enhancing capacity and durability of anti-seismic moment resisting frames” (2015–2019), funded by the Research Fund for Coal and Steel (RFSR-CT-2015-00023) of the European Commission. The authors duly acknowledge all the partners for their active contribution.
Conflicts of Interest
The authors declare no conflict of interest.
References
- Hou, B.; Li, X.; Ma, X.; Du, C.; Zhang, D.; Zheng, M.; Xu, W.; Lu, D.; Ma, F. The cost of corrosion in China. Mater. Degrad. 2017, 1, 1–10. [Google Scholar] [CrossRef]
- Koch, G.; Varney, J.; Thompson, N.; Moghissi, O.; Gould, M.; Payer, J. International Measures of Prevention, Application, and Economics of Corrosion Technologies Study; NACE International: Houston, TX, USA, 2016. [Google Scholar]
- Marcus, P. Pour un monde durable: Journée mondiale de la corrosion, 24 April 2020. Matér. Tech. 2020, 108, N1. [Google Scholar]
- CEN—European Comittee for Standardization. EN 1998-1:2005, Eurocode 8: Design of Structures for Earthquake Resistance—Part 1: General Rules, Seismic Actions and Rules for Buildings; CEN—European Comittee for Standardization: Brussels, Belgium, 2005. [Google Scholar]
- Comite Europeen de Normalisation (CEN). N-1992-1-1, Eurocode 2–Design of Concrete Structures. Part 1–1: General Rules and Rules for Buildings; Comite Europeen de Normalisation (CEN): Brussels, Belgium, 2008. [Google Scholar]
- Federal Emergency Management Agency. FEMA 356, “Pre-Standard and Commentary for the Seismic Rehabilitation of Buildings”; Federal Emergency Management Agency: Washington, DC, USA, 2008.
- Apostolopoulos, C.A.; Michalopoulos, D. Effect of corrosion on mass loss, and high and low cycle fatigue of reinforcing steel. J. Mater. Eng. Perform. 2006, 15, 742–749. [Google Scholar] [CrossRef]
- Caprili, S.; Moersch, J.; Salvatore, W. Mechanical Performance vs. Corrosion Damage Indicators for corroded steel reinforcing bars. Adv. Mater. Sci. Eng. 2015, 1–19. [Google Scholar] [CrossRef] [Green Version]
- Imperatore, S.; Rinaldi, Z.; Drago, C. Degradation relationships for the mechanical properties of corroded steel rebars. Constr. Build. Mater. 2017, 148, 219–230. [Google Scholar] [CrossRef]
- Darwin, D.; Kahrs, J.T.; Locke, C.E., Jr. Evaluation of Corrosion Resistance of Type 304 Stainless Steel Clad Reinforcing Bars; SM Report No. 65; The University of Kansas Center for Research, Inc.: Lawrence, KS, USA, 2001; 76p. [Google Scholar]
- Apostolopoulos, C.A. The influence of Corrosion and Cross- Section Diameter on the Mechanical Properties of B500c Steel. J. Mater. Eng. Perform. 2008, 18, 190–195. [Google Scholar] [CrossRef]
- Apostolopoulos, C.A. Mechanical behavior of corroded reinforcing steel bars S500s tempcore under low cycle fatigue. Constr. Build. Mater. 2007, 21, 1447–1456. [Google Scholar] [CrossRef]
- Apostolopoulos, C.A.; Papadakis, V.G. Consequences of steel corrosion on the ductility properties of reinforcement bar. Constr. Build. Mater. 2008, 22, 2316–2324. [Google Scholar] [CrossRef]
- Salvatore, W.; Caprili, S.; Braconi, A.; Finetto, M.; Bianco, L.; Ascanio, C.; Moersch, J.; Apostolopoulos, C.A.; Ferreira Pimenta, G. Effects of Corrosion on Low-Cycle Fatigue (Seismic) Behaviour of High-Strength Steel Reinforcing Bars (RUSTEEL)—RFSR-CT-2009-00023—Technical Steel Research Series EUR 26687; European Commission—Directorate General for Research: Brussels, Belgium, 2014. [Google Scholar]
- Caprili, S.; Salvatore, W. Cyclic behaviour of uncorroded and corroded steel reinforcing bars. Constr. Build. Mater. 2015, 76, 168–186. [Google Scholar] [CrossRef]
- Kashani, M.M.; Lowes, L.N.; Crewe, A.J.; Alexander, N.A. Finite element investigation of the influence of corrosion pattern on inelastic buckling and cyclic response of corroded reinforcing bars. Eng. Struct. 2014, 75, 113–125. [Google Scholar] [CrossRef]
- Zhang, W.; Song, X.; Gu, X.; Li, S. Tensile and fatigue behavior of corroded rebars. Constr. Build. Mater. 2012, 34, 409–417. [Google Scholar] [CrossRef]
- Andisheh, K.; Scott, A.; Palermo, A.; Clucas, D. Influence of chloride corrosion on the effective mechanical properties of steel reinforcement. Struct. Infrastruct. Eng. 2019, 15, 1036–1048. [Google Scholar] [CrossRef]
- Meda, A.; Mostosi, S.; Rinaldi, Z.; Riva, P. Experimental evaluation of the corrosion influence on the cyclic behaviour of RC columns. Eng. Struct. 2014, 76, 112–123. [Google Scholar] [CrossRef]
- Rajput, A.S.; Sharma, U.K. Corroded reinforced concrete columns under simulated seismic loading. Eng. Struct. 2018, 171, 453–463. [Google Scholar] [CrossRef]
- Apostolopoulos, C.A.; Drakakaki, A.; Basdeki, M. Seismic assessment of a reinforced concrete column under seismic loads. Int. J. Struct. Integr. 2019, 10, 41–54. [Google Scholar] [CrossRef]
- Guo, A.X.; Li, H.T.; Ba, X.; Guan, X.C.; Li, H. Experimental investigation on the cyclic performance of reinforced concrete piers with chloride-induced corrosion in marine environment. Eng. Struct. 2015, 105, 1–11. [Google Scholar] [CrossRef]
- Angst, U.M.; Elsener, B. The size effect in corrosion greatly influences the predicted life span of concrete infrastructures. Sci. Adv. 2017, 3, e1700751. [Google Scholar] [CrossRef] [Green Version]
- Pitilakis, K.D.; Karapetrou, S.T.; Fotopoulou, S.D. Consideration of aging and SSI effects on seismic vulnerability assessment of RC buildings. Bull. Earthq. Eng. 2014, 12, 1755–1776. [Google Scholar] [CrossRef]
- Sheng, G.M.; Gong, S.H. Investigation of low cycle fatigue behavior of building structural steels under earthquake loading. Acta Metall. Sin. Engl. Lett. 1997, 10, 51–55. [Google Scholar]
- Mander, J.B.; Panthaki, F.D.; Kasalanati, A. Low cycle fatigue behavior of reinforcing steel. J. Mater. Civil Eng. 1994, 6, 453–468. [Google Scholar] [CrossRef]
- Brown, J.; Kunnath, S.K. Low cycle fatigue failure of reinforcing steel bars. ACI Mater. J. 2004, 101, 457–466. [Google Scholar]
- Hawileh, R.A.; Abdalla, J.A.; Oudah, F.; Abdelrahman, K. Low-cycle fatigue life behaviour of BS 460B and BS B500B steel reinforcing bars. Fatigue Fract. Eng. Mater. Struct. 2010, 33, 397–407. [Google Scholar] [CrossRef]
- Apostolopoulos, C.A.; Rodopoulos, C.A. Inelastic cyclic behavior of as-received and pre-corroded S500s Tempcore steel reinforcement. Int. J. Struct. Integr. 2010, 1, 52–62. [Google Scholar] [CrossRef]
- Kashani, M.; Barmi, A.K.; Malinova, V.S. Influence of inelastic buckling on low-cycle fatigue degradation of reinforcing bars. Constr. Build. Mater. 2015, 94, 644–655. [Google Scholar] [CrossRef] [Green Version]
- Abdalla, J.A.; Hawileh, R.A.; Oudah, F.; Abdelrahman, K. Energy-based prediction of low-cycle fatigue life of BS 460B and BS B500B steel bars. Mater. Des. 2009, 30, 4405–4413. [Google Scholar] [CrossRef]
- Chang, G.A.; Mander, J.B. Seismic Energy Based Fatigue Damage Analysis of Bridge Columns: Part I—Evaluation of Seismic Capacity; Technical report NCEER 94-0006; National Center for Earthquake Engineering Research: Buffalo, NY, USA, 1994. [Google Scholar]
- Dolley, E.J.; Lee, B.; Wei, R.P. The effect of pitting corrosion on fatigue life. Fatigue Fract. Eng. Mater. Struct. 2000, 23, 555–560. [Google Scholar] [CrossRef]
- Veerman, R.; van Breugel, K.; Koenders, E. Effect of Corrosion on the Fatigue Service-Life on Steel and Reinforced Concrete Beam. In Proceedings of the fib Symposium, Copenhagen, Denmark, 18–20 May 2015. [Google Scholar]
- Fernandez, I.; Bairán, J.M.; Marí, A.R. Corrosion effects on the mechanical properties of reinforcing steel bars. Fatigue and r–e behavior. Constr. Build. Mater. 2015, 101, 772–783. [Google Scholar] [CrossRef]
- Yi, W.; Kunnath, S.K.; Sun, X.; Shi, C.; Tang, F. Fatigue Behavior of Reinforced Concrete Beams with Corroded Steel Reinforcement. ACI Struct. J. 2011, 107, 526–533. [Google Scholar]
- Apostolopoulos, C.A.; Konstantopoulos, G.; Koulouris, K. Seismic resistance prediction of corroded S400 (BSt420) reinforcing bars. Int. J. Struct. Integr. 2018, 9, 119–138. [Google Scholar] [CrossRef]
- Kelestemur, O.; Yıldız, S. Effect of various dual-phase heat treatments on the corrosion behavior of reinforcing steel used in the reinforced concrete structures. Constr. Build. Mater. 2009, 23, 78–84. [Google Scholar] [CrossRef] [Green Version]
- Apostolopoulos, C.A.; Drakakaki, A.; Apostolopoulos, A.; Matikas, T.; Rudskoi, A.I.; Kodzhaspirov, G. Characteristic defects-Corrosion Damage and Mechanical Behavior of Dual phase rebar. Mater. Phys. Mech. 2017, 30, 1–19. [Google Scholar]
- Apostolopoulos, A.; Drakakaki, A.; Konstantopoulos, G.; Matikas, T. Mapping sulfides and strength properties of BSt 420 and B500c Steel Bars before and after corrosion. Унив. научный ж. 2015, 15, 22–32. [Google Scholar]
- Apostolopoulos, C.A.; Diamantogiannis, G.; Apostolopoulos, A. Assessment of the mechanical behavior in dual phase steel B400c, B450c and B500b in marine environment. J. Mater. Civ. Eng. 2016, 28, 04015097. [Google Scholar] [CrossRef]
- Apostolopoulos, C.A.; Demis, S.; Papadakis, V.G. Chloride-induced corrosion of steel reinforcement—Mechanical performance and pit depth analysis. Constr. Build. Mater. 2013, 38, 139–146. [Google Scholar] [CrossRef]
- Trejo, D.; Monteiro, P.; Thomas, G.; Wang, X. Mechanical properties and corrosion susceptibility of dual-phase steel in concrete. Cem. Concr. Res. 1994, 24, 1245–1254. [Google Scholar] [CrossRef]
- Sarkar, P.P.; Kumar, P.; Manas Kumar Manna, P.C.; Chakraborti, P.C. Microstructural influence on the electrochemical corrosion behaviour of dual-phase steels in 3.5% NaCl solution. Mater. Lett. 2005, 59, 2488–2491. [Google Scholar] [CrossRef]
- Caprili, S.; Salvatore, W.; Valentini, R.; Cristiano Ascanio, C.; Luvarà, G. A new generation of high-ductile Dual-Phase steel reinforcing bars. Constr. Build. Mater. 2018, 179, 66–79. [Google Scholar] [CrossRef]
- ISO. ISO 15630-1:2010, Steel for the Reinforcement and Prestressing of Concrete—Test Methods—Part 1: Reinforcing Bars, Wire Rod and Wire; ISO: Geneva, Switzerland, 2010. [Google Scholar]
- BSI (British Standards Institution). Concrete. Part 1: Specification, Performance, Production and Conformity; EN 206-1; BSI: London, UK, 2000. [Google Scholar]
- Apostolopoulos, C.A.; Koulouris, K.; Basdeki, M. Damage Parameters of Rebars in Marine Environment and Fatigue Life. In Proceedings of the International Conference on Sustainable Materials, Systems and Structures (SMSS 2019), Rovinj, Croatia, 20–22 March 2019. [Google Scholar]
- ASTM International. ASTM G1-03, Standard Practice for Preparing, Cleaning, and Evaluating Corrosion Test Specimens; ASTM International: West Conshohocken, PA, USA, 2017. [Google Scholar]
- Especificação LNEC Varões de aço. A400 NR de Ductilidade Especial Para Armaduras de Betão Armado Características, Ensaios e Marcação; AO, LNEC E 455-2010. 2010.
- UNE. Norma Espanola Experimental Barras Corrugadas de Acero Soldable con Caracteristıcas Especiales de Ductilidad para Armaduras de Horigon Armado; UNE 36065 EX 2000; UNE: Madrid, Spain, 2000. [Google Scholar]
- Apostolopoulos, C.A.; Pasialis, V.P. Use of quality indices in comparison of corroded technical steel bars B500c and S500s on their mechanical performance basis. Constr. Build. Mater. 2008, 22, 2325–2334. [Google Scholar] [CrossRef]
- Alexopoulos, N.D.; Apostolopoulos, C.A.; Papadopoulos, M.P.; Pantelakis, S.G. Mechanical performance of BStIV grade steel bars with regard to the long-term material degradation due to corrosion damage. Constr. Build. Mater. 2007, 21, 1362–1369. [Google Scholar] [CrossRef]
- Papadopoulos, M.P.; Apostolopoulos, C.A.; Alexopoulos, N.D.; Pantelakis, S.G. Effect of salt spray corrosion exposure on the mechanical performance of different technical class reinforcing steel bars. Mater. Des. 2007, 28, 2318–2328. [Google Scholar] [CrossRef]
- Alexopoulos, N.D.; Pantelakis, S.G. A new quality index for characterizing aluminum cast alloys with regard to aircraft structure design requirements. Metall. Mater. Trans. A 2004, 35, 301–308. [Google Scholar] [CrossRef]
- Yang, S.Y.; Song, X.B.; Jia, H.X.; Chen, X.; Liu, X.L. Experimental research on hysteretic behaviors of corroded reinforced concrete columns with different maximum amounts of corrosion of rebar. Constr. Build. Mater. 2016, 121, 319–327. [Google Scholar] [CrossRef]
- Apostolopoulos, C.A.; Drakakaki, A.; Apostolopoulos, A.; Koulouris, K. Comparison of the mechanical response of B400c and B450c dual phase steel bar categories in long terms. Frat. Integrità Strutt. 2019, 50, 548–559. [Google Scholar] [CrossRef] [Green Version]
- Drakakaki, A.; Apostolopoulos, C.A. The size effect of rebars on the structural integrity of reinforced concrete structures, which are exposed to corrosive environments. MATEC Web Conf. 2018, 188, 03009. [Google Scholar] [CrossRef]
Figure 1.
Global costs of corrosion.

Figure 2.
Discrete phases of martensite (b), bainite (c), and ferrite–pearlite (d) on a cross section of Tempcore B rebar (a).
Figure 2.
Discrete phases of martensite (b), bainite (c), and ferrite–pearlite (d) on a cross section of Tempcore B rebar (a).

Figure 3.
Homogeneous microstructure (b) in a cross section of Dual Phase F rebar (a).

Figure 4.
Procedure of accelerated electro-corrosion: (a) schematic representation and (b) experimental setup.
Figure 4.
Procedure of accelerated electro-corrosion: (a) schematic representation and (b) experimental setup.

Figure 5.
Schematic representations of the exposed-to-corrosion lengths of the specimens.

Figure 6.
Definition of significant values of stress.

Figure 7.
SEM and EDX analyses of a non-corroded sample of Tempcore steel B [57].
Figure 7.
SEM and EDX analyses of a non-corroded sample of Tempcore steel B [57].

Figure 8.
SEM and EDX analyses of non-corroded sample of Dual Phase steel F.

Figure 9.
SEM analysis of 300-h corroded specimens (a,c) Tempcore B and (b,d) Dual Phase F.

Figure 10.
Mass loss vs. corrosion time.

Figure 11.
Schematic presentation of (a) electrical closed circuit for both group of specimens (b) differential aeration corrosion.
Figure 11.
Schematic presentation of (a) electrical closed circuit for both group of specimens (b) differential aeration corrosion.

Figure 12.
(a) Yield strength Rp and (b) tensile strength Rm.

Figure 13.
(a) Uniform deformation and (b) energy density.

Figure 14.
Diagrams of maximum stress σmax toward number of cycles N for ± 2.5% strain controlled for (a) Tempcore Steel B and (b) Dual Phase Steel F (DPF).
Figure 14.
Diagrams of maximum stress σmax toward number of cycles N for ± 2.5% strain controlled for (a) Tempcore Steel B and (b) Dual Phase Steel F (DPF).

Figure 15.
(a) Beneficiary number of cycles Neff and (b) normalized energy density Wd vs. mass loss for both types of steel reinforcement.
Figure 15.
(a) Beneficiary number of cycles Neff and (b) normalized energy density Wd vs. mass loss for both types of steel reinforcement.

Figure 16.
Fatigue damage indicator QF for steel B and steel F at strain amplitudes ±2.5%.


Table 1.
Chemical composition (in %) of steel rebars Tempcore B and Dual Phase F (DPF).
| Steel Type | C | Mn | Si | P | S | Cu | N | Cr | Ni | Mo | Ceq |
|---|---|---|---|---|---|---|---|---|---|---|---|
| Tempcore B | 0.233 | 0.646 | 0.138 | 0.0184 | 0.0422 | 0.371 | 0.0117 | 0.080 | 0.113 | 0.0187 | 0.393 |
| DPF | 0.160 | 0.999 | 0.166 | 0.0303 | 0.0099 | 0.372 | 0.0118 | 0.166 | 0.137 | 0.0303 | 0.400 |
Table 2.
Test matrix for Tempcore B and Dual Phase F (DPF) rebars.
| Corrosion Time | Corrosion Tests | Tensile Tests | Fatigue Tests | ||||
|---|---|---|---|---|---|---|---|
| ±2.5% | ±4.0% | ||||||
| Tempcore B | DPF | Tempcore B | DPF | Tempcore B | DPF | ||
| Reference | 3 | 7 | 5 | 5 | 5 | 5 | |
| 100 h | 24 | 4 | 4 | 4 | 4 | 4 | 4 |
| 200 h | 24 | 4 | 4 | 4 | 4 | 4 | 4 |
| 300 h | 24 | 4 | 4 | 4 | 4 | 4 | 4 |
| 400 h | 12 | 3 | 3 | 3 | 3 | ||
| 600 h | 12 | 3 | 3 | 3 | 3 | ||
| 800 h | 12 | 3 | 3 | 3 | 3 | ||
| 1000 h | 12 | 3 | 3 | 3 | 3 | ||
| Total | 120 | 34 | 116 | ||||
Table 3.
Percentage mass loss vs. corrosion time for tensile specimens (long specimens).
| Corrosion Time (h) | Mass Loss (%) | |
|---|---|---|
| Tempcore Steel B | Dual Phase Steel F (DPF) | |
| 0 | - | - |
| 100 | 2.44 | 2.94 |
| 200 | 4.69 | 7.39 |
| 300 | 5.81 | 8.19 |
Table 4.
Percentage mass loss vs. corrosion time for fatigue specimens (short specimens).
| Corrosion Time (h) | Mass Loss (%) | |
|---|---|---|
| Tempcore Steel B | Dual Phase Steel F (DPF) | |
| 0 | - | - |
| 100 | 1.39 | 1.36 |
| 200 | 1.67 | 1.91 |
| 300 | 2.54 | 2.24 |
| 400 | 3.75 | 5.97 |
| 600 | 3.97 | 7.04 |
| 800 | 5.06 | 7.61 |
| 1000 | 7.44 | 10.73 |
Table 5.
Results of tensile tests on Tempcore B and Dual Phase F (DPF) rebars (non-corroded and corroded conditions).
Table 5.
Results of tensile tests on Tempcore B and Dual Phase F (DPF) rebars (non-corroded and corroded conditions).
| Rebar | Mass Loss (%) | Yield Strength Rp (MPa) | Tensile Strength Rm (MPa) | Rm/Rp | Uniform Deformation Ag (%) | Strain Energy Density Ud (MPa) |
|---|---|---|---|---|---|---|
| B-0-1 | - | 481 | 592 | 1.23 | 12.67 | 69.95 |
| B-0-2 | - | 482 | 589 | 1.22 | 15.87 | 87.71 |
| B-0-3 | - | 479 | 585 | 1.22 | 16.01 | 88.02 |
| B-ave | - | 481 | 589 | 1.22 | 14.85 | 81.89 |
| B-100-1 | 2.40 | 478 | 580 | 1.21 | 9.63 | 51.78 |
| B-100-2 | 2.38 | 482 | 583 | 1.21 | 10.21 | 55.32 |
| B-100-3 | 2.55 | 481 | 579 | 1.20 | 9.45 | 50.49 |
| B-100-ave | 2.44 | 481 | 581 | 1.21 | 9.76 | 52.53 |
| B-200-1 | 4.21 | 482 | 561 | 1.16 | 6.06 | 31.04 |
| B-200-2 | 4.71 | 478 | 543 | 1.14 | 4.92 | 24.80 |
| B-200-3 | 4.88 | 484 | 546 | 1.13 | 4.45 | 22.35 |
| B-200-4 | 4.79 | 485 | 556 | 1.14 | 4.95 | 25.10 |
| B-200-5 | 4.84 | 477 | 567 | 1.19 | 7.16 | 37.44 |
| B-200-ave | 4.69 | 481 | 555 | 1.15 | 5.51 | 28.15 |
| B-300-1 | 5.14 | 463 | 561 | 1.21 | 6.58 | 34.17 |
| B-300-2 | 5.74 | 489 | 564 | 1.15 | 5.53 | 28.17 |
| B-300-3 | 7.03 | 442 | 552 | 1.25 | 5.11 | 26.00 |
| B-300-4 | 5.32 | 477 | 562 | 1.18 | 6.15 | 31.75 |
| B-300-ave | 5.81 | 468 | 560 | 1.19 | 5.84 | 30.02 |
| F-0-1 | - | 417 | 518 | 1.24 | 15.14 | 75.56 |
| F-0-2 | - | 401 | 510 | 1.27 | 11.98 | 58.41 |
| F-0-3 | - | 401 | 514 | 1.28 | 13.95 | 69.49 |
| F-0-4 | - | 404 | 519 | 1.28 | 16.48 | 82.62 |
| F-0-5 | - | 410 | 512 | 1.25 | 13.31 | 65.77 |
| F-0-ave | - | 407 | 515 | 1.26 | 14.17 | 70.37 |
| F-100-1 | 3.25 | 382 | 483 | 1.26 | 7.21 | 33.20 |
| F-100-2 | 3.05 | 409 | 507 | 1.24 | 8.56 | 41.43 |
| F-100-3 | 3.02 | 413 | 503 | 1.22 | 7.38 | 35.10 |
| F-100-4 | 2.45 | 406 | 504 | 1.24 | 7.56 | 34.13 |
| F-100-ave | 2.94 | 403 | 499 | 1.24 | 7.68 | 36.00 |
| F-200-1 | 6.73 | 388 | 481 | 1.24 | 4.98 | 22.81 |
| F-200-2 | 7.23 | 389 | 483 | 1.24 | 5.56 | 25.46 |
| F-200-3 | 7.61 | 381 | 463 | 1.22 | 4.41 | 19.47 |
| F-200-4 | 7.97 | 394 | 475 | 1.21 | 4.11 | 18.52 |
| F-200-ave | 7.39 | 388 | 476 | 1.23 | 4.77 | 21.57 |
| F-300-1 | 8.49 | 397 | 471 | 1.19 | 3.97 | 17.14 |
| F-300-2 | 7.97 | 386 | 468 | 1.21 | 3.73 | 16.71 |
| F-300-3 | 8.11 | 384 | 467 | 1.22 | 4.22 | 18.58 |
| F-300-ave | 8.19 | 389 | 469 | 1.21 | 3.97 | 17.48 |
Table 6.
Results of LCF tests with free length 6Ø conducted on steel Dual Phase F (DPF).
| Rebar | Mass Loss (%) | Strain | Cycles (N) | Energy Density Wd (MPa) | σmax (MPa) | σmin (MPa) |
|---|---|---|---|---|---|---|
| F-0-1 | - | ±2.5% | 43 | 856.5 | 486.6 | −483.9 |
| F-0-2 | - | 42 | 860.2 | 489.7 | −489.7 | |
| F-0-3 | - | 39 | 817.3 | 489.7 | −489.7 | |
| F-0-4 | - | ±4.0% | 13 | 479.41 | 504.2 | −483.9 |
| F-0-5 | - | 16 | 583.2 | 515.6 | −489.7 | |
| F-0-6 | - | 16 | 556.3 | 518.7 | −507.2 | |
| F-100-1 | 1.42 | ±2.5% | 28 | 628.66 | 465.45 | −437.38 |
| F-100-2 | 1.35 | 29 | 588.51 | 462.48 | −434.71 | |
| F-100-3 | 1.26 | 29 | 600.39 | 478.24 | −446.07 | |
| F-100-4 | 1.35 | 32 | 669.33 | 484.30 | −461.81 | |
| F-100-5 | 1.40 | ±4.0% | 12 | 455.27 | 522.55 | −479.84 |
| F-100-6 | 1.41 | 15 | 431.78 | 516.32 | −464.91 | |
| F-200-1 | 2.10 | ±2.5% | 31 | 664.19 | 494.68 | −469.79 |
| F-200-2 | 1.80 | 31 | 657.14 | 491.12 | −465.32 | |
| F-200-3 | 1.90 | 28 | 625.95 | 492.83 | −475.45 | |
| F-200-4 | 1.89 | 31 | 682.87 | 491.75 | −466.22 | |
| F-300-1 | 1.89 | ±2.5% | 39 | 658.85 | 483.38 | −461.40 |
| F-300-2 | 1.98 | 31 | 656.48 | 483.20 | −469.15 | |
| F-300-3 | 1.88 | 32 | 671.81 | 475.07 | −453.98 | |
| F-300-4 | 1.92 | 30 | 635.40 | 467.90 | −439.37 | |
| F-300-5 | 2.06 | ±4.0% | 13 | 459.54 | 513.46 | −468.67 |
| F-300-6 | 2.11 | 13 | 426.29 | 511.49 | −464.52 | |
| F-300-7 | 2.13 | 13 | 437.41 | 511.36 | −457.83 | |
| F-300-8 | 2.12 | 12 | 433.95 | 512.93 | −469.98 | |
| F-400-1 | 6.34 | ±2.5% | 25 | 510.63 | 459.97 | −435.15 |
| F-400-2 | 6.08 | 29 | 580.72 | 464.33 | −444.15 | |
| F-400-3 | 6.50 | 25 | 539.96 | 461.89 | −444.48 | |
| F-400-4 | 5.60 | ±4.0% | 12 | 413.17 | 486.48 | −442.16 |
| F-400-5 | 5.38 | 10 | 356.13 | 471.78 | −428.27 | |
| F-400-6 | 5.25 | 10 | 383.96 | 482.57 | −439.13 | |
| F-600-1 | 7.20 | ±2.5% | 26 | 547.77 | 464.10 | −434.86 |
| F-600-2 | 7.65 | 28 | 565.11 | 461.18 | −430.60 | |
| F-600-3 | 7.83 | 22 | 484.13 | 466.86 | −438.15 | |
| F-600-4 | 6.69 | ±4.0% | 11 | 386.84 | 492.71 | −448.44 |
| F-600-5 | 6.57 | 11 | 382.95 | 491.09 | −444.28 | |
| F-600-6 | 6.75 | 9 | 340.30 | 491.70 | −445.59 | |
| F-800-1 | 7.31 | ±2.5% | 22 | 484.52 | 464.82 | −440.97 |
| F-800-2 | 7.34 | 26 | 539.91 | 464.19 | −441.66 | |
| F-800-3 | 7.21 | 27 | 553.02 | 462.38 | −440.67 | |
| F-800-4 | 7.89 | ±4.0% | 11 | 369.39 | 469.42 | −420.89 |
| F-800-5 | 8.09 | 9 | 308.18 | 462.32 | −413.05 | |
| F-800-6 | 8.48 | 8 | 312.17 | 474.28 | −433.98 | |
| F-1000-1 | 12.46 | ±2.5% | 25 | 501.26 | 446.04 | −415.00 |
| F-1000-2 | 12.11 | 27 | 545.65 | 449.89 | −425.98 | |
| F-1000-3 | 11.76 | 23 | 484.09 | 448.33 | −417.97 | |
| F-1000-4 | 8.13 | ±4.0% | 9 | 301.69 | 449.60 | −422.23 |
| F-1000-5 | 9.64 | 10 | 344.66 | 477.16 | −435.54 | |
| F-1000-6 | 9.82 | 9 | 314.05 | 473.62 | −420.73 |
Table 7.
Results of LCF tests with free length 6Ø conducted on steel Tempcore B.
| Rebar | Mass Loss (%) | Strain | Cycles (N) | Wd (MPa) | σmax (MPa) | σmin (MPa) |
|---|---|---|---|---|---|---|
| Β-0-1 | - | ±2.5% | 38 | 905.02 | 528.36 | −549.75 |
| Β-0-2 | - | 35 | 814.19 | 528.51 | −549.90 | |
| Β-0-3 | - | 32 | 753.73 | 530.38 | −532.47 | |
| Β-0-4 | - | 36 | 718.42 | 533.70 | −553.94 | |
| Β-0-5 | - | 39 | 758.23 | 532.14 | −543.73 | |
| Β-0-6 | - | ±4.0% | 10 | 417.65 | 559.56 | −530.10 |
| Β-0-7 | - | 9 | 382.53 | 559.35 | −531.56 | |
| Β-0-8 | - | 11 | 417.00 | 559.95 | −535.43 | |
| Β-0-9 | - | 10 | 393.86 | 562.10 | −535.62 | |
| Β-0-10 | - | 10 | 398.08 | 560.23 | −532.36 | |
| Β-100-1 | 1.42 | ±2.5% | 27 | 651.12 | 508.84 | −511.75 |
| Β-100-2 | 1.42 | 22 | 538.90 | 513.68 | −523.03 | |
| Β-100-3 | 1.23 | 25 | 598.68 | 505.59 | −496.91 | |
| Β-100-4 | 1.52 | ±4.0% | 9 | 391.43 | 534.15 | −489.75 |
| Β-100-5 | 1.33 | 10 | 424.12 | 532.06 | −496.66 | |
| Β-100-6 | 1.48 | 10 | 436.15 | 543.52 | −507.65 | |
| Β-200-1 | 1.73 | ±2.5% | 35 | 823.51 | 445.92 | −528.23 |
| Β-200-2 | 1.54 | 34 | 796.69 | 443.00 | −540.93 | |
| Β-200-3 | 1.78 | 30 | 704.38 | 438.65 | −535.49 | |
| Β-200-4 | 1.56 | ±4.0% | 9 | 388.51 | 556.25 | −523.26 |
| Β-200-5 | 1.62 | 8 | 358.95 | 559.57 | −526.31 | |
| Β-200-6 | 1.85 | 8 | 356.97 | 558.18 | −529.75 | |
| Β-200-7 | 1.75 | 8 | 349.61 | 551.78 | −526.44 | |
| Β-300-1 | 4.72 | ±2.5% | 26 | 604.97 | 502.42 | −507.11 |
| Β-300-2 | 3.32 | 30 | 701.68 | 510.45 | −502.62 | |
| Β-300-3 | 3.35 | 27 | 648.38 | 510.16 | −493.52 | |
| Β-300-4 | 3.28 | 28 | 661.63 | 510.80 | −500.63 | |
| Β-300-5 | 2.57 | ±4.0% | 8 | 348.60 | 553.62 | −534.34 |
| Β-300-6 | 2.62 | 10 | 408.47 | 549.52 | −525.37 | |
| Β-300-7 | 2.61 | 9 | 393.39 | 555.48 | −535.12 | |
| Β-300-8 | 2.57 | 10 | 418.45 | 550.04 | −525.18 | |
| Β-400-1 | 3.25 | ±2.5% | 34 | 789.70 | 507.42 | −529.72 |
| Β-400-2 | 3.74 | 26 | 631.10 | 507.44 | −539.60 | |
| Β-400-3 | 3.63 | 23 | 556.78 | 504.99 | −512.77 | |
| Β-400-4 | 3.90 | ±4.0% | 8 | 349.66 | 546.88 | −518.50 |
| Β-400-5 | 4.02 | 10 | 415.54 | 541.88 | −519.52 | |
| Β-400-6 | 3.69 | 9 | 361.89 | 536.43 | −513.11 | |
| Β-600-1 | 4.06 | ±2.5% | 22 | 562.71 | 507.47 | −528.84 |
| Β-600-2 | 3.55 | 23 | 573.83 | 509.98 | −518.09 | |
| Β-600-3 | 4.08 | 23 | 567.83 | 510.49 | −506.73 | |
| Β-600-4 | 4.04 | ±4.0% | 9 | 416.93 | 553.57 | −535.91 |
| Β-600-5 | 4.09 | 10 | 449.64 | 543.73 | −506.01 | |
| Β-600-6 | 3.81 | 8 | 359.27 | 544.41 | −507.73 | |
| Β-800-1 | 5.52 | ±2.5% | 27 | 651.12 | 508.84 | −511.75 |
| B-800-2 | 3.84 | 22 | 538.90 | 513.68 | −523.03 | |
| B-800-3 | 6.20 | 25 | 598.68 | 505.59 | −496.91 | |
| B-800-4 | 4.74 | ±4.0% | 9 | 391.43 | 534.15 | −489.75 |
| B-800-5 | 5.70 | 10 | 424.12 | 532.06 | −496.66 | |
| B-800-6 | 4.57 | 10 | 436.15 | 543.52 | −507.65 | |
| B-1000-1 | 7.31 | ±2.5% | 15 | 363.98 | 492.91 | −471.55 |
| B-1000-2 | 5.10 | 34 | 786.96 | 510.56 | −517.06 | |
| B-1000-3 | 5.41 | 18 | 436.62 | 505.17 | −491.46 | |
| B-1000-4 | 7.51 | ±4.0% | 7 | 307.81 | 517.14 | −479.04 |
| B-1000-5 | 6.37 | 7 | 319.31 | 532.61 | −497.95 | |
| B-1000-6 | 7.77 | 7 | 293.33 | 514.92 | −477.36 |
Table 8.
Results of LCF tests on Tempcore Steel B (mean values).
| Tempcore Steel B | |||||||||||
|---|---|---|---|---|---|---|---|---|---|---|---|
| ±2.5% | ±4.0% | ||||||||||
| Corrosion Time (h) | Mass Loss (%) | Nf | Wd (MPa) | Wd/Wd,nc | σmax (MPa) | σmax/σmax,nc | Nf | Wd (MPa) | Wd/Wd,nc | σmax (MPa) | σmax/σmax,nc |
| 0 | - | 36 | 789.92 | 1.00 | 530.62 | 1.00 | 10 | 401.82 | 1.00 | 560.24 | 1.00 |
| 100 | 1.39 | 35 | 825.37 | 1.04 | 528.62 | 1.00 | 9 | 413.37 | 1.03 | 563.59 | 1.01 |
| 200 | 1.67 | 33 | 774.86 | 0.98 | 442.52 | 0.83 | 8 | 363.51 | 0.90 | 556.44 | 0.99 |
| 300 | 2.54 | 28 | 654.16 | 0.83 | 508.46 | 0.96 | 9 | 392.22 | 0.98 | 552.17 | 0.99 |
| 400 | 3.75 | 28 | 557.88 | 0.71 | 525.08 | 0.99 | 9 | 462.99 | 1.15 | 527.52 | 0.94 |
| 600 | 3.97 | 23 | 568.13 | 0.72 | 509.31 | 0.96 | 9 | 408.61 | 1.02 | 547.24 | 0.98 |
| 800 | 5.06 | 25 | 596.23 | 0.75 | 509.37 | 0.96 | 10 | 417.24 | 1.04 | 536.58 | 0.96 |
| 1000 | 7.44 | 22 | 529.19 | 0.67 | 502.88 | 0.95 | 7 | 306.82 | 0.76 | 521.55 | 0.93 |
Table 9.
Results of LCF tests on Dual Phase steel F (DPF) (mean values).
| Dual Phase Steel F (DPF) | |||||||||||
|---|---|---|---|---|---|---|---|---|---|---|---|
| ±2.5% | ±4.0% | ||||||||||
| Corrosion Time (h) | Mass Loss (%) | Nf | Wd (MPa) | Wd/Wd,nc | σmax (MPa) | σmax/σmax,nc | Nf | Wd (MPa) | Wd/Wd,nc | σmax (MPa) | σmax/σmax,nc |
| 0 | - | 33 | 652.67 | 1.00 | 484.20 | 1.00 | 14 | 456.33 | 1.00 | 510.52 | 1.00 |
| 100 | 1.36 | 29 | 596.14 | 0.91 | 480.72 | 0.99 | 13 | 518.79 | 1.14 | 507.72 | 0.99 |
| 200 | 1.91 | 30 | 657.73 | 1.01 | 492.59 | 1.02 | invalid | ||||
| 300 | 2.24 | 33 | 661.08 | 1.01 | 480.26 | 0.99 | 13 | 478.52 | 1.05 | 503.43 | 0.99 |
| 400 | 5.97 | 26 | 543.77 | 0.83 | 462.06 | 0.95 | 11 | 384.42 | 0.84 | 480.27 | 0.94 |
| 600 | 7.04 | 25 | 532.34 | 0.82 | 464.05 | 0.96 | 10 | 370.03 | 0.81 | 491.83 | 0.96 |
| 800 | 7.61 | 25 | 525.82 | 0.81 | 463.80 | 0.96 | 9 | 329.91 | 0.72 | 468.67 | 0.92 |
| 1000 | 10.73 | 25 | 510.33 | 0.78 | 448.08 | 0.93 | 9 | 320.13 | 0.70 | 466.79 | 0.91 |
Table 10.
Parameters determined by regression analyses for both types of steel reinforcement.
| Parameters | Beneficial Number of Cycles Neff | Normalized Energy Density Wd/Wd,nc | ||
|---|---|---|---|---|
| Tempcore Steel B | Dual Phase Steel F | Tempcore Steel B | Dual Phase steel F | |
| a | −2.64 | −0.68 | −0.072 | −0.024 |
| b | 35.54 | 21.24 | 1.05 | 1.006 |
| R2 (%) | 62 | 37 | 79 | 73 |
Table 11.
Parameters determined by regression analyses for both types of steel reinforcement.
| Parameters | Fatigue Index QF | |
|---|---|---|
| Tempcore Steel B | Dual Phase Steel F | |
| a | −0.58 | −0.404 |
| b | 612.12 | 428.23 |
| R2 (%) | 41 | 56 |
Publisher’s Note: MDPI stays neutral with regard to jurisdictional claims in published maps and institutional affiliations. |
© 2021 by the authors. Licensee MDPI, Basel, Switzerland. This article is an open access article distributed under the terms and conditions of the Creative Commons Attribution (CC BY) license (https://creativecommons.org/licenses/by/4.0/).
Share and Cite
MDPI and ACS Style
Basdeki, M.; Apostolopoulos, C. Mechanical Behavior Evaluation of Tempcore and Hybrid Reinforcing Steel Bars via a Proposed Fatigue Damage Index in Long Terms. Metals 2021, 11, 834. https://0-doi-org.brum.beds.ac.uk/10.3390/met11050834
AMA Style
Basdeki M, Apostolopoulos C. Mechanical Behavior Evaluation of Tempcore and Hybrid Reinforcing Steel Bars via a Proposed Fatigue Damage Index in Long Terms. Metals. 2021; 11(5):834. https://0-doi-org.brum.beds.ac.uk/10.3390/met11050834
Chicago/Turabian StyleBasdeki, Maria, and Charis Apostolopoulos. 2021. "Mechanical Behavior Evaluation of Tempcore and Hybrid Reinforcing Steel Bars via a Proposed Fatigue Damage Index in Long Terms" Metals 11, no. 5: 834. https://0-doi-org.brum.beds.ac.uk/10.3390/met11050834
Note that from the first issue of 2016, this journal uses article numbers instead of page numbers. See further details here.