
MEROS Dust Quality of Different Plants and Its Potential Further Uses


1
Department of Water, Atmosphere and Environment, University of Natural Resources and Life Sciences Vienna, Muthgasse 18, 1190 Wien, Austria
2
Primetals Technologies Austria GmbH, 4031 Linz, Austria
*
Author to whom correspondence should be addressed.
Metals 2021, 11(5), 840; https://0-doi-org.brum.beds.ac.uk/10.3390/met11050840
Submission received: 29 March 2021
/
Revised: 14 May 2021
/
Accepted: 17 May 2021
/
Published: 20 May 2021
(This article belongs to the Special Issue Sustainable Steel Industry: Energy and Resource Efficiency, Low-Emissions and Carbon-Lean Production)
Abstract
:Sintering is a process of agglomeration of fine particles into porous sinters for blast furnaces. During the sintering process, high volumes of sinter plant gas containing high loads of dust, SO2 and NOX and toxic pollutants, such as heavy metals (e.g., Hg, Pb, Cr and Cd) and PCDD/F, are emitted. The objective of this study was to characterize dusts of different plants as the basis for suggestions of reutilization and treatment options. Dusts, eluates and residues were produced and DOC, T-N, ions and heavy metals were analyzed. The results show that dusts from different plants are very similar in terms of DOC, T-N, Mg, Ca and many heavy metals and only differ in criteria such as suspended solids and ions such as K, Na, Cl and SO4. Based on the high levels of alkalis and low levels of iron, direct recycling into the sinter or furnace process is not recommended. The dissolution of the soluble substances in water reduces the MEROS dust by 90% of the weight and extracts the alkalis. The remaining wastewater needs to be treated to reduce DOC, T-N and some heavy metals. The solid residues can be recycled into the sinter to reduce potential PCDD/F, which are attached to the activated carbon.
1. Introduction
Sintering is a crucial process in steel mills to prepare the feed for blast furnaces to make iron, whereby iron ore fines, flux, recycled products and coke breeze or anthracite are agglomerated to a porous sinter. Sintering is a very complex process, and about 500 parameters [1] need to be controlled and optimized to maintain a high sinter quality. The productivity of the sintering process depends not only on the raw materials and the returned fines balance but also on having optimum and stable operation conditions, such as charge density control, pallet speed control and adverse ingrediencies [1]. In particular, high alkali levels should be avoided to minimize scaffold formation and additional coke consumption [2]. The recycled waste products generated throughout the ironmaking process require, therefore, special physical, chemical and mechanical properties. Sinter plants are in constant evolution to improve techniques and systems to control the process [1]. During the sintering process, high volumes of sinter plant gas are emitted. These gases contain high loads of dust, SO2 and NOX and also a high number of toxic pollutants such as heavy metals (e.g., mercury Hg, lead Pb, chrome Cr and cadmium Cd), polycyclic aromatic hydrocarbons (PAH) and polychlorinated (PCDD) and polybrominated dibenzodioxins (PBDD) and furans (PCDF) [3,4]. Lab experiments also showed high concentrations of up to 34.5 ppm total volatile organic carbon (TVOC), mainly benzene, toluene, xylene and ethylbenzene, in sinter flue gas, which were affected by the coal and coke ratio in sinter raw material [5]. These pollutants need to be removed from the off-gas as the sintering process accounts for an important percentage of the iron and steelmaking emissions [6]. These flue gas purification processes can be classified into two major groups: wet processes and dry processes [7]. To remove SO2, different systems can be used, such as the circulating fluidized bed (CFB)–FGD process, ammonia-ammonia sulfate process, limestone/gypsum process, maximized emission reduction of sintering (MEROS)–FGD process and activated carbon adsorption process. Cores et al. [1] described different techniques: the WETFINE technology (developed by VAI) consists of a flexible modular system to reduce dust, alkaline chloride, SOX and dioxin contents. Gas scrubbing is achieved by a mixed system: wet wash and electrostatic discharges, but this treatment system cannot reduce dioxin emission levels below 0.4 ng I-TEQ Nm−3. For an improvement, urea was added and some plant operating parameters were modified.
In the MEROS process (maximized emission reduction of sintering), developed by Siemens-VAI [8], dust, acid gases, hazardous metals and organic compounds are eliminated with high efficiency rates, and this treatment fulfills current environmental regulations. There are two options of desulfurization agents: option A uses hydrated lime and option B uses sodium bicarbonate. The difference between these two options is the precondition for optimized desulfurization. Desulfurization with hydrated lime requires lower gas temperatures (approx. 100 °C) and a defined moisture level for optimal performance.
Option B injects the additive into the waste gas after the ESP of the sinter plant; to reach a higher efficiency rate, there is an internal recirculation after the pulse jet filter (bag filter). Option B can handle a higher waste gas temperature and does not need a specific moisture content. Additionally, the use of sodium bicarbonate is preferred if a high DeSOx degree and a DeNOx plant are requested [9].
The efficacy of the process results in a dust reduction of more than 99% to less than 5 mg/Nm3; a Hg and Pb reduction of 97% and 99%, respectively; and PCDD/F are eliminated by about 97% and VOCs by more than 99% [10]. This means that MEROS® is currently the most modern and powerful system for cleaning off-gas in sinter plants. Different treatment methods have to be applied to comply with the respective national legislation on the emission limits for each substance, as the plants have to adapt and/or incorporate gas treatment systems to reach their specific emission limits. Although the MEROS process is valuable as it removes acidic components such as HCl and SO2 up to a very high level, large amounts of residues containing high concentrations of soluble alkali salts, heavy metals and organic pollutants are formed. The gas cleaning residue is considered as hazardous waste, and Song et al. [11] found that Pb and Se are the main elements of environmental and health concern. Therefore, the disposal of residues in landfills must meet special requirements, and solidification/stabilization using cement and a chelating agent were investigated by Song et al. [11]. Solidification/stabilization is a necessary step for the immobilization of heavy metals. The solidification of dust from a DeSOx plant with cement has the disadvantage of high CO2 emissions—e.g., 200–550 kg/t fly ash was emitted depending on the ratio of cement and dust [12]. Another argument against the mixture of dust and cement is the high concentration of cement used and the decreased potential of further reutilization [12].
Another option would be reutilization in a primary process step, such as in the sinter plant. However, different ingredients such as Zn and especially high alkaline values show adverse effects on the ESP and in the blast furnace process [2,13]. Another method suggested by Xu et al. [14] is the reuse of the washed residue in cement production. For all of these potential reuse options, information on the composition of the dust and its fractions is required.
In this paper, MEROS sinter dusts from two different plants are characterized, and the differences between various charges and plants are pointed out. The knowledge on the ingredients of the dusts is crucial for potential recycling or reuse options. For reusing purposes, eluates and residues were produced and characterized. One of the main topics of this paper is to find the best solution of reutilization of the dust from a dry DeSOx plant (Sinter–MEROS network). Therefore, different options and criteria for further applications and uses are suggested.
2. Materials and Methods
2.1. Description of the Plants
Residue samples of sinter waste gas streams were collected from two different sinter plants with MEROS (maximized emission reduction of sintering) gas purification units, called Plants A and B. The two MEROS plants are located in different continents. One plant is located in Asia and the other one in Europe. The following description of the sinter and MEROS plants gives an overview of the plant sizes (design parameters are used).
Samples A-D1 to A-D6 were collected from Plant A, with a plant size of 250 m2, a sinter capacity of 7920 t/d and a waste gas stream of approximately 600,000 Nm3/h. Samples B-D1 and B-D2 were taken from the second plant of the Sinter–MEROS network (Plant B), with a size of 400 m2 and a capacity of approx. 14,200 t/d. The waste gas stream is approx. 1,000,000 Nm3/h. Both sinter plants are designed for a sinter bed height of 700 mm and applied the bicarbonate process. The designated desulfurization rate and byproduct formation of Plant A and Plant B were between 60 and 70% and approx. 620 kg/h and between 95 and 97% with approx. 4570 kg/h, respectively.
2.2. Sampling
Solid samples of A-D1 to A-D5 and B-D1 and B-D2 were taken in small sample sizes of about 2 kg in PE bottles directly out of the MEROS byproduct silo. From sample A-D6, about 120 kg was taken from the silo of Plant A in 4 different barrels. Due to this, more experiments were conducted with this sample compared to the others.
2.3. Preparation of the Samples
For the lab experiments, 1:10 (mass per volume) suspensions were prepared by dissolving 100 g dust in 1 L of deionized water in a volumetric flask. The mixture was transferred into a plastic bottle and eluted for 120 min by shaking in an overhead shaker. Afterwards, the suspension was centrifuged for 10 min at 4000 rpm to coarsely separate the undissolved constituents, and the fine fraction was removed by membrane pressure filtration (cellulose nitrate, 47 mm diameter, pore size of 0.45 μm). The filtered 1:10 solution is called eluate (i.e., A-Dn-E). The solid fraction after dissolution and removal of the dissolved fraction is called solid residue (i.e., A-Dn-R).
2.4. Analytical Methods
The dissolved fraction (eluate A-Dn-E) was analyzed for dissolved carbon and nitrogen, selected ions and heavy metals. The untreated dust (A-Dn) and the solid residues after filtration (A-Dn-R) (pore size 0.45 µm) were analyzed for total heavy metals and ions. With the unfiltered suspension of dust (dilution of 1:10) and water, the percentage of suspended solids was determined.
The parameters pH, temperature and conductivity were measured with WTW (Multi 3630, Xylem Analytics, Weilheim, Germany).
2.4.1. ICP-MS
For determining the total concentration of heavy metals in the dust and solid residue samples, 2.0 g of the dried (100 °C) solid samples was digested in a microwave with HNO3 suprapur (65%). The heavy metal components were determined by means of ionized plasma and detection by mass spectroscopy (ICP-MS, ELAN DRC-e, Perkin Elmer, Waltham, MA, USA) in the quantification mode according to DIN EN ISO 17294-1 (E 36): 2003. The results for the solids, such as dusts and filter residues, are given as total (e.g., Cdtot), and in the filtered eluate, as dissolved concentration (e.g., Cddis).
2.4.2. Ion Chromatography
Cations and anions were separated by a liquid chromatograph (DIONEX ICS 3000, DIONEX Softron Germering, Germany) equipped with an autosampler, suppressor and conductivity detector. An AS15 250 × 2 mm + AG15 50 × 2 mm column was used for anion separation and a CS12A 250 × 2 mm + CG12A 50 × 2 mm column was used for cation separation. As the mobile phase (eluent) for the determination of the cations, methane sulfonic acid solution was used, and for the determination of the anions, potassium hydroxide solution was used. Anion and cation standards were prepared using stock standards (Merck). All solutions and dilutions were prepared with deionized water. The limits of quantification and working ranges for the different ions were as follows: for anions, 0.25–3.0, 0.22–2.5, 1.0–10, 0.65–4.9 and 0.1–3.0 mg/L for Cl, NO3-N, SO4, PO4-P, F and Br; and for cations, 0.25–6.5 mg/L for Na, Ca and Mg and 0.78–14.8 mg/L for NH4-N, respectively. Several dilutions of the samples were analyzed to cover the different concentration ranges and stay within the working range of the various ions. The dilutions resulted in different limits of quantification.
2.4.3. TOC, DOC and T-N
The total organic carbon (TOC) and dissolved organic carbon (DOC) (after filtration to 0.45 µm) were analyzed as non-purgeable organic carbon in a Shimadzu (Shimadzu TOC V CPN) at pH to <2 (HCl 32% and sparging); the carbon was oxidized by thermocatalytic combustion to carbon dioxide, which was detected by a non-dispersive infrared spectrometer (NDIR) according to DIN EN 1484 (H3): 2019-04. The working range was between 0.3 and 1000 mg/L C with a standard deviation of 5%. The determination of the total content of bound nitrogen (T-N) was based on its oxidation by catalytic combustion in an oxygen atmosphere at >700 °C to form nitrogen oxides. The nitrogen mass concentration was quantified by chemiluminescence detection (after reaction with ozone). The limit of quantification was 0.1 mg/L T-N with a standard deviation of 9%.
2.4.4. Bulk Density and Suspended Solids
For the bulk density of the dusts, 20.0 g dust was weighed in a 100-milliliter measuring cylinder, and the sample bulk density (g/L) was derived from the mass per volume.
To determine the suspended solids (SS), a total volume of 200 mL of a 1:10 suspension of dust and water was filtered (cellulose nitrate, 47 mm diameter, pore size of 0.45 μm) in small portions using 15–20 fresh filters. Each individual filter was dried before and after filtration at 100 °C for 2 h, cooled in a desiccator and weighed; the sum of all portions was used for the calculation of the percentage of the solid residue based on the initial weight of the dust.
2.4.5. XRD
The untreated dust (A-D6), this untreated dust heated to 550 °C, the dried solid residue (A-D6-R) and the dried salts from the eluate (A-D6-E) were studied by means of X-ray diffraction (XRD) using a Panalytical X’Pert Pro MPD diffractometer (Pananalytical, Almelo, Netherlands) with automatic divergent slit, Cu LFF tube 45 kV, 40 mA, with an X´Celerator detector. The measuring time was 25 s per step, with a step size of 0.017°. The semiquantitative mineral composition of the bulk samples was estimated using Rietveld refinement with the Panalytical software X´Pert (Version HighScore Plus, Pananalytical, Almelo, Netherlands). Simultaneous thermal analysis (STA), thermogravimetric (TG) and differential scanning calorimetry (DSC) measurements were performed with the dried residue after filtration. The STA analyses were carried out on Netzsch STA 409 PC Luxx (Netsch, Selb, Germany). Between 50 and 51 mg of the sample was weighed in a Pt-cup and then analyzed in a controlled atmosphere with 50 mL/min air and 10 mL/min N2. The heating rate was 10 °C/min, and the samples were heated up to 1000 °C. The physical parameter measured in DSC was the difference in energy inputs into the sample and reference material when both are subjected to a controlled temperature program. Endothermal and exothermal reactions could be observed [15]. During TG measurement, mass changes of the sample mass were observed.
2.5. Data Analysis and Statistics
For the heavy metals’ concentrations, the data were measured in multiple dilutions and the results were selected according to the dilution in the working range. The data acquisition and processing of heavy metals were controlled by ICP-MS software (ELAN 3.0, Perkin Elmer, Waltham, MA, USA), and the results were expressed in µg/L but recalculated and expressed as µg per g.
In order to determine whether the means of the two sets of dust data from the different plants are significantly different from each other, Student’s t-tests were performed for the different parameters using the program R. The level of significance was chosen at 5% (p-value < 0.05).
3. Results and Discussion
3.1. Characterization of Different Dust Samples
The variations in concentration between different charges of MEROS dusts of Plant A and between Plants A and B are shown in Figure 1. A high fraction of the dust solids were water soluble and could be transferred into the eluate; only about 10 to 12% of the total solids of dust of Plant A and 6% of the dust of Plant B remained solid and could be removed from the solution with membrane filters. The samples A-D1, A-D6 and B-D1 were examined more closely for DOC, T-N, solid residues, bulk density and total and dissolved heavy metals.
The bulk density of A-D1, A-D6 and B-D1 was observed to be 400, 278 and 488 g/L, respectively. The data show that the variations within Plant A are higher than those between the two plants. Figure 1 shows the DOC, T-N and the solid residues of the three dusts and eluates.
The DOC concentration in the eluate varies between 0.37 and 0.74 mg/g, and that of T-N between 1.6 and 2.03 mg/g. The statistical analysis indicates that there is no significant difference between the different dusts.
3.2. Characterization of the Different Eluates
A huge fraction of the dust could be dissolved as most of it consisted of ions, as can be seen in Table 1. The dissolved ion concentrations in the eluates A-D1-E to A-D6-E and B-D1-E to B-D2-E after filtration (pore size: 0.45 µm) are summarized in Table 1.
The most important anions are SO4 and Cl, which make up 44% (m/m) and 13% (m/m) of the total dry matter of the dust, respectively; the major cations are Na and K, contributing 24% (m/m) and 11% (m/m) of the total dry matter, respectively. Due to the high concentrations of ions in the eluate and remaining salts in the solid residue, the calculated value can reach more than 100% of the mass of the dust used; this is potentially due to the overestimation of the solid residue, as the complete removal of the high concentrated salt solution during filtration was not possible, and to reflect practical applications, no washing step was performed. All other ions could be detected only in minor concentrations; PO4-P was, in most cases, below the LOQ. Although F, NO3-N, NH4-N and Br contributed only little to the total mass, some have strict standard values according to wastewater emission regulations. The eluates A-D1 to A-D3 have NH4-N concentrations <LOD (limit of detection) in contrast to all others. In A-D1-E, quite high concentrations of NO3-N could be detected. Ammonia can be added into sinter plants to reduce the formation of PCDD/F [3]. The difference between the T-N values and the sum of the fractions of NH4-N and NO3-N is organic N, as NO2-N could not be detected in any sample. The eluates from sinter Plant B had higher concentrations of SO4 and Na than those from Plant A, which is probably due to the design, as the permit of Plant B requires a higher rate of desulfurization than Plant A does. The K content was lower in the eluates from sinter Plant B.
3.3. Analysis of the Heavy Metals Contained
Selected dusts were also analyzed to gain insight on the heavy metal content of the dusts and the corresponding eluate. The dusts A-D1, A-D2, A-D6, B-D1 and B-D2 were investigated for total and dissolved heavy metals (Table 2). In addition, the data were compared to data in the literature and the effluent standards of different countries.
Although the deviation between the samples of Plant A is high, which could be due to different sinter feeds during the sampling times, the concentrations of heavy metals of Plant B are lower for nearly all metals except Ni and Zn. The total concentration of Fe in the dust was very low in all samples and only between 0.086 and 0.73% of the dust. In comparison to data in the literature, the sample of Plant A “A-D6“ was up to one order of magnitude higher in terms of Pb than seen in the data of Sheng et al. [7], who characterized samples from MEROS flue gas desulfurization (FGD) systems, but are in line with the data of Song et al. [11], who found total concentrations of Pb, Cu, Fe Mn, Se and Zn in the dust of a MEROS system in the same order of magnitude (Table 3).
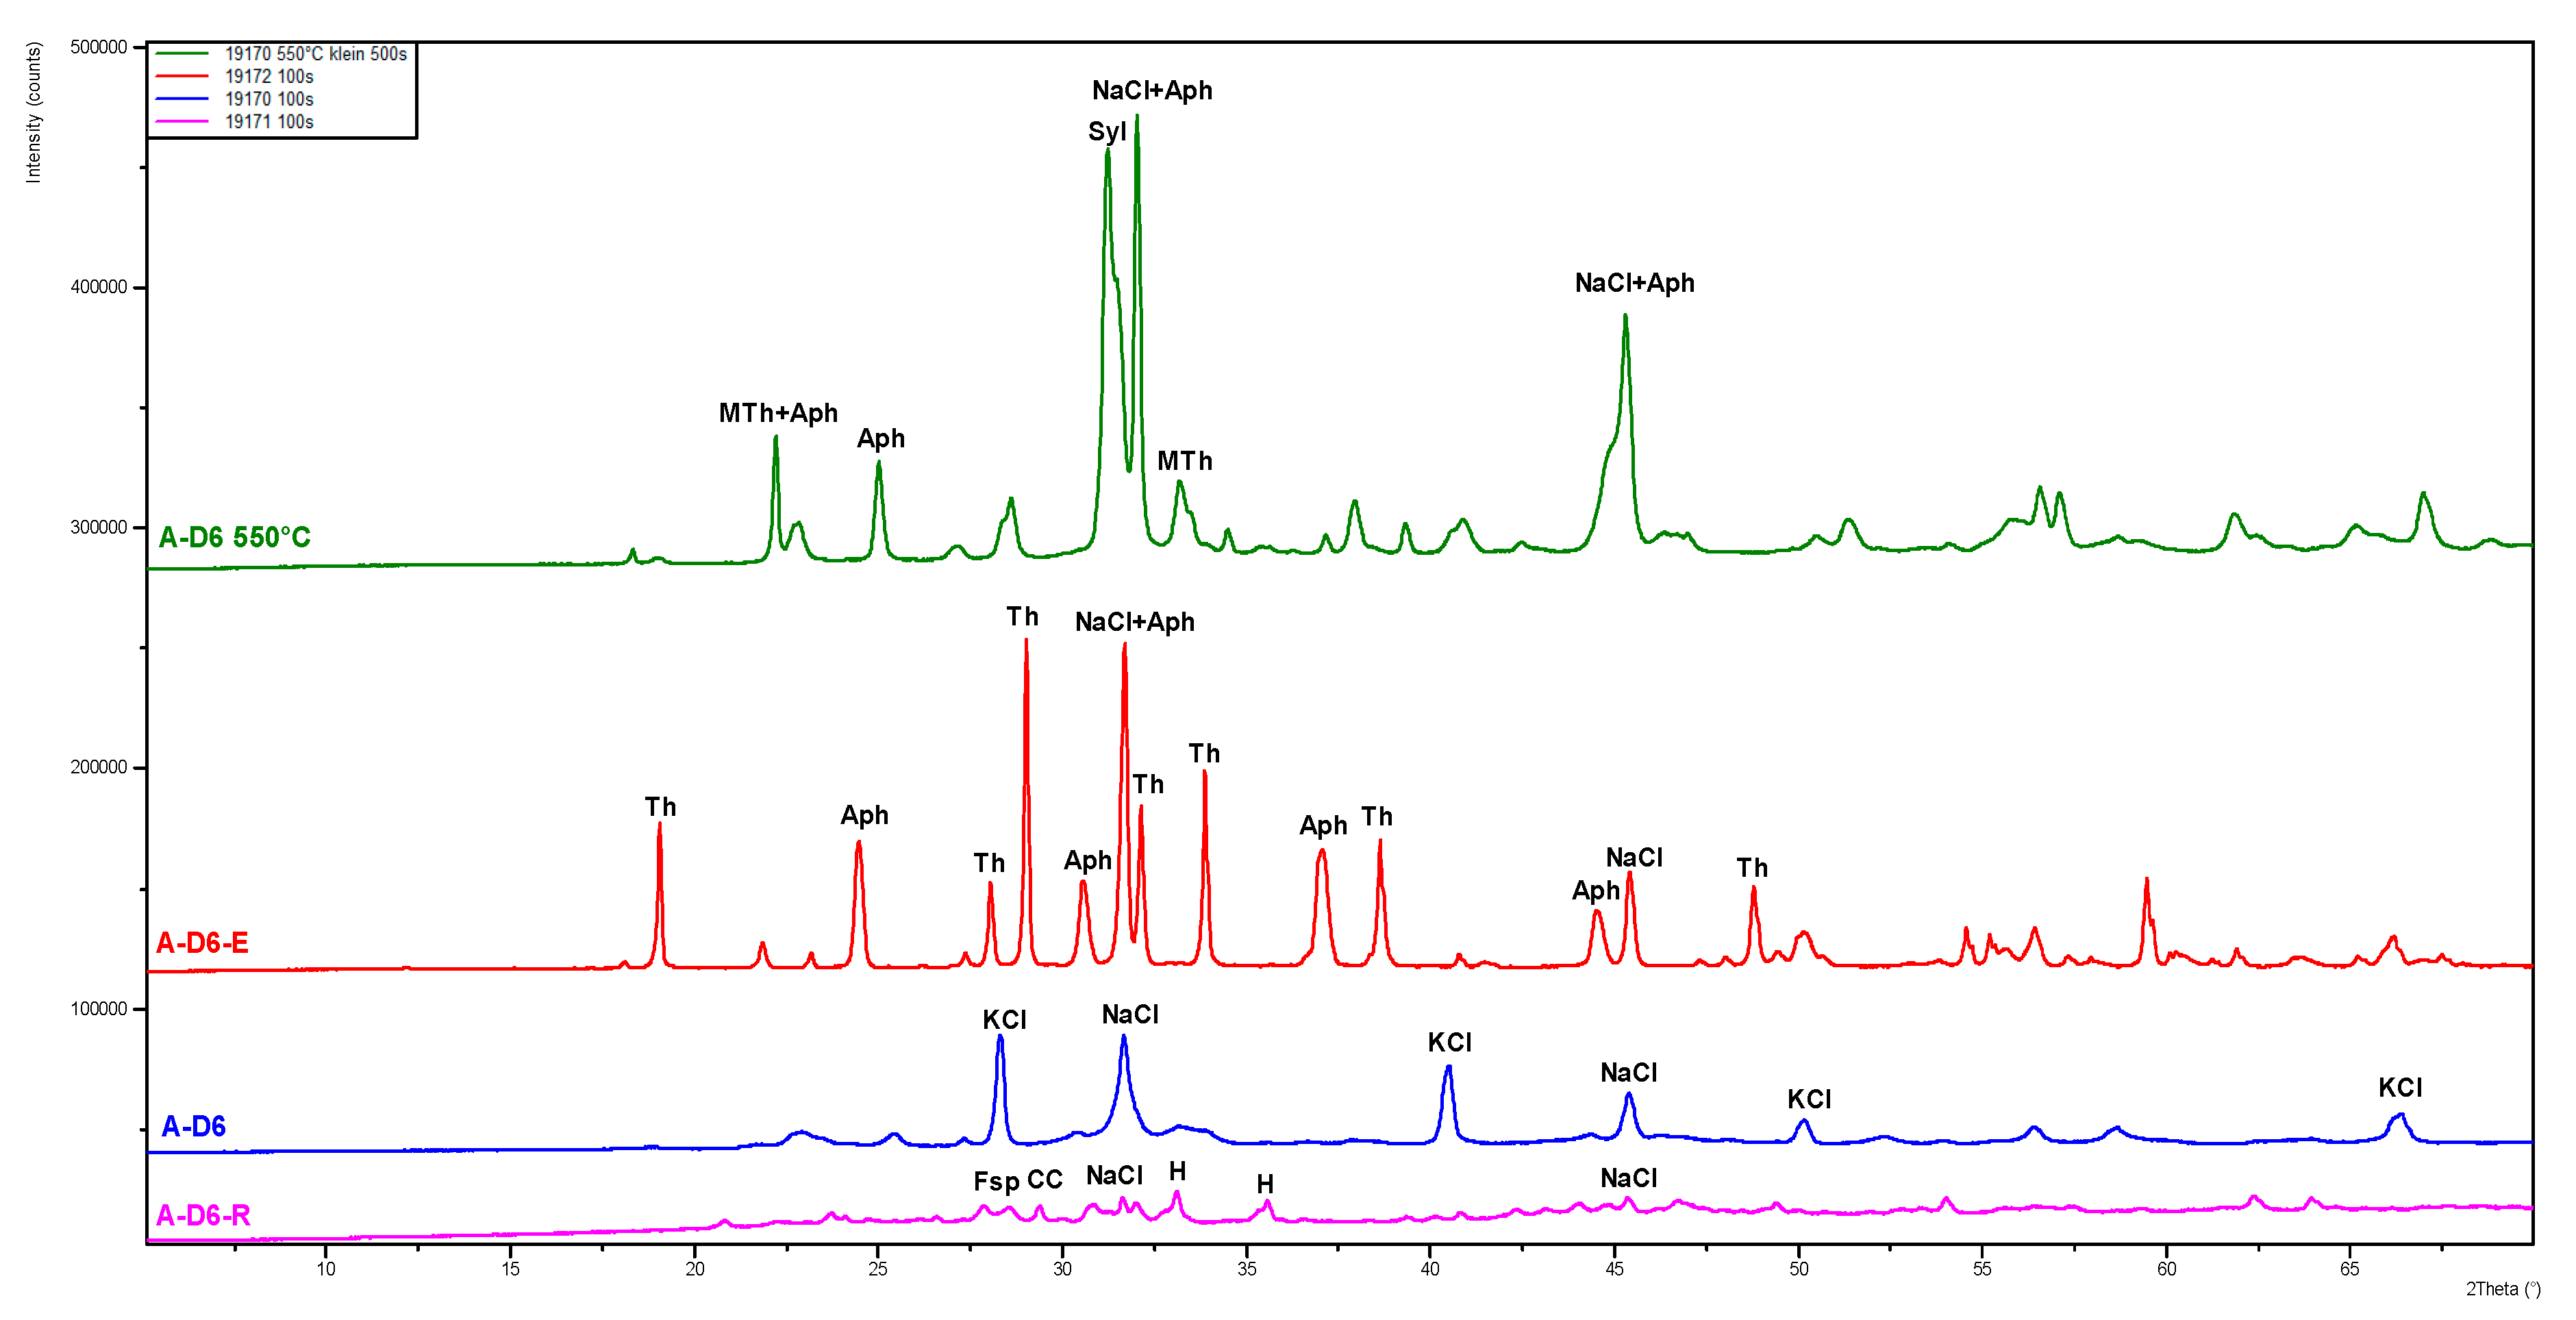
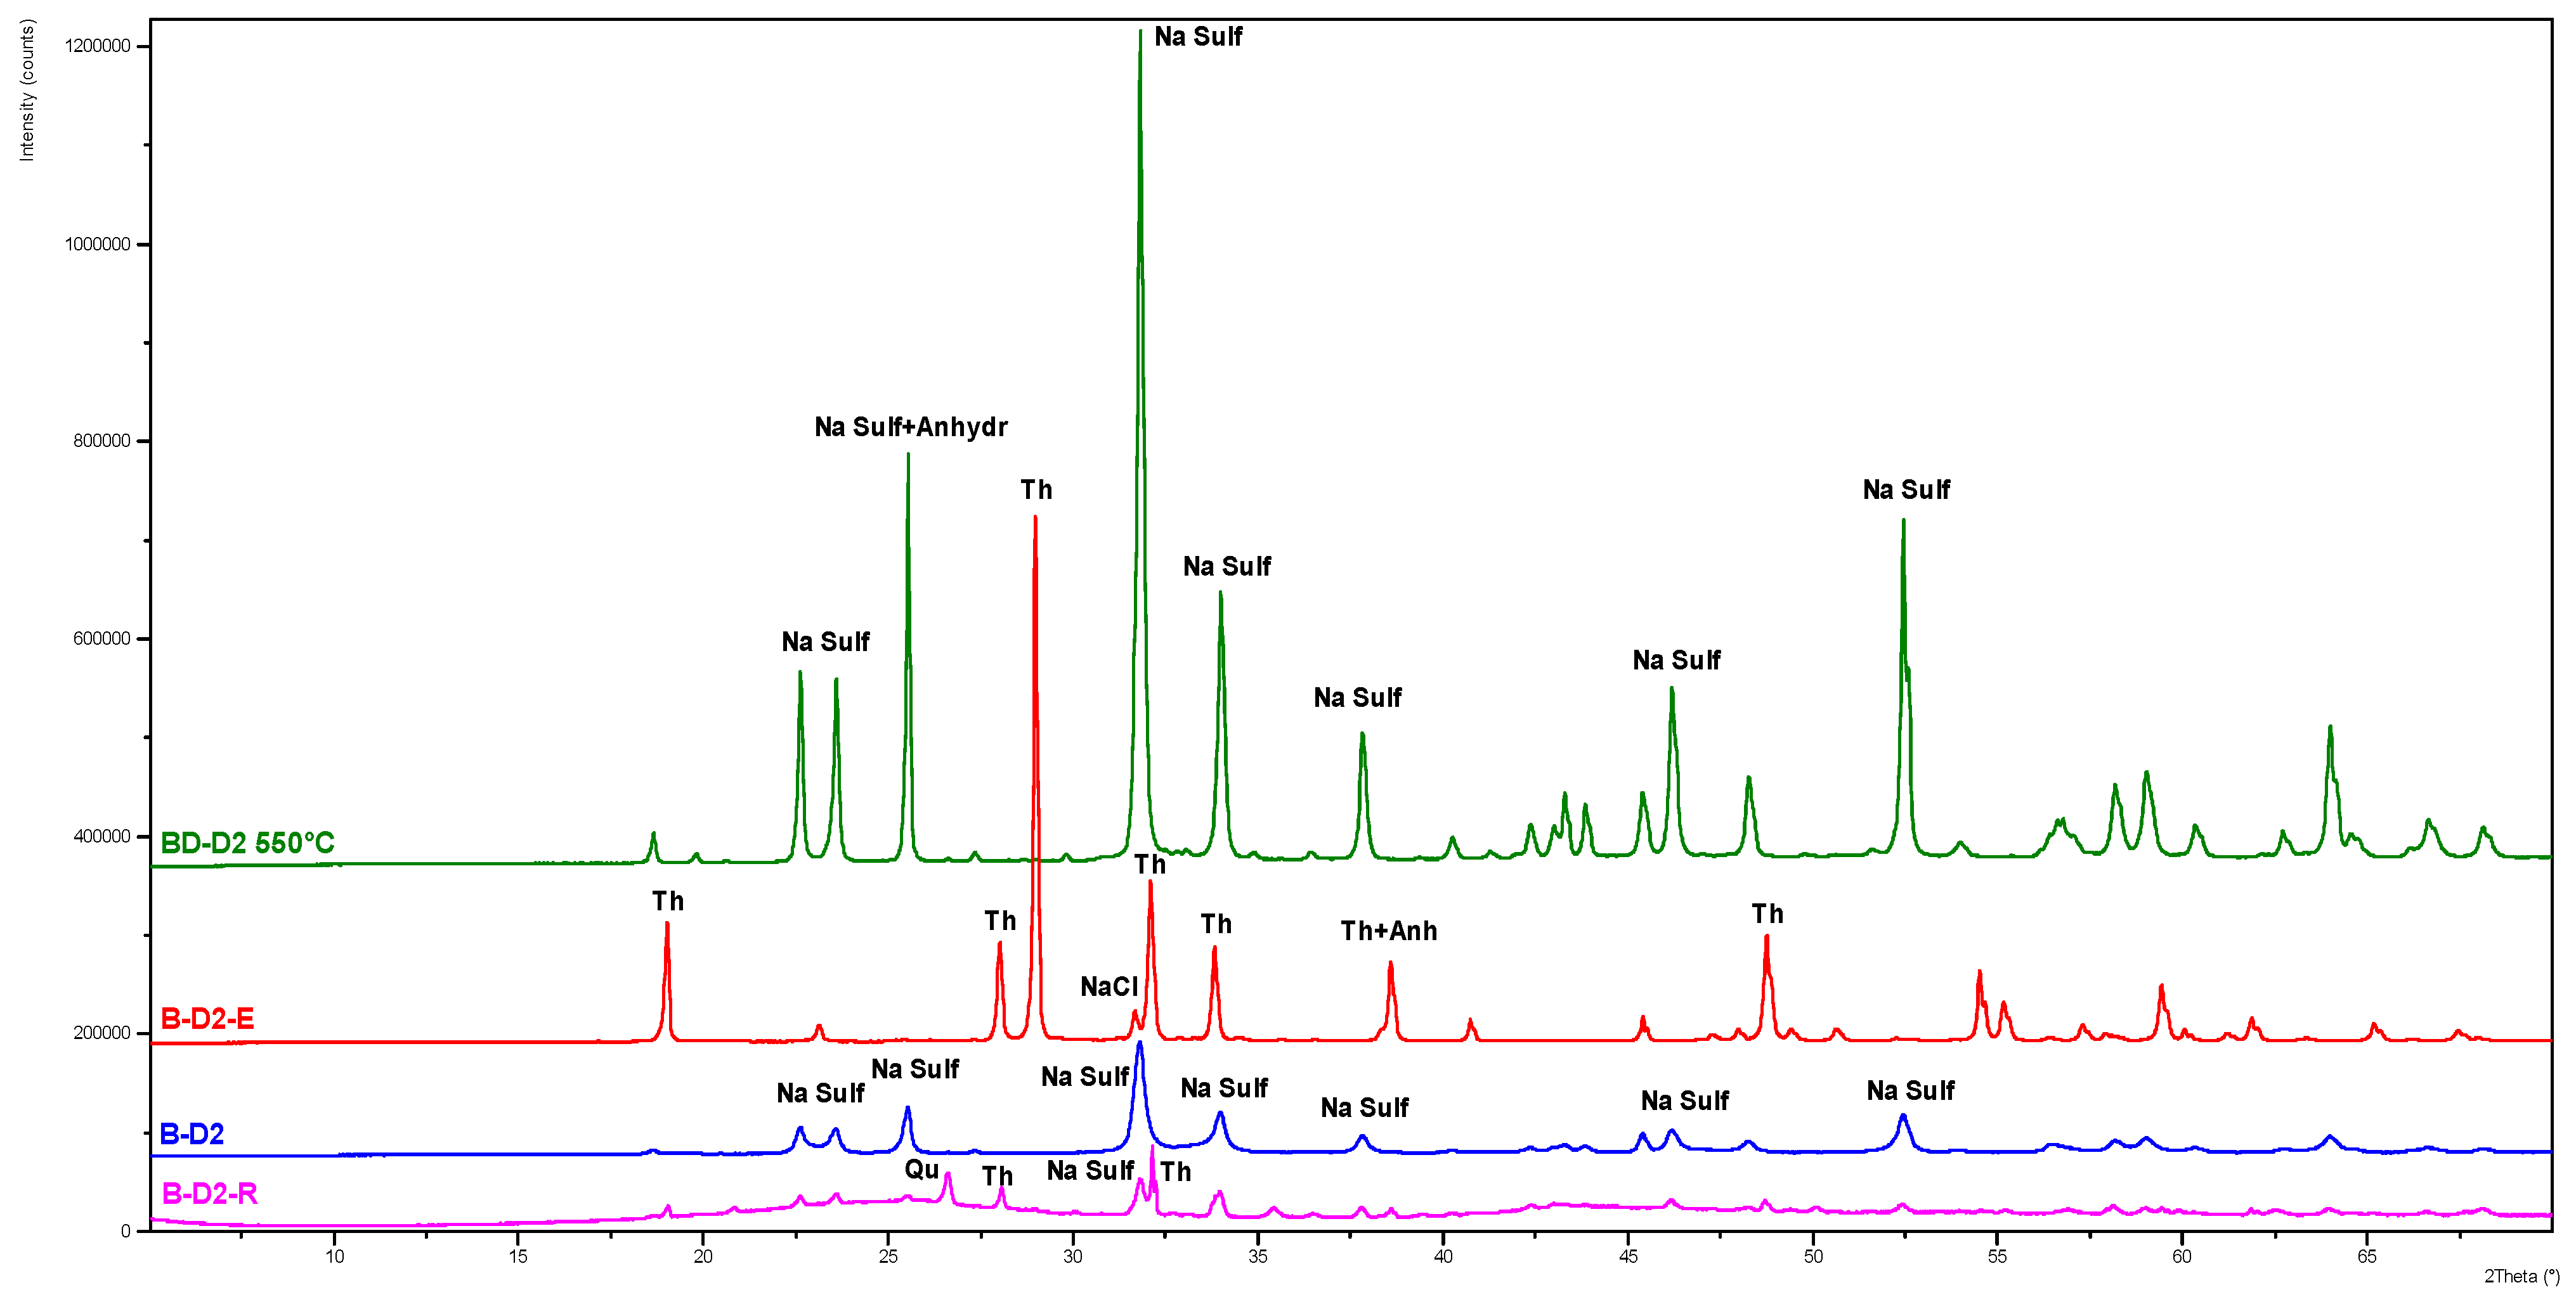
Interestingly, the Fe content of the dust was very low, as also confirmed by XRD investigations, which could mainly detect amorphous material and salts and only traces of iron (Table 4 and Table 5). Only parts of the evaporated dried eluate could be quantified. For all other ingredients, their amounts could only be assessed as *** high, ** medium, * low or as traces. Figure 2 and Figure 3 show the X-ray diffractograms of samples A-D6 and B-D2 after different treatments.
Due to the amorphous structure of the sample, a better result could be obtained after the heat treatment at 550 °C. In dust A-D6, mainly NaCl and mixed salts of Na and K with Cl and SO4 could be detected; the eluates were very crystalline and could be quantified. In dust B-D2, Na2SO4 could be detected. From the XRD results, it is also clear that the residue still contains soluble salts. Sheng et al. [7] characterized samples from two flue gas desulfurization (FGD) systems of two different sinter plants in China. In both dusts, the main mineralogical phases were CaSO3 1/2H2O, CaSO4, Ca(OH)2 and CaCO3.
3.4. Potential Direct Reuse of the Dust or the Solid Residue after Leaching
Several papers investigated different strategies of disposal such as disposal in a secure landfill (hazardous waste) with adequate solidification [11,12] or reuse of residues as secondary construction materials [14] or as cement additives [7]. However, these papers also discussed the problems of the long-term stability of the cement matrix, independent of whether the dust will be cemented or used as an additive for the cement industry. In conclusion, there is a risk of possible leaching of harmful substances from the sinter dust.
Another strategy could be recycling in the primary process, but the low concentration of iron in the dust makes direct reuse questionable, even more so as the alkaline concentration is very high. Additionally, alkalis (Na, K) are among the elements which have a negative effect on the blast furnace performance (such as Na, K, Pb, Mn, etc.)—those with a very high impact. Zn and evaporated Pb are transported with the upstream of the top gas to the upper area of the blast furnace. The accumulation of Pb on the burden particles reduces the reduction process efficiency of the blast furnace and locks the incineration of the coke, whereas Zn starts to precipitate and builds up scaffolds such as alkalis [16].
For a better overview, in Table 6, the concentrations of Zn and alkalis and their contributions to the sinter material are shown with and without an additional treatment step (washing of the sinter dust), which, in case of reuse, would be charged to the primary process. The values are calculated in g/t sinter feed. The ratio of MEROS dust is approx. 0.5% of the designed sinter capacity.
Zn will be charged naturally with the sinter material (approx. 70–200 g/t) [13]. Compared to the potential load of Zn, in the case that the dust is recycled to the furnace, the fraction will only be 1.2 g/t—that is, about 0.6–1.7% of the natural content. The results for the alkalis (Na and K) are different. Without a treatment step, the add-on to the natural alkaline amount (for K and Na of 600–1000 and 250–500 g/t sinter feed, respectively [13]) are, for K and Na, 583 and 1175 g/t sinter feed, respectively. The increase in total amount for K is more than 100% compared to the normal value, and for Na, more than 300%.
Geerdes et al. [17] considered an alkaline content of 1 to 3 kg/t HM (hot metal) as the upper limit for the prevention of scaffolds, which is similar to the paper of El Geassy [2], who investigated the correlation between the alkaline content and the presence of scaffolds on the furnace wall, with the result that there is a relation between alkalis and scaffolds. They show the relation of the input of Na2O to 6–7.5 kg/t pig iron (4.5–5.25 Na kg/t pig iron) and the K2O feed between 1 and 1.8 kg/t pig iron (0.8–1.5 K kg/t pig iron) [2] and the presence of scaffolds. Based on the above-mentioned limits [17], the contents in Table 6 and under the assumption of a 100% sinter feed with an iron content of 58% to the blast furnace, the alkaline value in the blast furnace will exceed the above-mentioned limit if the MEROS dust will be reused without a treatment step in the sinter plant.
For direct reutilization, a high content of alkali poses a major problem, as the amount of alkali in the burden is split between liquid, solid and gas and depends on the conditions. Liquid and solid streams move downwards, while the gas stream is the opposite. In particular, alkalis in the gas phase are the most critical ones because according to condensation or oxidation processes, the alkalis precipitate [16] and build scaffolds on the furnace walls, which increase the gas velocity and reduce the working volume; the risk of braking off scaffolds is that chilled areas in the blast furnace could occur [2]. In addition, alkalis increase the coke consumption by about approx. 19.6% [2] and also move the equilibrium of the Boudouard reaction to lower temperatures according to catalytical influences [16]. They also have an influence on the physical and chemical properties of the slag, attack the refactoring lining in the furnace [2] and decrease the efficiency of the ESP dust emissions. Dust emissions <50 mg/Nm3 were only reachable with an alkaline input of below 2.5 kg/t [13].
Therefore, alkalis should be removed from MEROS dust before reuse in sinter or blast furnaces. In our study, the soluble fraction was dissolved with water, which removed about 89–94% of the previous solids of the dust. The remaining wastewater (eluate) contained some DOC, T-N and heavy metals (Table 7) and would need to be treated to remove toxic substances, nutrients and organic carbon.
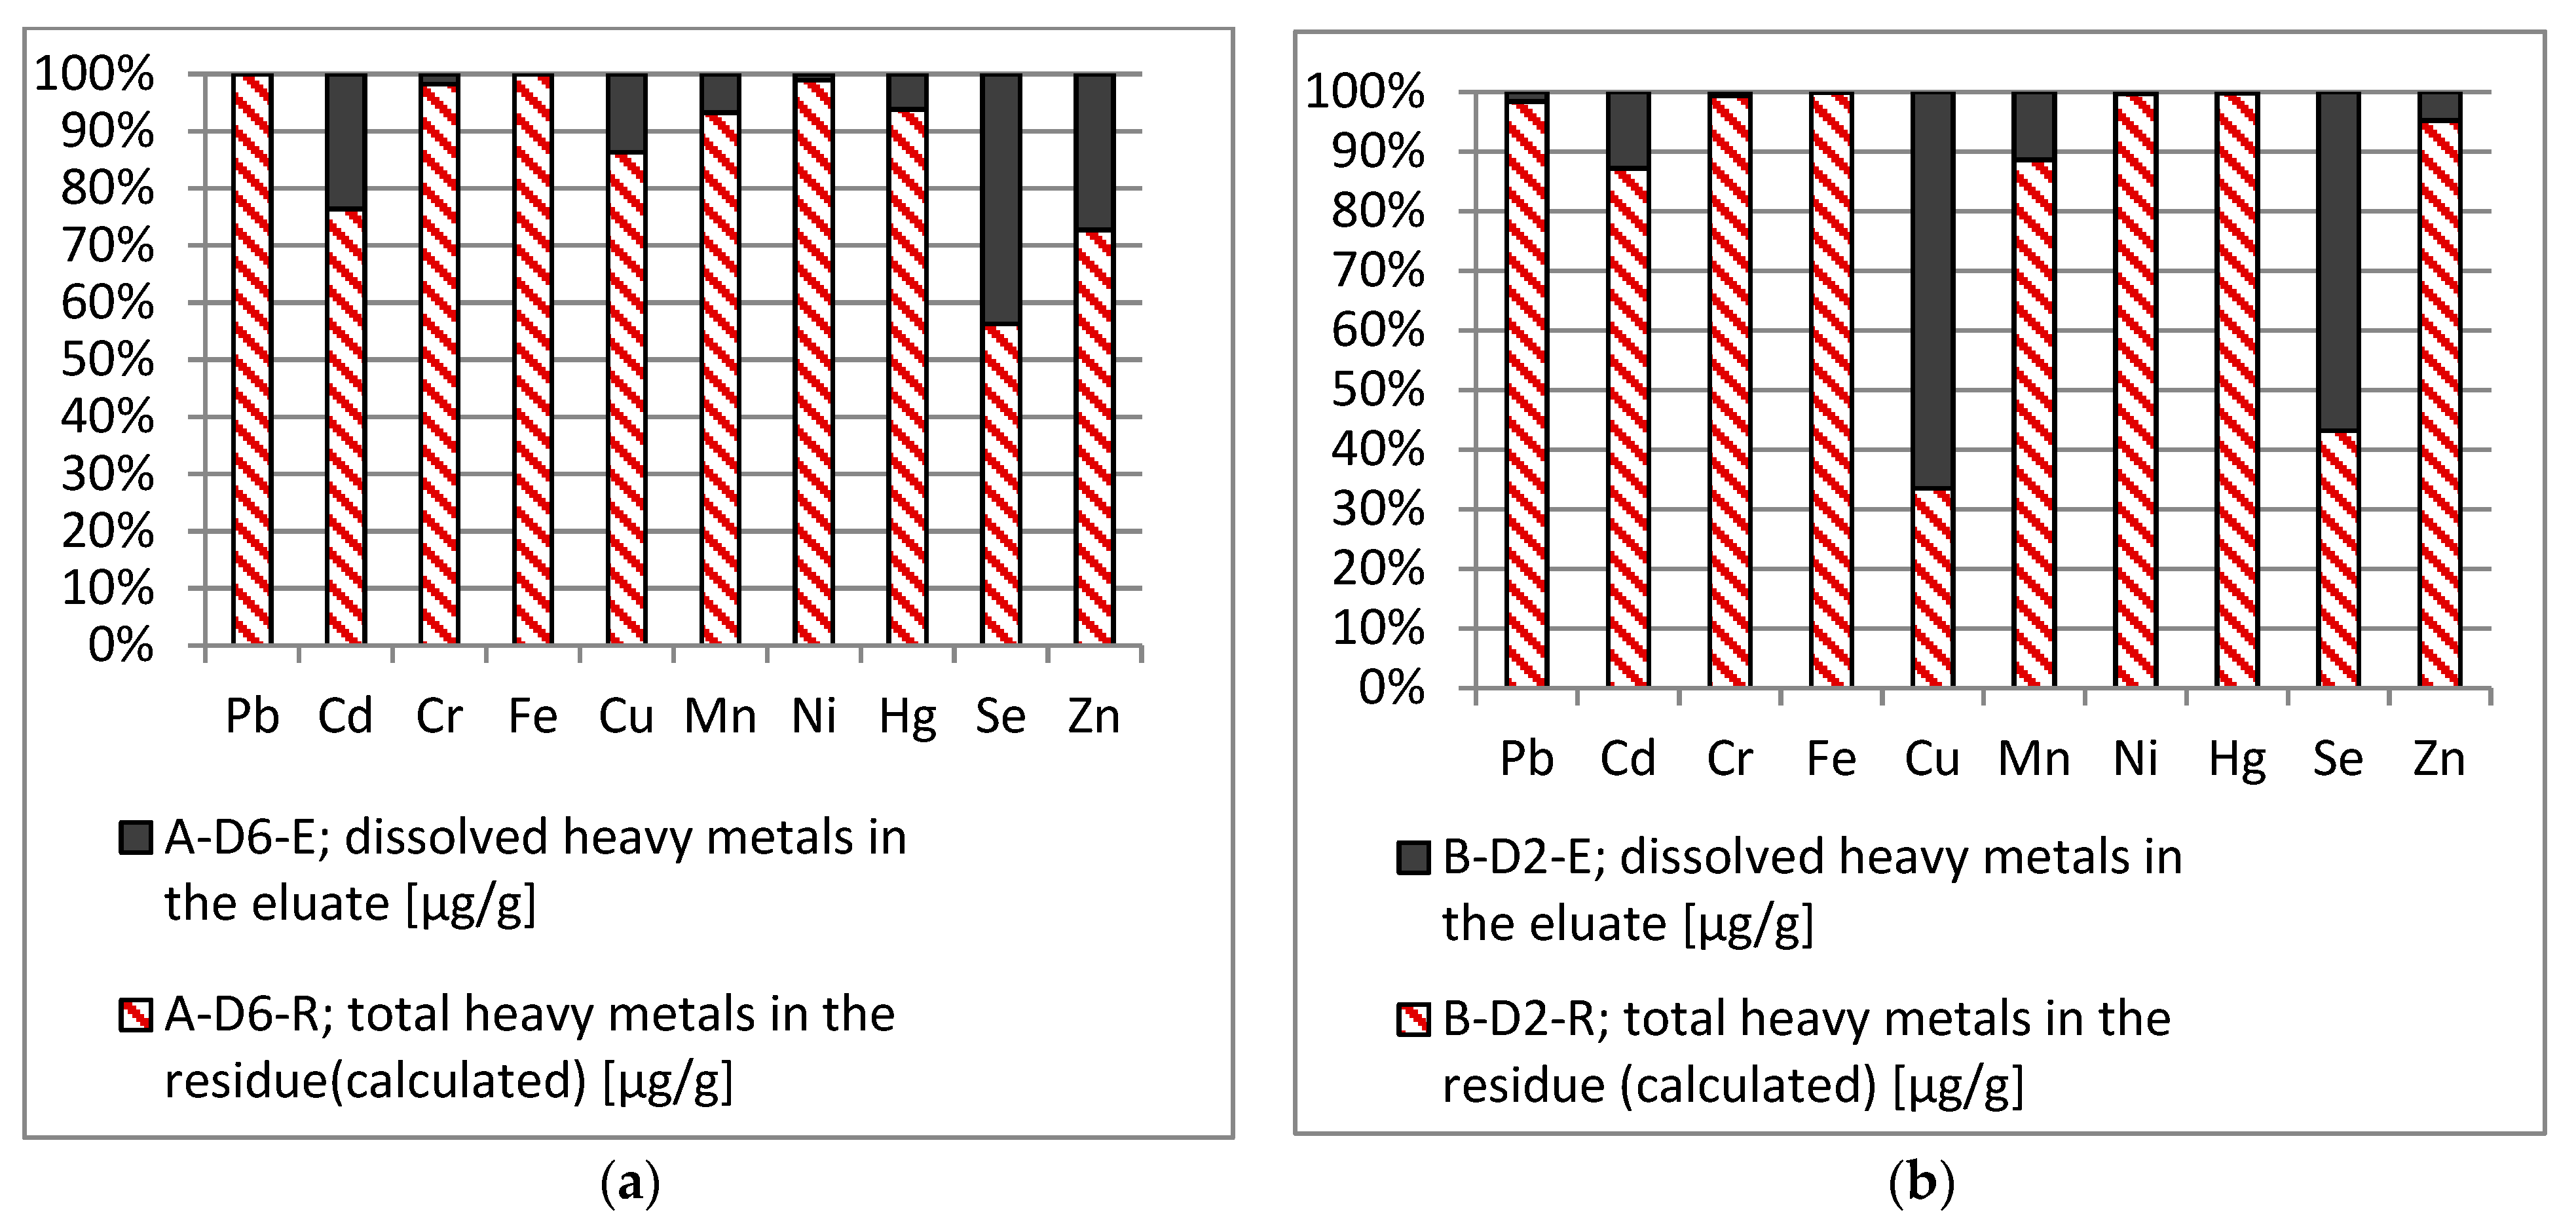
Additionally, for the dissolved fractions, huge differences could be obtained between the plants, except for in Fe and Zn. Although some of the concentrations in the wastewater were high, e.g., Pb and Hg, only a small fraction of heavy metals dissolved, depending on the element. Figure 4 shows the total concentration of heavy metals (100%) in dust A-D6 and B-D2 split up in the dissolved fractions (A-D6-E and B-D2-E) and fractions in the solid residues in %. For this comparison, the results for the dissolved fraction were expressed in µg/L but recalculated and expressed as µg per g based on the solids used for the preparation of the eluate.
Most of the heavy metals remained in the solid phase of A-D6; only Cd, Se and Zn showed more than 20% solubility. In the eluate B-D2-E, a special high solubility of Cu and Se could be observed.
The assessment of different options of reutilization indicates that during water treatment, emissions to surface water have to be expected. Therefore, the concentrations in the different eluates were compared to the emission standards of various countries. These standards are either based on national emission levels or selective permits for the metal industry.
Table 8 shows the emission limits of Korea, Japan, China and Austria compared with the values of the investigated eluates A-D1-E, A-D2-E, A-D3-E, A-D4-E, A-D5-E, A-D6-E, B-D1-E and B-D2-E.
The pH value and the amount of T-P and Ni were below the limit values. All other parameters were prone to exceed the acceptable range and require the development of potential treatment options.
4. Conclusions
- The investigations of MEROS dusts taken from two sources, Plants A and B, at different times showed significant differences for Na, K, Cl and SO4 and only low Fe and Zn concentrations. Zn might not influence the process as the addition is low compared to the feed.
- To increase the benefit of reutilization, washing out of the alkalis with water is a possible treatment step to avoid problems in the blast furnace process and to reduce the amount of dust by 90%. However, the comparison with international guidance values indicated that treatment of the remaining wastewater or eluate will be necessary before it can be emitted to surface waters or sewer systems.
- The solid residue can be recycled into the sinter process to reduce potential PCDD/F attached to the activated carbon, as in the sinter process, temperatures of 1200 °C are reached, which are prone to destroying PCDD/Fs.
- With the removal of the soluble fraction, potential precursors for the formation of PCDD/F and PBDD/F such as Cl and Br are also removed from the residue.
- An open question remains regarding the behavior of Hg, as most of the Hg is attached to the solid residue. Additional studies to investigate the benefits are recommended.
Author Contributions
Conceptualization, M.F., M.G.; data curation, C.H.; funding acquisition, M.G.; investigation, F.O.; writing—review and editing all authors, project administration, M.F. All authors have read and agreed to the published version of the manuscript.
Funding
This research was funded by FFG (Österreichische Forschungsfördergesellschaft) within the COMET Competence Centers for Excellent Technologies—COMET Centre (K1- Met), FFG Project No.: 869295.
Institutional Review Board Statement
Not applicable.
Informed Consent Statement
Not applicable.
Acknowledgments
This study was elaborated within the COMET Competence Centers for Excellent Technologies—COMET Centre (K1- Met) and financially supported by the FFG (Österreichische Forschungsfördergesellschaft).
Conflicts of Interest
The authors declare no conflict of interest.
References
- Cores, A.; Verdeja, L.F.; Ferreira, S.; Ruiz-Bustinza, I.; Mochón, J.; Robla, J.I.; Gasca, C.G. Iron ore sintering. Part 3: Automatic and control systems. DYNA 2015, 82, 227–236. [Google Scholar] [CrossRef]
- El-Geassy, A.A.; Shehata, K.A.; Nasr, M.I.; Fakhoury, S.S. Effect of alkalies on the performance of blast furnace. Trans. Iron Steel Inst. Jpn. 1986, 26, 865–874. [Google Scholar] [CrossRef] [Green Version]
- Qian, L.; Chun, T.; Long, H.; Li, J.; Di, Z.; Meng, Q.; Wang, P. Emission reduction research and development of PCDD/Fs in the iron ore sintering. Process. Saf. Environ. Prot. 2018, 117, 82–91. [Google Scholar] [CrossRef]
- Li, S.; Liu, G.; Zheng, M.; Liu, W.; Li, J.; Wang, M.; Li, C.; Chen, Y. Unintentional production of persistent chlorinated and brominated organic pollutants during iron ore sintering processes. J. Hazard. Mater. 2017, 331, 63–70. [Google Scholar] [CrossRef] [PubMed]
- Li, J.; He, X.; Pei, B.; Li, X.; Ying, D.; Wang, Y.; Jia, J. The ignored emission of volatile organic compounds from iron ore sinter process. J. Environ. Sci. 2019, 77, 282–290. [Google Scholar] [CrossRef] [PubMed]
- Fernández-González, D.; Ruiz-Bustinza, I.; Mochón, J.; González-Gasca, C.; Verdeja, L.F. Iron Ore Sintering: Environment, Automatic, and Control Techniques. Miner. Process. Extr. Met. Rev. 2017, 38, 238–249. [Google Scholar] [CrossRef]
- Sheng, G.; Huang, P.; Mou, Y.; Zhou, C. Characteristics of fly ash from the dry flue gas desulfurization system for iron ore sintering plants. Environ. Technol. 2012, 33, 837–844. [Google Scholar] [CrossRef] [PubMed]
- Fleischanderl, A. MEROS®: An improved dry-type gas-cleaning process for the treatment of sinter offgas. Rev. Métall. 2006, 103, 481–486. [Google Scholar] [CrossRef]
- Primetals. MEROS® Maximized Emission Reduction of Sintering 2020; Primetals Technologies Austria GmbH: Linz, Austria, 2020; p. 16. [Google Scholar]
- Wegener, D.; Finkbeiner, M.; Holst, J.-C.; Olsen, S.I.; Walachowicz, F. Improving Energy Efficiency in Industrial Solutions? Walk the Talk. In Proceedings of the 2011 Risø International Energy Conference, Copenhagen, Denmark, 10–12 May 2011. [Google Scholar]
- Song, M.; Liu, J.; Xu, S. Characterization and solidification/stabilization of iron-ore sintering gas cleaning residue. J. Mater. Cycles Waste Manag. 2014, 17, 790–797. [Google Scholar] [CrossRef]
- Huber, F.; Blasenbauer, D.; Mallow, O.; Winter, F.; Fellner, J. Alternatives Konzept zum Flugaschenmanagement der Stadt Wien. In Mineralische Nebenprodukte und Abfälle 3—Aschen, Schlacken, Stäube und Baurestmassen; TK Verlag Karl Thomé-Kozmiensky: Neuruppin, Germany, 2016. [Google Scholar]
- Roudier, S.; Sancho, L.D.; Remus, R.; Aguado-Monsonet, M. Best Available Techniques (BAT) Reference Document for Iron and Steel Production: Industrial Emissions Directive 2010/75/EU: Integrated Pollution Prevention and Control; JRC Press: Brussels, Belgium, 2013. [Google Scholar]
- Xu, S.; Liu, J.; Song, M. Water-Washing of Iron-Ore Sintering Gas Cleaning Residue for Beneficial Reutilization as Secondary Construction Material. Procedia Environ. Sci. 2012, 16, 244–252. [Google Scholar] [CrossRef] [Green Version]
- Wilson, M.J. A Handbook of Determinative Methods in Clay Mineralogy; Verlag Blackie: London, UK, 1987; p. 308. [Google Scholar]
- Rentz, O.; Schultmann, F.; Spengler, T.; Sieverdingbeck, A.; Engels, B. Prozeßintegrierte Umweltschutzmaßnahme in der Eisen- und Stahlindustrie—Teil 2; Universität Karlsruhe: Karlsruhe, Germany, 1999. [Google Scholar]
- Geerdes, M.; Chaigneau, R.; Lingiardi, O. Modern Blast Furnace Ironmaking: An Introduction, 4th ed; IOS Press: Amsterdam, The Netherlands, 2020. [Google Scholar]
Figure 1.
DOC, T-N and the solid residues of the three dusts and eluates.

Figure 2.
X-ray diffractograms of sample A-D6 after different treatments. Aph = Aphthitalite; Syl = Sylvin; Th = Thenardite; MTh = Metathenardite; Fsp = Feldspar; CC = Calcite; H = Hematite.
Figure 2.
X-ray diffractograms of sample A-D6 after different treatments. Aph = Aphthitalite; Syl = Sylvin; Th = Thenardite; MTh = Metathenardite; Fsp = Feldspar; CC = Calcite; H = Hematite.

Figure 3.
X-ray diffractograms of sample B-D2 after different treatments. Na Sulf = Na2SO4; Anhydr = Anhydrite; Th = Thenardite; Qu = Quartz.
Figure 3.
X-ray diffractograms of sample B-D2 after different treatments. Na Sulf = Na2SO4; Anhydr = Anhydrite; Th = Thenardite; Qu = Quartz.

Figure 4.
Comparison of total and dissolved heavy metals of (a) dust A-D6 (%) and (b) dust B-D2 (%.)
Figure 4.
Comparison of total and dissolved heavy metals of (a) dust A-D6 (%) and (b) dust B-D2 (%.)


Table 1.
Concentration of cations and anions in the eluates of the dusts (dilution 1:10).
| Ions | A-D1-E | A-D2-E | A-D3-E | A-D4-E | A-D5-E | A-D6-E | B-D1-E | B-D2-E |
|---|---|---|---|---|---|---|---|---|
| Cl (mg/L) | 13,000 | 13,000 | 13,000 | 6700 | 10,000 | 14,000 | 3300 | 2900 |
| F (mg/L) | 110 | 110 | 90 | 56 | 60 | 90 | 300 | 300 |
| SO4 (mg/L) | 50,000 | 44,000 | 44,000 | 44,700 | 45,000 | 41,000 | 66,000 | 64,000 |
| NO3-N (mg/L) | 150 | 44 | 34 | n.a. | 46 | 54 | 7.3 | 4.4 |
| Na (mg/L) | 25,000 | 24,000 | 24,000 | 22,900 | 21,000 | 22,100 | 30,500 | 29,900 |
| Mg (mg/L) | 13 | 25 | 18 | 478 | <20 | 26.1 | 2.18 | 2.73 |
| NH4-N (mg/L) | <5 | <5 | <5 | 219 | 91 | 122 | 95 | 92 |
| Ca (mg/L) | 27 | 60 | 100 | 229 | n.a. | 11.5 | 37.4 | 17.2 |
| K (mg/L) | 11,000 | 10,000 | 10,000 | 11,000 | 9500 | 11,100 | 521 | 423 |
n.a.—not analyzed.
Table 2.
Total concentrations (µg/g dust) of Pb, Cd, Cr, Fe, Cu, Mn, Hg, Ni and Zn in three dusts and the LOQ (after digestion).
Table 2.
Total concentrations (µg/g dust) of Pb, Cd, Cr, Fe, Cu, Mn, Hg, Ni and Zn in three dusts and the LOQ (after digestion).
| Total Heavy Metals | A-D1 | A-D1 | A-D6 | B-D1 | B-D2 | LOQ |
|---|---|---|---|---|---|---|
| Pbtot (µg/g) | 1510 | 3470 | 3970 | 7.7 | 4.7 | 0.08 |
| Cdtot (µg/g) | 12.1 | 27 | 50 | 0.37 | 0.25 | 0.002 |
| Crtot (µg/g) | 3.7 | 5.1 | 10.1 | 9.1 | 7.4 | 0.05 |
| Fetot (µg/g) | 3000 | 4900 | 7280 | 877 | 864 | 0.2 |
| Cutot (µg/g) | 110 | 136 | 78.1 | 4.7 | 5.1 | 0.06 |
| Mntot (µg/g) | 158 | 249 | 340 | 34.5 | 41.5 | 0.01 |
| Hgtot (µg/g) | 180 | 319 | 385 | 92.5 | 96 | 0.012 |
| Nitot (µg/g) | 0.58 | 0.83 | 1.4 | 9.6 | 7.4 | 0.04 |
| Zntot (µg/g) | 253 | 207 | 259 | 506 | 271 | 0.12 |
LOQ: Limits of Quantification.
Table 3.
Comparison of MEROS dust samples data in the literature.
| Heavy Metals | MEROS-FGD [7] | MEROS [11] | A-D6 | B-D2 |
|---|---|---|---|---|
| Pbtot (µg/g) | 387 | 2437 ± 76 | 3970 | 4.7 |
| Crtot (µg/g) | 4 | - | 10.1 | 7.4 |
| Cutot (µg/g) | - | 95 ± 3 | 78.1 | 5.1 |
| Fetot (µg/g) | - | 7301 ± 249 | 7280 | 864 |
| Mntot (µg/g) | - | 117 ± 6 | 340 | 41.5 |
| Setot (µg/g) | - | 76 ± 4 | 48.5 | 120 |
| Zntot (µg/g) | - | 154 ± 8 | 259 | 270 |
Table 4.
Results of the XRD investigation and semiquantitative assessment.
| Material | A-D6 | A-D6 (550 °C) | A-D6-R | A-D6-R (550 °C) | A-D6-E |
|---|---|---|---|---|---|
| Amorphous Material | *** | *** | |||
| (K0,2Na0,8)Cl + KCl (Sylvin) | ** | ** | |||
| NaCl | ** | ** | * | * | 11% |
| Ca (SO4) (Anhydrite) | traces | traces | |||
| Ca(OH)2 | traces | ||||
| CaF2 | traces | traces | traces | ||
| CaCO3 (Calcite) | * | * | |||
| Ca5 [F/OH(PO4)3] | traces | ||||
| Fe2O3 (Hematite) | traces | traces | * | traces | |
| Fe3O4 | traces | traces | |||
| NaK3 (SO4)2 (Aphthitalite) | * | * | 33% | ||
| Feldspar | * | * | |||
| SiO2 (Quartz) | traces | traces | |||
| MgCa (CO3)2 | * | ||||
| Mica | traces | ||||
| Na2SO4 (Thenardite) | traces | 55% | |||
| Na2SO4 (Metathenardite) | * |
Table 5.
Results of the XRD investigation and semiquantitative assessment (continued).
| Material | B-D2 | B-D2 (550 °C) | B-D2-R | B-D2-R (550 °C) | B-D2-E |
|---|---|---|---|---|---|
| Amorphous material | *** | *** | |||
| Na2SO4 | ** | *** | * | ** | |
| α-Na2SO4 (Thenardite) | * | 96% | |||
| Na2SO4 (Metathenardite) | ** | ||||
| NaCl | * | * | 3% | ||
| Ca (SO4) (Anhydrite) | traces | traces | 1% | ||
| Fe2O3 (Hematite) | traces | traces | |||
| Fe3O4 | traces | traces | |||
| SiO2 (Quartz) | * | ** | |||
| Ca5 [F/OH(PO4)3] | traces |
Table 6.
Dust content and contribution to the total sinter of untreated or treated dust.
| Salt | Dust Content mg/g | Direct Reuse of the Dust Add-on g/t to Sinter Raw Material | Reuse after Treatment Add-on g/t to Sinter Raw Material |
|---|---|---|---|
| K | 123 | 583 | 19.6 |
| Na | 248 | 1175 | 14.4 |
| Zn | 0.3 | 1.2 | 0.9 |
Table 7.
Dissolved concentrations (µg/L eluate) of Pb, Cd, Cr, Fe, Cu, Mn, Hg, Ni and Zn of three dusts and the LOQ (in water).
Table 7.
Dissolved concentrations (µg/L eluate) of Pb, Cd, Cr, Fe, Cu, Mn, Hg, Ni and Zn of three dusts and the LOQ (in water).
| Dissolved Heavy Metals | A-D1-E | A-D3-E | A-D6-E | B-D1E | B-D2-E | LOQ |
|---|---|---|---|---|---|---|
| Pbdis (µg/L) | 3190 | 519 | 308 | 7.7 | 7.5 | 0.5 |
| Cddis (µg/L) | 143 | 1220 | 1180 | 4.2 | 3.2 | 0.05 |
| Crdis (µg/L) | 40.7 | 5.5 | 18 | 2.2 | 4.4 | 0.5 |
| Fedis (µg/L) | 74.3 | 93.5 | 172 | 111 | 46.6 | 5.0 |
| Cudis (µg/L) | 1210 | 148 | 1070 | 350 | 339 | 1.0 |
| Mndis (µg/L) | 932 | 3950 | 2290 | 312 | 471 | 0.5 |
| Hgdis (µg/L) | 3400 | 13,000 | 2380 | 19.7 | 21.9 | 0.1 |
| Nidis (µg/L) | 1.2 | 1.8 | 1.5 | 5.2 | 2.6 | 2.0 |
| Zndis (µg/L) | 154 | 4890 | 7070 | 3440 | 1290 | 6.0 |
Table 8.
Comparison of the emission standards and threshold values with the dust samples.
| Parameter | Korea | Japan | China | Austria | Dust Samples |
|---|---|---|---|---|---|
| pH | 5.8–8.6 | 6.5–9 | 5–9 | 6.5–8.5 | 8–8.5 |
| TOC (mg/L) | 15 | <20 | 15–95 | ||
| T-N (mg/L) | 20 | 119.6 | 45 | 130–203 | |
| T-P (mg/L) | 1 | <14.5 | <63 | <LOQ–0.53 * | |
| Cr (mg/L) | <2 | <2 | 0.5 | 0.0022–1.76 | |
| Fe (mg/L) | <10 | <1 | 2.0 | 0.0058–1.25 | |
| Zn (mg/L) | 5 | <4.5 | 1.0 | 0.15–7.1 | |
| Cd (mg/L) | <0.1 | 0.1 | 0.00024–1.22 | ||
| Hg (mg/L) | <0.005 | <0.11 | 0.005 | 0.02–13 | |
| As (mg/L) | <0.25 | <0.011 | 0.08–0.28 | ||
| Pb (mg/L) | <0.5 | 0.5 | 0.01–3.2 | ||
| Cu (mg/L) | <3 | 0.5 | 0.07–1.2 | ||
| F (mg/L) | <15 | <40 | 30 | 56–300 | |
| Ni (mg/L) | <3.0 | 0.0012–0.0052 | |||
| Mn (mg/L) | <10 | <1 | <0.9 | 0.31–4.0 |
* PO4-P measured.
Publisher’s Note: MDPI stays neutral with regard to jurisdictional claims in published maps and institutional affiliations. |
© 2021 by the authors. Licensee MDPI, Basel, Switzerland. This article is an open access article distributed under the terms and conditions of the Creative Commons Attribution (CC BY) license (https://creativecommons.org/licenses/by/4.0/).
Share and Cite
MDPI and ACS Style
Hledik, C.; Goetz, M.; Ottner, F.; Fürhacker, M. MEROS Dust Quality of Different Plants and Its Potential Further Uses. Metals 2021, 11, 840. https://0-doi-org.brum.beds.ac.uk/10.3390/met11050840
AMA Style
Hledik C, Goetz M, Ottner F, Fürhacker M. MEROS Dust Quality of Different Plants and Its Potential Further Uses. Metals. 2021; 11(5):840. https://0-doi-org.brum.beds.ac.uk/10.3390/met11050840
Chicago/Turabian StyleHledik, Claudia, Martin Goetz, Franz Ottner, and Maria Fürhacker. 2021. "MEROS Dust Quality of Different Plants and Its Potential Further Uses" Metals 11, no. 5: 840. https://0-doi-org.brum.beds.ac.uk/10.3390/met11050840
Note that from the first issue of 2016, this journal uses article numbers instead of page numbers. See further details here.