Article

Effect of Gas Bubbling Filtration Treatment Conditions on Melt Quality of AlSiMgCu Alloy

1
Advanced Forming Process R&D Group, Korea Institute of Industrial Technology, Ulsan 44776, Korea
2
School of Materials Science and Engineering, Pusan National University, Busan 46241, Korea
*
Authors to whom correspondence should be addressed.
Submission received: 23 April 2021 / Revised: 11 May 2021 / Accepted: 17 May 2021 / Published: 20 May 2021

Abstract

:
In this study, the optimal conditions of gas bubbling filtration (GBF) treatment for securing highly-clean molten Al-Si-Mg-Cu alloy were identified. The effects of GBF treatment time and stabilization time on the degree of molten metal cleanliness were examined by measuring melt quality parameters such as density index, bifilm index, porosity, and the amount of dissolved hydrogen [H]. A high melt quality was achieved when GBF treatment was performed on 10 kg melt for more than 10 min (i.e., 1 L gas/kg melt). However, as the stabilization holding time after GBF treatment increased to 10, 20, and 30 min, the melt quality degraded. GBF treatment for 30 min had a similar effect to treatment for 10 min, and the degree of deterioration of melt quality during the stabilization time was also similar. Considering the economics, 10 min GBF treatment and short holding time are required. Observations of the shape and volume of the largest pore suggested the cause of defect formation and confirmed that the volume of the largest pore can be used as an index of the melt quality.

1. Introduction

Cast aluminum (Al) products generally have internal defects caused mainly by inclusions, hydrogen, and shrinkage. Inclusions are mainly oxides formed from the molten Al alloys, scraps, flux, and tools. Hydrogen is generated in molten Al alloy by reaction of moisture on the flux, crucibles, refractories, raw materials, and casting tools [1,2]. The temperature in molten metal greatly affects hydrogen solubility [3]; in liquid pure Al at 600 °C, it is 0.7 mL/100 g Al, whereas in solid Al it is only 0.042 mL/100 g Al. As a result of this difference, hydrogen is expelled during solidification, and forms hydrogen pores in the product [2]. The shrinkage flaws are a result of the difference in the densities of the solid and liquid phase of Al alloys, which causes of ~7% volume reduction during solidification of Al alloy melt [4]; this volume reduction results in a 5~6% shrinkage cavity.
The removal of impurities and hydrogen gas from Al alloy melt is generally performed during casting to secure a high-quality of molten metal and to reduce the number of major internal cast defects. Various methods for treatment of molten metal have been developed such as GBF (Gas Bubbling Filtration) [5,6,7,8], spray degassing [9], filtering by ceramic foam filters [10,11], gas or powder fluxing according to the state of reactant [12], and ultrasonic treatment [13]. Gas Bubbling Filtration (GBF) was invented by Showa Aluminum in 1977 and is one of the most common methods to secure high-quality molten metal [14]. GBF treatment introduces argon or nitrogen gas from the bottom of the bath and uses a rotating impeller to generate strong turbulence and a uniform distribution of fine bubbles throughout the melt. These bubbles lift dissolved hydrogen and inclusions to the surface of the melt. This process achieves final hydrogen levels of 0.05–0.12 cm3/100 g Al, and eliminates up to 90% of nonmetallic impurities [12,14].
The purification success depends on the geometry of the impellers and the GBF processing parameters, such as flow rate of gas and rotary impeller speed, which influence the gas dispersion and the efficiency of the refining process. The flow pattern of gas bubble dispersion in gas liquid mixture has been investigated by several methods [15,16,17]. The observed flow pattern of gas dispersion has been used to build several physical water models, and to investigate the effect of impeller geometry and processing parameters on the uniformity of gas dispersion [18,19,20]. Experimental research has been performed to optimize the processing parameters and improve the mechanical properties of cast product in the foundry. Process variables of GBF treatment have varying effects on the tensile properties and porosity of commercial A384 alloy [21]; optimized parameters yielded grain refinement in the microstructure of the cast product and improvement in the defect susceptibility of tensile properties to microporosity variation. Ultimate tensile strength (UTS) and elongation of A356 alloy were improved to approximately 30 MPa and 1.5% after GBF treatment with optimal conditions of degassing time, impeller rotation and size of gas inlet hole [5]. Optimal degassing time and stabilization/holding time at GBF treatment allow time for inert purge bubbles to degas and escape through the melt surface, and therefore, to achieve a high-quality melt with the desired low level of hydrogen and inclusions. In Al-Si-Mg-Cu alloys especially, the quantity of impurities must be controlled during the casting stage to achieve age hardening during heat treatment after rolling.
In this study, the effects of degassing time and stabilization time at the GBF process on the melt quality of Al-Si-Mg-Cu alloy were characterized by measuring melt quality parameters (Density Index (DI), Bifilm Index (BI), porosity, maximum pore volume, and dissolved hydrogen content ([H])). The shapes of pores and the oxides in the cast sample were observed to understand the defects and inclusions in the molten metal. Use of optimal conditions for GBF treatment of Al-SI-Mg-Cu alloy can ensure high cleanliness of molten metal in the shortest time possible, at the lowest cost.

2. Materials and Methods

Al-Si-Mg-Cu alloy (Table 1) was melted in an electric resistance furnace (ThermAll Co., Ltd., Yangju, Korea) in air. The relative humidity of laboratory was kept constant at about 50%, and special care was taken to prevent the moisture in the air and tools from entering the molten metal. Samples of molten metal (10 kg) were maintained at 800 °C for 10 min, and then the GBF treatments were performed with various degassing times and holding times at that temperature. The instantaneous temperature drops of the melt due to the Ar gas injection at the beginning of GBF treatment was less than 10 °C, and the melt temperature was maintained at 800 °C during the stabilization time. In GBF treatment, the gas flow rate was 1 L/min using Ar gas. The rotation speed of the impeller was fixed at 300 RPM. The conditions of GBF degassing time were: ungassed (nonGBF), 1 min (1minGBF), 10 min (10minGBF), and 30 min (30minGBF), so the gas amount per unit weight of melt were 0.1 L/kg, 1.0 L/kg, and 3.0 L/kg, respectively. Then stabilization treatment was followed with holding times of 0 min (0minS), 10 min (10minS), 20 min (20minS), and 30 min (30minS). The GBF processing conditions were designed by consulting previous studies [5,14,21,22,23,24,25]. The dross on the surface of the molten metal was removed after GBF and stabilization treatment.
To assess how GBF treatment and stabilization affected melt quality, a Straube-Pfifer Reduced Pressure Test (RPT) was used for the Al-Si-Mg-Cu alloy after GBF treatment. This RPT shows the qualitative cleanliness of the molten metal; the information relates to both the inclusion and hydrogen in the melts [26]. For the RPT, molten metal samples of 80~100 g were solidified at atmospheric pressure or at a reduced pressure of 80 mbar. The density (g/cm3) of RPT samples was determined using the Archimedes principle, then the Density Index (DI) was obtained as:
DI = ρ 1 ρ 2 ρ 1 × 100
where ρ 1 is the density of the sample cast at atmospheric pressure, and ρ 2 is the density of the sample cast at 80 mbar.
The bifilm Index (BI) and the number of pores (NP) were measured from the tomographic images of cross-sections of the RPT samples, which were obtained using X-ray CT analysis. The maximum diameter of the pores formed in the cross-section was assumed to be the pole length, and BI (mm/100 g) was calculated as [27]:
BI = Σ (pore length)
BI measures the size of the pores in the cross-section, so the result can vary depending on the selected cross section and the number of sections. To determine the effect of sample size on BI, it was measured for 1, 3, and 5 sections. The values that represent melt quality, such as DI, BI, porosity, and number of pores NP, were compared to each other.
The amount ([H]) of hydrogen dissolved in the molten alloys was measured using the CLR method (ABB Inc., Quebec, QC, Canada). Measurement of [H] was performed for 30 min before GBF and after stabilization for 30 min, and each measurement was repeated three times for 10 min each. Defects in the RPT samples such as the maximum pore volume, the porosity, and the shape of pores were observed using a 3D X-ray computed tomography (240 kV X-ray, resolution—29 m; XTH320, Nikon, Tring, UK). Field emission scanning electron microscopy (JEOL JSM-7600, Tokyo, Japan) and energy spectroscopy were used to identify the oxides and inclusions of pores formed in the RPT samples.

3. Results and Discussion

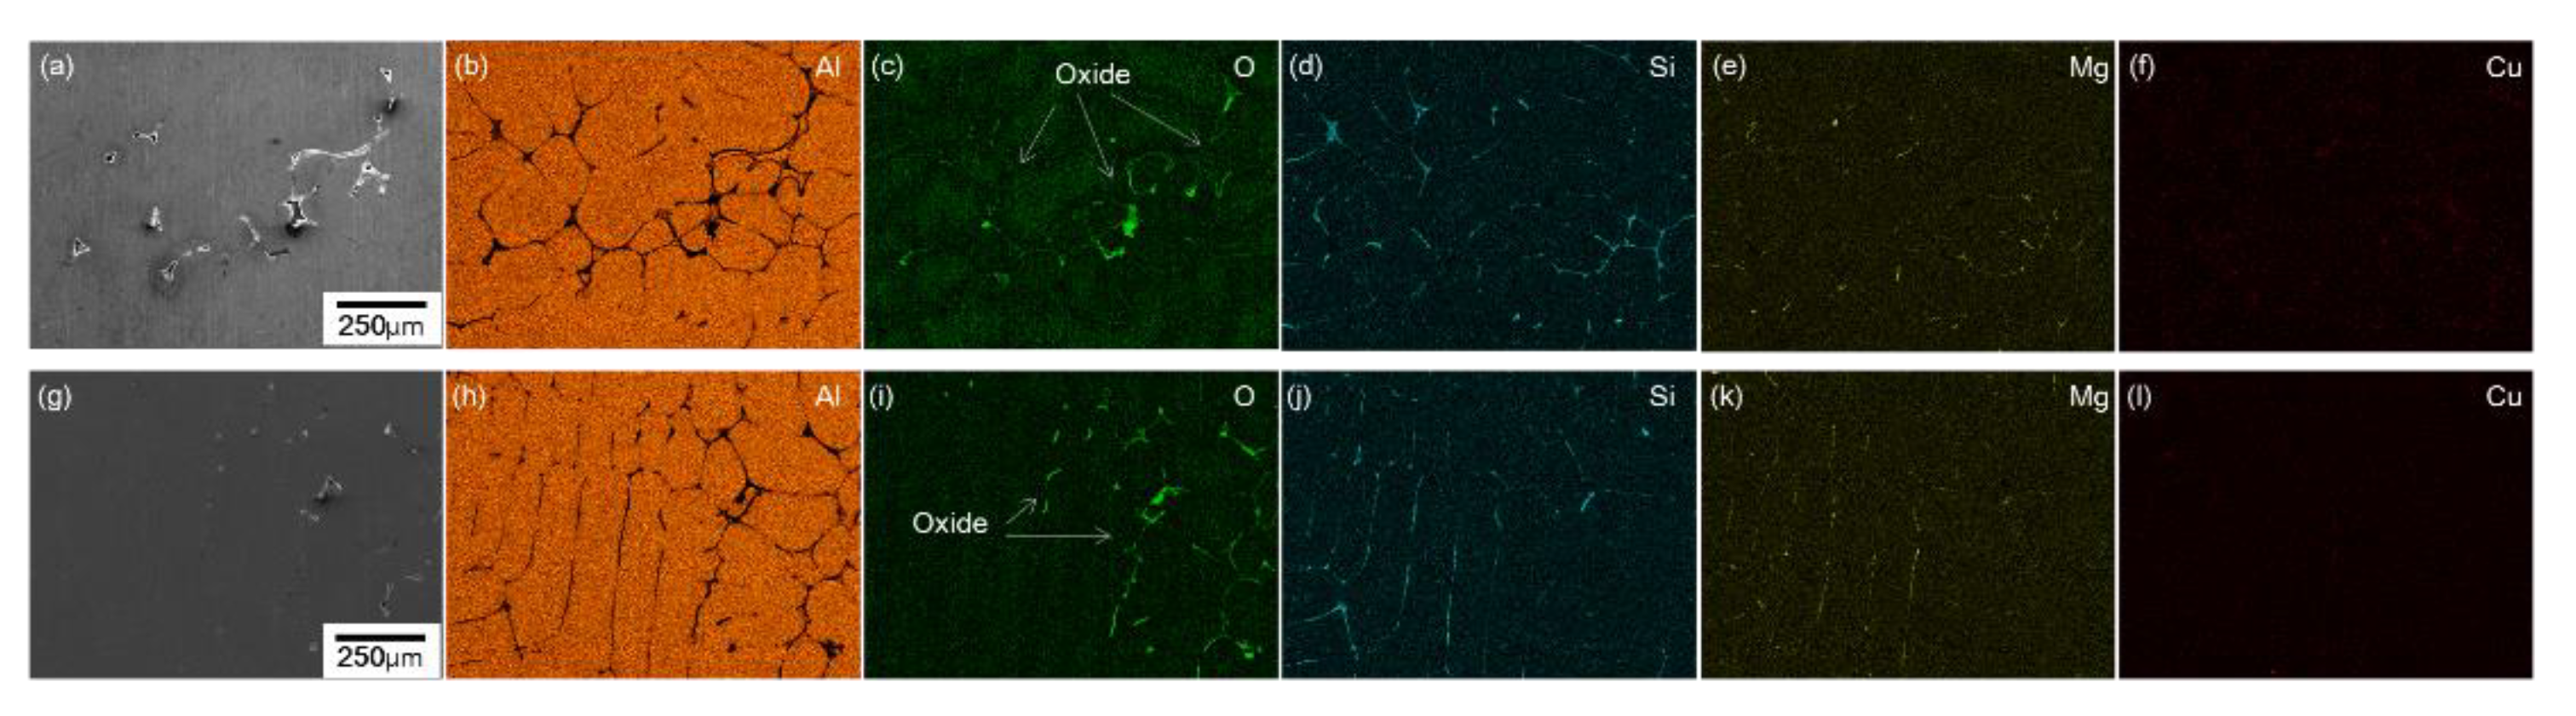
3.1. Melt Quality of Al-Si-Mg-Cu Alloy after GBF Treatment

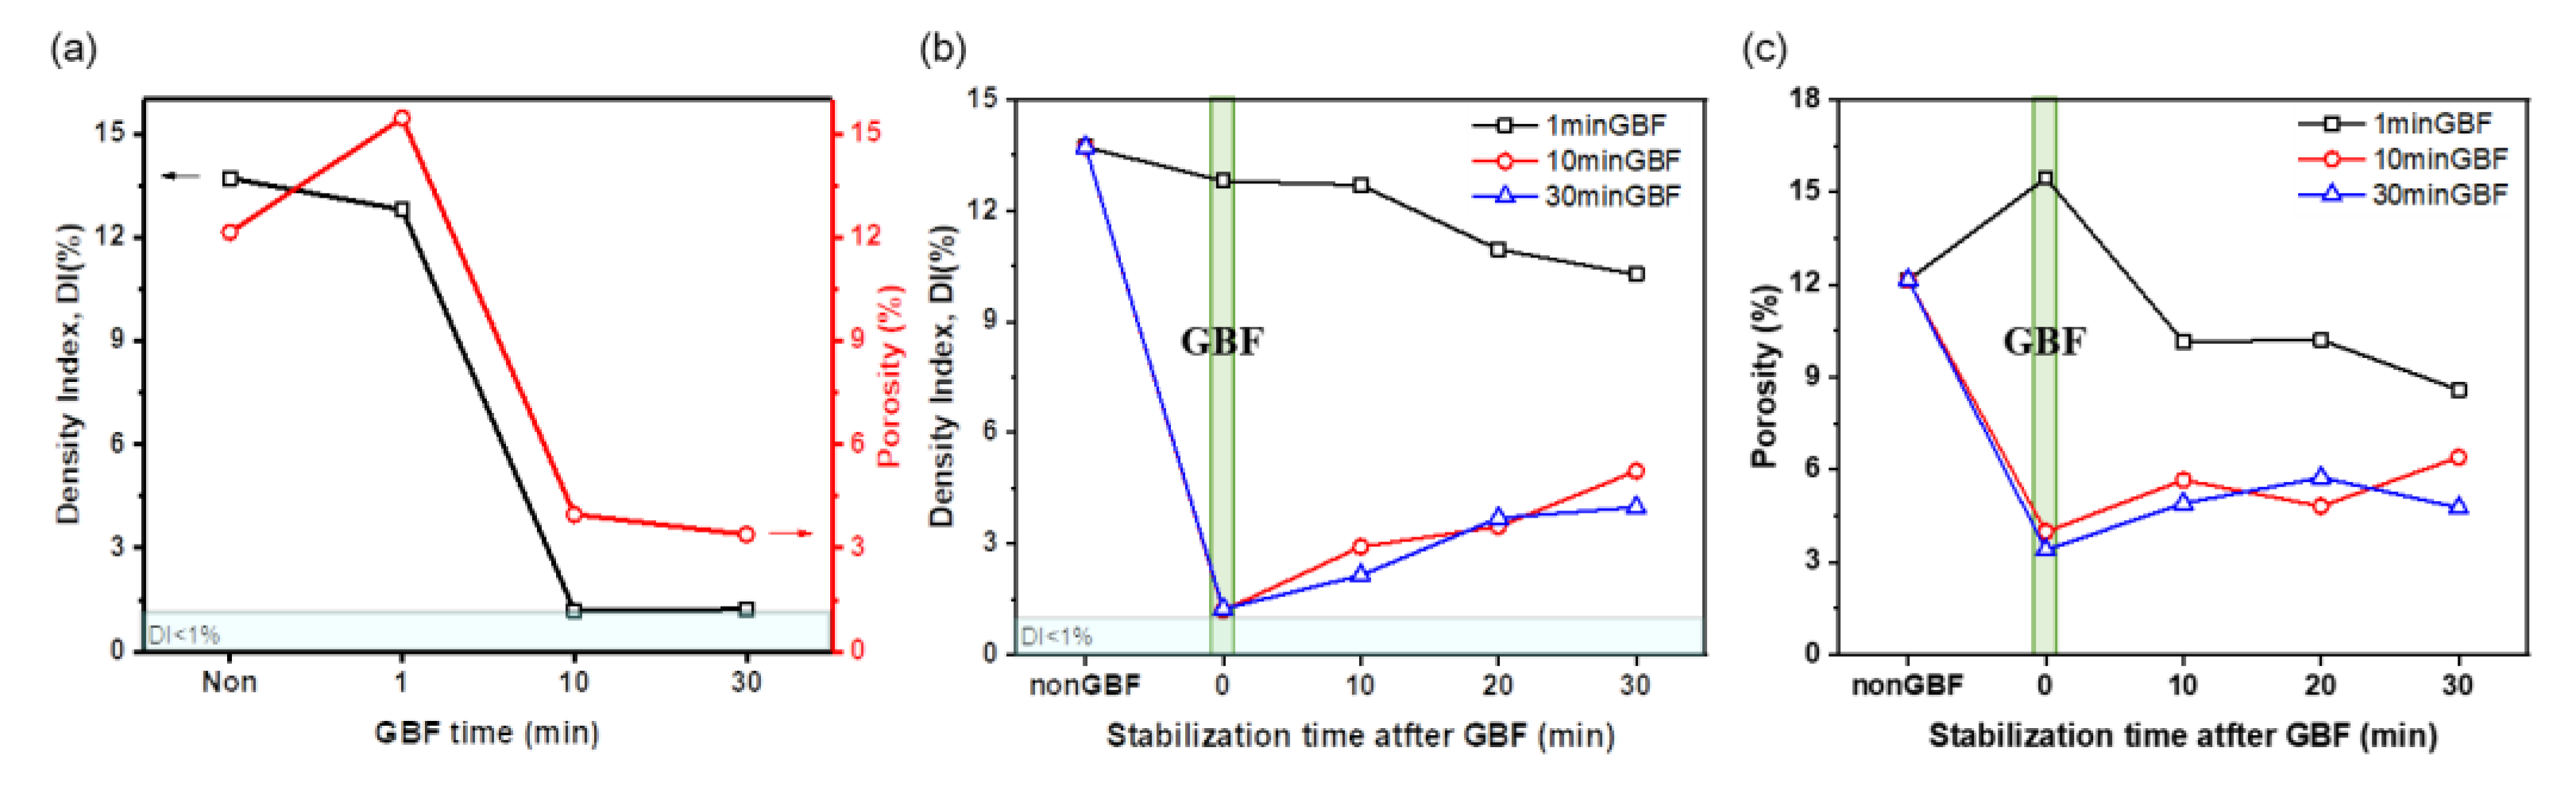
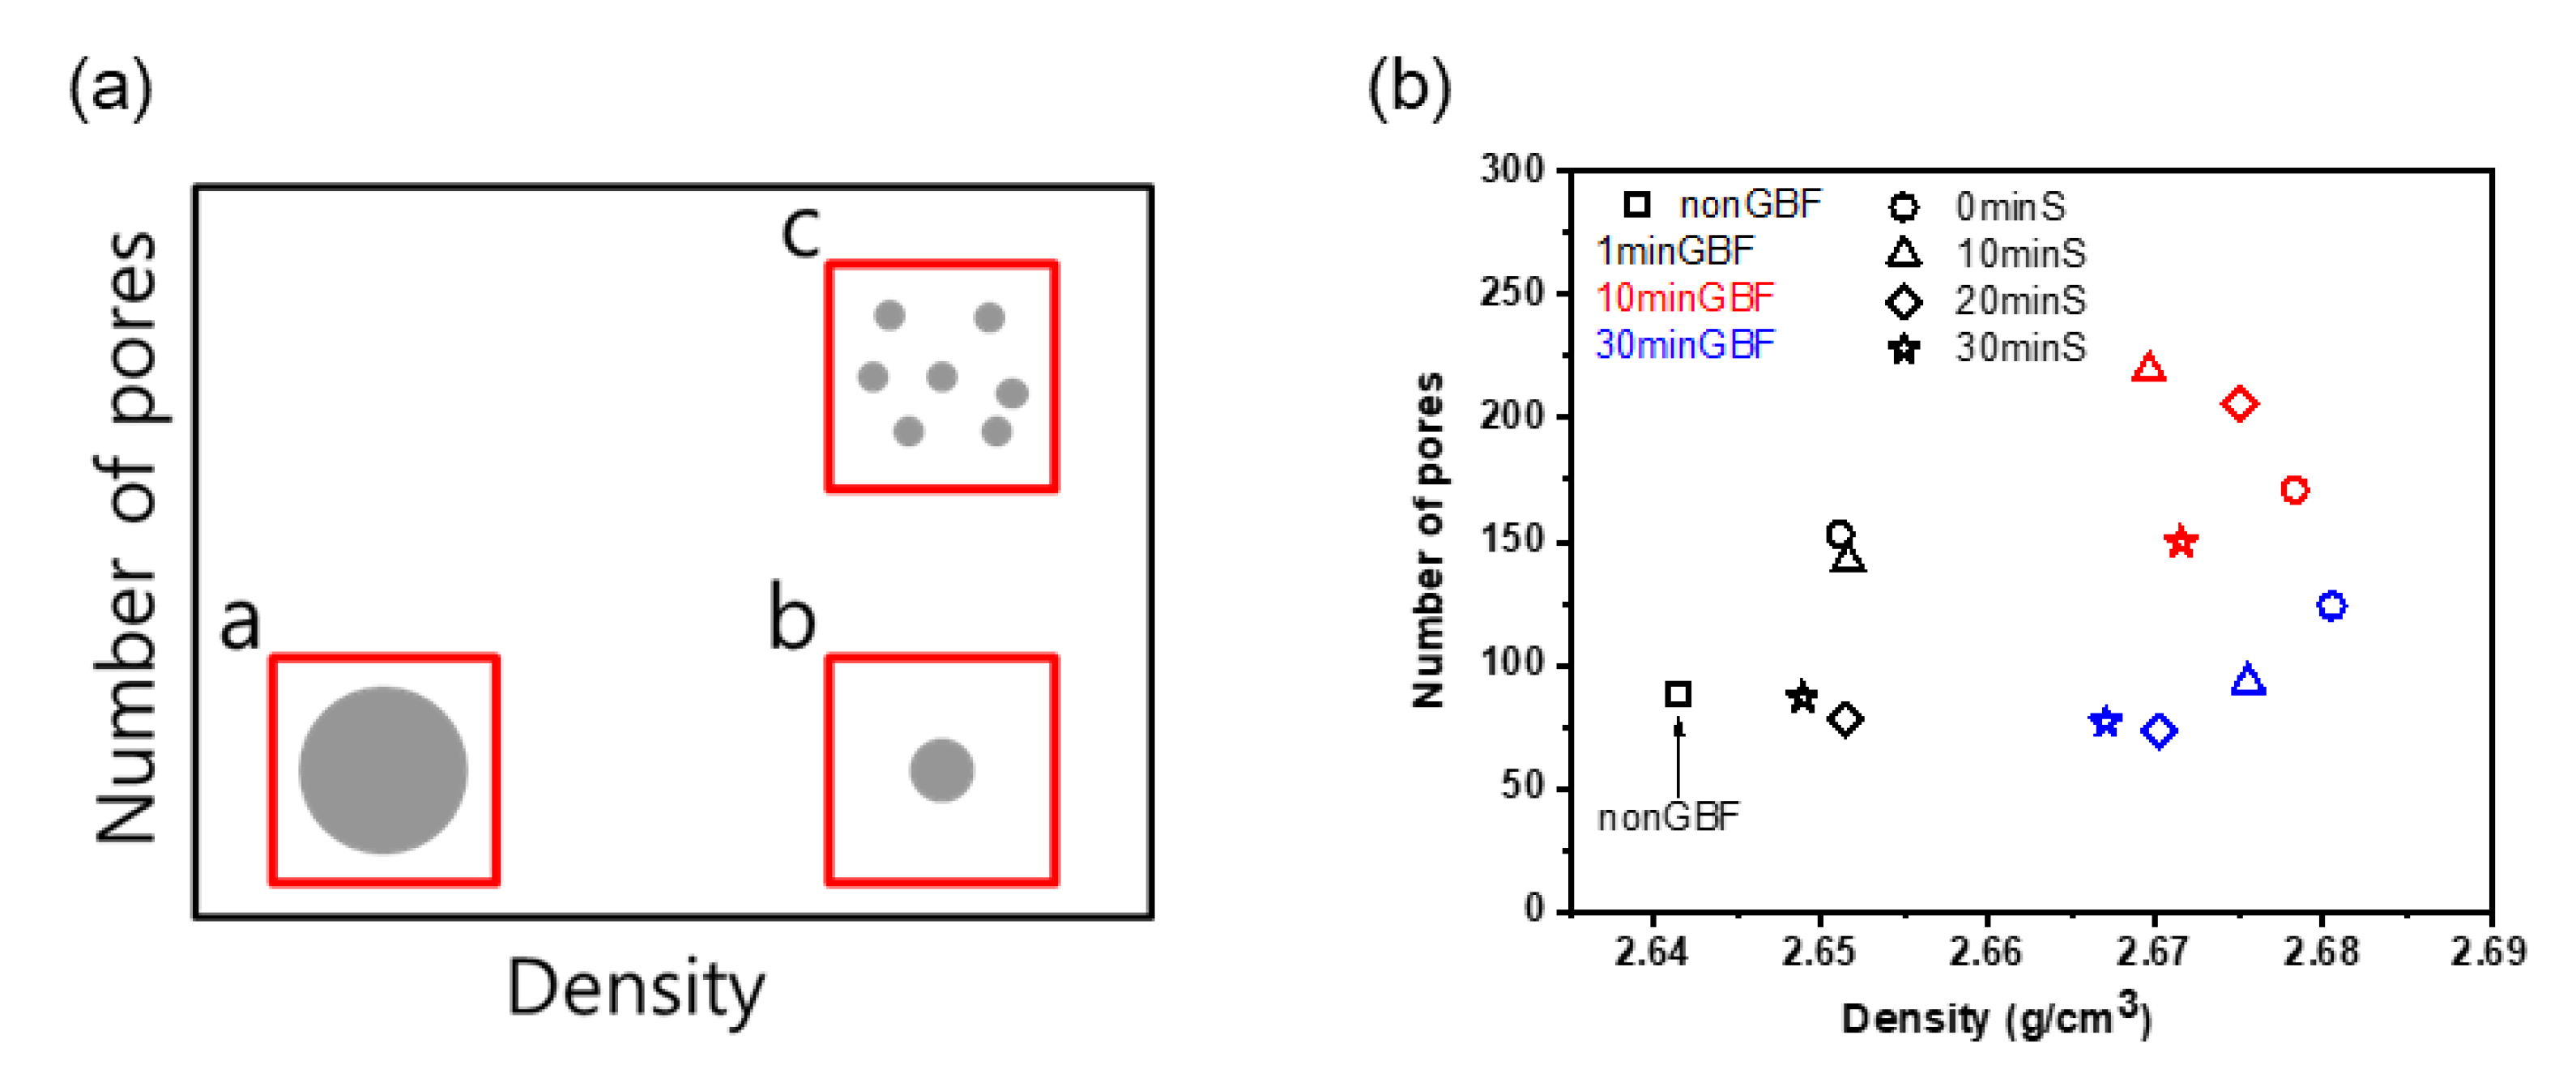
3.1.1. Effects of GBF Conditions on Density Index and Porosity

Melt quality of Al-Si-Mg-Cu alloy at 800 °C before and after GBF treatment was evaluated by using DI and pore analysis (Figure 1). DI and porosity of the RPT samples showed the same trends after GBF treatment (Figure 1a). The 1minGBF RPT sample showed little improvement or degradation in melt quality compared to nonGBF sample. In the 10minGBF and 30minGBF samples, melt quality of the alloy improved and the samples had DI <1, which is the value required in the industry. In the 1minGBF RPT sample, the DI decreased as stabilization time increased, but remained >1 (Figure 1b). Although the 10minGBF and 30minGBF samples initially achieved DI <1, it increased as subsequent stabilization time increased.
X-ray Computed Tomography (CT) images of RPT samples showed defects in the sample and showed the same trends with DI and porosity according to GBF time and stabilization time (Figure 2). The results of DI, porosity, and inner defects show that GBF treatment for 1 min has no effect on the melt quality of Al-Si-Mg-Cu alloy even after some stabilization time. DI and porosity of 10minGBF and 30minGBF samples increase during stabilization; this trend indicates that the melt quality declines during stabilization process, and is in contrast to the general result that the melt quality is high after GBF treatment and then improves or does not change with stabilization time [28]. During the stabilization time, the sizes of defects in the specimen tended to increase rather than creating new small defects. These results indicate that the reduction of melt quality during stabilization time may result from the re-dissolution of hydrogen and diffusion of the residual hydrogen in the melt rather than by regeneration of inclusions at the high temperature of 800 °C. The hydrogen re-dissolution in the melt is highly affected by the state of the oxide films on the melt surface (aluminum dross) and melt conditions. The aluminum dross was formed on the melt surface during melting and GBF treatment, and the dross covering the melt was partially destroyed due to the vortex and turbulence during GBF treatment. There was little difference in the state and amount of the dross according to the GBF treatment time. The dross was removed after GBF treatment, and thin oxide films were formed again during the stabilization process. The newly exposed surface of the molten metal after GBF and the high temperature of the melt during stabilization process may make the re-dissolution of hydrogen dominate in the melt over the floating of bubbles with the internal hydrogen and inclusions. It may cause the decrease in the melt quality during the stabilization time. It should be mentioned that the defects smaller than CT resolution 29 m cannot be measured and this may lead to an error for the defect analysis.

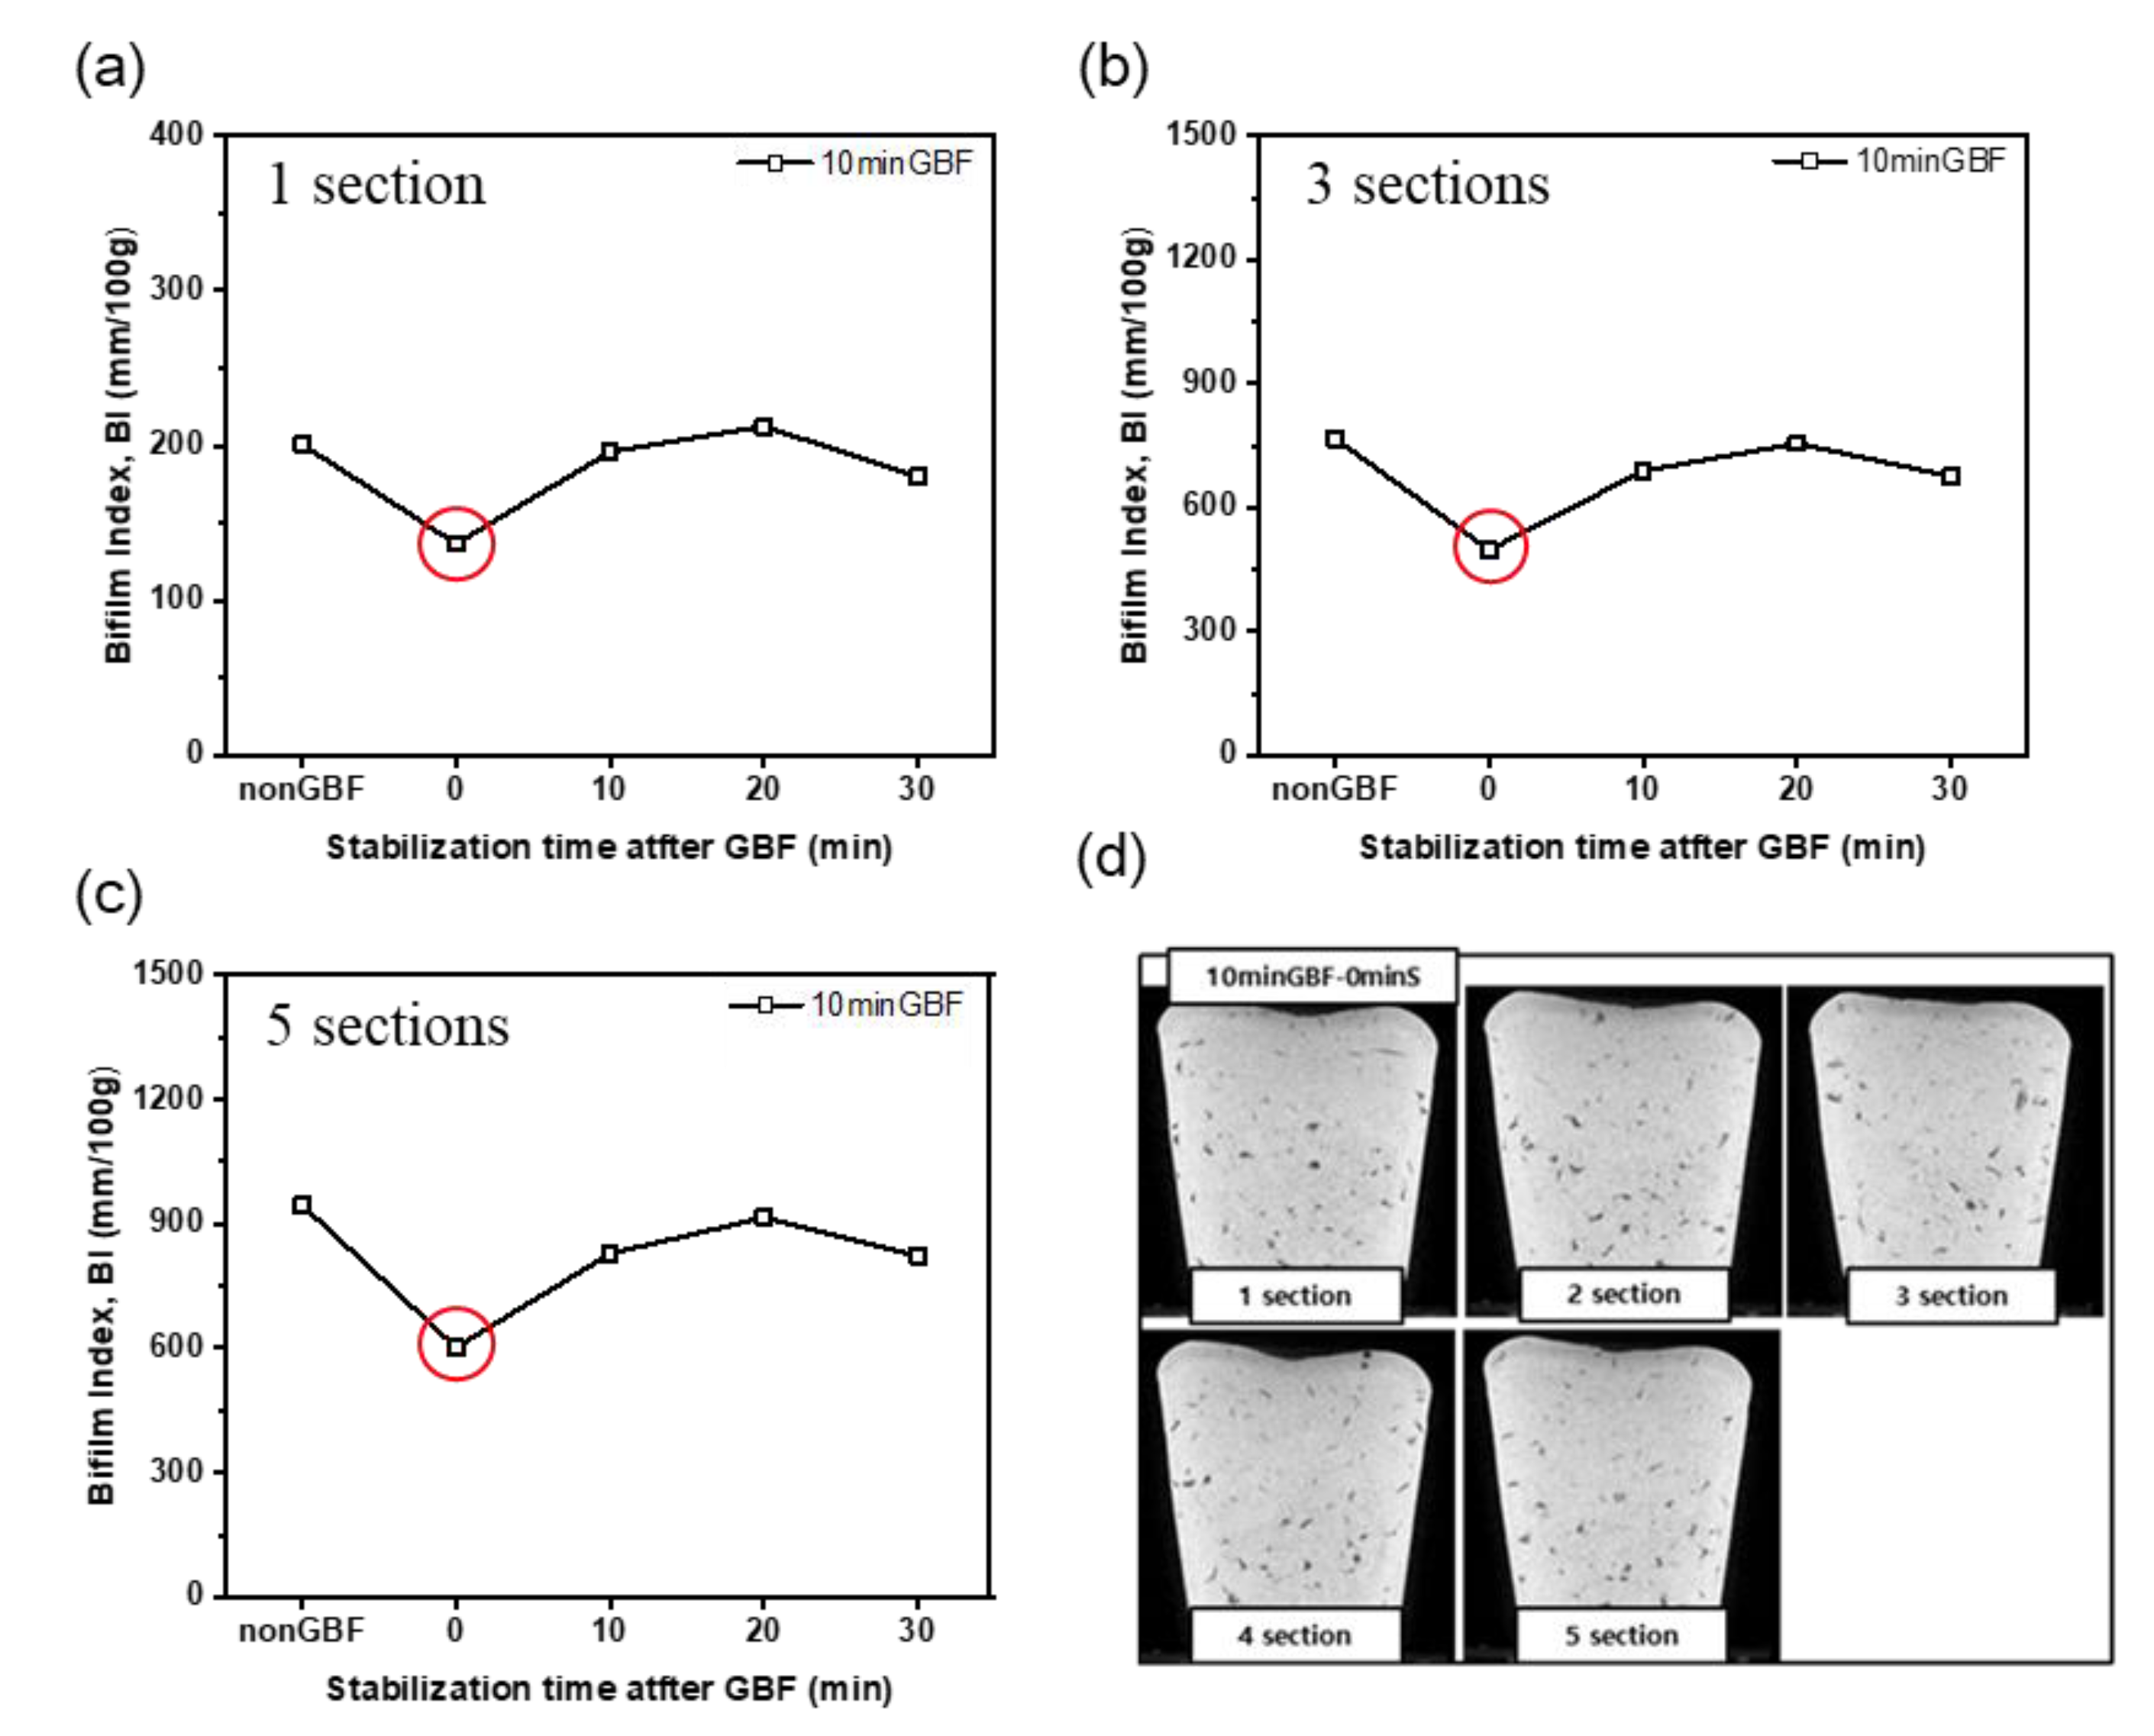
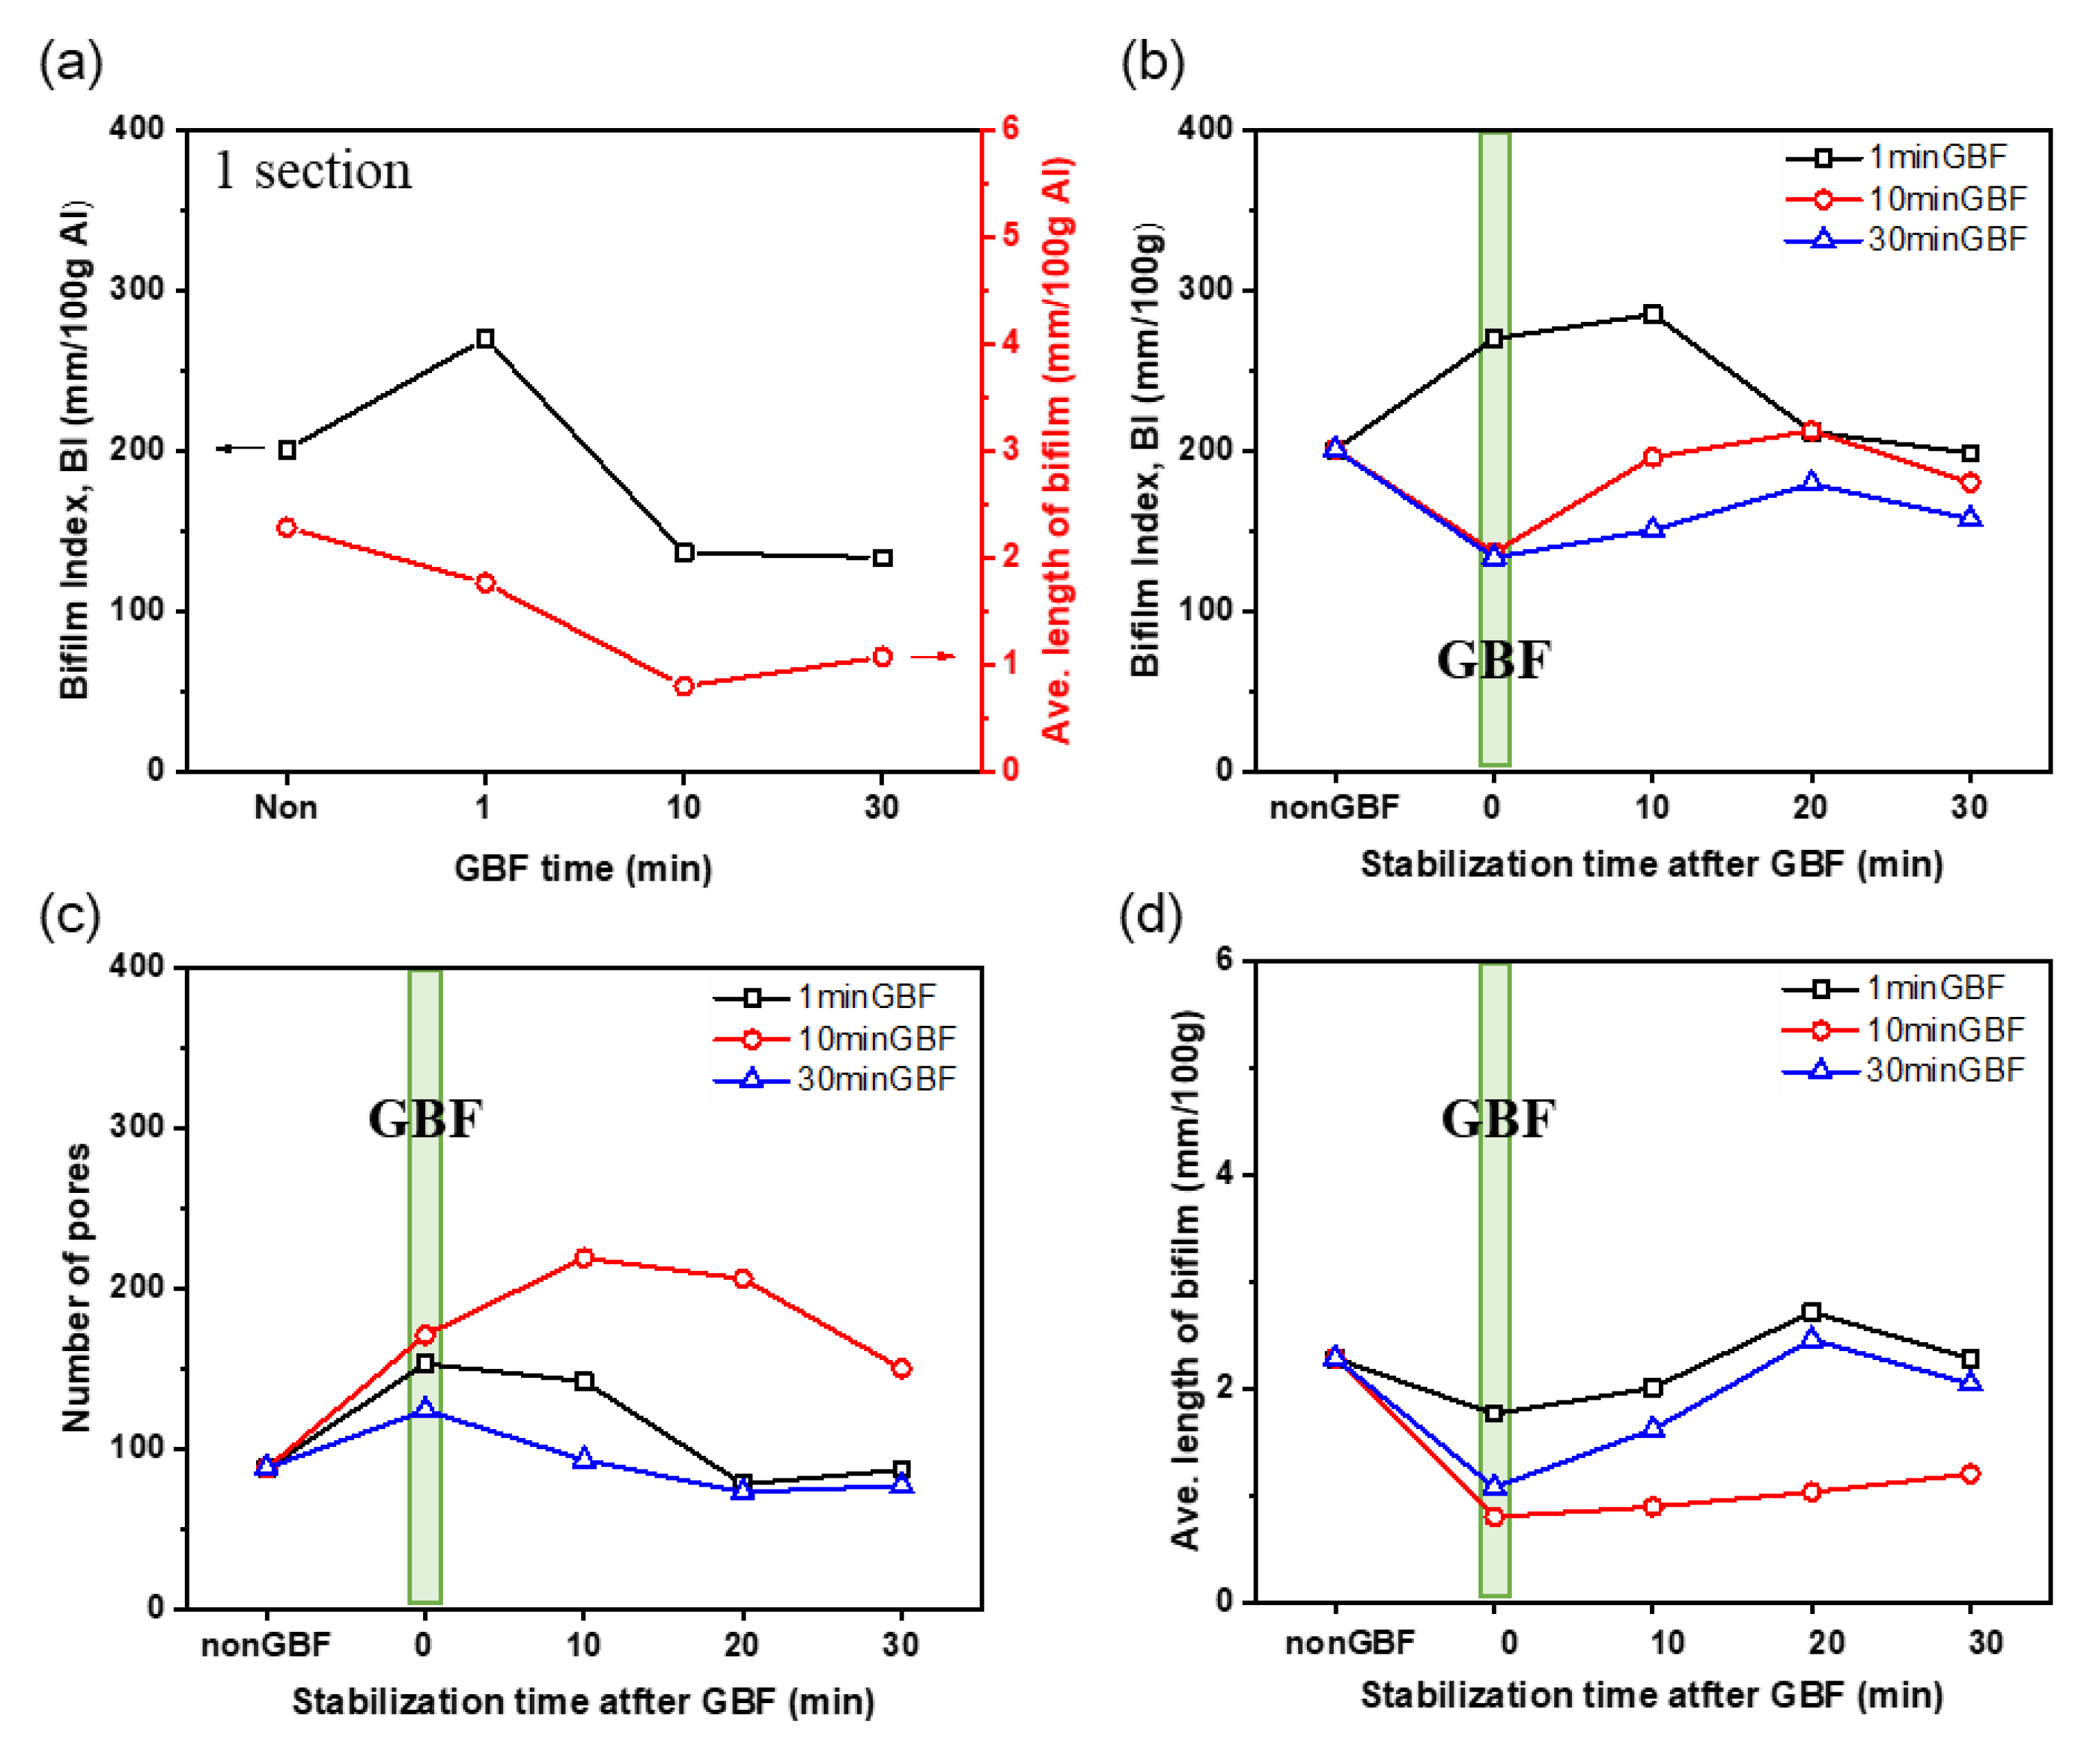
3.1.2. Effects of GBF Conditions on Bifilm Index

BI was calculated from the two-dimensional cross-sectional X-ray CT images of the RPT samples. BI values were estimated from 1, 3, and 5 images and compared to quantify how the number of data selections affected the estimate (Figure 3). The BI value had the same tendency according to stabilization time, regardless of the number of cross-section images considered for the BI calculation. Therefore, BI values, numbers of pores, and average sizes of bifilms were calculated for one image per RPT sample, at each GBF condition (Figure 4).
GBF time affected BI (Figure 4a). After an initial increase, BI declined as GBF time increased, and average length tended to decrease as GBF treatment increased. BI was 200.9 mm in nonGBF, 267.0 mm in 1minGBF, 136.8 mm in 10minGBF, and 133.4 mm in 30minGBF. The average length of the bifilm was 2.28 mm in nonGBF, 1.76 mm in 1minGBF, 0.80 mm in 10minGBF, and 1.08 mm in 30minGBF. Both DI and BI were similar in the 10minGBF and 30minGBF samples. Therefore, 10 min and 30 min GBF treatment yield similar improvements on melt quality.
Stabilization holding time also affected BI (Figure 4b). The BI of 1minGBF sample increased little during holding time for 10 min, then decreased to a value similar to the that nonGBF after stabilization holding time >20 min. In contrast, BI of 10minGBF and 30minGBF samples increased for the first 20 min of stabilization time, then decreased a level similar to that of the nonGBF sample after 30 min, and the GBF effect was almost eliminated.
After GBF treatment, NP was higher in all GBF conditions than in nonGBF (Figure 4c). The 10minGBF had more pores than the 1minGBF and 30minGBF samples after GBF treatment, and after 10 to 30 min of stabilization time. The average length of bifilm generally increased with stabilization time after GBF treatment (Figure 4d). This trend was similar to those of DI and porosity (Figure 1), and the CT images (Figure 2).
The average length of bifilm was the smallest in the 10minGBF sample. This result may mean that 10minGBF sample developed numerous fine gas bubbles during GBF treatment, and that they could not float to the melt surface during 10 min of GBF treatment. The tendencies of the average length of bifilm and of NP according to the stabilization holding time were similar in 1minGBF to those in 30minGBF; this agreement differed from the tendencies of DI, BI and porosity. This difference means that NP has a large influence on their average size but does not determine the degree of molten melt cleanliness.
The relative size and distribution of pores in the Al alloys can be compared by exploiting the relationship between the density of the sample and NP [27]. Points a and b (Figure 5) indicate the difference in pore size at different densities in the same NP. The pore size is larger at a than at b. Points b and c have the same density but different numbers of pores, which means that they have the same total volume of pores but a difference in their numbers. This result means that 1minGBF had bigger pores than 30minGBF. The samples subjected to the GBF treatment for 1 min and 30 min had similar numbers of pores, but the sizes of the pores were different. 10minGBF had more pores than 30minGBF. Although the pore size decreased after GBF treatment for 10 min and 30 min, the NP was larger in 10minGBF than in 30minGBF.

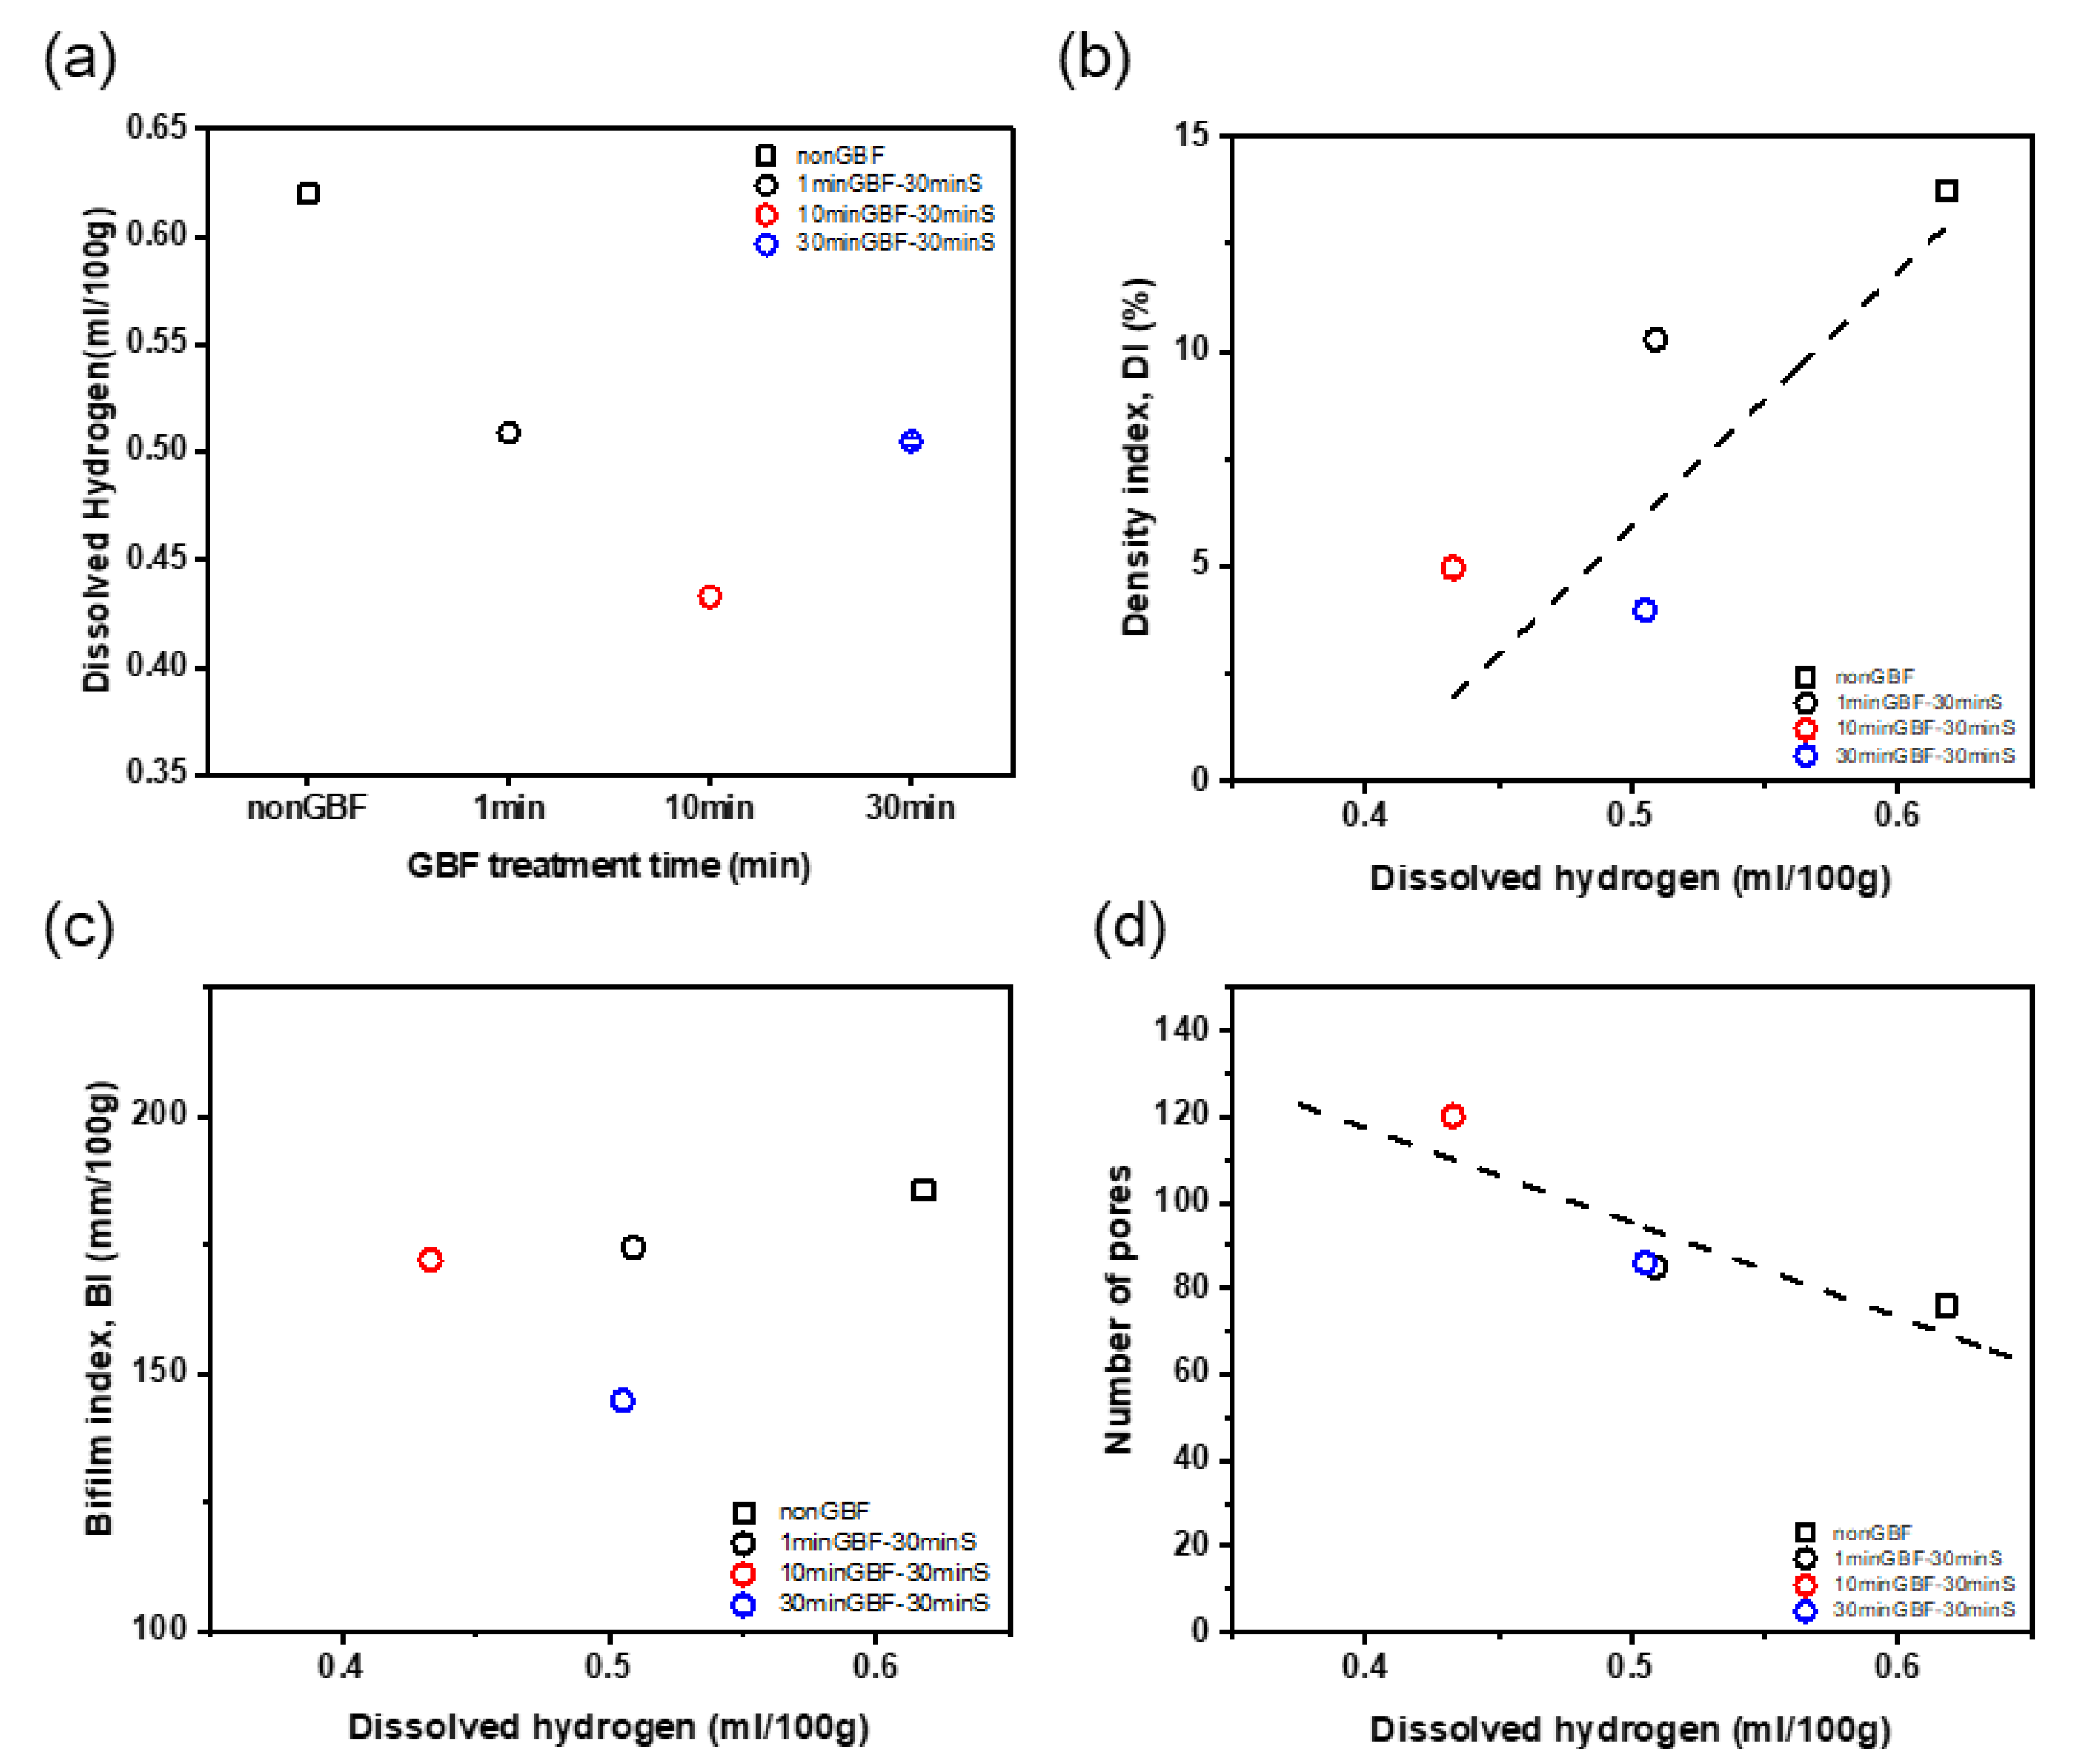
3.1.3. Effects of GBF Conditions on Dissolved Hydrogen Content

Dissolved [H] in the molten Al-Si-Mg-Cu alloy before GBF was 0.62 mL/100 g (Figure 6a), which is 40.1% of the calculated solubility from previous studies that considered alloys of Si = 1.25 wt. %, Cu = 0.3 wt. % at 800 °C [3,29,30,31]. After GBF treatment and 30 min of stabilization the molten alloy had [H] = 0.51 mL/100 g (1minGBF-30minS), 0.43 mL/100 g (10minGBF-30minS), and 0.50 mL/100 g (30minGBF-30minS), which were 33.1%, 28.1%, and 32.8% of the calculated solubility, respectively. When the melt was treated with GBF for 1, 10, and 30 min followed 30 min of holding time, [H] decreased by 17.6%, 30.0%, and 18.3%, respectively, compared with Non-GBF melt. The melt of 10minGBF-30minS had the lowest [H], so GBF treatment for 10 min and stabilization for 30 min can be expected to have the highest degassing effect on the melt quality of the present alloys. The optimal GBF time and stabilization time for the Al-Si-Mg-Cu alloy will be discussed in detail in Section 3.3.
[H] in the melts was related to DI, BI, and NP (Figure 6b–d). As [H] decreased, DI generally decreased, and someone might consider that there is a specific proportional relationship between [H] and the melt quality. However, the samples of 1minGBF-30minS and 30minGBF-30minS had similar [H] but differences in DI and BI. The increase in NP with a decrease of [H] and the weak relationship between BI and [H] shows that [H] is not an appropriate indicator of the melt quality of Al-Si-Mg-Cu alloys; this conclusion agrees with the results of the previous study [27]. [H] and BI may be independent, with BI affected by dross [28]. Additionally, both [H] and bifilms in melt may increase during GBF treatment due to broken surface oxide film.

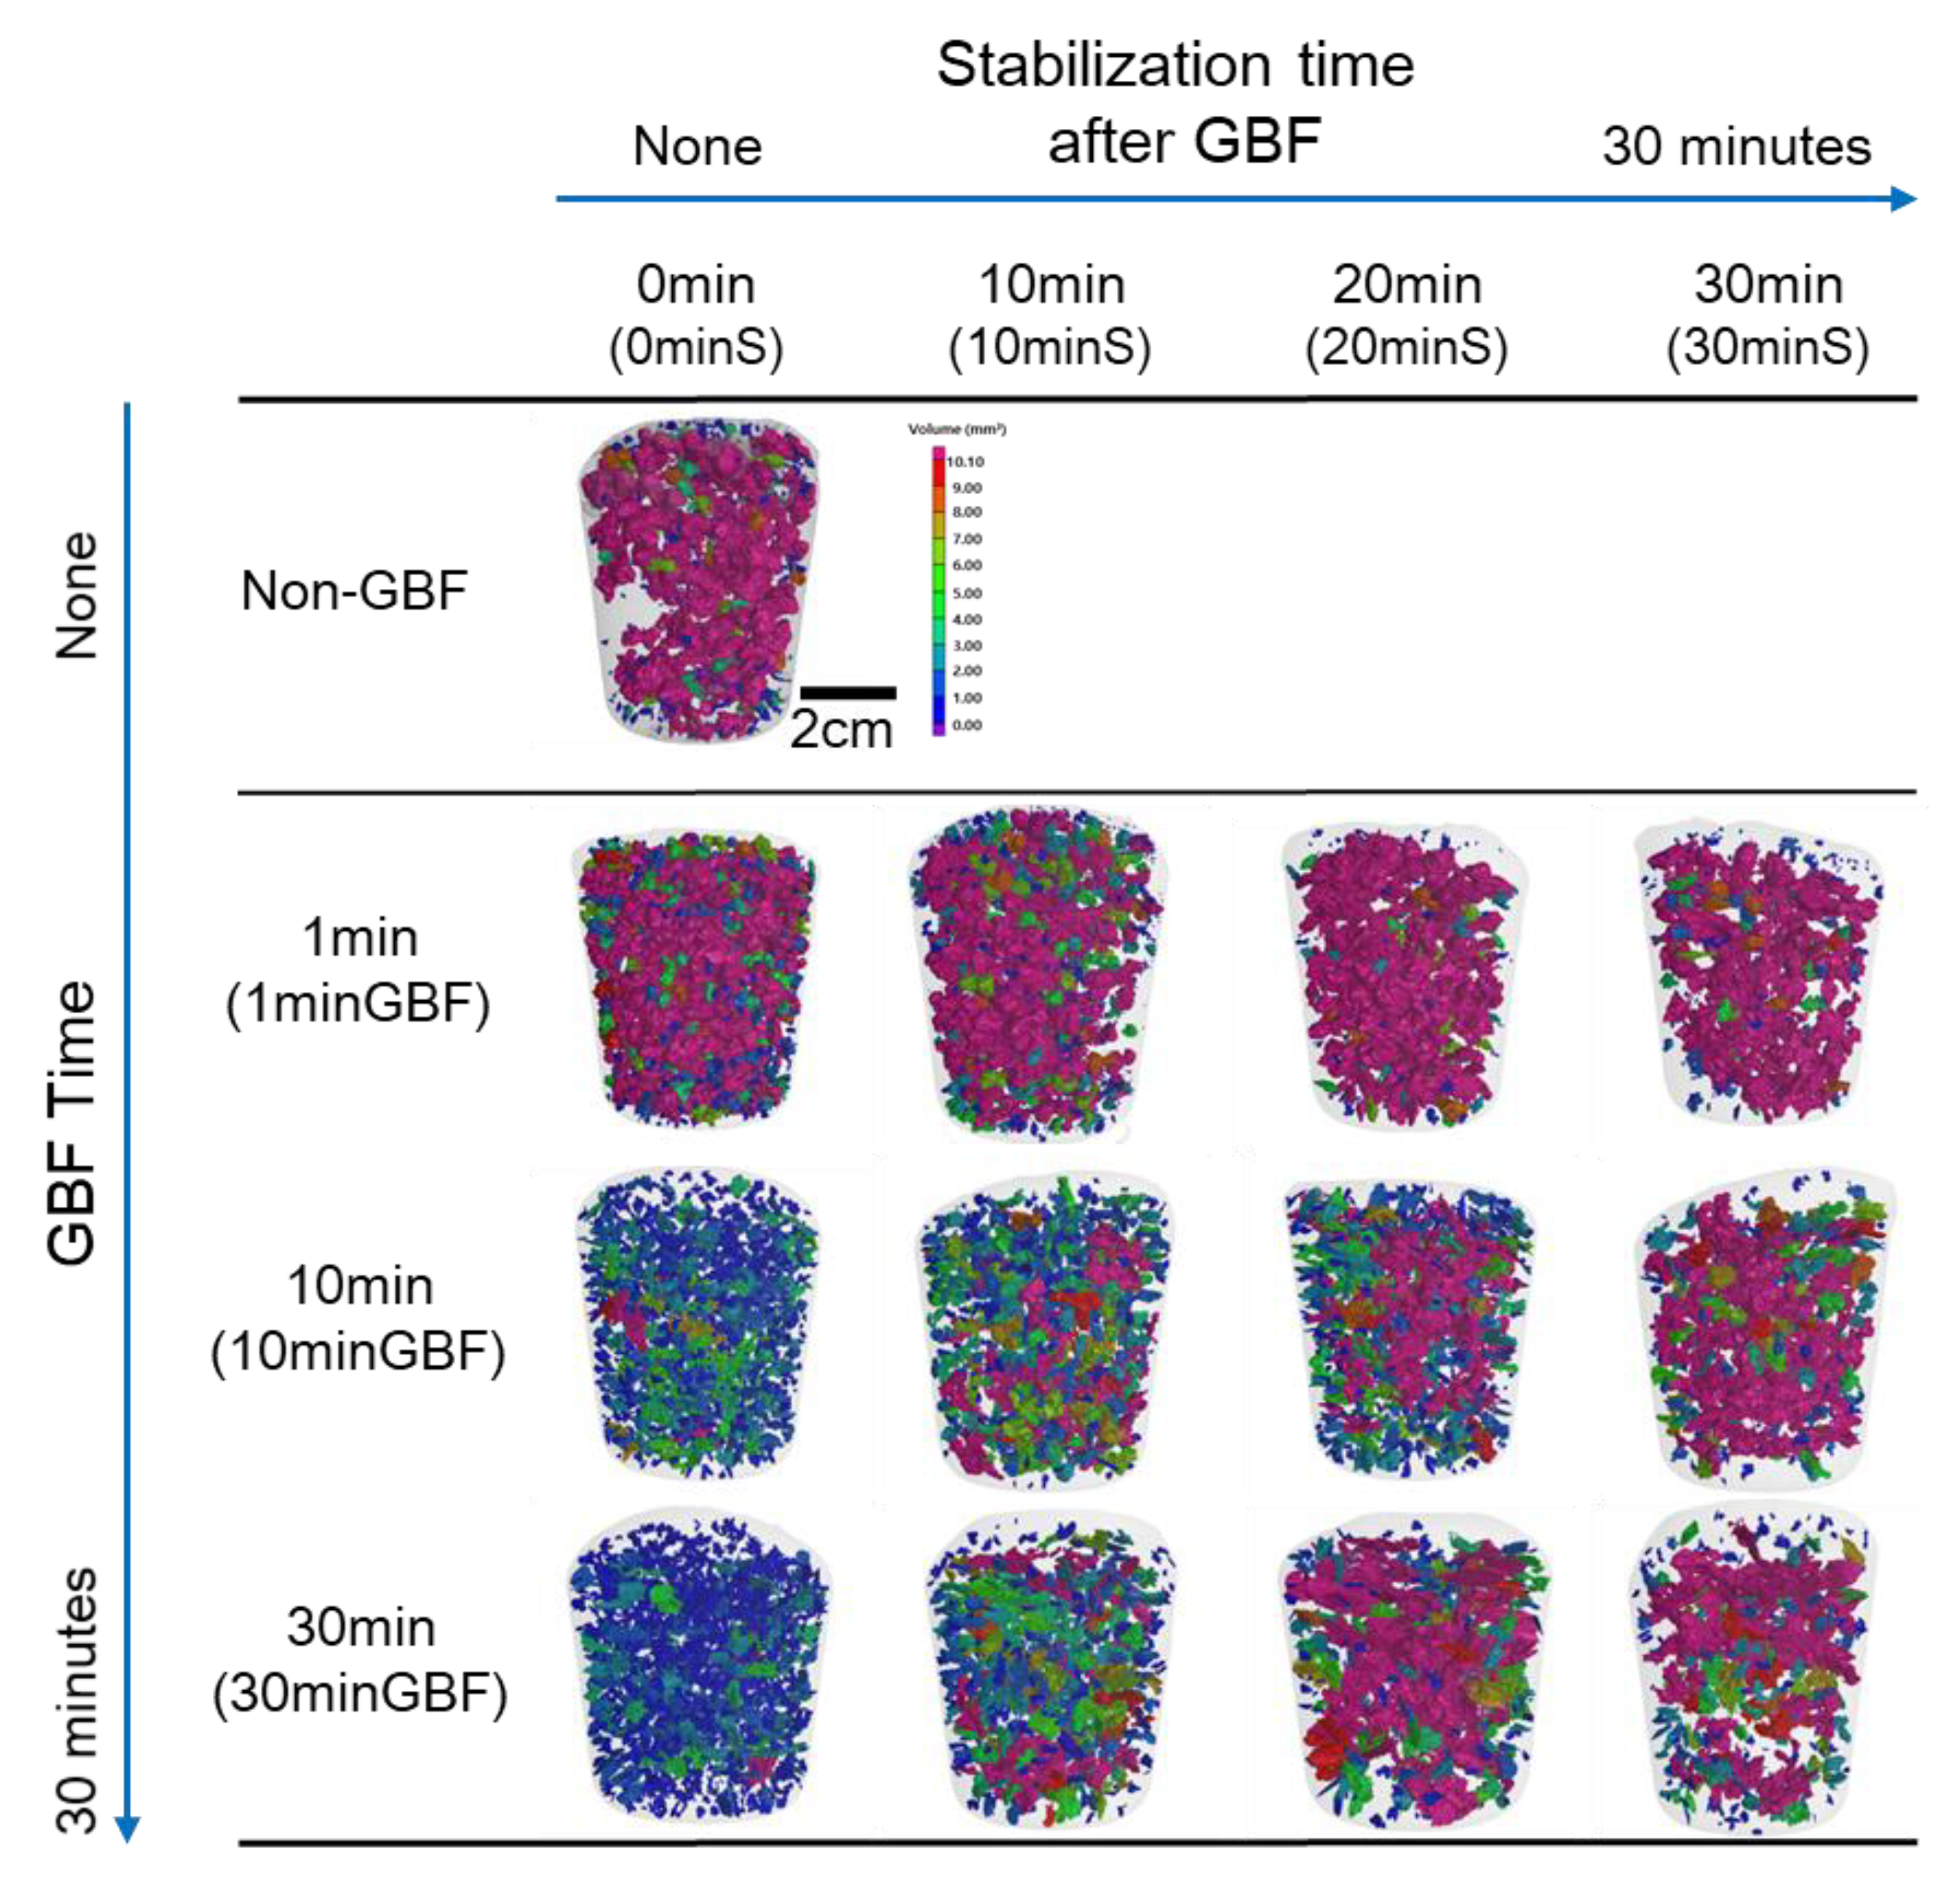
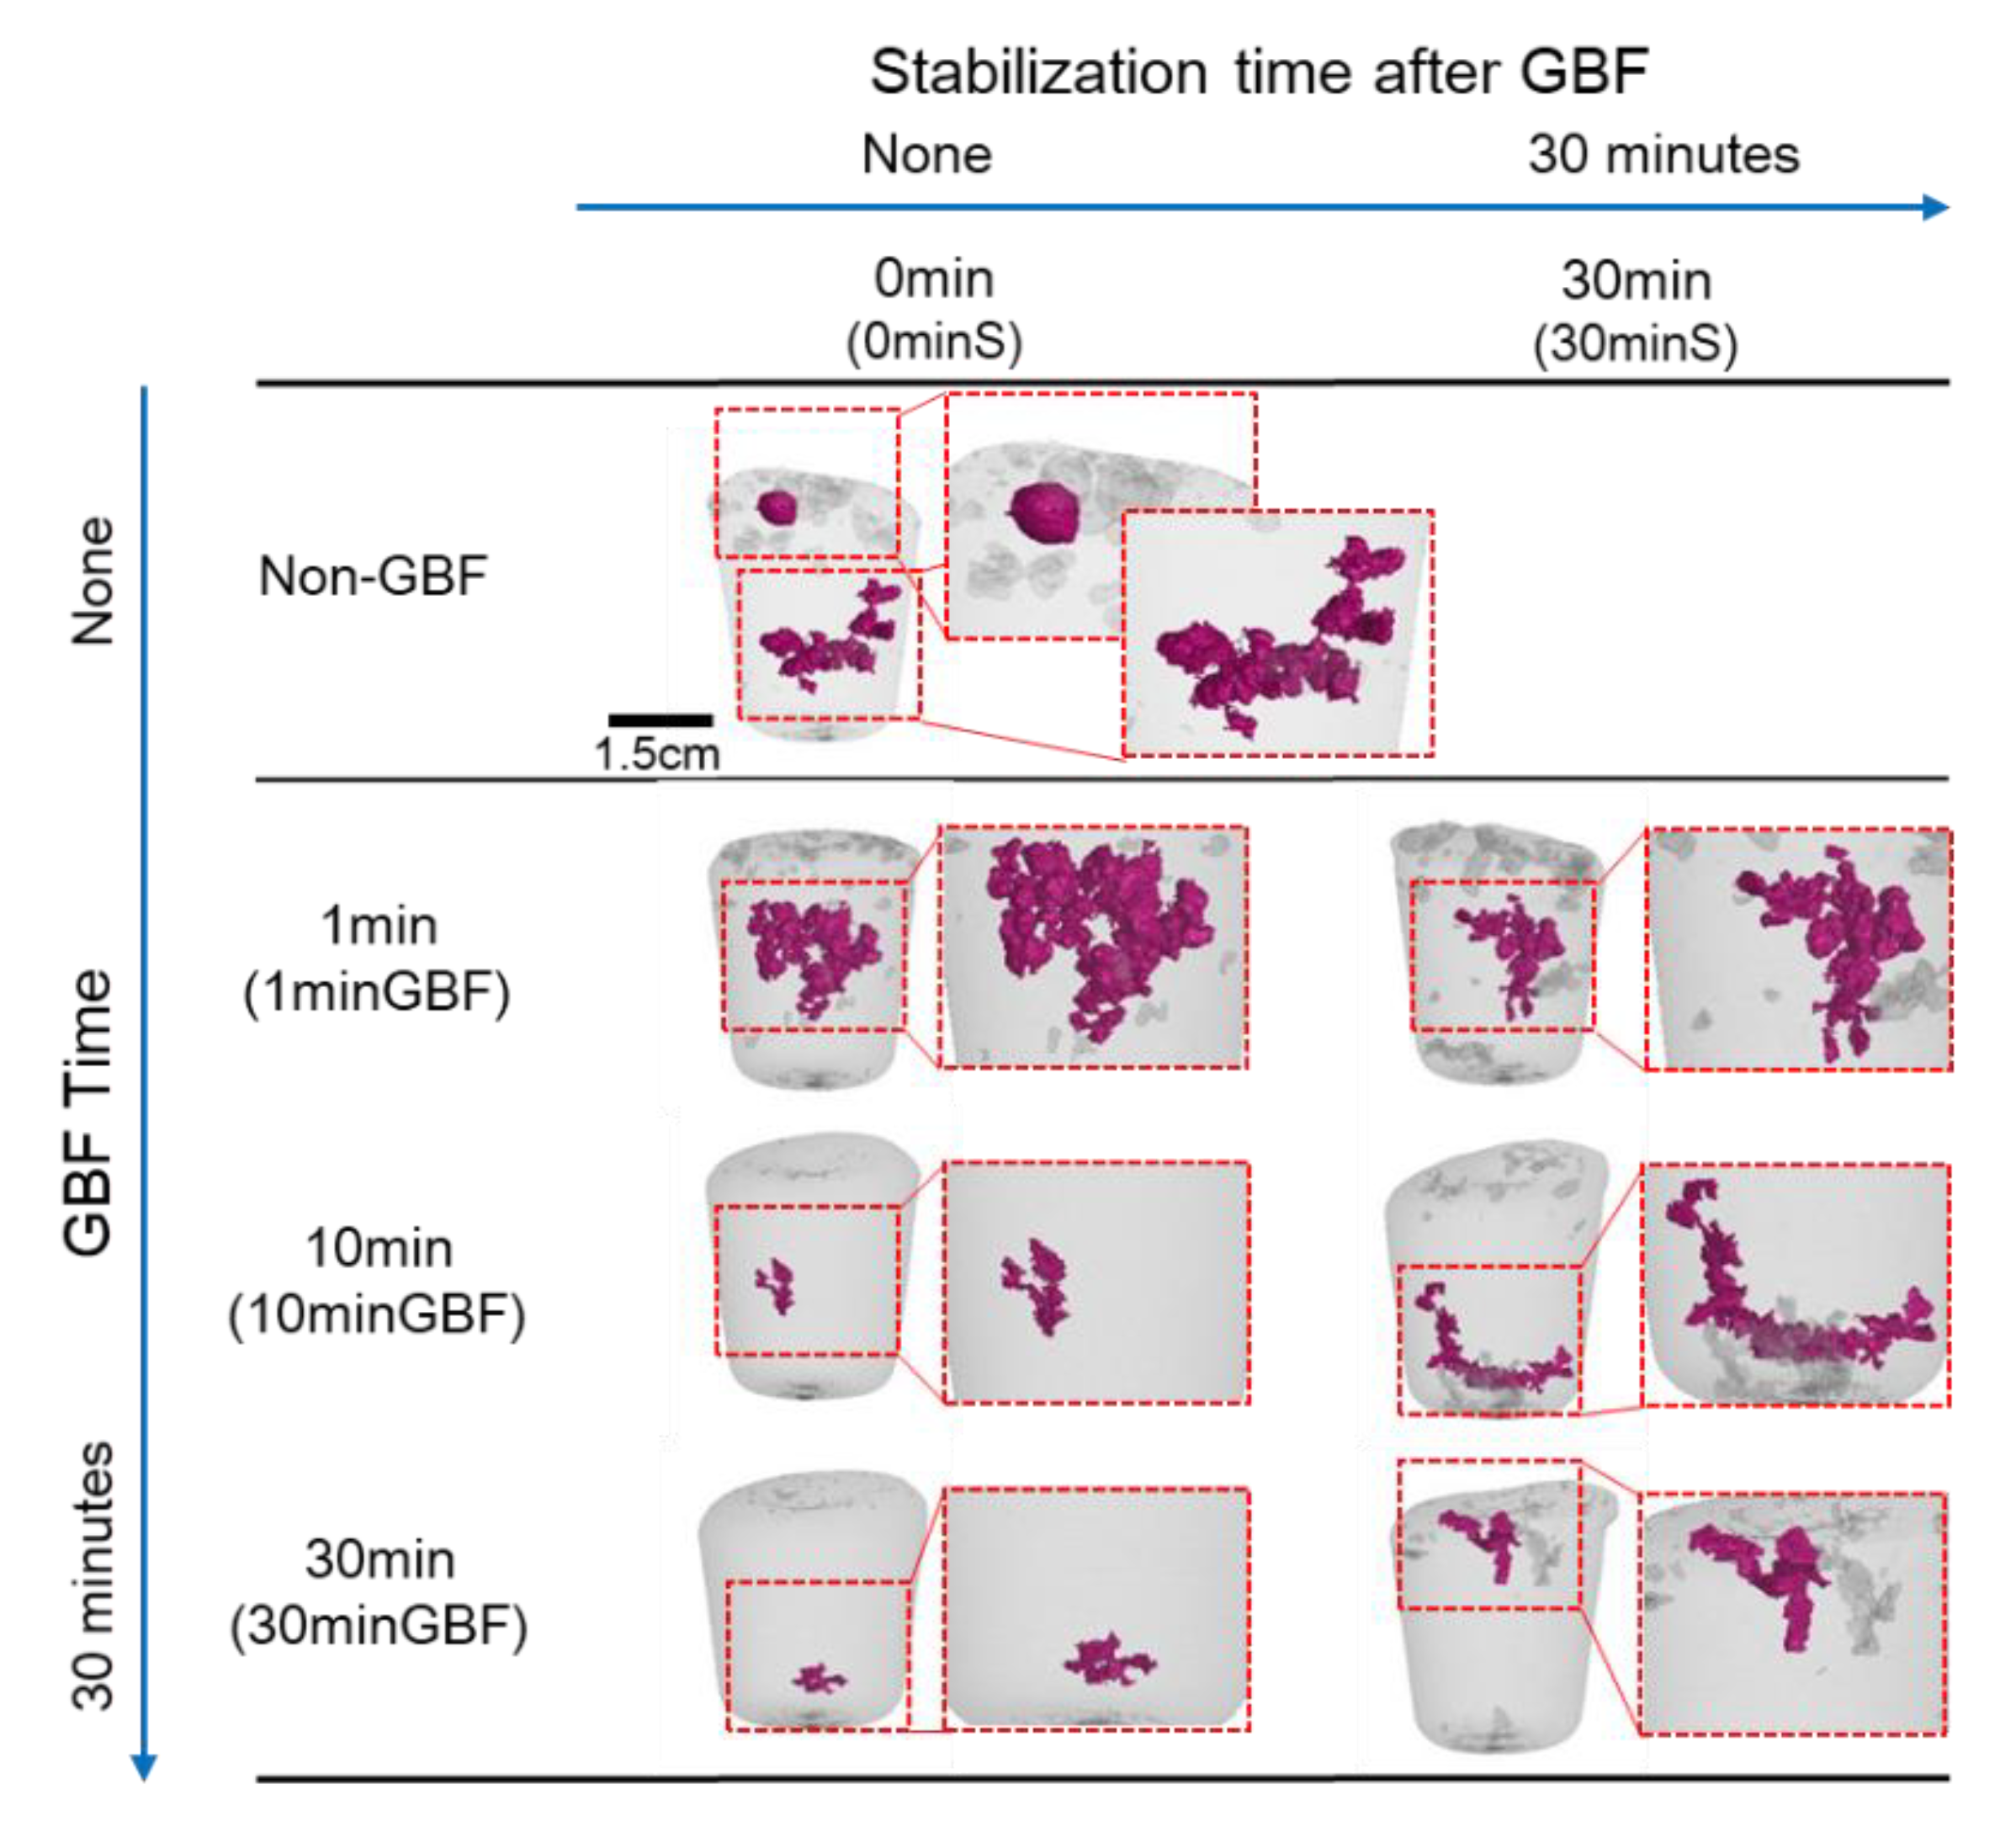
3.2. Analysis of Pores in RPT Samples by 3D X-ray CT

3.2.1. Effect of GBF Conditions on Pore Shape in RPT Samples

The shape of the pore that had the largest volume can help to determine whether the pores are caused by gas, inclusions, or shrinkage. A spherical pore is mainly a result of gas, which is generated by surface tension during expansion of gas trapped between bifilms in the melt. A pore that has many irregular arms are formed by tension during shrinkage of the Al from the liquid phase to solid; they may form by groupings of clusters of pores [4]. The non-GBF sample had both spherical and irregular pores (Figure 7). The 1minGBF samples with and without stabilization had clusters composed of spherical pores; this result indicates that the clusters had formed by gas and shrinkage combined. The 10minGBF and 30minGBF samples had small clusters formed by shrinkage after GBF, but the defects became long and irregularly shaped after stabilization for 30 min. The long and irregular shape of pores in the 30minGBF-30minS samples may result from increase in inclusions and gas again during stabilization at 800 °C. The trend toward pore shape according to the GBF treatment conditions is generally consistent with the DI results of the samples.
Pores may open by a mechanism similar to ratchet action. Bifilm is usually introduced as a folded state in a melt. As the existing gas between BI expands during cooling at 80 mbar, the volume increases, and the pores grow by hydrogen diffusion into the gap. The inner surfaces of the pores oxidize again and this process cannot be reversed [32]. The results of EDS showed that oxide layers formed on the inner surfaces of the pores in the RPT samples with and without GBF treatment (Figure 8) and that pores grew between the oxide films (Figure 9).

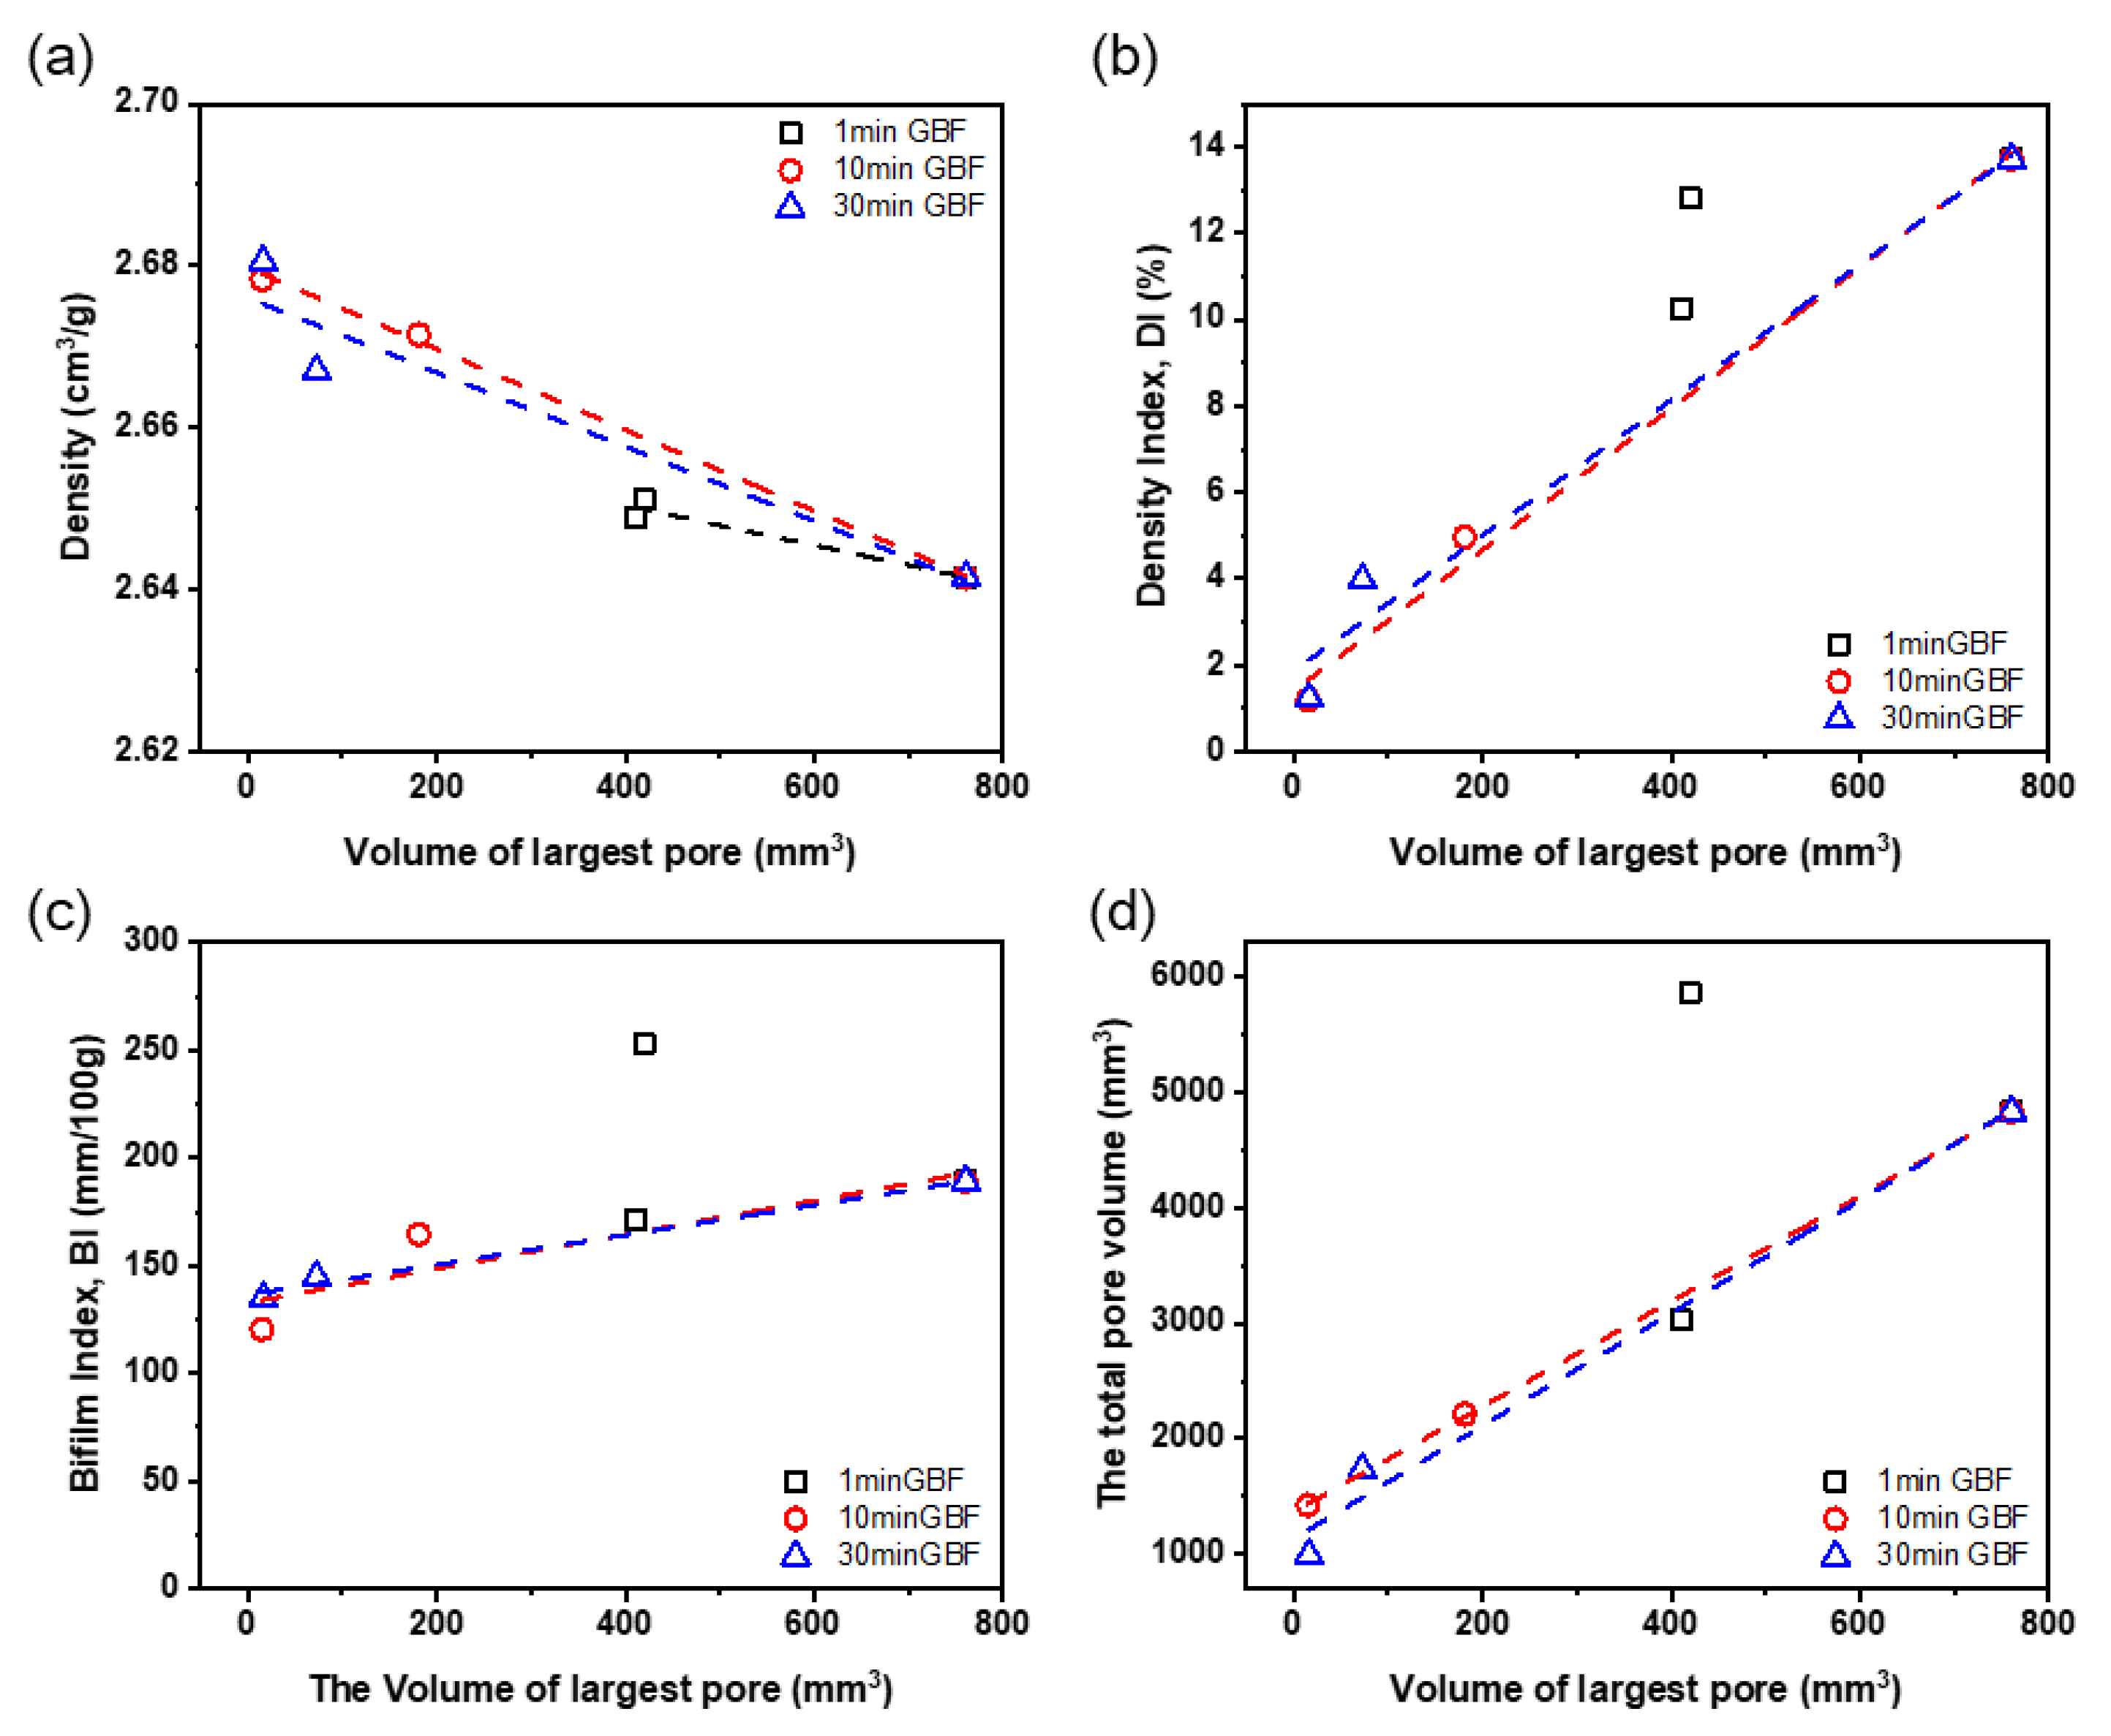
3.2.2. Melt Quality Parameter Comparison with the Volume of the Largest Pore

The volume VMAX of the largest pore in the RPT samples was compared with the density, DI, BI, and total pore volume of the samples (Figure 10). VMAX of 1minGBF samples related only to the density. VMAX of 10minGBF and 30minGBF samples showed a strong linear relationship with all of these parameters. The relationship may occur because the melt quality parameters in the RPT sample are affected by cluster formation rather than by single pores. This result suggests that the volume of the largest pore can be used to predict the melt quality of Al-Si-Mg-Cu alloy. In the present study, most pores were clusters, so the volume of the largest pore and shape of the largest pores can be used to represent the cleanliness of the molten Al-Si-Mg-Cu alloy.

3.3. Optimization Study of GBF Time and Stabilization Time

GBF treatment time has an important effect on the cleanliness of the clean melt and the economic feasibility of the process. If the GBF treatment time is short, a high-quality molten metal cannot be obtained, whereas if the treatment time is long, the economic efficiency decreases. The optimal GBF treatment time is the time required until the injected gas is mixed and spread evenly in the molten metal and has a large gas–liquid contact area. The mixing time is generally defined as the time required to achieve 95% complete mixing in the stirred bath. Numerous theoretical and experimental studies on the phenomena of mixing have been reported and several models have been developed to estimate the mixing time for the Al refining [14,33,34]. One model [34] estimates the mixing time T m in liquids of varying kinematic viscosities agitated by bottom gas injection:
T m = 1200 · Q g 0.47 · D 1.97 · H L 1 · ν L 0.47 ;
in this work, Q g   = 1 L/min is gas flow rate, D = 20 cm is bath inner diameter, HL = 20 cm is liquid depth, and ν L = 0.59 cm2/s is kinematic viscosity, which is generally known for aluminum. The model estimated Tm = 197 s = 3 min 17 s, which is less than our observed optimal time of 10 min. The difference may be due to the lack of experiments, i.e., not performing GBF experiments between 1 min and 10 min, or due to the high ν L of the Al-Si-Mg-Cu alloy. The estimated Tm is the time required for the inert gas to contact the molten metal by more than 95%. Considering the time required for gas and inclusions in the melt to float to the surface to complete the cleaning of the molten metal, the optimal time for GBF treatment will be longer than Tm. The optimal GBF time of 10 min observed in this study is similar to results of previous studies [5,22,23,24]. GBF time can also be considered as a proxy for the total amount of gas injection, which can be expressed as a process parameter of the amount of gas injected into a unit amount of molten metal. In this study, 10 min of GBF time is equivalent to a gas injection of 1 L/kg, which is similar to 1 L/kg [22] and 2.5 L/kg [35] of other papers.
Considering the optimal stabilization holding time after GBF treatment, the degree of molten metal cleanliness declined as the stabilization time increased from 10 to 20 and 30 min, so this study suggests that 10 min is optimal. The decline is caused by turbulence and vortices introduced during rotary degassing; these phenomena disturb the melt surface, entrain oxide films and accelerate re-gassing of hydrogen from the newly exposed surface [7,22]. Nevertheless, in general, a stabilization time is required after the GBF treatment to allow Ar gas bubbles to escape through the melt surface, but the stabilization time was not required in this study; instead, reduced the cleanliness of the molten metal. This result differs from a previous study of Rheinfelden’s Silafont—36 alloy (AlSi10MnMg), in which DI was lowest after 10 min of stabilization time but increased until 70 min [22]. Although the degree of cleanliness of the molten metal after 30 min stabilization time had industrially acceptable DI (5%), a rapid subsequent casting process must be performed after GBF treatment to maintain the high quality of melt and achieve excellent mechanical properties of the final product.

4. Conclusions

The effect of Gas Bubbling Filtration (GBF) on the melt quality of Al-Si-Mg-Cu alloy was quantified, and optimal GBF time and stabilization time were obtained by measuring DI, BI, [H], porosity, density, and the VMAX.
  • The molten metal quality after GBF treatment had melt quality that met the industry standard (DI< 1%), but the melt quality decreased with increase in stabilization time to 30 min, possibly because hydrogen re-dissolved during the stabilization holding time from the newly exposed surface generated after GBF treatment.
  • As GBF time increased to 30 min, i.e., the amount of injected gas increased to 3 L/kg, the quality of the molten metal of Al-Si-Mg-Cu alloy improved, but the improvements of cleanliness of molten metal were similar after GBF = 10 min and 30 min.
  • The shape of the pore with the largest volume by CT analysis in RPT samples can identify the different types of pores by gas, inclusion, and shrinkage. The RPT sample of Al-Si-Mg-Cu alloy without GBF had the clusters consisted of the spherical pores, which was mainly affected by the gas. After GBF treatment for 10 or 30 min, the RPT sample of Al-Si-Mg-Cu alloy had small clusters, which were formed by shrinkage. The defects became long and irregularly shaped after the stabilization of 30 min. The trend toward pore shape according to the GBF treatment conditions is generally consistent with the DI results of the samples.
  • The pores in the RPT sample of Al-Si-Mg-Cu alloy were clusters, so the volume of the largest pore and shape of the largest pores with DI can be used to represent the cleanliness of the molten Al-Si-Mg-Cu alloy.
  • The volume of the largest pore in RPT samples of Al-Si-Mg-Cu alloy showed a relatively strong linear relationship with the melt quality parameters of density, DI, and BI. These trends may occur because the melt quality parameters in the RPT sample are affected by cluster formation.
  • These results recommend that the melt of Al-Si-Mg-Cu alloy should be treated by applying GBF for 10 min with gas flow >1 L/kg to satisfy DI < 1% for high-quality melt in the foundry industry.
  • Stabilization time should be as short as possible (<30 min) after GBF treatment to maintain high molten metal cleanliness.

Author Contributions

H.-S.J. and S.S. conceived and designed the experiments; H.-S.J., H.-J.K., G.-H.L. and P.-H.Y. performed the experiments; H.-S.J., J.-Y.P. and S.S. analyzed and discussed the data. H.-S.J., Y.-S.C. and S.S. wrote the paper. All authors have read and agreed to the published version of the manuscript.

Funding

This work was funded by Ministry of Trade, Industry and Energy (10081329), Republic of Korea.

Institutional Review Board Statement

Not applicable.

Informed Consent Statement

Not applicable.

Data Availability Statement

The data presented in this study are available on request from the corresponding author. The data are not publicly available due to an ongoing study.

Conflicts of Interest

The authors have no conflict of interest.

References

  1. Cao, X.; Campbell, J. Oxide inclusion defects in Al-Si-Mg cast alloys. Can. Metall. Q. 2005, 44, 435–448. [Google Scholar] [CrossRef]
  2. ASM Handbook Volume 15 Casting; ASM International: Russell Township, OH, USA, 2008; ISBN 978-0-87170-711-6.
  3. Jiang, G.R.; Li, Y.X.; Liu, Y. Calculation of hydrogen solubility in molten alloys. Trans. Nonferrous Met. Soc. China (Engl. Ed.) 2011, 21, 1130–1135. [Google Scholar] [CrossRef]
  4. Wray, P.J. Predicted volume change behavior accompanying the solidification of binary alloys. Metall. Trans. B 1976, 7, 639–646. [Google Scholar] [CrossRef]
  5. Lee, C.; So, T.; Shin, K. Effect of gas bubbling filtration treatment on microporosity variation in A356 aluminium alloy. Acta Metall. Sin. (Engl. Lett.) 2016, 29, 638–646. [Google Scholar] [CrossRef] [Green Version]
  6. Camacho-Martnez, J.L.; Ramírez-Argáez, M.A.; Juárez-Hernández, A.; González-Rivera, C.; Trápaga-Martnez, G. Novel degasification design for aluminum using an impeller degasification water physical model. Mater. Manuf. Process 2012, 27, 556–560. [Google Scholar] [CrossRef]
  7. Dispinar, D.; Akhtar, S.; Nordmark, A.; Di Sabatino, M.; Arnberg, L. Degassing, hydrogen and porosity phenomena in A356. Mater. Sci. Eng. A 2010, 527, 3719–3725. [Google Scholar] [CrossRef]
  8. Gyarmati, G.; Fegyverneki, G.; Tokár, M.; Mende, T. The Effects of Rotary Degassing Treatments on the Melt Quality of an Al-Si Casting Alloy. Int. J. Met. 2021, 15, 141–151. [Google Scholar] [CrossRef] [Green Version]
  9. Wu, R.; Qu, Z.K.; Sun, B.; Shu, D. Effects of spray degassing parameters on hydrogen content and properties of commercial purity aluminum. Mater. Sci. Eng. A 2007, 456, 386–390. [Google Scholar] [CrossRef]
  10. Ray, S.; Milligan, B.; Keegan, N.; Falcon, I. Measurement of Filtration Performance, Filtration Theory and Practical Applications of Ceramic Foam Filters. In Proceedings of the 9th Australasian Conference and Exhibition on Aluminium Cast House Technology, Melbourne, Australia, 12–15 September 2005; pp. 249–258. [Google Scholar]
  11. Damoah, L.N.W.; Zhang, L. Removal of inclusions from aluminum through filtration. Metall. Mater. Trans. B Process. Metall. Mater. Process. Sci. 2010, 41, 886–907. [Google Scholar] [CrossRef]
  12. Taylor, M.B. Molten Metal Fluxing/Treatment: How Best To Achieve the Desired Quality Requirements. Aluminium 2003, 79, 44–50. [Google Scholar]
  13. Meidani, A.R.N.; Hasan, M. A study of hydrogen bubble growth during ultrasonic degassing of Al-Cu alloy melts. J. Mater. Process. Technol. 2004, 147, 311–320. [Google Scholar] [CrossRef]
  14. Zhang, L.; Lv, X.; Torgerson, A.T.; Long, M. Removal of impurity elements from molten aluminum: A review. Miner. Process. Extr. Metall. Rev. 2011, 32, 150–228. [Google Scholar] [CrossRef]
  15. Hsi, R.; Tay, M.; Bukur, D.; Tatterson, G.; Morrison, G. Sound spectra of gas dispersion in an agitated tank. Chem. Eng. J. 1985, 31, 153–161. [Google Scholar] [CrossRef]
  16. Zhao, J.C.; Chen, J. Gas line pressure fluctuation analysis of a gas-liquid reactor. J. Therm. Sci. 2005, 14, 267–271. [Google Scholar]
  17. Warmoeskerken, M.M.C.G.; Smith, J.M. Flooding of disc turbines in gas-liquid dispersions: A new description of the phenomenon. Chem. Eng. Sci. 1985, 40, 2063–2071. [Google Scholar] [CrossRef]
  18. Saternus, M.; Merder, T. Physical modelling of aluminum refining process conducted in batch reactor with rotary impeller. Metals 2018, 8, 726. [Google Scholar] [CrossRef] [Green Version]
  19. Camacho-Martínez, J.L.; Ramírez-Argáez, M.A.; Zenit-Camacho, R.; Juárez-Hernández, A.; Barceinas-Sánchez, J.D.O.; Trápaga-Martinez, G. Physical modelling of an aluminium degassing operation with rotating impellersa comparative hydrodynamic analysis. Mater. Manuf. Process. 2010, 25, 581–591. [Google Scholar] [CrossRef]
  20. Odenthal, H.J.; Bölling, R.; Pfeifer, H. Numerical and physical simulation of Tundish fluid flow phenomena. Steel Res. 2003, 74, 44–45. [Google Scholar] [CrossRef]
  21. Lee, C.; So, T.; Shin, K. Defect Susceptibility of Tensile Properties to Microporosity Variation in High-Pressure Die-Cast Aluminium Alloy Controlled by Gas Bubbling Flotation Treatment. Inter. J. Metalcast. 2019, 13, 880–889. [Google Scholar] [CrossRef]
  22. Lordan, E.; Lazaro-Nebreda, J.; Zhang, Y.; Fan, Z. Effective Degassing for Reduced Variability in High-Pressure Die Casting Performance. JOM 2019, 71, 824–830. [Google Scholar] [CrossRef]
  23. Hao, C.; Li, D.; Zeng, J. Research on porous sprayer for refining of aluminium melt. Adv. Mater. Res. 2012, 418–420, 1856–1859. [Google Scholar] [CrossRef]
  24. Li, Q.; He, K.; Wu, N.; Zeng, J. Purification of aluminum melt in crucibles by bubble flotation. Procedia Manuf. 2019, 37, 438–442. [Google Scholar] [CrossRef]
  25. Galarraga, H.; de Cortazar, M.G.; Arregi, E.; Artola, A.; Oncala, J.L.; Merchan, M. Gas blowing ultrasonic aluminium degassing assessment with the reduced pressure test (RPT) method. Arch. Foundry Eng. 2020, 20, 111–117. [Google Scholar]
  26. Mitrasinovic, A.; Robles Hernández, F.C.; Djurdjevic, M.; Sokolowski, J.H. On-line prediction of the melt hydrogen and casting porosity level in 319 aluminum alloy using thermal analysis. Mater. Sci. Eng. A 2006, 428, 41–46. [Google Scholar] [CrossRef]
  27. Dispinar, D.; Campbell, J. Critical assessment of reduced pressure test. Part 2: Quantification. Int. J. Cast Met. Res. 2004, 17, 287–294. [Google Scholar] [CrossRef]
  28. Uludağ, M.; Çetin, R.; Dispinar, D.; Tiryakioğlu, M. Characterization of the Effect of Melt Treatments on Melt Quality in Al-7wt. %Si-Mg Alloys. Metals 2017, 7, 157. [Google Scholar] [CrossRef] [Green Version]
  29. Miettinen, J. Thermodynamic description of the Cu-Al-Si system in the copper-rich corner. Calphad Comput. Coupling Phase Diagrams Thermochem. 2007, 31, 449–456. [Google Scholar] [CrossRef]
  30. Opie, W.R.; Grant, N.J. Hydrogen Solubility in Aluminum and Some Aluminum Alloys. Trans. Metall. Soc. 1950, 188, 1237–1241. [Google Scholar] [CrossRef]
  31. Zhang, H.; Li, Y.; Liu, Y. Hydrogen solubility in pure metals for Gasar process. ACTA Metall. Sin. Ed. 2007, 43, 113. [Google Scholar]
  32. Dispinar, D.; Campbell, J. Porosity, hydrogen and bifilm content in Al alloy castings. Mater. Sci. Eng. A 2011, 528, 3860–3865. [Google Scholar] [CrossRef]
  33. Chiti, F.; Paglianti, A.; Bujalski, W.; Work, E. A mechanistic model to estimate power. Chem. Eng. Res. Des. 2004, 82, 1105–1111. [Google Scholar] [CrossRef]
  34. Iguchi, M.; Nakamura, K.I.; Tsujino, R. Mixing Time and Fluid Flow Phenomena in Liquids of Varying Kinematic Viscosities Agitated by Bottom Gas Injection. Metall. Mater. Trans. B 1998, 29B, 569–575. [Google Scholar] [CrossRef]
  35. Saha, D.; Becker, J.S.; Gluns, L. A new in-line aluminum treatment system using nontoxic gases and a gas-permeable vessel bottom. In Proceedings of the Productivity and Technology in the Metallurgical Industries, Cologne, Germany, 17–22 September 1989; pp. 855–877. [Google Scholar]
Figure 1. Density index (DI) and Porosity of RPT samples cast at 800 °C after GBF treatment for 1, 10, and 30 min (a), and Density index (DI) (b) and Porosity (c) of samples cast after GBF treatment and stabilization for various times.
Metals 11 00841 g001
Figure 2. X-ray Computed Tomography images of RPT samples of Al-Si-Mg-Cu alloys casted at 80 mbar after various GBF and stabilization times.
Metals 11 00841 g002
Figure 3. Bifilm Index (BI) measured in two-dimensional cross-sectional X-ray CT images of RPT samples of Al-Si-Mg-Cu alloy with different stabilization time, which is estimated from the (a) 1 section, (b) sum of 3 sections, and (c) sum of 5 sections, (d) X-ray Computed Tomography results of 10minGBF.
Metals 11 00841 g003
Figure 4. Bifilm Index (BI) and average length of bifilm of RPT samples according to (a) GBF treatment time, (b) BI, (c) number of pores, and (d) average length of bifilm measured in RPT samples cast after various GBF treatment time and stabilization time.
Metals 11 00841 g004
Figure 5. Relation between density and the number of pores: (a) schematic diagram and (b) Al-Si-Mg-Cu alloys cast at the reduced pressure of 80 mbar after different GBF time and stabilization time; color of marker represents GBF time; shape of marker represents stabilization holding time. Black square: nonGBF sample.
Metals 11 00841 g005
Figure 6. (a) Dissolved hydrogen content [H] in Al-Si-Mg-Cu alloy melt at 800 °C before GBF treatment and after different times of GBF and 30 min of stabilization. Relation between [H] and other melt quality parameters; (b) density index (DI), (c) Bifilm Index (BI), and (d) number of pores.
Metals 11 00841 g006
Figure 7. Shape of largest pore in RPT samples of Al-Si-Mg-Cu alloy observed by X-ray CT.
Metals 11 00841 g007
Figure 8. SEM microscope images (a,b,d,e) and EDS results (c,e) of pore in the RPT sample of Al-Si-Mg-Cu alloy cast at 800 °C; Non-GBF (ac) and after GBF (df) for 10 min.
Metals 11 00841 g008
Figure 9. SEM microscope images (a,g) and EDS mapping results (bf, hl) of pore and oxide films in the RPT sample of Al-Si-Mg-Cu alloy cast at 800 °C; Non-GBF (af) and after GBF (gl) for 10 min.
Metals 11 00841 g009
Figure 10. Relation between volume of largest pore observed in RPT samples, and melt quality parameters; Density (a), Density index (DI) (b), Bifilm Index (BI) (c), and total pore volume (d).
Metals 11 00841 g010
Table 1. Chemical composition of the Al-Si-Mg-Cu Alloy used in the present work.
Element.SiMgCuMnFe
wt. %1.30.340.270.20.01
Publisher’s Note: MDPI stays neutral with regard to jurisdictional claims in published maps and institutional affiliations.

