
Effect of Ca Addition on Corrosion Behavior of Wrought AM60 Magnesium Alloy in Alkaline Solutions


1
Department of Mechanical Engineering, Sami Shamoon College of Engineering, Ashdod 77245, Israel
2
Department of Material Engineering, Ben-Gurion University of the Negev, Beer-Sheva 84105, Israel
3
Magnesium Technology Innovation Center, RIAM, School of Materials Science and Engineering, Seoul National University, Seoul 08826, Korea
*
Author to whom correspondence should be addressed.
Metals 2021, 11(8), 1172; https://0-doi-org.brum.beds.ac.uk/10.3390/met11081172
Submission received: 28 June 2021
/
Revised: 19 July 2021
/
Accepted: 21 July 2021
/
Published: 23 July 2021
(This article belongs to the Special Issue Corrosion Behavior of Magnesium Alloys)
Abstract
:Magnesium (Mg) alloys possess the lowest density among structural materials, and their application in the automotive and aircraft industries might enhance fuel efficiency. The mechanical properties can be improved by the addition of alloying elements. However, since Mg and its alloys are very susceptible to corrosion degradation, it is important to study the effect of these elements on the alloys’ corrosion behavior. In this study, 1 wt% of calcium (Ca) was added to wrought AM60 Mg alloy, and the electrochemical corrosion behavior of the alloys in alkaline solutions with and without Cl− ions was compared. The corrosion behavior was investigated by means of immersion tests, gravimetric measurements and potentiodynamic polarization (PDP); the characteristics of the oxide layer were studied by electrochemical impedance spectroscopy (EIS) and X-ray photoelectron spectroscopy (XPS). The addition of Ca resulted in precipitation of the ternary aluminum-rich (Mg-Al)2Ca phase. Scanning Kelvin probe force microscope (SKPFM) identified that this phase has a cathodic behavior relative to the α-Mg matrix; hence it can serve as additional sites for initiation of pitting corrosion. As a result, the corrosion resistance of wrought AM60 alloy with 1 wt% Ca addition deteriorated in a NaCl solution. However, in the absence of Cl− ions, alloying with Ca improves the corrosion resistance of wrought AM60 alloy due to the stabilization of the corrosion products layer. The effect of long-period immersion time on the corrosion behavior and alloy oxidation is discussed.
1. Introduction
Reducing greenhouse gas emissions and improving fuel efficiency is an aspiration in the automotive and aircraft industries. This can be achieved by using lightweight metals and reducing the vehicle’s weight. Among other structural materials, magnesium (Mg) alloys have the lowest density; additional advantages are high strength-to-weight ratio and high damping capacity [1,2,3,4,5]. Further improvement of strength and ductility was obtained for wrought Mg alloys [4,5]. Nevertheless, since the formability of Mg alloys at room temperature is limited, the production rate of wrought Mg alloys is relatively low and most of the commercial Mg components are produced by casting [4,5,6,7,8]. Moreover, based on our previous research, as well as of other researchers [8,9,10,11,12,13,14,15,16,17,18,19,20], it can be seen that Mg alloys are susceptible to corrosion. This susceptibility prevents their widespread application. Therefore, there is a growing need for the development and production of new wrought Mg alloys with superior mechanical properties and good corrosion resistance.
A common way to improve the corrosion resistance of Mg is alloying with small quantities of manganese (Mn) [21,22,23]. Mn additions effectively mitigate the harmful effect of heavy metal impurities (e.g., iron) by encapsulating them [24] and reducing the micro-galvanic effects. Yet, large additions of Mn can deteriorate the corrosion resistance of Mg alloys. For instance, in magnesium–aluminum (Mg-Al) alloys, Mn reacts with Al to form Al-Mn intermetallics. Those intermetallics have a higher reduction potential in comparison to the α-Mg matrix and serve as local cathodes [25]. A higher amount of Mn in the alloy results in larger precipitation of Al-Mn particles, and eventually in a higher corrosion rate [11,23]. To avoid this negative effect, no more than 0.5 wt% Mn is added to commercial Mg-Al alloys.
Mg-Al alloys are the most widely used commercial Mg alloys; the optimal combination of mechanical properties is achieved for Mg-6Al alloy [4]. The strength of Mg-Al alloys is generally higher in comparison to the strength of pure Mg, but the rollability and the creep rate of Mg alloys is deteriorated by increasing Al content [26,27]. As for the corrosion properties, Al tends to enrich the oxide layer on the surface of Mg-Al alloys which enhances its passive behavior [9]. Moreover, alloying with Al results in continuous precipitation of β-Mg17Al12 phase at the grain boundaries, which can act as a corrosion barrier in cast alloys [9,28,29]. In wrought alloys the effect of β-phase is different. During extrusion, the continuous network rearranges to non-continuous particles, which serve as local cathodes, thus accelerating the overall corrosion rate [30]. Therefore, binary wrought Mg-Al alloys are not suitable for application as good corrosion-resistant material.
Calcium (Ca) additions to Mg alloys have many advantages. Aside from improving the alloy’s mechanical properties, both at room temperature and at elevated temperatures [31,32,33,34,35,36], Ca was found to enhance corrosion resistance. This is achieved by increasing the α-Mg matrix corrosion potential [10,37], improving the protectiveness of the oxide layer [38,39,40], and precipitation of Ca-containing phases, which may act as corrosion barriers [34,37,41,42,43]. In addition, Ca is a relatively light and cheap material. Hence, the use of Ca may result in the development of cost-effective Mg alloys with good mechanical properties and enhanced corrosion resistance. On the other hand, it was also reported that Ca additions may deteriorate the corrosion resistance mainly due to the appearance of new micro-galvanic cells within the material [40,42,44,45,46,47]. The protectiveness of the oxide film is also questionable. Baek et al. [44] reported that precipitation of the Mg-Al-Ca phase reduces the solutionized Al within the α-Mg matrix and decreased the stability of the corrosion products layer. In addition, the corrosion of Mg alloys in relatively short immersion periods (several hours) is widely studied, whereas there is a lack of knowledge regarding the corrosion behavior in longer immersion periods. This lacking information is very important for further application of the alloys.
The aim of the present study is to compare wrought AM60 alloy (Mg-6Al-0.5Mn in wt%) with and without Ca, and to reveal the influence of alloyed Ca and Ca-containing phases on the alloy’s microstructure and corrosion properties. For this purpose, 1 wt% of Ca was added to wrought AM60 alloy. The corrosion properties and electrochemical behavior of the as-extruded alloys at alkaline solutions were studied and compared, and the role of Ca will be discussed in detail.
2. Materials and Methods
2.1. Alloys Preparation and Microstructure Observations
Pure Mg ingot was melted in a steel crucible under a protective mixture of CO2 and 0.5% SF6. After the addition of Al, Mn and Ca (99.99% purity), the melt was mechanically stirred, cast and homogenized for 12 h at 400 °C. The extrusion process was proceeded at 300 °C, with an extrusion ratio of 56:1 and ram speed of ~0.8 cm/min. The chemical composition of the as-extruded alloys was measured by optical emission spectroscopy and the results are shown in Table 1.
For microstructure observation the specimens were polished up to 1 μm and etched in a solution containing 1.5 g picric acid, 10 mL distilled water and 25 mL ethanol. The microstructure of the as-extruded alloys was investigated using Rigaku D/MAX-2000 X-ray diffractometer (XRD), Rigaku, Tokyo, Japan Nikon Eclipse MA200 light microscopy (LM), Nikon, Tokyo, Japan, JEOL JSM-IT100 scanning electron microscopy (SEM) JEOL, Tokyo, Japan, and Jeol JEM-2100F transmission electron microscope (TEM), JEOL, Tokyo, Japan.
2.2. Corrosion Measurements
The corrosion properties of as-extruded alloys were studied in alkaline 3.5 wt% NaCl solution saturated with Mg (OH)2 and NaOH solution at room temperature. The pH of both solutions was set to ~10.5. In this pH, Mg alloys can form a protective oxide or hydroxide layer which checks the dissolution reaction [8]. For the electrochemical tests, a standard three-electrode cell was used, with a platinum reference electrode, a silver-chloride counter electrode, and an Mg specimen with an active area of 1 cm2 served as a working electrode. The samples were wet grounded to 5 μm SiC. Prior to electrochemical tests, the specimens were immersed in the solution for 1 h to obtain a stable open circuit potential (Eocp). The potentiodynamic polarization (PDP) curves were carried out in a potential range of −500 mV to +1000 mV vs. Eocp at a scan rate of 1 mV/s. The electrochemical impedance spectroscopy (EIS) tests were performed in the frequency range 0.01 Hz–100 kHz with an amplitude of 0.01 V. Both PDP and EIS tests were conducted after 1 h, 1 day, 2 days and 3 days of immersion. All the corrosion tests were repeated at least three times to check for reproducibility.
Immersion tests were performed at room temperature for 30 h. The specimens with an exposed area of 6 cm2 were ground to 5 μm and immersed in the solution. Hydrogen gas was collected in a burette, and the corrosion rate was evaluated according to [48]. The hydrogen evolution rate in NaOH solution was measured by the gravimetric method, described by Fajardo and Frankel [49]. After the immersion test, the samples were cleaned in chromic acid for two minutes in order to remove the corrosion products, and the corroded surfaces were studied by the Nikon SMZ745T stereoscope, Nikon, Tokyo, Japan
Surface potential maps were recorded using an Asylum Research MFP-3D-BIO scanning Kelvin probe force microscope (SKPFM) Oxford Instruments Asylum Research, High Wycombe, UK, with a silicon tip coated with Ti/Ir (5/20), working in tapping mode. The scan height in the lift mode was 25 nm, and the scan rate was 0.25 Hz. Prior to the testing, the specimen’s surface was polished up to 1 μm, cleaned in acetone and ethanol and dried in air. The test was performed at room temperature and relative humidity of ~30%.
The corrosion products layer was examined by X-ray photoelectron spectroscopy (XPS, ESCALAB 250) Thermo Fisher Scientific, Waltham, MA, USA, with Al Kα radiation source at room temperature. The sputtering rate was 0.2 nm/s. Prior to the XPS analysis, the specimens were ground to 5 μm SiC and immersed in the electrolytes for 300 s in the open circuit potential.
3. Results and Discussion
3.1. Microstructure
Figure 1a,b shows the optical micrographs of as-extruded AM60 with and without Ca addition. The microstructure mainly consists of α-Mg grains, with average grain size 6.1 ± 0.4 μm and 6.4 ± 0.3 μm for AM60 and AMX601 alloys, respectively. Alloying with Ca usually refines the microstructure [40,42,43,44]; however, Baek et al. [44] and Mingo et al. [50] reported no change in the grain size of extruded AZ61 after alloying with Ca. Large polygonal-shaped precipitates of the Al-Mn phase were observed in both alloys, Figure 1c,d. A remarkable change in the microstructure of AM60 alloy as a result of Ca addition, is massive precipitation of Ca-containing second phase particles, as shown in Figure 1d. These particles are small and are arranged with the extrusion direction.
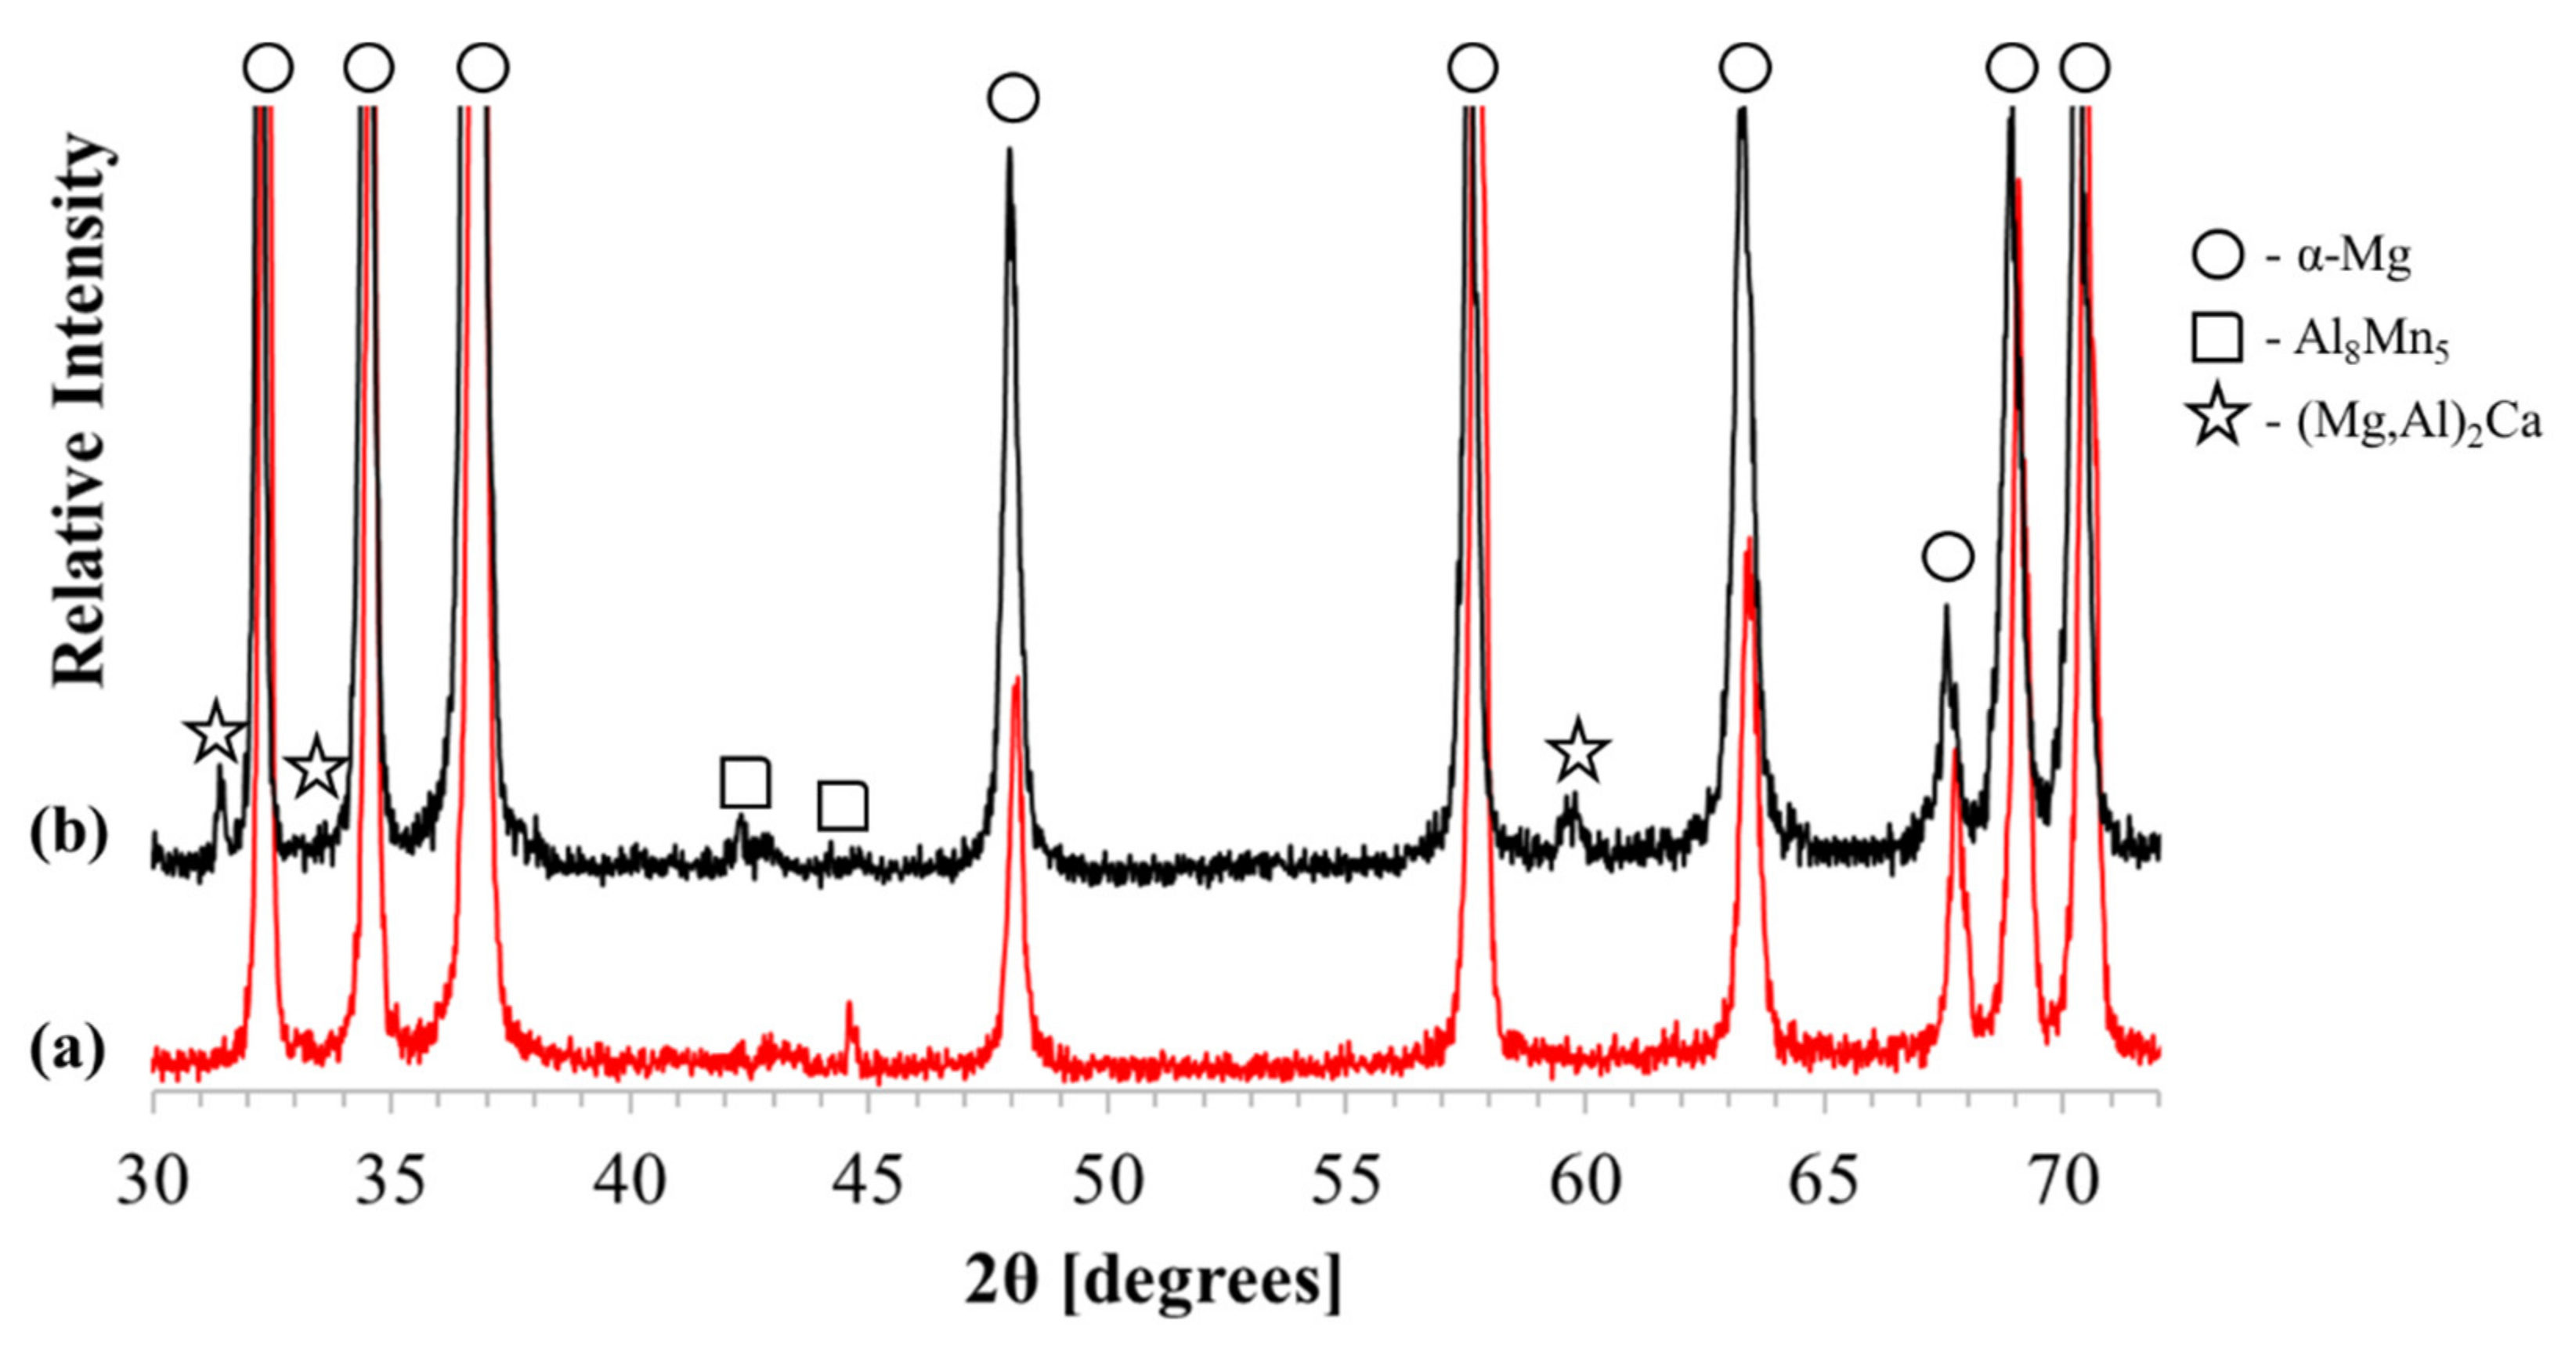
XRD patterns of the as-extruded alloys in Figure 2 confirm the presence of the Al8Mn5 phase. The additional peaks in the pattern of AMX601 alloy can be ascribed either to (Mg-Al)2Ca or to Mg2Ca phases since both phases possess a similar crystal structure [51].
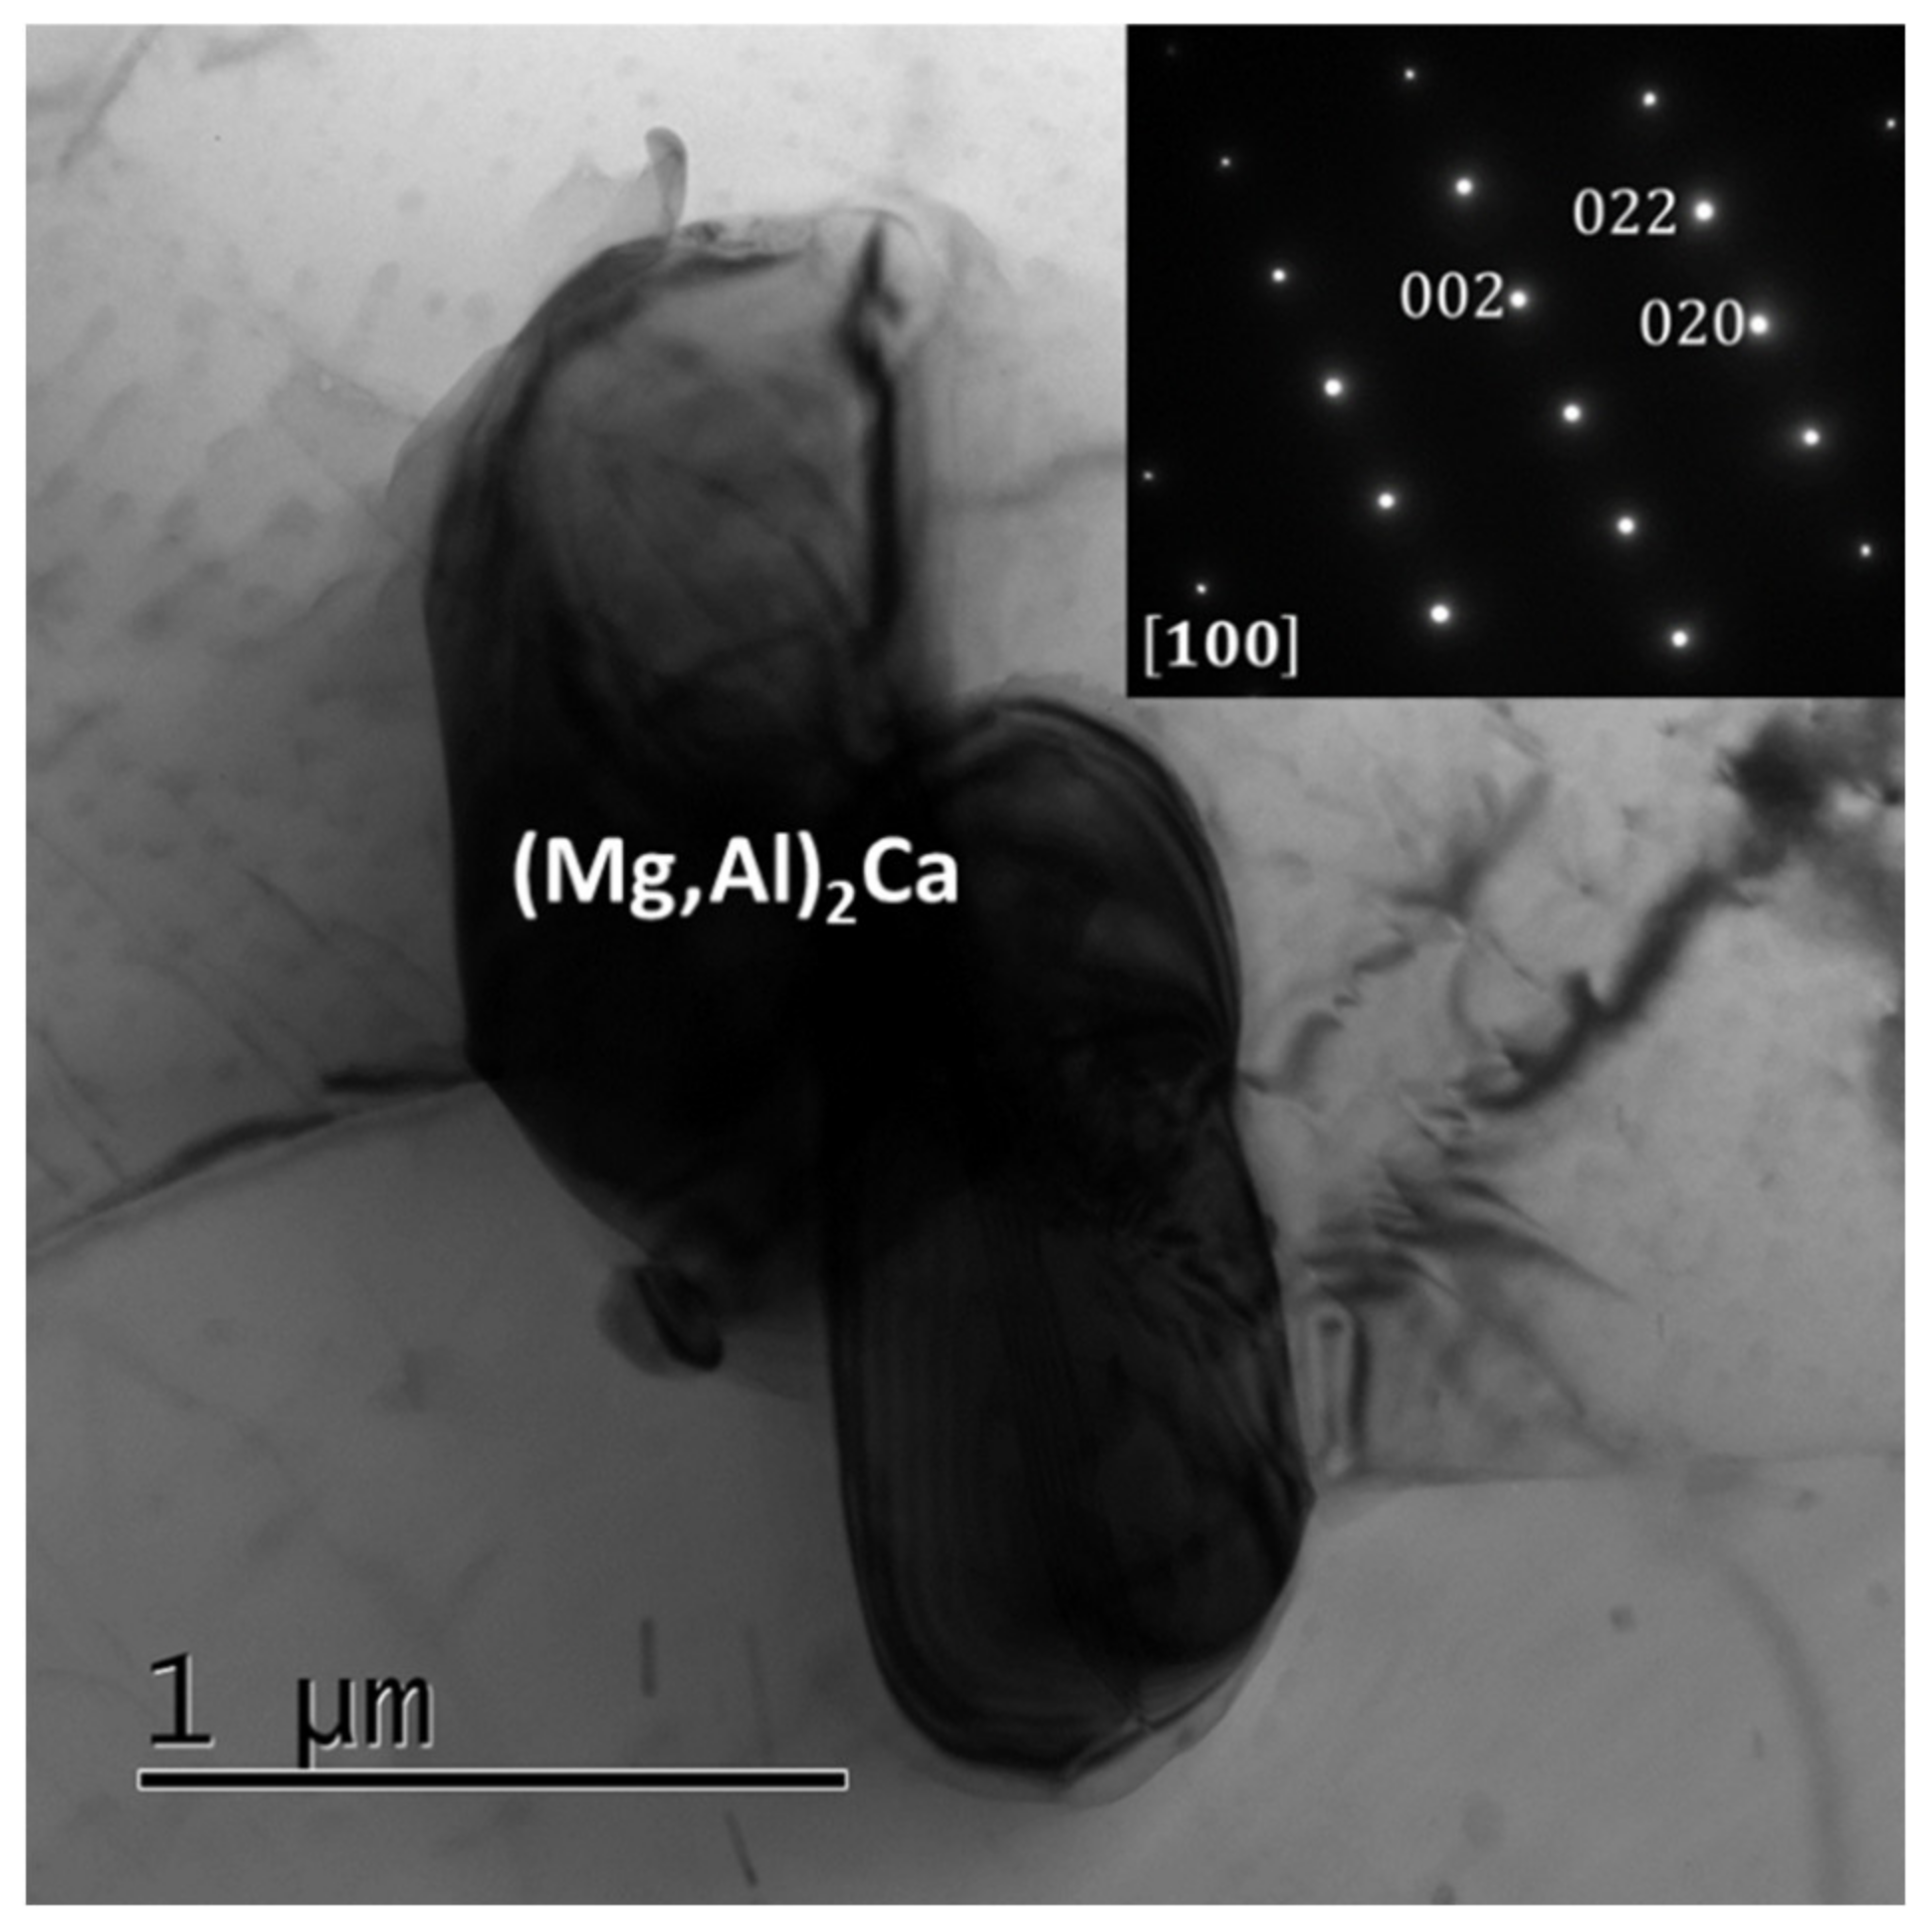
Thus, detailed phase identification was carried out through TEM measurements, Figure 3. TEM diffraction pattern (inset in Figure 3) confirmed the presence of hexagonal (Mg, Al)2Ca phase (S.G. P63/mmc, a = 6.5 Å, c = 9.5 Å). The average composition of this phase, as measured by TEM/EDS is 7.7 at.% Mg, 59 at.% Al and 33.3 at.% Ca. In addition, in our previous study [11] small particles of β-Mg17Al12 were found in wrought AM50 alloy; hence it is reasonable to assume that it is also presented in wrought AM60 alloy which was prepared by the same method and process parameters as AM50 alloy in [11]. However, no β-phase was observed in the AMX601 alloy in various areas of the specimen. This phenomenon was observed by several researchers, who suggested that Ca additions suppress the precipitation of β-phase [43,52], especially when Ca-containing phases are formed [53].
3.2. Scanning Kelvin Probe Force Microscope Measurements
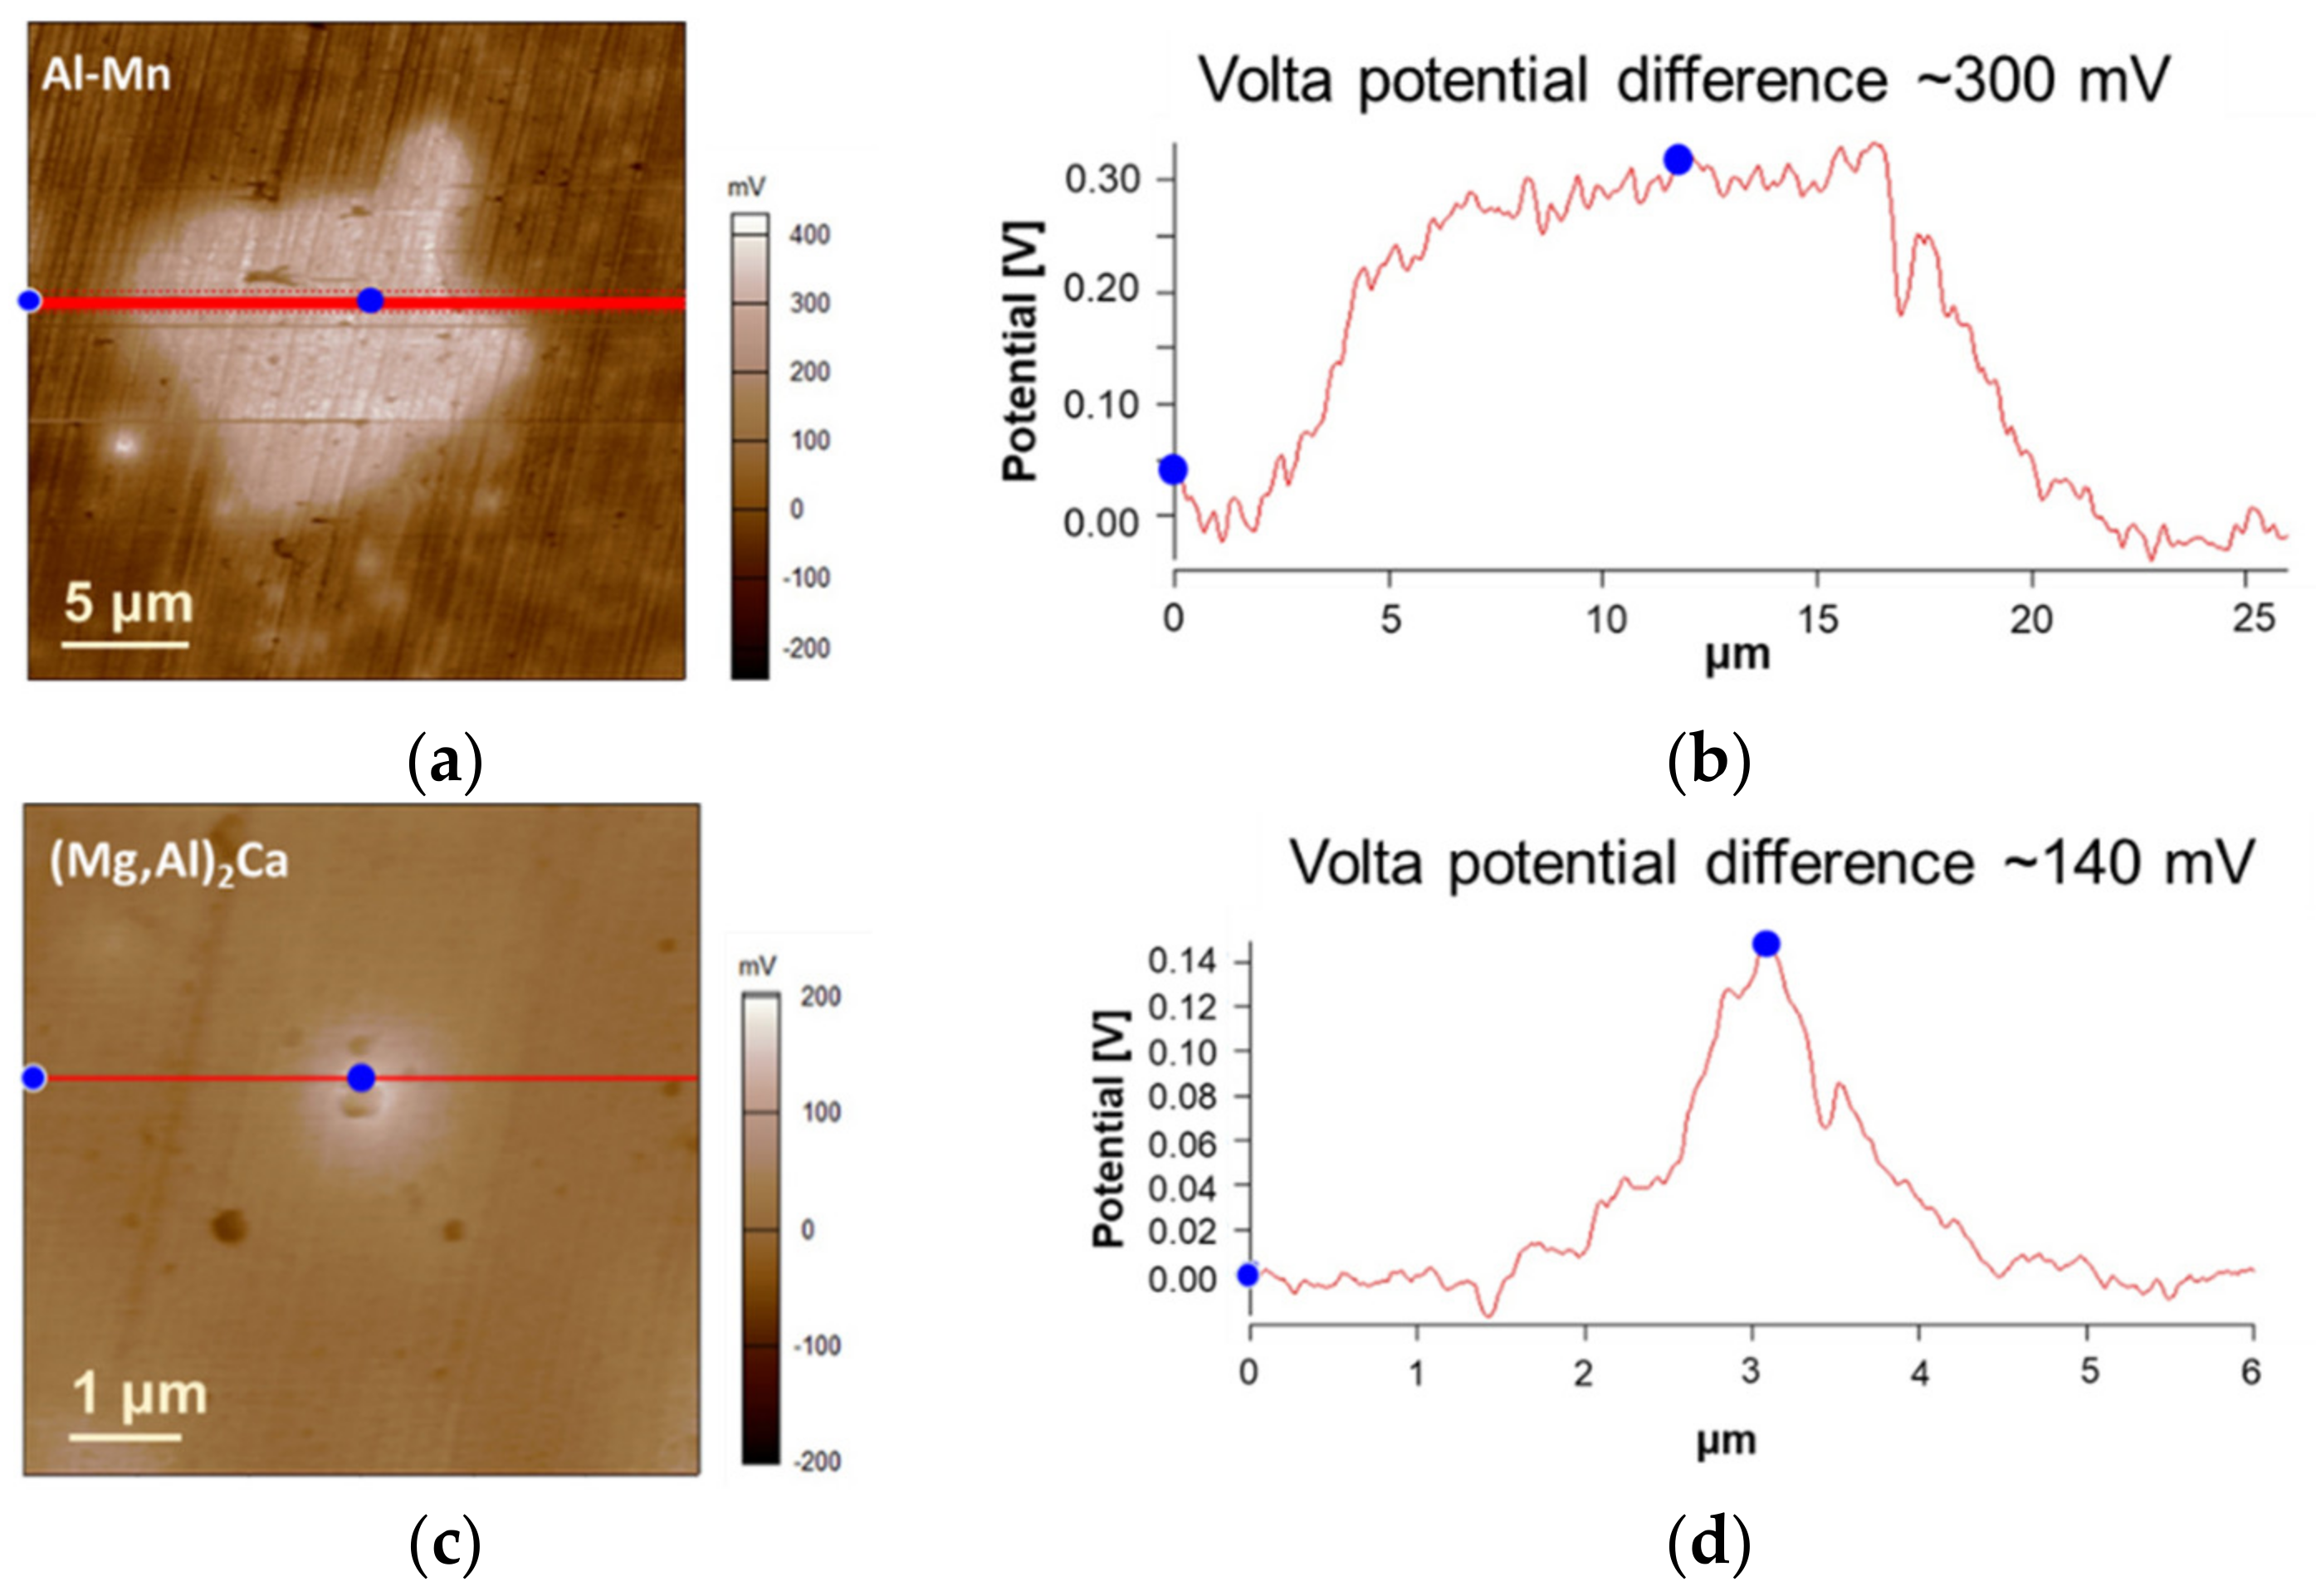
In order to distinguish the effect of the second phase particles on the corrosion behavior of AM60 and AMX601 alloys, an SKPFM test was performed. Figure 4 shows the Volta potential maps of the two types of particles: (1) Al-Mn, and (2) (Mg-Al)2Ca. Both phases have greater Volta potential than the α-Mg matrix, suggesting a cathodic behavior [54]. It was shown previously that Al-Mn and Ca-containing phases (e.g., Mg2Ca, Al2Ca, and (Mg-Al)2Ca) are electrochemically more noble than the α-Mg matrix [11,30,44,45,46,54,55]. Consequently, a micro-galvanic cell is created between the surrounding matrix and the second phase particles, which serve as local cathodes. This results in preferential dissolving of the α-Mg matrix around those particles and increasing of the overall corrosion rate.
The Volta potential difference measured between the α-Mg matrix and Al-Mn particle is about ~300 mV, Figure 4b. This value is close to the previously reported Volta potential difference between Al-Mn intermetallic and α-Mg matrix in wrought AM50 alloy [11]. Since there is no difference in Al and Mn concentrations in the alloys (Table 1), it is reasonable to assume that the amount of the Al-Mn particles is the same; thus, they will have the same influence on the alloy’s corrosion behavior. Additional (Mg-Al)2Ca particles with a Volta potential difference of ~140 mV (Figure 4d) are expected to deteriorate the corrosion resistance of AMX601 alloy. This value is close to the one reported by Baek et al. [44] in AZC611 alloy. It should be noted that the Volta potential difference between the α-Mg matrix and (Mg-Al)2Ca phase is lower in comparison to the β-phase, which is reported to be around ~200 mV [30,56,57]. In other words, due to the addition of Ca the precipitated β-phase changes to a Ca-containing phase, which might decrease the micro-galvanic effects.
3.3. Immersion Tests
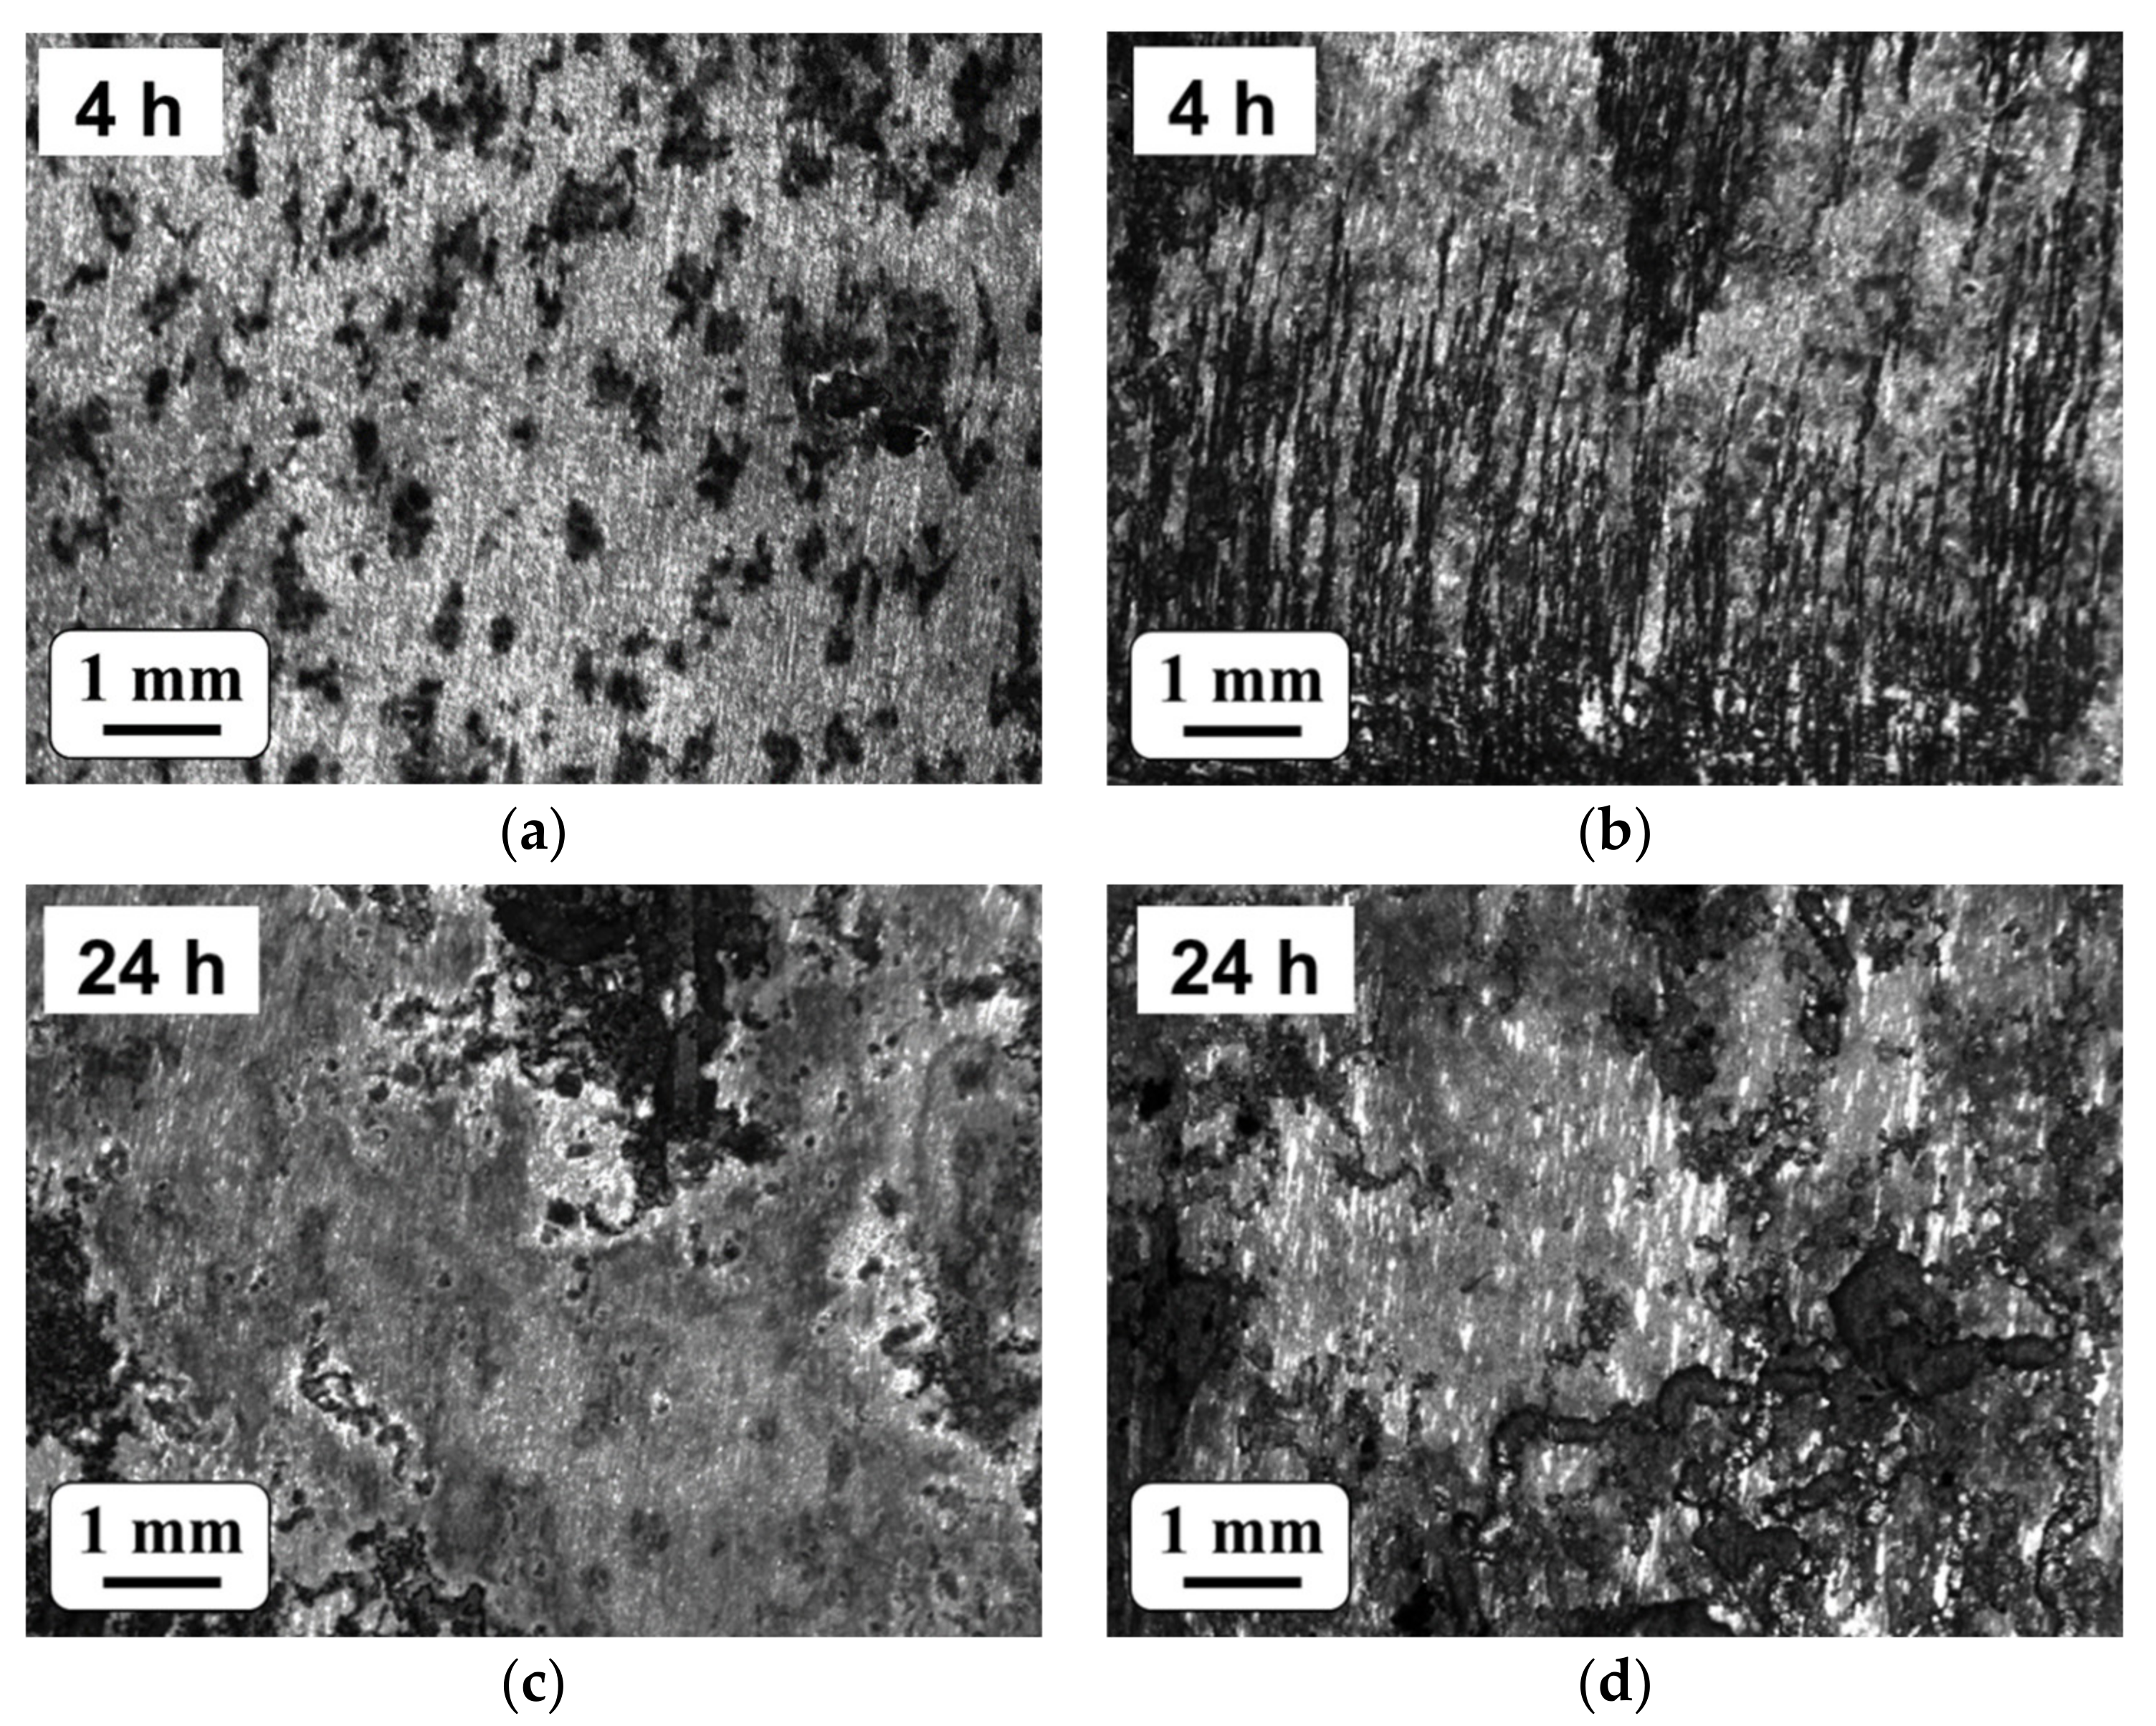
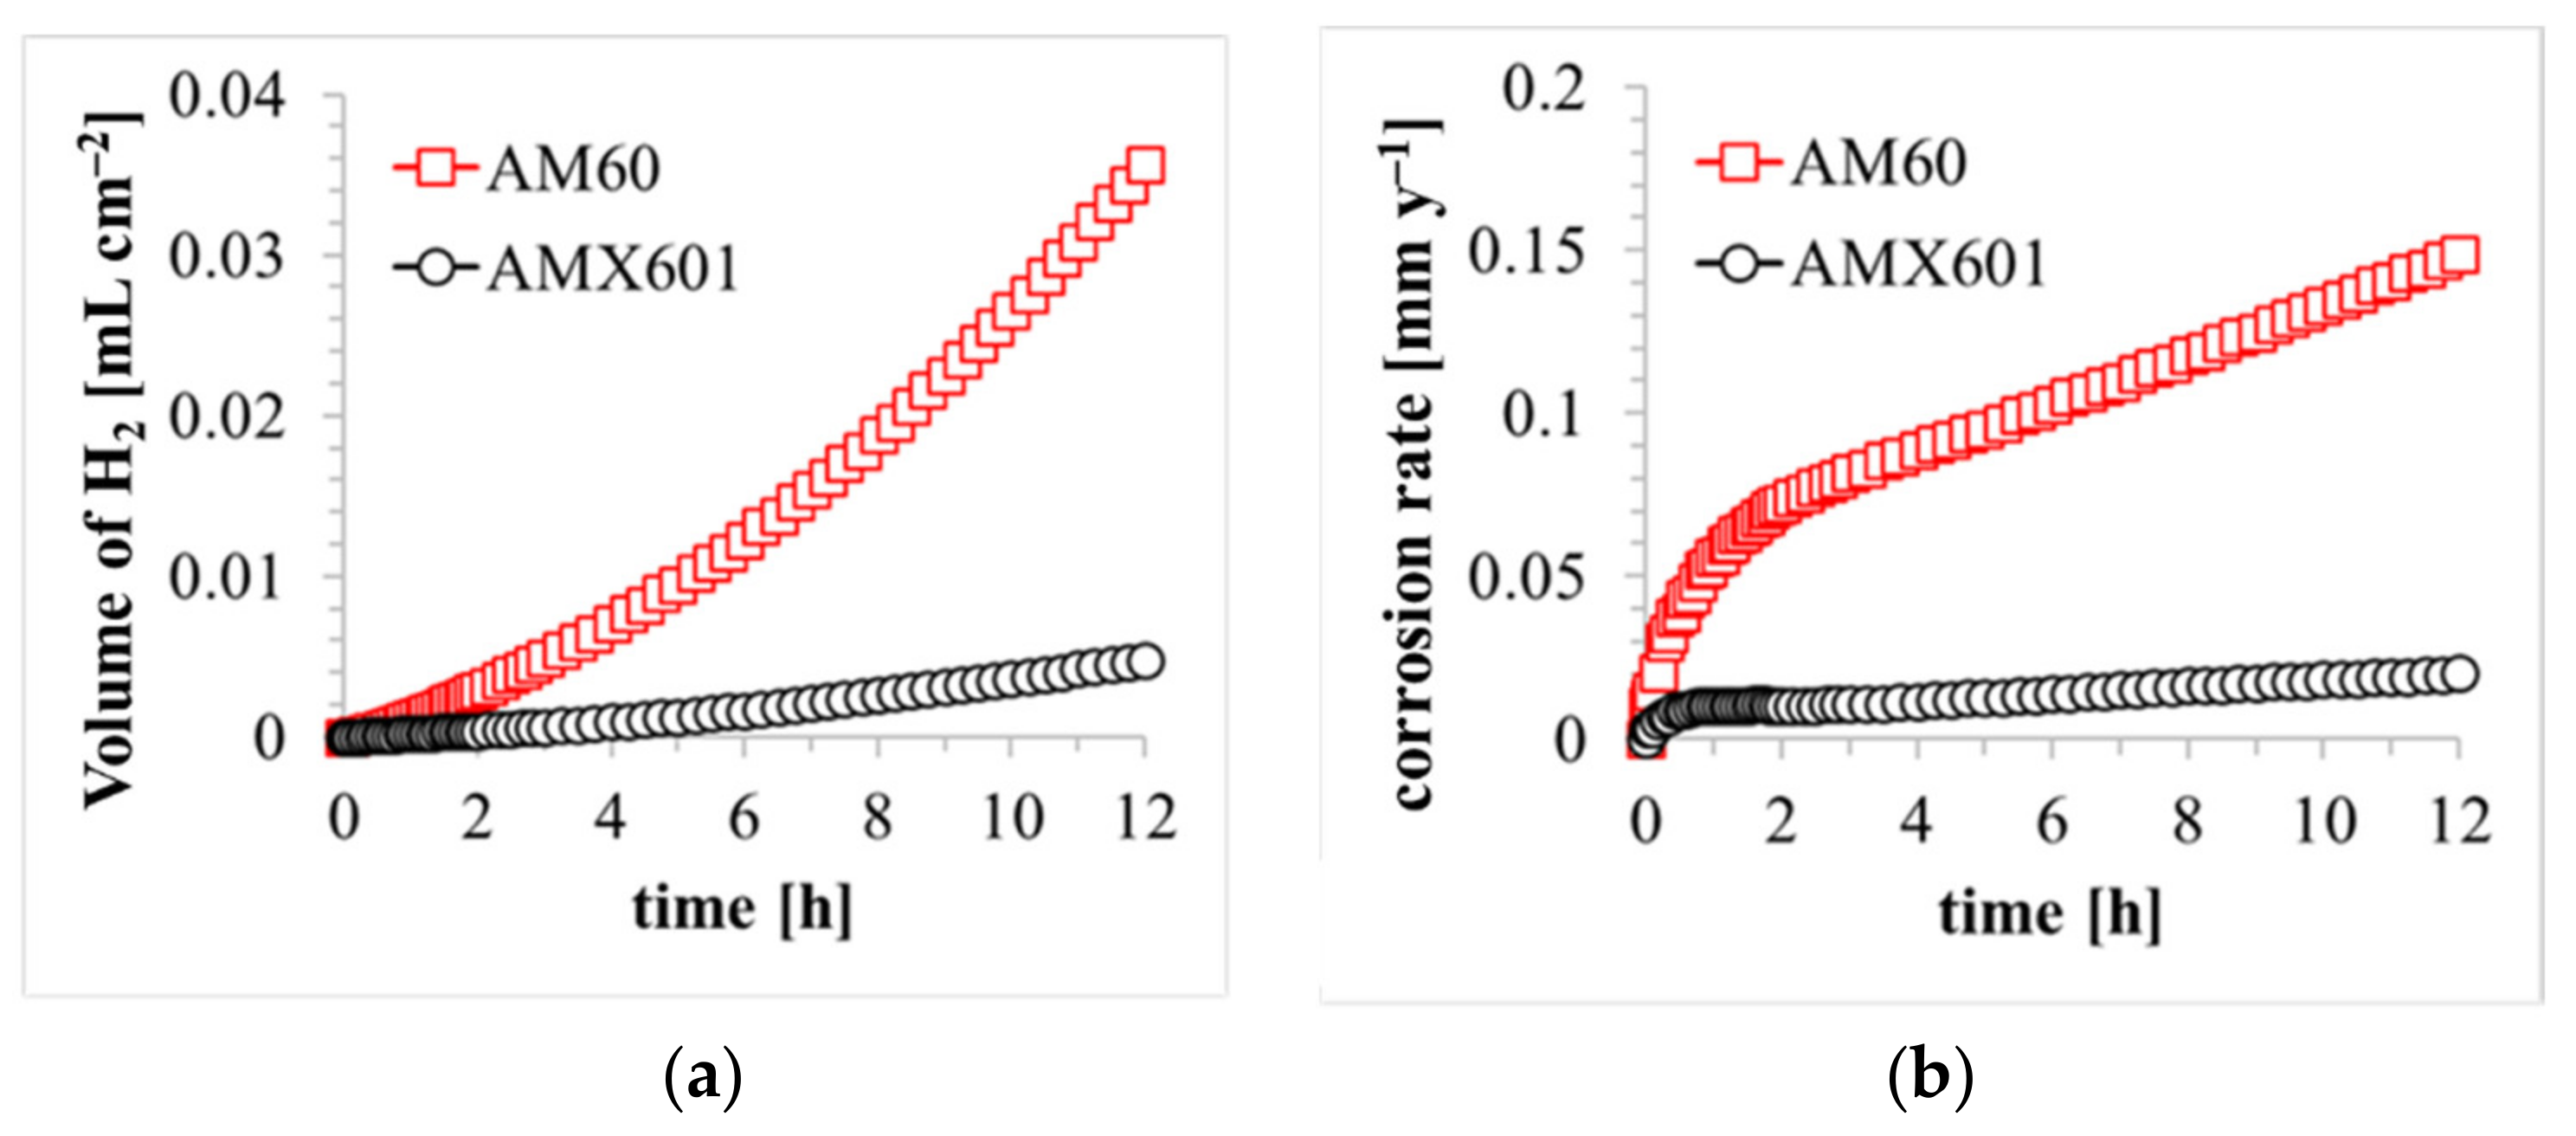
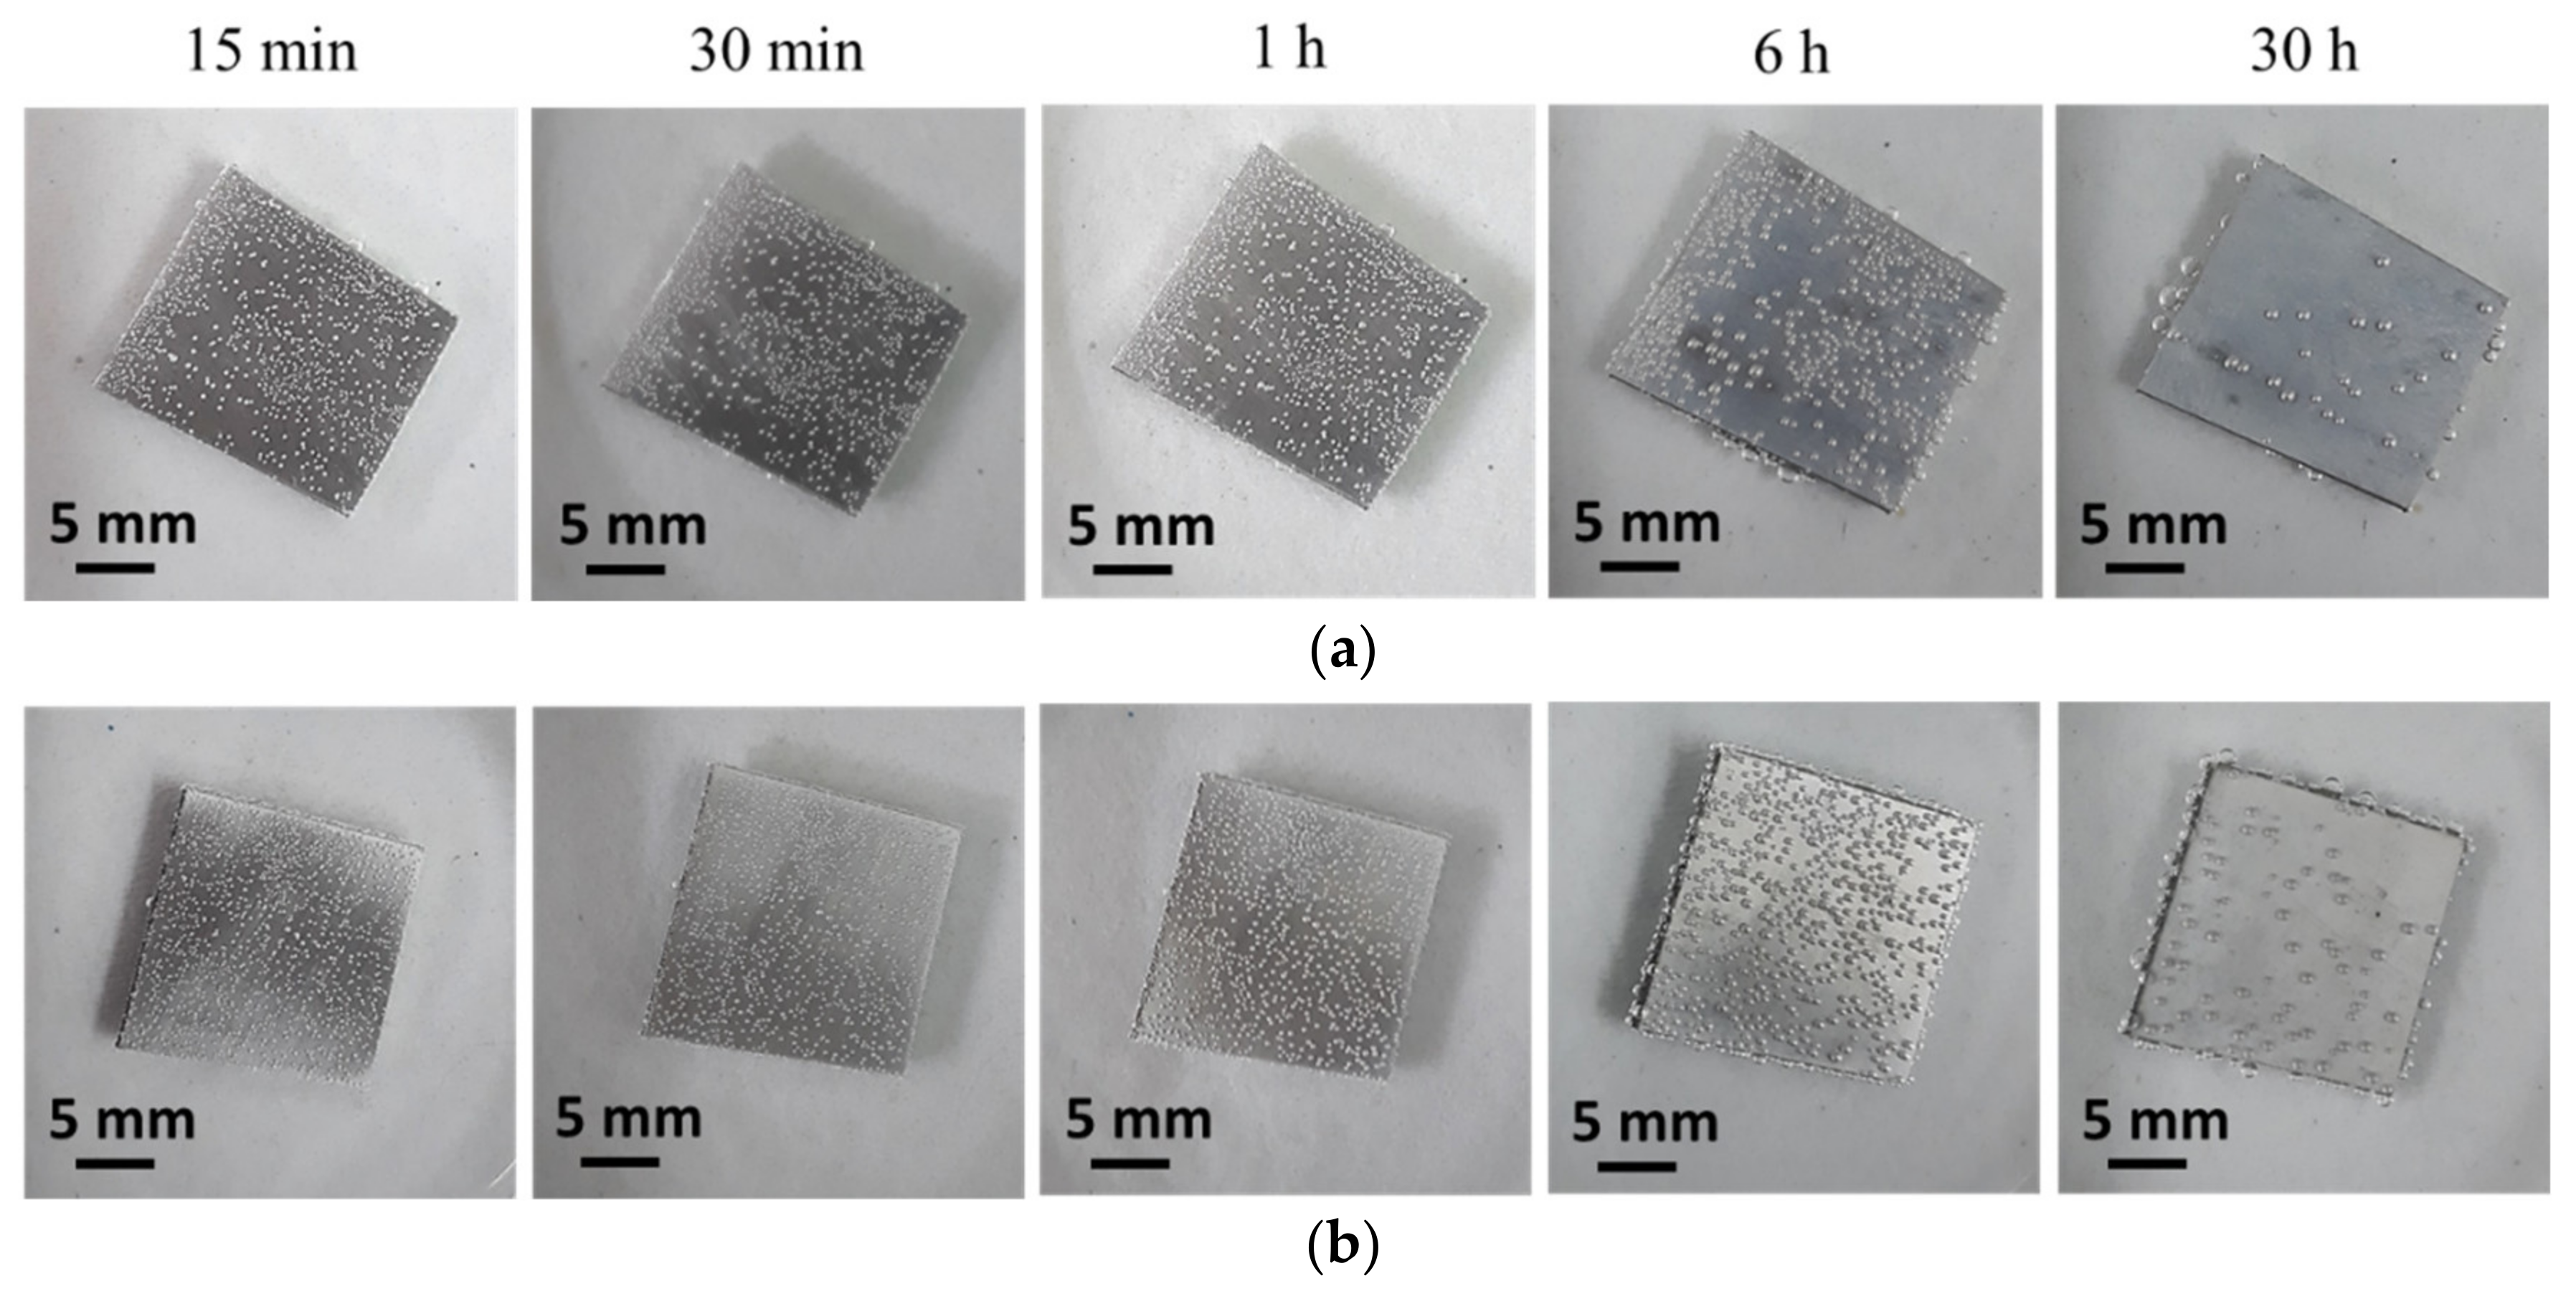
Figure 5a presents the volume of hydrogen evolved during the immersion in 3.5 wt% NaCl solution, saturated with Mg (OH)2. The cathodic reaction, and the corresponding corrosion rate, shown in Figure 5b, were enhanced with Ca addition. Localized corrosion was observed on the alloy’s surface during the immersion, Figure 6. Although hydrogen bubbles were observed on both alloys after 15 min, it is clearly seen that the corrosion initiation and propagation are faster in the AMX601 alloy. The macrograph of the corroded surface after removal of the corrosion products in Figure 7a presents clear pitting corrosion for AM60 alloy after 4 h of immersion. On the contrary, the corrosion of AMX601 alloy propagated as filiform corrosion, Figure 7b. The same tendency was observed after 24 h of immersion: AM60 alloy still has only pitting corrosion damage, Figure 7c, whereas AMX601 alloy exhibit mixed pitting and filiform corrosion, Figure 7d. Nonetheless, the corrosion damage seems to cover more surface at AMX601 alloy, yet the pits of AM60 alloy are deeper.
In order to check the effect of Ca on the corrosion behavior of AM60 in the absence of Cl− ions, an immersion test was carried out in NaOH solution with the same pH, as the NaCl solution (~10.5). Since the hydrogen evolution rate was very low and unable to be measured by the volumetric method, a gravimetric method [49] was used instead. This method is more sensitive than volumetric since it can take into account all the hydrogen bubbles produced by the corrosion reaction, even those that remain on the alloy’s surface.
According to the results shown in Figure 8a, the hydrogen evolution rate of both alloys in the absence of Cl− ions is two orders of magnitude lower than in the NaCl solution (Figure 5). The corresponding corrosion rate of AM60 alloy is higher in comparison to AMX601 alloy, Figure 8b. Hydrogen bubbles appeared after 15 min of immersion, yet no visible corrosion damage was observed on the surface of both AM60 and AMX601 alloys after 30 h (Figure 9). A protective oxide layer appeared on the alloy’s surface, manifested by the loss of the metallic luster. According to the results of the immersion test, Figure 8, it seems that the oxide layer of AMX601 is more stable and protective in comparison to AM60 in the absence of Cl− ions.
3.4. Electrochemical Tests
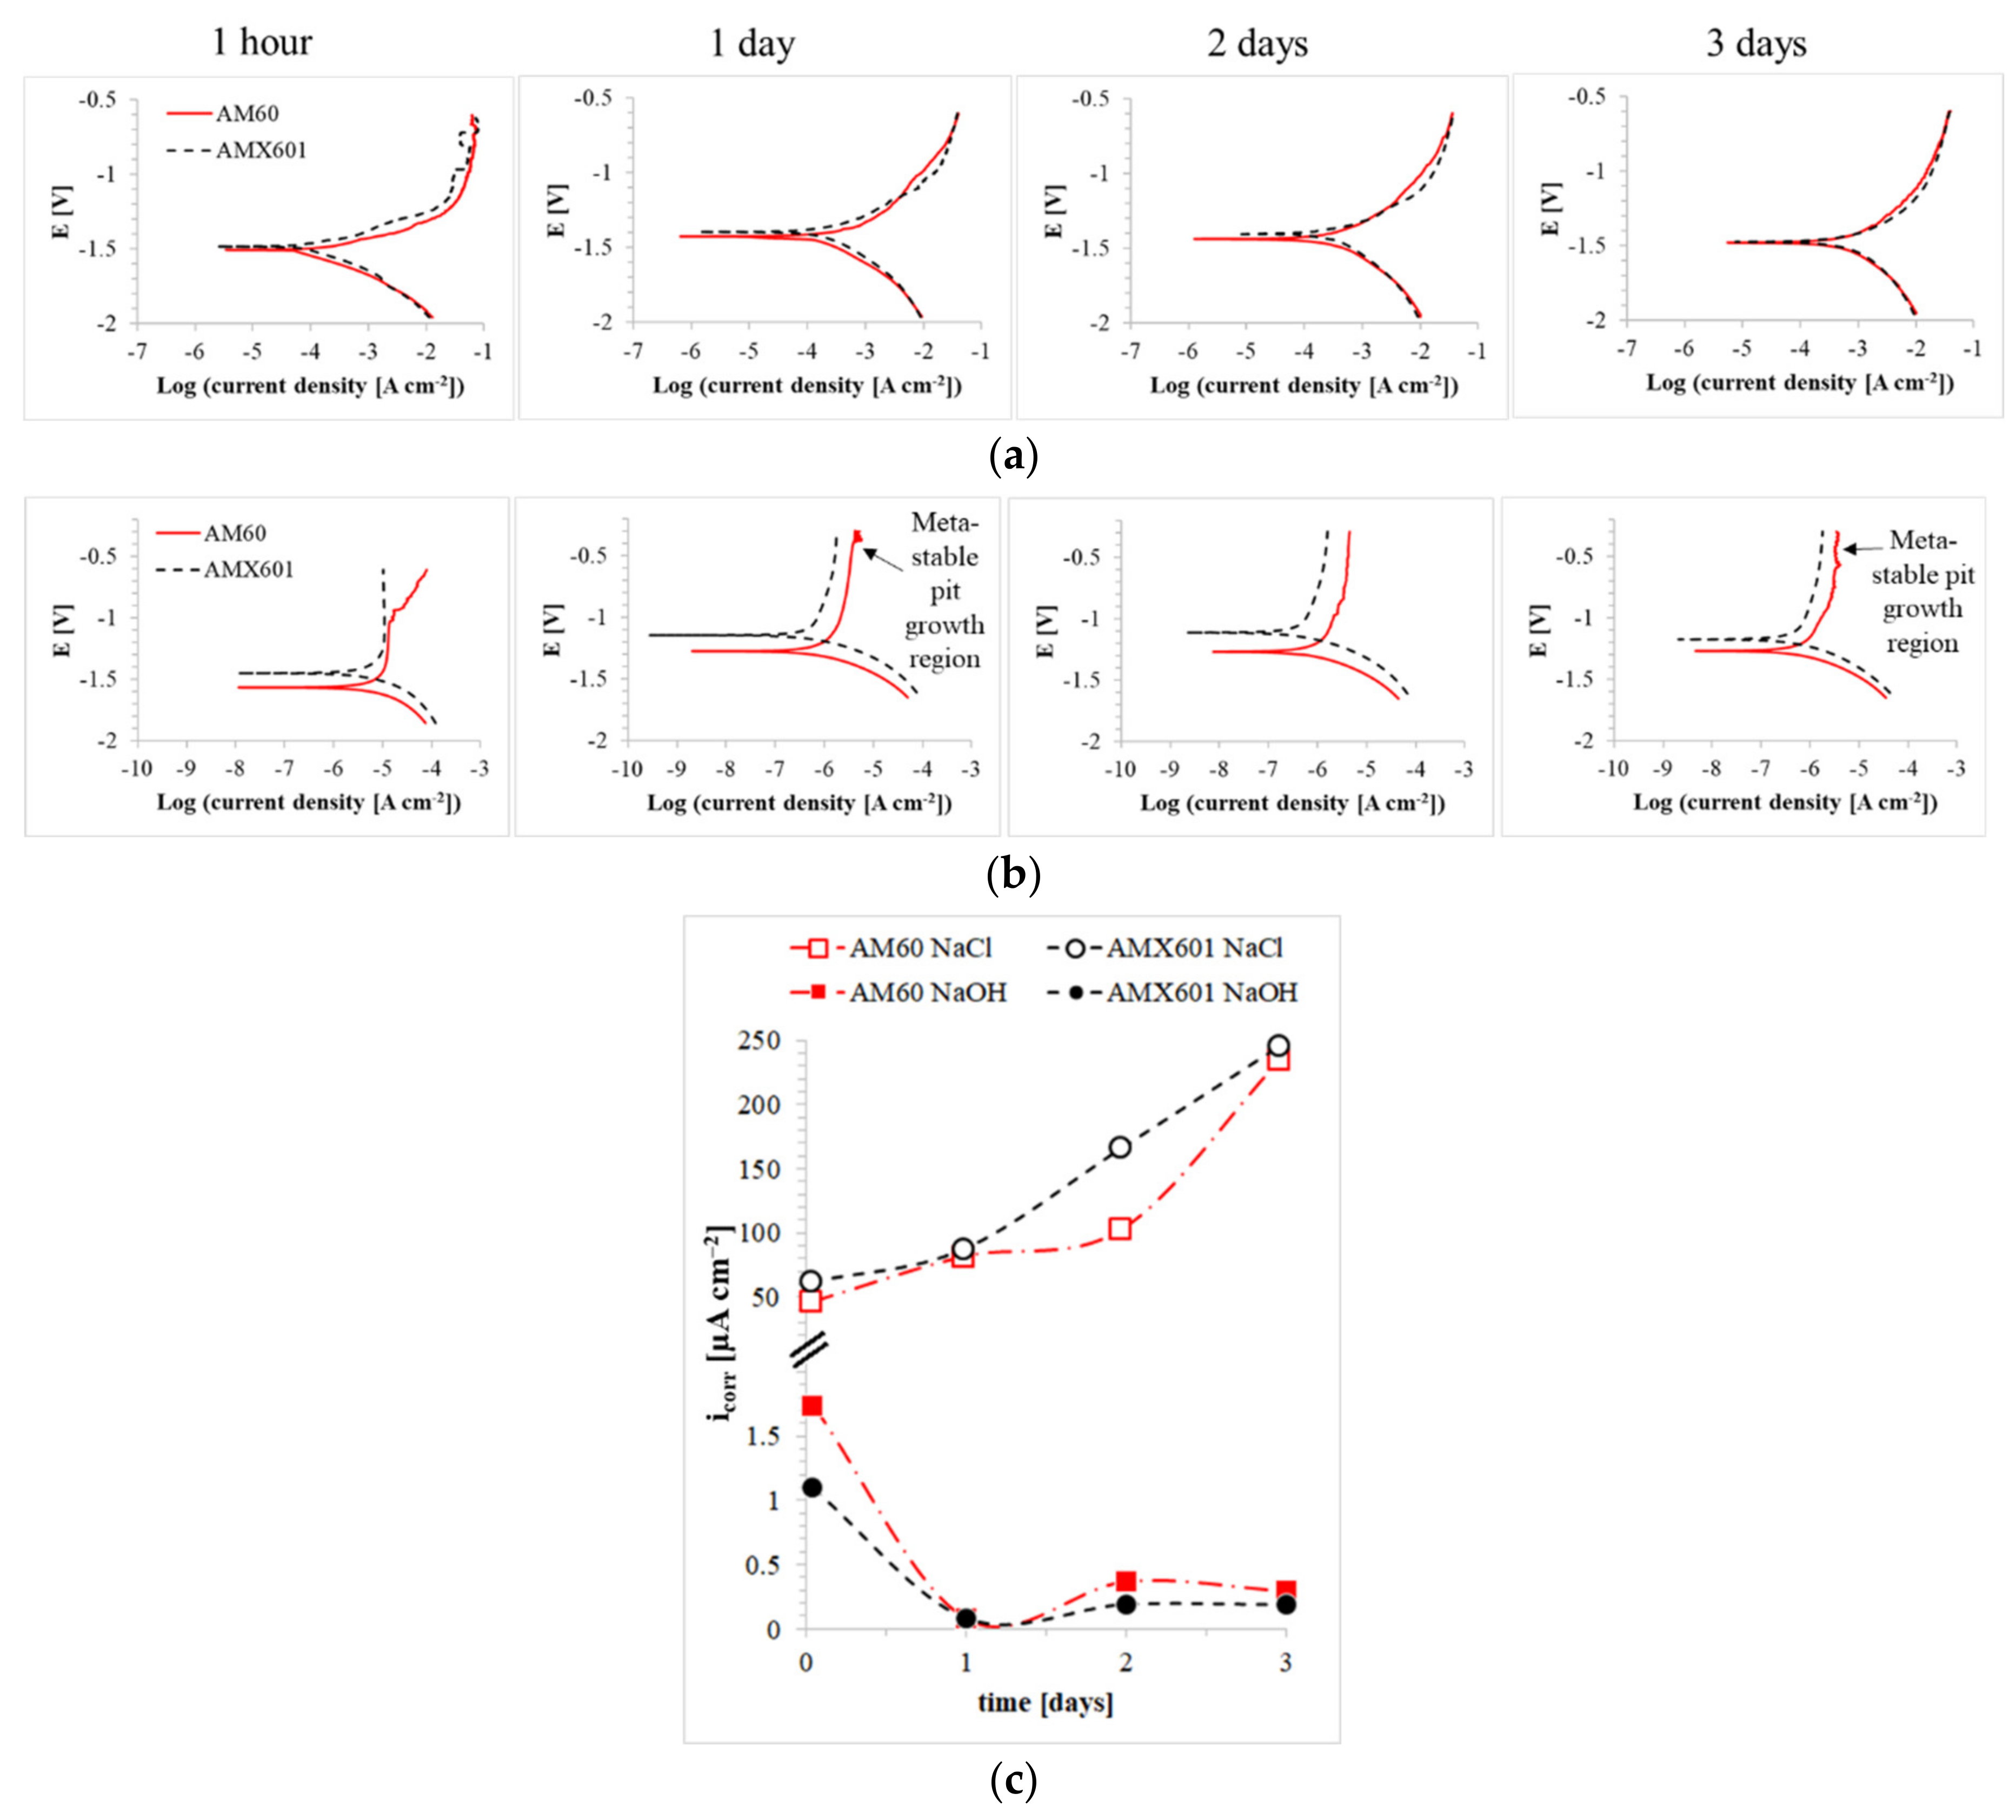
For further study of the alloy’s corrosion behavior, potentiodynamic polarization (PDP) tests were conducted. Figure 10a presents the PDP curves of AM60 and AMX601 in 3.5 wt% NaCl solution, saturated with Mg (OH)2 after different immersion periods. The corrosion current density (icorr) was measured by Tafel extrapolation of the cathodic branch, as described by Tkacz et al. [58], and the results are shown in Figure 10c and Table 2. Clearly, alloying with Ca increases the icorr of wrought AM60 alloy and deteriorates the corrosion resistance in NaCl solution. Longer immersion periods result in a higher value of icorr for both alloys. These observations are consistent with the results of immersion test, Figure 5.
Performing the polarization tests in NaOH solution, Figure 10b, resulted in passive behavior for both alloys at anodic potentials, indicating a growth of the protective oxide layer. A metastable pit growth region [59] was observed for AM60 alloy at relatively high potentials, expressed by spikes of the current density with increasing potential. The initiation of pitting is characterized by increasing the current density, however, if their growth is metastable and they can repassivate, the current density decreases. The icorr values calculated for AM60 alloy are slightly higher than those of AMX601 alloy. Moreover, increasing immersion time decreased the icorr of both alloys. The inhabitation of the corrosion reaction is probably due to the formation of a passive layer on the alloy’s surface. The addition of Ca resulted in a more protective behavior of the layer in NaOH solution, as was observed in the immersion test, Figure 7.
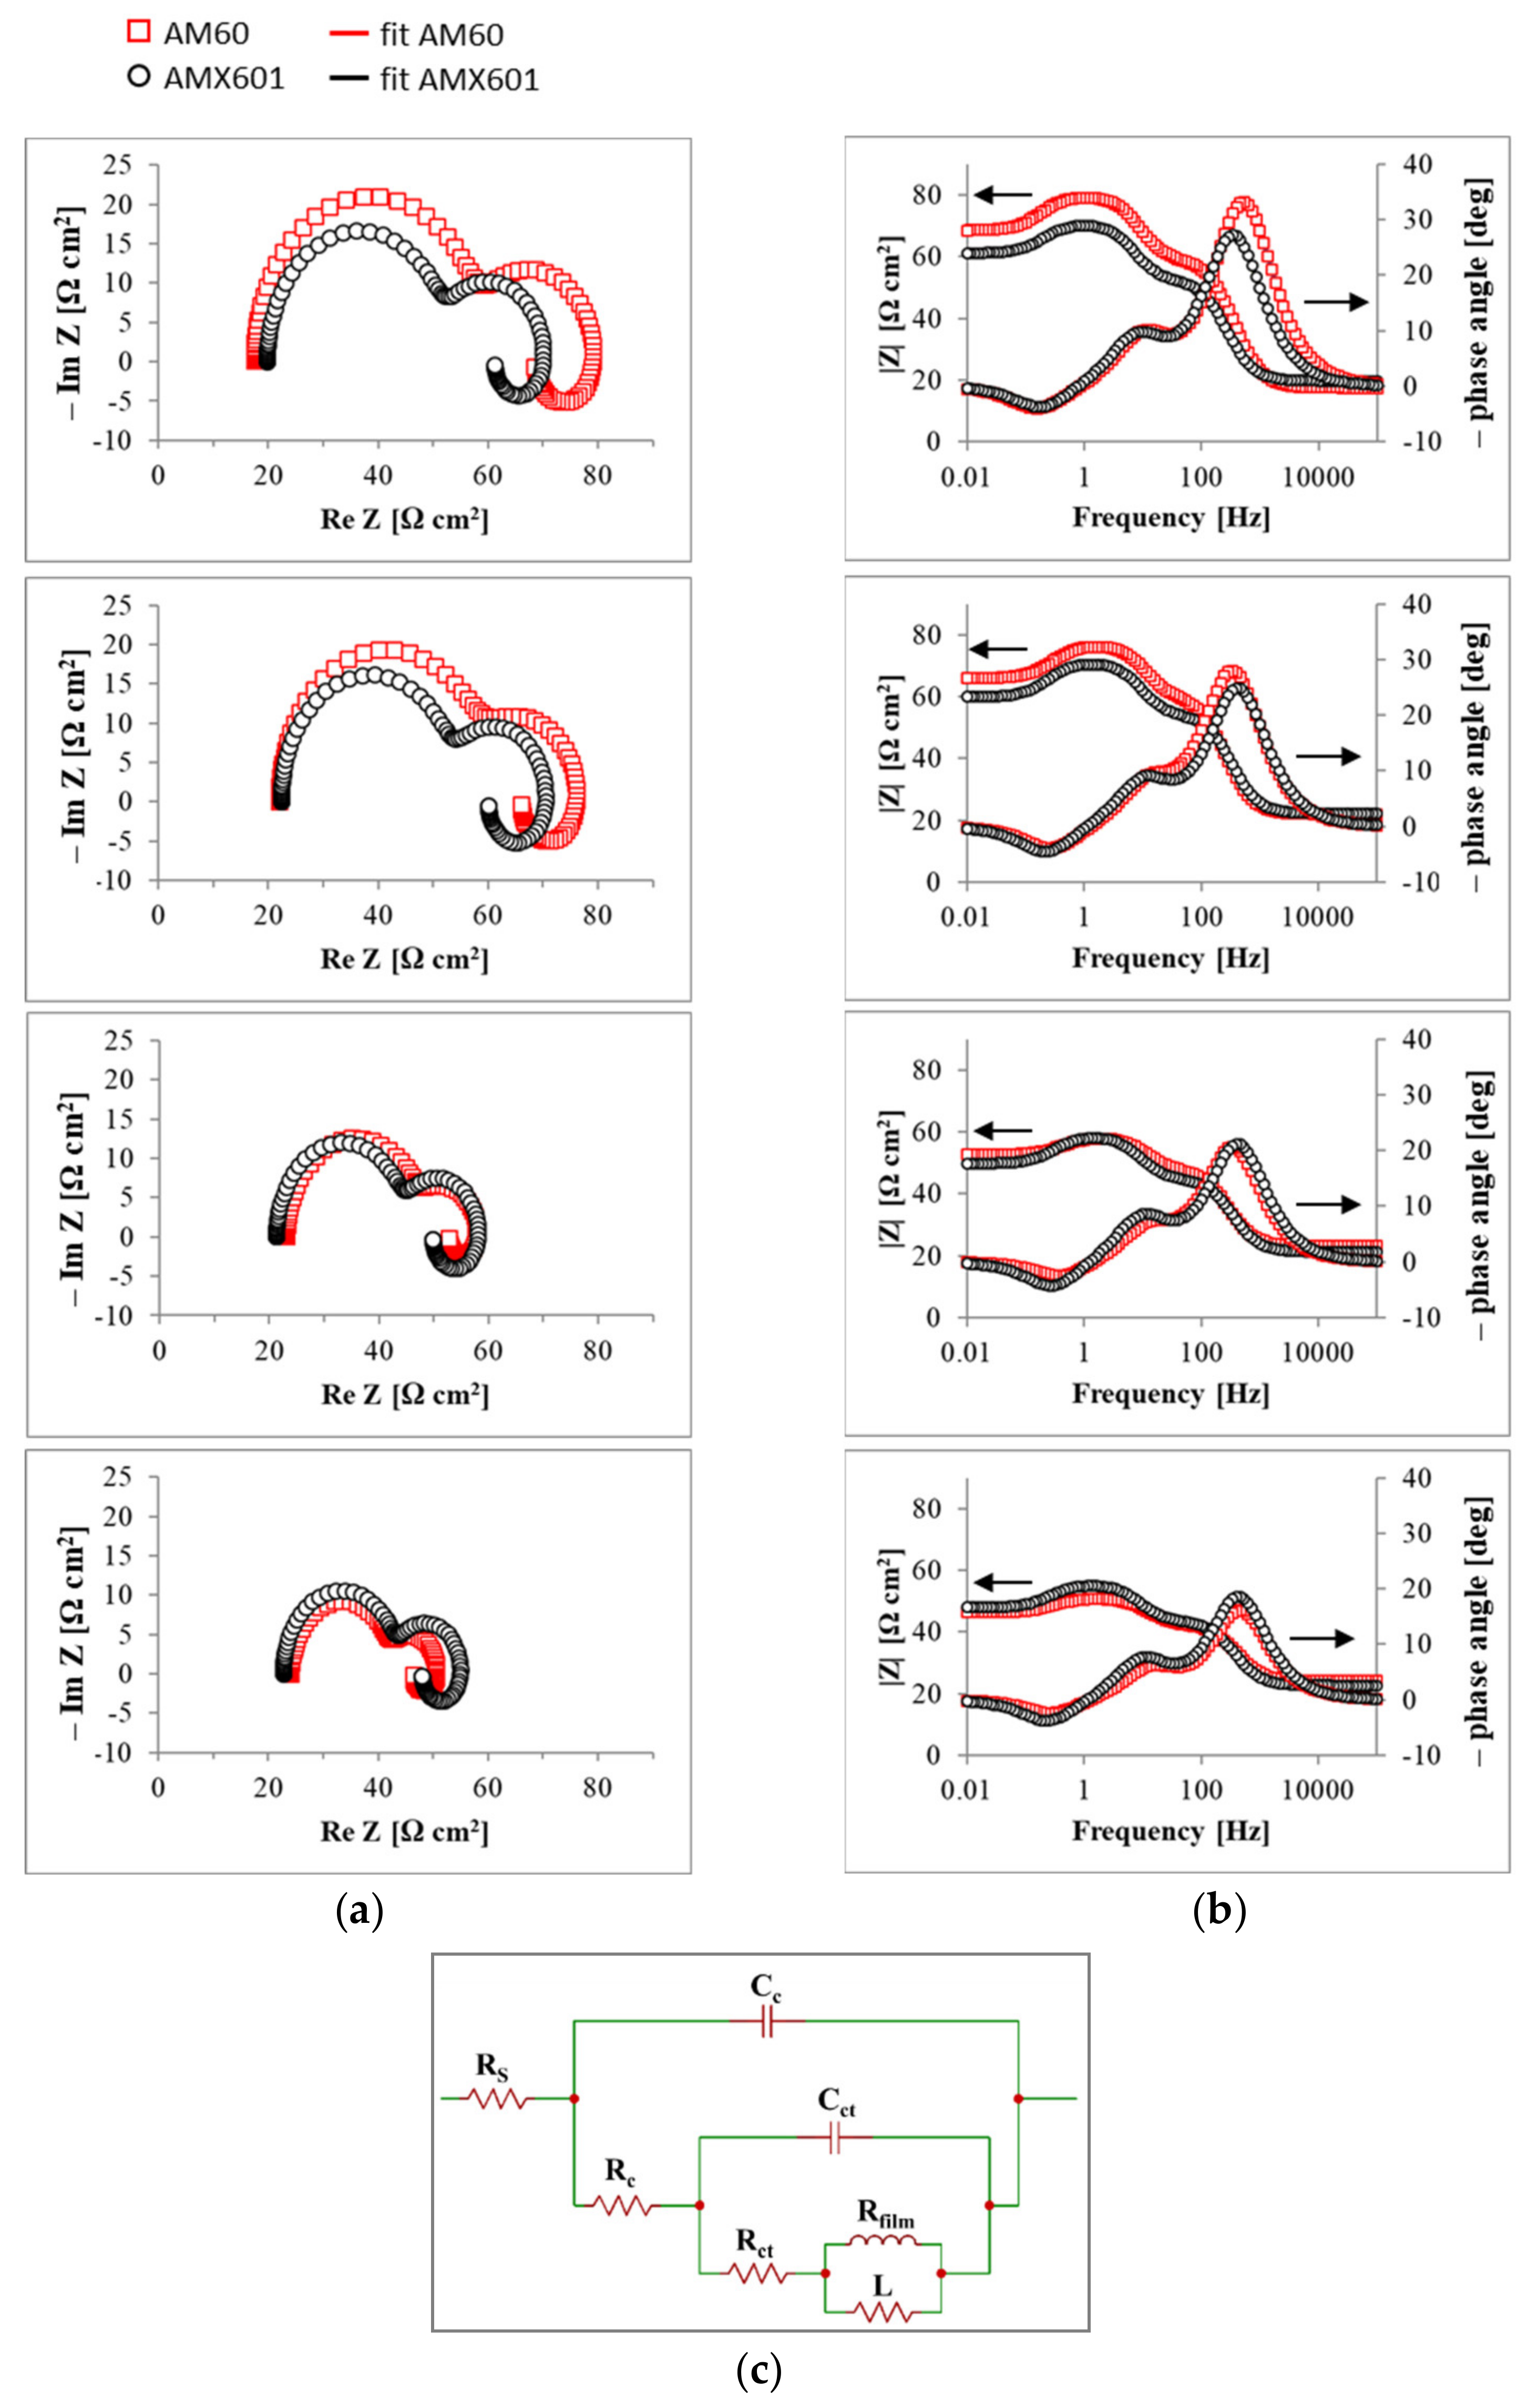
In order to ensure the suggestion above, EIS measurements were performed. Figure 11 presents the Nyquist and Bode plots of AM60 and AMX601 alloys in 3.5 wt% NaCl solution, saturated with Mg (OH)2. During three days of immersion, both alloys exhibit two capacitance loops, as can be seen in Figure 10a. The loop at high frequencies is associated with the double layer that exists in the interface between the alloy’s surface and the solution, whereas the loop at low frequencies is attributed to the corrosion products layer [60]. In addition, an inductive loop is observed at low frequencies, implying only a partially protective oxide layer [61]. Increasing immersion time decreased the corrosion resistance of the alloys, manifested by decreased impedance. At short immersion times, it seems that the addition of Ca deteriorated the corrosion resistance of wrought AM60 alloy; the impedance values of AMX601 alloy are lower and the phase aperture is narrower, Figure 10b. However, after three days of immersion, the impedance values of both alloys are very close and so are the phase apertures, indicating the same corrosion resistance. It seems that the deterioration of corrosion resistance with increasing immersion time is more pronounced for the AM60 alloy.
The EIS data were fitted by Ivium Software. Version 4.999, Ivium Technologies, Eindhoven, The Netherlands, to an equivalent circuit [11], shown in Figure 10c, and the results are shown in Table 3. In this circuit Rs stands for the solution resistance, Rct and Cct represents the resistance and capacitance of the double layer, respectively, Rfilm represents the resistance of the partially protective film, and Cc is the capacitance of the outer oxide layer. Apart from the first hour of immersion, the values of Rfilm are higher for the AMX601 alloy, whereas the values of Rct of both alloys are very close. These results imply that the initial oxide layer formed on the alloys’ surfaces is better for the AM60 alloy, yet it is less stable for longer immersion periods. The deteriorated corrosion resistance of the AM60 alloy can be also ascribed to a pitting mode of corrosion, as was shown in Figure 7a,c, whereas the AMX601 alloy exhibit mixed pitting and filiform corrosion, Figure 7b,d. In our previous study [12] we showed that the corrosion resistance of alloys with mixed filiform and pitting corrosion is better in comparison to alloys that exhibit only pitting corrosion.
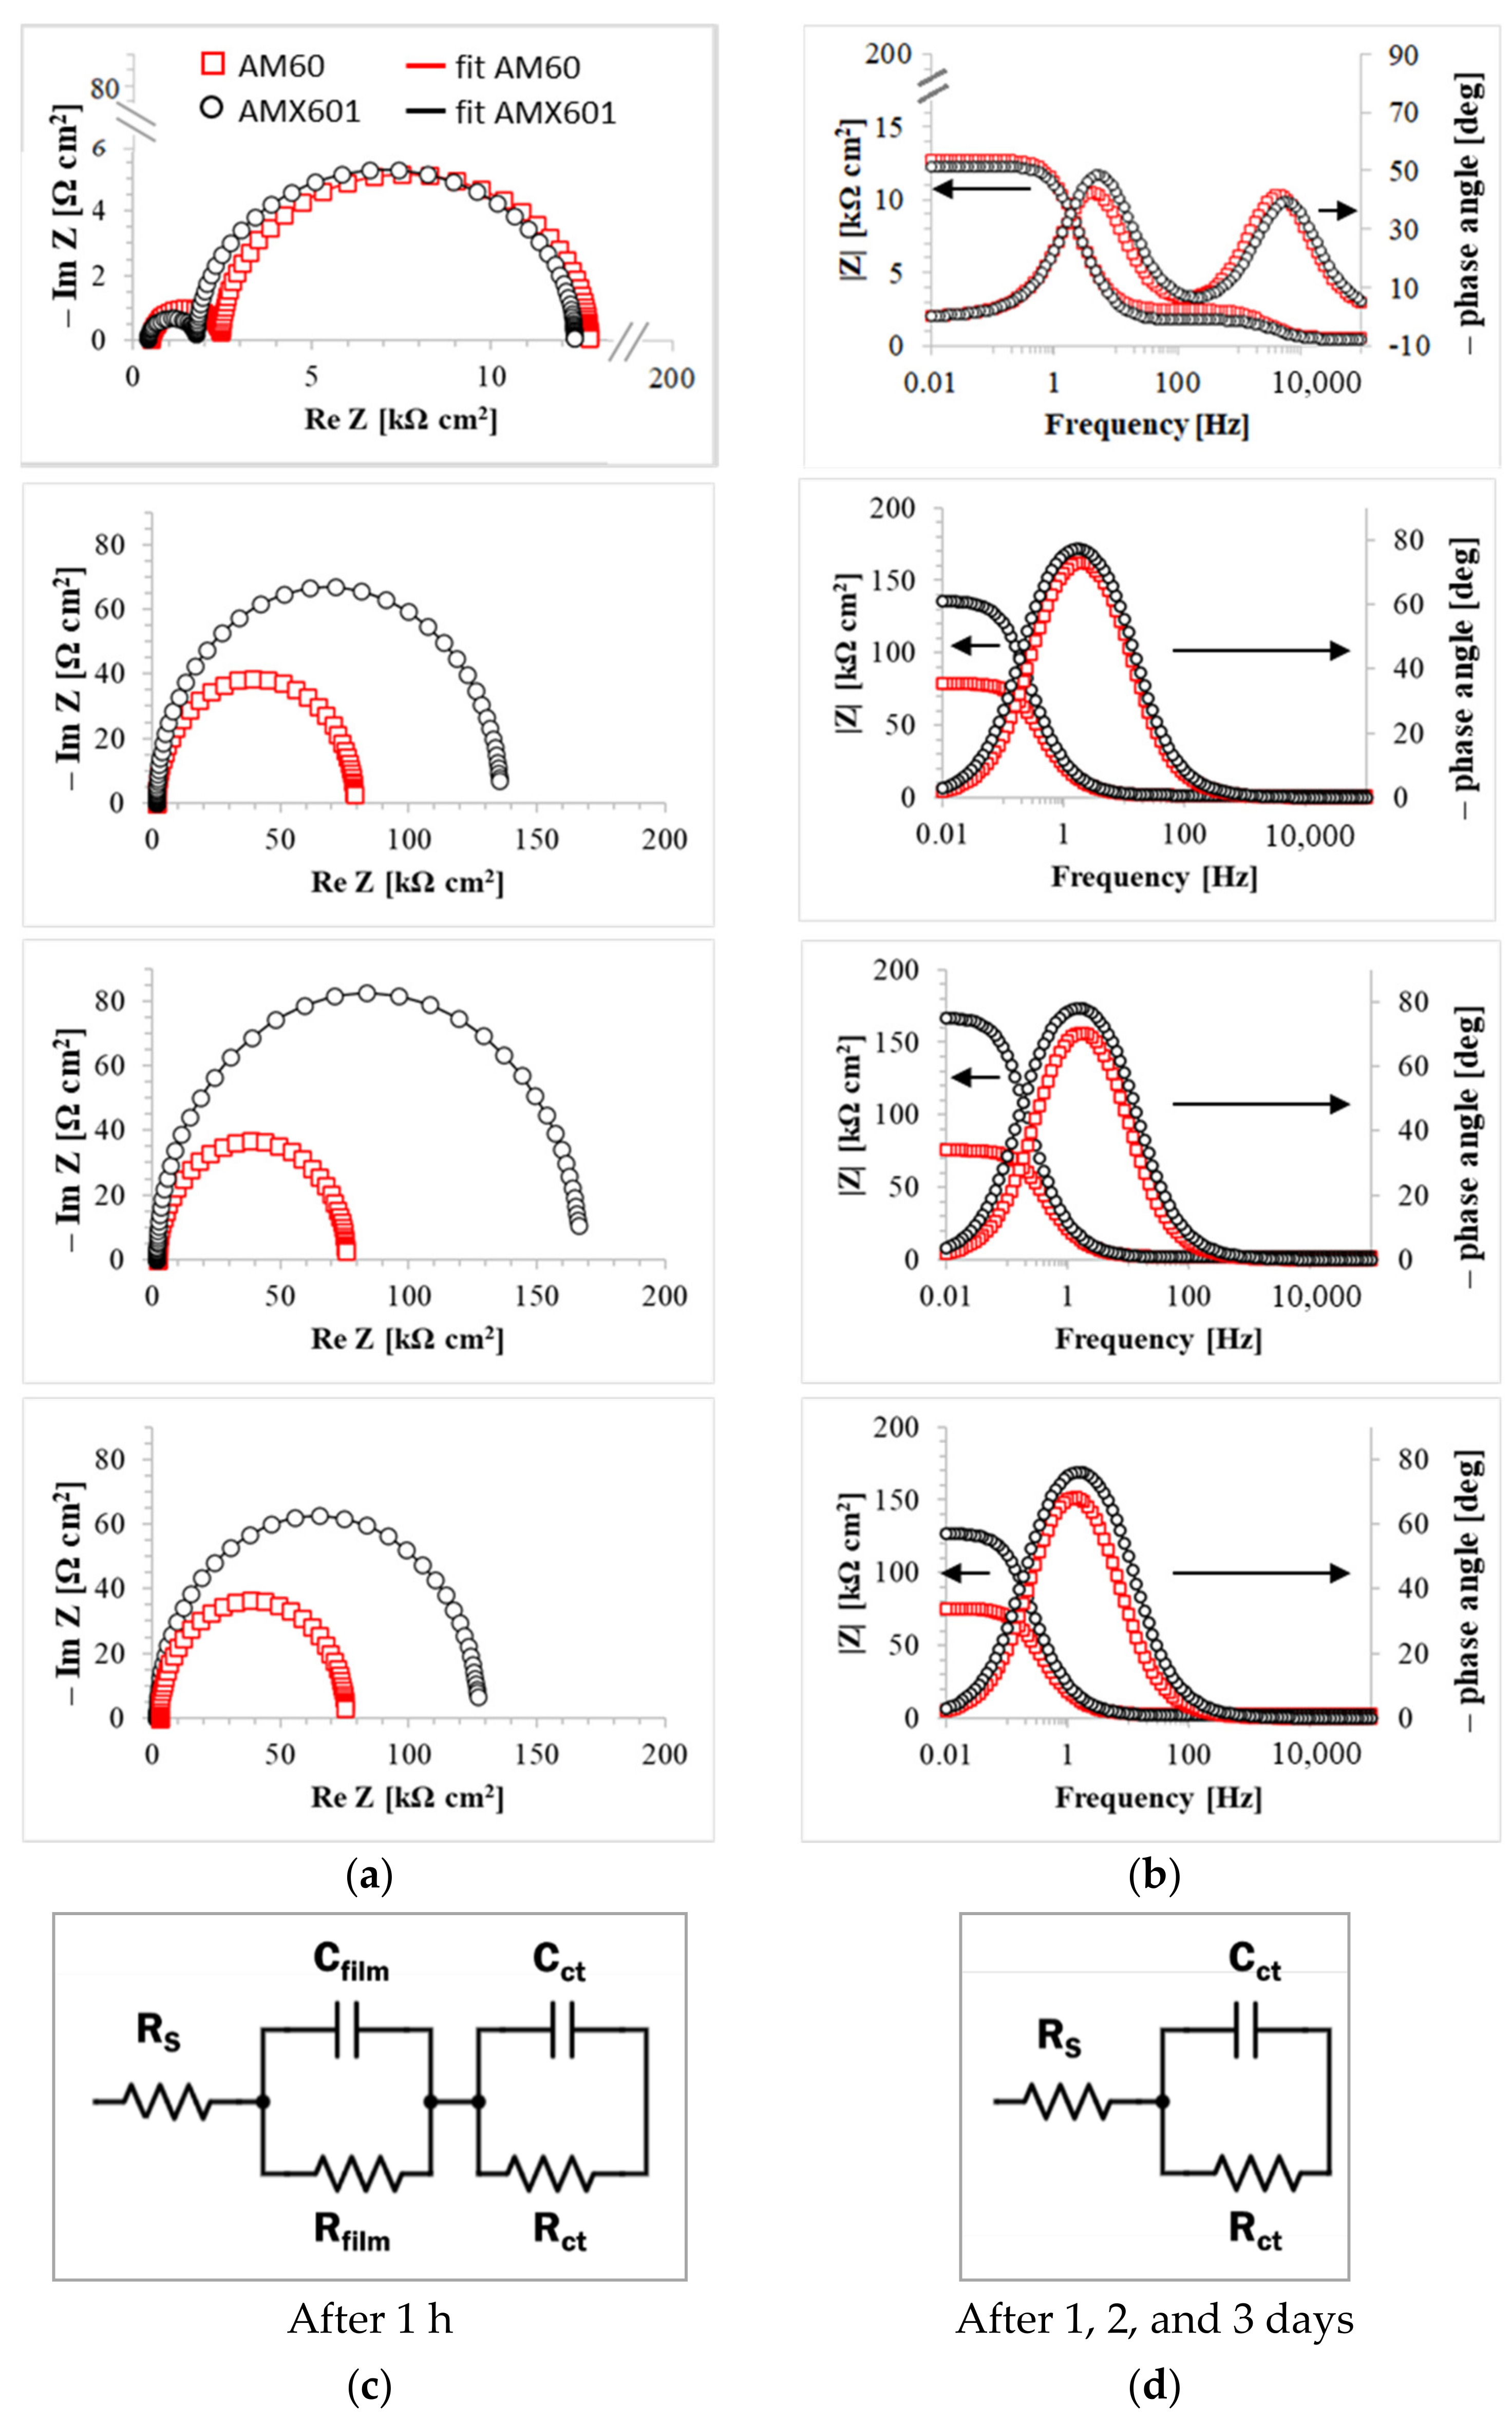
Different results were obtained after immersion in NaOH solution, Figure 12. Two capacitance loops are observed after one hour of immersion. However, at longer immersion periods the Nyquist plots present only one capacitance loop with a significantly larger diameter, Figure 12a. In this case, the diameter of the capacitance loop is related to the corrosion resistance; and it is clearly seen that the diameter of the AMX601 alloy’s loop is bigger than that of AM60 alloy. Furthermore, no inductance loop is seen, even after 1 h of immersion, indicating strong protective film [61]. The Bode plots, Figure 12b, correlate with the Nyquist plots, indicating a better corrosion resistance for the AMX601 alloy.
Moreover, the impedance (and the corrosion resistance) of both alloys increased with increasing immersion time, supporting the results of immersion tests and PDP tests in NaOH solution, Figure 8 and Figure 10b.
Since the corrosion behavior of the alloys is different for short and long immersion periods, the data were fitted to different equivalent circuits. According to the results above, after 1 h of immersion a duplex structure oxide layer was formed on the alloy’s surface and an equivalent circuit with two time constants was used for data fitting, Figure 12c. With increasing immersion time, the oxide layer becomes dense and compact, and the data were fitted to a simple Randles equivalent circuit, Figure 12d. The fitting results are listed in Table 4. A sharp increase in Rct values is seen after 1 day of immersion for both alloys, indicating improved corrosion resistance. In addition, the Rct values of the AMX601 alloy are two times larger in comparison to the values of the AM60 alloy. This observation comes in line with the results of the immersion (Figure 8) and PDP tests (Figure 10b) in NaOH solution. It seems that alloying with Ca results in a stronger protective layer in the absence of Cl− ions. Moreover, increasing immersion time from 1 h to 24 h improves the stability of the oxide film, and the corrosion reaction is inhibited.
3.5. Oxidation Characterisation
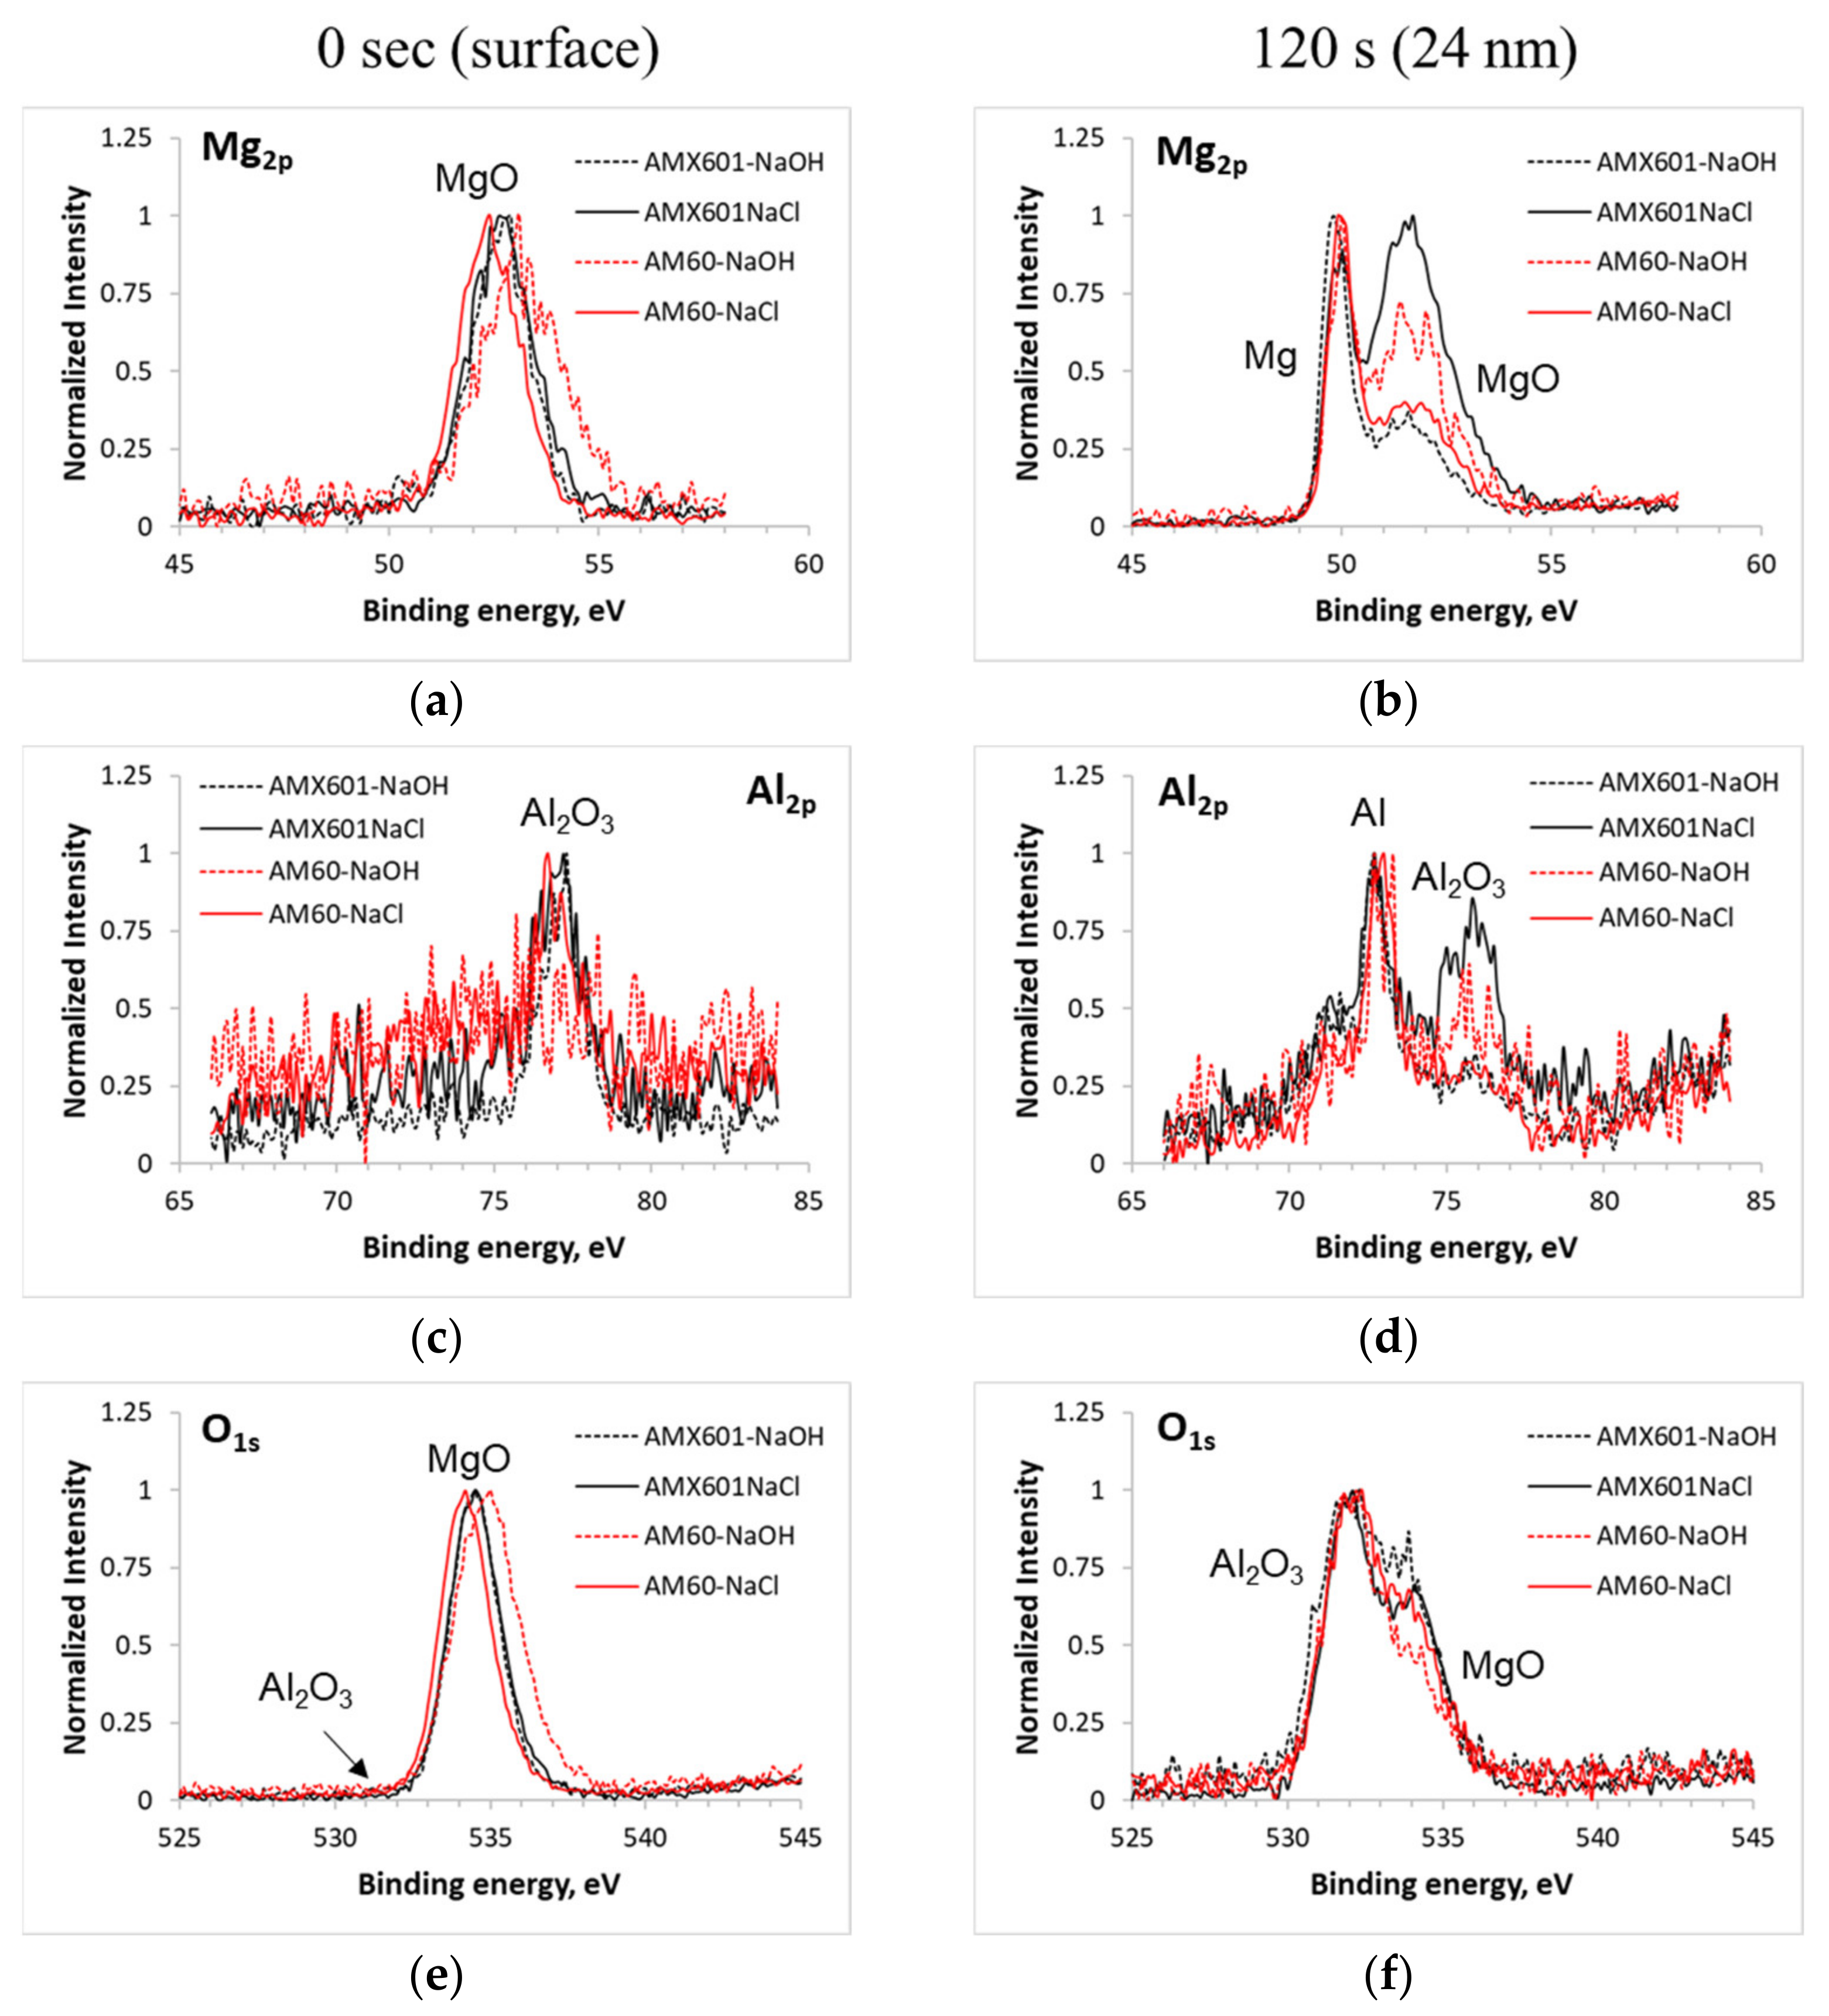
For a better understanding of the oxidation characteristics, the polished alloys were immersed in the corrosive environments for 300 s, and the corrosion product layer was studied by means of XPS. Figure 13 presents the XPS peaks’ analysis of the oxide films at the surface and after 120 s of sputtering, which corresponds to a depth of 24 nm. Two types of oxide were identified: MgO and Al2O3. The oxide layer of both alloys possesses a duplex structure: the outer layer consists mainly of MgO, Figure 13e, and beneath it, the corrosion products are a mix of MgO and Al2O3, Figure 13f. The quantity of MgO decreased whereas the quantity of Al2O3 increased from the outer layer to the interior layer close to the alloy’s surface. No Ca was detected in the oxide layer of the AMX601 alloy, in contrast to previously published in the literature [39,47,62]. Nonetheless, the AMX601 alloy exhibited a higher tendency for Al2O3 formation in comparison to the AM60 alloy. Moreover, no Al2O3 was observed in the XPS spectra of AM60 after immersion in NaOH solution, Figure 13c,d. Thus, it can be suggested that the addition of Ca might promote the formation of the aluminum oxide layer.
In order to achieve a deeper understanding of the effect of surface oxidation of the AM60 and AMX601 alloys, this study applies the gravimetric method as described in [49] with few differences. In these measurements, the studied samples were contacted to the bottom of a balance, that was connected to a computer where the time evaluation of the weight was recorded automatically during 24 h. The weight and the surface area of the studied samples (in both solutions) were similar (~4.5 g and 20 cm2, respectively). The weight difference/surface area (ΔW/A) of the studied alloys during 24 h of immersion in 3.5% NaCl solution saturated with Mg (OH)2 and NaOH solution presented in Figure 14a,b respectively. The behavior of the studied alloys was different in different environments.
In the case of immersion in the 3.5% NaCl solution saturated with Mg (OH)2, Figure 14a, the ΔW/A of the samples decreased in the first hour (65 min and 51 min for the AM60 and AMX601, respectively). Afterward, the ΔW/A increased for both alloys, and after a few hours reached a constant value. The average ΔW/A value of AMX601 was less than zero, whereas the average ΔW/A of AM60 reached positive values after 5 h and 14 min and then stabilized. This can be explained by two different competing mechanisms: (i) dissolution of the α-Mg matrix, and (ii) growth of the oxide layer. In the first hour, the dissolution was dominant, thus the samples’ ΔW/A decreased. Afterward, the growth of the oxide layer was more overcame the dissolution, and the ΔW/A increased. The oxide layer of AM60 was thicker and more stable in comparison to that of AMX601, manifested by positive values in the measured ΔW/A.
In the case of immersion in the NaOH solution, Figure 14b, the average ΔW/A values of the samples were almost zero during 8 h of immersion. Afterward the ΔW/A values increased, implying growth of the oxide layer. It should be noted that the rate of ΔW/A increase was higher for the AMX601 alloy. After ~17 h of immersion, the average ΔW/A values reached a fixed value. The ratio between the ΔW/A value of the AMX601 to AM60 was ~3.5 after 24 h of immersion. Thus, it can be assumed that alloying with Ca improved the stability and thickness of the oxide layer of AM60 in the absence of Cl− ions.
The results obtained from this experiment are consistent with the results of the hydrogen evaluation rate and electrochemical measurement shown above.
4. Discussion
Alloyed Ca has two major impacts on the corrosion behavior of AM60: (i) precipitation of ternary (Mg-Al)2Ca phase, Figure 1, Figure 2 and Figure 3, and (ii) changing the corrosion mode from pitting to filiform corrosion, Figure 6 and Figure 7. SKPFM measurements confirmed the cathodic behavior of (Mg-Al)2Ca phase relative to the α-Mg matrix. This phase creates micro-galvanic cells with the surrounding matrix and facilitates the initiation of localized corrosion, as was discussed in Section 3.2. On the other hand, filiform corrosion usually occurs in Mg alloys when there is a protective oxide layer, which inhibits the corrosion rate [62,63]. XPS measurements revealed the presence of Al oxide, which results from the solutionized Al in the α-Mg matrix, Figure 13. This phenomenon and its contribution to corrosion resistance are well-known in Mg-Al alloys [28,29]. Moreover, several researchers [38,39,40] reported that Ca additions might improve the stability of the corrosion products layer, especially in long immersion periods [39].
As was mentioned in Section 3.5 the corrosion behavior of the alloys depends on two competing mechanisms: matrix dissolution and growth of protective oxide layer. The corrosion reaction initiated as preferential dissolution of the α-Mg matrix around the second phase particles with higher Volta potential. Alloying with Ca resulted in a higher number of second-phase particles, as was shown in Section 3.1, and the micro-galvanic effects are expected to increase. The effect of the β-phase on the corrosion resistance of the AM60 alloy is negligible, due to the small amount of the particles, as was shown in our previous study [11]. Therefore, the corrosion initiation of AMX601 is expected to be hastened. On the other hand, it was found that Ca additions improve the stability of the corrosion products layer, as was shown in Section 3.4–Section 3.5, thus improving the alloy’s corrosion resistance. The overall corrosion resistance depends on the dominant mechanism.
In the case of NaCl solution, it seems that the matrix dissolution due to the micro-galvanic effects is the dominant mechanism. The stability of the AMX601 alloy’s oxide layer in the presence of Cl− ions was found to be insufficient, and the corrosion rate of AMX601 was high in comparison to that of AM60. Hence it can be summarized, the addition of Ca to AM60 deteriorated its corrosion resistance in the presence of Cl− ions. However, in the case of NaOH solution, it is clearly seen that Ca contributes to the stability and the thickness of the protective layer and inhibits the corrosion rate. Thus, it can be assumed that alloying with Ca improves the corrosion resistance of wrought AM60 in the absence of Cl− ions.
5. Conclusions
- •
- This research investigates the effect of alloyed Ca on the corrosion behavior of wrought AM60 alloys in alkaline solutions with and without Cl− ions. It was found that Ca additions deteriorate the corrosion resistance of AM60 in NaCl solution, whereas in NaOH solution without Cl− ions the corrosion behavior improved. The addition of 1 wt% Ca to AM60 results in massive precipitation of (Mg-Al)2Ca second phase particles with cathodic behavior relative to the α-Mg matrix.
- •
- Ca additions stabilize the corrosion products layer of the wrought AM60 alloy. However, its stability is inferior in the presence of Cl− ions in short-term immersion.
- •
- In the NaCl solution, Ca additions deteriorate the corrosion resistance of wrought AM60, due to the increased micro-galvanic effects.
- •
- In the NaOH solution, Ca additions effectively stabilize the oxide layer of the wrought AM60 alloy and contribute to the alloy’s corrosion resistance.
- •
- The stabilization of the oxide layer by Ca additions is more pronounced after 2–3 days of immersion both in the NaCl and NaOH solutions.
Author Contributions
P.M.: Validation, Investigation, Writing—original draft, Visualization; G.B.-H.: Conceptualization, Supervision; K.S.S.: Resources—Alloys manufacturer; A.E.: writing—review and editing. All authors have read and agreed to the published version of the manuscript.
Funding
This research received no external funding.
Institutional Review Board Statement
Not applicable.
Informed Consent Statement
Not applicable.
Data Availability Statement
The raw/processed data required to reproduce these findings cannot be shared at this time as the data also forms part of an ongoing study.
Acknowledgments
We would like to thank Vladimir Ezersky for the TEM measurements.
Conflicts of Interest
The authors declare no conflict of interest.
References
- Kumar, D.S.; Sasanka, C.T.; Ravindra, K.; Suman, K.N.S. Magnesium and its alloys in automotive applications—A review. Am. J. Mater. Sci. Technol. 2015, 4, 12–30. [Google Scholar] [CrossRef]
- Gaines, L.; Cuenca, R.; Stodolsky, F.; Wu, S. Potential Automotive Technology Development. In Proceedings of the Automotive Technology Development Conference, Detroit, MI, USA, 28 October–1 November 1996. [Google Scholar]
- Esmaily, M.; Svensson, J.E.; Fajardo, S.; Birbilis, N.; Frankel, G.S.; Virtanen, S.; Arrabal, R.; Thomas, S.; Johansson, L.G. Fundamentals and advances in magnesium alloy corrosion. Prog. Mater. Sci. 2017, 89, 92–193. [Google Scholar] [CrossRef]
- Mordike, B.L.; Ebert, T. Magnesium: Properties—Applications—Potential. Mater. Sci. Eng. A 2001, 302, 37–45. [Google Scholar] [CrossRef]
- Hono, K.; Mendis, C.L.; Sasaki, T.T.; Oh-ishi, K. Towards the development of heat-treatable high-strength wrought Mg alloys. Scr. Mater. 2010, 63, 710–715. [Google Scholar] [CrossRef]
- Bettles, C.J.; Gibson, M.A. Current wrought magnesium alloys: Strengths and weaknesses. JOM 2005, 57, 46–49. [Google Scholar] [CrossRef]
- You, S.; Huang, Y.; Kainer, K.U.; Hort, N. Recent research and developments on wrought magnesium alloys. J. Magnes Alloys 2017, 5, 239–253. [Google Scholar] [CrossRef]
- Ben-Hamu, G.; Eliezer, D.; Shin, K.S. The role of Si and Ca on new wrought Mg–Zn–Mn based alloy. Mater. Sci. Eng. A 2007, 447, 35–43. [Google Scholar] [CrossRef]
- Alves, H.; Koster, U.; Aghion, E.; Eliezer, D. Environmental Behavior of Magnesium and Magnesium Alloys. Mater. Technol. 2001, 16, 110–126. [Google Scholar] [CrossRef]
- Ghali, E.; Dietzel, W.; Kainer, K.U. General and localized corrosion of magnesium alloys: A critical review. J. Mater. Eng. Perform. 2004, 13, 7–23. [Google Scholar] [CrossRef]
- Metalnikov, P.; Ben-Hamu, G.; Templeman, Y.; Shin, K.S.; Meshi, L. The relation between Mn additions, microstructure and corrosion behavior of new wrought Mg-5Al alloys. Mater. Char. 2018, 145, 101–115. [Google Scholar] [CrossRef]
- Metalnikov, P.; Ben-Hamu, G.; Eliezer, D.; Shin, K.S. Role of Sn in microstructure and corrosion behavior of new wrought Mg-5Al alloy. J. Alloys Compd. 2019, 777, 835–849. [Google Scholar] [CrossRef]
- Ben-Hamu, G.; Eliezer, D. Corrosion behavior of wrought Mg-6%Zn-1%Mn-xSi-yCa alloy. Mater. Corros. 2012, 62, 1–6. [Google Scholar] [CrossRef]
- Ben-Hamu, G.; Eliezer, D.; Shin, K.S. The role of Mg2Si on the corrosion behavior of wrought Mg–Zn–Mn alloy. Intermetallics 2008, 16, 860–867. [Google Scholar] [CrossRef]
- Ben-Hamu, G.; Eliezer, D.; Shin, K.S.; Wagner, L. Corrosion Mechanisms of New Wrought Mg-Zn Based Alloys Alloying with Si, Ca and Ag. Corros. Sci. Tech. 2008, 7, 152–157. [Google Scholar]
- Metalnikov, P.; Ben-Hamu, G.; Shin, K. Relation Between Zn Additions, Microstructure and Corrosion Behavior of New Wrought Mg-5Al Alloys. Met. Mater. Int. 2021, 27, 1493–1505. [Google Scholar] [CrossRef]
- Ben-Hamu, G.; Eliezer, D.; Kaya, A.; Na, Y.G.; Shin, K.S. Microstructure and corrosion behavior of Mg–Zn–Ag alloys. Mater. Sci Eng. A 2006, 435–436, 579–587. [Google Scholar] [CrossRef]
- Lisitsyn, V.; Ben-Hamu, G.; Eliezer, D.; Shin, K.S. The role of Ca microalloying on the microstructure and corrosion behavior of Mg–6Zn–Mn–(0.5–2) Si alloys. Corros. Sci. 2009, 51, 776–784. [Google Scholar] [CrossRef]
- Lisitsyn, V.; Ben-Hamu, G.; Eliezer, D.; Shin, K.S. Some particularities of the corrosion behaviour of Mg–Zn–Mn–Si–Ca alloys in alkaline chloride solutions. Corros. Sci. 2010, 52, 2280–2290. [Google Scholar] [CrossRef]
- Ben-Hamu, G.; Eliezer, D.; Shin, K.S. Studies on the influence of chloride ion concentration on the corrosion behavior of ZSMX magnesium alloy. In Proceedings of the 3rd International Conference on Corrosion, Processes and Advanced Materials in Industry, Beer-Sheva, Israel, 29–30 May 2007. [Google Scholar]
- Boyer, J.A. The Corrosion of Magnesium and of the Magnesium Aluminium Alloys Containing Manganese; Report 248; American Magnesium Corporation: Niagara Falls, NY, USA, 1926. [Google Scholar]
- Song, G.L.; Atrens, A. Corrosion Mechanisms of Magnesium Alloys. Adv. Eng. Mater. 1999, 1, 11–33. [Google Scholar] [CrossRef]
- Gusieva, K.; Davies, C.H.J.; Scully, J.R.; Birbilis, N. Corrosion of magnesium alloys: The role of alloying. Int. Mater. Rev. 2015, 60, 169–194. [Google Scholar] [CrossRef]
- Gandel, D.S.; Easton, M.A.; Gibson, M.A.; Birbilis, N. CALPHAD simulation of the Mg-(Mn, Zr)-Fe system and experimental comparison with as-cast alloy microstructures as relevant to impurity driven corrosion of Mg-alloys. Mater. Chem. Phys. 2014, 143, 1082–1091. [Google Scholar] [CrossRef]
- Danaie, M.; Asmussen, R.M.; Jakupi, P.; Shoesmith, D.W.; Botton, G.A. The cathodic behaviour of Al-Mn precipitates during atmospheric and saline aqueous corrosion of a sand-cast AM50 alloy. Corros. Sci. 2014, 83, 299–309. [Google Scholar] [CrossRef]
- Zarandi, F.; Seale, G.; Verma, R.; Essadiqi, E.; Yue, S. Effect of Al and Mn additions on rolling and deformation behavior of AZ series magnesium alloys. Mater. Sci. Eng. A 2008, 496, 159–168. [Google Scholar] [CrossRef]
- Dargusch, M.; Pettersen, K.; Nogita, K.; Nave, M.D.; Dunlop, G.L. The effect of aluminium content on the mechanical properties and microstructure of die cast binary magnesium–aluminium alloys. Mater. Trans. 2006, 47, 977–982. [Google Scholar] [CrossRef] [Green Version]
- Pardo, A.; Merino, M.C.; Coy, A.E.; Viejo, F.; Arrabal, R.; Feliú, S., Jr. Influence of microstructure and composition on the corrosion behaviour of Mg/Al alloys in chloride media. Electrochim. Acta 2008, 53, 7890–7902. [Google Scholar] [CrossRef]
- Song, G.; Atrens, A.; Wu, X.; Zhang, B. Corrosion behaviour of AZ21, AZ501 and AZ91 in sodium chloride. Corros. Sci. 1998, 40, 1769–1791. [Google Scholar] [CrossRef]
- Ben-Haroush, M.; Ben-Hamu, G.; Eliezer, D.; Wagner, L. The relation between microstructure and corrosion behavior of AZ80 Mg alloy following different extrusion temperatures. Corros. Sci. 2008, 50, 1766–1778. [Google Scholar] [CrossRef]
- Suzuki, A.; Saddock, N.D.; Jones, J.W.; Pollock, T.M. Solidification paths and eutectic intermetallic phases in Mg–Al–Ca ternary alloys. Acta Mater. 2005, 53, 2823–2834. [Google Scholar] [CrossRef]
- Xiao, D.; Chen, Z.; Wang, X.; Zhang, M.; Chen, D. Microstructure, mechanical and creep properties of high Ca/Al ratio Mg-Al-Ca alloy. Mater. Sci. Eng. A 2016, 660, 166–171. [Google Scholar] [CrossRef]
- Luo, A.A.; Balogh, M.P.; Powell, B.R. Creep and Microstructure of Magnesium-Aluminum-Calcium Based Alloys. Metall Mater. Trans. A 2002, 33, 567–574. [Google Scholar] [CrossRef]
- Wu, G.; Fan, Y.; Gao, H.; Zhai, C.; Zhu, Y.P. The effect of Ca and rare earth elements on the microstructure, mechanical properties and corrosion behavior of AZ91D. Mater. Sci. Eng. A 2005, 408, 255–263. [Google Scholar] [CrossRef]
- Zhang, L.; Deng, K.; Xu, K.N.F.; Su, K.; Liang, W. Microstructures and mechanical properties of Mg-Al-Ca alloys affected by Ca/Al ratio. Mater. Sci. Eng. A 2015, 636, 279–288. [Google Scholar] [CrossRef]
- Jeong, Y.S.; Kim, W.J. Enhancement of mechanical properties and corrosion resistance of Mg-Ca alloys through microstructural refinement by indirect extrusion. Corros. Sci. 2014, 82, 392–403. [Google Scholar]
- Yim, C.D.; Kim, Y.M.; You, B.S. Effect of Ca addition on the corrosion resistance of gravity cast AZ31 magnesium alloy. Mater. Trans. 2007, 48, 1023–1028. [Google Scholar] [CrossRef] [Green Version]
- You, B.S.; Park, W.W.; Chung, I.S. The effect of calcium additions on the oxidation behavior in magnesium alloys. Scr. Mater. 2000, 42, 1089–1094. [Google Scholar] [CrossRef]
- Deng, M.; Wang, L.; Hoche, D.; Lamaka, S.V.; Wang, C.; Snihirova, D.; Jin, Y.; Zhang, Y.; Zheludkevich, M.L. Approaching “stainless magnesium” by Ca micro-alloying. Mater. Horiz. 2020, 8, 589–596. [Google Scholar]
- Zhang, C.; Wu, L.; Huang, G.; Huang, Y.; Jiang, B.; Atrens, A.; Pan, F.-S. Effect of microalloyed Ca on the microstructure and corrosion behavior of extruded Mg alloy AZ31. J. Alloys Compd. 2020, 823, 153844. [Google Scholar] [CrossRef]
- Majhi, J.; Ganguly, S.; Basu, A.; Mondal, A.K. Improved corrosion response of squeeze-cast AZ91 magnesium alloy with calcium and bismuth additions. J. Alloys Compd. 2021, 873, 159600. [Google Scholar] [CrossRef]
- Yang, J.; Peng, J.; Nyberg, E.A.; Pan, F.S. Effect of Ca addition on the corrosion behavior of Mg-Al-Mn alloy. Appl. Surf. Sci. 2016, 369, 92–100. [Google Scholar]
- Kim, K.H.; Nam, N.D.; Kim, J.G.; Shin, K.S.; Jung, H.C. Effect of calcium addition on the corrosion behavior of Mg-5Al alloy. Intermetallics 2011, 19, 1831–1838. [Google Scholar] [CrossRef]
- Baek, S.-M.; Kim, H.J.; Jeong, H.Y.; Sohn, S.-D.; Shin, H.-J.; Choi, K.-J.; Lee, K.-S.; Lee, J.G.; Yim, C.D.; You, B.S.; et al. Effect of alloyed Ca on the microstructure and corrosion properties of extruded AZ61 Mg alloy. Corros. Sci. 2016, 112, 44–53. [Google Scholar] [CrossRef]
- Dabah, E.; Ben-Hamu, G.; Lisitsyn, V.; Eliezer, D.; Shin, K.S. The influence of Ca on the corrosion behavior of new die cast Mg-Al-based alloys for elevated temperature applications. J. Mater. Sci. 2010, 45, 3007–3015. [Google Scholar]
- Kim, W.C.; Kim, J.G.; Lee, J.Y.; Seok, H.K. Influence of Ca on the corrosion properties of magnesium for biomaterials. Mater. Lett. 2008, 62, 4146–4148. [Google Scholar] [CrossRef]
- Zeng, R.C.; Qi, W.C.; Cui, H.Z.; Zhang, F.; Li, S.Q.; Han, E.H. In vitro corrosion of as-extruded Mg-Ca alloys-the influence of Ca concentration. Corros. Sci. 2015, 96, 23–31. [Google Scholar] [CrossRef]
- Qiao, Z.; Shi, Z.; Hort, N.; Abidin, N.I.Z.; Atrens, A. Corrosion behaviour of a nominally high purity Mg ingot produced by permanent mould direct chill casting. Corros. Sci. 2012, 61, 185–207. [Google Scholar] [CrossRef]
- Fajardo, S.; Frankel, G.S. Gravimetric method for hydrogen evolution measurements on dissolving magnesium. J. Electrochem. Soc. 2015, 162, C693–C701. [Google Scholar] [CrossRef] [Green Version]
- Mingo, B.; Mohedano, M.; Blawert, C.; del Olmo, R.; Hort, N.; Arrabal, R. Role of Ca on the corrosion resistance of Mg–9Al and Mg–9Al–0.5Mn alloys. J. Alloys Compd. 2019, 811, 151992. [Google Scholar] [CrossRef]
- Cao, H.; Zhang, C.; Zhu, J.; Cao, G.; Kou, S.; Schmid-Fetzer, R.; Chang, Y.A. Experiments coupled with modeling to establish the Mg-rich phase equilibria of Mg-Al-Ca. Acta Mater. 2008, 56, 5245–5254. [Google Scholar] [CrossRef]
- Kondori, B.; Mahmudi, R. Effect of Ca additions on the microstructure, thermal stability and mechanical properties of a cast AM60 magnesium alloy. Mater. Sci. Eng. A 2010, 527, 2014–2021. [Google Scholar] [CrossRef]
- Liang, S.M.; Chen, R.S.; Blandin, J.J.; Suery, M.; Han, E.H. Thermal analysis and solidification pathways of Mg-Al-Ca system alloys. Mater. Sci. Eng. A 2008, 480, 365–372. [Google Scholar] [CrossRef]
- Ben-Hamu, G.; Eliezer, D.; Cross, C.E.; Böllinghaus, T. The relation between microstructure and corrosion behavior of GTA welded AZ31B magnesium sheet. Mater. Sci. Eng. A Struct. 2007, 452–453, 210–218. [Google Scholar] [CrossRef]
- Bahmani, A.; Nayebi, B.; Zonoozi, S.B.; Wang, L.; Shokouhimehr, M. Mechanochemical characteristics of Ca-added Mg-based alloys: A multimodality approach. Mater. Char. 2020, 167, 110475. [Google Scholar] [CrossRef]
- Andreatta, F.; Apachitei, I.; Kodentsov, A.A.; Dzwonczyk, J.; Duszczyk, J. Volta potential of second phase particles in extruded AZ80 magnesium alloy. Electrochim. Acta 2006, 51, 3551–3557. [Google Scholar] [CrossRef]
- Jönsson, M.; Thierry, D.; LeBozec, N. The influence of microstructure on the corrosion behaviour of AZ91D studied by scanning Kelvin probe force microscopy and scanning Kelvin probe. Corros. Sci. 2006, 48, 1193–1208. [Google Scholar] [CrossRef]
- Tkacz, J.; Minda, J.; Fintová, S.; Wasserbauer, J. Electrochemical Methods for the Evaluation of Cast AZ91 Magnesium Alloy. Materials 2016, 9, 925. [Google Scholar] [CrossRef] [Green Version]
- Saadi, S.A.; Yi, Y.; Cho, P.; Jang, C.; Beeley, P. Passivity breakdown of 316L stainless steel during potentiodynamic polarization in NaCl solution. Corros. Sci. 2016, 111, 720–727. [Google Scholar] [CrossRef]
- Wang, H.; Song, Y.; Yu, J.; Shan, D.; Han, H. Characterization of filiform corrosion of Mg–3Zn Mg alloy. J. Electrochem. Soc. 2017, 164, C574–C580. [Google Scholar] [CrossRef]
- Song, G.; Atrens, A.; StJohn, D.; Wu, X.; Nairn, J. The anodic dissolution of magnesium in chloride and sulphate solutions. Corros Sci. 1997, 39, 1981–2004. [Google Scholar] [CrossRef]
- Nam, N.D.; Bian, M.Z.; Forsyth, M.; Seter, M.; Tan, M.; Shin, K.S. Effect of calcium oxide on the corrosion behaviour of AZ91 magnesium alloy. Corros. Sci. 2012, 64, 263–271. [Google Scholar] [CrossRef]
- Lunder, O.; Lein, J.E.; Hesjevik, S.M.; Aune, T.K.; Nisancioglu, K. Corrosion morphologies on magnesium alloy AZ91. Mater. Corros. 1994, 45, 331–340. [Google Scholar] [CrossRef]
Figure 1.
Typical microstructure of as-extruded: (a,c) AM60; (b,d) AMX601 alloys.

Figure 2.
XRD (X-ray diffractometer) patterns of as-extruded: (a) AM60; (b) AMX601 alloys.

Figure 3.
TEM (transmission electron microscope) bright-field micrograph of the second phase intermetallics observed in AMX601 alloy, with the corresponding electron diffraction pattern shown in the inset.
Figure 3.
TEM (transmission electron microscope) bright-field micrograph of the second phase intermetallics observed in AMX601 alloy, with the corresponding electron diffraction pattern shown in the inset.

Figure 4.
(a,c) Volta potential maps and (b,d) Volta potential line scans for the two second-phase particles: (a,b) Al–Mn; (c,d) (Mg, Al)2Ca.
Figure 4.
(a,c) Volta potential maps and (b,d) Volta potential line scans for the two second-phase particles: (a,b) Al–Mn; (c,d) (Mg, Al)2Ca.

Figure 5.
(a) Hydrogen evolution rate curve; (b) corrosion rate curves for AM60 and AMX601 alloys immersed in 3.5 wt% NaCl solution saturated with Mg (OH)2 at room temperature.
Figure 5.
(a) Hydrogen evolution rate curve; (b) corrosion rate curves for AM60 and AMX601 alloys immersed in 3.5 wt% NaCl solution saturated with Mg (OH)2 at room temperature.

Figure 6.
Optical micrographs showing the surface of (a) AM60; (b) AMX601 alloys during the immersion in 3.5 wt% NaCl solution saturated with Mg (OH)2 at room temperature.
Figure 6.
Optical micrographs showing the surface of (a) AM60; (b) AMX601 alloys during the immersion in 3.5 wt% NaCl solution saturated with Mg (OH)2 at room temperature.

Figure 7.
Macrographs of the corroded surface after 4 and 24 h immersion in 3.5 wt% NaCl solution saturated with Mg (OH)2 at room temperature, and removal of corrosion products: (a,c) AM60; (b,d) AMX601 alloys.
Figure 7.
Macrographs of the corroded surface after 4 and 24 h immersion in 3.5 wt% NaCl solution saturated with Mg (OH)2 at room temperature, and removal of corrosion products: (a,c) AM60; (b,d) AMX601 alloys.

Figure 8.
(a) Hydrogen evolution rate curve; (b) corrosion rate curves for AM60 and AMX601 alloys immersed in NaOH solution (pH ≈ 10.5) at room temperature.
Figure 8.
(a) Hydrogen evolution rate curve; (b) corrosion rate curves for AM60 and AMX601 alloys immersed in NaOH solution (pH ≈ 10.5) at room temperature.

Figure 9.
Optical micrographs showing the surface of (a) AM60; (b) AMX601 alloys during the immersion in NaOH solution (pH ≈ 10.5) at room temperature.
Figure 9.
Optical micrographs showing the surface of (a) AM60; (b) AMX601 alloys during the immersion in NaOH solution (pH ≈ 10.5) at room temperature.

Figure 10.
Potentiodynamic polarization curves of AM60 and AMX601 alloys after different immersion periods in: (a) 3.5 wt% NaCl solution saturated with Mg (OH)2; (b) NaOH solution (pH ≈ 10.5); (c) the calculated corrosion current density of AM60 and AMX601 alloys as a function of time in different solutions.

Figure 11.
EIS results of AM60 and AMX601 alloys after different immersion periods in 3.5 wt% NaCl solution saturated with Mg (OH)2: (a) Nyquist plots; (b) Bode plots; (c) an equivalent circuit.
Figure 11.
EIS results of AM60 and AMX601 alloys after different immersion periods in 3.5 wt% NaCl solution saturated with Mg (OH)2: (a) Nyquist plots; (b) Bode plots; (c) an equivalent circuit.

Figure 12.
EIS results of AM60 and AMX601 alloys after different immersion periods in NaOH solution (pH ≈ 10.5): (a) Nyquist plots; (b) Bode plots; (c,d) equivalent circuits.
Figure 12.
EIS results of AM60 and AMX601 alloys after different immersion periods in NaOH solution (pH ≈ 10.5): (a) Nyquist plots; (b) Bode plots; (c,d) equivalent circuits.

Figure 13.
XPS analysis of corrosion products of AM60 and AMX601 alloys after different immersion periods in 3.5 wt% NaCl solution saturated with Mg (OH)2 and NaOH solution (pH ≈ 10.5): (a) Mg 2p 0s etching; (b) Mg 2p 120s etching; (c) Al 2p 0s etching; (d) Al 2p 120s etching; (e) O 1s 0s etching; (f) O 1s 120s etching.

Figure 14.
Gravimetric measurement (ΔW/A) for AM60 and AMX601 alloys immersed in: (a) 3.5 wt% NaCl solution saturated with Mg (OH)2; (b) NaOH solution during 24 h.
Figure 14.
Gravimetric measurement (ΔW/A) for AM60 and AMX601 alloys immersed in: (a) 3.5 wt% NaCl solution saturated with Mg (OH)2; (b) NaOH solution during 24 h.


Table 1.
The chemical composition of extruded AM60 and AMX601 alloys.
| Mg [wt%] | Al [wt%] | Mn [wt%] | Ca [wt%] | Fe [ppm] | Si [ppm] | Cu [ppm] | Ni [ppm] | |
|---|---|---|---|---|---|---|---|---|
| AM60 | Balance | 6.0 | 0.4 | 0.0 | 71 | 136 | 10 | 5 |
| AMX601 | Balance | 6.4 | 0.5 | 1.1 | 22 | 152 | 14 | 9 |
Table 2.
(a). The electrochemical parameters obtained from PDP (potentiodynamic polarization) curves of AM60 alloy. (b). The electrochemical parameters obtained from PDP curves of AMX601 alloy. Eocp: open circuit potential. Ecorr corrosion potential. icorr: corrosion current density.
Table 2.
(a). The electrochemical parameters obtained from PDP (potentiodynamic polarization) curves of AM60 alloy. (b). The electrochemical parameters obtained from PDP curves of AMX601 alloy. Eocp: open circuit potential. Ecorr corrosion potential. icorr: corrosion current density.
| (a) | ||||||||
|---|---|---|---|---|---|---|---|---|
| AM60 | NaCl | NaOH | ||||||
| 1 h | 1 Day | 2 Days | 3 Days | 1 h | 1 Days | 2 Days | 3 Days | |
| Eocp [V] | −1.599 | −1.542 | −1.59 | −1.584 | −1.556 | −1.295 | −1.285 | −1.293 |
| Ecorr [V] | −1.506 | −1.424 | −1.44 | −1.48 | −1.512 | −1.275 | −1.271 | −1.27 |
| Ecorr-Eocp [mV] | 93 | 118 | 150 | 104 | 44 | 20 | 14 | 23 |
| icorr [μA/cm2] | 45.7 | 81.3 | 102.3 | 234.4 | 1.7 | 0.1 | 0.4 | 0.3 |
| (b) | ||||||||
| AMX601 | NaCl | NaOH | ||||||
| 1 h | 1 Day | 2 Days | 3 Days | 1 h | 1 Day | 2 Days | 3 Days | |
| Eocp [V] | −1.578 | −1.568 | −1.569 | −1.564 | −1.511 | −1.146 | −1.118 | −1.182 |
| Ecorr [V] | −1.484 | −1.393 | −1.409 | −1.475 | −1.453 | −1.146 | −1.114 | −1.174 |
| Ecorr-Eocp [mV] | 94 | 175 | 160 | 89 | 58 | 0 | 4 | 8 |
| icorr [μA/cm2] | 61.7 | 87.1 | 166 | 245.5 | 1.1 | 0.1 | 0.2 | 0.2 |
Table 3.
The fitting parameters of EIS (electrochemical impedance spectroscopy) for AM60 and AMX601 alloys, immersed in 3.5% NaCl solution saturated with Mg (OH)2. Rs: solution resistance. Rc: resistance of the oxide layer. Rfilm: resistance of the partially protective film. Rct: resistance of the double layer. Cct: capacitance of the double layer. Cc: capacitance of the outer oxide layer. L: inductance of the partial protective film.
| 1 h | 1 Day | 2 Days | 3 Days | |||||
|---|---|---|---|---|---|---|---|---|
| AM60 | AMX601 | AM60 | AMX601 | AM60 | AMX601 | AM60 | AMX601 | |
| Rs [Ω cm2] | 17.5 | 19.8 | 22 | 22.3 | 23.1 | 21.3 | 24.1 | 22.7 |
| Rc [Ω cm2] | 42.1 | 33.3 | 38.7 | 32.3 | 25.1 | 24.1 | 18.6 | 21.2 |
| Rfilm [Ω cm2] | 10.7 | 9.1 | 10.2 | 10.6 | 5.3 | 8.4 | 4.3 | 7.1 |
| Rct [Ω cm2] | 9 | 8.1 | 5.3 | 5.3 | 4.5 | 4.5 | 3.7 | 4.1 |
| Cct [μF/cm2] | 940 | 1345 | 908 | 1082 | 1418 | 1404 | 1596 | 1618 |
| Cc [μF/cm2] | 13.5 | 22.4 | 20 | 18.1 | 26 | 23 | 24.4 | 23.9 |
| L [H cm2] | 9.4 | 7.1 | 5.6 | 6.8 | 1.9 | 4.2 | 2.3 | 4.2 |
Table 4.
The fitting parameters of EIS for AM60 and AMX601 alloys, immersed in NaOH solution (pH ≈ 10.5).
Table 4.
The fitting parameters of EIS for AM60 and AMX601 alloys, immersed in NaOH solution (pH ≈ 10.5).
| 1 h | 1 Day | 2 Days | 3 Days | |||||
|---|---|---|---|---|---|---|---|---|
| AM60 | AMX601 | AM60 | AMX601 | AM60 | AMX601 | AM60 | AMX601 | |
| Rs [Ω cm2] | 0.5 | 0.4 | 1.7 | 1.7 | 2.3 | 1.8 | 2.8 | 1.9 |
| Rct [Ω cm2] | 2 | 1.4 | 77.1 | 134 | 73.4 | 164.9 | 72.7 | 125.2 |
| Cct [μF/cm2] | 8.5 | 7.6 | 7.2 | 6.2 | 7.5 | 6.1 | 8.9 | 6.8 |
| Rfilm [Ω cm2] | 10.3 | 10.6 | / | / | / | / | / | / |
| Cfilm [μF/cm2] | 0.04 | 0.041 | / | / | / | / | / | / |
Publisher’s Note: MDPI stays neutral with regard to jurisdictional claims in published maps and institutional affiliations. |
© 2021 by the authors. Licensee MDPI, Basel, Switzerland. This article is an open access article distributed under the terms and conditions of the Creative Commons Attribution (CC BY) license (https://creativecommons.org/licenses/by/4.0/).
Share and Cite
MDPI and ACS Style
Metalnikov, P.; Ben-Hamu, G.; Shin, K.S.; Eliezer, A. Effect of Ca Addition on Corrosion Behavior of Wrought AM60 Magnesium Alloy in Alkaline Solutions. Metals 2021, 11, 1172. https://0-doi-org.brum.beds.ac.uk/10.3390/met11081172
AMA Style
Metalnikov P, Ben-Hamu G, Shin KS, Eliezer A. Effect of Ca Addition on Corrosion Behavior of Wrought AM60 Magnesium Alloy in Alkaline Solutions. Metals. 2021; 11(8):1172. https://0-doi-org.brum.beds.ac.uk/10.3390/met11081172
Chicago/Turabian StyleMetalnikov, Polina, Guy Ben-Hamu, Kwang Seon Shin, and Amir Eliezer. 2021. "Effect of Ca Addition on Corrosion Behavior of Wrought AM60 Magnesium Alloy in Alkaline Solutions" Metals 11, no. 8: 1172. https://0-doi-org.brum.beds.ac.uk/10.3390/met11081172
Note that from the first issue of 2016, this journal uses article numbers instead of page numbers. See further details here.