
Fluoride Leaching of Titanium from Ti-Bearing Electric Furnace Slag in [NH4+]-[F−] Solution
by
 ,
,
Fuqiang Zheng
, 
Yufeng Guo
*,
Feng Chen
,
Shuai Wang
*,
Jinlai Zhang
,
Lingzhi Yang
and
Guanzhou Qiu
School of Minerals Processing and Bioengineering, Central South University, Changsha 410083, China
*
Authors to whom correspondence should be addressed.
Metals 2021, 11(8), 1176; https://0-doi-org.brum.beds.ac.uk/10.3390/met11081176
Submission received: 30 June 2021
/
Revised: 20 July 2021
/
Accepted: 21 July 2021
/
Published: 24 July 2021
(This article belongs to the Special Issue Metal Recovery and Separation from Wastes)
Abstract
:The effects of F− concentration, leaching temperature, and time on the Ti leaching from Ti-bearing electric furnace slag (TEFS) by [NH4+]-[F−] solution leaching process was investigated to reveal the leaching mechanism and kinetics of titanium. The results indicated that the Ti leaching rate obviously increased with the increase of leaching temperature and F− concentration. The kinetic equation of Ti leaching was obtained, and the activation energy was 52.30 kJ/mol. The fitting results of kinetic equations and calculated values of activation energy both indicated that the leaching rate of TEFS was controlled by surface chemical reaction. The semi-empirical kinetics equation was consistent with the real experimental results, with a correlation coefficient (R2) of 0.996. The Ti leaching rate reached 92.83% after leaching at 90 °C for 20 min with F− concentration of 14 mol/L and [NH4+]/[F−] ratio of 0.4. The leaching rates of Si, Fe, V, Mn, and Cr were 94.03%, 7.24%, 5.36%, 4.54%, and 1.73%, respectively. The Ca, Mg, and Al elements were converted to (NH4)3AlF6 and CaMg2Al2F12 in the residue, which can transform into stable oxides and fluorides after pyro-hydrolyzing and calcinating.
1. Introduction
Titanium dioxide is an irreplaceable high-grade functional white pigment and widely used in coatings [1], rubber [2], papermaking [3], printing [4] and other chemical industries [5,6,7,8,9,10], due to its characteristics, stable chemical properties, good color covering capability, high tinting strength and dispersion, nontoxicity, and electronic properties. Its application is a key indicator for evaluating the national modernization [11]. The titanium reserves in China account for about 38.8% of that worldwide, providing an important material basis for the development of titanium dioxide production and the promotion of China’s modernization process. Statistically, titanium dioxide production consumes 90% of titanium raw materials all over the world [12,13,14]. Nowadays, about 62.7% of global titanium dioxide is produced by chlorination process, and the other is produced by sulfuric acid process [15].
The chlorination process requires high quality titanium-rich feedstock containing TiO2 ≥ 90% and CaO + MgO < 1.5%, because the non-volatile CaCl2 and MgCl2 will hinder the chlorination reaction and obstruct the reaction bed [16,17,18]. The chlorination temperature of TiO2 reaches 900–1000 °C, and the oxidation temperature of TiCl4 reaches 1800–2000 °C. A large number of toxic and harmful, flammable, and explosive media, such as Cl2, TiCl4, and CO, participate in the high temperature reaction, which is not conducive to safe production [19]. The chlorination process can only produce rutile titanium dioxide, which belongs to high-end titanium dioxide product [20]. The hazardous wastes, including CaCl2, MgCl2, unreacted titanium-rich feedstocks, and petroleum coke, cannot be recycled except for by deep burial.
Ilmenite and titanium slag can be used as the feedstocks of the sulfuric acid process. The reaction temperature of sulfuric acid and titanium-bearing feedstock is about 250 °C, and the calcination temperature for TiO2 transition is 700–900 °C [21]. The sulfuric acid process can produce the anatase and rutile titanium dioxide products belonging to low-end titanium dioxide products [21,22]. The iron in ilmenite is transformed into ferrous sulfate which causes the waste of iron resources and environmental pollution [23]. A large amount of waste acid and acid wastewater produced by the sulfuric acid process cannot be recycled. Environmental pollution has become an insurmountable problem in the production of titanium dioxide. Therefore, the method for the clean production of titanium dioxide is the focus of the titanium dioxide industry.
The fluorination method was proposed to prepare titanium dioxide, ferric oxide, or calcium fluoride from ilmenite or perovskite [24,25]. The leaching agent of fluorination method is NH4HF2 or NH4F. The reaction temperature of fluoride leaching process is about 100 °C, which is much lower than that of chlorination process and sulfuric acid process. Fluorine and ammonia in the fluorination method can be recycled in the thermal hydrolysis process of fluorinated ammonium salt [26]. The solution containing fluorine and ammonia is returned to the leaching or impurity removal process for recycling, which ensures the cleanliness of the fluorination method. The fluorination reaction of ilmenite or perovskite should be carried out under high temperature and high pressure. The Ti leaching rate is only about 78% at 160 °C for 120 min in the leaching of perovskite by NH4HF2 [25].
The titanium resources contained in the vanadium titanomagnetite concentrate in the Panxi region account for more than 50% of China’s total titanium resources. At present, iron and vanadium in vanadium titanomagnetite concentrate are mainly recovered by the blast furnace process. Titanium in the blast furnace titanium slag cannot be effectively recovered [27,28]. The direct reduction-electric furnace smelting process is an effective method to utilize iron and enrich titanium from vanadium titanomagnetite concentrate, and has been commercialized in South Africa and New Zealand [29]. The titanium in vanadium titanomagnetite concentrate is enriched in Ti-bearing electric furnace slag (TEFS) containing high SiO2, Al2O3, CaO, and MgO, which cannot be the feedstock of chlorination process and sulfuric acid process. TEFS can be used to prepare titanium dioxide by fluorination method due to its low requirements for impurities in feedstock. However, the main Ti-bearing mineral phase in TEFS is a complex solid solution with a stable structure and is more difficult to decompose by NH4HF2 or NH4F than ilmenite and perovskite. Our team studied the pressurized fluoride leaching of TEFS, including the leaching of the main elements and the transformation of mineral phase and particle morphology [30]. Based on the results, we found that there are some shortcomings in pressurized fluoride leaching in large-scale leaching equipment. During the leaching process, the F-bearing solution and steam cause serious corrosion to the equipment. The outer layer of the heating parts in the fluoride leaching equipment needs to be sprayed with fluorine-resistant materials which are easy to deform and fall off under high temperature. The leaching pressure and temperature reach the designated values too slowly. It is more harmful to fluorine-resistant materials, which makes it difficult to enlarge the pressurized fluoride leaching reactor. The completion of fluoride leaching reaction at a temperature under normal pressure was more conducive to the industrial production. However, compared with pressurized leaching, the rate of the chemical reaction was lower during normal pressure leaching. Therefore, it is necessary to study the fluoride leaching mechanism and kinetics of titanium from TEFS under a normal pressure system, in order to reveal the key factors affecting the Ti leaching rate. It has important practical significance for increasing the leaching speed and realizing the industrialization.
In this paper, the effects of F− concentration and temperature on the TEFS fluoride leaching mechanism and kinetics were investigated. The transformation of mineral phase and microstructure during leaching can reveal the fluoride leaching mechanism of TEFS. The kinetics study can determine the rate-controlling step and key factors in order to provide a basis for regulating the leaching reaction rate. The findings will provide a technical basis for the preparation of titanium dioxide by fluorination method with TEFS and is of great significance for improving the utilization of titanium resources in the Panxi region of China.
2. Experimental methods
2.1. Experimental Procedure
The leaching experiment was carried out in a 500 mL plastic three-necked flask fitted with an agitator and a reflux condenser. The leaching reaction of fine TEFS particles was completed in a very short time, which made it impossible to accurately study the leaching kinetics. Too wide particle size range is not conducive to the study of leaching kinetics. Therefore, the TEFS used in this study were crushed and screened with standard Taylor sieves from 200 mesh to 250 mesh, and the volume average particle size was 67.35 μm. The mass transfer rate between the solution and TEFS particles was accelerated by strengthening the stirring. The influence of stirring on the external diffusion can be ignored, as the rotating speed was 200 r/min. During the leaching process, the flask was heated in a thermostatically controlled water bath. The [NH4+]/[F−] molar ratio of [NH4+]-[F−] solution was 0.4. First, 300 g of [NH4+]-[F−] solution with required F− concentration was loaded into the flask and heated to the designated temperature. After that, 15 g TEFS sample was put into the [NH4+]-[F−] solution. There was a large excess of leaching solution, with the L/S ratio of 20:1, which meant the change of F− concentration can be neglected in the whole leaching process. The F− concentration range was chosen to be 8 mol/L to 14 mol/L in order to ensure that the concentration of leaching agent was much larger than the theoretical consumption and lower than the maximum solubility. When the leaching time reaches the experimental required time, the slurry was filtered and washed with distilled water immediately. Then the washed residue was dried for 4 h at 110 °C for the analyses of chemical composition, mineral phase, and microstructure.
2.2. Definition of Parameters
The Ti leaching rate is defined as follows:
where X demotes the Ti leaching rate (%), m demotes the mass of dry leaching residue (g), wTi denotes the Ti content of dry leaching residue (wt%), m0 demotes the initial mass of dry TEFS sample (g), and w0 denotes the Ti content of dry TEFS sample (wt%).
2.3. Analysis and Characterization
The chemical compositions of TEFS sample and leaching residue were quantitatively analyzed by the fusion method of X-ray fluoroscopy (XRF, Axios mAX, Holand PANalytical Co., Ltd., Almelo, The Netherlands).
The chemical compositions of the leaching solution were determined by inductively coupled plasma atomic emission spectrometry (ICP-MS, Optima 5300DV, PerkinElmer, Waltham, MA, USA).
The mineral phases of the TEFS sample and leaching residue were characterized by X-ray diffraction (XRD, Cu Ka radiation, λ = 0.154056 nm, 40 kV, 300 mA, SCAN: 10.0/80.0/0.0085/0.15 sec, D/max2550PC, Rigaku Co., Ltd., Tokyo, Japan).
The scanning electron microscope equipped with an energy diffraction spectrum analyzer (SEM, JEOL JSM-6490LV, Tokyo, Japan) was used to study the microstructure and element analysis of TEFS sample and leaching residue.
The particle size distribution of TEFS sample was characterized by laser practical size analyzer (Mastersize 2000, Malvern Panalytical, Malvern, England).
3. Results and Discussion
3.1. Ti-Bearing Electric Furnace Slag
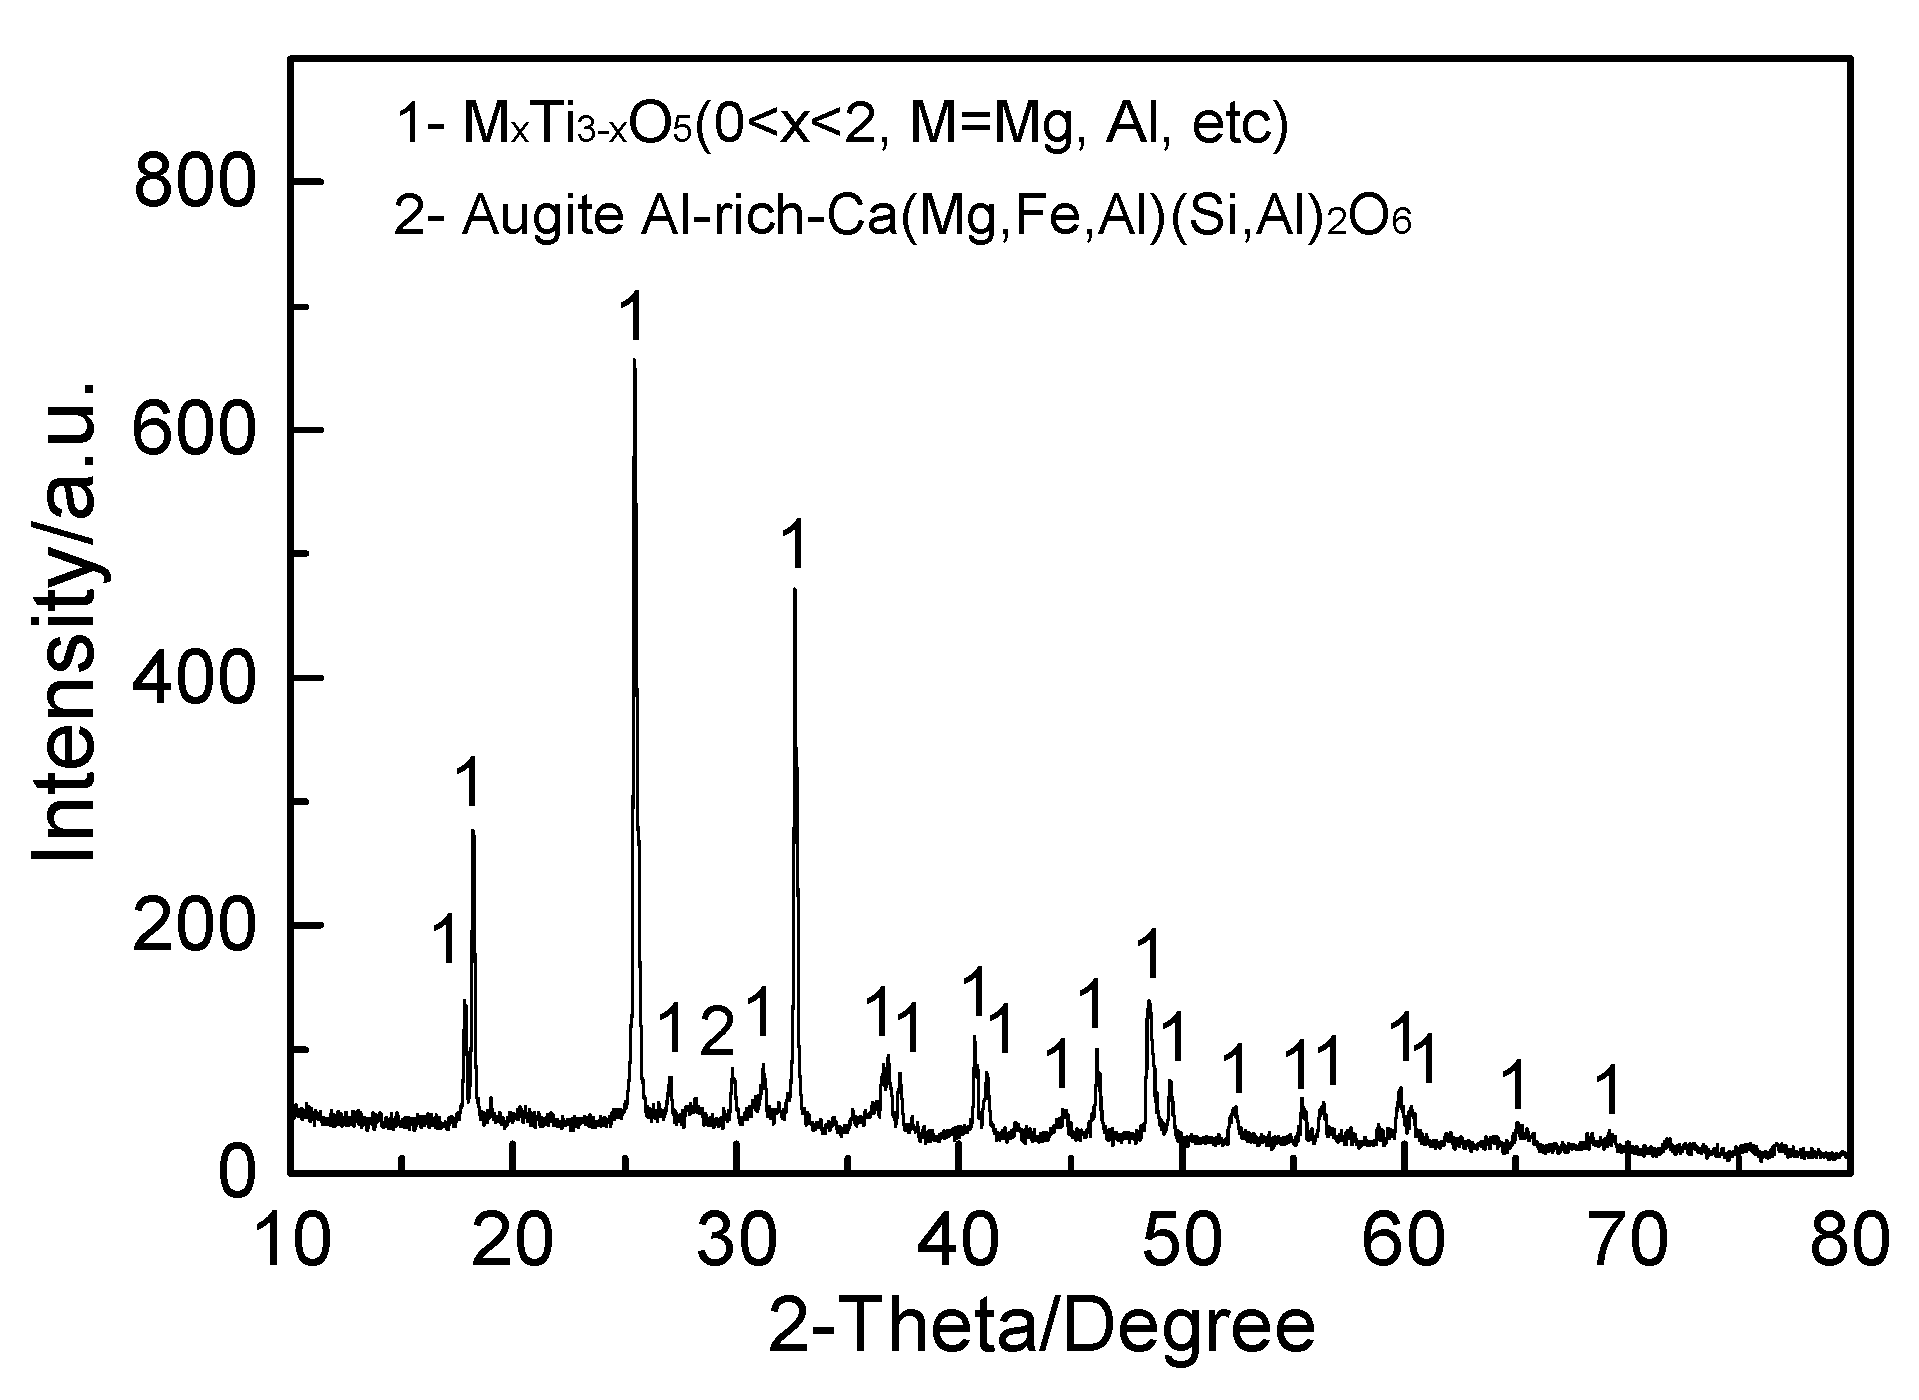
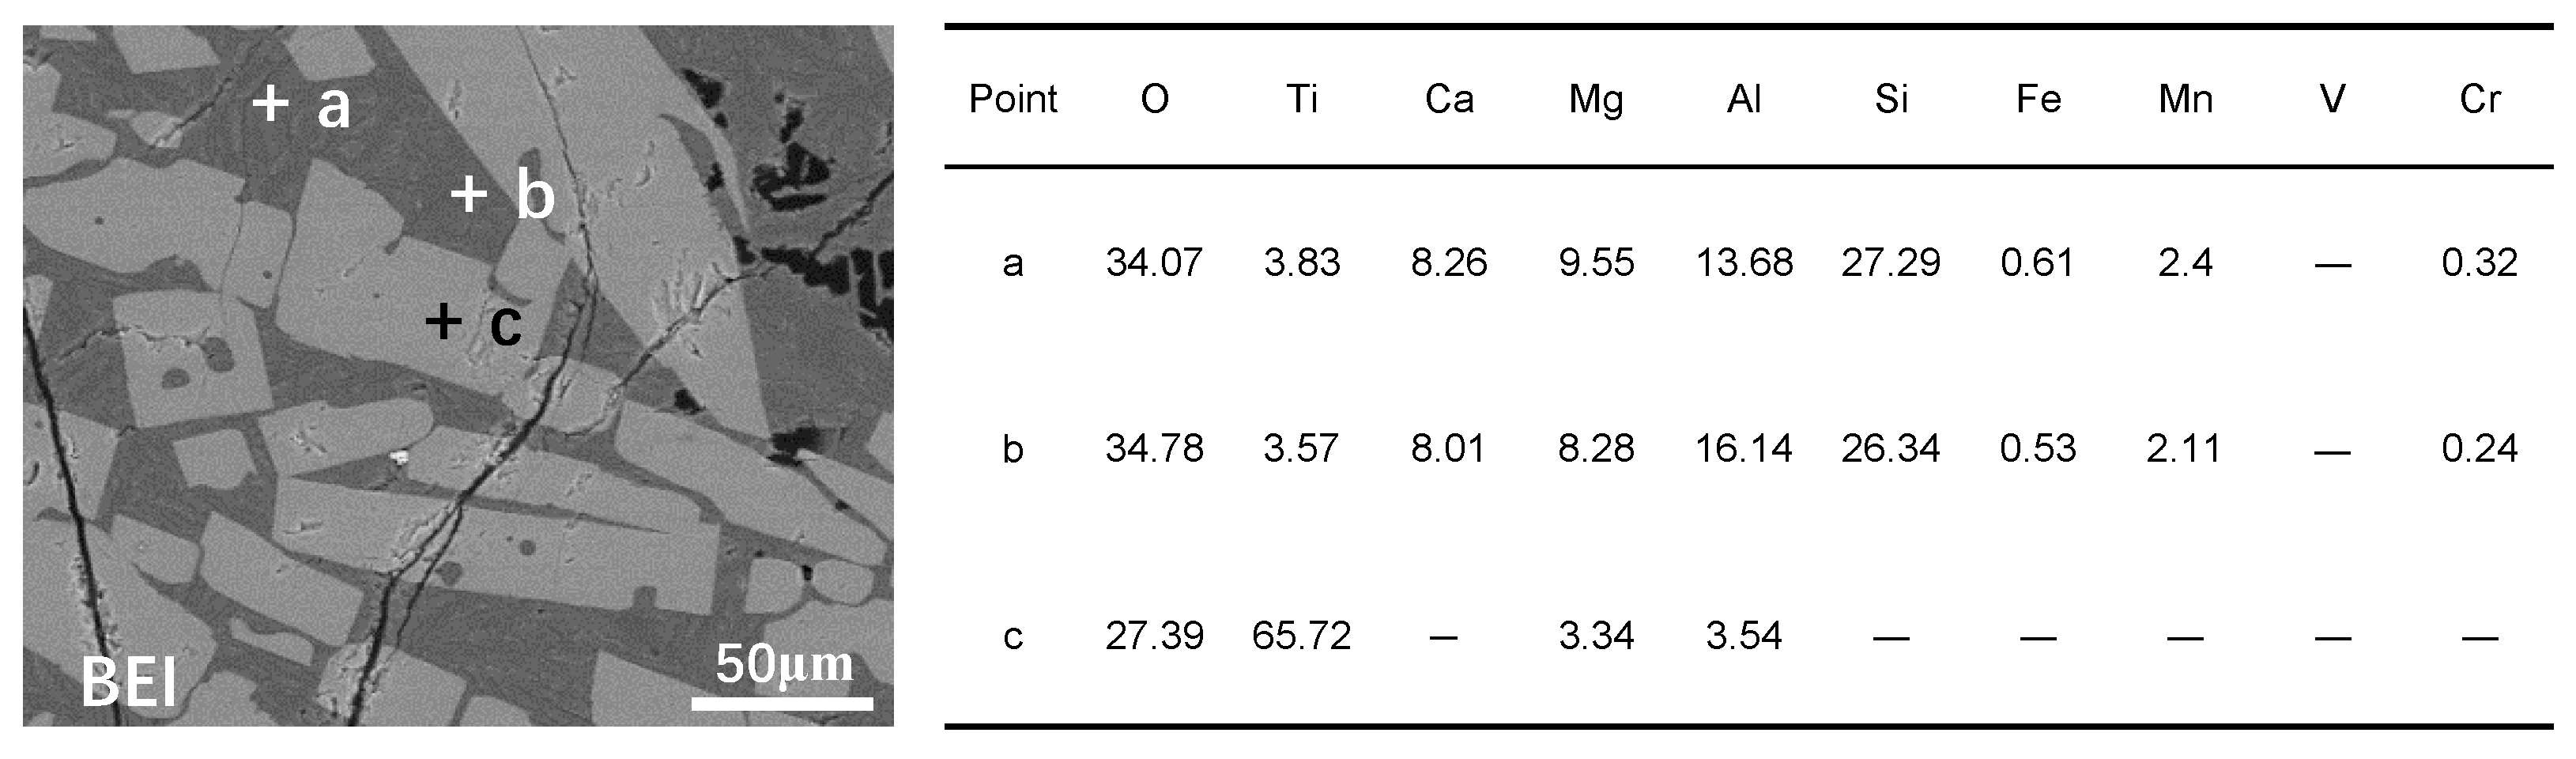
The TEFS used in this investigation was provided by the Chongqing Iron and Steel (group) Co., Ltd. (Chongqing, China). The TEFS was produced from vanadium titanomagnetite concentrate by the direct reduction-electric furnace smelting process. The main chemical composition of TEFS was listed in Table 1. The X-ray diffraction (XRD) pattern of TEFS was shown in Figure 1. The SEM microstructure and EDS analysis of TEFS was shown in Figure 2, which indicates that the columnar MxTi3xO5 particles embedded in the gangue phase of augite. The width of columnar MxTi3xO5 particles is less than 50 μm. All reagents used in the study were of analytical grade.
3.2. Thermodynamic Analysis of Fluoride Leaching Reactions
The major Ti-bearing mineral phase in TEFS is MxTi3xO5, which is the solid solution of Ti3O5, MgTi2O5, and Al2TiO5. The reactions of Ti-bearing mineral phases in TEFS during fluoride leaching can be simply expressed as follows.
2Ti3O5(s) + 24H+(aq) + 36F−(aq) + O2(g) = 6TiF62−(aq) + 12H2O(aq)
Al2TiO5(s) + 10H+(aq) + 18F−(aq) = 2AlF63−(aq) + TiF62−(aq) + 5H2O(aq)
MgTi2O5(s) + 10H+(aq) + 14F−(aq) = MgF2(s) + 2TiF62−(aq) + 5H2O(aq)
The major gangue in TEFS is augite, which can be simply regarded as CaSiO3, MgSiO3, Al2SiO5, CaAl2O4, MgAl2O4, CaO·MgO·2SiO2, and CaO·Al2O3·2SiO2. The reactions of gangue in TEFS during fluoride leaching can be expressed as follows.
CaSiO3(s) + 6H+(aq) + 8F−(aq) = CaF2(s) + SiF62−(aq) + 3H2O(aq)
MgSiO3(s) + 6H+(aq) + 8F−(aq) = MgF2(s) + SiF62−(aq) + 3H2O(aq)
Al2SiO5(s) + 10H+(aq) + 18F−(aq) = 2AlF63−(aq) + SiF62−(aq) + 5H2O(aq)
CaAl2O4(s) + 8H+(aq) + 14F−(aq) = CaF2(s) + 2AlF63−(aq) + 4H2O(aq)
MgAl2O4(s) + 8H+(aq) + 14F−(aq) = MgF2(s) + 2AlF63−(aq) + 4H2O(aq)
CaO·MgO·2SiO2(s) + 12H+(aq) + 16F−(aq) = 2SiF62−(aq) + CaF2(s) + MgF2(s) + 6H2O(aq)
CaO·Al2O3·2SiO2(s) + 16H+(aq) + 26F−(aq) = 2SiF62−(aq) + 2AlF63−(aq) + CaF2(s) + 8H2O(aq)
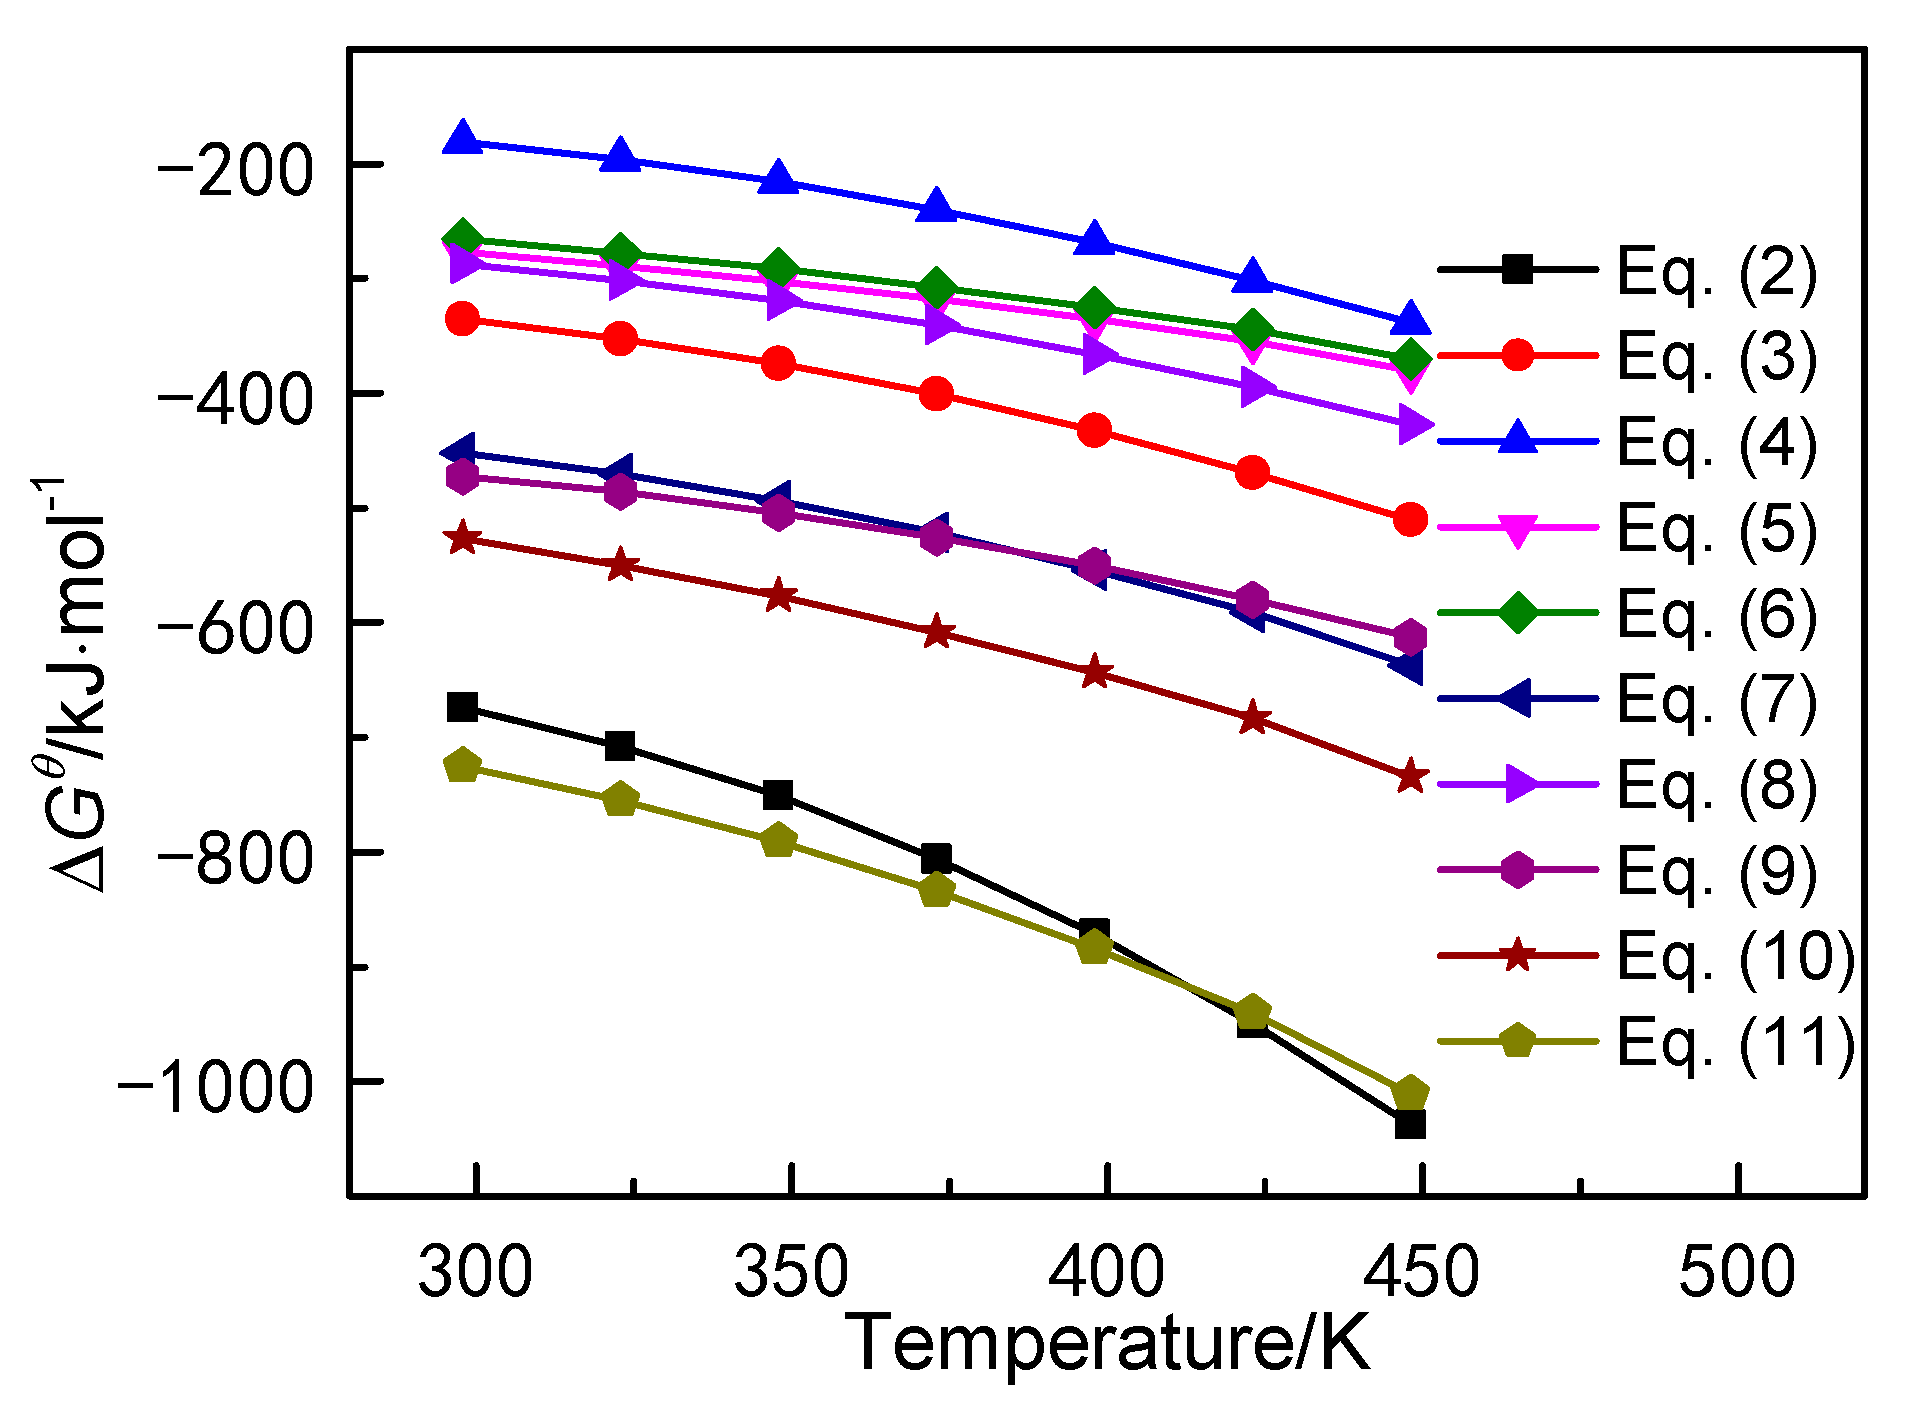
Figure 3 shows the ∆Gθ-T relationship lines of the possible reactions during fluoride leaching. According to the calculated results, the ∆Gθ of Equations (2)–(11) at the temperature range of 298 K to 448 K are less than zero, and all the ∆Gθ decreases with increasing leaching temperature. The calculation results illustrate that Equations (2)–(11) can proceed spontaneously, and the reactions occurred easier as the reaction temperature increased. Comparing the ∆Gθ of Equations (2)–(4), the ∆Gθ line of Equation (2) was below the ∆Gθ lines of Equations (3) and (4), which means the Ti3O5 was easier to decompose in the leaching process than Al2TiO5 and MgTi2O5. According to Equations (5)–(7), the MgSiO3 was easier to decompose in the leaching process than Al2SiO5 and CaSiO3. The ∆Gθ lines of Equations (8) and (9) were the fluoride leaching reactions of aluminate, which shows that the fluoride leaching occurring process of MgAl2O4 was easier than that of CaAl2O4. In addition, the ∆Gθ lines of Equations (10) and (11) were below that of other silicates and aluminates. The solubility of (NH4)3AlF6 was only 1.03 g/100g H2O. Thus, the AlF63− may react with the NH4+ in the leaching solution as follows.
3NH4+(aq) + AlF63−(aq) = (NH4)3AlF6(s)
According to the results of thermodynamic analysis, the Ti and Si elements were converted to TiF62− and SiF62− in the leaching solution. The Ca, Mg, and Al elements were converted to CaF2, MgF2, and (NH4)3AlF6 in the residue.
3.3. Effects of Experimental Parameters on Ti Leaching Rates
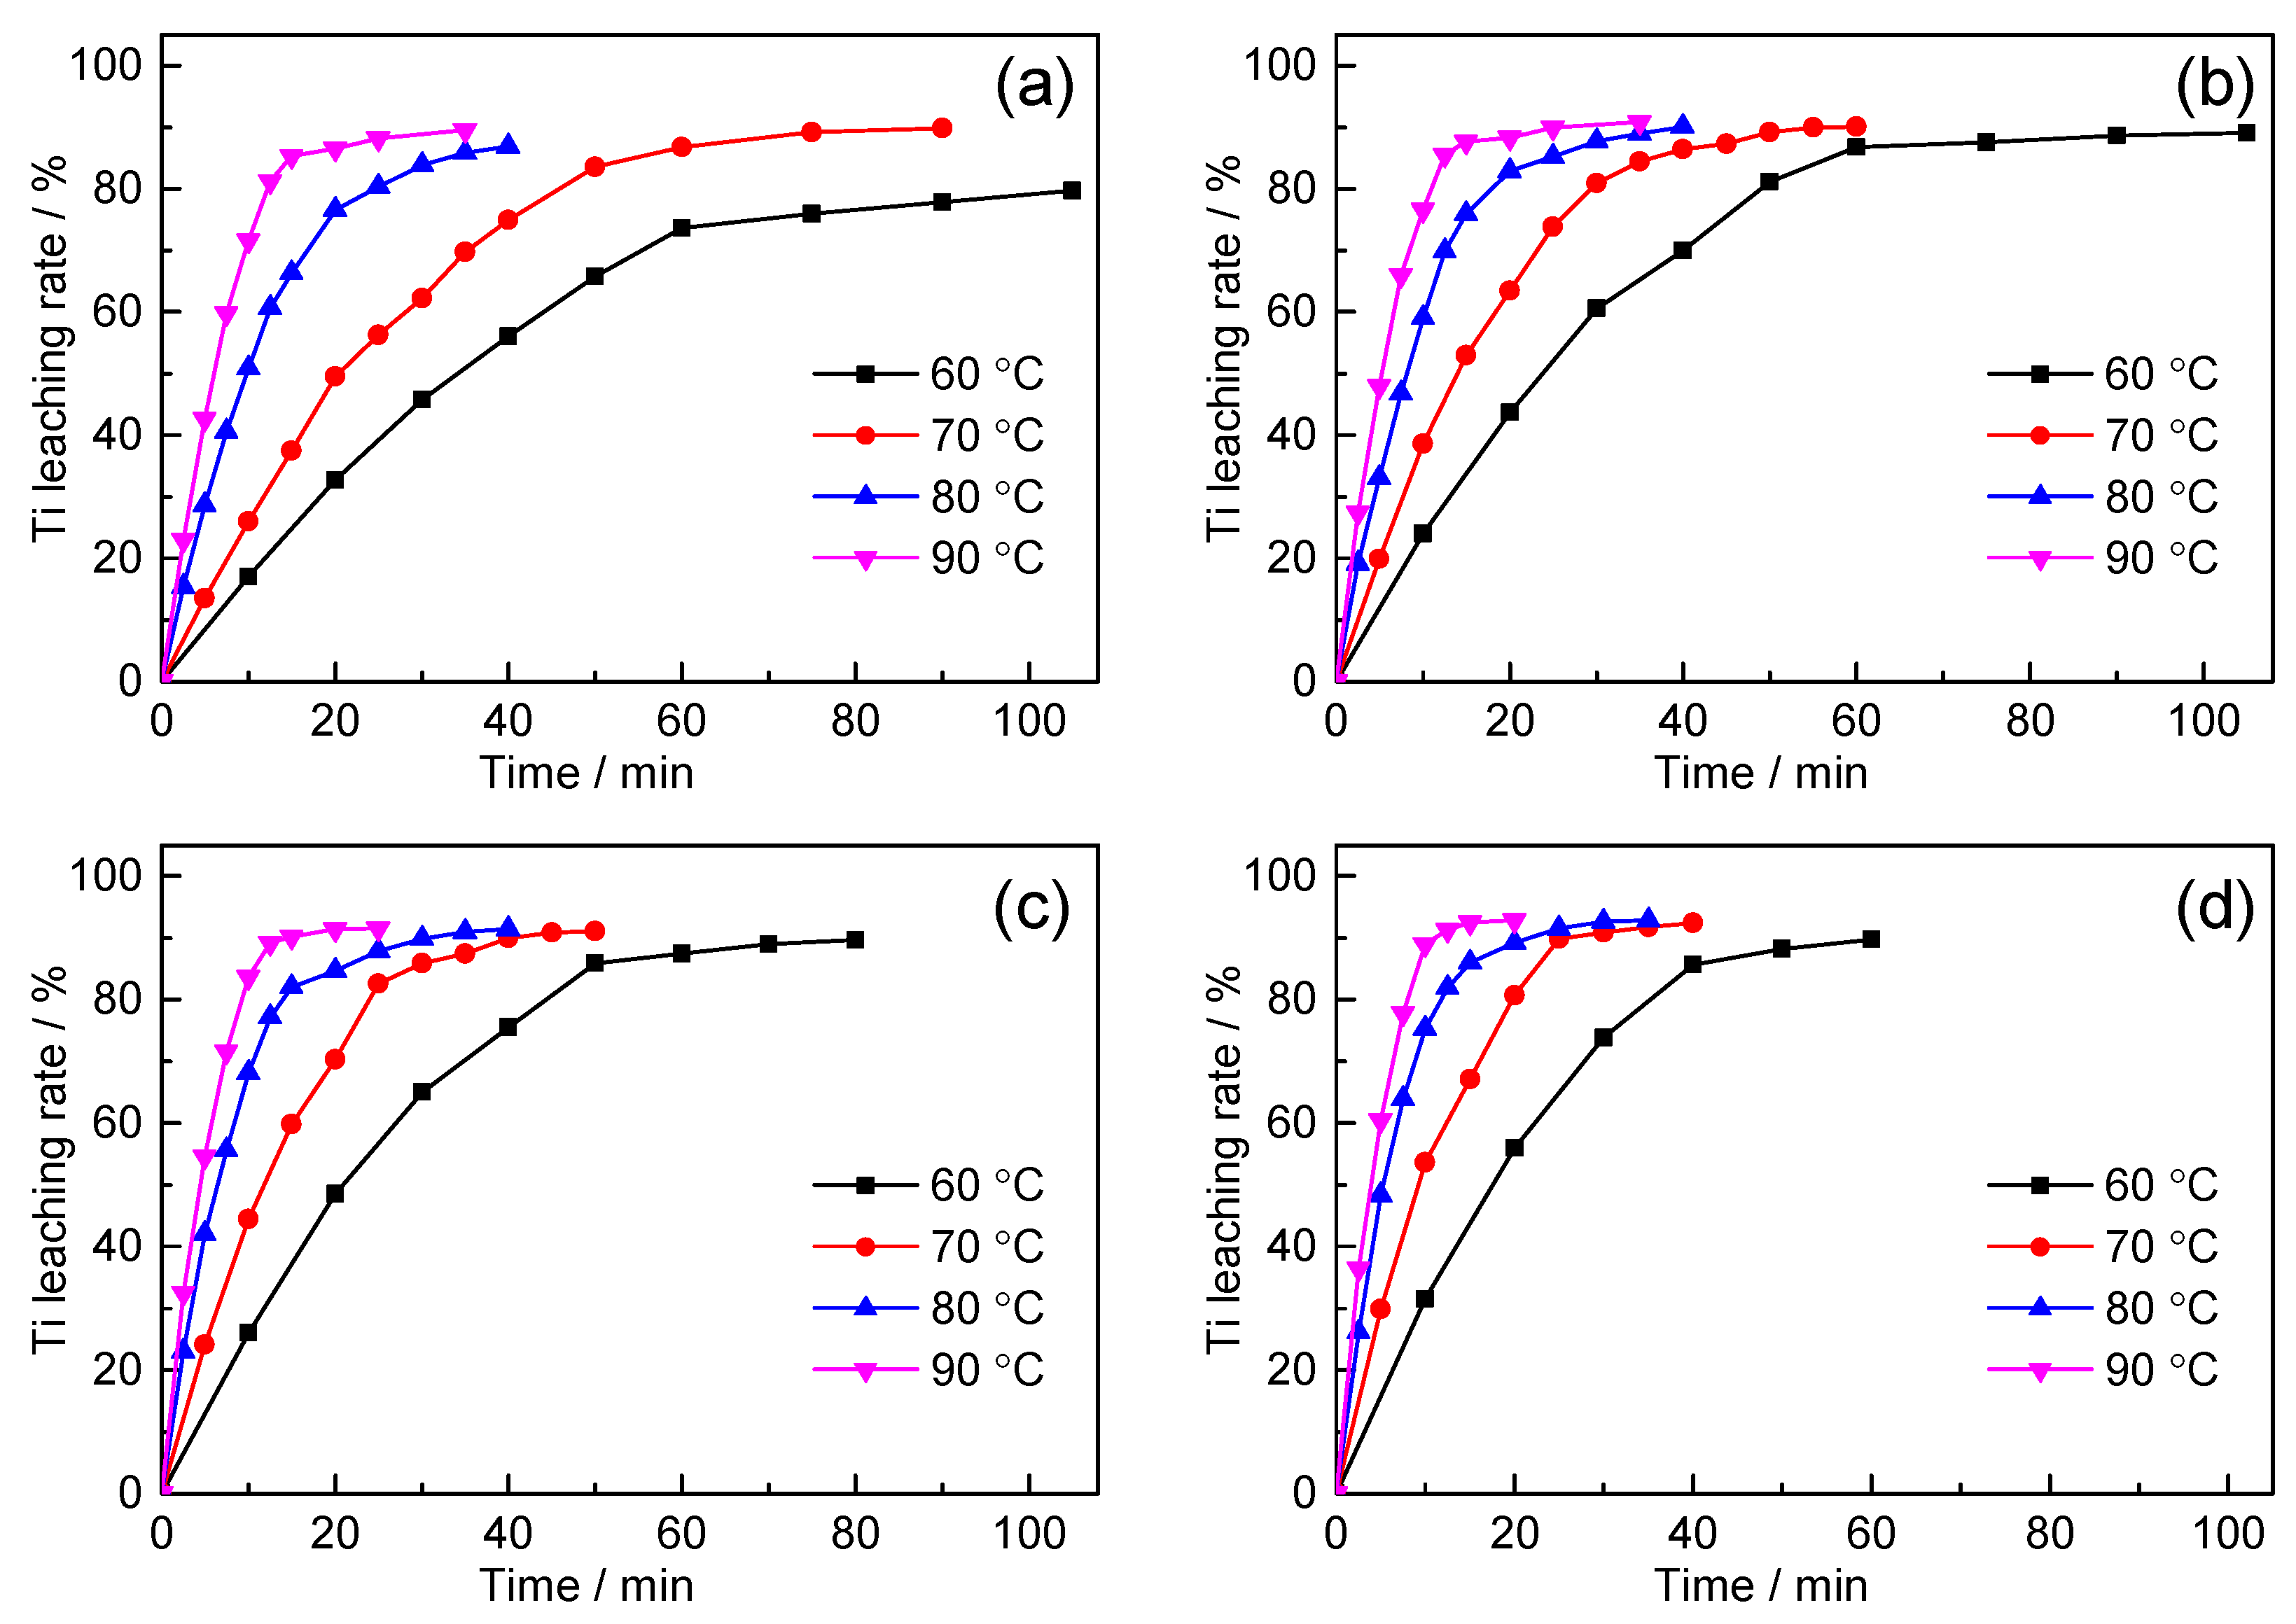
The leaching experiments were carried out in the F− concentration range of 8 mol/L to 14 mol/L and temperature range of 60 °C to 90 °C at L/S ratio of 20:1 with rotating speed of 200 r/min. The effect of temperature and F− concentration on Ti leaching rates are shown in Figure 4.
When the Ti leaching rate reaches a certain value, prolonging the leaching time has no significant effect on the Ti leaching rate. The Ti leaching rate obviously increased with the increase of F− concentration at the leaching temperatures of 60 °C and 70 °C. The F− concentration had no obvious effect on Ti leaching rate when the leaching temperature exceeded 80 °C. With the increase of F− concentration, the effect of leaching temperature on Ti leaching rate decreased. Increased leaching temperature and F− concentration could increase the effective collision of TEFS particles and reactive ions, which promote the leaching reactions.
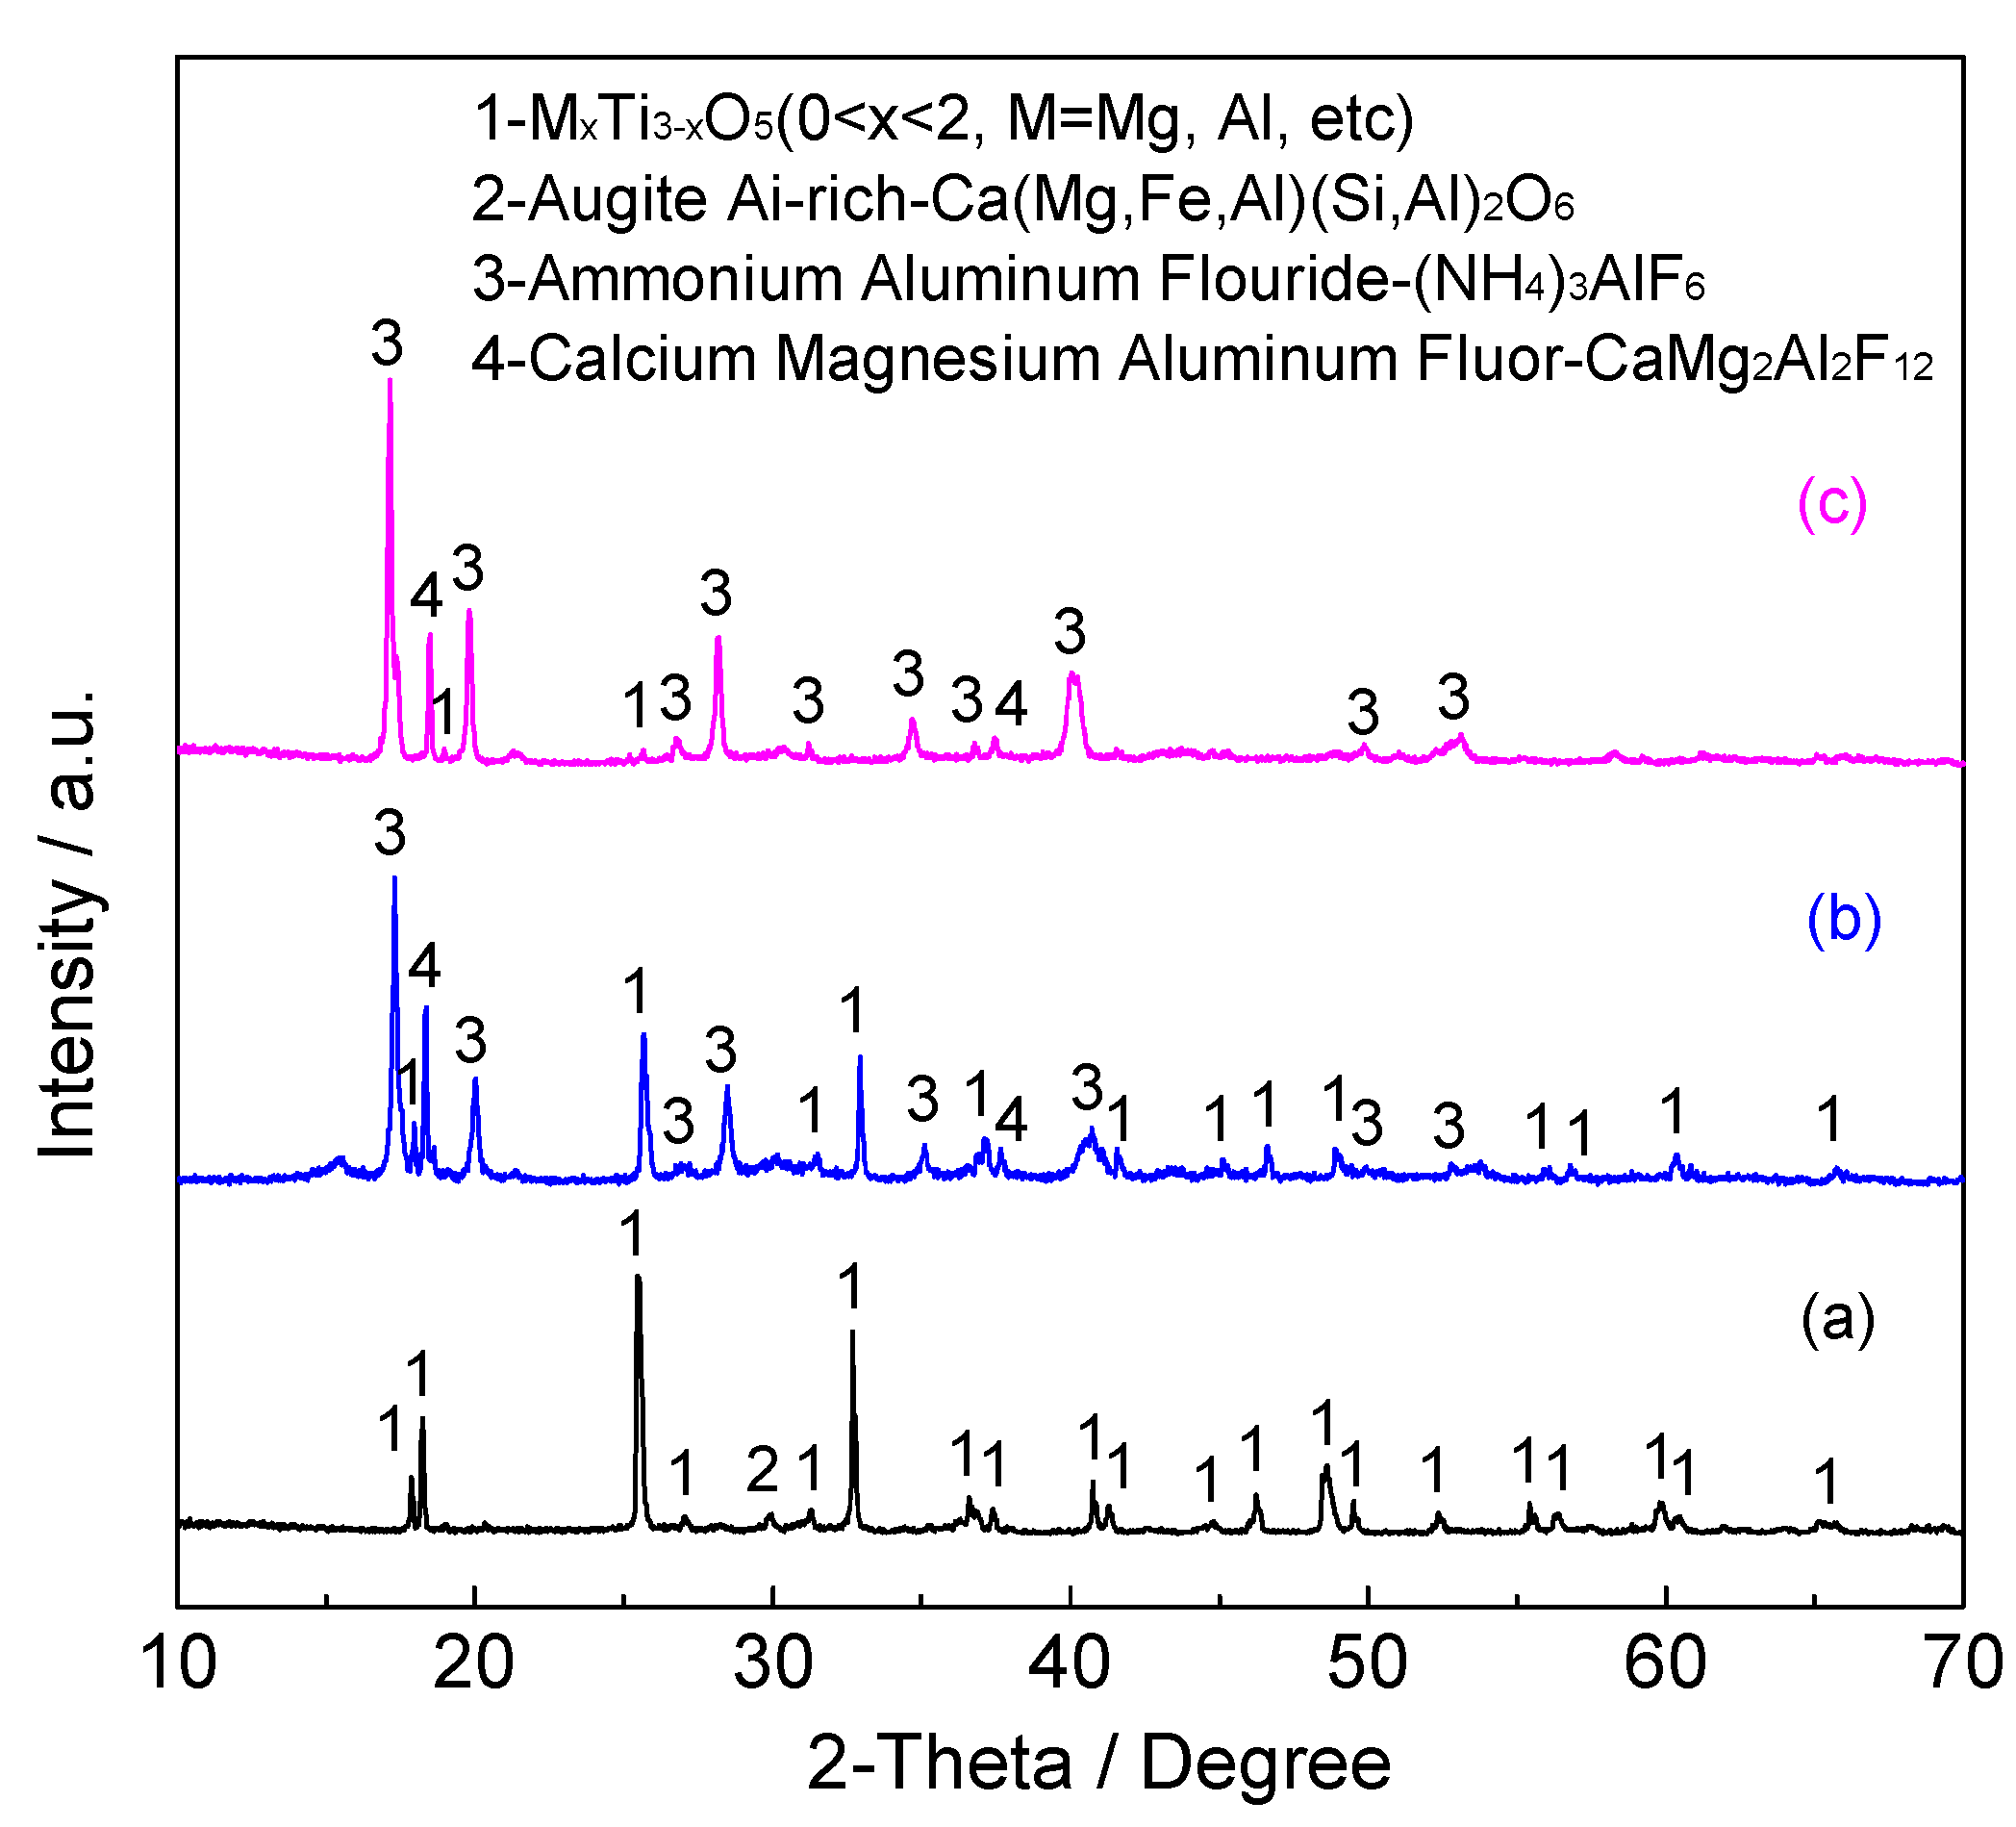
3.4. Transformation of Mineral Phase
The effect of leaching temperature on the mineral phase of leaching residue was shown in Figure 5. The other leaching conditions were F− concentration of 10 mol/L, leaching time of 30 min, L/S ratio of 20:1, and rotating speed of 200 r/min. When the leaching temperature reached 60 °C, the peaks of (NH4)3AlF6 and CaMg2Al2F12 were detected in the leaching residue and the peaks of augite disappeared, as shown in Figure 5b. The peaks of MxTi3xO5 became very weak at the leaching temperature of 90 °C, as shown in Figure 5c. The intensity of (NH4)3AlF6 peaks increased sharply as the leaching temperature rose from 60 °C to 90 °C. The reactions can be expressed as follows.
Al2TiO5(s) + 10H+(aq) +18F−(aq) + 6NH4+(aq) = 2(NH4)3AlF6(s) + TiF62−(aq) + 5H2O(aq)
CaSiO3(s) + 2MgSiO3(s) + Al2SiO5(s) + 28H+(aq) +36F−(aq) = CaMg2Al2F12(s) + 4SiF62−(aq) + 14H2O(aq)
CaAl2O4(s) + 2MgAl2O4(s) + 24H+(aq) +36F−(aq) + 12NH4+(aq) = CaMg2Al2F12(s) + 4(NH4)3AlF6(s) + 12H2O(aq)
CaO·MgO·2SiO2(s) + CaO·Al2O3·2SiO2(s) + 3MgTi2O5(s) + Al2TiO5(s) + 68H+(aq) + 90F−(aq) = 2CaMg2Al2F12(s) + 4SiF62−(aq) + 7TiF62−(aq) + 34H2O(aq)
3.5. Transformation of Microstructure
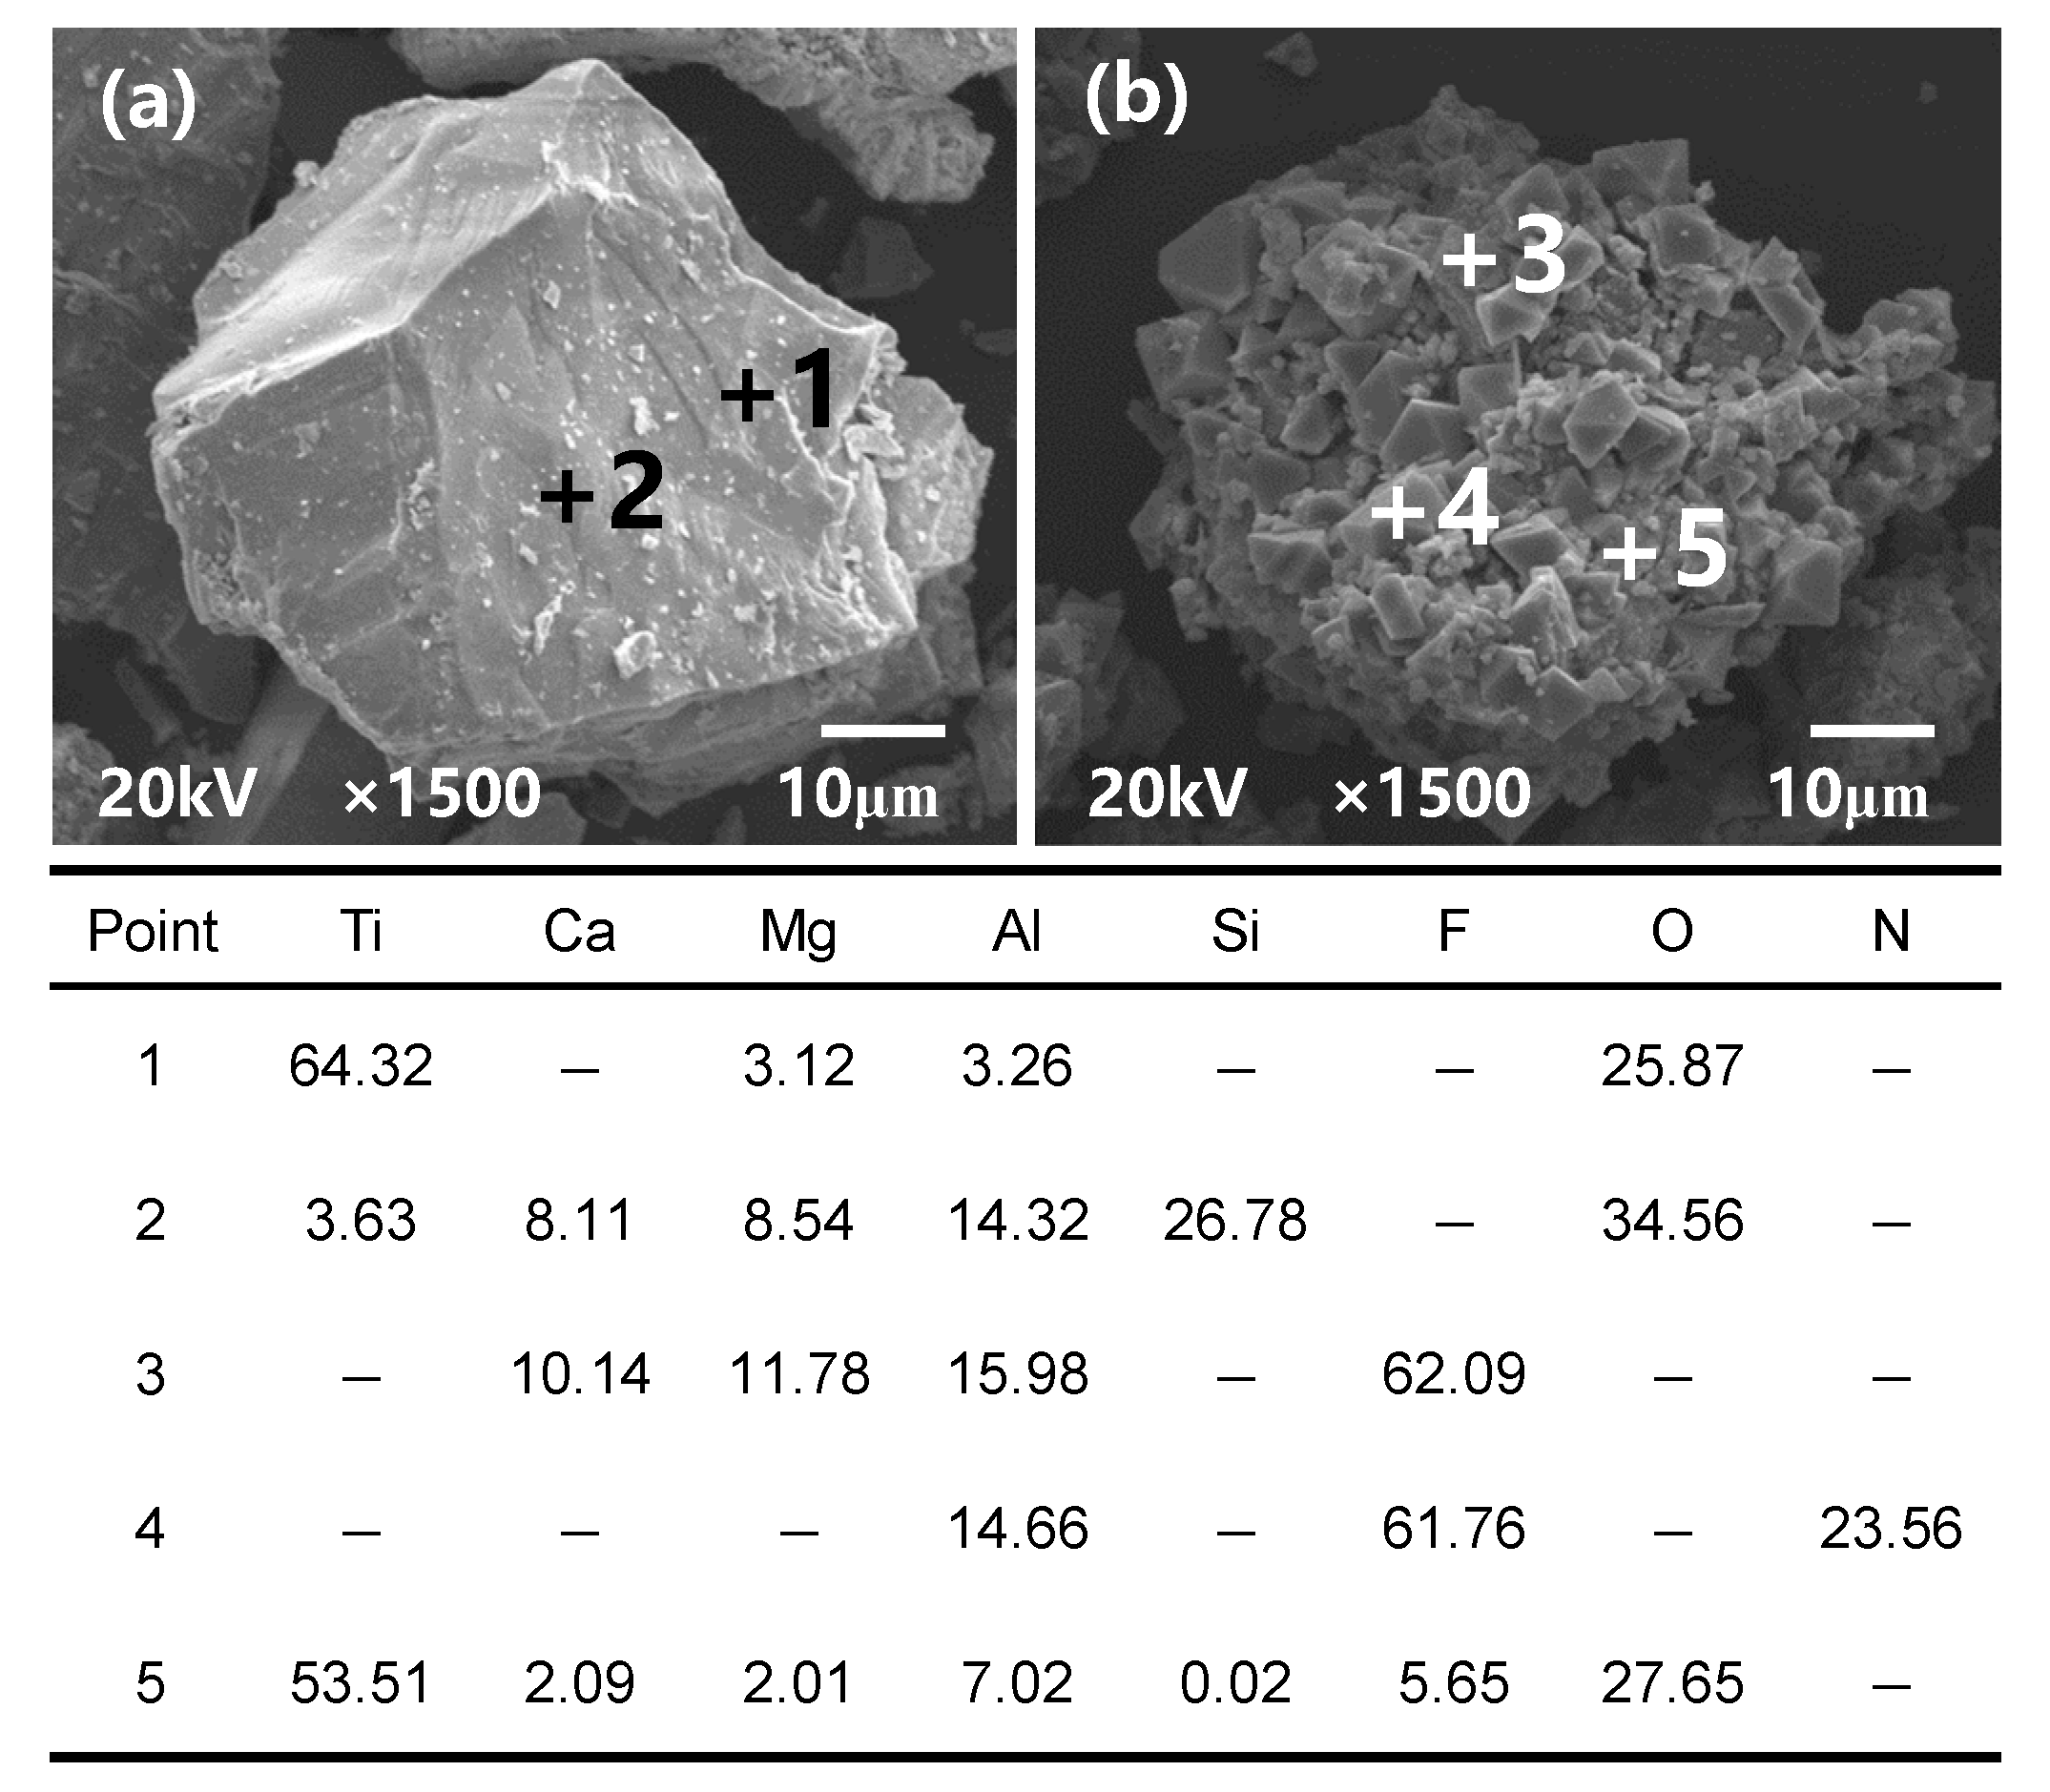
The SEM images and EDS analysis of TEFS and leaching residue are shown in Figure 6. Before the fluoride leaching, the TEFS particle was a dense irregular particle, as shown in Figure 6a. It was observed from the EDS analysis that point 1 was MxTi3xO5 and point 2 was augite. Figure 6b illustrates that the outer layer of the particle is the product layer, and the inside of particle is still unreacted TEFS. Many cracks appeared on the surface of residue. The granular grain on the surface of residue was CaMg2Al2F12 (point 3). The octahedral grain was (NH4)3AlF6, as shown in point 4. Point 5 was the surface of unreacted TEFS. When the fluoride leaching reaction progressed, the surface of the TEFS particle reacts with the leaching reagent and forms the F-bearing ions and F-bearing compounds. The TiF62− and SiF62− ions dissolved in the leaching solution. The CaMg2Al2F12 and (NH4)3AlF6 grains adsorb on the surface of unreacted TEFS.
3.6. Kinetics of Fluoride Leaching of Titanium
3.6.1. Selection of Leaching Kinetics Model
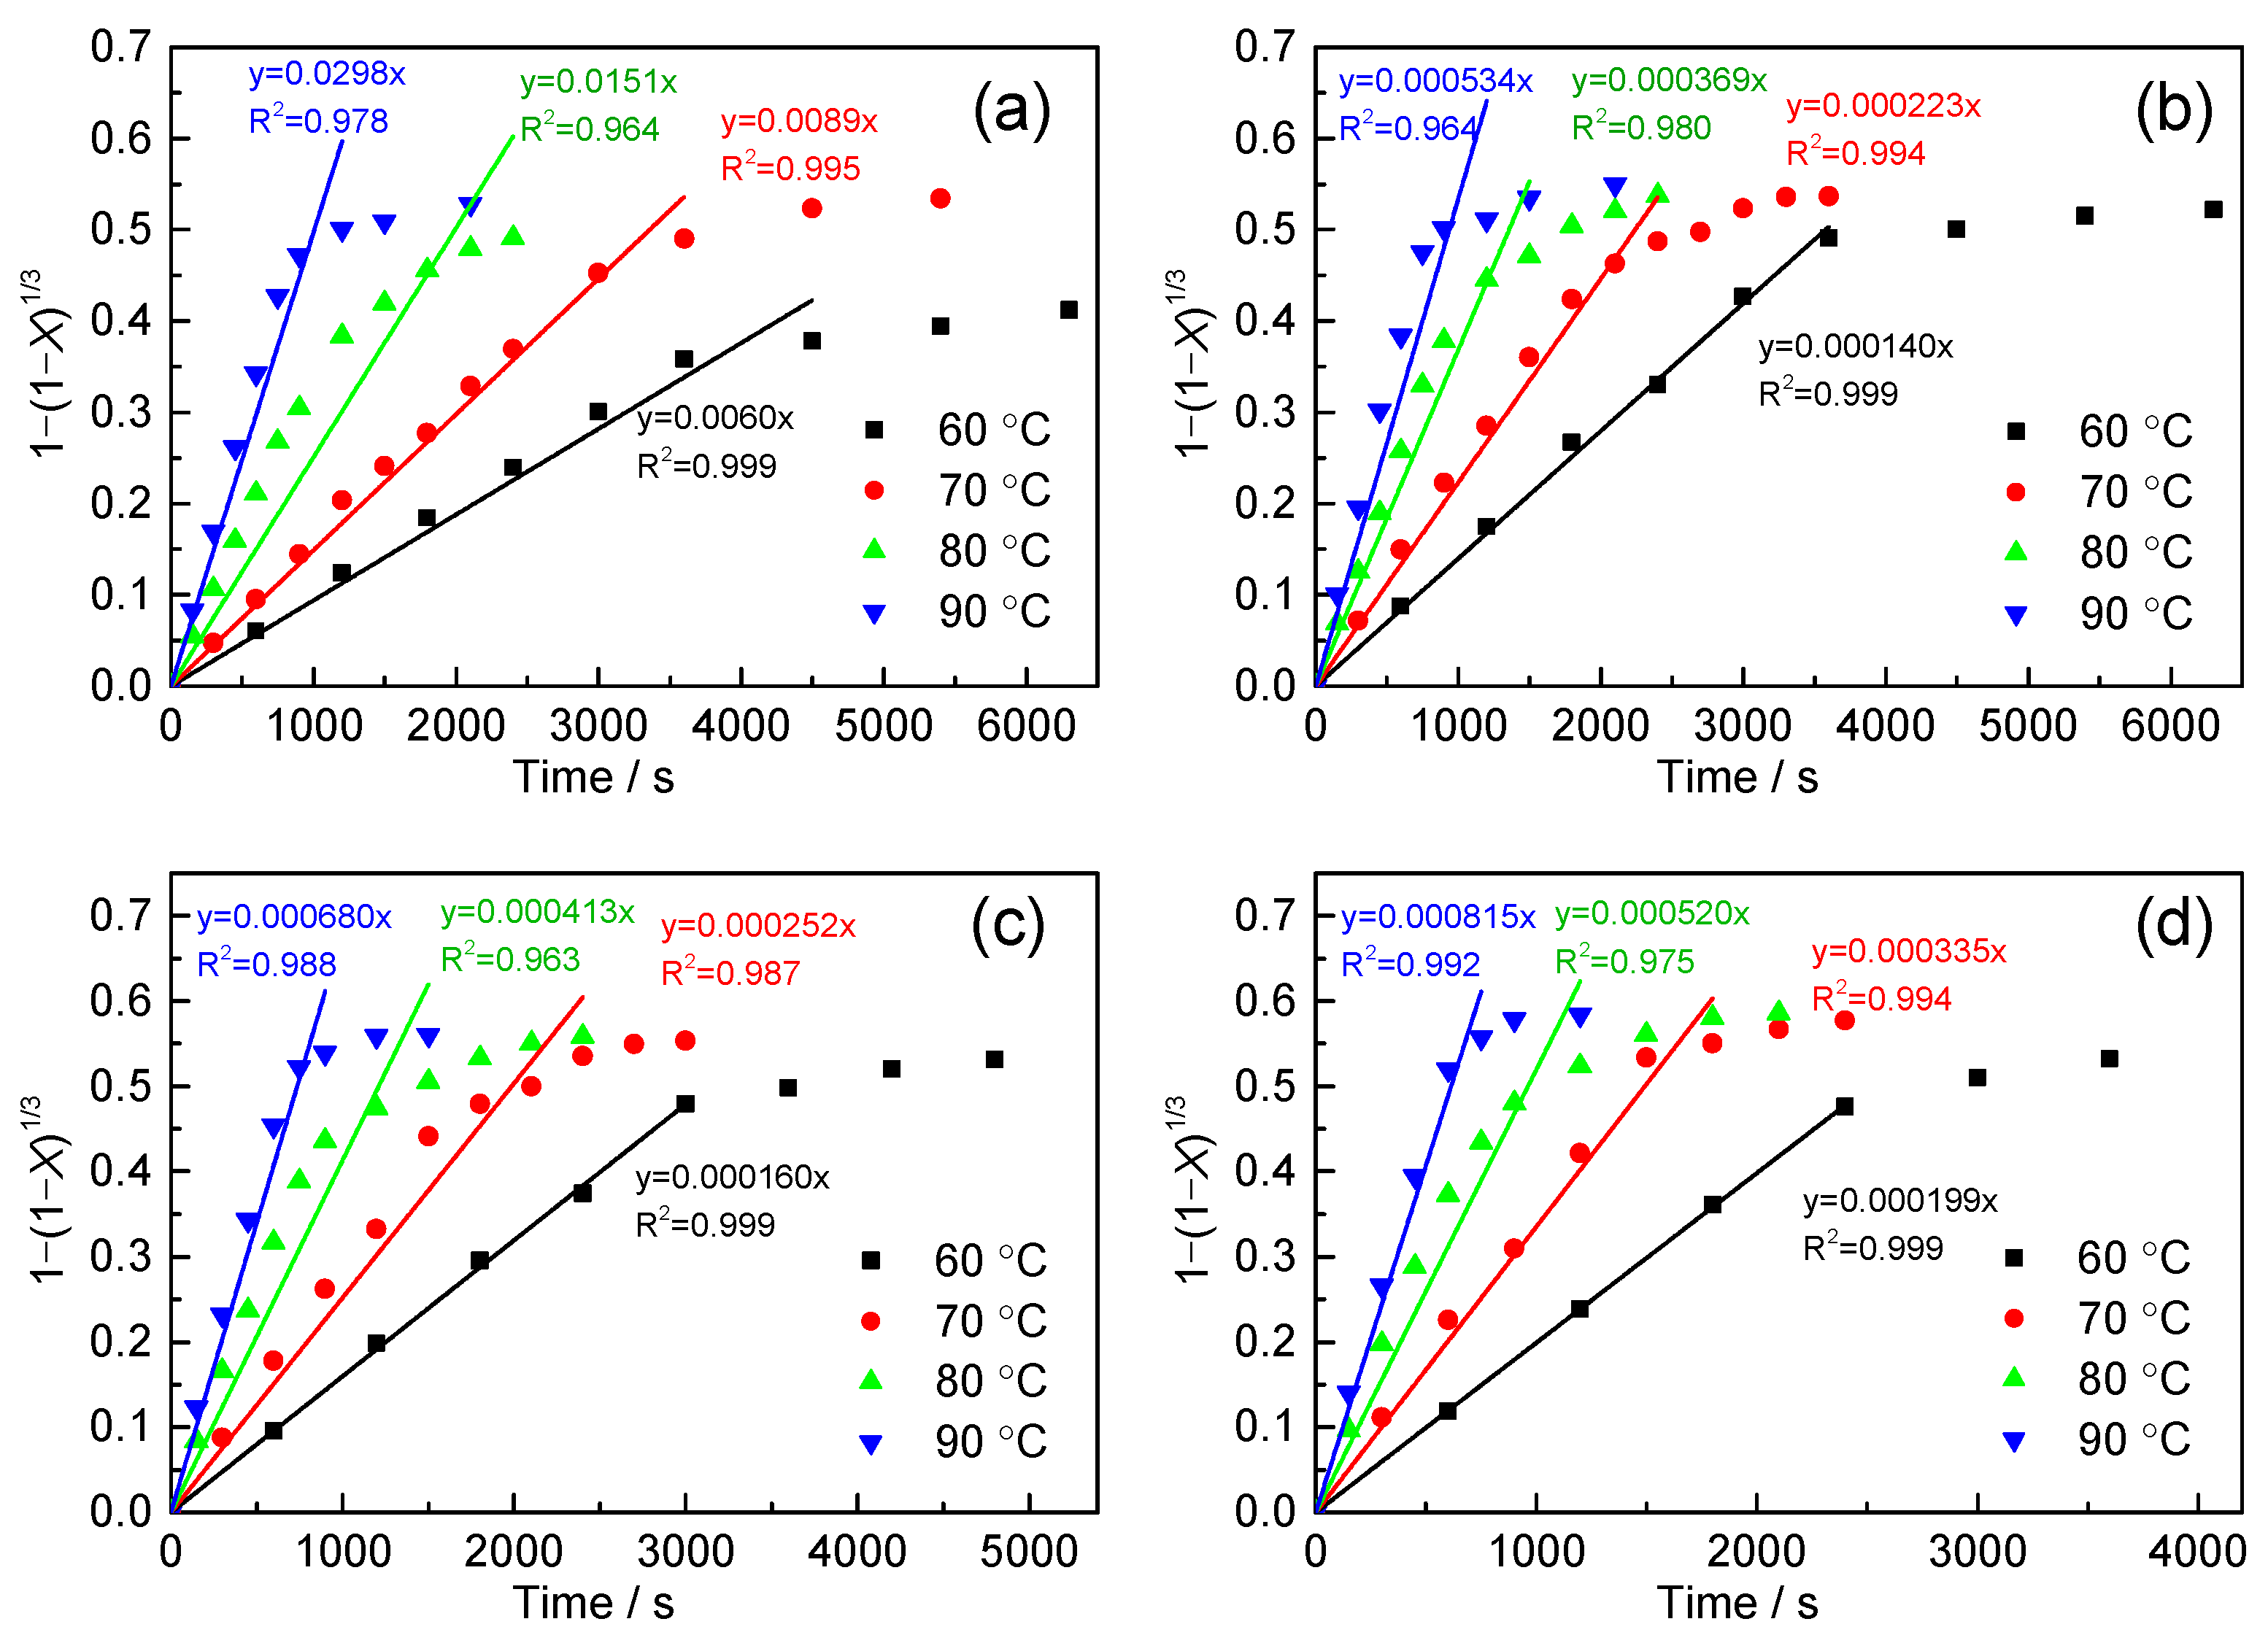
When the fluid reactant reacted with the dense and non-porous solid particles, in addition to forming a fluid product, the resulting solid product or residual inert material was loose and porous. This reaction model is the shrinking core model. The SEM microstructure showed that the TEFS particles were essentially dense grains. The non-porous TEFS particles gradually shrank during leaching. The product layer composed of CaMg2Al2F12 and (NH4)3AlF6 was loose and porous. Thus, the reaction model of TEFS leaching process accords with the shrinking core model [12]. The rate-controlling steps of shrinking core model contain surface chemical reaction and diffusion control through the ash or production layer [31,32]. The rate equations for shrinking core model are listed in Table 2.
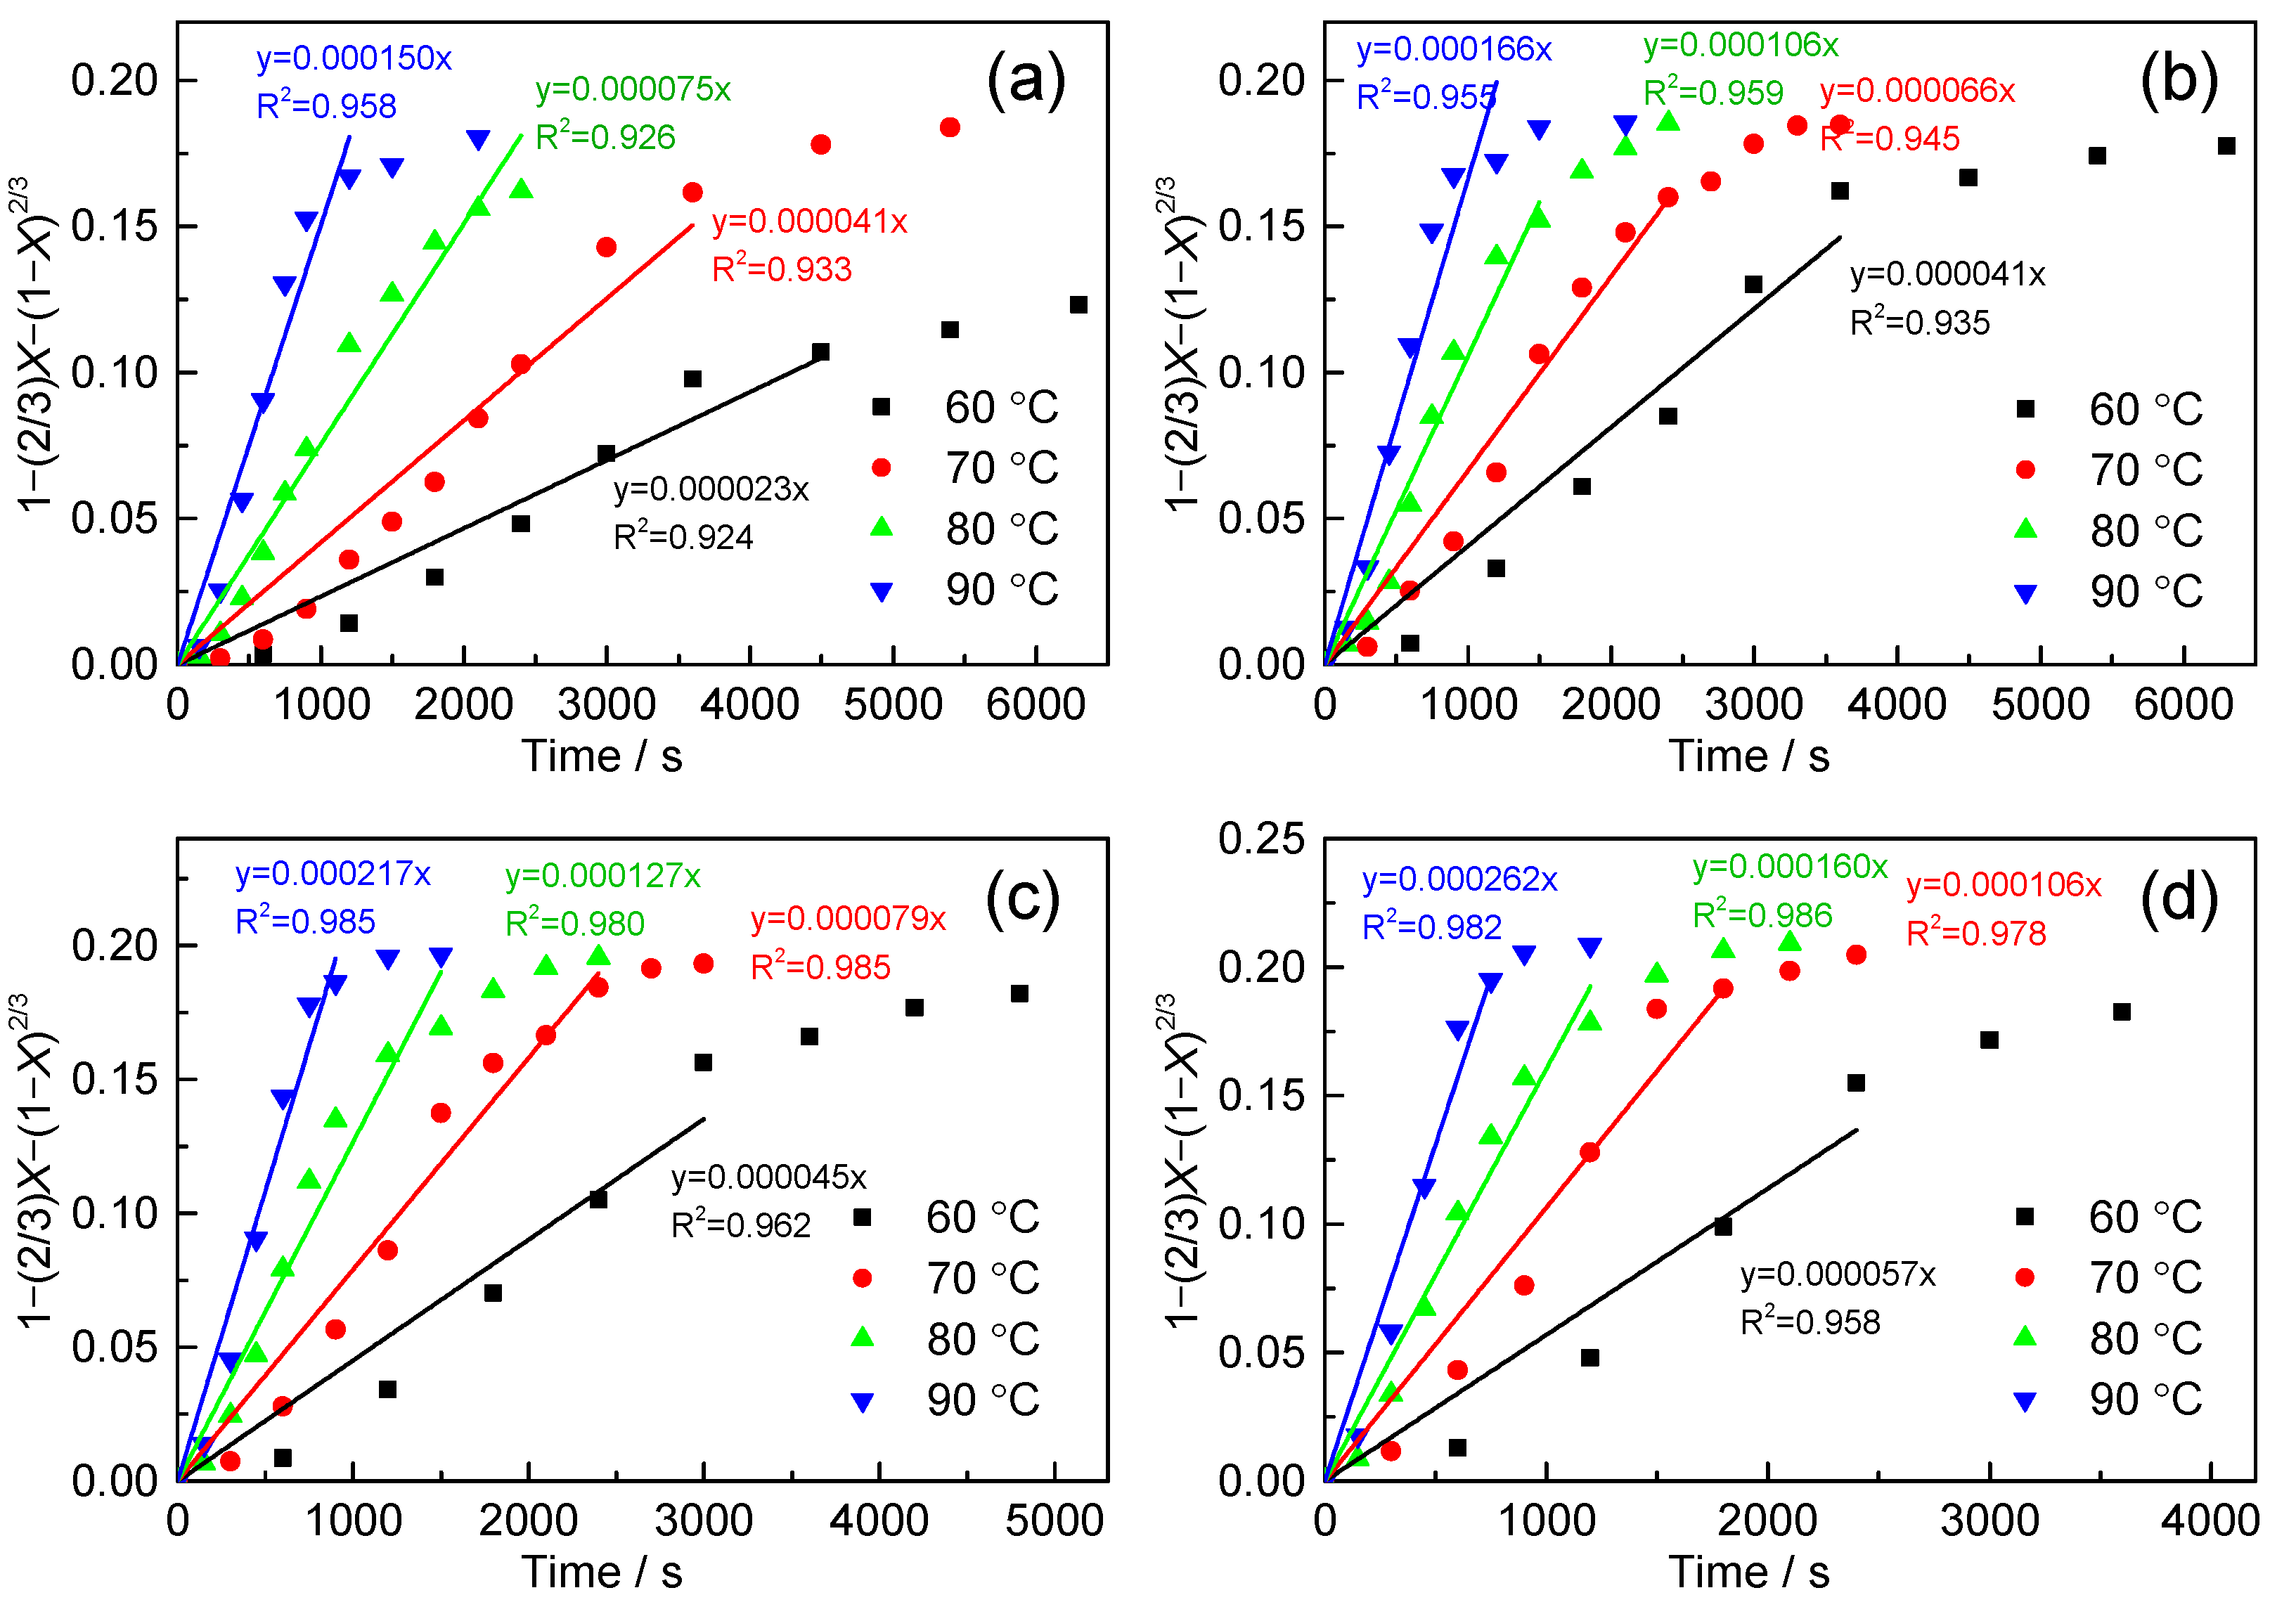
In order to establish the control step, the Ti leaching rates obtained at different conditions in this study were analyzed by the rate equations for shrinking core model. When the Ti leaching rate reached a certain value at the determining F− concentration and temperature, there was no further increase with prolonged time. In this study, the Ti leaching rate increased significantly was used to analyze kinetics. The plots of 1 − (1 − X)1/3 versus time and plots of 1 − (2/3)X − (1 − X)1/3 versus time for different conditions are shown in Figure 7 and Figure 8, respectively. The slope of the fitted straight line denoted the apparent rate constant of rate-controlling step. The correlation coefficients (R2) of the fitted straight line could be used to determine the rate-controlling step. Comparison of R2 between plots of 1 − (1 − X)1/3 and 1 − (2/3)X − (1 − X)2/3 versus time is listed in Table 3. The plots of 1 − (1 − X)1/3 obtained a higher linear relationship with time. The surface chemical reaction step with the highest kinetics resistance is the rate-controlling step. Therefore, the fluoride leaching rate of TEFS was controlled by surface chemical reaction.
3.6.2. Determination of Rate Constant
F− Concentration Index
The kinetic equation of the fluoride leaching rate of TEFS can be expressed as Equation (17).
where X is Ti leaching rate (%), and k is apparent rate constant (min−1).
The apparent rate constant (k) is affected by F− concentration and leaching temperature, as indicated in Equation (18).
where k0 is the preexponential factor of the kinetic equation, CF- is F− concentration (mol/L), b is F− concentration index, E is activation energy (kJ/mol), R is molar gas constant (8.314 J·mol−1·K−1), and T is leaching temperature (K).
The semi-empirical kinetics equation can be established from Equation (17) and Equation (18) as:
While k0∙e−E/RT can be regarded as k1 in order to calculate the F− concentration index (b), Equation (19) can be transformed into:
Equation (20) can be transformed into:
Equation (21) can be transformed into Equation (22) after logarithmic calculation on both sides of the equation.
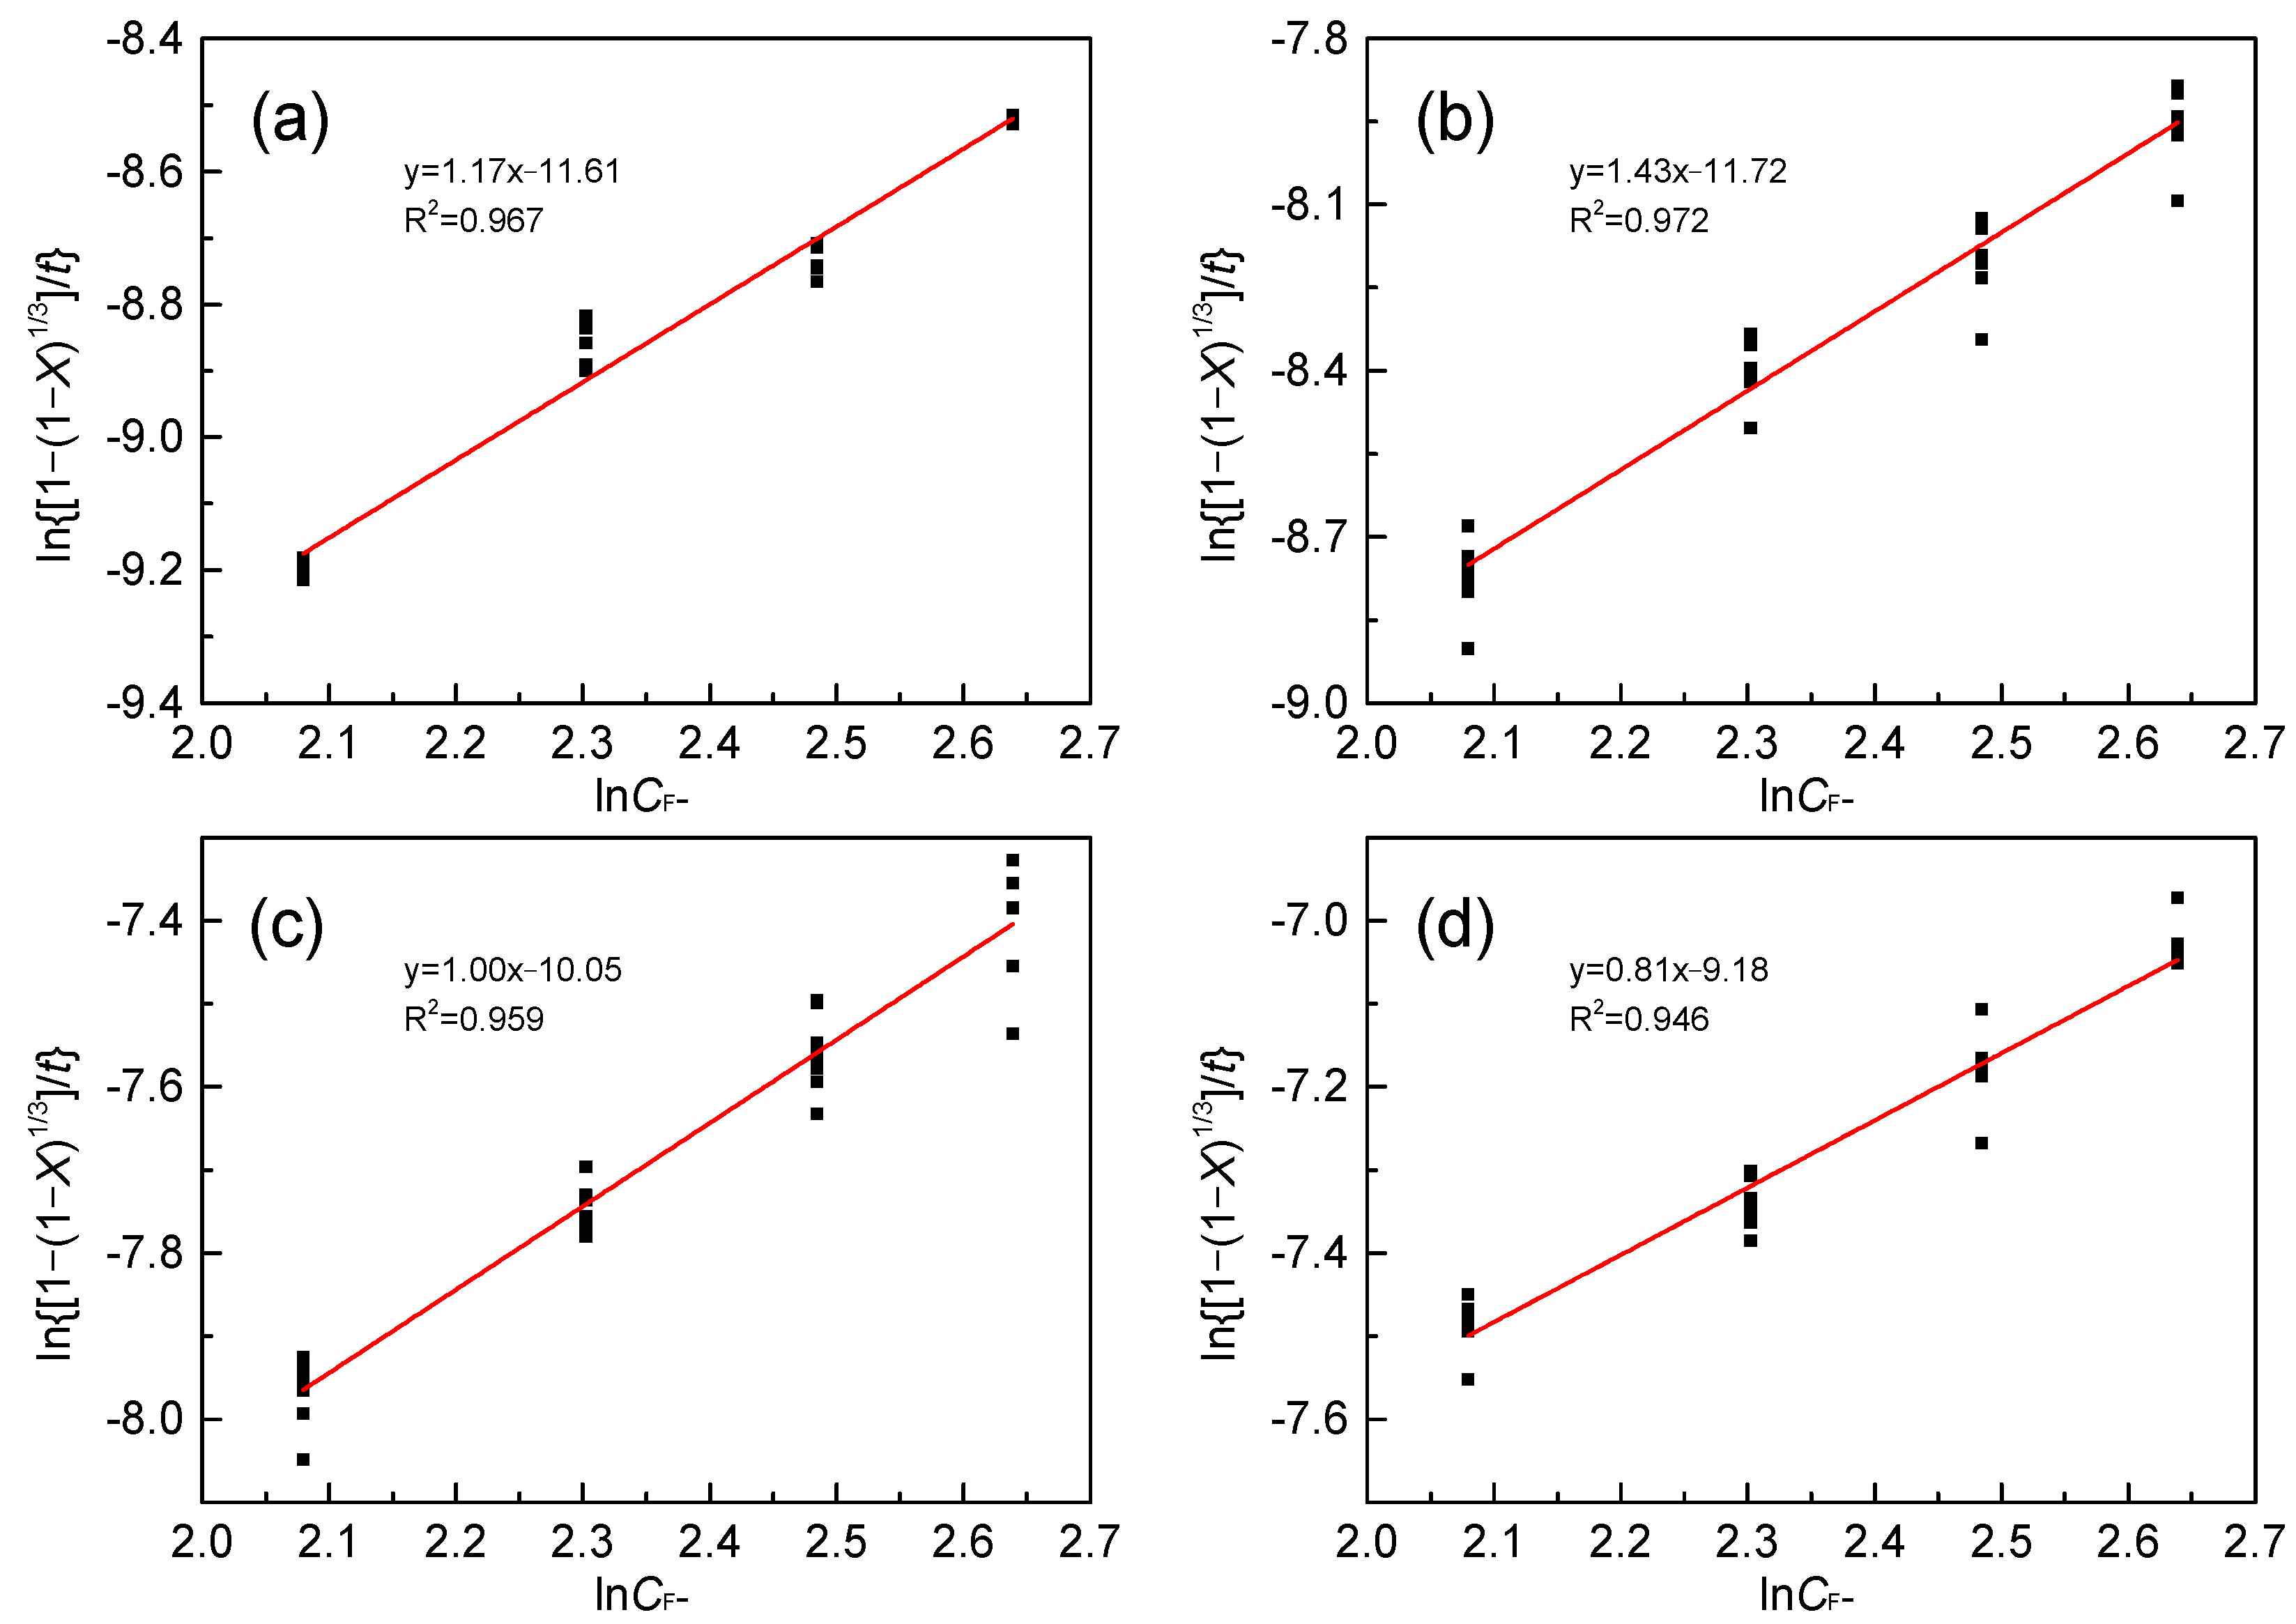
The plots of ln[[1 − (1 − X)1/3]/t] vs. lnCF- at different leaching temperatures are presented in Figure 9. The slopes of fitted straight lines were the F− concentration indexes at different temperatures. The four slopes were calculated to be 1.17, 1.43, 1.00, and 0.81 with R2 of 0.967, 0.972, 0.959, and 0.946, respectively. The statistical average of b was calculated to be 1.10 according to Figure 9.
Equation (19) can be written as:
Activation Energy and Preexponential Factor
In order to calculate the activation energy and preexponential factor, the Equation (18) can be transformed into:
Equation (24) can be transformed into Arrhenius equation after logarithmic calculation on both sides of the equation.
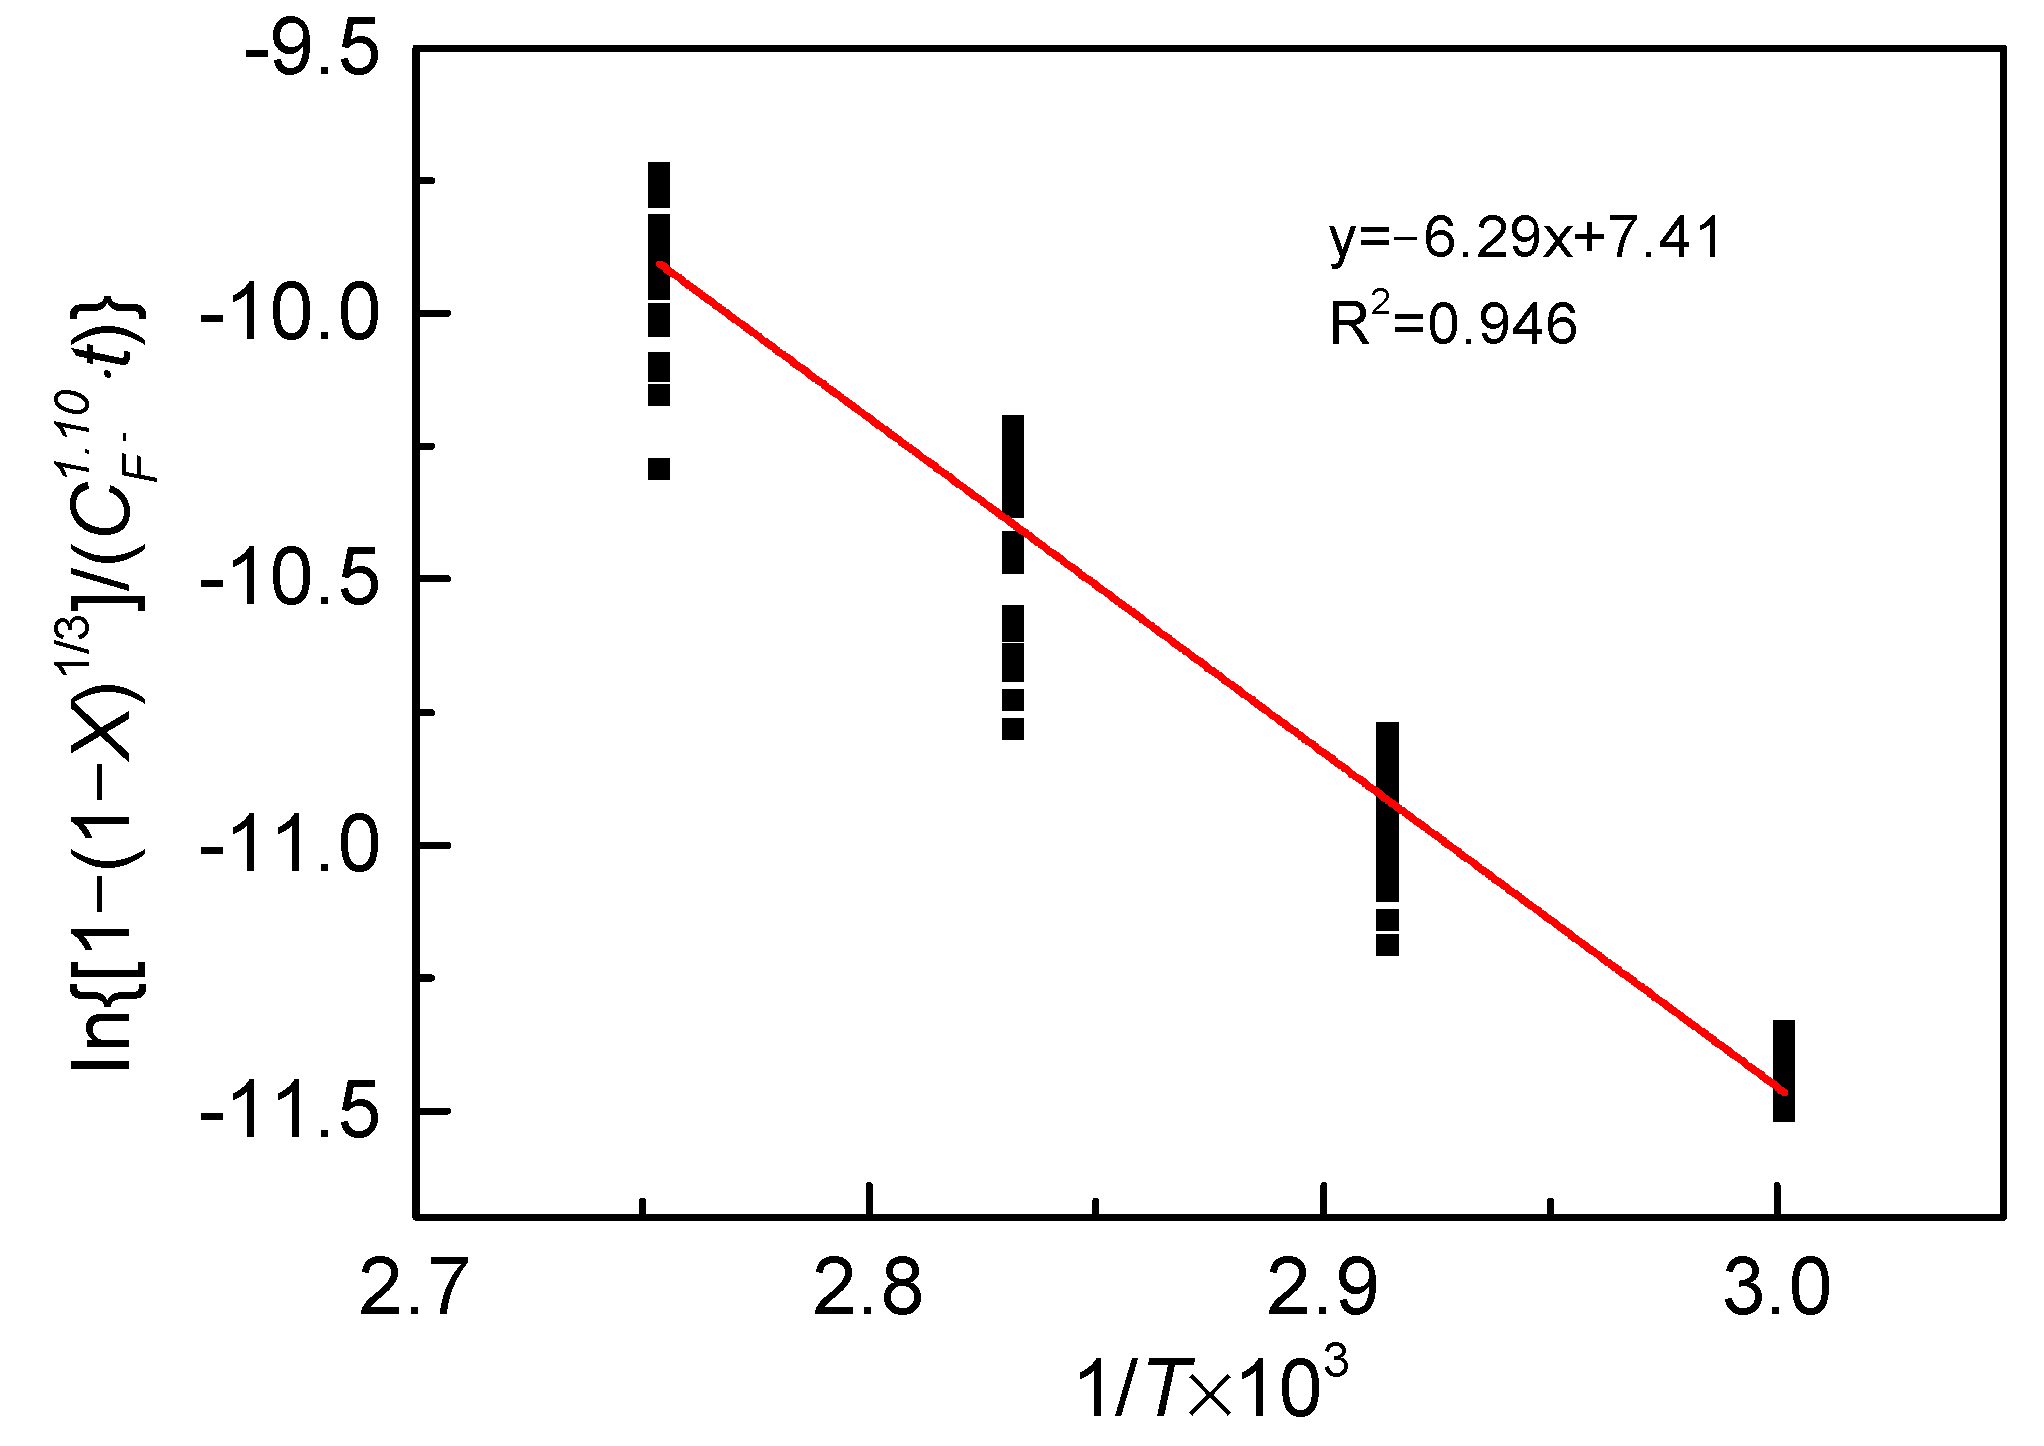
The Arrhenius plot, which describes the relationship of and 1/T × 1000, is shown in Figure 10. The correlation coefficient (R2) of the fitted straight line in Figure 10 is 0.946.
The slope of the fitted straight line denoted the –E/R. The intercept of the fitted straight line and vertical axis represented ln k0.
The slope of fitted straight line in Figure 10 was calculated to be −6.29.
Thus, the activation energy, E, can be expressed as:
The activation energy of the fluoride leaching reaction is 52.30 kJ/mol. The activation energy of the reaction controlled by surface chemical reaction was in excess of 40.0 kJ/mol. The value of the activation energy confirmed that the fluoride leaching rate of TEFS was controlled by surface chemical reaction [31,33].
The intercept of fitted straight line and vertical axis in Figure 10 was calculated to be 7.41.
Thus, the preexponential factor k0 can be expressed as:
The Ti leaching kinetic equation preexponential factor of fluoride leaching reaction was 1652.43.
3.6.3. Determination of Leaching Kinetics
In the conditions of F− concentration range from 8 mol/L to 14 mol/L, leaching temperature range from 60 °C to 90 °C, L/S ratio of 20:1, and rotating speed of 200 r/min, the final semi-empirical kinetics equation can be obtained by synthesizing the Equations (19), (23), (27), and (29).
where X is Ti leaching rate (%), CF- is F− concentration (mol/L), R is molar gas constant (8.314 J·mol−1·K−1), and T is leaching temperature (K).
3.6.4. Comparison of Experimental and Calculated Results
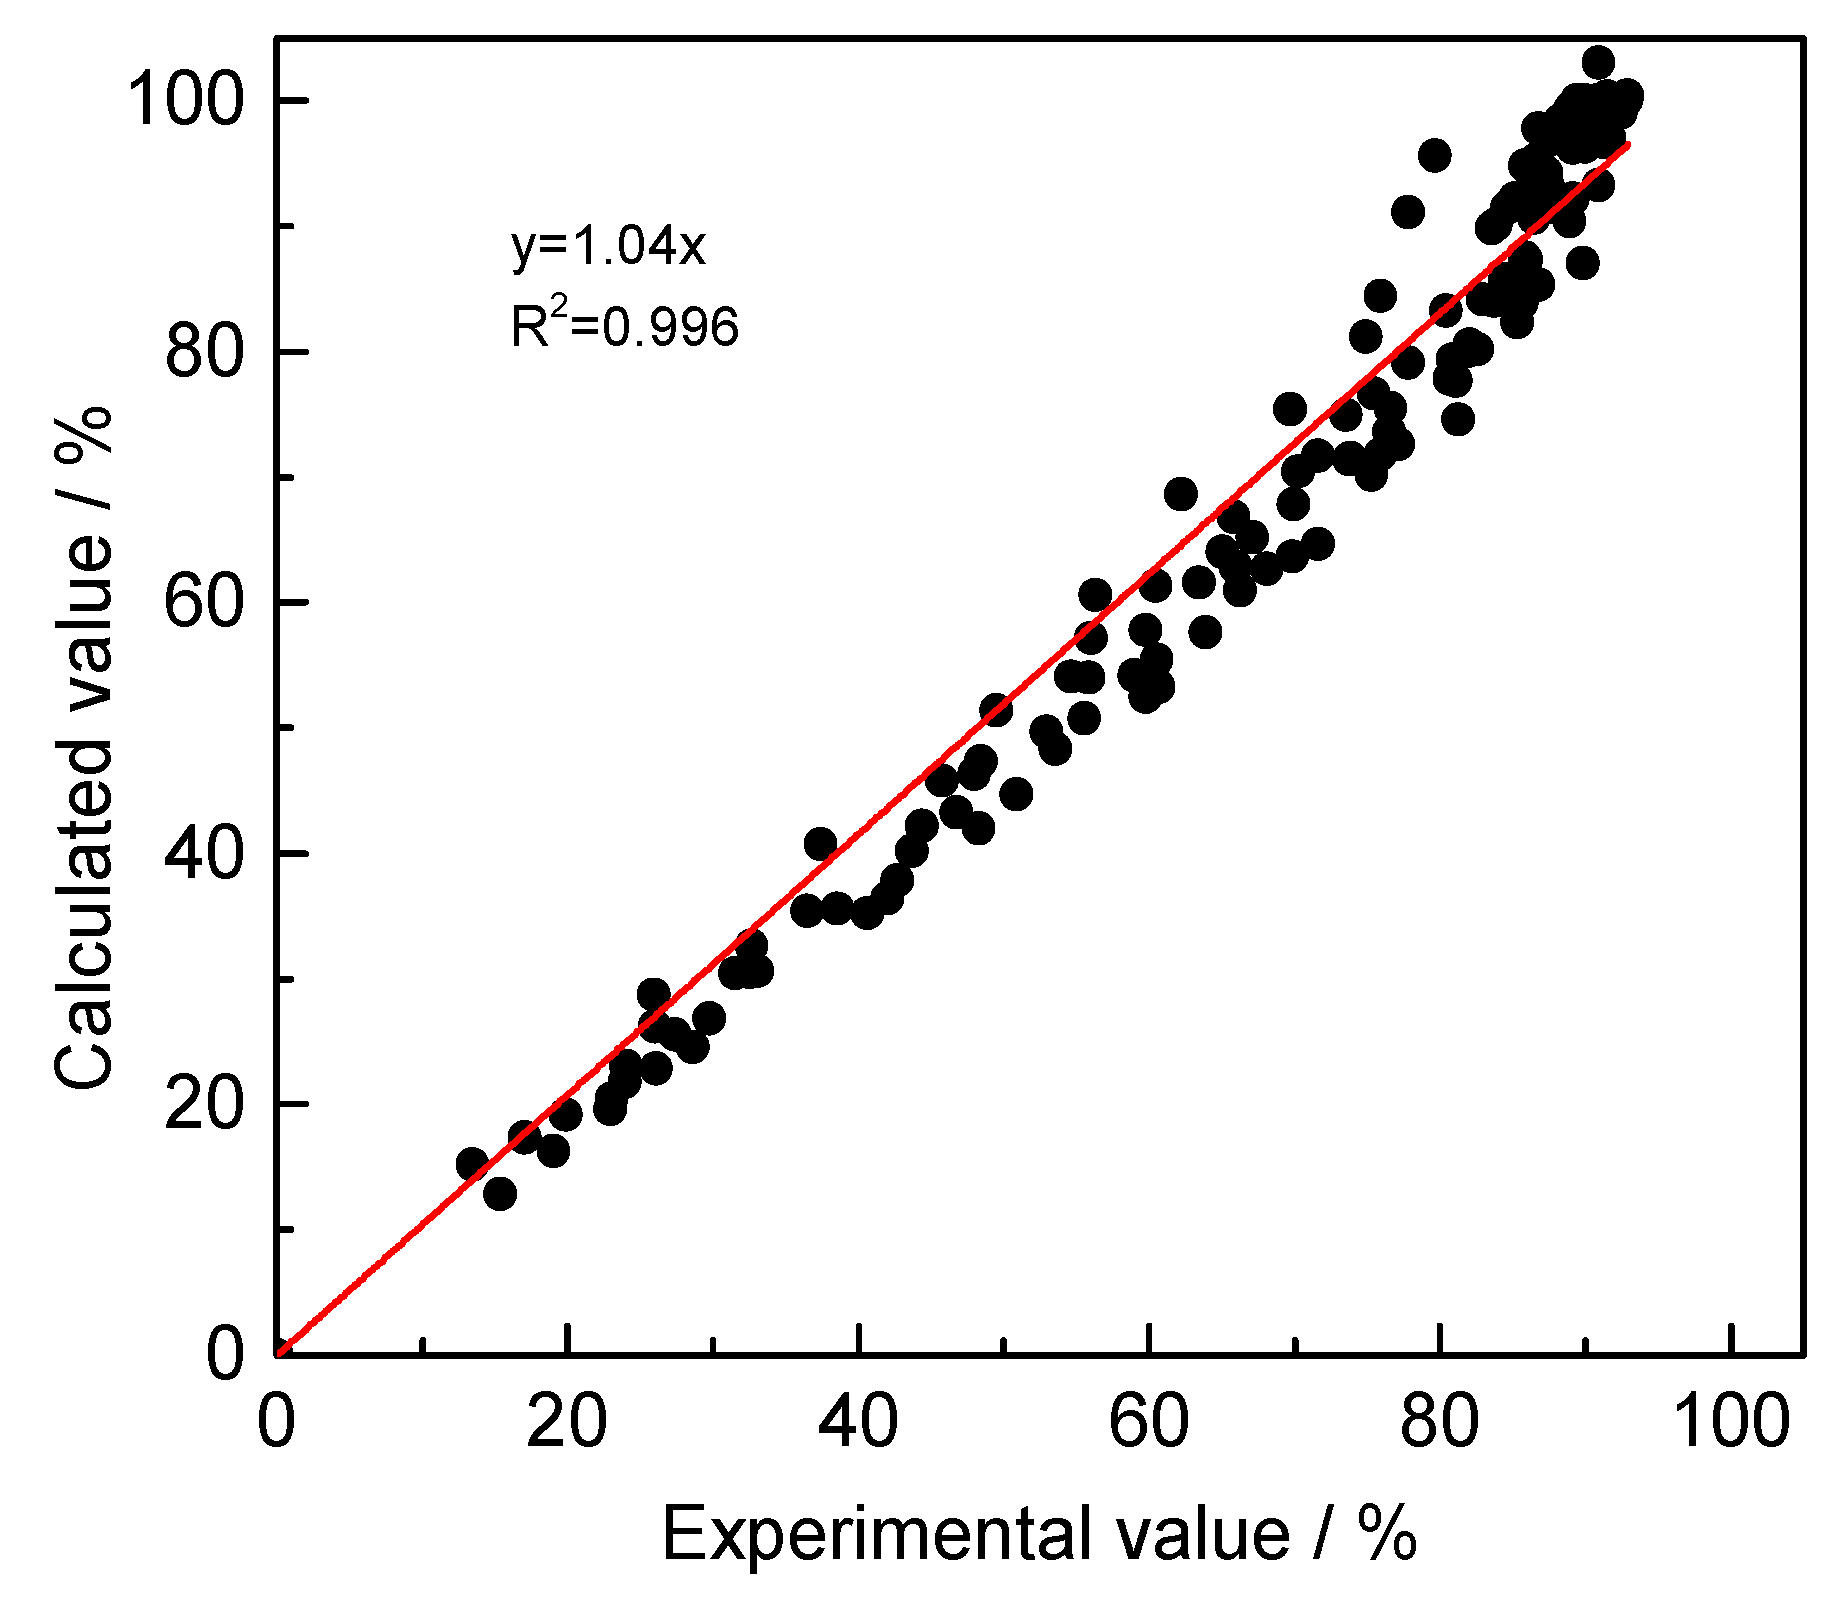
Comparison of the calculated Ti leaching rate with Equation (30) and all the experimental results in this work is shown in Figure 11. The R2 of the fitted straight line is 0.996, which indicates that the calculated results by Equation (30) agree with the experimental ones.
3.7. Leaching Solution and Leaching Residues
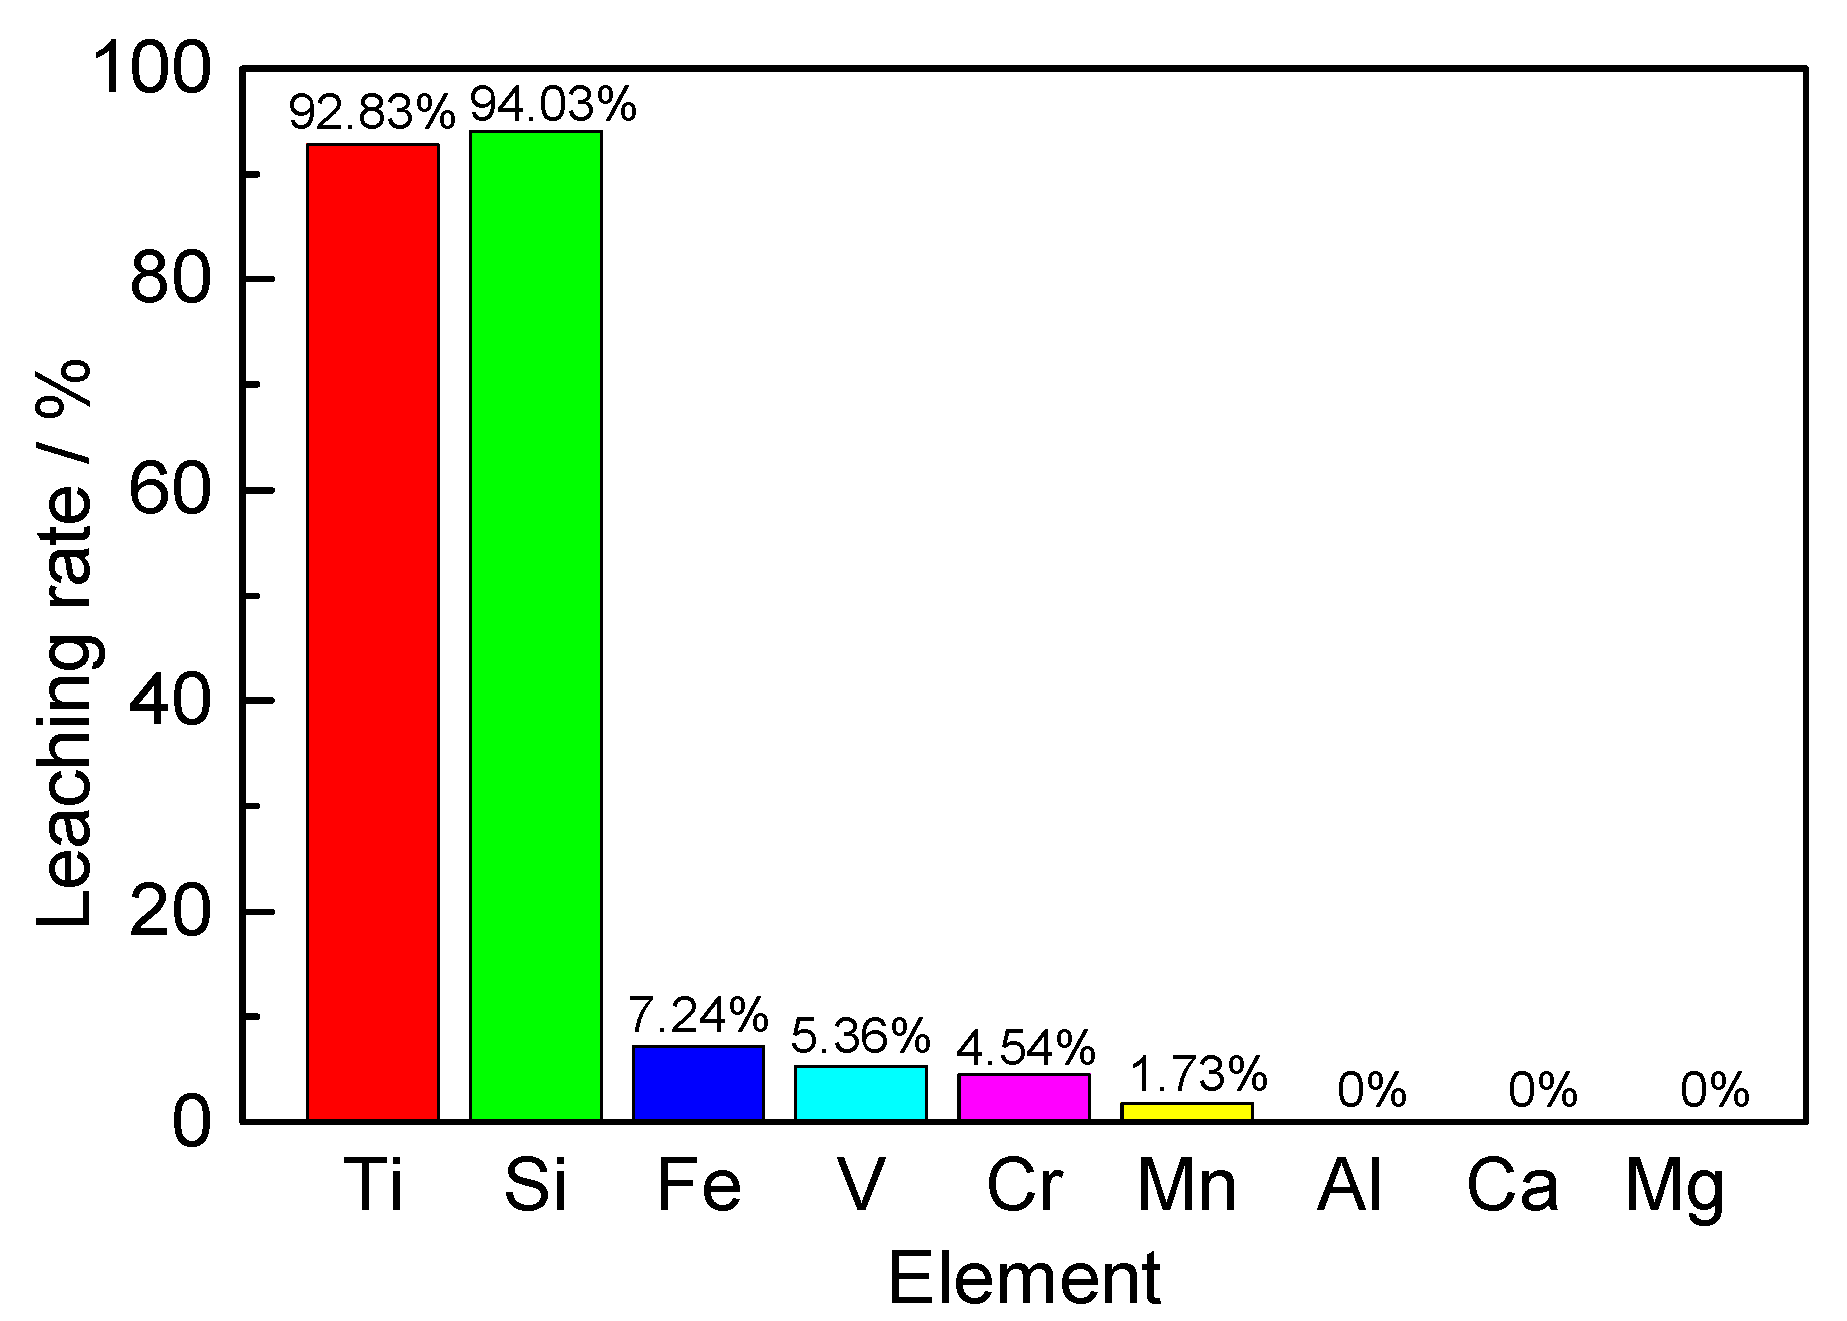
Figure 12 shows the leaching rates of elements in TEFS under the conditions of F− concentration at 14 mol/L and leaching temperature of 90 °C for 20 min. Almost of the Ti and Si elements dissolved in the leaching solution. Most of Fe, V, Cr, and Mn exist in the leaching residue. The mineral phase, containing iron, vanadium, chromium, and manganese, was not detected in the leaching residue because their contents were too low to be detected in the X-ray diffraction analysis. All the Al, Mg, and Ca elements exist in the leaching residue.
The composition of leaching solution is listed in Table 4. The Si is the main impurity in the leaching solution. Although the Fe, V, Mn, and Cr contents in the leaching solution were not high, they were all harmful elements which will seriously deteriorate the whiteness of titanium dioxide. Non-silicon impurities can be selectively precipitated and removed by adjusting the pH and NH4+ concentration of the leaching solution. Then, the recovery of titanium can be achieved by selective precipitation of fluorinated titanate. Finally, silicon can be precipitated from the solution to prepare Si-bearing product.
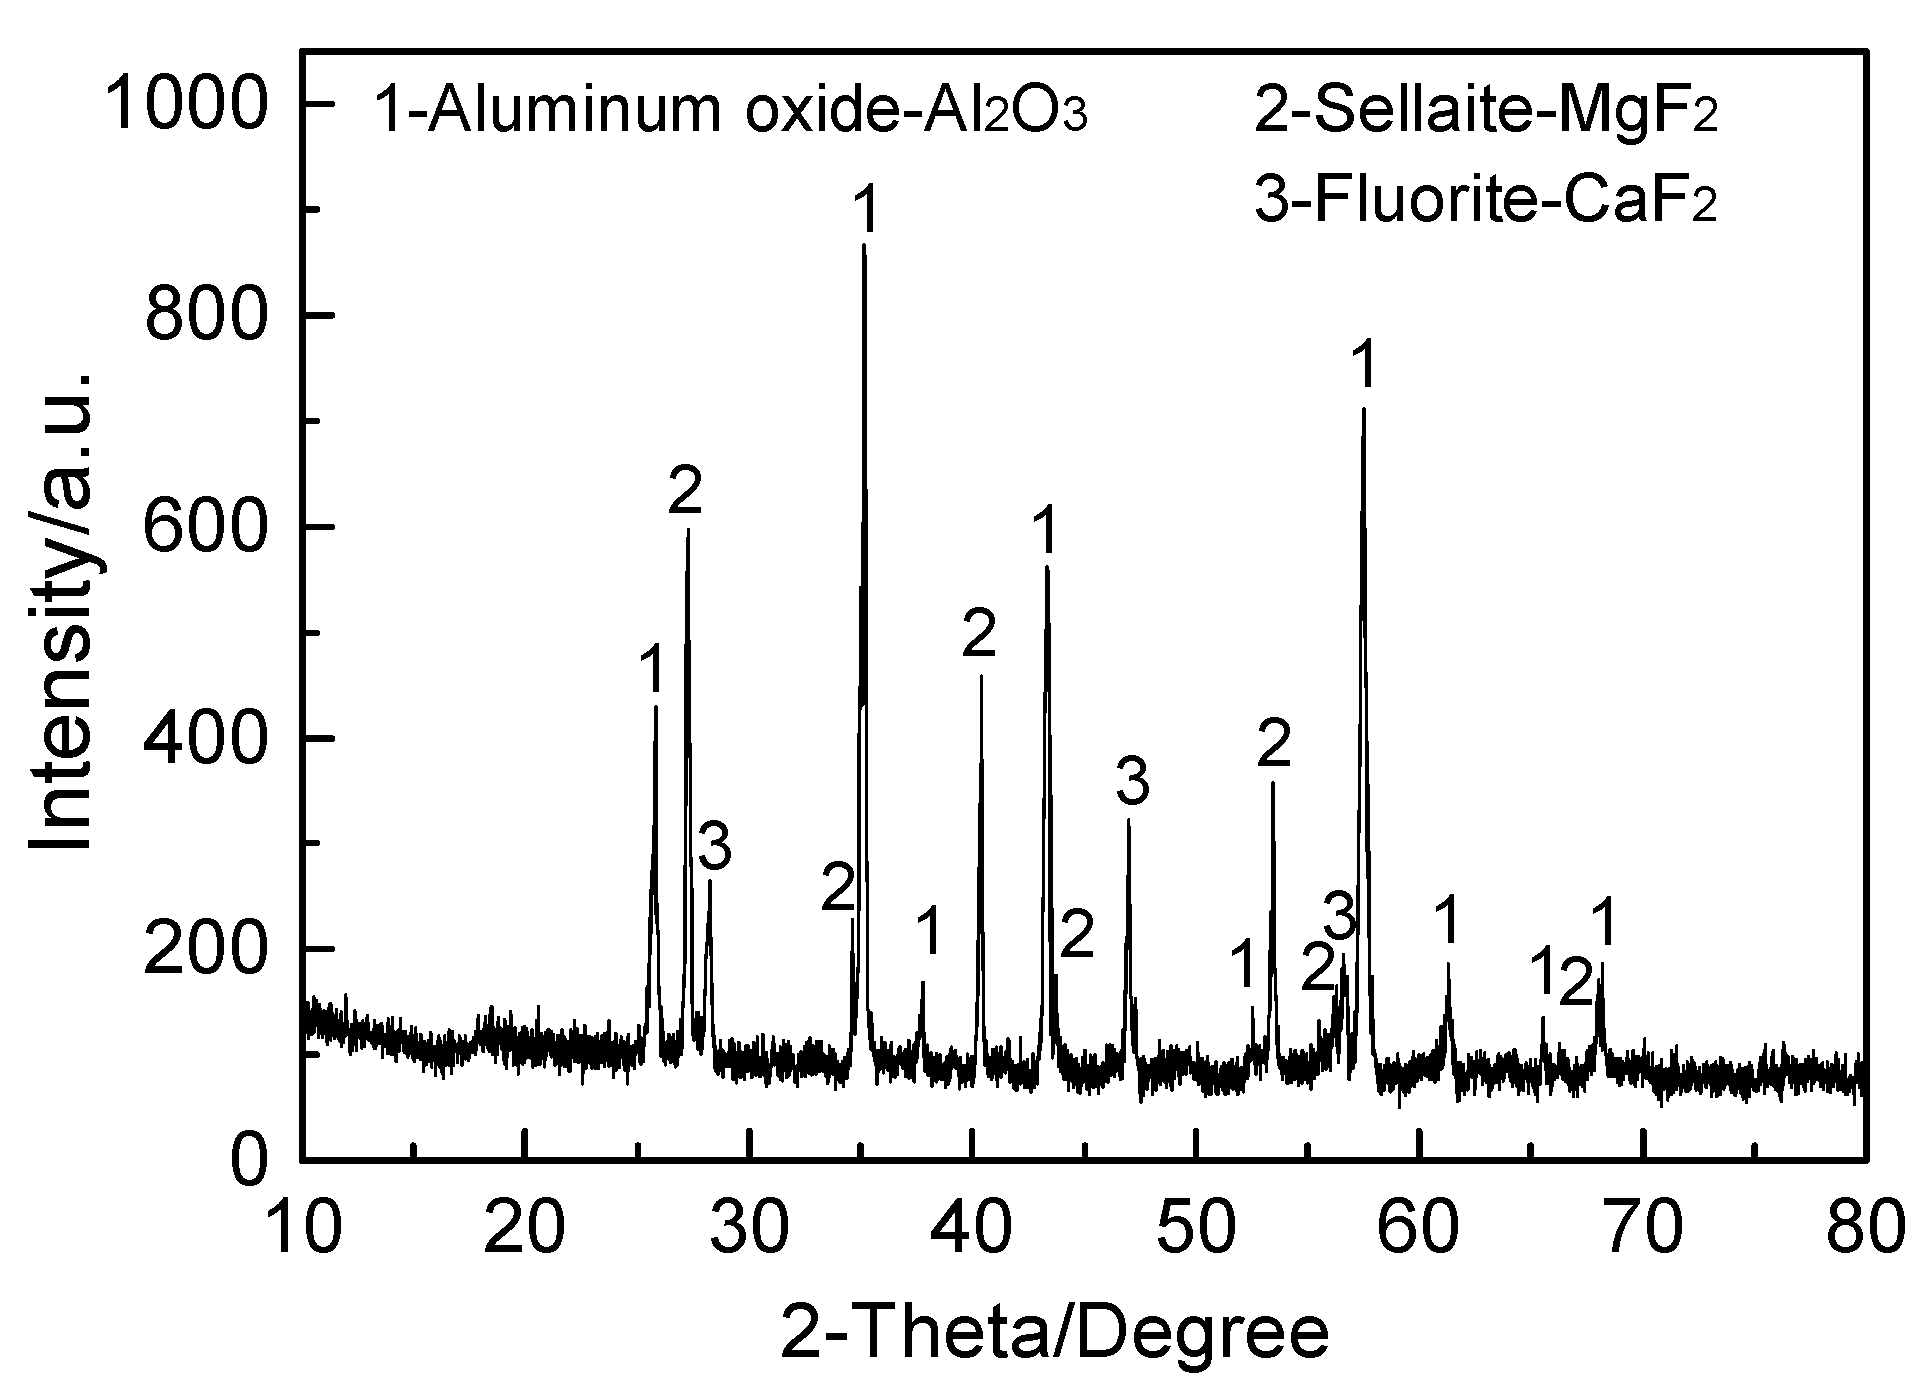
The main mineral phases in leaching residue are (NH4)3AlF6 and CaMg2Al2F12, which have poor thermal stability. The whole NH4+ and most of the F element in residue can be recycled in the form of NH4F by pyro-hydrolyzing at 250 °C for 120 min in the presence of water vapor and ammonia gas. Then, the residue is calcined at 900 °C for 60 min to become more stable. The composition and mineral phases of the calcinated residues are shown in Table 5 and Figure 13. The main mineral phases in the calcinated residue are aluminum oxide, sellaite, and fluorite. The calcinated residue has been identified for the leaching toxicity of solid waste according to HJ/T 298-2007 and GB 5085.3-2007. The inorganic fluoride content in the leaching solution was 59 mg/L, which was less than the hazard limit of 100 mg/L (GB 5085.3-2007). Therefore, the calcinated residue was not hazardous waste and can be used as fluxes of steelmaking.
4. Conclusions
The fluoride leaching mechanism and kinetics of TEFS under a normal pressure system was studied to achieve efficient leaching of titanium and provide the foundation for industrialization. The TEFS is mainly composed of MxTi3xO5 (0 < x < 2, M = Mg, Al) and augite, which can both react with [NH4+]-[F−] solution. The TiF62− and SiF62− were dissolved in the leachate, and the CaMg2Al2F12 and (NH4)3AlF6 grains were deposited on the surface of the unreacted TEFS particles. The Ti leaching rate was controlled by surface chemical reaction, with the activation energy of 52.30 kJ/mol. The semi-empirical kinetics equation can effectively predict the result of Ti leaching rate and provide a basis for the determination of actual leaching process parameters.
In the fluoride leaching process of TEFS, the Ti leaching rate can be increased by increasing the temperature and F− concentration. Within the condition scope of this study, increasing the leaching temperature had a more significant increase in the leaching rate. In addition, the Ti leaching rate was also improved by reducing the TEFS particle size. Higher specific surface area of TEFS particles can increase the reaction interface and thus achieve an increase in the Ti leaching rate.
Author Contributions
Conceptualization, F.Z., Y.G. and G.Q.; methodology, F.Z., Y.G. and F.C.; investigation, S.W., J.Z. and L.Y.; resources, F.Z., S.W. and L.Y.; data curation, S.W., J.Z. and L.Y.; writing—original draft preparation, F.Z.; writing—review and editing, Y.G. and S.W.; supervision, G.Q.; project administration, F.Z.; funding acquisition, F.Z. and F.C. All authors have read and agreed to the published version of the manuscript.
Funding
This research was funded by the Natural Science Foundation of Hunan Province, China (Grant No.2019JJ50816), the National Natural Science Foundation of China (Grant No. 51904348) and the State Key Laboratory of Vanadium and Titanium Resources Comprehensive Utilization.
Data Availability Statement
The data presented in this study are available in this article.
Conflicts of Interest
The authors declare no conflict of interest.
References
- Noormohammed, S.; Sarkar, D.K. Rf-sputtered teflon-modified superhydrophobic nanostructured titanium dioxide coating on aluminum alloy for lcephobic applications. Coatings 2021, 11, 432. [Google Scholar] [CrossRef]
- Kumar, V.; Kumar, A.; Song, M.; Lee, D.J.; Park, S.S. Properties of silicone rubber-based composites reinforced with few-layer graphene and iron oxide or titanium dioxide. Polymers 2021, 13, 1550. [Google Scholar] [CrossRef]
- Zhang, D.; Pan, L.; Li, C.; Xia, L.; Gao, W. Fabrication of flower-like TiO2 on Bucky paper with enhanced photocatalytic activity. Int. J. Mod. Phys. B 2019, 33, 195–207. [Google Scholar] [CrossRef]
- Turner, J.; Aspinall, H.C.; Rushworth, S.; Black, K. A hybrid nanoparticle/alkoxide ink for inkjet printing of TiO2: A templating effect to form anatase at 200 °C. RSC Adv. 2019, 9, 39143–39146. [Google Scholar] [CrossRef] [Green Version]
- Mahdi, B.S.; Hasson, S.A. Linear optical characterization of novel dye doped poly methyl methacrylate with titanium dioxide nanoparticale. NeuroQuantology 2021, 19, 16–21. [Google Scholar] [CrossRef]
- Wan, L.; Deng, C.; Zhao, Z.Y.; Zhao, H.B.; Wang, Y.Z. A titanium dioxide–carbon nanotube hybrid to simultaneously achieve the mechanical enhancement of natural rubber and its stability under extreme frictional conditions. Mater. Adv. 2021, 2, 2408–2418. [Google Scholar] [CrossRef]
- Zhang, M.M.; Chen, J.Y.; Li, H.; Wang, C.R. Recent progress in Li-ion batteries with TiO2 nanotube anodes grown by electrochemical anodization. Rare Met. 2020, 40, 249–271. [Google Scholar] [CrossRef]
- Li, F.; Wang, C.L.; Ding, S.; Yang, K.; Tian, F. Photoelectrochemical performance of TiO2 nanotube arrays by in situ decoration with different initial states. Rare Met. 2021, 40, 720–727. [Google Scholar] [CrossRef]
- Liu, H.; Zhang, R.; Yan, S.; Li, J.; Yang, S. Effect of La2O3 on the microstructure and grain refining effect of novel Al-TiO2-C-XLa2O3 refiners. Metals 2020, 10, 182. [Google Scholar] [CrossRef] [Green Version]
- Rahmani, R.; Rosenberg, M.; Ivask, A.; Kollo, L. Comparison of mechanical and antibacterial properties of TiO2/Ag ceramics and Ti6Al4V-TiO2/Ag composite materials using combined SLM-SPS techniques. Metals 2019, 9, 874. [Google Scholar] [CrossRef] [Green Version]
- Bordbar, H.; Yousef, A.A.; Abedini, H. Production of titanium tetrachloride (TiCl4) from titanium ores: A review. Polyolefns J. 2017, 4, 150–169. [Google Scholar] [CrossRef]
- Zheng, F.; Chen, F.; Guo, Y.; Jiang, T.; Travyanov, A.Y.; Qiu, G. Kinetics of hydrochloric acid leaching of titanium from titanium-bearing electric furnace slag. JOM 2016, 68, 1476–1484. [Google Scholar] [CrossRef]
- Yang, J.; Tang, Y.; Yang, K.; Rouff, A.A.; Elzinga, E.J.; Huang, J.H. Leaching characteristics of vanadium in mine tailings and soils near a vanadium titanomagnetite mining site. J. Hazard. Mater. 2014, 264, 498–504. [Google Scholar] [CrossRef] [PubMed]
- Fan, S.G.; Dou, Z.H.; Zhang, T.A.; Yan, J.S. Self-propagating reaction mechanism of Mg–TiO2 system in preparation process of titanium powder by multi-stage reduction. Rare Metals 2021, 40, 2645–2656. [Google Scholar] [CrossRef]
- Wang, X.; Liu, W.; Liang, B.; Lv, L.; Li, C. Combined oxidation and 2-octanol extraction of iron from a synthetic ilmenite hydrochloric acid leachate. Sep. Purif. Technol. 2016, 158, 96–102. [Google Scholar] [CrossRef]
- Zhang, W.; Zhu, Z.; Cheng, C. A literature review of titanium metallurgical processes. Hydrometallurgy 2011, 108, 177–188. [Google Scholar] [CrossRef]
- El-Sadek, M.H.; Fouad, O.A.; Morsi, M.B.; El-Barawy, K. Controlling conditions of fluidized bed chlorination of upgraded titania slag. Trans. Indian Inst. Met. 2019, 72, 423–427. [Google Scholar] [CrossRef]
- Zheng, F.; Guo, Y.; Liu, S.; Qiu, G.; Chen, F.; Jiang, T.; Wang, S. Removal of magnesium and calcium from electric furnace titanium slag by H3PO4 oxidation roasting–leaching process. Trans. Nonferr. Metal. Soc. 2018, 28, 356–366. [Google Scholar] [CrossRef]
- Middlemas, S.; Fang, Z.Z.; Peng, F. Life cycle assessment comparison of emerging and traditional titanium dioxide manufacturing processes. J. Clean. Prod. 2015, 89, 137–147. [Google Scholar] [CrossRef] [Green Version]
- Li, Y.; Gang, X.; Lin, T.; Zhan, L.; Yan, C.; Yan, Q. Model on titanium tetrachloride gas phase oxidation process. Mater. Sci. Forum 2015, 833, 56–60. [Google Scholar] [CrossRef]
- Zhou, Q.; Liu, Q.; Yao, L.; Ren, S.; Zhu, B.; Meng, F.; Lu, R. Influence of different conditions on the precipitation of metatitanic acid to synthesis rutile TiO2 via sulfuric acid process. Mater. Sci. Forum 2016, 850, 851–856. [Google Scholar] [CrossRef]
- Mehta, S.M.; Patel, S.R. The behavior of solutions of titanium dioxide in sulfuric acid in the presence of metallic sulfates. JACS 1951, 73, 224–226. [Google Scholar] [CrossRef]
- Sasikumar, C.; Rao, D.S.; Srikanth, S.; Mukhopadhyay, N.K.; Mehrotra, S.P. Dissolution studies of mechanically activated Manavalakurichi ilmenite with HCl and H2SO4. Hydrometallurgy 2007, 88, 154–169. [Google Scholar] [CrossRef]
- Anderrv, A.A.; Diachenko, A.N. Conditions for the production of pigmentary titanium dioxide of rutile and anatase modifications by ilmenite processing with ammonium fluoride. Theor. Found. Chem. Eng. 2009, 43, 707–712. [Google Scholar] [CrossRef]
- Krysenko, G.F.; Epov, D.G.; Medkov, M.A.; Sitnik, P.V.; Nikolaev, A.I. Processing of perovskite concentrate by ammonium hydrodifluoride. Theor. Found. Chem. Eng. 2016, 50, 588–592. [Google Scholar] [CrossRef]
- Bakeeva, N.G.; Gordienko, P.S.; Pashnina, E.V. Preparation of high-purity titanium salts from the system (NH4)2TiF6-(NH4)3FeF6-NH4F-H2O. Russ. J. Gen. Chem. 2009, 79, 1–6. [Google Scholar] [CrossRef]
- Zhao, Y.; Sun, T.; Zhao, H.; Chen, C.; Wang, X. Effect of reductant type on the embedding direct reduction of beach titanomagnetite concentrate. Int. J. Miner. Metall. Mater. 2019, 26, 152–159. [Google Scholar] [CrossRef]
- Li, T.; Sun, C.; Song, S.; Wang, Q. Roles of MgO and Al2O3 on the viscous and structural behavior of blast furnace primary slag, part 1: C/S = 1.3 containing TiO2. Metals 2019, 9, 866. [Google Scholar] [CrossRef] [Green Version]
- Steinberg, W.S.; Geyser, W.; Nell, J. The history and development of the pyrometallurgical processes at Evraz Highveld steel & vanadium. J. S. Afr. Inst. Min. Metall. 2011, 111, 705–710. [Google Scholar]
- Zheng, F.; Guo, Y.; Qiu, G.; Chen, F.; Wang, S.; Sui, Y.; Jiang, T.; Yang, L. A novel process for preparation of titanium dioxide from Ti-bearing electric furnace slag: NH4HF2-HF leaching and hydrolyzing process. J. Hazard. Mater. 2018, 344C, 490–498. [Google Scholar] [CrossRef]
- Sohn, H.Y.; Wadsworth, M.E. Rate Processes of Extractive Metallurgy, 1st ed.; Plenum Press: New York, NY, USA, 1979; pp. 135–143. [Google Scholar]
- Levenspiel, O. Chemical Reaction Engineering, 3rd ed.; John Wiley and Sons Inc.: New York, NY, USA, 1999; pp. 566–570. [Google Scholar]
- Habashi, F. Principles of Extractive Metallurgy, General Principles, 2nd ed.; Gordon and Breach Science Publishers, Inc.: New York, NY, USA, 1969; Volume 1, pp. 111–169. [Google Scholar]
Figure 1.
XRD pattern of Ti-bearing electric furnace slag.

Figure 2.
SEM microstructure and EDS analysis of Ti-bearing electric furnace slag (wt%).

Figure 3.
∆Gθ–T relationship lines of the possible reactions during fluoride leaching.

Figure 4.
Effects of temperature on the Ti leaching rate with L/S ratio of 20:1 and rotating speed of 200 r/min. (a) CF- = 8 mol/L; (b) CF- = 10 mol/L; (c) CF- = 12 mol/L; (d) CF- = 14 mol/L.
Figure 4.
Effects of temperature on the Ti leaching rate with L/S ratio of 20:1 and rotating speed of 200 r/min. (a) CF- = 8 mol/L; (b) CF- = 10 mol/L; (c) CF- = 12 mol/L; (d) CF- = 14 mol/L.

Figure 5.
XRD patterns of the leaching residue at different leaching temperatures with F− concentration of 10 mol/L, leaching time of 30 min, L/S ratio of 20:1, and rotating speed of 200 r/min. (a) Ti-bearing electric furnace slag; (b) Leaching temperature: 60 °C; (c) Leaching temperature: 90 °C.
Figure 5.
XRD patterns of the leaching residue at different leaching temperatures with F− concentration of 10 mol/L, leaching time of 30 min, L/S ratio of 20:1, and rotating speed of 200 r/min. (a) Ti-bearing electric furnace slag; (b) Leaching temperature: 60 °C; (c) Leaching temperature: 90 °C.

Figure 6.
SEM images and EDS analysis of TEFS and fluoride leaching residue (wt%). (a) TEFS; (b) fluoride leaching residue at 60 °C with F− concentration of 10 mol/L, leaching time of 30 min, L/S ratio of 20:1, and rotating speed of 200 r/min.
Figure 6.
SEM images and EDS analysis of TEFS and fluoride leaching residue (wt%). (a) TEFS; (b) fluoride leaching residue at 60 °C with F− concentration of 10 mol/L, leaching time of 30 min, L/S ratio of 20:1, and rotating speed of 200 r/min.

Figure 7.
Plots of 1 − (1 − X)1/3 versus time for different leaching temperatures with L/S ratio of 20:1 and rotating speed of 200 r/min. (a) CF- = 8 mol/L; (b) CF- = 10 mol/L; (c) CF- = 12 mol/L; (d) CF- = 14 mol/L.
Figure 7.
Plots of 1 − (1 − X)1/3 versus time for different leaching temperatures with L/S ratio of 20:1 and rotating speed of 200 r/min. (a) CF- = 8 mol/L; (b) CF- = 10 mol/L; (c) CF- = 12 mol/L; (d) CF- = 14 mol/L.

Figure 8.
Plots of 1 − (2/3)X − (1 − X)1/3 versus time for different leaching temperature with L/S ratio of 20:1 and rotating speed of 200 r/min. (a) CF- = 8 mol/L; (b) CF- = 10 mol/L; (c) CF- = 12 mol/L; (d) CF- = 14 mol/L.
Figure 8.
Plots of 1 − (2/3)X − (1 − X)1/3 versus time for different leaching temperature with L/S ratio of 20:1 and rotating speed of 200 r/min. (a) CF- = 8 mol/L; (b) CF- = 10 mol/L; (c) CF- = 12 mol/L; (d) CF- = 14 mol/L.

Figure 9.
Plot of ln[[1 − (1 − X)1/3]/t] vs. lnC with L/S ratio of 20:1 and rotating speed of 200 r/min. (a) 60 °C, (b) 70 °C, (c) 80 °C, (d) 90 °C.
Figure 9.
Plot of ln[[1 − (1 − X)1/3]/t] vs. lnC with L/S ratio of 20:1 and rotating speed of 200 r/min. (a) 60 °C, (b) 70 °C, (c) 80 °C, (d) 90 °C.

Figure 10.
Plot of ln{[1 − (1 − X)1/3]/∙t} versus 1/T × 1000 with L/S ratio of 20:1 and rotating speed of 200 r/min.
Figure 10.
Plot of ln{[1 − (1 − X)1/3]/∙t} versus 1/T × 1000 with L/S ratio of 20:1 and rotating speed of 200 r/min.

Figure 11.
Comparison between the calculated Ti leaching rate using Equation (30) and all the experimental results in this work.
Figure 11.
Comparison between the calculated Ti leaching rate using Equation (30) and all the experimental results in this work.

Figure 12.
Leaching rates of elements in TEFS under the conditions of F− concentration at 14 mol/L, leaching temperature of 90 °C for 20 min with L/S ratio of 20:1, and rotating speed of 200 r/min.
Figure 12.
Leaching rates of elements in TEFS under the conditions of F− concentration at 14 mol/L, leaching temperature of 90 °C for 20 min with L/S ratio of 20:1, and rotating speed of 200 r/min.

Figure 13.
XRD patterns of the calcinated residue under the conditions of F− concentration at 14 mol/L, leaching temperature of 90 °C for 20 min with L/S ratio of 20:1, and rotating speed of 200 r/min.
Figure 13.
XRD patterns of the calcinated residue under the conditions of F− concentration at 14 mol/L, leaching temperature of 90 °C for 20 min with L/S ratio of 20:1, and rotating speed of 200 r/min.


Table 1.
The chemical composition of Ti-bearing electric furnace slag (TEFS) (wt%).
| TiO2 | SiO2 | Al2O3 | MgO | CaO | Total Fe | MnO | V2O5 | Cr2O3 |
|---|---|---|---|---|---|---|---|---|
| 51.50 | 19.01 | 14.38 | 7.42 | 3.22 | 1.88 | 1.10 | 0.63 | 0.03 |
Table 2.
The rate equations for shrinking core model.
| Rate-Controlling Step | Rate Equation |
|---|---|
| Surface chemical reaction | |
| Diffusion control through the ash or production layer |
X: Ti leaching rate (%); t: time (min); k: apparent rate constant (min−1); k’: apparent rate constant (min−1).
Table 3.
Comparison of R2 between plots of 1 − (1 − X)1/3 and 1 − (2/3)X − (1 − X)2/3 versus time for different F− concentrations and temperatures with L/S ratio of 20:1 and rotating speed of 200 r/min.
Table 3.
Comparison of R2 between plots of 1 − (1 − X)1/3 and 1 − (2/3)X − (1 − X)2/3 versus time for different F− concentrations and temperatures with L/S ratio of 20:1 and rotating speed of 200 r/min.
| CF−(mol/L) | Temperature (°C) | Correlation Coefficient R2 | |
|---|---|---|---|
| 1 − (1 − X)1/3 | 1 − (2/3)X − (1 − X)2/3 | ||
| 8 | 60 | 0.999 | 0.924 |
| 70 | 0.995 | 0.933 | |
| 80 | 0.964 | 0.926 | |
| 90 | 0.978 | 0.958 | |
| 10 | 60 | 0.999 | 0.935 |
| 70 | 0.994 | 0.945 | |
| 80 | 0.980 | 0.959 | |
| 90 | 0.964 | 0.955 | |
| 12 | 60 | 0.999 | 0.962 |
| 70 | 0.987 | 0.985 | |
| 80 | 0.963 | 0.980 | |
| 90 | 0.988 | 0.985 | |
| 14 | 60 | 0.999 | 0.958 |
| 70 | 0.994 | 0.978 | |
| 80 | 0.975 | 0.986 | |
| 90 | 0.992 | 0.982 | |
Table 4.
Composition of leaching solution under the conditions of F− concentration at 14 mol/L, leaching temperature of 90 °C for 20 min with L/S ratio of 20:1, rotating speed of 200 r/min (g/L).
Table 4.
Composition of leaching solution under the conditions of F− concentration at 14 mol/L, leaching temperature of 90 °C for 20 min with L/S ratio of 20:1, rotating speed of 200 r/min (g/L).
| Ti | Si | Fe | V | Mn | Cr | Ca | Mg | Al |
|---|---|---|---|---|---|---|---|---|
| 26.64 | 7.81 | 0.13 | 0.02 | 0.016 | 0.001 | 0 | 0 | 0 |
Table 5.
Composition of calcinated residue under the conditions of F− concentration at 14 mol/L, leaching temperature of 90 °C for 20 min with L/S ratio of 20:1, and rotating speed of 200 r/min (wt%).
Table 5.
Composition of calcinated residue under the conditions of F− concentration at 14 mol/L, leaching temperature of 90 °C for 20 min with L/S ratio of 20:1, and rotating speed of 200 r/min (wt%).
| Ti | Al | Mg | Ca | Fe | Mn | Si | V | Cr | F |
|---|---|---|---|---|---|---|---|---|---|
| 1.81 | 6.22 | 3.64 | 1.88 | 1.42 | 0.68 | 0.43 | 0.27 | 0.02 | 44.54 |
Publisher’s Note: MDPI stays neutral with regard to jurisdictional claims in published maps and institutional affiliations. |
© 2021 by the authors. Licensee MDPI, Basel, Switzerland. This article is an open access article distributed under the terms and conditions of the Creative Commons Attribution (CC BY) license (https://creativecommons.org/licenses/by/4.0/).
Share and Cite
MDPI and ACS Style
Zheng, F.; Guo, Y.; Chen, F.; Wang, S.; Zhang, J.; Yang, L.; Qiu, G. Fluoride Leaching of Titanium from Ti-Bearing Electric Furnace Slag in [NH4+]-[F−] Solution. Metals 2021, 11, 1176. https://0-doi-org.brum.beds.ac.uk/10.3390/met11081176
AMA Style
Zheng F, Guo Y, Chen F, Wang S, Zhang J, Yang L, Qiu G. Fluoride Leaching of Titanium from Ti-Bearing Electric Furnace Slag in [NH4+]-[F−] Solution. Metals. 2021; 11(8):1176. https://0-doi-org.brum.beds.ac.uk/10.3390/met11081176
Chicago/Turabian StyleZheng, Fuqiang, Yufeng Guo, Feng Chen, Shuai Wang, Jinlai Zhang, Lingzhi Yang, and Guanzhou Qiu. 2021. "Fluoride Leaching of Titanium from Ti-Bearing Electric Furnace Slag in [NH4+]-[F−] Solution" Metals 11, no. 8: 1176. https://0-doi-org.brum.beds.ac.uk/10.3390/met11081176
Note that from the first issue of 2016, this journal uses article numbers instead of page numbers. See further details here.