Article

Microstructure Evolution and Recrystallization Temperature Change of Cold-Rolled Fe–19Mn–0.6C Twinning-Induced Plasticity Steel during Annealing

1
Key Laboratory of Metastable Materials Science & Technology, Yanshan University, Qinhuangdao 066004, China
2
State Key Laboratory for Advanced Metals and Materials, University of Science and Technology Beijing, Beijing 100083, China
3
School of Materials Science and Engineering, Henan Polytechnic University, Jiaozuo 454000, China
4
School of Materials Science and Engineering, Tiangong University, Tianjin 300387, China
*
Authors to whom correspondence should be addressed.
Submission received: 28 June 2021 / Revised: 22 July 2021 / Accepted: 22 July 2021 / Published: 25 July 2021

Abstract

:
Ultra-high twinning-induced plasticity (TWIP) steel is receiving increasing attention in the automobile industry. Self-designed Fe–19Mn–0.6C TWIP steel was subjected to reveal the relationship between microstructures, which were related to recrystallization starting/ending temperature and cold rolling. The results indicated that initial deformation twins, secondary deformation twins, and nano-twins were successively generated in rolled TWIP steel with the increase of cold rolling, deformation twins, and dislocations, as well as with the elongation of grains. The elements remained uniformly dispersed rather than agglomerated in the twin crystals and grain boundaries. The recrystallization starting temperature changes of TWIP steel were 500–525, 400–425, 400–415, and 400–410 °C at cold rolling deformations of 25%, 50%, 75%, and 88%, respectively. Furthermore, the obtained corresponding recrystallization ending temperature changes were 580–600, 530–550, 520–540, and 500–520 °C, respectively. The linear relationship between cold deformation and hardness suggests that cold rolling can increase dislocation density and thus facilitate improving the hardness of TWIP steel.

1. Introduction

The development of lightweight body materials is geared toward saving energy, reducing emissions, and improving the safety of the modern automobile [1,2,3]. Twinning-induced plasticity (TWIP) steel, with high strength and good plasticity, has attracted growing attention in the automotive manufacturing industry [4]. Historically, the research of TWIP steels has been focused on mechanical property characterizations [5,6,7], deformation microstructure evolution, and microstructure transformation during cold rolling and tensile testing [8,9,10,11].
For instance, Dai et al. [12] proved the microstructure characteristics of Fe–Mn–C TWIP steel at various deformations. The deformed microstructure exhibits a typical plane slip, dislocations accumulation, and mechanical twins. The microstructure evolution and strengthening mechanism of Fe–23Mn–0.3C–1.5Al steel during cold rolling were studied by Kusakin et al. [13]. The results showed that as the cold rolling increased, the mechanical twins were gradually divided into nano-twin chips. Moreover, the strain-hardening and twin formation of Fe–22Mn–0.6C and Fe–22Mn–0.6C–1.5Al TWIP steels during tensile were compared by Zhang et al. [14]. Deformation twins, especially secondary deformation twins, play a key role in preventing the dislocation slip in Fe–22Mn–0.6C steel rather than that in Fe–22Mn–0.6C–1.5Al steel.
However, to gather deep insight into TWIP steels, research about the deformation mechanism [15,16,17,18] and recrystallization behavior [19,20] of different kinds of TWIP steels has emerged in response. For example, the study of Hamada et al. [21] showed that the optimal microstructure of hot working and ductility was obtained at a heating temperature of 1150–1200 °C and a rolling temperature of 1100–1150 °C for TWIP steel. Their results were later used as the research basis of cold rolling. Thus, it can be reasonably concluded that combining cold rolling with annealing is a potential strategy to optimize TWIP steels and other automotive steels. Mi et al. [22] reported that TWIP steel exhibits good comprehensive mechanical properties at a reduction of 65% and a subsequent annealing temperature of 1000 °C.
To date, numerous investigations of TWIP steels have been centered on structure evolution, mechanical properties, and annealing temperature [23,24,25,26,27,28,29,30,31,32,33]. However, research on TWIP steels regarding the determination of recrystallization temperature at different cold rolling levels is still scarce. Hence, this article took Fe–19Mn–0.6C TWIP steel as an example to reveal the relationship between cold rolling and the recrystallization starting/ending temperature. The results indicated that as the cold rolling increased, deformation twins occurred transformation, dislocations were generated, and grains were elongated. The recrystallization starting/ending temperature (RST/RET) gradually declined as the cold rolling increased. This investigation could provide great fundamental significance in designing the deformation process and confirming the recrystallization temperature of deformed TWIP steels.

2. Materials and Methods

2.1. Materials

The Fe–19Mn–0.6C TWIP steel, with its chemical composition listed in Table 1, was melted in a 50 kg vacuum induction furnace and refined via electromagnetic stirring. First, a rod shape with a weight of 20 kg and a diameter of 100 mm was forged. The ingot was then annealed at 1200 °C for 1 h and hot-forged into a 20 mm thick sheet.

2.2. Mechanical Testing

The cold-rolling specimens, with a size of 120 × 30 × 20 mm3, were machined from the obtained steel sheet. Cold rolling was performed at a constant strain rate of 0.4 m s−1 at ambient temperature using a two-high mill (200-type). According to a previous report on Fe–22Mn–0.6C–(1.5Al) TWIP steel [14], the initial amount of twins can no longer increase once the cold-rolled (CR) deformation exceeds 50%, at which point the secondary twins start to form. Hence, we wondered whether the tested Fe–19Mn–0.6C TWIP steel with 25%, 50%, and 75% CR deformation would exhibit the same change trend. Moreover, a small CR deformation of 5% and a larger CR deformation of 88% were also selected to study the evolution of the microstructure and recrystallization temperature. Therefore, the reductions of the tested samples were designed to be CR deformations of 5%, 25%, 50%, 75%, and 88%, respectively. The CR samples were isothermally annealed in a vacuum tube furnace for 1 h at temperatures of 400, 425, 450, 475, 500, and 550 °C, respectively.

2.3. Characterizations

The microstructural evolution was measured from the center section in the longitudinal plane, which was parallel to the CR direction. To reveal the effect of annealing temperature on the microstructural evolution, longitudinal and cross-sections were selected to present non-recrystallized and recrystallized states, respectively. Electropolishing, which used a mixture of 90% acetic acid and 10% perchloric acid, was conducted to eliminate the remaining deformation layer before characterizations. Electropolishing was performed at room temperature and 20 V for 15 s (optical and electron microscopy) or 1 min (phase analysis and hardness).
Optical microscopy (OM; Zeiss Axiovert 200-MAT, Jena, Germany) was conducted to access microstructural evolution, and the specimens were etched with 4 vol% alcohol nitrate solution after being polished using standard metallographic procedures. Hitachi FEM–SEM (S-3400 N) equipped with an OIM EBSD system from EDAX (7.0, Hitachi, Tokyo, Japan) was used for electron backscatter diffraction (EBSD) analysis, microstructure analysis, and elemental analysis. The morphology of the tested TWIP steel at 5% and 75% CR deformation were investigated via TEM. The thin-film samples for TEM were twin-jet electropolished with a polishing solution of 10% HClO4 and 90% CH3COOH at a voltage of 17 V. XRD (D/max-2500/PC), with a Cu target Kα line at a voltage of 40 kV with a current of 200 mA, was used to qualitatively and quantitatively determine the dislocation density for the CR and annealed TWIP steel. XRD patterns in 20°–100° were tested at a constant step of 2° min−1 using a graphite monochromatic filter and Si powder as the internal standard. FM-ARS9000, with 0.5 kg loading and a duration of 10 s, was carried out to test the hardness of the CR and annealed specimens. To acquire a relatively accurate value, 16 points (4 × 4) on the sample’s surface were monitored to calculate the average hardness. The average grain size of at least 300 grains was measured via Image-Pro Plus software 6.0.

3. Results

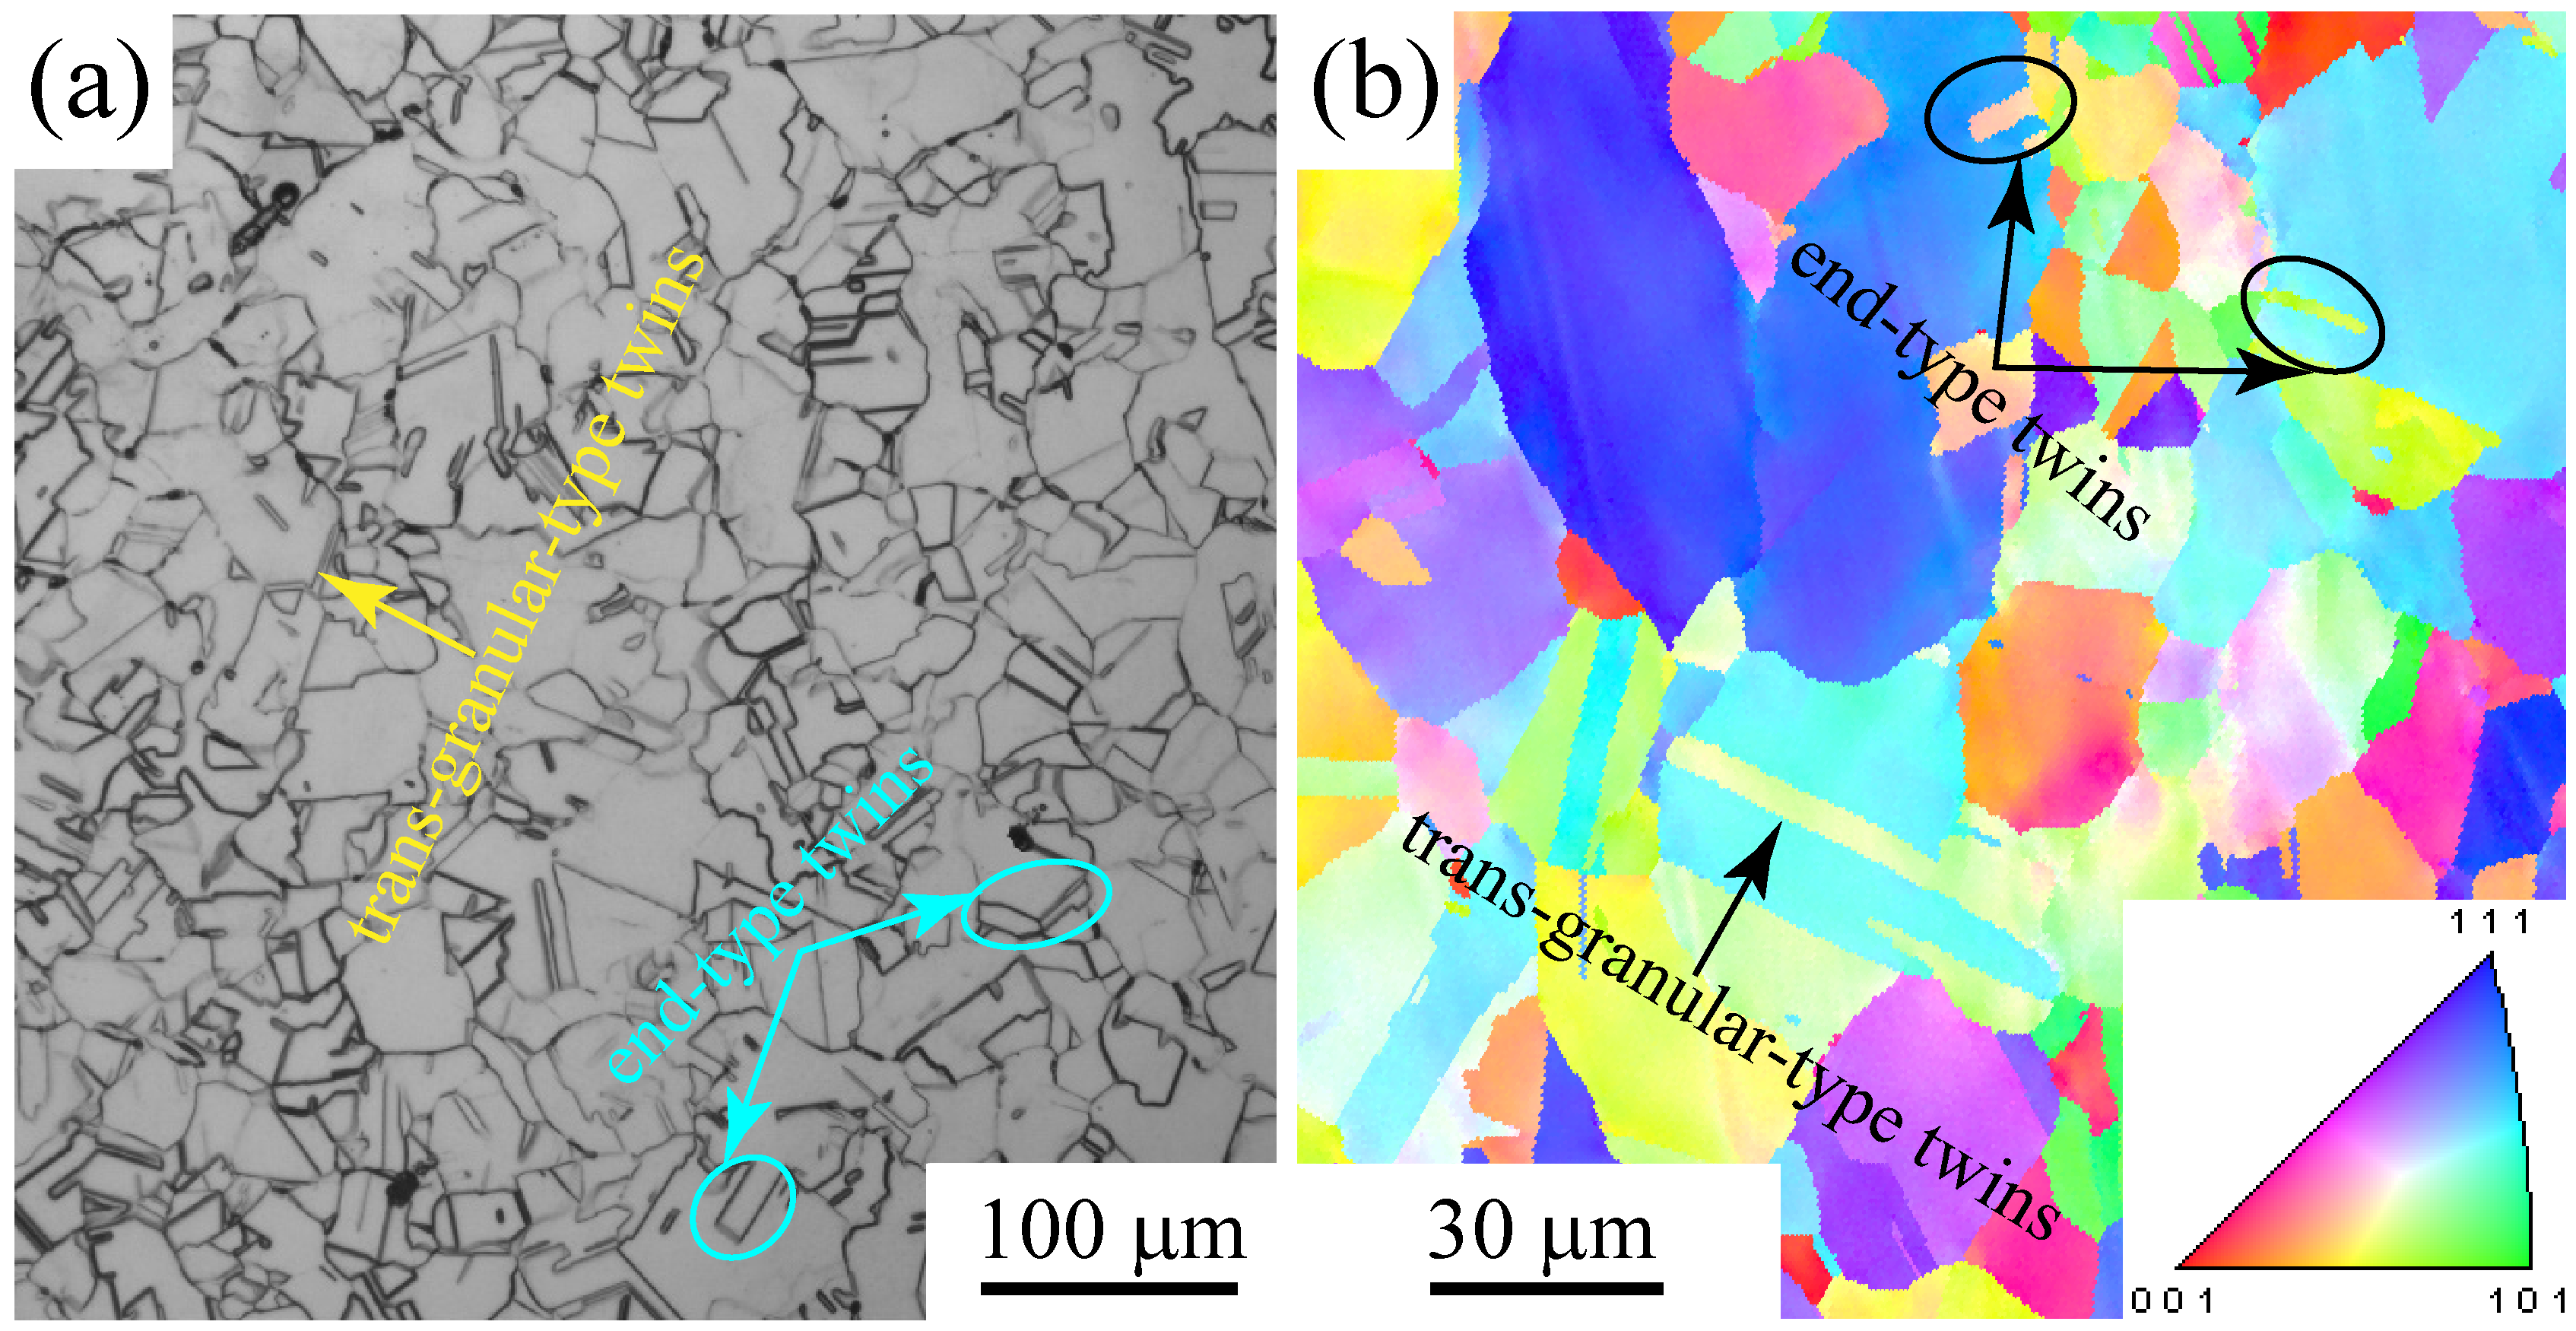
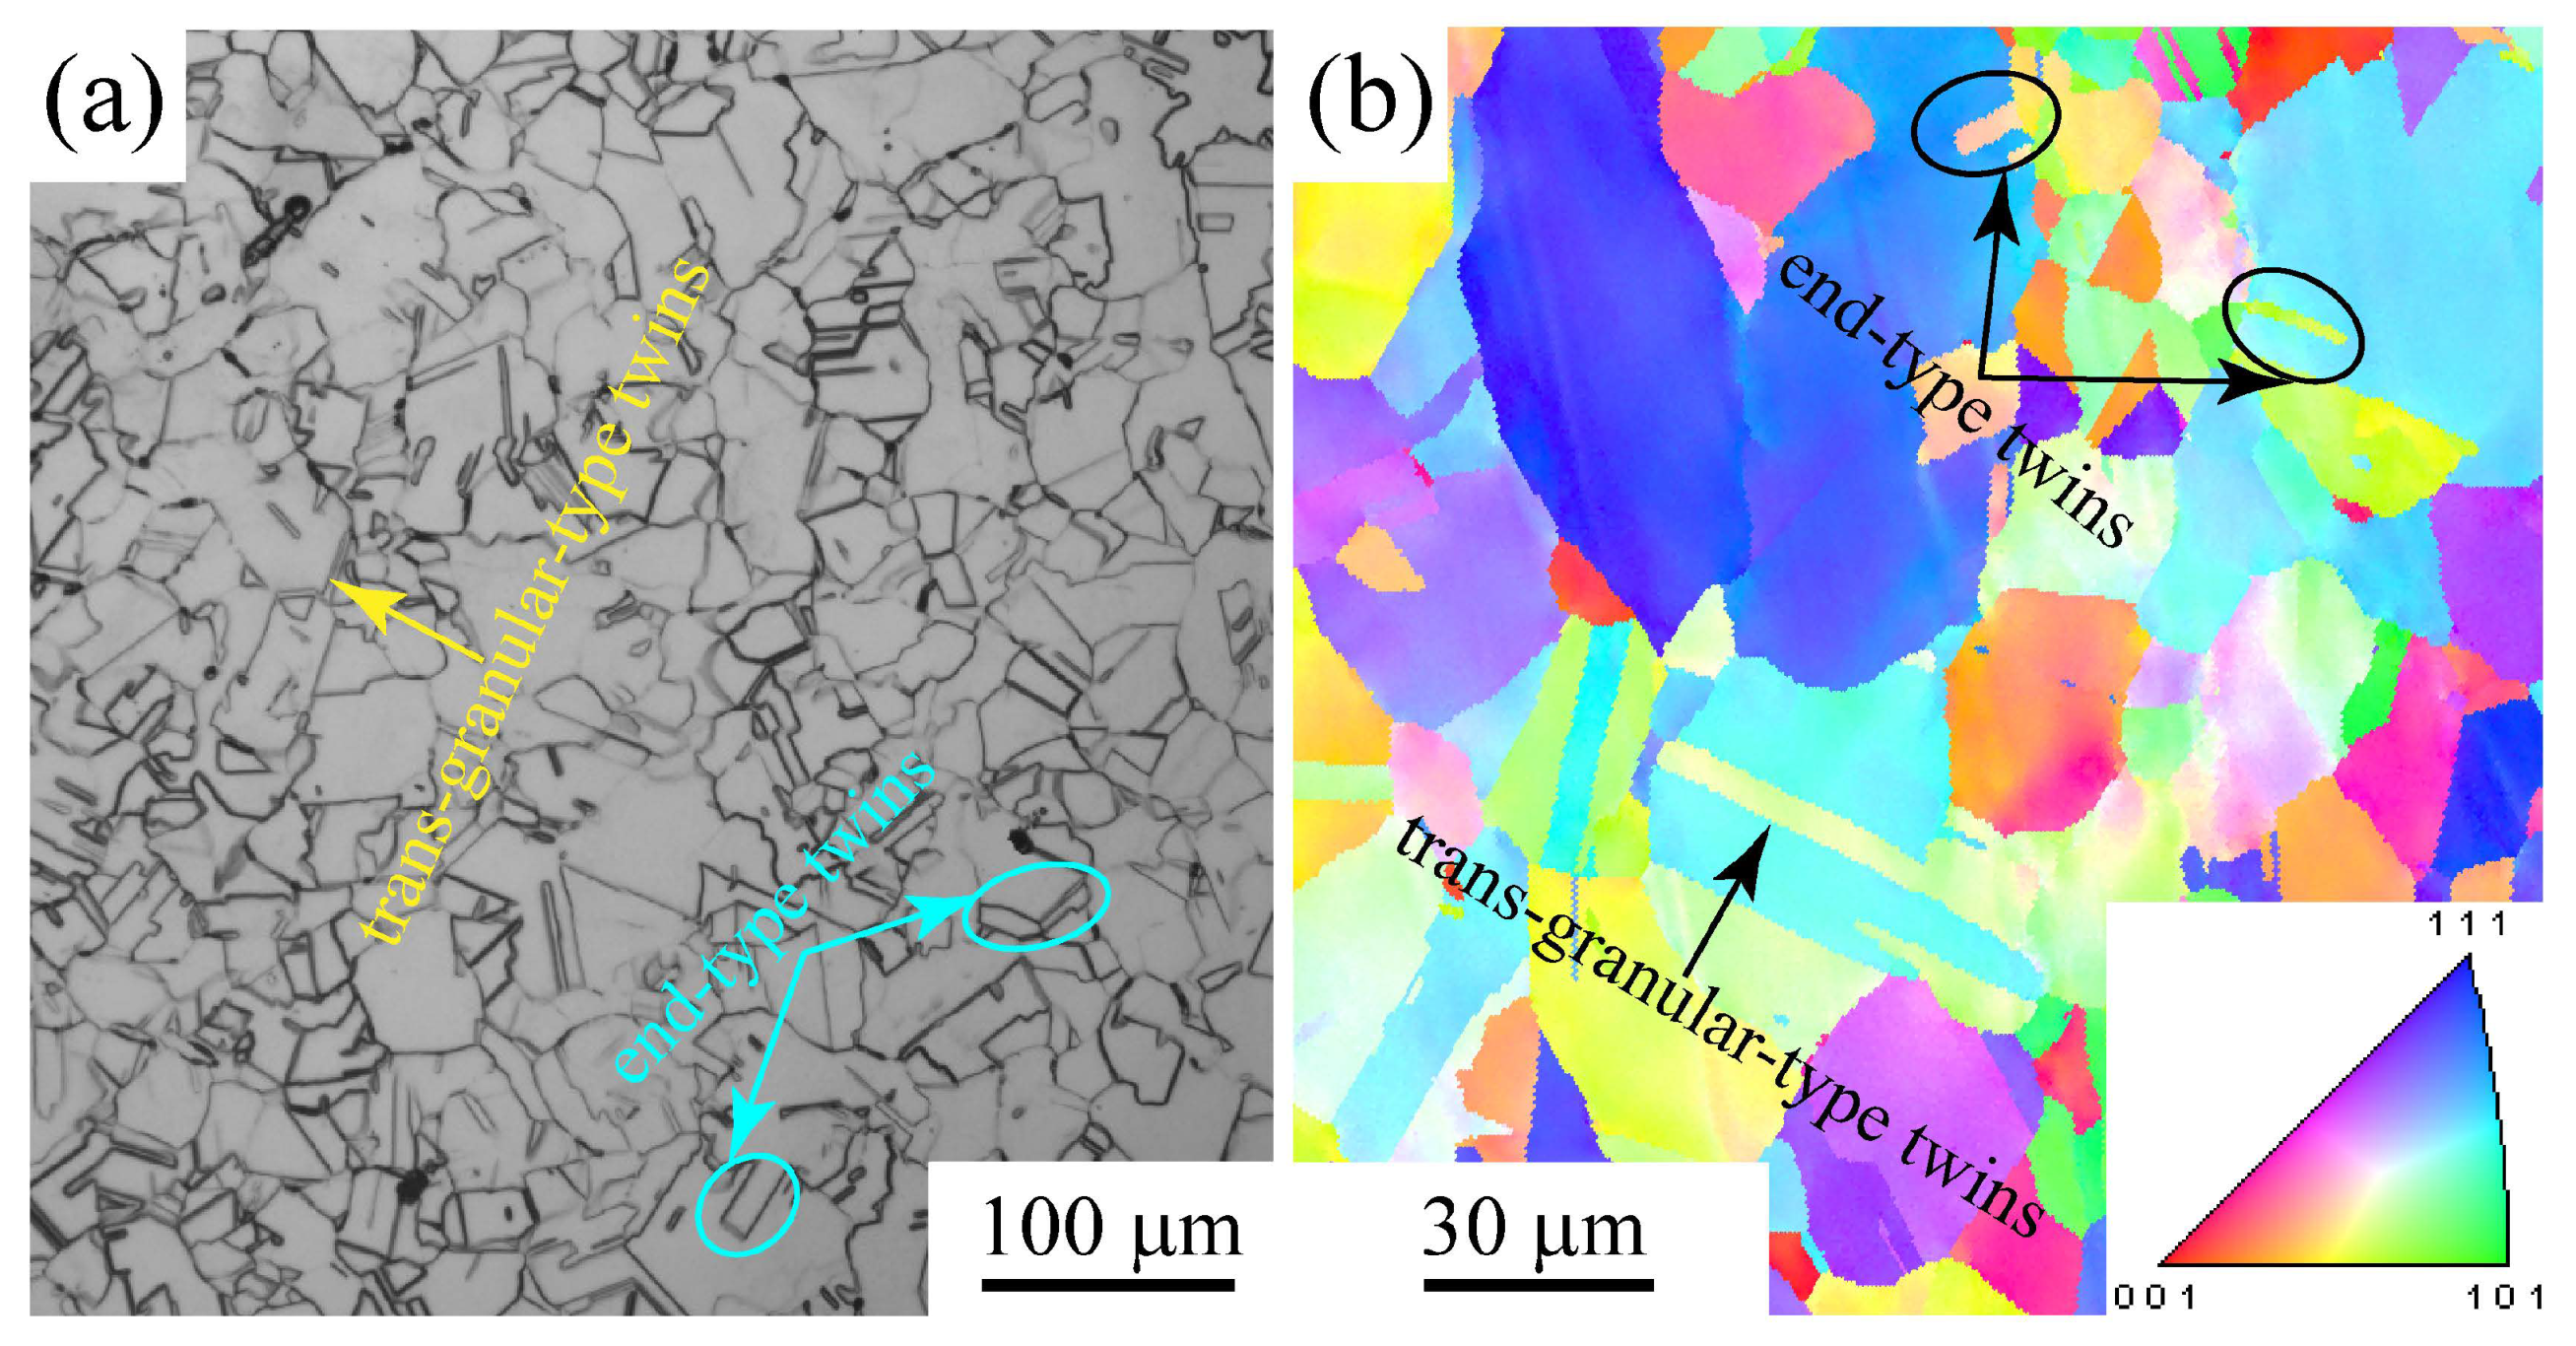
3.1. The Microstructure of Non-CR Fe–19Mn–0.6C TWIP Steel

Figure 1 shows the original microstructure of the non-CR Fe–19Mn–0.6C TWIP steel. The austenite grains present a single irregular shape in Figure 1a and a uniform grain size of 50–60 µm. Additionally, numerous end-type and trans-granular type annealing twins, parallel to the adjacent grain-boundaries, can be observed. Furthermore, the presence of annealing twins in austenite grains can be also verified by the EBSD in Figure 1b. Moreover, the end-type and trans-granular type annealing twins are parallel to the adjacent grain boundaries. However, no obvious orientation relationship between grains can be observed in Figure 1b, implying the irregularity of austenite grain distribution.

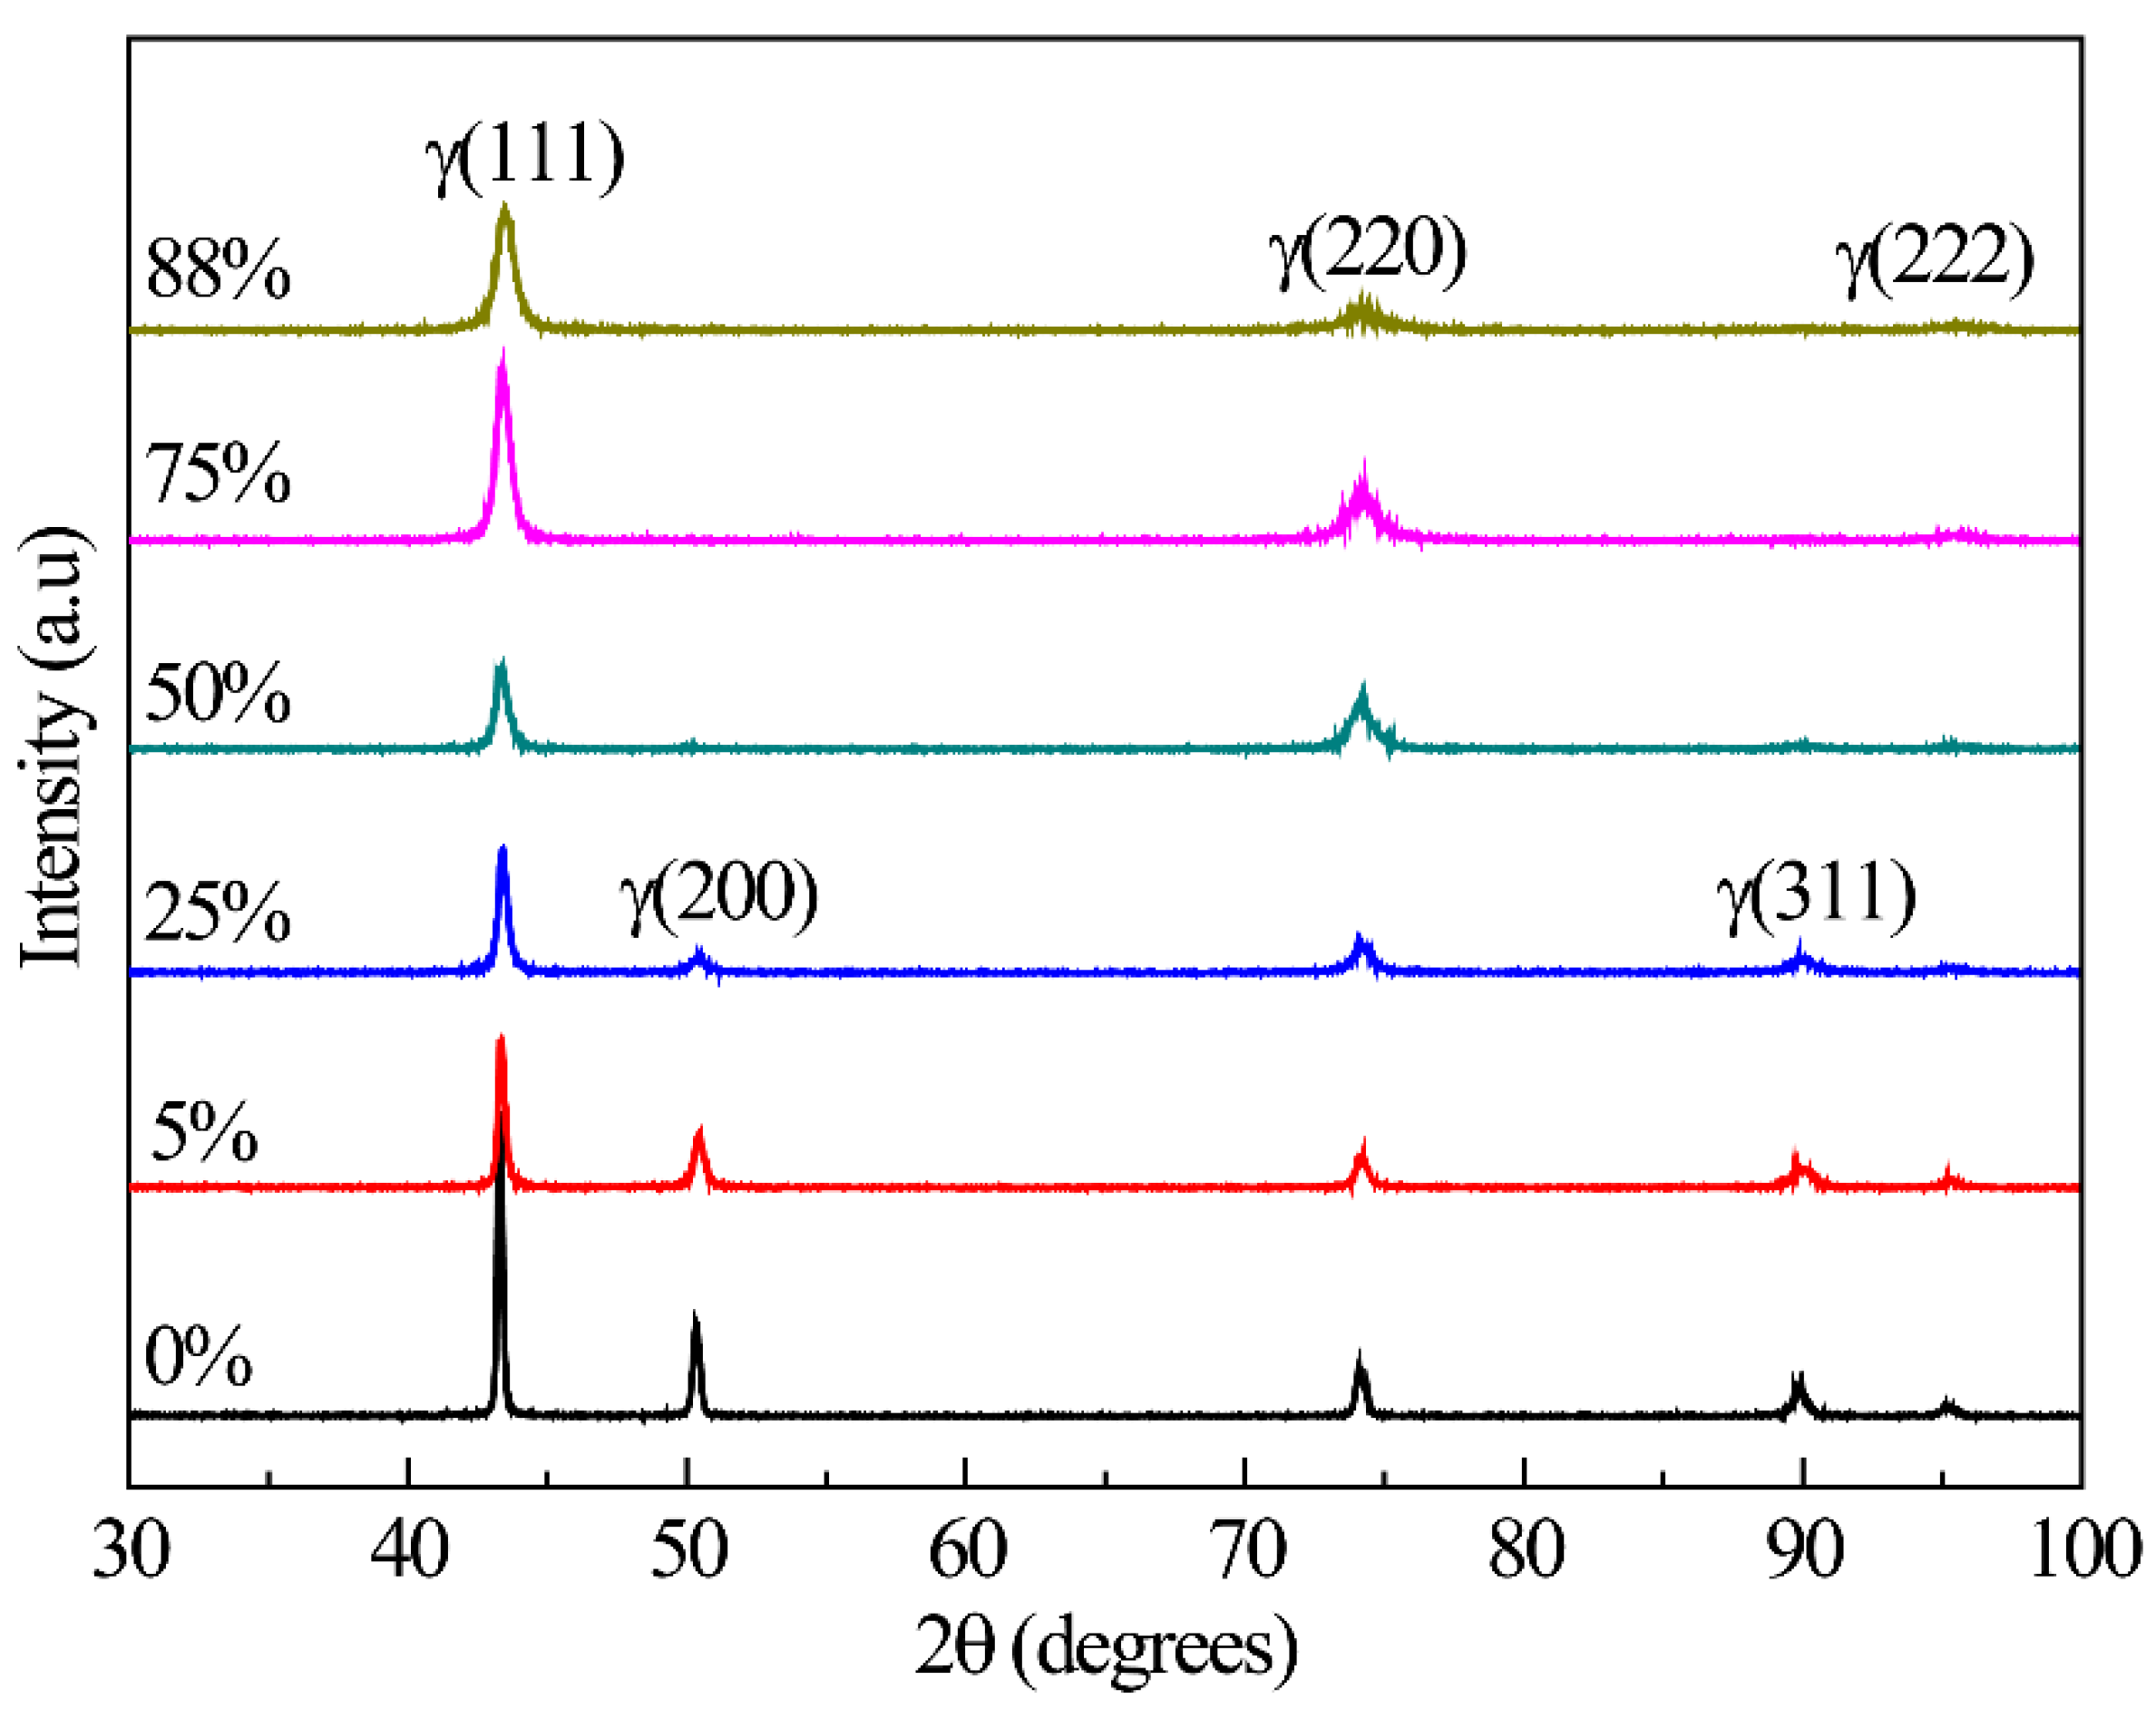
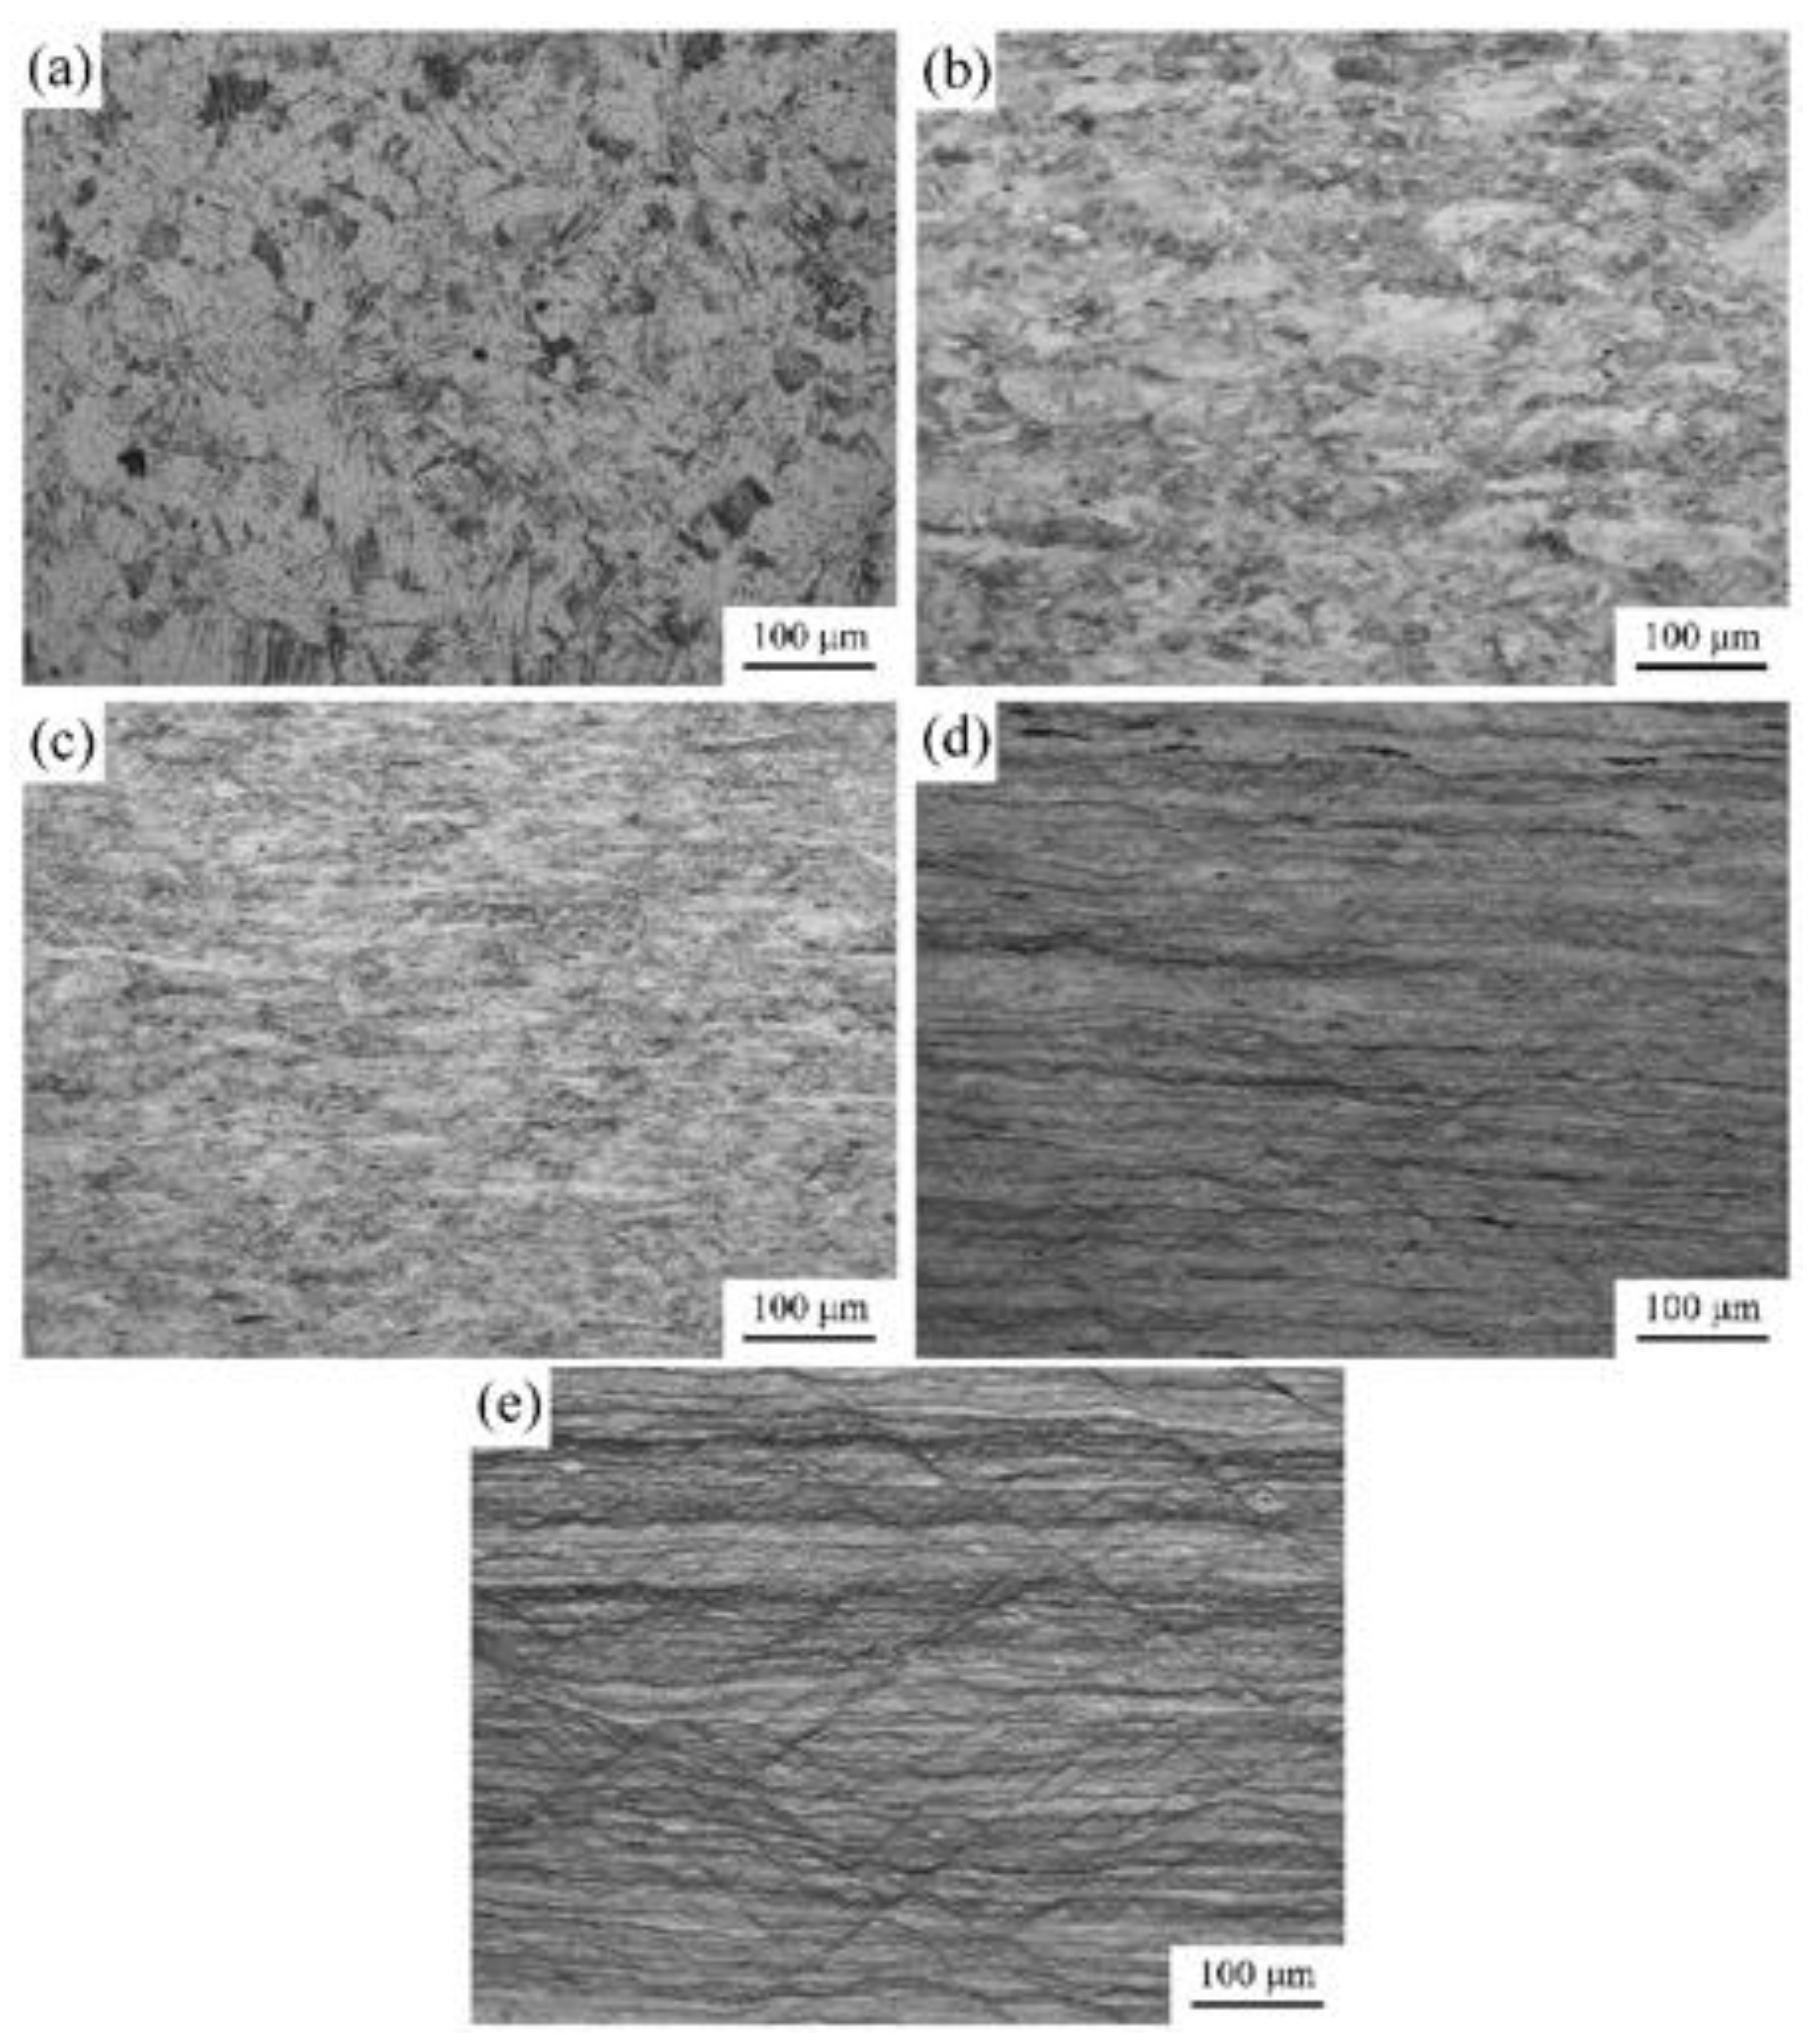
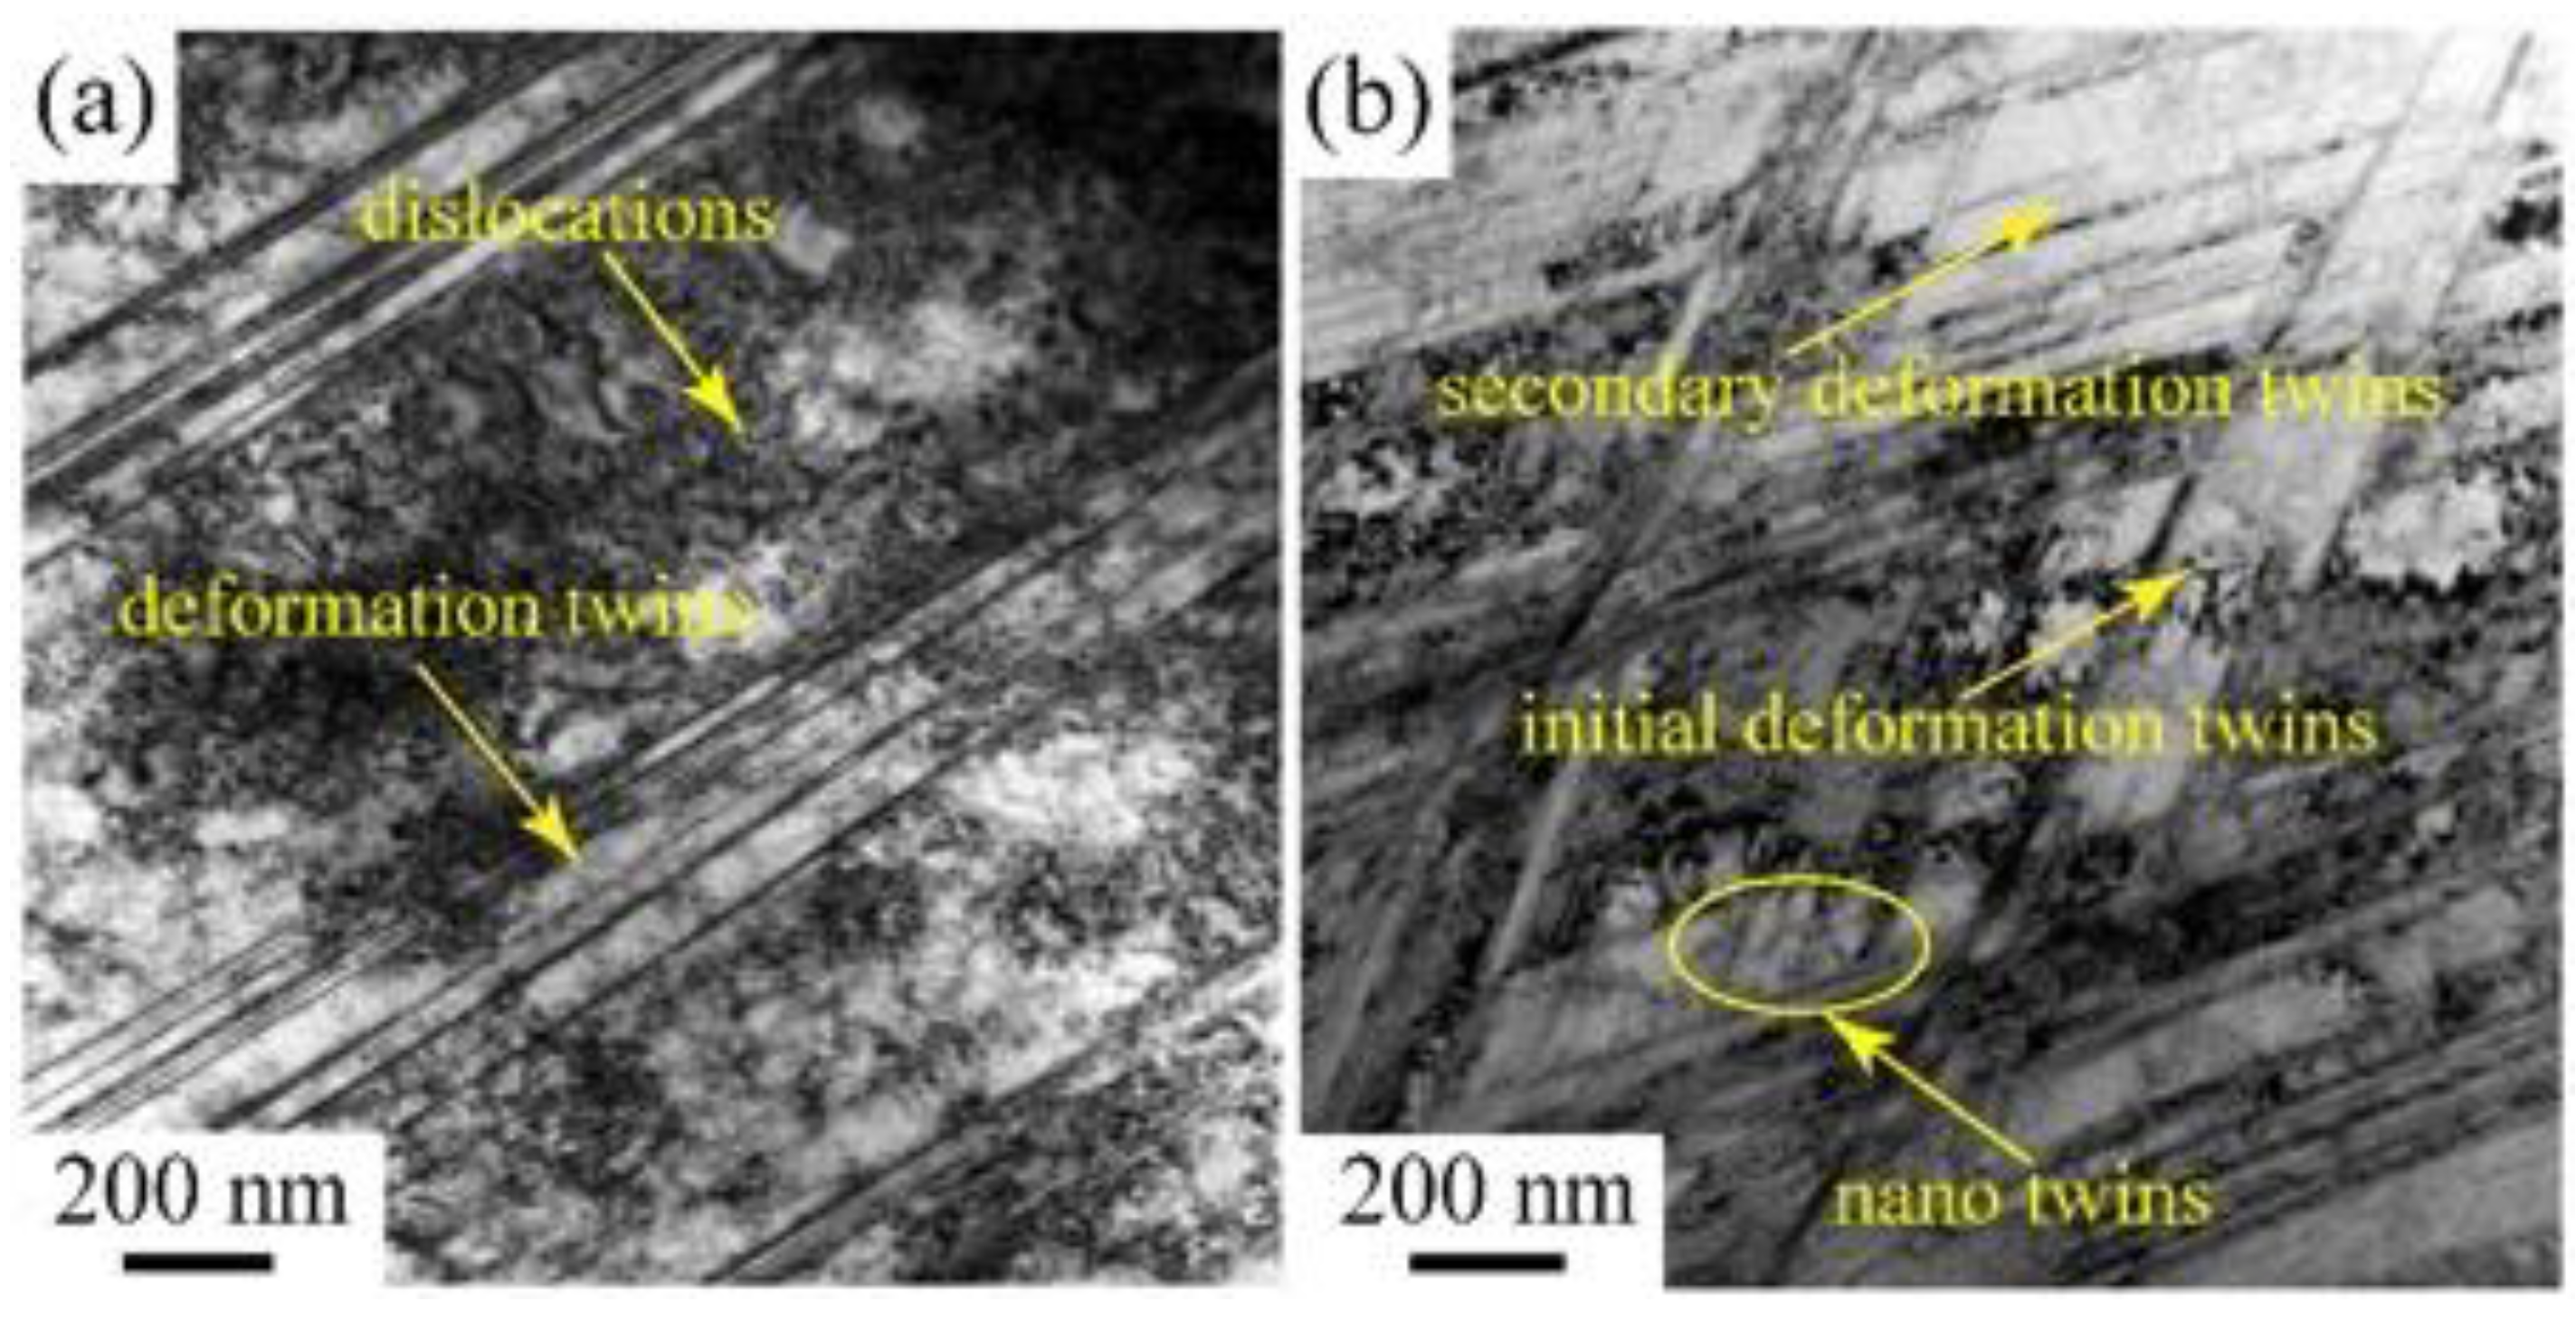
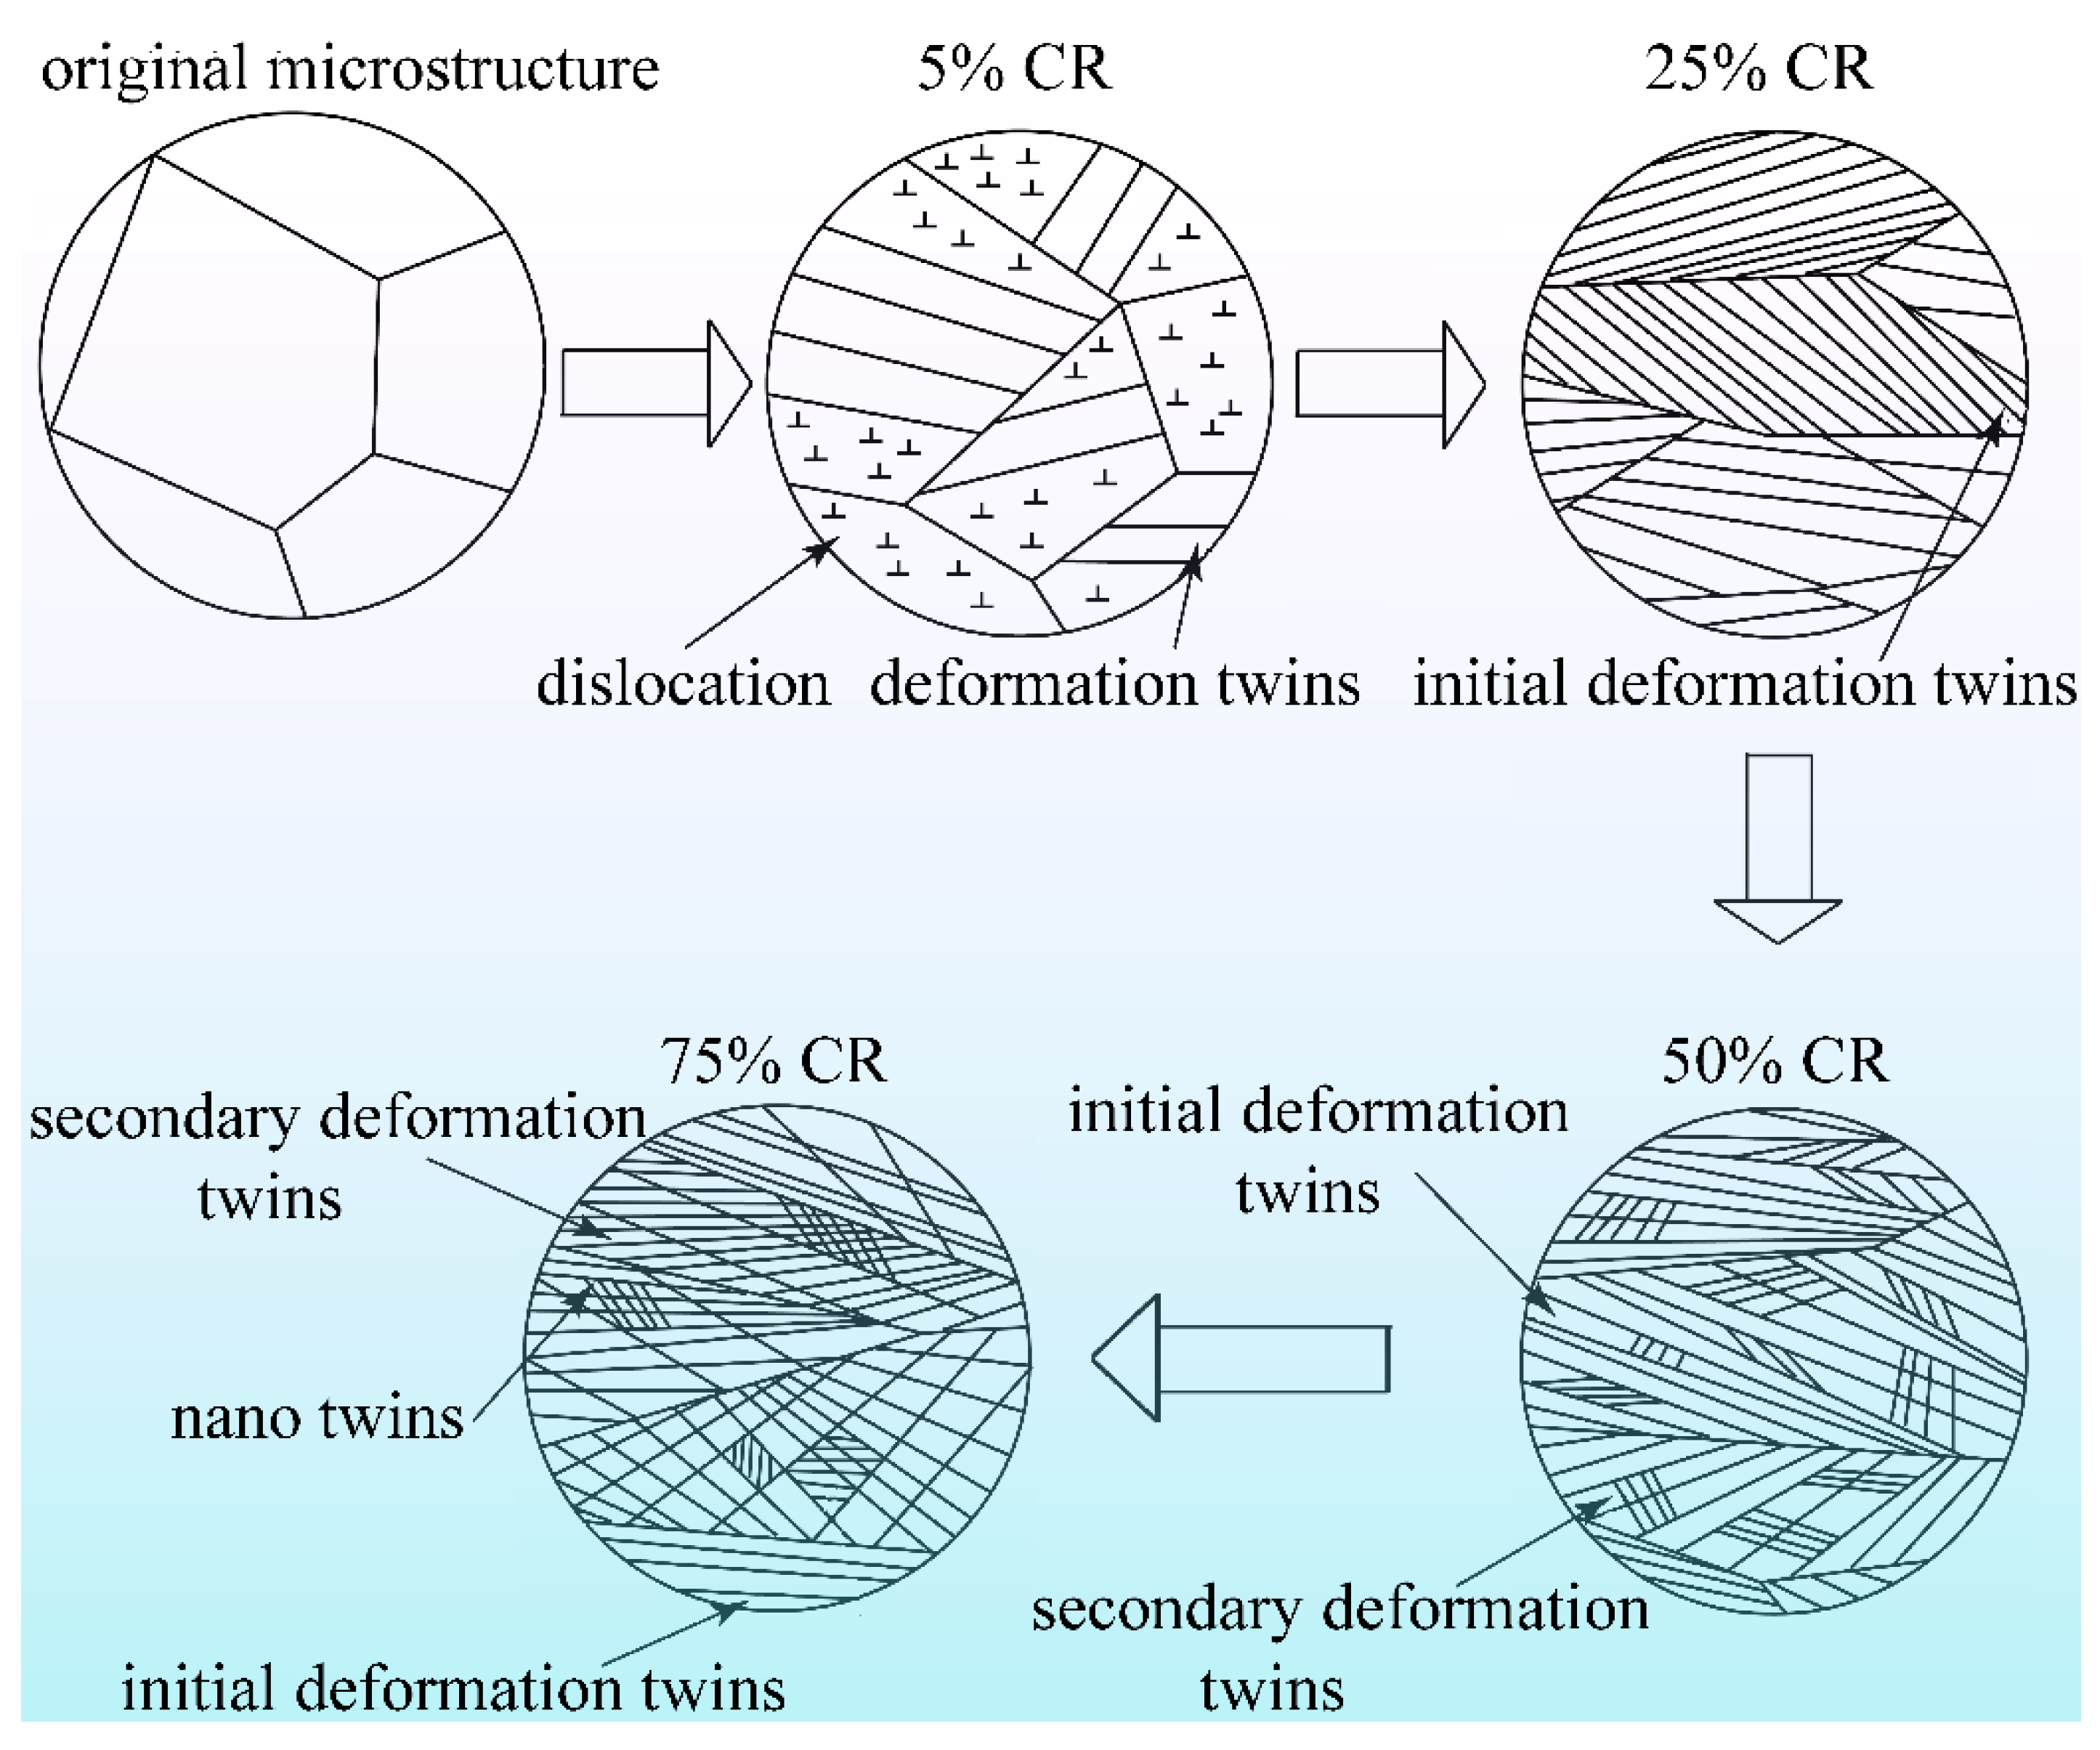
3.2. Microstructural Evolution of CR Fe–19Mn–0.6C TWIP Steel

In Figure 2, the XRD patterns of Fe–19Mn–0.6C TWIP steel at 0%, 5%, 25%, 50%, 75%, and 88% CR deformation are used to reveal the phase transformation. The patterns at various CR deformations just represent the presence of austenite, while the absence of martensite peaks suggests that the austenite transformation had not occurred. For the original TWIP steel, the peaks could be well-indexed to austenite, and the corresponding crystal planes were (111), (200), (220), (311), and (222). Moreover, the crystal planes of (200) and (311) for austenite disappeared as the CR deformation exceeded 25%. As the CR deformation further increased to 88%, the (220) and (222) crystal planes tended to die away. As a result, the larger the CR deformation, the wider the peaks. Furthermore, the exposed crystal became more simplified as the CR deformation increased, suggesting that the deformation can tune the orientation of grains. This changing trend can be ascribed to the refinement of grains and the increase of micro-stress. It can be considered that during cold rolling, grains were refined and became finer as the CR deformation increased.
The microstructural evolution for Fe–19Mn–0.6C TWIP steel at various CR deformation levels (such as 5%, 25%, 50%, 75%, and 88%) can be deduced from Figure 3a–e. As shown in Figure 3a, numerous carbide precipitates and plenty of deformation twins rose in austenite grains, while the early annealing twins disappeared at 5% CR deformation. However, deformation twins with different directions emerged in certain austenite grains, suggesting that two or more systems of twins were initiated. The austenitic grains were separated by different orientational deformation twins, prone to occur in the larger grains, which ran from the boundaries through to the interior.
After reaching 25% CR deformation, the gap of deformation twins further reduced (Figure 3b). The deformation twin boundaries segmented the majority of the austenite grains into various regions, eventually resulting in grain refinement while significantly hindering dislocation motion. However, vast deformation twin boundaries, which are detrimental to dislocation movement, were gradually formed. Thus, larger resistance is needed to overcome plastic deformation from external stress and then improving the strength of TWIP steel. In general, larger grains have dense twins and small grains do not have any twins, suggesting that the formation and growth of twins are closely related to grain orientations. As previously reported [5,14,34], deformation twins tend to generate along the γ<111> orientation. Specifically, deformation twins were generated in the grains with optimal orientations, because the adjacent grains gradually rotated to the preferential orientations as deformation was enhanced, thus promoting deformation twin formation.
As shown in Figure 3c,d (50% and 75% CR deformation, respectively), the original austenite grains that emerged were elongated with varying degrees as the deformation further increased. The results of grain elongation can also be seen in the SEM of Figure 4. The grains were elongated to a strip type, which is similar to a fibrous structure, as the deformation reached up to 75% CR (Figure 3d and Figure 4c,d); following that, the grains were crushed at 88% CR deformation (Figure 3e). At 75% CR deformation (Figure 4c,d), the firstly formed deformation twins tended to continuously split into tinier twins while numerous secondary deformation twins appeared in some wider twins. The secondary deformation twins were much thinner than the initial deformation twins, and the thickness of the secondary deformation twins could be lower than 100 nm (Figure 4d). Nano twin crystals even occurred at 88% CR deformation (Figure 3e), and the resulting twins were divided via twin and grain refinement, thus improving the strength of the tested steel. As a result, the lamellar twin orientations rotated to parallel with the rolling orientation, and the grains’ elongation tendency became much clear as CR deformation increased. Furthermore, EDS at 75% indicated the uniform distribution of Fe, Mn, and C in the region of numerous twins and twin boundaries (Figure 4e,f). The absence of element segregation could also be observed at 75% CR deformation.

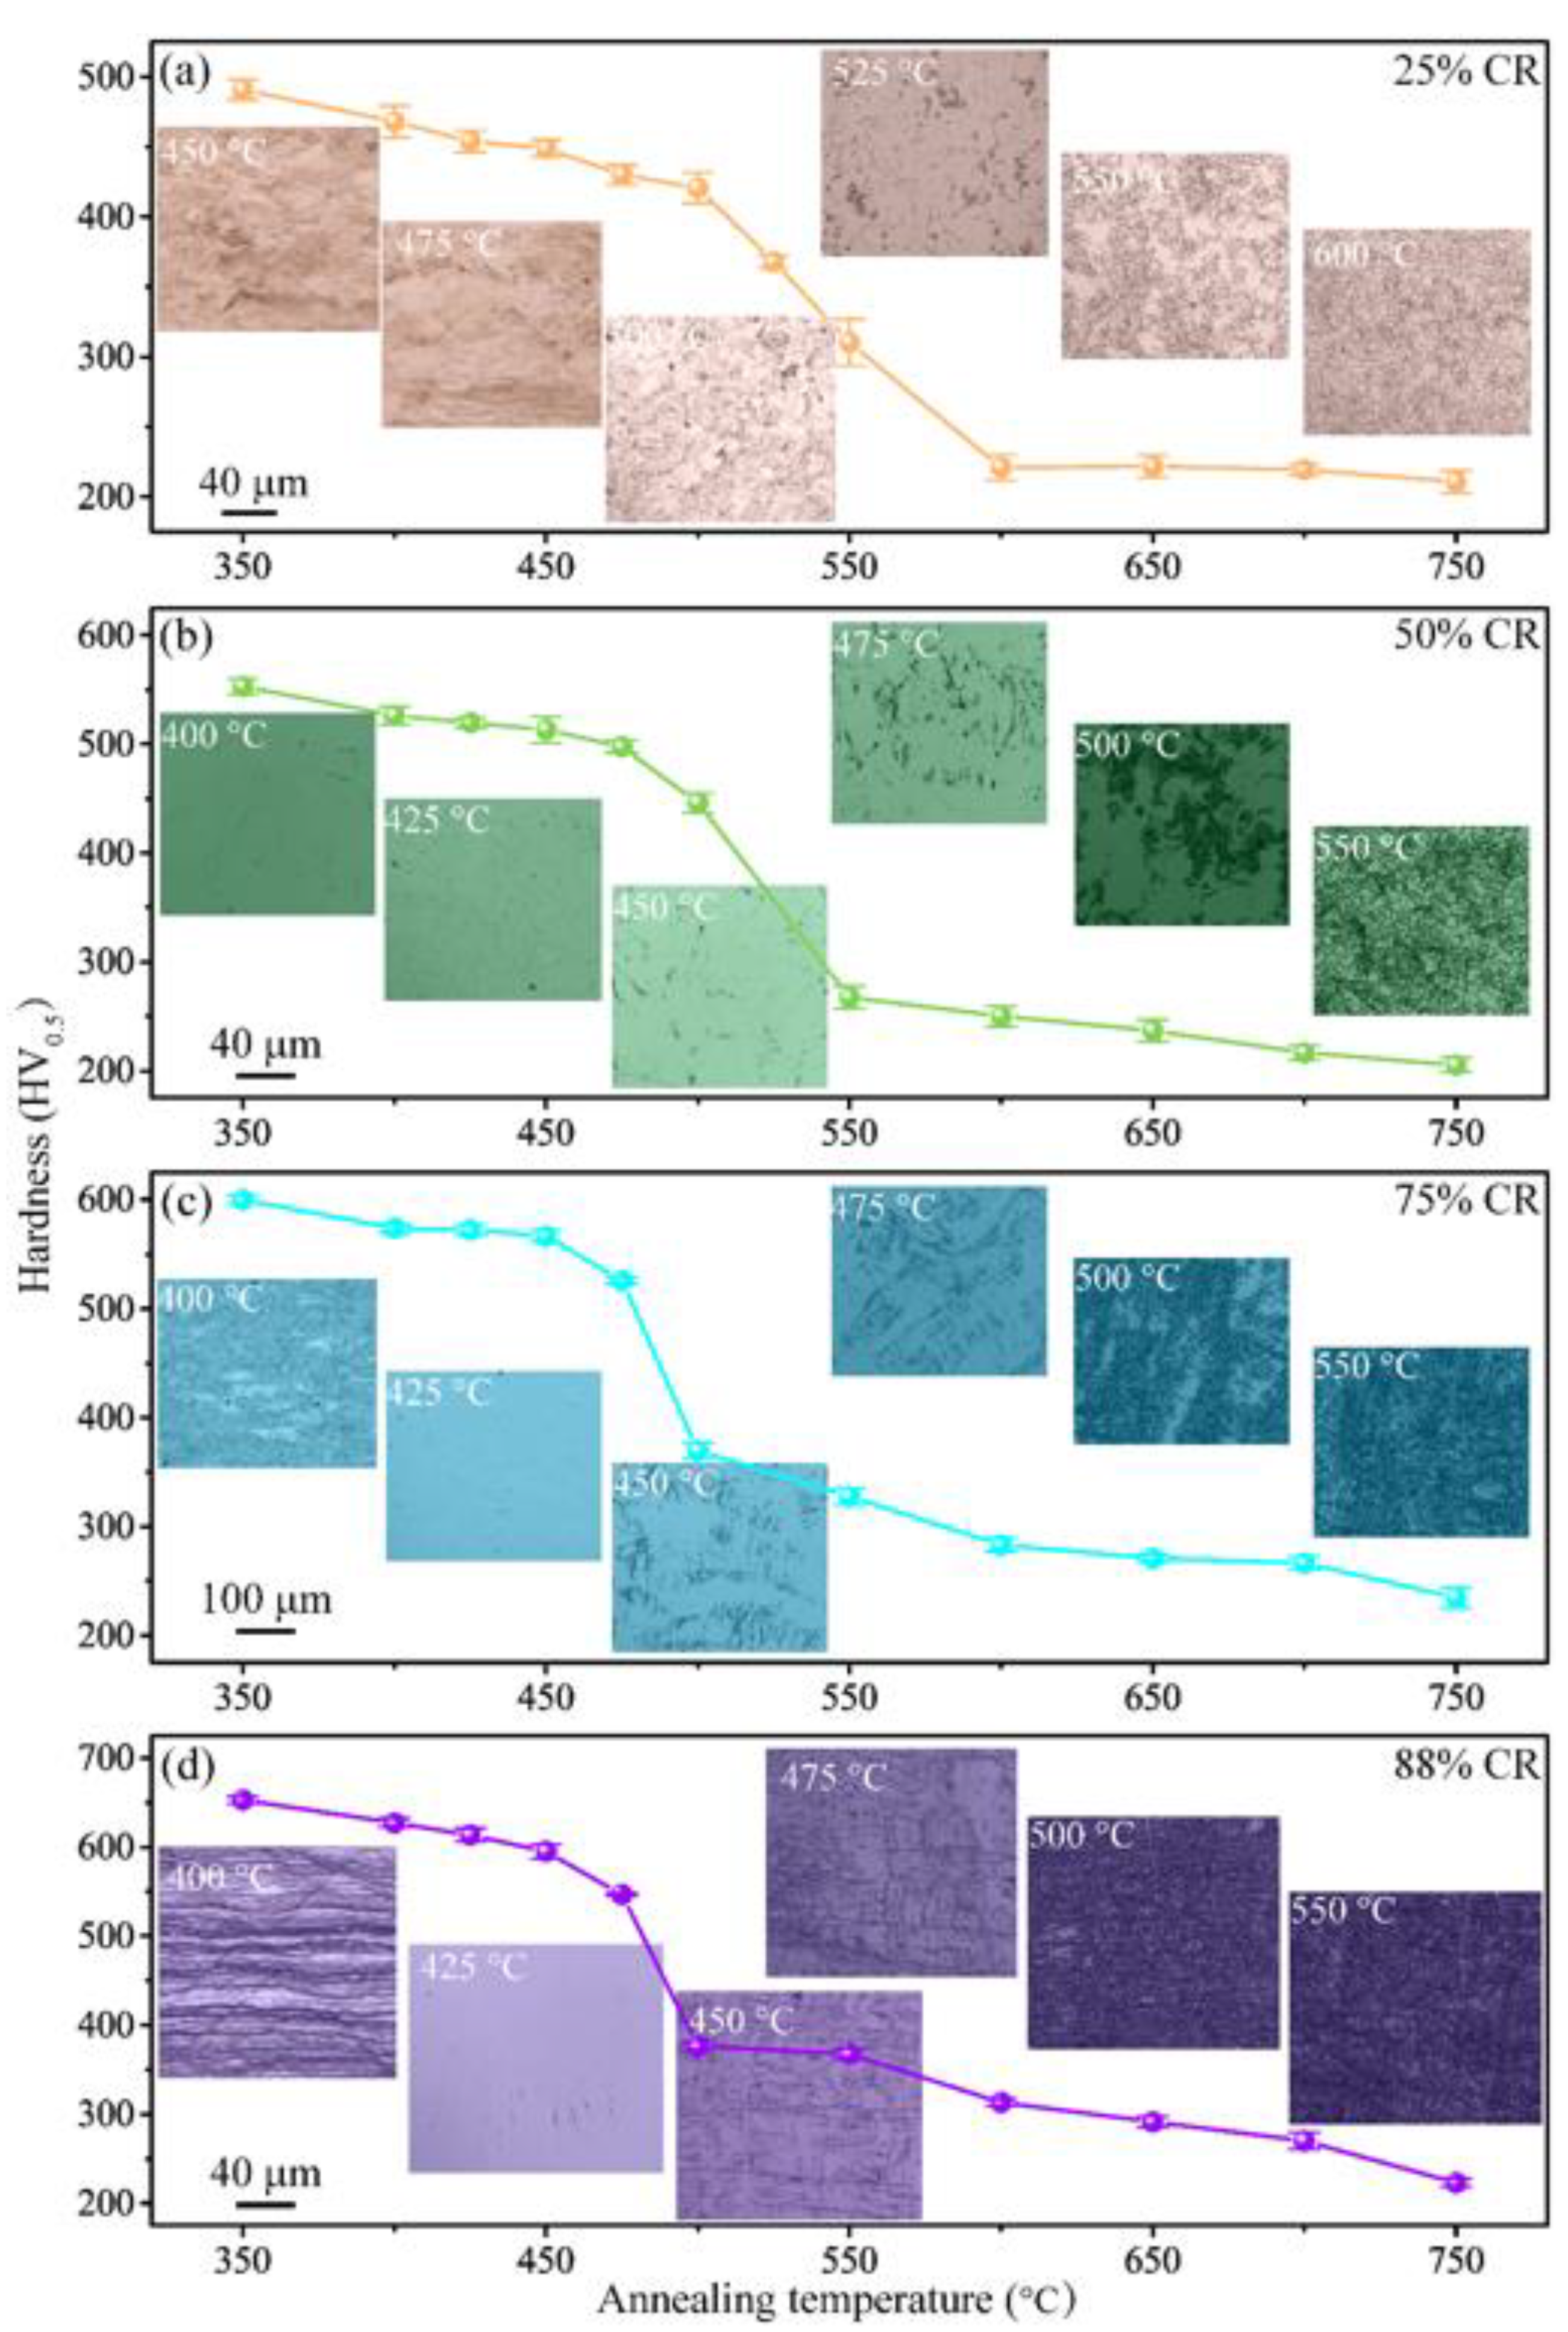
3.3. Recrystallization Temperature Determination of CR Fe–19Mn–0.6C TWIP Steel

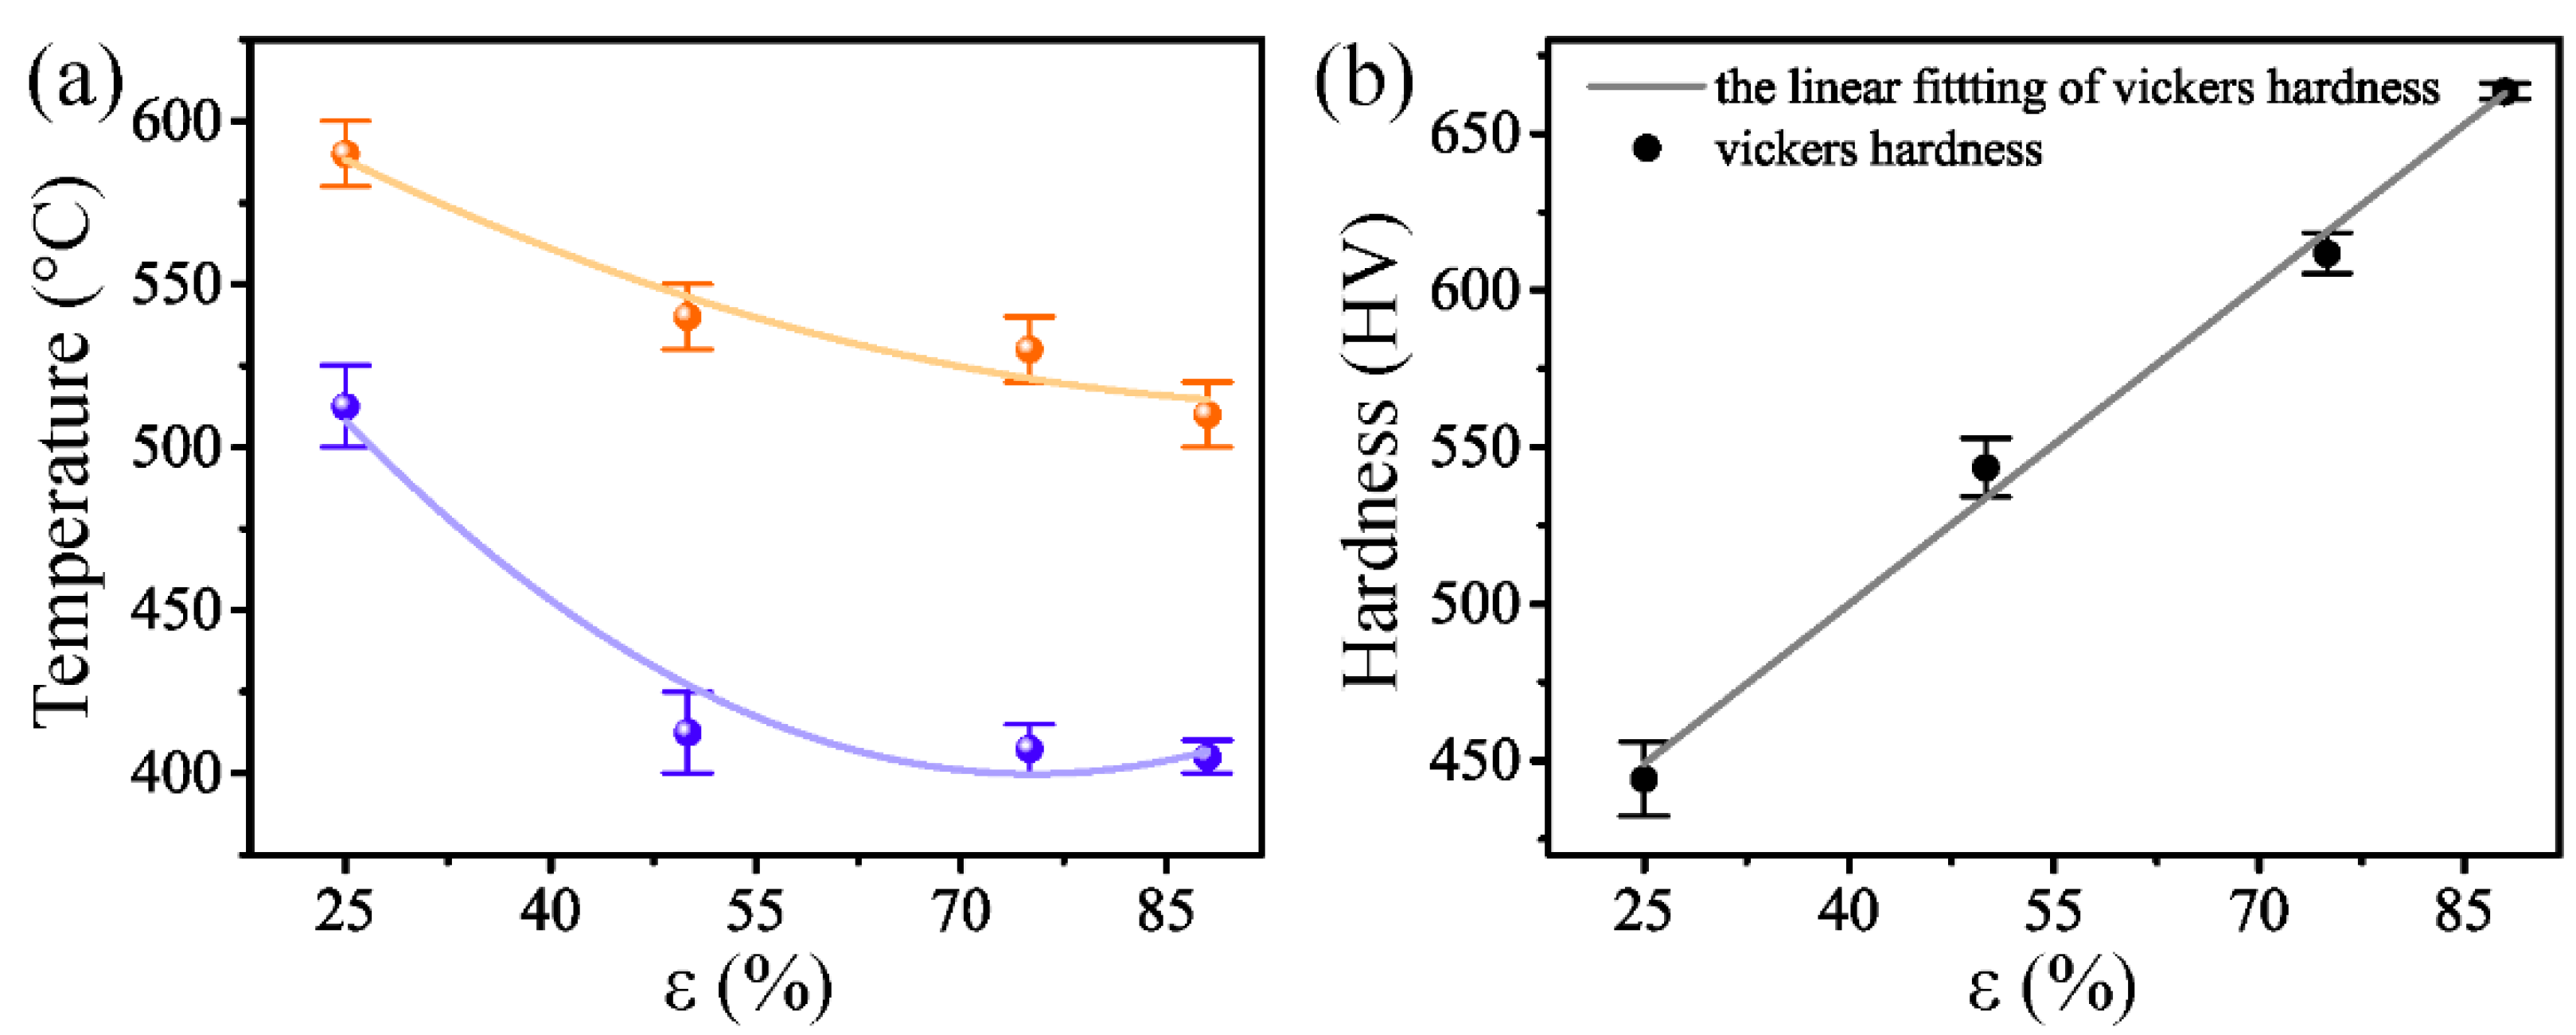
3.3.1. Recrystallization Starting Temperature at Various CR Deformation Levels

To estimate the RST/RET, we tested the hardness–temperature curves and related microstructures at 25%, 50%, 75%, and 88% CR deformation. Here, we screened 50% and 75% CR deformation to investigate the RST, which is based on the principle that deformation twins occur refine at 50–60% deformation [13,24]. The hardness–temperature curves and corresponding optical microstructures are presented in Figure 5. It can be seen in Figure 5b that at 50% CR deformation, hardness slightly changed before 400 °C, suggesting that several defects and dislocations arose at these annealing temperatures. The microstructure still retained the CR state after annealing for 1 h at 400 °C. The absence of recrystallized refinement grains indicated that recovery, rather than recrystallization, occurred at an annealing temperature equal to or lower to 400 °C.
As the annealing temperature increased to 425 °C, recrystallized refinement grains appeared at the grain boundaries and hardness dropped. With the increase of annealing temperature, the fraction of recrystallization grains gradually increased while hardness quickly decreased. This result may have been caused by the high-density dislocations and the newly formed tiny grains offsetting the strain-hardening effect during recrystallization. Hence, it can be deduced that the RST ranged from 400 to 425 °C at 50% CR deformation for the tested Fe–19Mn–0.6C TWIP steel. As the CR deformation increased to 75% (Figure 5c), however, recrystallized refinement grains at 400 °C were present at the grain boundaries, implying the occurrence of recrystallization. The corresponding hardness curve shows a drop, so it can be surmised the RST was 400–415 °C at 75% CR deformation. Similarly, RST values of 500–525 and 400–410 °C were obtained at 25% (Figure 5a) and 88% (Figure 5d) CR deformation, respectively, and the results are summarized in Table 2.

3.3.2. Recrystallization Ending Temperature at Various CR Deformation Levels

Figure 5b shows that at 50% CR deformation, the hardness rapidly decreased as the annealing temperature increased from 475 to 550 °C, suggesting the dramatic recrystallization process as the occurrence of nucleation and growth of numerous recrystallization grains. As the temperature exceeded 550 °C, the CR microstructure disappeared entirely and displayed equiaxial tiny recrystallization grains. However, the hardness exhibited little change as the temperature rose over 550 °C, implying that recrystallization was almost completed. As such, a RET of 530–550 °C was obtained for the 50% CR Fe–19Mn–0.6C TWIP steel at an annealing time of 1 h. The recrystallization grains gradually grew up as the annealing temperature further increased.
For the 75% CR deformation (Figure 5c), a rapid decline of hardness also occurred at the temperature of 475–550 °C, demonstrating the severity of the recrystallization process. Moreover, the absence of a CR microstructure at above 550 °C suggested the completion of recrystallization. However, there were more recrystallization grains at 550 °C at 75% CR deformation than at 50% CR deformation, implying a lower RET. Hence, a RET of 520–540 °C can be observed from Figure 5c at 75% CR deformation. Similarly, for 25% (Figure 5a) and 88% (Figure 5d) CR deformation, RET values of 580–600 and 500–520 °C, respectively, were obtained. Finally, the RET values for TWIP steel at various CR levels are shown in Table 2.

4. Discussion

Deep insight into the microstructural evolution of Fe–19Mn–0.6C TWIP steel during CR deformation is revealed by the TEM images. Here, small (5%) and large (75%) CR deformation levels were screened to study the fine grain structure. As shown in Figure 6a, deformation twins, as well as numerous dislocations, were generated when a small CR deformation of 5% was exerted. When the CR deformation increased to 75%, initial deformations twins, secondary deformation twins, and nano twins could be observed, as seen in Figure 6b. These observations suggest that the initial deformation occurred as the CR deformation began to be gradually increased.
Based on the analysis of the above-mentioned microstructures, the microstructural evolution of Fe–19Mn–0.6C TWIP steel during the CR process is illustrated in Figure 7. The microstructural evolution can be categorized into two stages. At a small CR deformation, the microstructure comprises grains with a high density of dislocations and grains, as well as deformation twin segmentation. The twin layer becomes thinner as the CR deformation further increases. At a large CR deformation, the grains mainly comprise partial dislocation accumulation, secondary deformation twins, and even a few nano twins. As the CR deformation further increases, a vast amount of nano twins start to form twin crystals [13]. For the tested Fe–19Mn–0.6C TWIP steel, therefore, it can be reasonably deduced that as CR deformation gradually increases, the presence of microstructures follows the order of: dislocations → deformation twins → initial deformations twins → secondary deformation twins → nano twins.
Post-annealing treatment is a key way to optimize the machining performance of TWIP steel. Hence, a deep clear relationship between recrystallization temperatures and various CR deformation levels needs to be established in order to rationally design the annealing process of TWIP steel. As mentioned above, the RST/RET values of Fe–19Mn–0.6C TWIP steel at various CR deformation levels are shown in Table 2, and corresponding curves are shown in Figure 8a; they show a greater decrease of the RST as the CR deformation level increased from 25% to 50% and a smaller decrease of the RST as the CR deformation level increased from 50% to 75%. However, a larger change of the RET than that from 50% to 75% could be observed as the CR deformation increased from 75% to 88%. In detail, the RST lowered 100–125 °C as the CR deformation increased from 25% to 50%. However, a slight RST reduction of 20 °C was obtained as the CR deformation increased from 50% to 75% or even 88%. Thus, it can be deduced that deformation storage energy generates a great recrystallization driving force, resulting in a lower RST at higher levels of CR deformation. The RST tends to be a constant as the exerted CR deformation exceeds a certain extent because a large CR deformation leads to a local area with high storage energy, satisfying several regions that need lower recrystallization nucleation temperatures. However, continuously increasing the CR deformation contributes to the local area’s storage energy and thus has almost no effect on RST.
Furthermore, the Vickers hardness test was employed to under the reason for the recrystallization temperature change of TWIP steel. In general, a special relationship always exists between Vickers hardness and CR deformation, and the corresponding curve of Fe–19Mn–0.6C TWIP steel is shown in Figure 8b. This presents an almost linear relation and can be verified by fitting curve b, which can be described as follows:
H V = 3.482 ε + 356.834
where HV represents the Vickers hardness of the CR TWIP steel and ε represents the compression strain.
Moreover, there is a special relationship between the dislocation density and Vickers microhardness of cold-formed metals, and the formula is shown in Equation (2) [29]:
ρ = [ H V × 4 π ( 1 υ ) β G b M ] 2
where G represents the shear modulus, M represents the dislocation distribution parameters, b represents the Burgers vector, and υ represents the Poisson ratio of Fe–19Mn–0.6C TWIP steel.
The relationship between CR deformation and dislocation density can be obtained via substituting Equation (1) into Equation (2), as shown in Equation (3). This formula demonstrates that the dislocation density is the square of CR deformation, which suggests that a larger CR deformation leads to a higher dislocation density.
ρ = [ 4 π ( 1 υ ) ( 3.482 ε + 356.834 ) β G b M ] 2
Deformation storage energy, the vast majority existing in the form of dislocations and a minimal amount existing in the form of vacancy and elastic distortion (among others), acts as the main driving force of annealing recrystallization steel. The minimal dislocation density can be ignored completely after recrystallization, so the recrystallization driving force always can be calculated by Equation (4) [30].
P d 1 2 ρ G b 2
where Pd represents the recrystallization driving force, b represents the Burgers vector of dislocations, and ρ represents the dislocation density.
Hence, the relationship between the recrystallization driving force and CR deformation can be obtained by substituting Equation (3) into Equation (4), as shown in Equation (5).
P d [ π ( 1 υ ) ( 3.482 ε + 356.834 ) β M ] 2
This formula shows that CR deformation (ε) is a variable, while other parameters have particular values for steels with specific compositions. As a result, the parameter f, which represents the increased percentage of the recrystallization driving force, can be considered to be the ratio of former deformation to later deformation, as shown in Equation (6).
f = Δ P d P d 1 = P d 2 P d 1 P d 1 = ( 3.485 ε 2 + 356.834 ) ( 3.485 ε 1 + 356.834 ) ( 3.485 ε 1 + 356.834 )
From Equation (6), it can be deduced that the recrystallization driving force enhances by 56% as deformation increases from 25% to 50% CR. Enhancements of 27% and 30% in the recrystallization driving force can be gained as the deformation increases from 50% to 75% and from 75% to 88%, respectively. The RET reduces as the CR deformation increases. This is because CR deformation has a small effect on recrystallization temperature and the reduction degree declines as the CR deformation increases to a certain extent. However, the influence of CR deformation on recrystallization temperature is again slowly increased as it further increases. Based on the above analysis of recrystallization, the corresponding microstructural evolution during annealing treatment is illustrated in Figure 9.
Figure 9 indicates that for CR Fe–19Mn–0.6C TWIP steel, the recrystallized refined grains are prone to firstly form in the boundaries during the annealing process. This is due to the greater recrystallization driving force that can be provided by grain or twin boundaries. As the annealing temperature increases, more recrystallized refined grains tend to form and transfer from boundaries to intragranular spaces. Then, recrystallization is fully completed. Finally, the grains grow coarse as the annealing temperature further increases.

5. Conclusions

In this work, the microstructural evolution and recrystallization temperature change of a self-designed, ultra-high-strength Fe–19Mn–0.6C TWIP steel at various CR deformation levels were investigated. As the CR deformation gradually increased, initial deformation twins, secondary deformation twins, and nano twins emerged in succession. Moreover, all elements exhibited a uniform distribution, rather than segregation, in the entire microstructure at 75% CR deformation. The RST/RET exhibited a sharp decrease at first and then slowly increased as the CR deformation further increased. Finally, the results showed a linear relationship between the CR deformation and hardness, i.e., the larger the CR deformation, the higher hardness of the studied TWIP steel.

Author Contributions

Conceptualization, H.X. and M.Z.; methodology, H.X.; validation, H.X. and M.Z.; formal analysis, H.X.; resources, H.Y.; data curation, H.X.; writing—original draft preparation, H.X.; writing—review and editing, M.Z., H.X., K.G. and Z.Z.; supervision, H.X., H.Y., K.G., Z.Z. and M.Z. All authors have read and agreed to the published version of the manuscript.

Funding

This research received no external funding.

Data Availability Statement

The data presented in this study are available from the corresponding author upon request.

Acknowledgments

The authors greatly appreciate the equipment and financial support from the Key Laboratory of Metastable Materials Science & Technology, Yanshan University.

Conflicts of Interest

The authors declare no conflict of interest.

References

  1. Ji, F.; Song, W.; Ma, Y.; Li, C.; Bleck, W.; Wang, G. Recrystallization behavior in a low-density high-Mn high-Al austenitic steel undergone thin strip casting process. Mater. Sci. Eng. A 2018, 733, 87–97. [Google Scholar] [CrossRef]
  2. De Cooman, B.C.; Kwon, O.; Chin, K.G. State of the knowledge on TWIP steel. Mater. Sci. Technol. 2012, 28, 513–527. [Google Scholar] [CrossRef]
  3. Dai, Y.J.; Tang, D.; Mi, Z.L.; Lu, J.C. Microstructure characteristics of an Fe-Mn-C TWIP steel after deformation. J. Iron Steel Res. Int. 2010, 17, 53–59. [Google Scholar] [CrossRef]
  4. Dini, G.; Najafizadeh, A.; Ueji, R.; Monir-Vaghefi, S.M. Tensile deformation behavior of high manganese austenitic steel: The role of grain size. Mater. Des. 2010, 31, 3395–3402. [Google Scholar] [CrossRef]
  5. Lee, Y.K. Microstructural evolution during plastic deformation of twinning-induced plasticity steels. Scripta Mater. 2012, 66, 1002–1006. [Google Scholar] [CrossRef]
  6. Lee, J.; Sohn, S.; Hong, S.; Suh, B.C.; Kyu, S. Effects of Mn addition on tensile and charpy impact properties in austenitic Fe-Mn-C-Al-based steels for cryogenic applications. Metall. Mater. Trans. A 2014, 45, 5419–5430. [Google Scholar] [CrossRef] [Green Version]
  7. Frommeyer, G.; Brux, U.; Neuman, P. Supra-ductile and high-strength manganese-TRIP/TWIP for high energy absorption purposes. ISIJ Int. 2003, 43, 438–446. [Google Scholar] [CrossRef] [Green Version]
  8. Sato, K.; Ichinose, M.; Hirotsu, Y.; Inoue, Y. Effects of deformation induced phase transformation and twinning on the mechanical properties of austenitic Fe-Mn-AI alloys. ISIJ Int. 1989, 29, 868–877. [Google Scholar] [CrossRef]
  9. Allain, S.; Chateau, J.P.; Bouaziz, O.; Migot, S.; Guelton, N. Correlations between the calculated stacking fault energy and the plasticity mechanisms in Fe-Mn-C alloys. Mater. Sci. Eng. A 2004, 387, 158–162. [Google Scholar] [CrossRef]
  10. Dμmaya, A.; Chateau, J.P.; Allain, S.; Migot, S.; Bouaziz, O. Influence of addition elements on the stacking-fault energy and mechanical properties of an Austenitic Fe-Mn-C steel. Mater. Sci. Eng. A 2008, 483–484, 184–187. [Google Scholar]
  11. Kim, J.; Lee, S.J.; Cooman, B.C.D. Effect of Al on the stacking fault energy of Fe-18Mn-0.6C twinning-induced plasticity. Scripta Mater. 2011, 65, 363–366. [Google Scholar] [CrossRef]
  12. Mi, Z.; Tang, D.; Zhao, A.; Jiang, H. Mechanical properties and microstructure evolution during deformation of Fe-Mn-C TWIP steel. Steel Res. Int. 2012, 83, 346–351. [Google Scholar]
  13. Kusakin, P.; Belyakov, A.; Haase, C.; Kaibyshev, R.; Molodov, D.A. Microstructure evolution and strengthening mechanisms of Fe-23Mn-0.3C-1.5Al TWIP steel during cold rolling. Mater. Sci. Eng. A 2014, 617, 52–60. [Google Scholar] [CrossRef]
  14. Yang, H.K.; Zhang, Z.J.; Zhang, Z.F. Comparison of work hardening and deformation twinning evolution in Fe-22Mn-0.6C-(1.5Al) twinning-induced plasticity steels. Scripta Mater. 2013, 68, 992–995. [Google Scholar] [CrossRef]
  15. Dini, G.; Najafizadeh, A.; Ueji, R.; Monir-Vaghefi, S.M. Improved tensile properties of partially recrystallized submicron grained TWIP Steel. Mater. Lett. 2010, 64, 15–18. [Google Scholar] [CrossRef]
  16. Jin, J.E.; Lee, U.K. Strain hardening behavior of a Fe-18Mn-0.6C-1.5Al TWIP steel. Mater. Sci. Eng. A 2009, 527, 157–161. [Google Scholar] [CrossRef]
  17. Yuan, G.W.; Huang, M.X. Supper strong nanostructured TWIP steels for automotive applications. Prog. Nat. Sci. Mater. 2014, 24, 50–55. [Google Scholar] [CrossRef] [Green Version]
  18. Lu, S.; Li, R.H.; Kádas, K.; Zhang, H.; Tian, Y.; Kwon, S.K.; Kokko, K.; Hu, Q.M.; Hertzman, S.; Vitos, L. Stacking fault energy of C-alloyed steels: The effect of magnetism. Acta Mater. 2017, 122, 72–81. [Google Scholar] [CrossRef]
  19. Marandi, A.; Zarei-Hanzaki, R.; Zarei-Hanzaki, A.; Abedi, R.H. Dynamic recrystallization behavior of new transformation-twinning induced plasticity steel. Mater. Sci. Eng. A 2014, 607, 397–408. [Google Scholar] [CrossRef]
  20. Salas-Reyes, A.E.; Mejía, I.; Bedolla-Jacuinde, A.; Boulaajaj, A.; Calvo, J.; Cabrera, J.M. Hot ductility behavior of high-Mn austenitic Fe-22Mn-1.5Al-1.5Si-0.45C TWIP steels microalloyed with Ti and V. Mater. Sci. Eng. A 2014, 611, 77–89. [Google Scholar] [CrossRef]
  21. Hamada, A.S.; Karjalainen, L.P. Hot ductility behaviour of high-Mn TWIP Steels. Mater. Sci. Eng. A 2011, 528, 1819–1827. [Google Scholar] [CrossRef]
  22. Mi, Z.L.; Tang, D.; Dai, Y.J.; Huang, H.Q.; Li, S.S. Influence of cold rolling reduction on microstructure and mechanical proprerties of TWIP steel. Acta Mater. 2007, 20, 441–447. [Google Scholar]
  23. Ueji, R.; Tsuchida, N.; Terada, D.; Tsuji, N.; Tanaka, Y.; Takemura, A.; Kunishige, K. Tensile properties and twinning behavior of high manganese austenitic steel with fine-grained structure. Scripta Mater. 2008, 59, 963–966. [Google Scholar] [CrossRef]
  24. Bouaziz, O.; Scott, C.P.; Petitgand, G. Nanostructured steel with high work-hardening by the exploitation of the thermal stability of mechanically induced twin. Scripta Mater. 2009, 60, 714–716. [Google Scholar] [CrossRef]
  25. Ding, H.; Ding, H.; Song, D.; Tang, Z.; Ping, Y. Strain hardening behavior of a TRIP/TWIP Steel with 18.8% Mn. Mater. Sci. Eng. A 2011, 528, 868–873. [Google Scholar] [CrossRef]
  26. Kim, J.K.; Kwon, M.H.; Cooman, B.C.D. On the deformation twinning mechanisms in twinning-induced plasticity steel. Acta Mater. 2017, 141, 444–555. [Google Scholar] [CrossRef]
  27. Fabrèguea, D.; Bouaziz, O.; Barbier, D. Nano-twinned steel exhibits high mechanical properties obtained through ultra-rapid heat treatment. Mater. Sci. Eng. A 2018, 712, 765–771. [Google Scholar] [CrossRef]
  28. Yang, H.K.; Tian, Y.Z.; Zhang, Z.F. Revealing the mechanical properties and microstructure evolutions of Fe-22Mn-0.6C-(x)Al TWIP steels via Al alloying control. Mater. Sci. Eng. A 2018, 731, 61–70. [Google Scholar] [CrossRef]
  29. Zhang, N.; Wang, Y. Dislocation and hardness of hard coatings. Thin Solid Films 1992, 214, 4–5. [Google Scholar] [CrossRef]
  30. Mittemeijer, E.J. Recovery, recrystallization and grain growth. Fundam. Mater. Sci. 2011, 463–496. [Google Scholar]
  31. Yanushkevich, Z.; Belyakov, A.; Kaibyshev, R.; Haase, C.; Molodov, D.A. Effect of cold rolling on recrystallization and tensile behavior of a high-Mn steel. Mater. Charact. 2016, 112, 180–187. [Google Scholar] [CrossRef]
  32. Kalinenko, A.; Kusakin, P.; Belyakov, A.; Kaibyshev, R.; Molodov, D. Microstructure and mechanical properties of a high-Mn TWIP steel subjected to cold rolling and annealing. Metals 2017, 7, 571. [Google Scholar] [CrossRef] [Green Version]
  33. Haase, C.; Kühbach, M.; Barrales-Mora, L.A.; Wong, S.L.; Roters, F.; Molodov, D.A.; Gottstein, G. Recrystallization behavior of a high-manganese steel: Experiments and simulations. Acta Mater. 2015, 100, 155–168. [Google Scholar] [CrossRef]
  34. Rahman, K.M.; Jones, N.G.; Dye, D. Micromechanics of twinning in a TWIP steel. Mater. Sci. Eng. A 2015, 35, 133–142. [Google Scholar] [CrossRef] [Green Version]
Figure 1. The microstructures of non-CR TWIP steel: (a) optical image and (b) EBSD.
Metals 11 01181 g001
Figure 2. XRD patterns of TWIP steel at 0%, 5%, 25%, 50%, 75%, and 88% CR deformation.
Metals 11 01181 g002
Figure 3. Microstructures of TWIP steel at various CR deformation levels: (a) 5%, (b) 25%, (c) 50%, (d) 75%, and (e) 88%.
Metals 11 01181 g003
Figure 4. SEM with different magnifications of TWIP steel at various CR deformation levels: (a,b) 50% and (c,d) for 75%. EDS line profiles of 75% CR deformation for TWIP steel: (e,f).
Metals 11 01181 g004
Figure 5. The relationship among annealing temperatures, hardness, and microstructural evolution of Fe–19Mn–0.6C TWIP steel at (a) 25%, (b) 50%, (c) 75%, and (d) 88% CR deformation.
Metals 11 01181 g005
Figure 6. TEM images of Fe–19Mn–0.6C TWIP steel at (a) 5% and (b) 75% CR deformation.
Metals 11 01181 g006
Figure 7. Illustration of the microstructural evolution in TWIP steel as CR deformation increases.
Metals 11 01181 g007
Figure 8. (a) The correlation between recrystallization temperatures and CR deformation. (b) The interrelation between hardness and CR deformation of Fe–19Mn–0.6C TWIP steel.
Metals 11 01181 g008
Figure 9. The illustration of the CR microstructural evolution of Fe–19Mn–0.6C TWIP steel as the annealing temperature increases.
Metals 11 01181 g009
Table 1. Chemical compositions (wt.%) of Fe–19Mn–0.6C TWIP steel.
CMnSiSCuCrNiFe
0.59019.1200.1240.0120.0250.0190.006Bal.
Table 2. The obtained RST and RET values at different CR deformation levels.
CR Deformation (%)RST (°C)RET (°C)
25500–525580–600
50400–425530–550
75400–415520–540
88400–410500–520
Publisher’s Note: MDPI stays neutral with regard to jurisdictional claims in published maps and institutional affiliations.

