
Welding of Large Thickness Super Duplex Stainless Steel: Microstructure and Properties


1
Department of Engineering Science, University West, 461 32 Trollhättan, Sweden
2
Outokumpu Stainless AB, Avesta R&D Center, 774 41 Avesta, Sweden
*
Author to whom correspondence should be addressed.
Metals 2021, 11(8), 1184; https://0-doi-org.brum.beds.ac.uk/10.3390/met11081184
Submission received: 22 June 2021
/
Revised: 9 July 2021
/
Accepted: 21 July 2021
/
Published: 25 July 2021
(This article belongs to the Special Issue Research on Microstructure and Mechanical Properties in Stainless Steel)
Abstract
:In this study, Submerged Arc Welding (SAW) and Gas Metal Arc Welding (GMAW) processes were used in multi-pass welding of 33 mm thickness super duplex stainless steel plates. Recommended and higher than recommended arc energy and interpass temperatures were used. Both GMAW and SAW processes were able to produce large thickness weldments meeting the microstructural, mechanical, and corrosion resistance requirements, and also when using higher than recommended arc energy and interpass temperature. It was possible to reduce the number of welding passes by half when using higher than recommended arc energy and interpass temperature. The SAW process needed only half of the welding time required for the GMAW process to produce a weldment with nearly the same number of weld passes, when using recommended arc energy and interpass temperature. Based on the results of this investigation, the practical recommendations for welding large thicknesses should be revised and updated.
1. Introduction
It is well-known that duplex and super duplex stainless steels show an excellent combination of strength, toughness, corrosion resistance, and stress corrosion cracking resistance [1]. This combination of corrosion and mechanical properties makes these stainless steels appropriate for severely corrosive environments while saving weight due to these steels’ higher strength in comparison to austenitic stainless steels or clad steels [2].
Among the wide range of industries where duplex stainless steels are used, the pulp and paper industry and the oil and gas industry are worth noticing. In the pulp and paper industry, duplex stainless steels are found in the pulp digesters, evaporators, liquor tanks, and piping for corrosive process liquors [2,3,4]. In the oil and gas industry, these steels are used in on-shore production tubing but also in off-shore subsea manifolds and pipelines, experiencing high internal pressures but also external pressures due to their undersea location [2,5,6]. In both industries, duplex and super duplex stainless steels are demanded in the form of large thickness plates and tubes, usually ranging from 20 to 40 mm in thickness. There is, therefore, a strong need for welding large thickness super duplex stainless steels in the fabrication of these industrial components.
However, corrosion resistance and mechanical properties can be severely impaired when the duplex and super duplex stainless steels are repeatedly reheated to the range of approximately 600 °C to 1000 °C, as happens in multi-pass welding. The main reasons are the formation of undesirable intermetallic phases (e.g., sigma-, chi-, and R-phases) detrimental to the mechanical properties, as well as secondary austenite formation and nitride precipitation, which are detrimental for corrosion resistance [7,8,9,10,11,12,13].
Considering the above-mentioned issues and therefore to support the successful welding of duplex and super duplex stainless steels, the guidelines and recommendations [14,15,16,17] impose restrictions on the arc energy and the interpass temperature. These guidelines recommend arc energies in the range 0.5–2.5 kJ/mm and interpass temperature restricted to a maximum of 150 °C. Specifically for 25% Cr super duplex, it is recommended not to exceed 1.5 kJ/mm and 100 °C as the interpass temperature. Despite the guidelines underlining the maximum arc energy level, it is also warned that multi-pass welding using low arc energies could promote the formation of intermetallics. Special caution in the passes sequence has to be paid to avoid passes being unnecessarily reheated. The guidelines also recommend an arc energy balance between the root pass and the following ones, suggesting using for the second and subsequent passes around 75% of the arc energy used in the root pass.
According to the above-mentioned guidelines [14,15,16,17], all the arc welding processes are suitable for joining duplex and super duplex stainless steels. For the root pass, the commonly preferred processes are Gas Tungsten Arc Welding (GTAW), Plasma Arc Welding (PAW), and pulsed Gas Metal Arc Welding (GMAW), whilst for the filling passes, other welding processes with higher deposition rates are possible to be used, such as Flux Cored Arc Welding (FCAW) and Submerged Arc Welding (SAW). The selection of the welding process and settings has to produce quality weldments fulfilling the desired properties, and at the same time, productivity aspects need to be considered.
Despite previous research in multi-pass welding of duplex and super duplex stainless steels [11,12,13] and available guidelines [14,15,16,17], more information and additional data are needed to bridge the knowledge gap and particularities of welding large thickness super duplex stainless steels by using different welding processes. There is a real need for welding large thickness super duplex stainless steels in specific industries, and the weldments have to fulfill the desired properties and at the same time with the highest possible productivity. Therefore, in this work, SAW and GMAW processes were used for multi-pass welding of 33 mm thickness super duplex stainless steel plates. The microstructure, corrosion, and mechanical properties, as well as the productivity of the weldments were compared when using different arc energy values. It is expected that the outputs of this work can contribute by adding complementary and valuable data about large thickness welding of super duplex stainless steels.
2. Materials and Testing
2.1. Materials and Welding Experiments
Type 2507 super duplex stainless steel (EN 1.4410, UNS S32750) plates in 33 mm thickness were welded with mechanized GMAW and SAW processes. Table 1 includes the designation and chemical composition of the base and filler materials. The diameters of the filler materials were 1.2 mm and 2.4 mm, respectively, for GMAW and SAW. The shielding gas selected for GMAW was Ar + 30% He (20 L/min flow), and the backing gas was N2 (>99.95% purity, 8 L/min flow). For SAW, an aluminate-fluoride flux with a Boniszewski basicity index of 1.7 was used.
Three welding experiments were conducted, one of them using GMAW and two using SAW. In the GMAW experiment, designated as GM-R, the arc energy and interpass temperature were according to those recommended by guidelines and practices [14,15,16]. However, two approaches were tried in the SAW experiments. In the one designated as SA-R, recommended interpass temperatures and arc energies were used, whilst in the experiment SA-H, higher than recommended interpass temperature and arc energy were used. Table 2 summarizes the three welding experiments conducted in this study, including the range of values for the welding parameters, the interpass temperature, the arc energy, and the welding layout.
Joint preparation was in all cases X-prep with an 80° angle. For GMAW, direct current (DC) pulsed was used, whilst for SAW it was positive polarity (DC+). The welding position was downhand (PA) in all cases. Therefore, the workpiece was turned 180° to reach each side of the weld according to the welding sequence designed (Table 2).
2.2. Microstructural Inspection
The microstructural evaluation included the quantification of austenite/ferrite phases and the detection of secondary phases, mainly nitrides, secondary austenite, and sigma-phase. Special attention was paid to austenite presence in the top and bottom surfaces of the weld in contact with the media.
Light Optical Microscopy [Olympus BX60M, (Olympus Corporation, Tokyo, Japan), Zeiss AxioCam MRC5, (Zeiss International, Oberkochen, Germany)] was used for microstructural characterization. Electrolytic etching with 40% NaOH was selected to reveal sigma-phase, 10% oxalic acid was used to reveal nitrides, and color etching with Beraha II was used to contrast austenite and ferrite for phase quantification by image analysis. For the determination of ferrite content by image analysis, 387 images were taken, giving an average of 16 images for each region and weld pass examined.
2.3. Chemical Analysis
Optical Emission Spectroscopy (OES) with SPECTROMAXx (Spectro Analytical Instruments GmbH, Kleve, Germany) was used in the analysis of the main elements, and the combustion technique (LECO TC-436, LECO Corporation, St. Joseph, MI, USA) was used in the analysis of nitrogen and oxygen. Two cross-sections per experiment were analyzed, and three repetitions per location conducted. As the purpose was to cover the analysis of the entire cross-section, the three locations were the bottom (side 2 in Table 2), the center (root, first pass in Table 2), and the top (side 1 in Table 2) of the cross-sections.
2.4. Mechanical Testing
Impact toughness testing was conducted in the weld metal and the Heat Affected Zone (HAZ) according to ISO 9016 [18] with a Zwick Roell equipment (ZwickRoell Group, Ulm, Germany). A total of 72 specimens were tested, 24 per experiment, which corresponds to three repetitions per temperature and location. Room temperature and −46 °C were the selected temperatures, and coupons were extracted from three locations: the root of the weldment (mid of the X joint), the bulk weld metal (side 1), and in the HAZ, where the notch was located at 2 mm from the fusion line.
Transverse tensile testing was conducted according to ISO 4136 [19] with an Instron 8516 equipment (ITW Instron, Norwood, MA, USA). A total of 18 samples was tested, 6 per experiment, in different locations (2 from the top of the weld metal, 2 from the center of side 1, and 2 in the X-root of the weld), as shown in Figure 1.
Longitudinal tensile testing was conducted according to ISO 5178 [20]. A total of 6 samples were tested, 2 per experiment, one in the top of the weld metal and one in the center of side 1.
2.5. Corrosion Testing
Corrosion testing was performed following ASTM G48E [21] for a total of 30 coupons, 10 per experiment, to evaluate the Critical Pitting Temperature (CPT). This test is normally considered for surfaces in contact with the media, not for cross-sections. However, in this study, the cross-section was the area of interest. In such large-size specimens, it was decided not to consider the weight loss criterion established by Norsok standard M-601 [22] (<4 g/m2) because the results might not reflect the true corrosion resistance of the area of interest. Instead, the criterion to pass the test was the absence of pits deeper than or equal to 0.025 mm. The depth of the pits was evaluated by using a Nikon Epiphot (Nikon Corporation, Chiyoda, Japan), an inverted metallurgical microscope.
To compare the influence of the arc energy on the pitting corrosion resistance of the SAW welds, the ASTM G150 test [23] was performed on coupons extracted at a distance of 8 mm from the root in an Avesta Cell (Bank Elektronik-Intelligent Controls GmbH, Pohlheim, Germany). The test was stopped as soon as 0.1 mA/cm2 was registered to find the most susceptible location to pitting corrosion. Since the standard requests 60 s holding time after registering 0.1 mA/cm2, the temperature at which pitting started was not strictly speaking the CPT, but it served for comparison purposes.
3. Results
3.1. Microstructure and Phase Balance
In this section, the ferrite content and the location of intermetallics and secondary phases are presented for the three weldments investigated.
3.1.1. SA-R Weldment
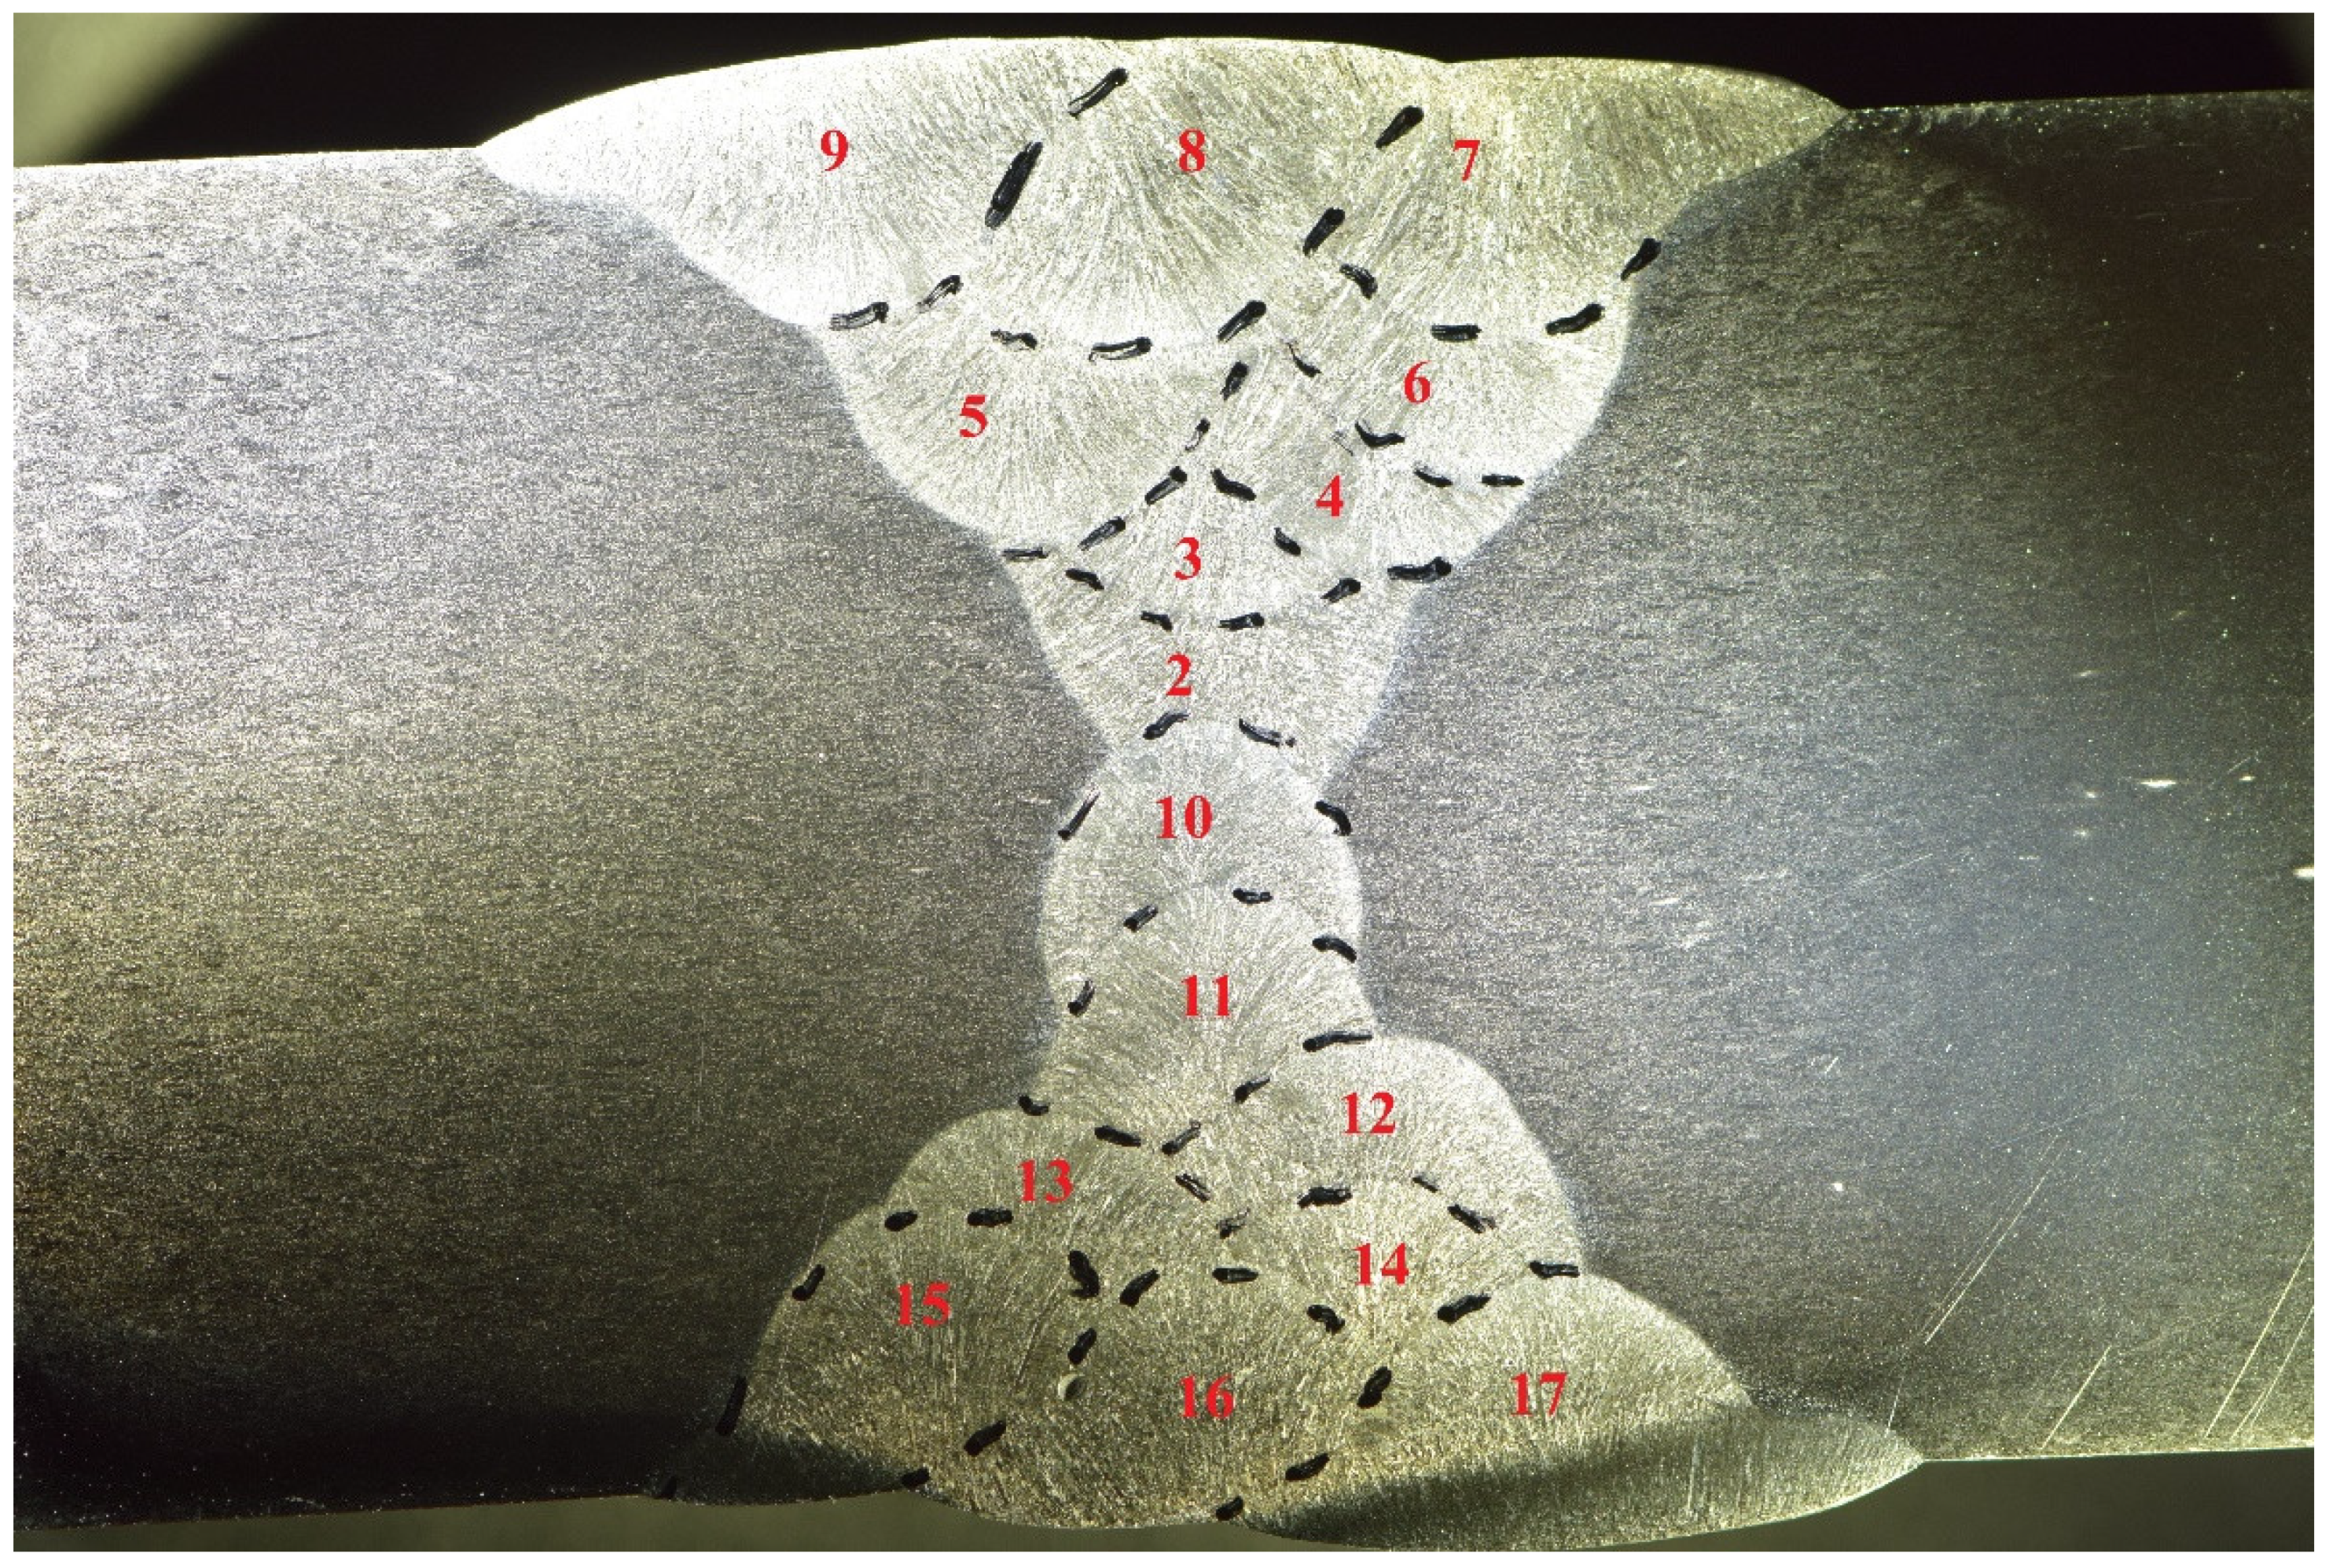
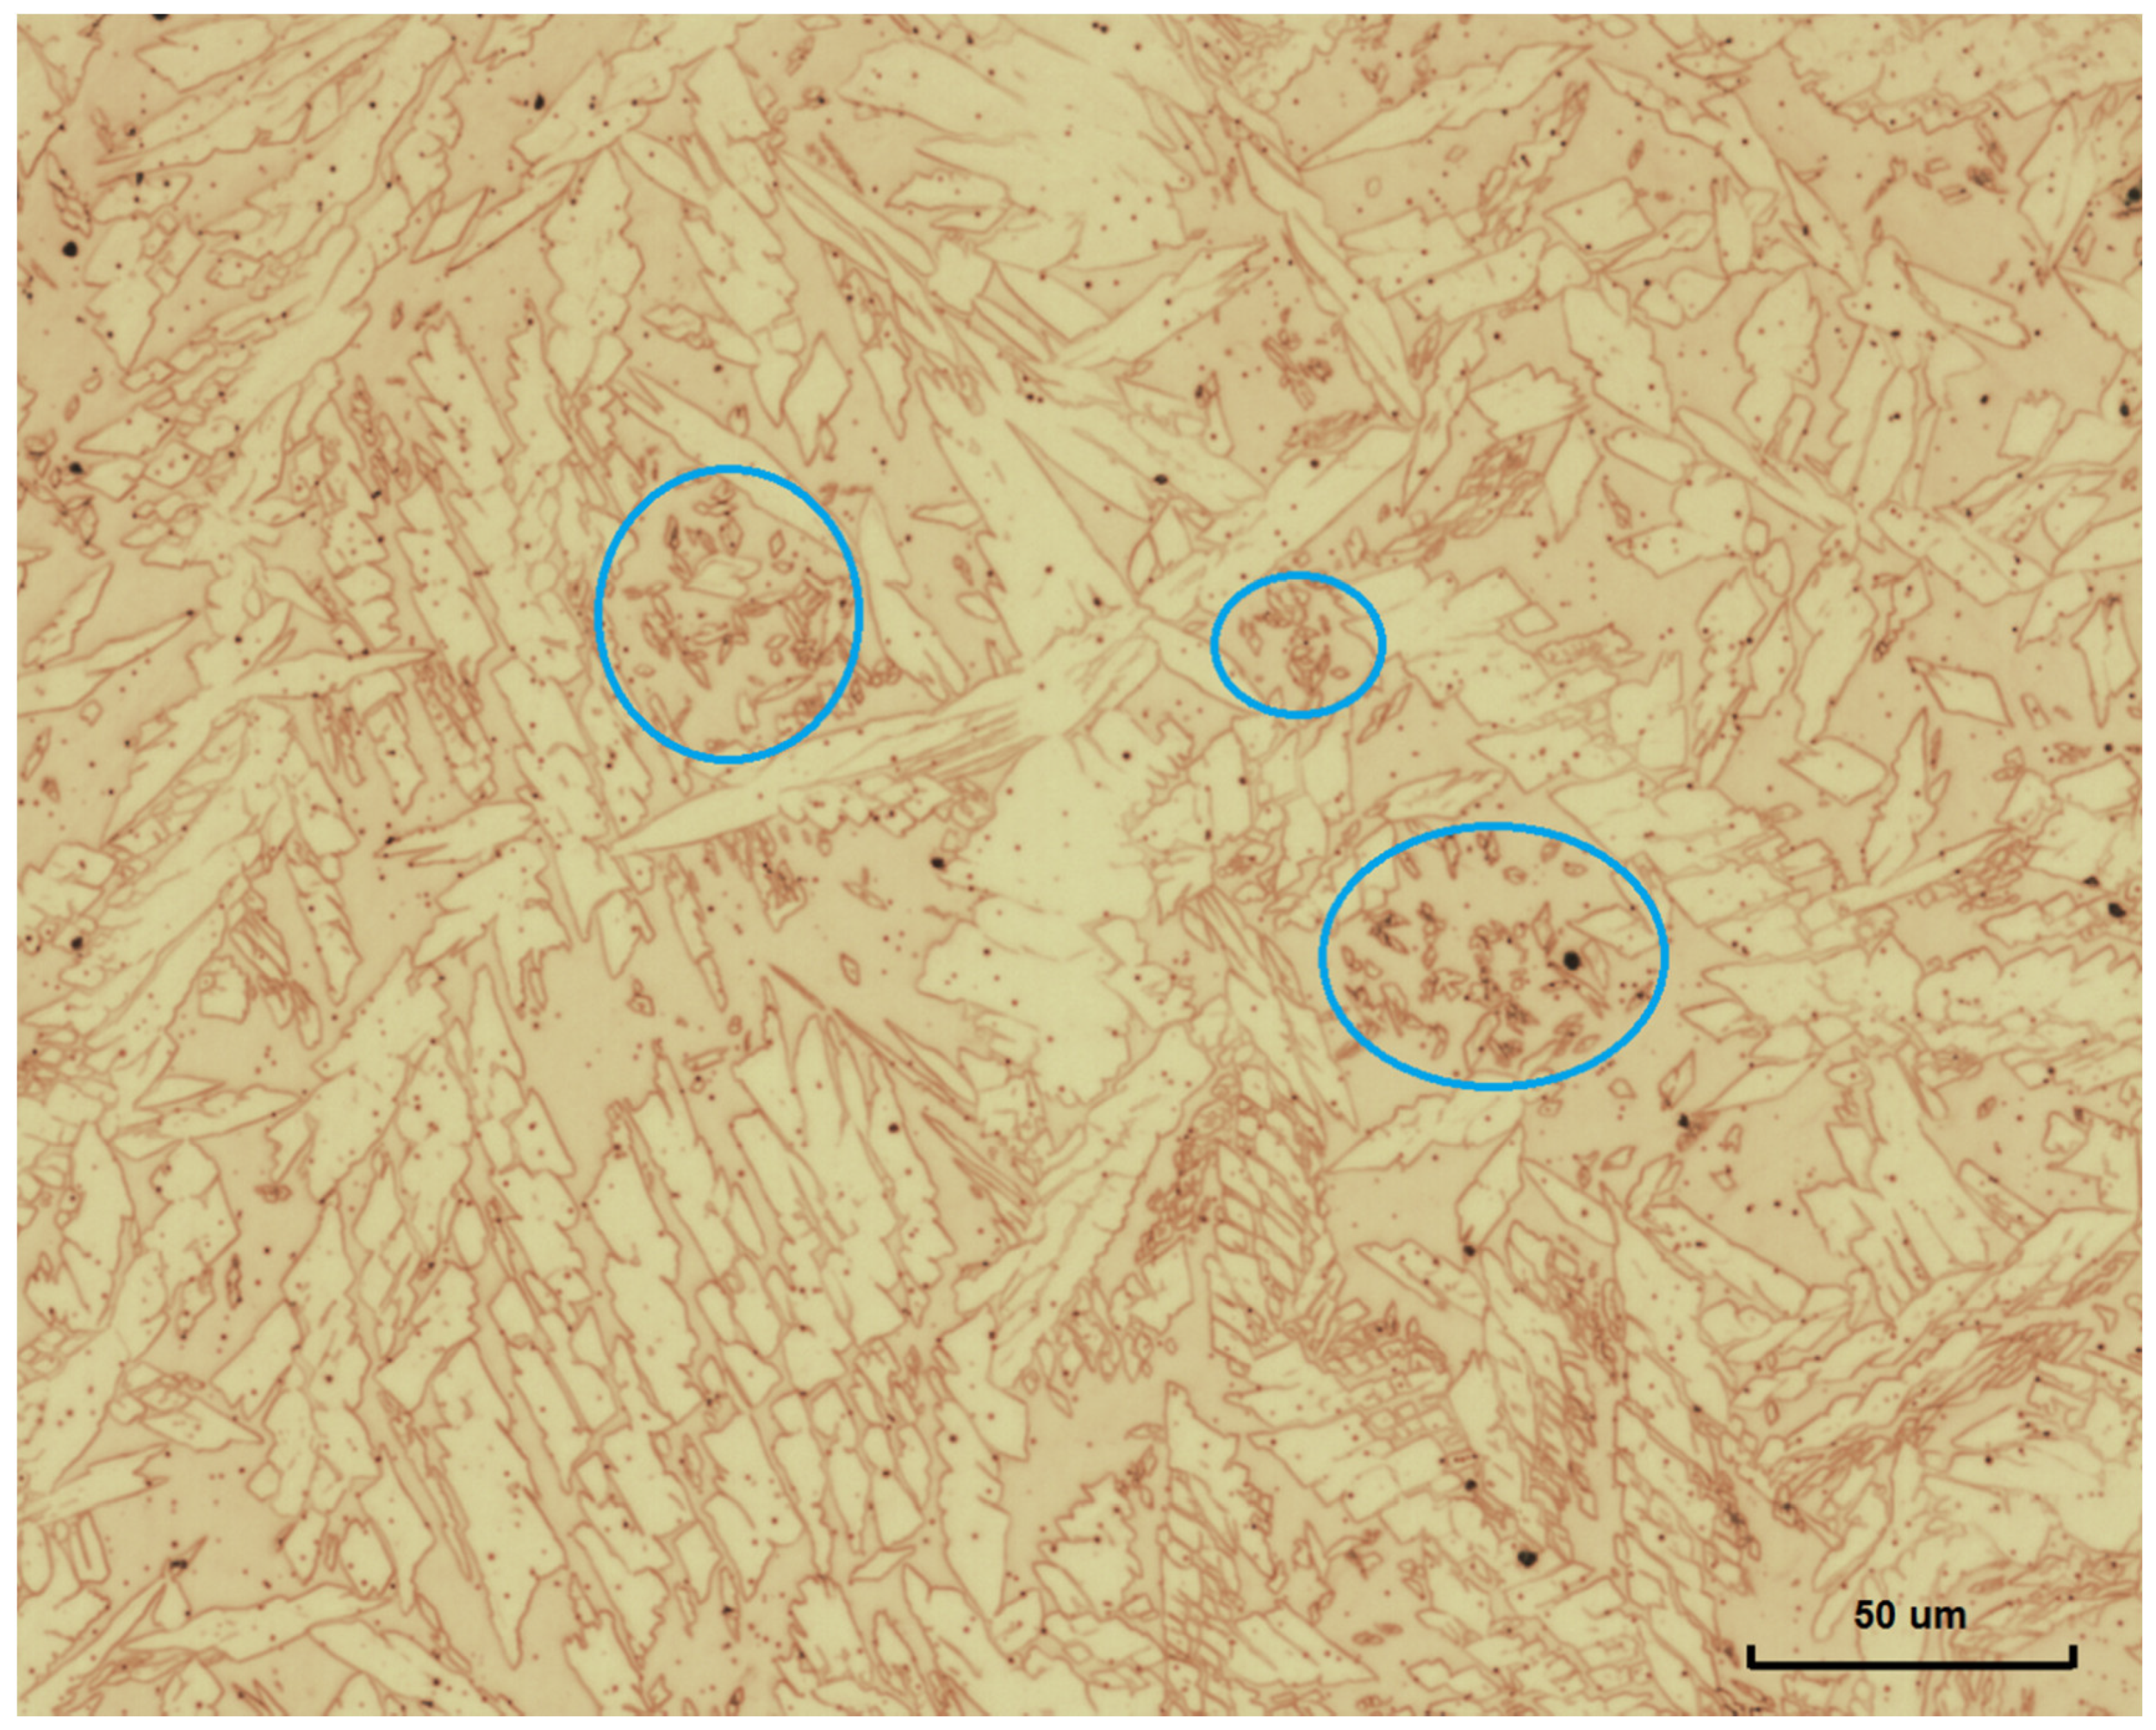
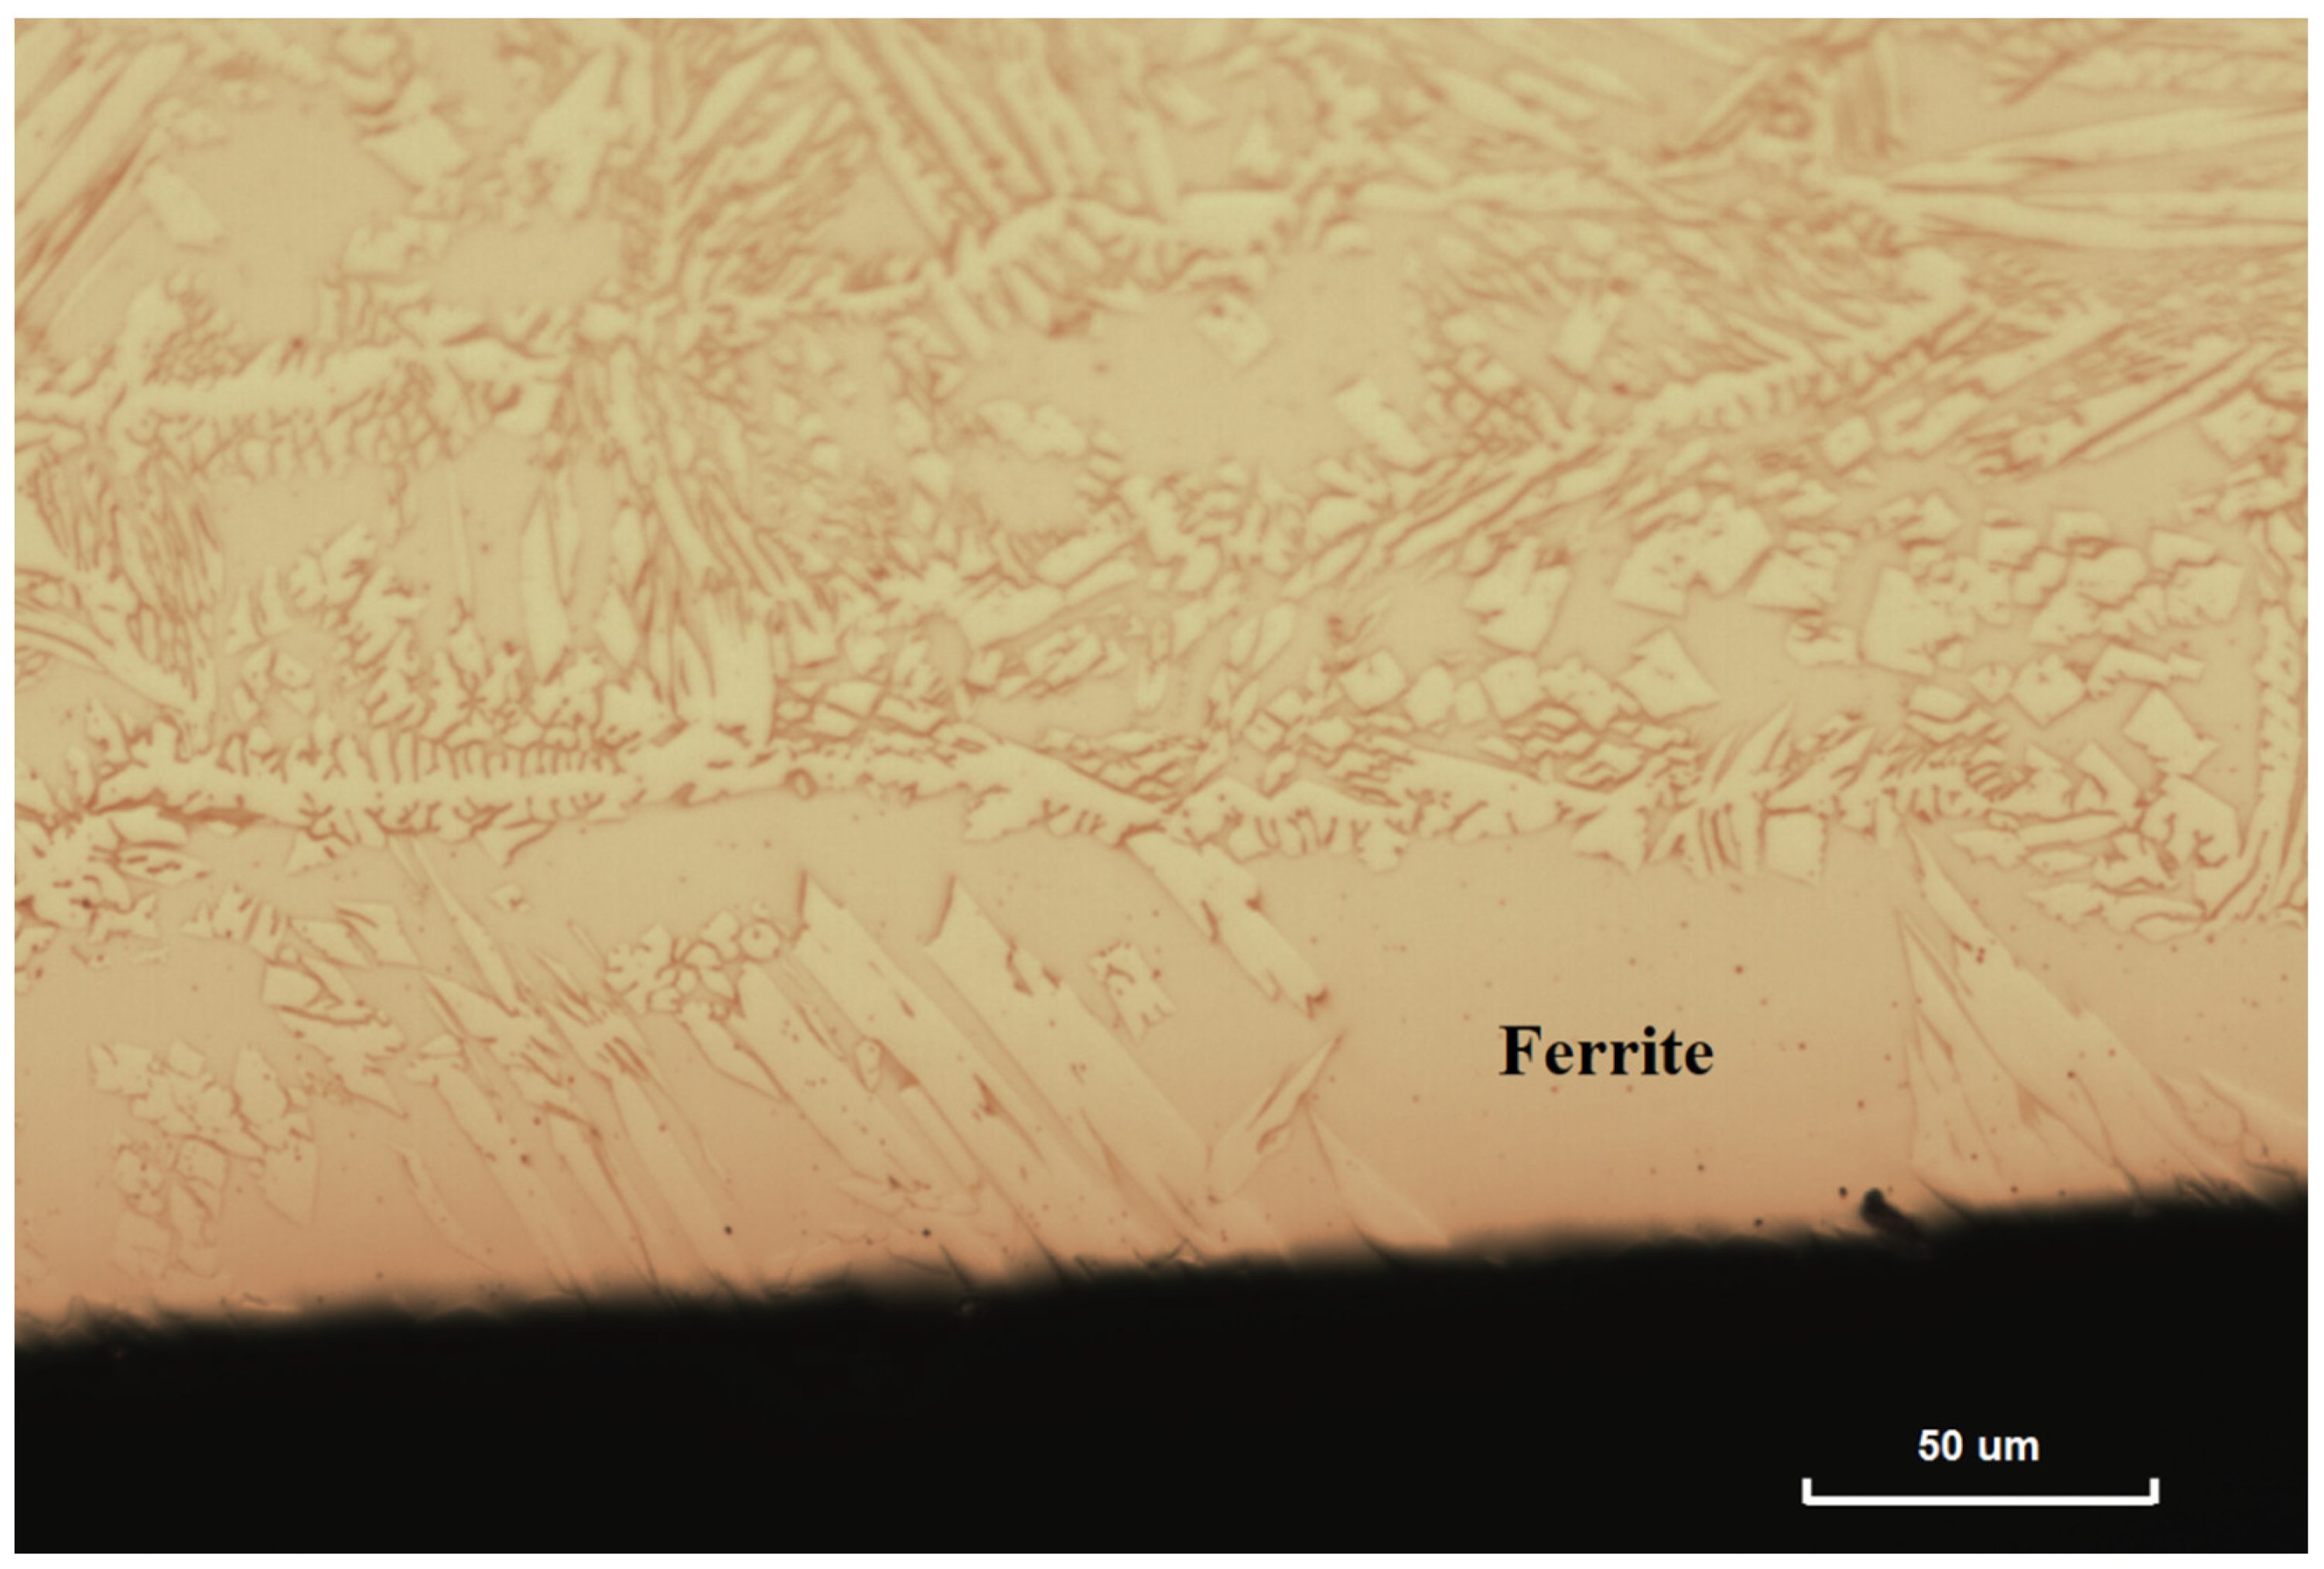
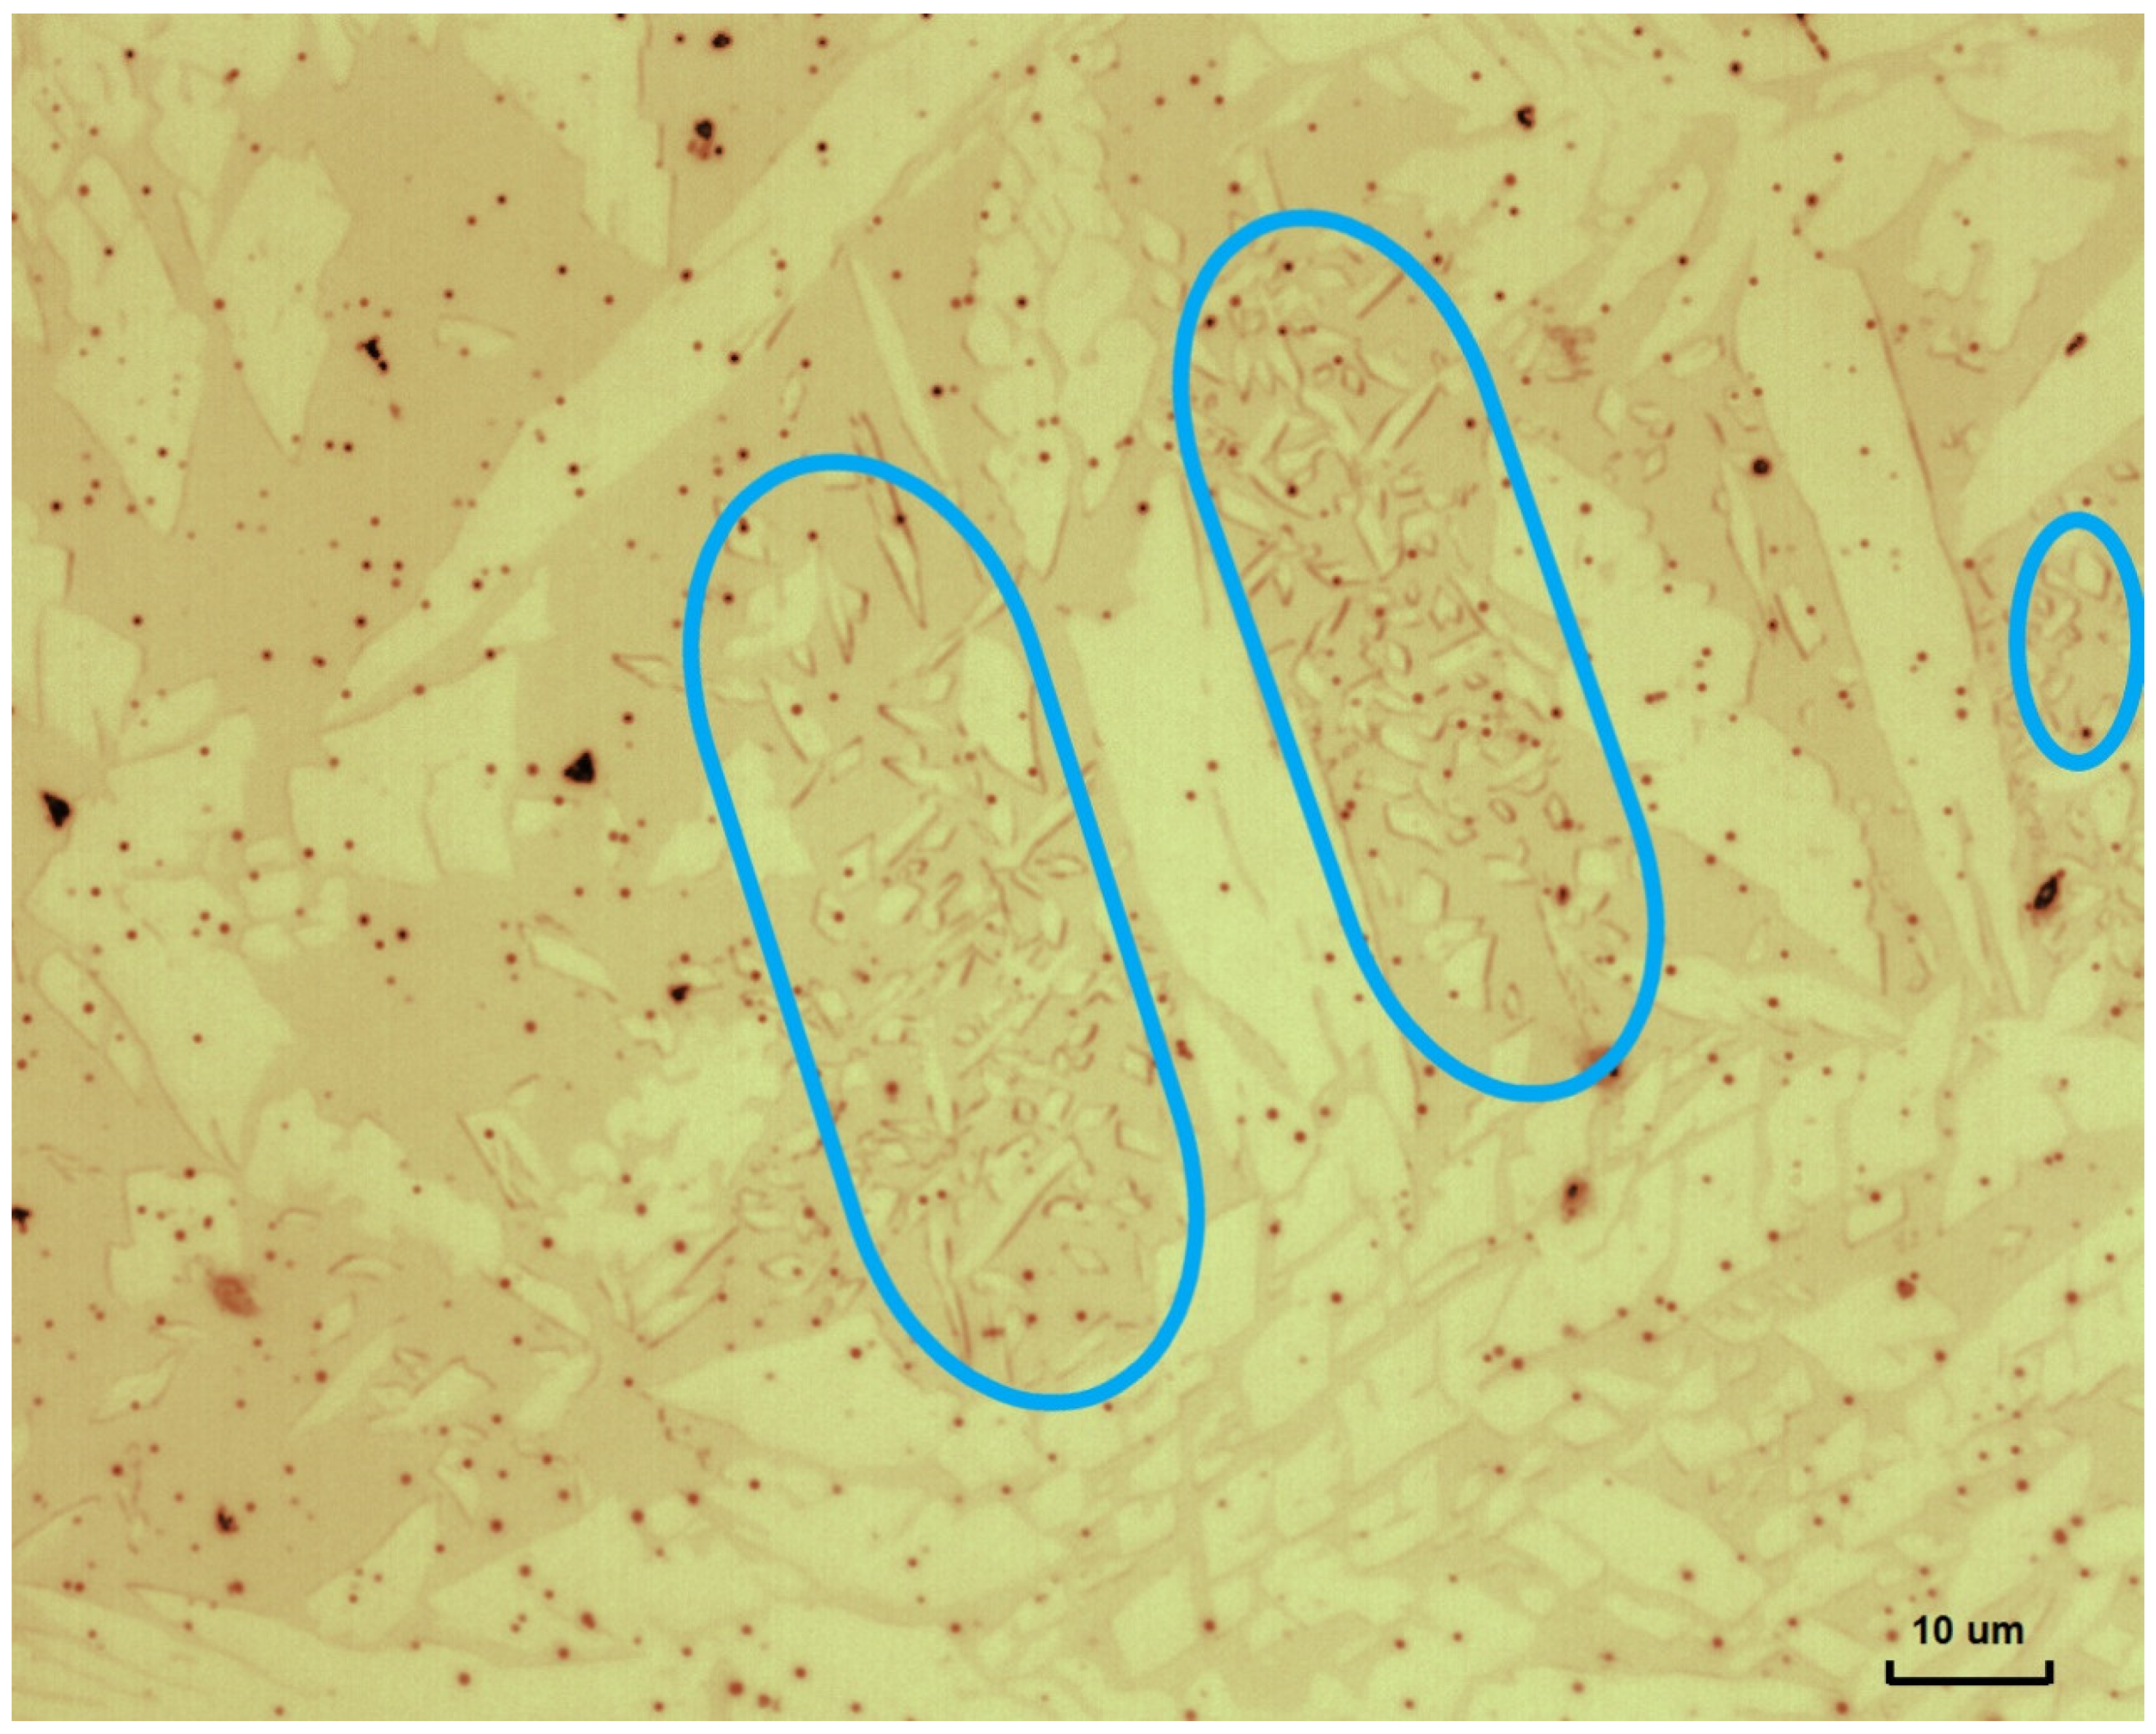
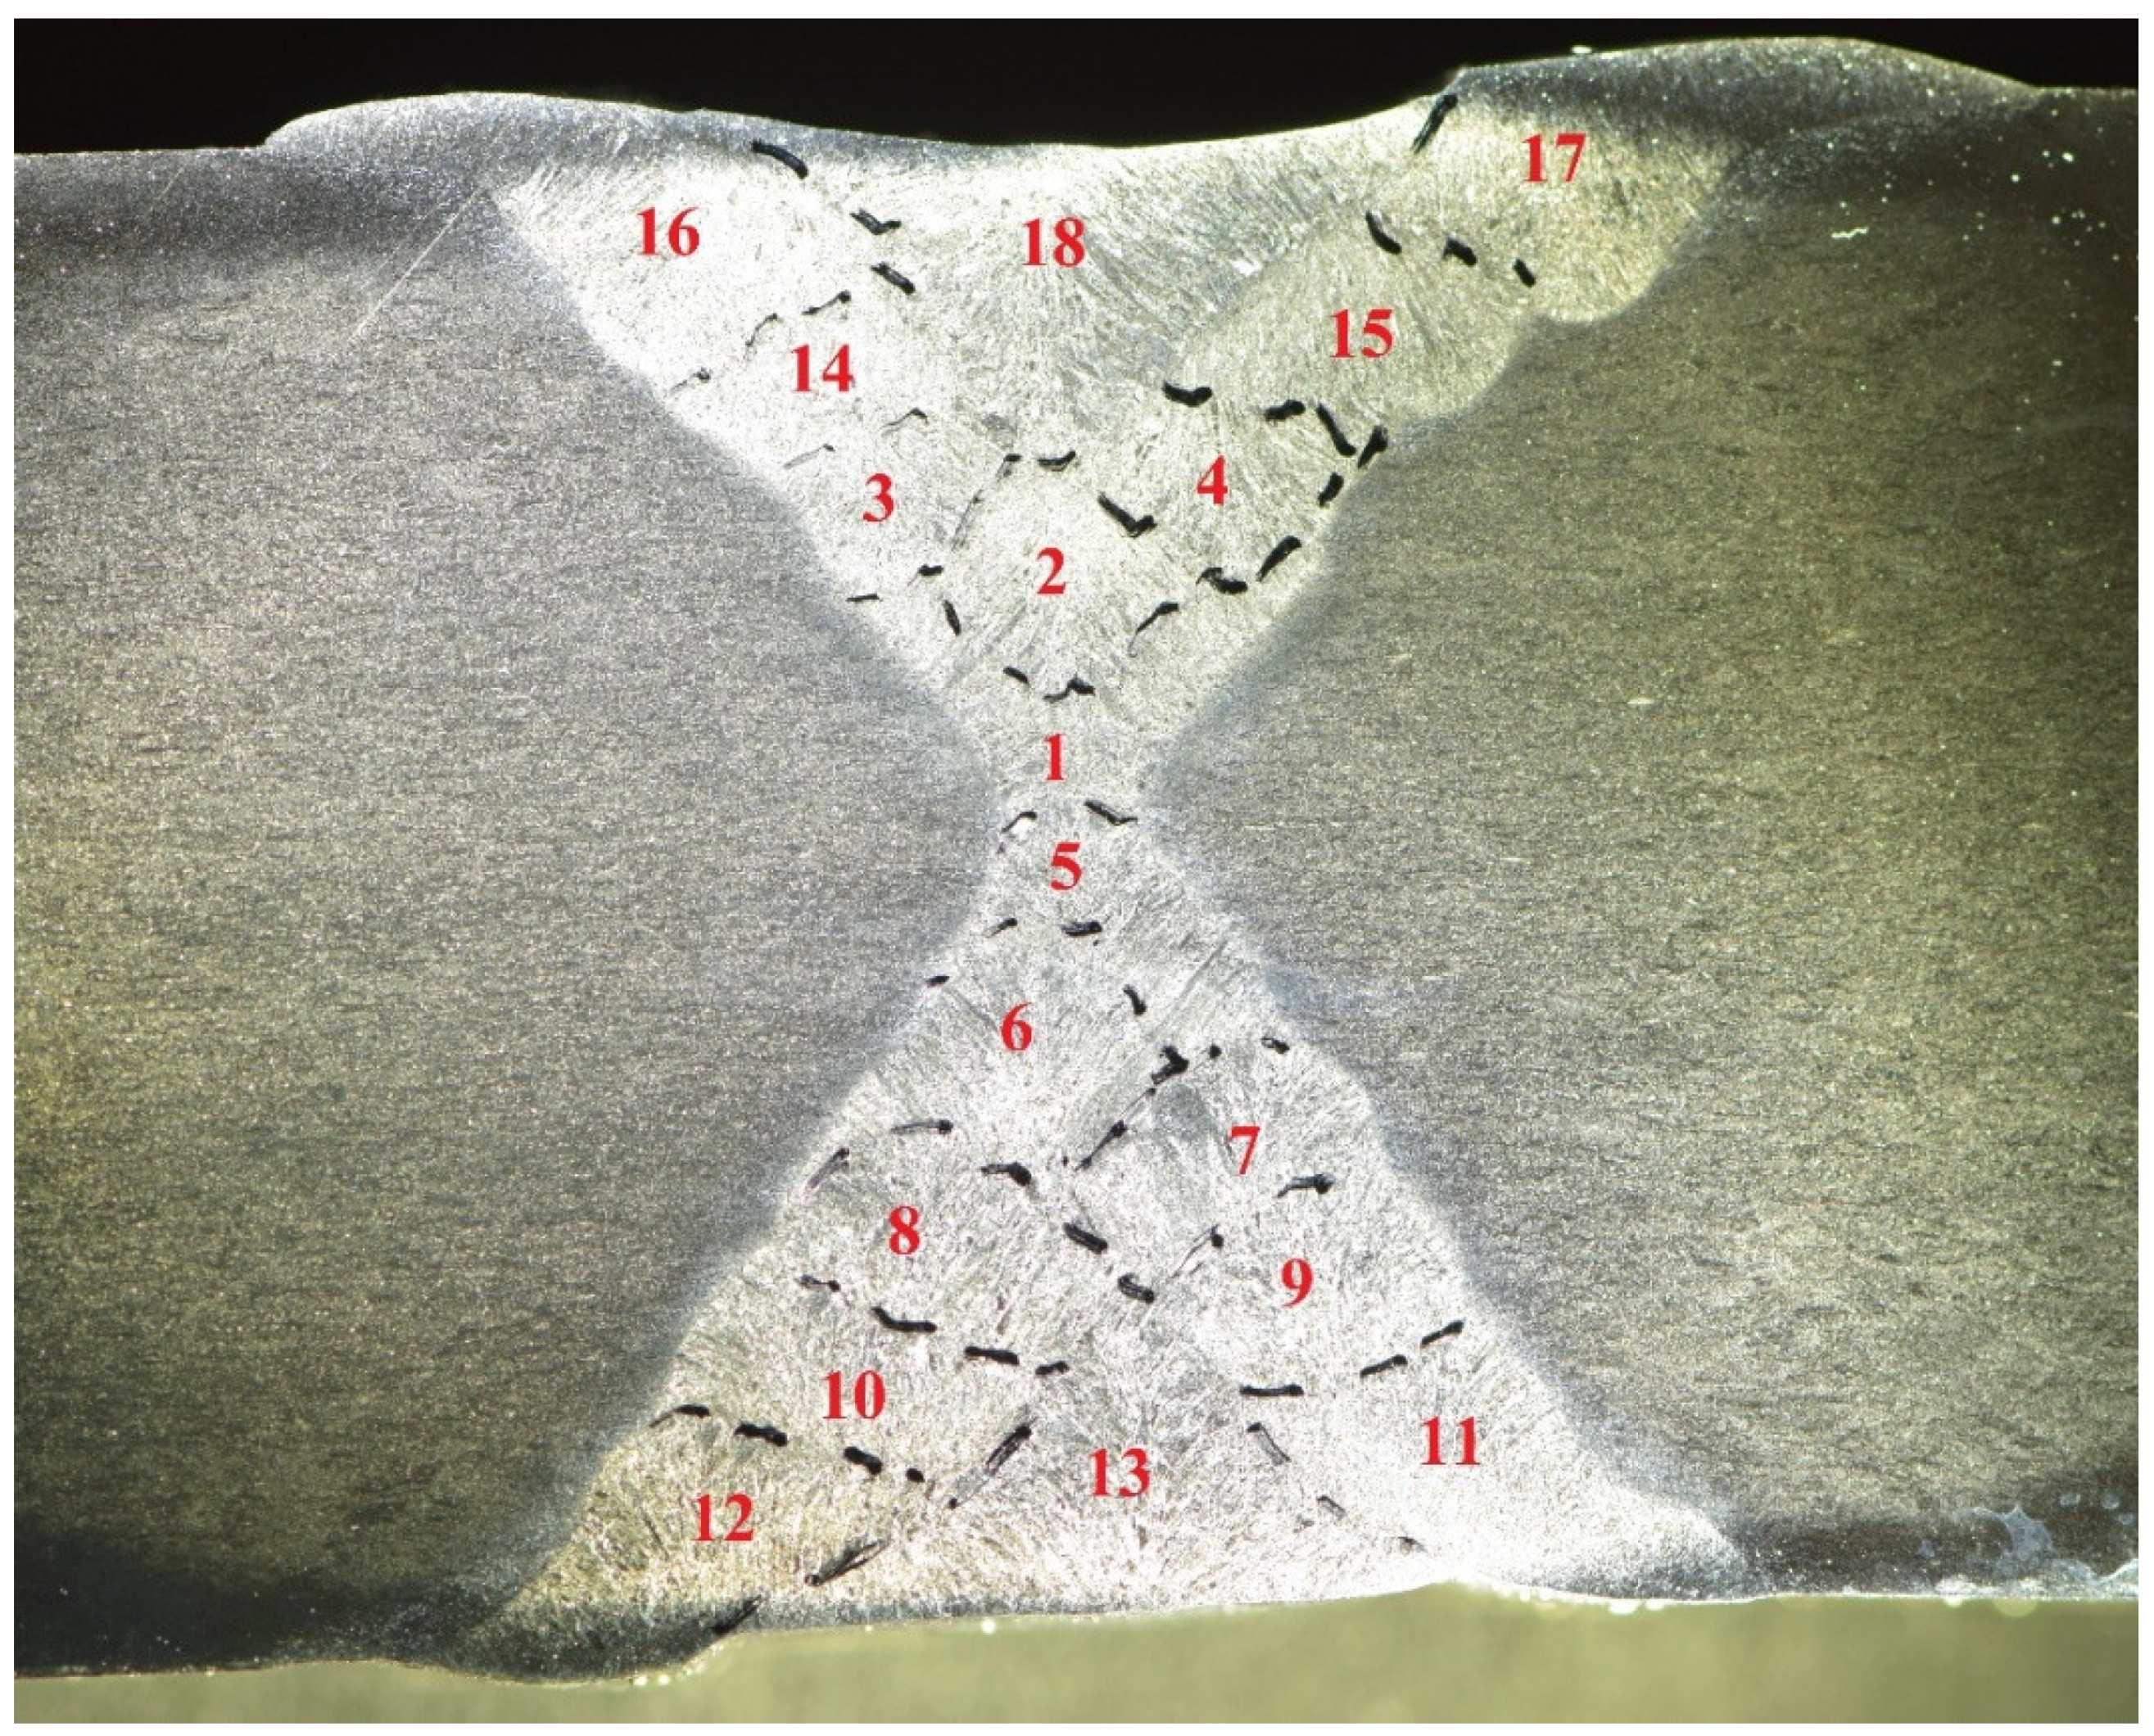
Figure 2 shows the macrograph of the weldment with the sequence of the 17 passes. Weld pass 1 was not visible because it was completely re-melted, most probably by weld passes 2 and 10. The microstructural map showing the location of intermetallics and secondary phases observed is shown in Figure 3. Nitrides were found in the HAZ and weld passes 2, 4, 7, and 10. Sigma-phase was only found in a small area of weld pass 4 close to weld passes 5, 6, and 8 (Figure 4). Secondary austenite was found in greater amounts in weld passes 3, 5, 6, 11, 12, 16, and close to the boundary with the closest subsequent weld passes (Figure 5). Newly formed austenite on previous ferrite/austenite boundaries was also observed to a great extent. Nitrides were mainly located in the HAZ, but it was possible to observe them in weld passes 2, 4, 7, 8, and 10. Secondary austenite was not found in the HAZ. Both the root and face surfaces showed a highly ferritic microstructure, as illustrated in Figure 6.
3.1.2. SA-H Weldment
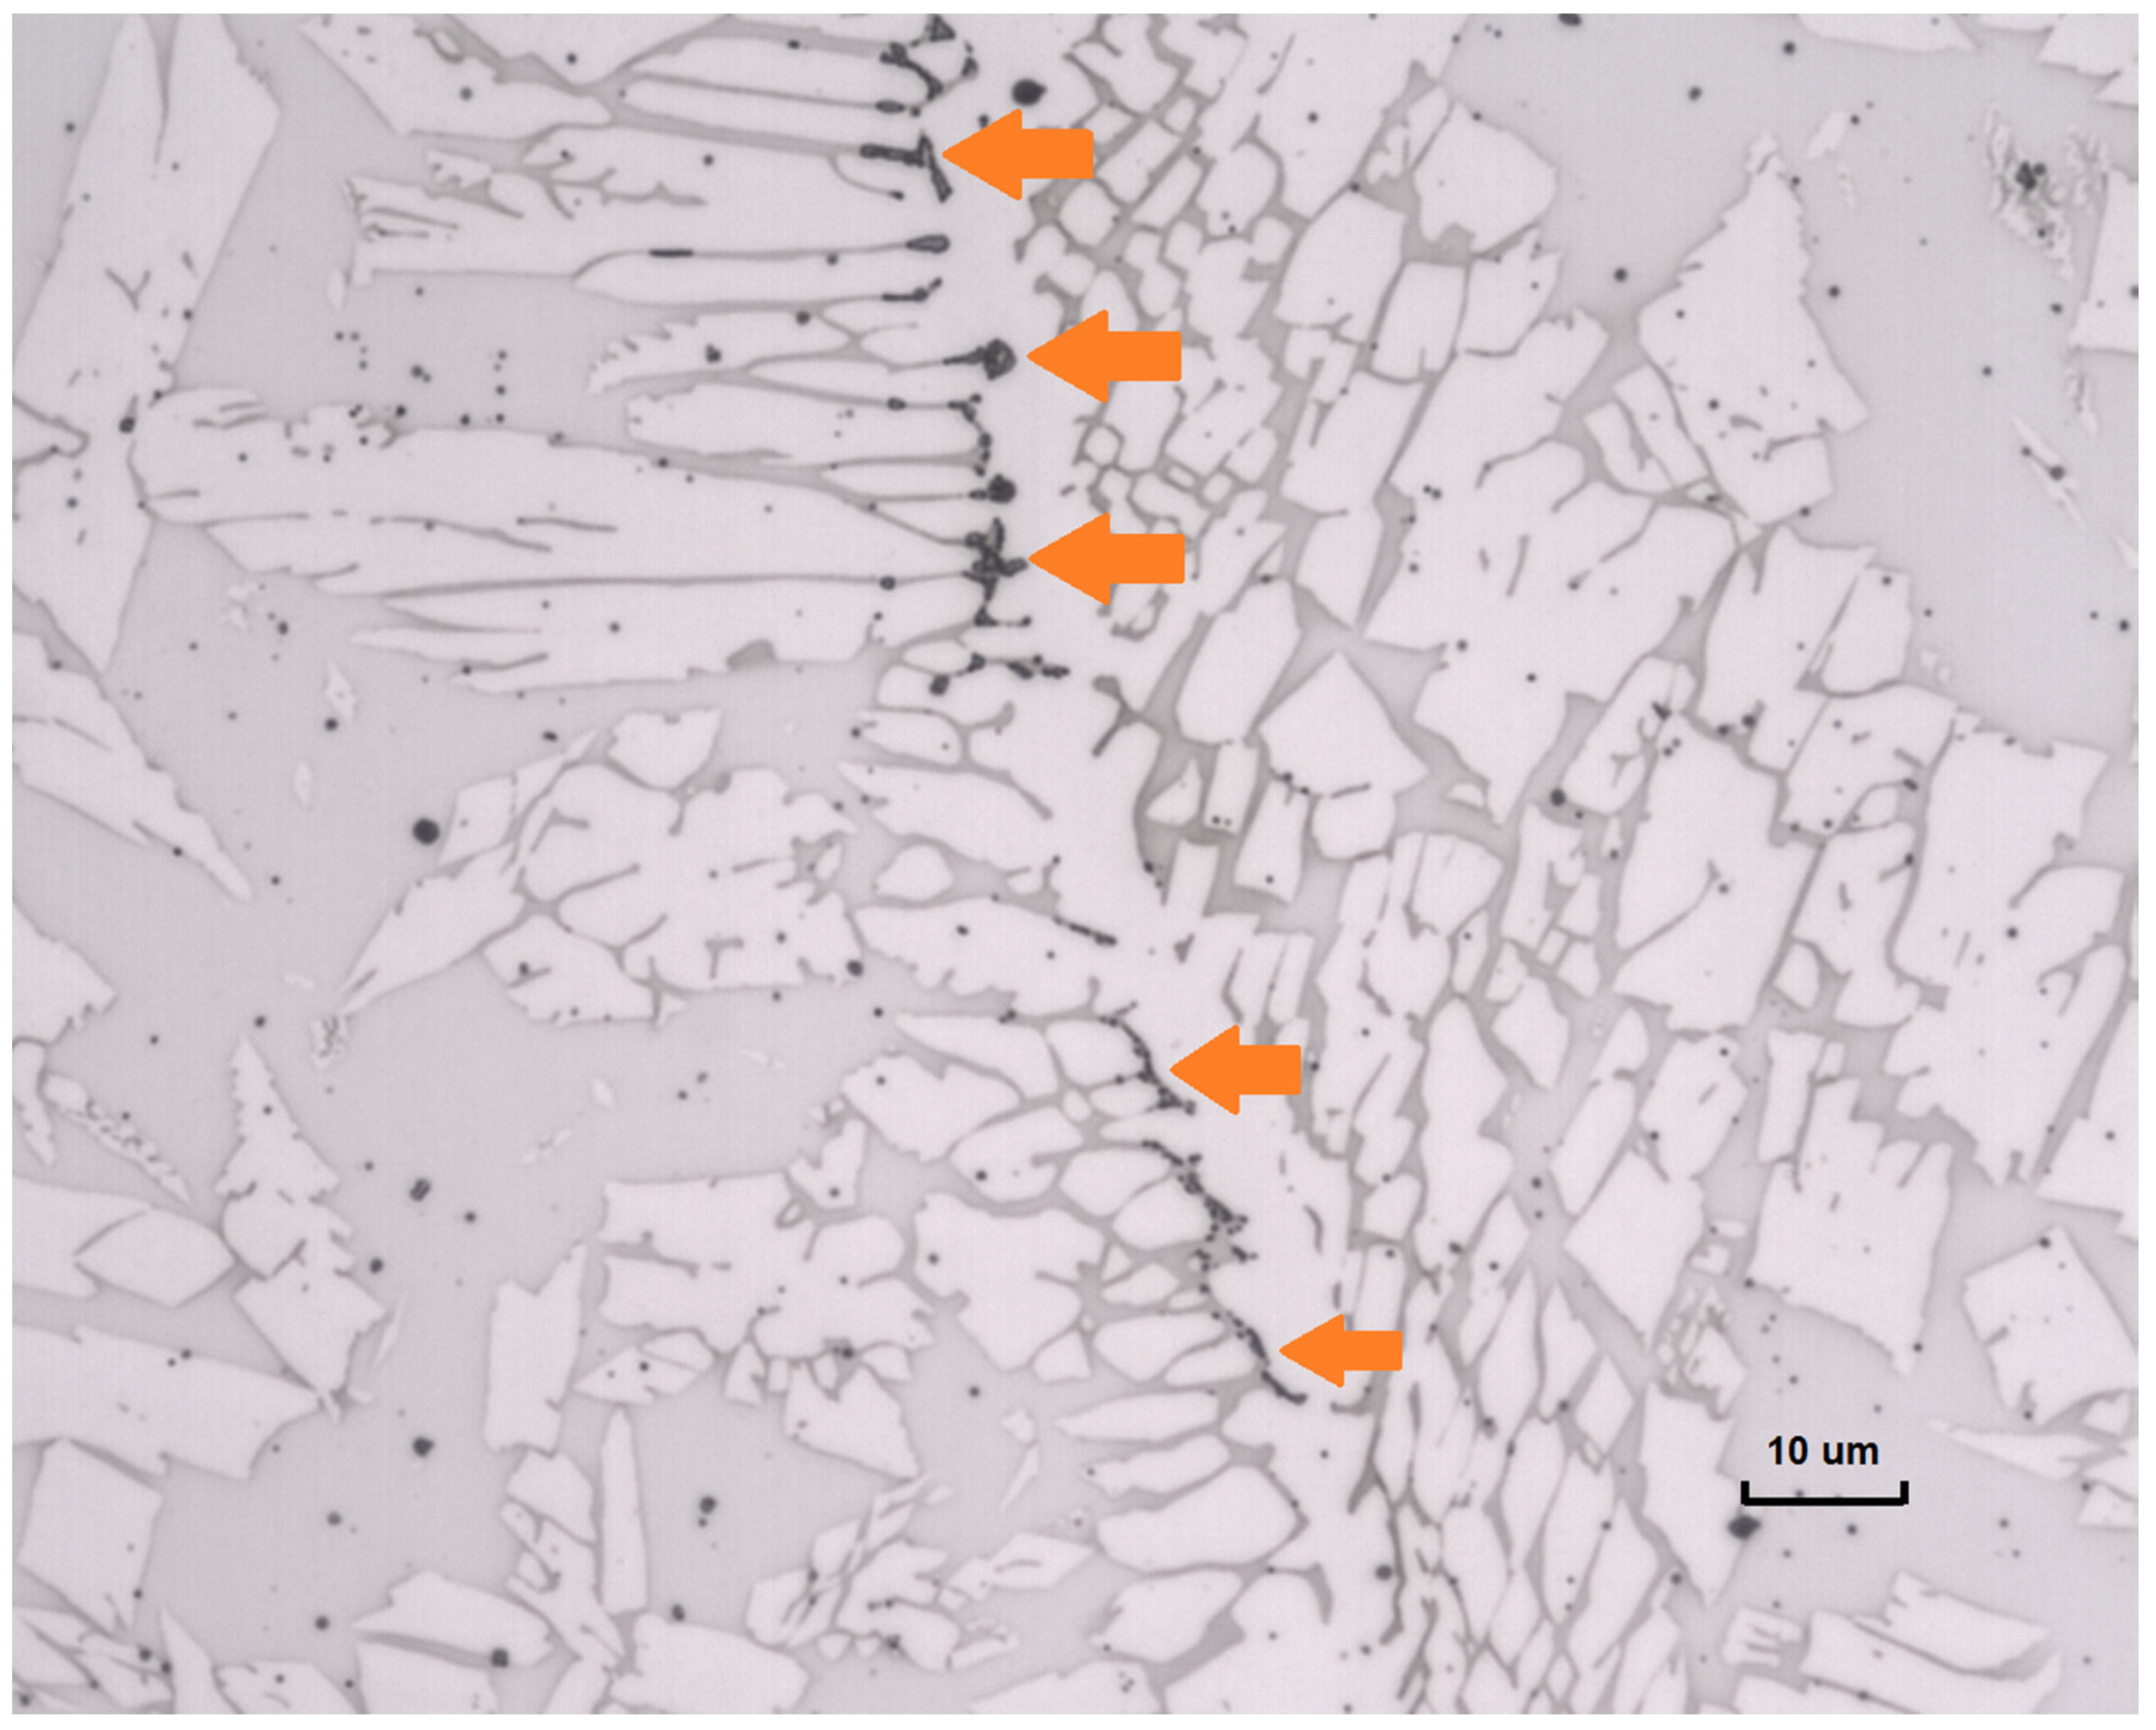
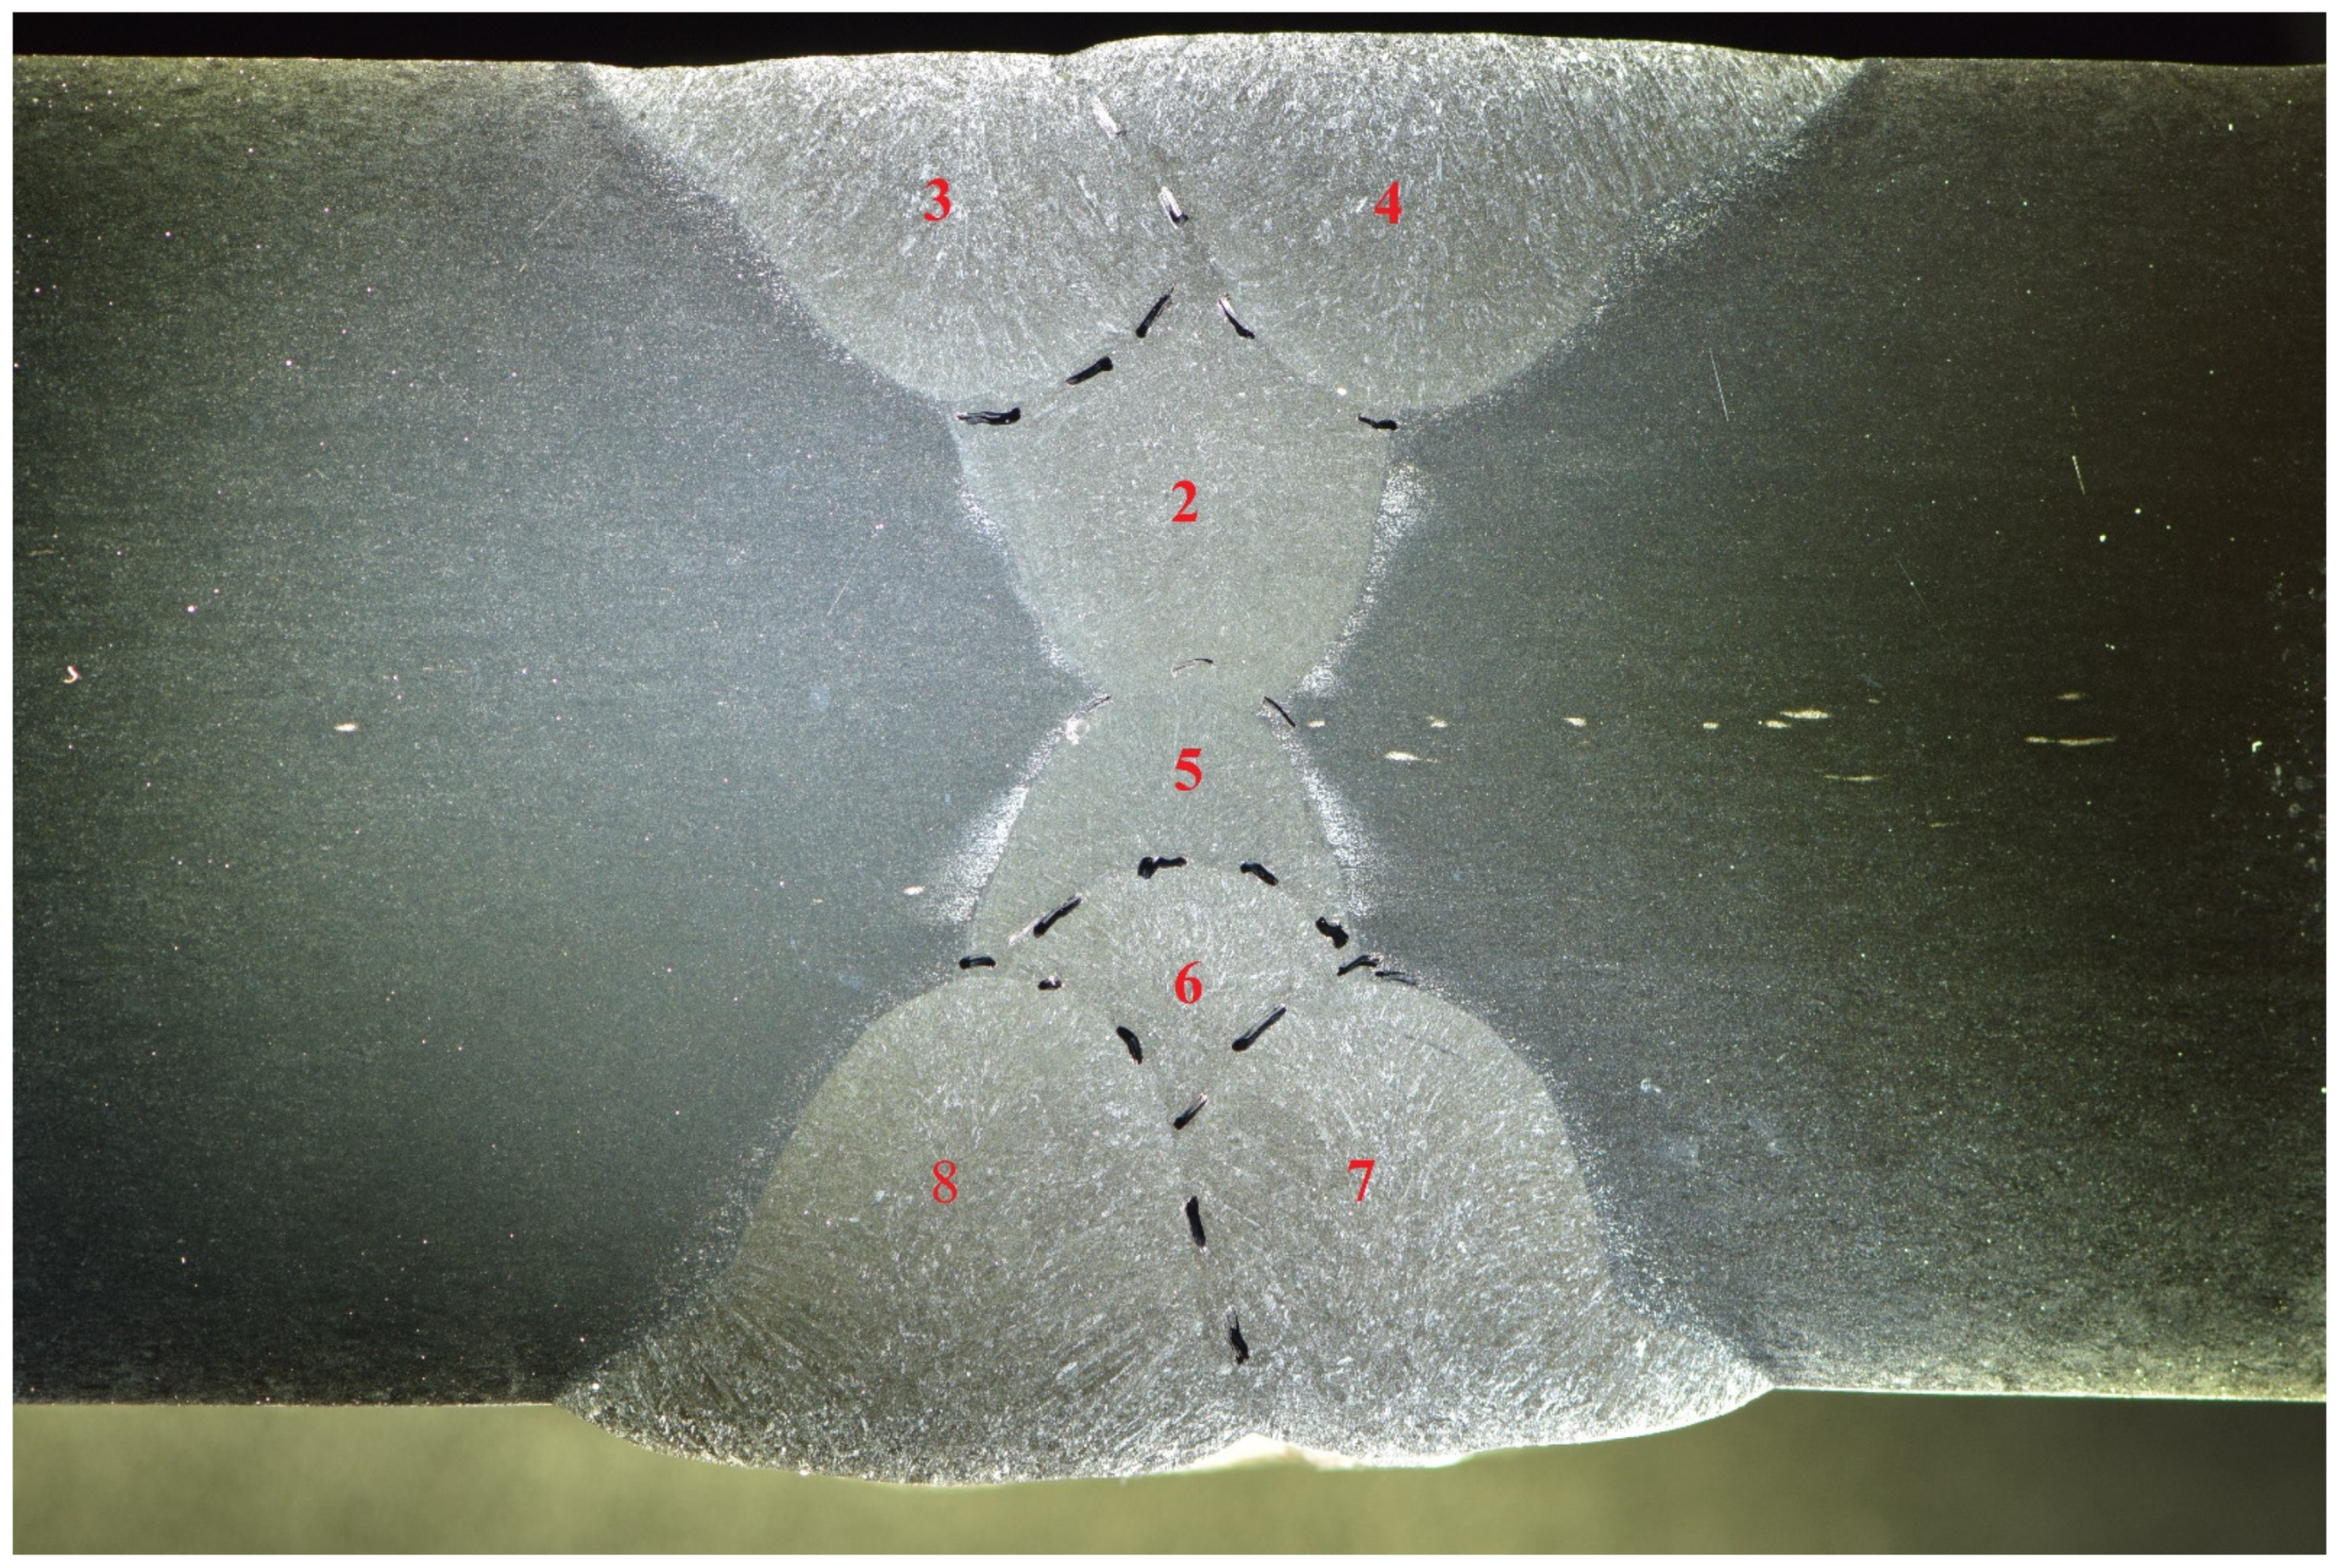
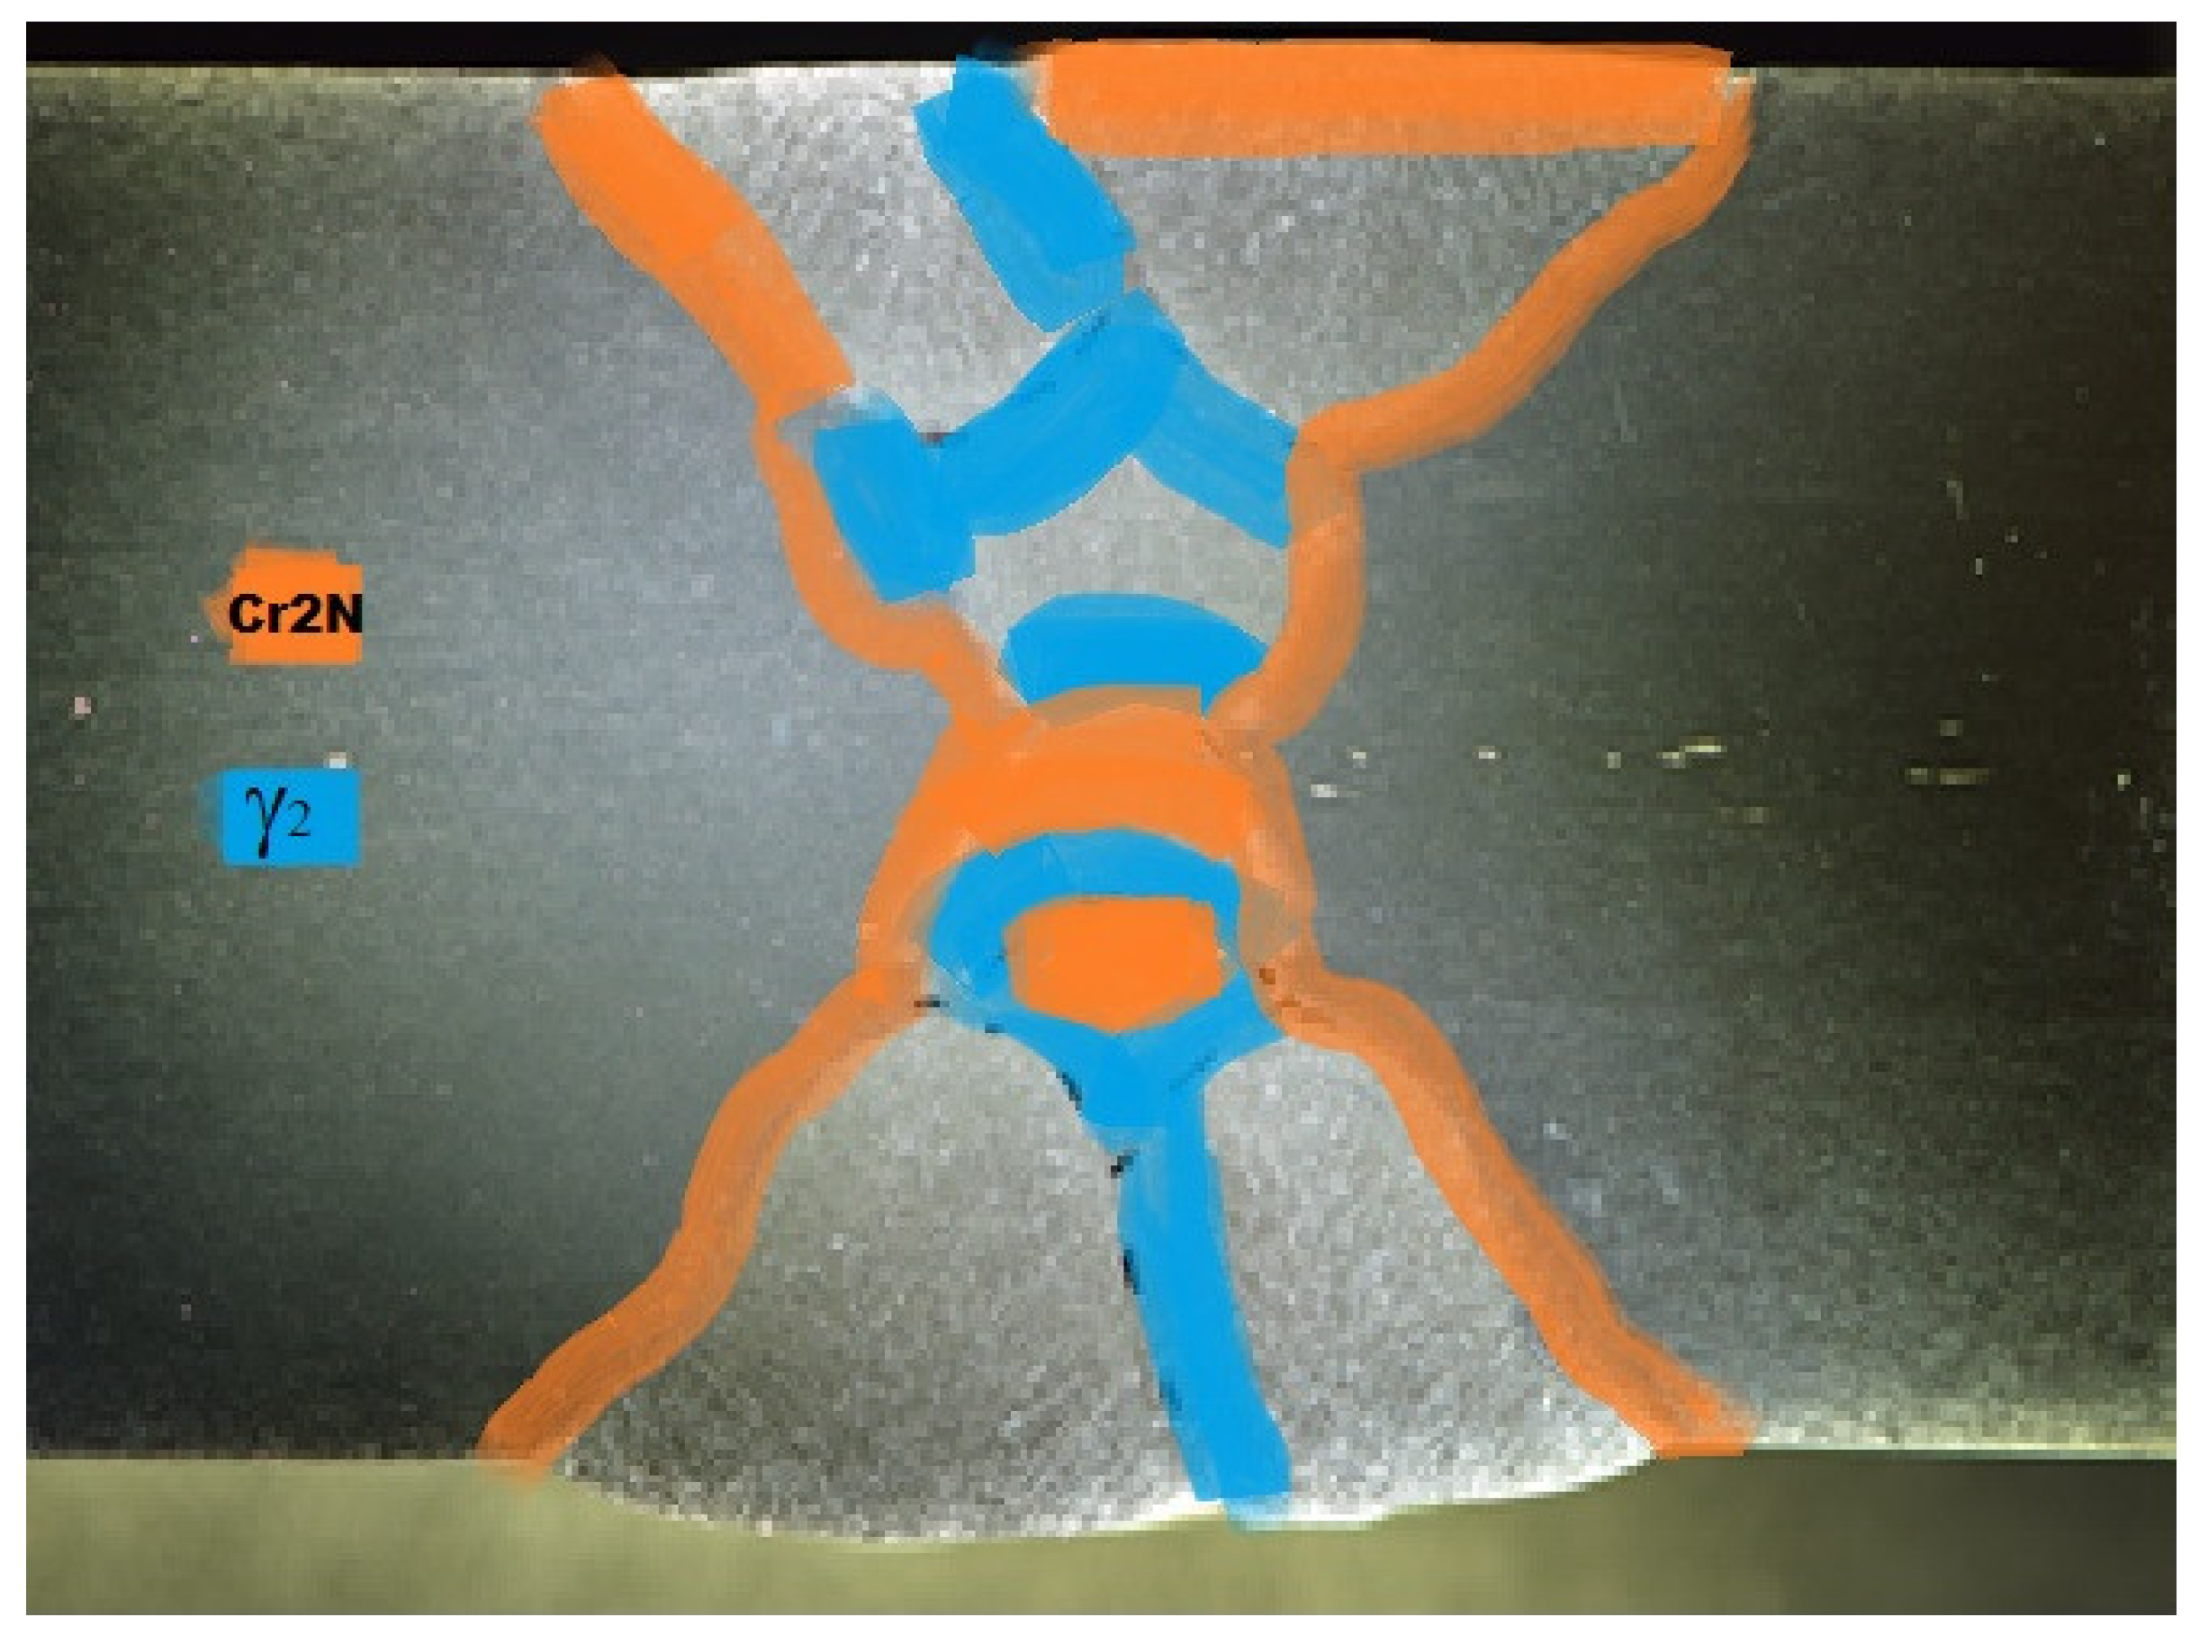
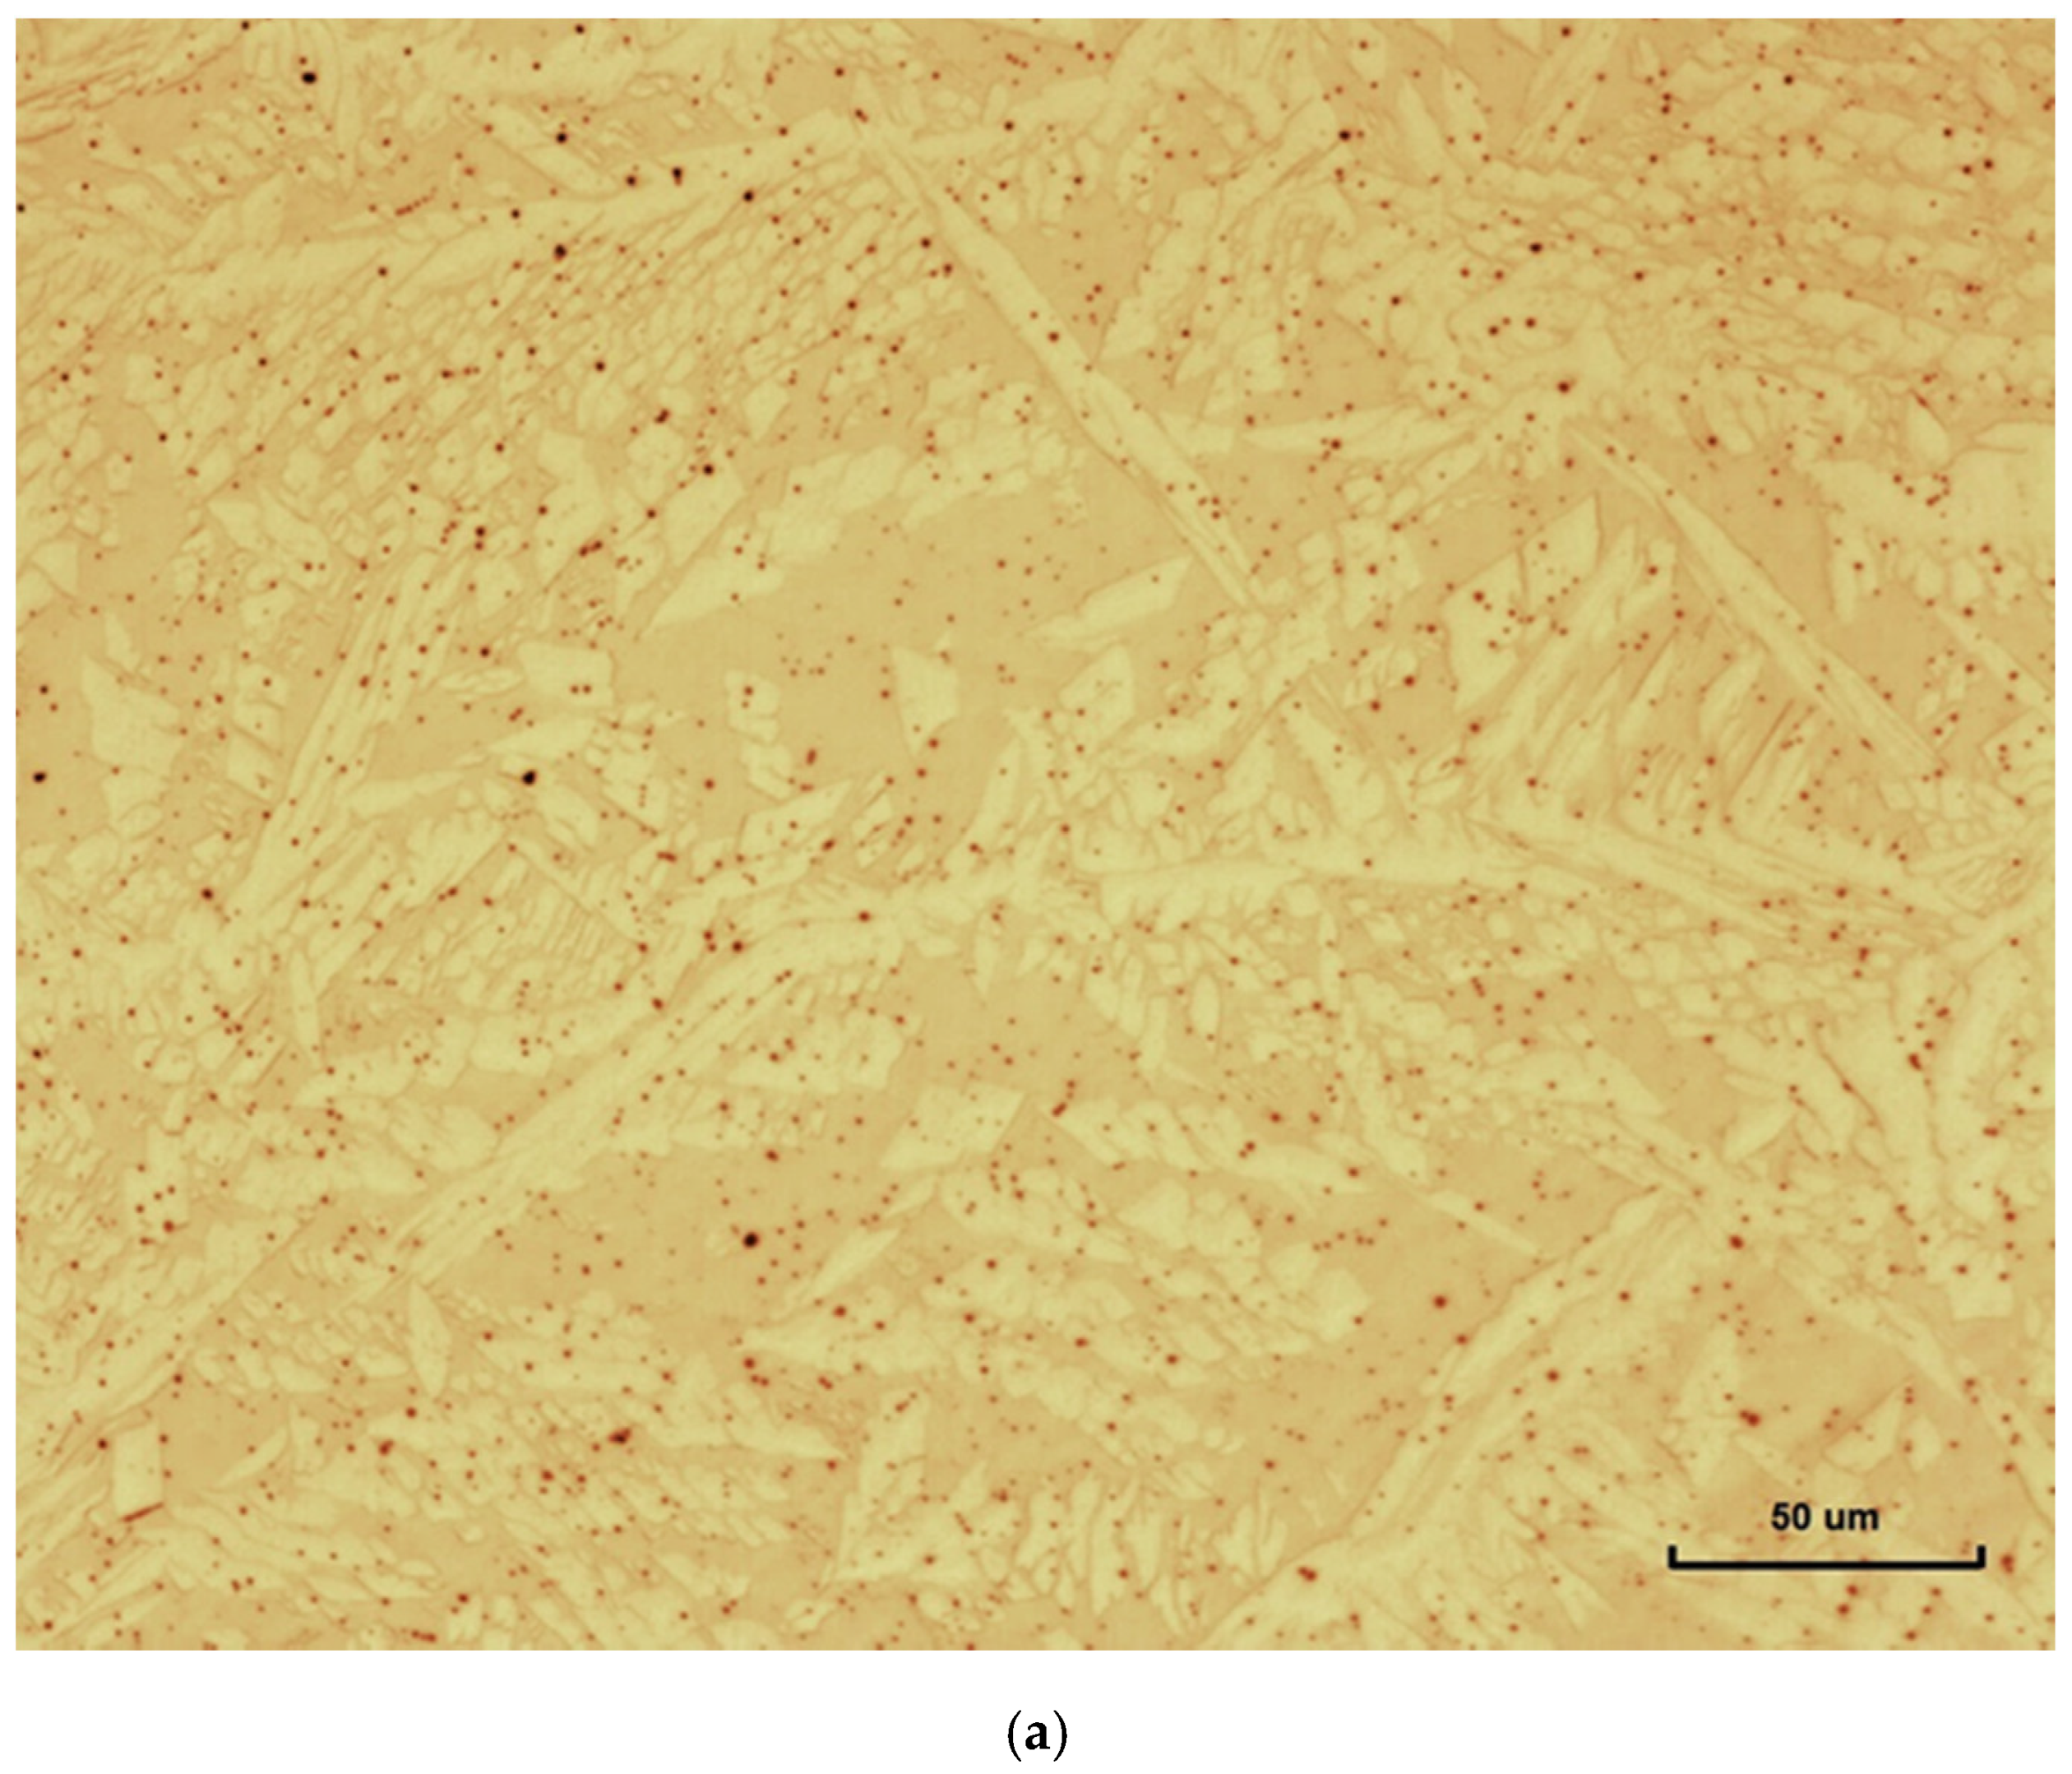
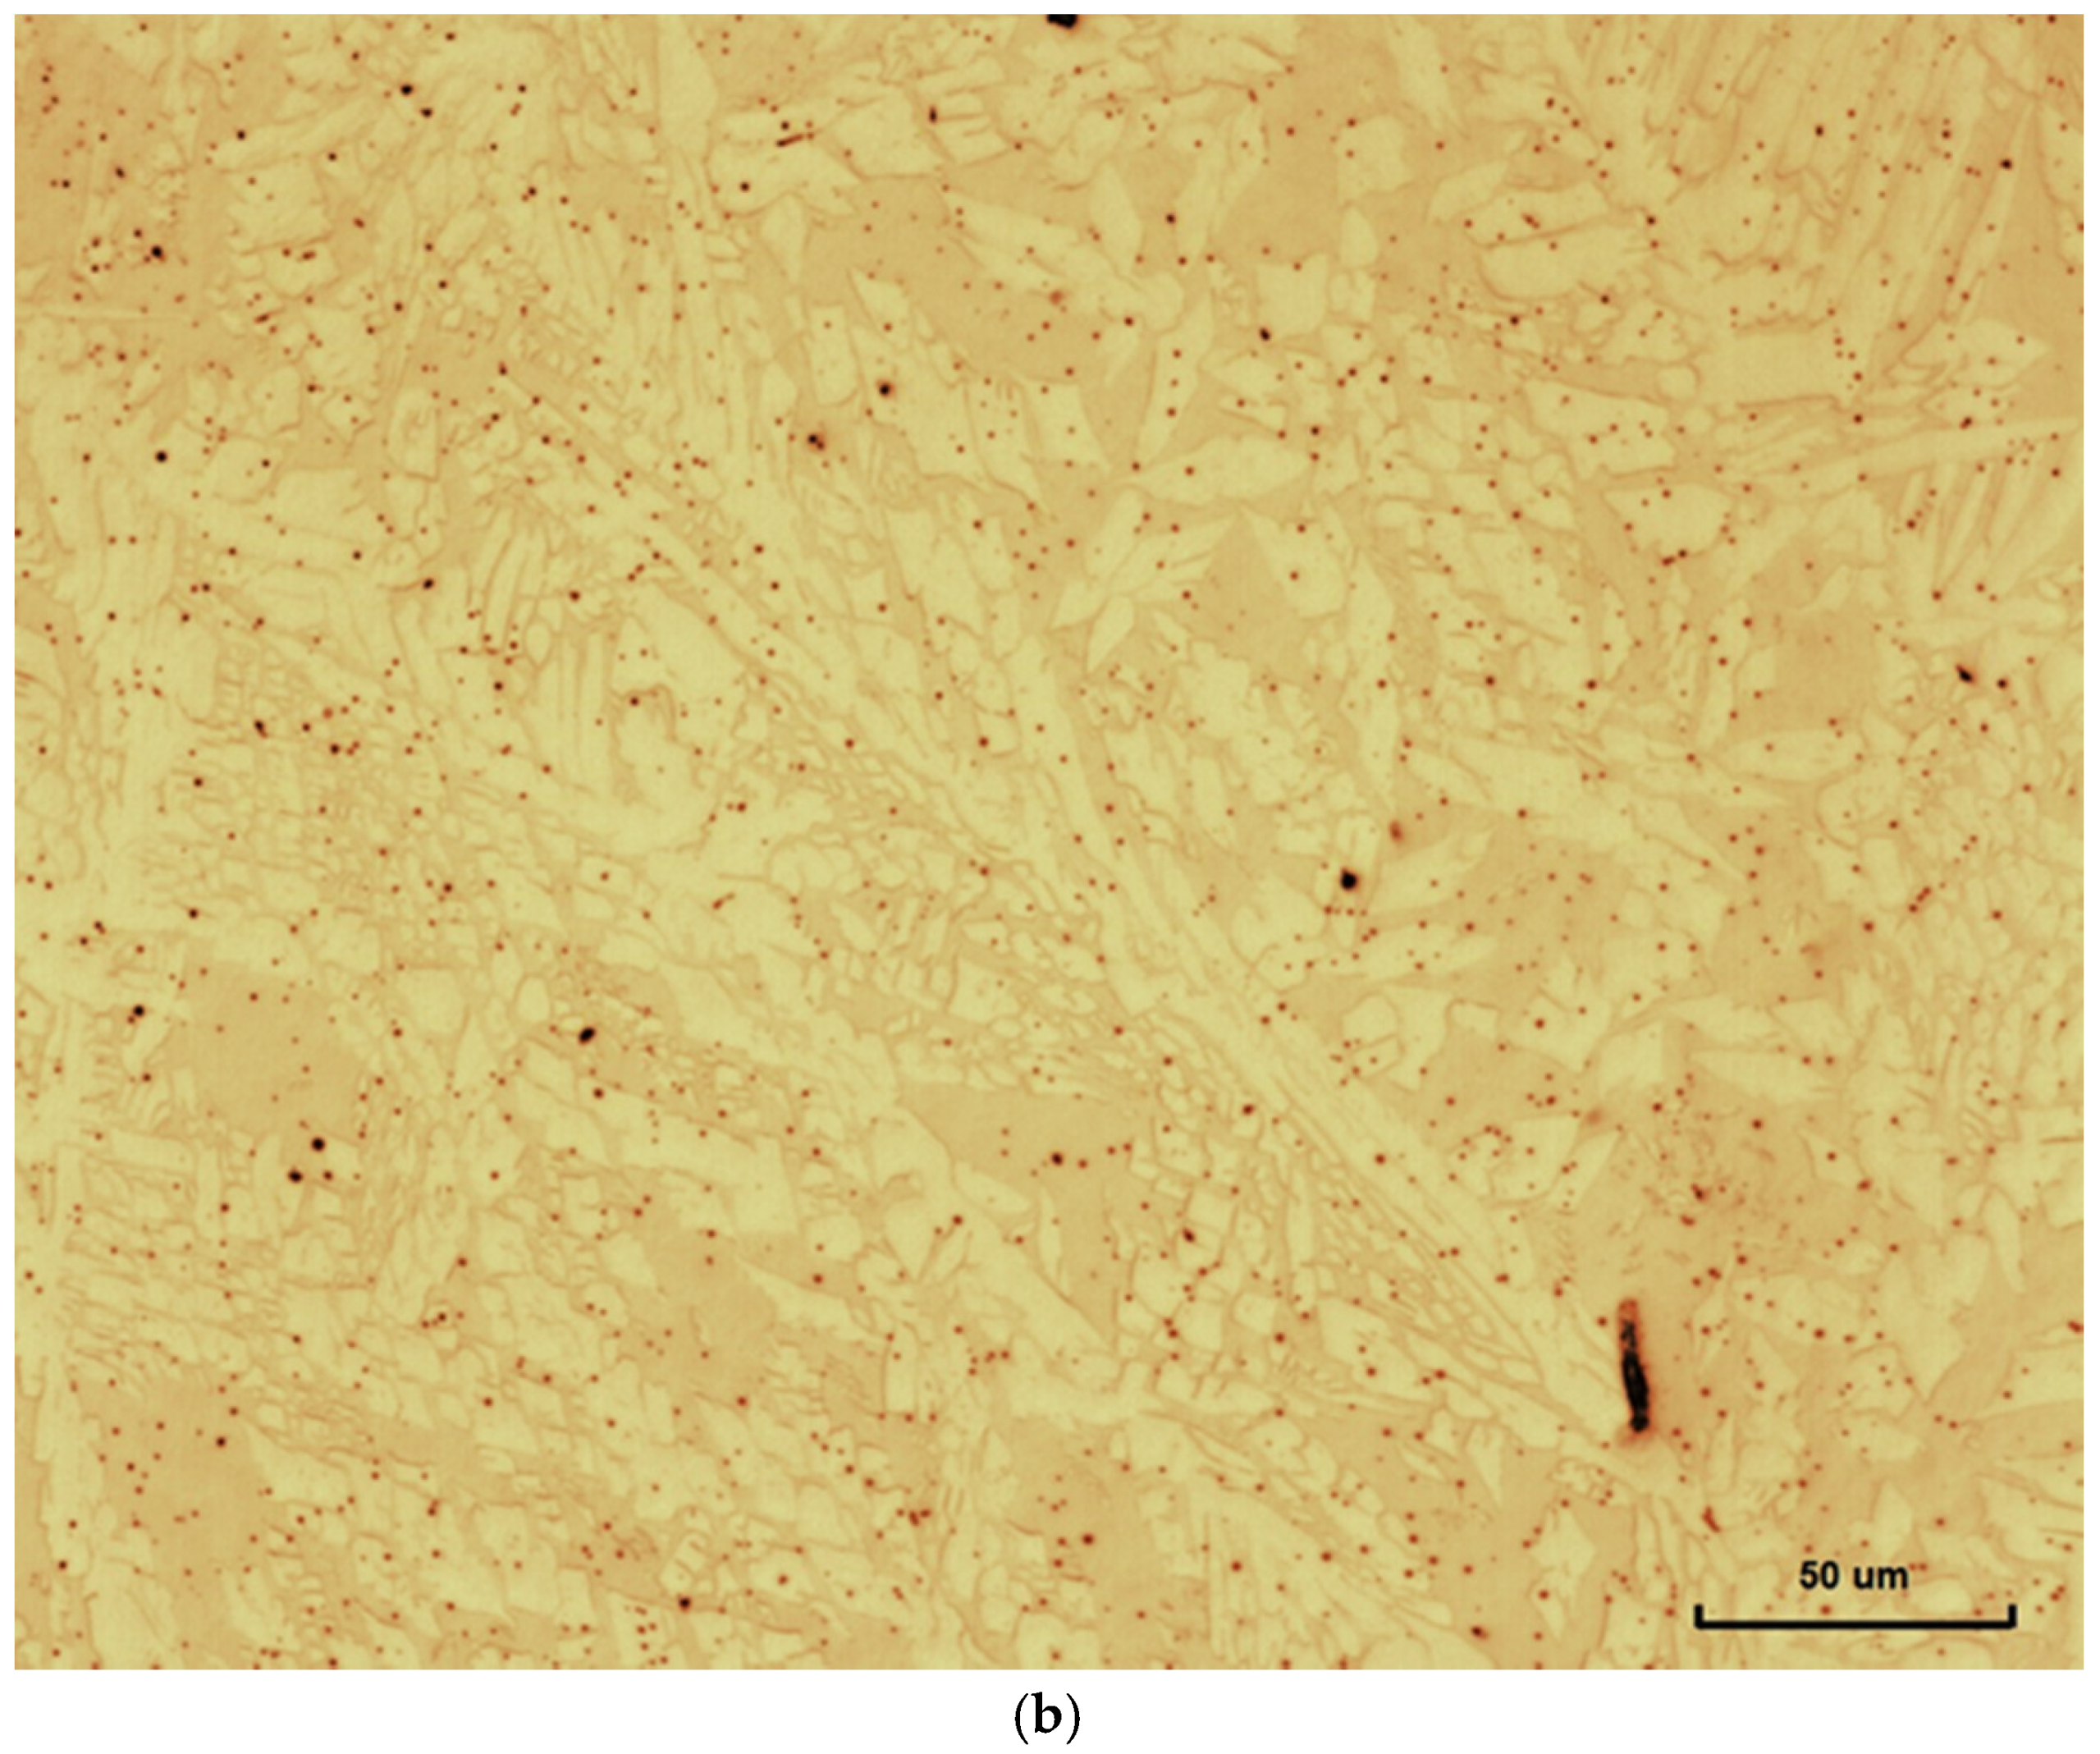
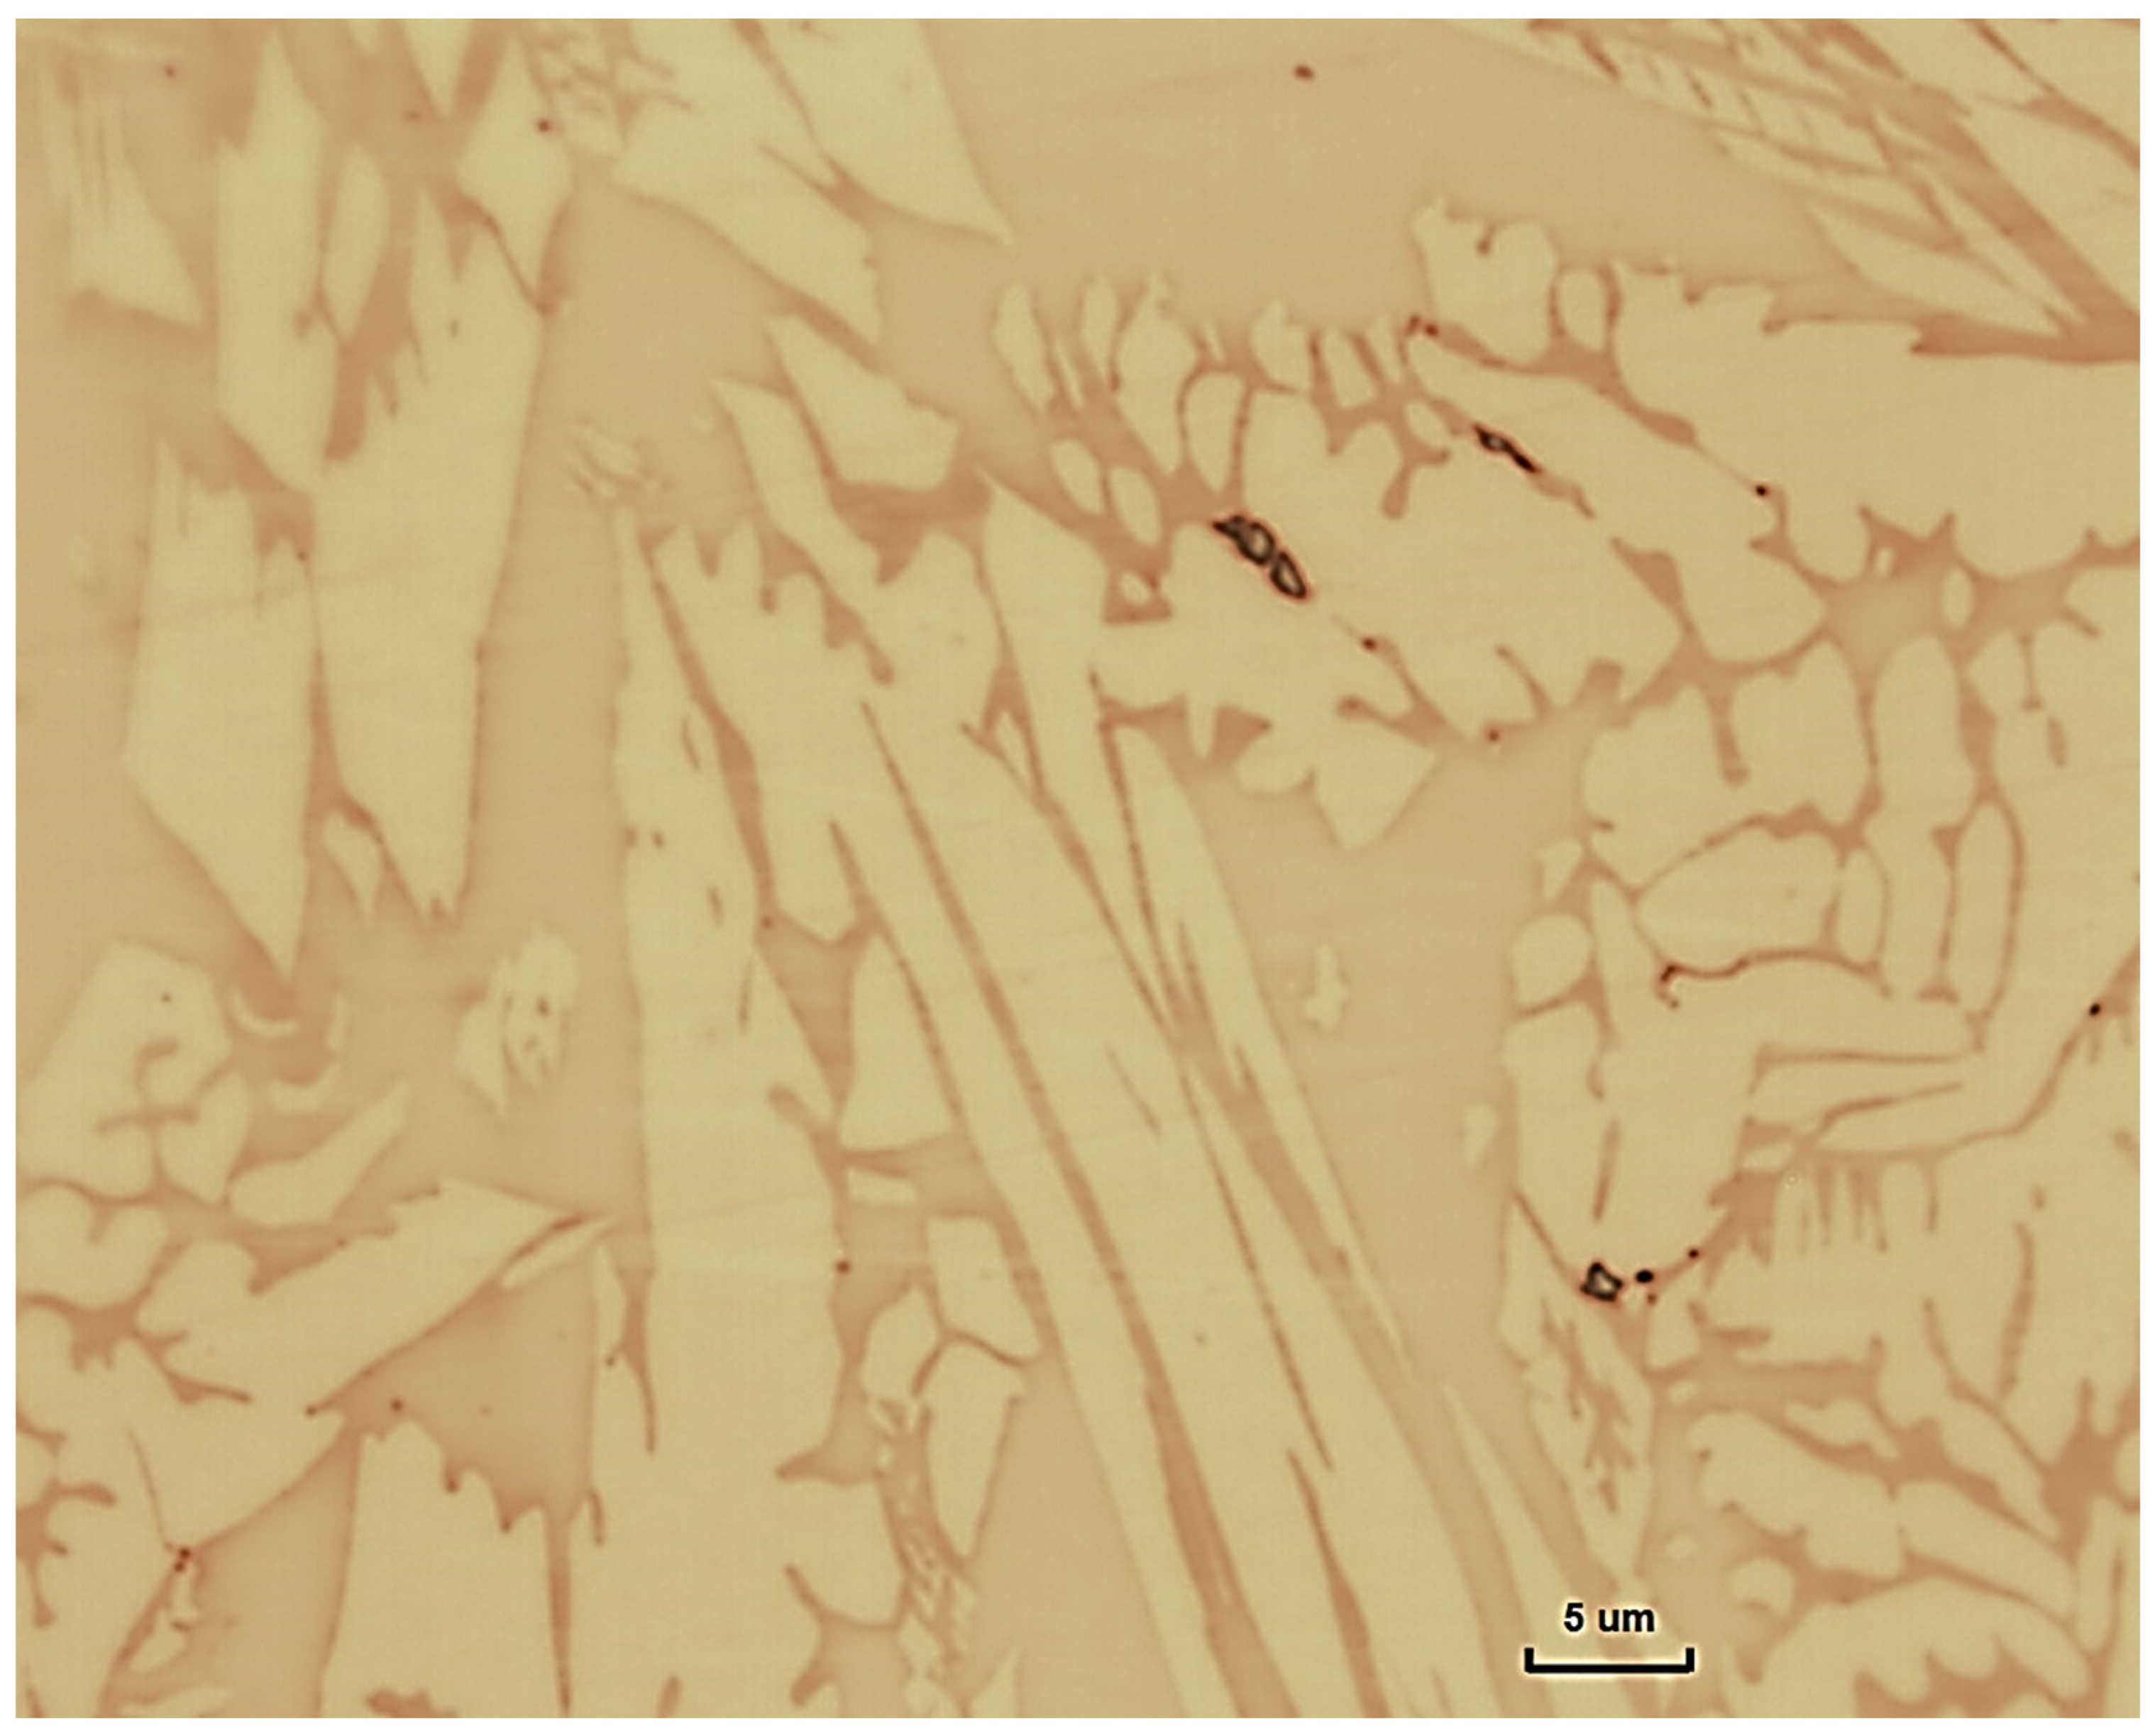
Eight weld passes were used in the preparation of the SA-H weldment (Figure 7). Weld pass 1 was not visible, as it was re-melted by weld pass 5 and probably partly by weld pass 2. Figure 8 shows the location of intermetallics and secondary phases observed. Sigma-phase was not found in the weld metal of the cross-section inspected. However, nitrides were found in weld passes 4, 5, and 6, and intragranular secondary austenite was found to a greater extent in weld passes 2, 3, 6, and 7. The re-heating caused the growth of the primary austenite (intergranular and Windmanstätten). That is illustrated in Figure 9, showing the comparison between the microstructure of the non-reheated weld pass 8 and the weld pass 6, which was re-heated twice. Secondary austenite was found in specific areas of the reheated High-Temperature Heat Affected Zone (HT-HAZ) of the SA-H weldments (Figure 10), and nitrides were found in the Low Temperature Heat Affected Zone (LT-HAZ).
3.1.3. GM-R Weldment
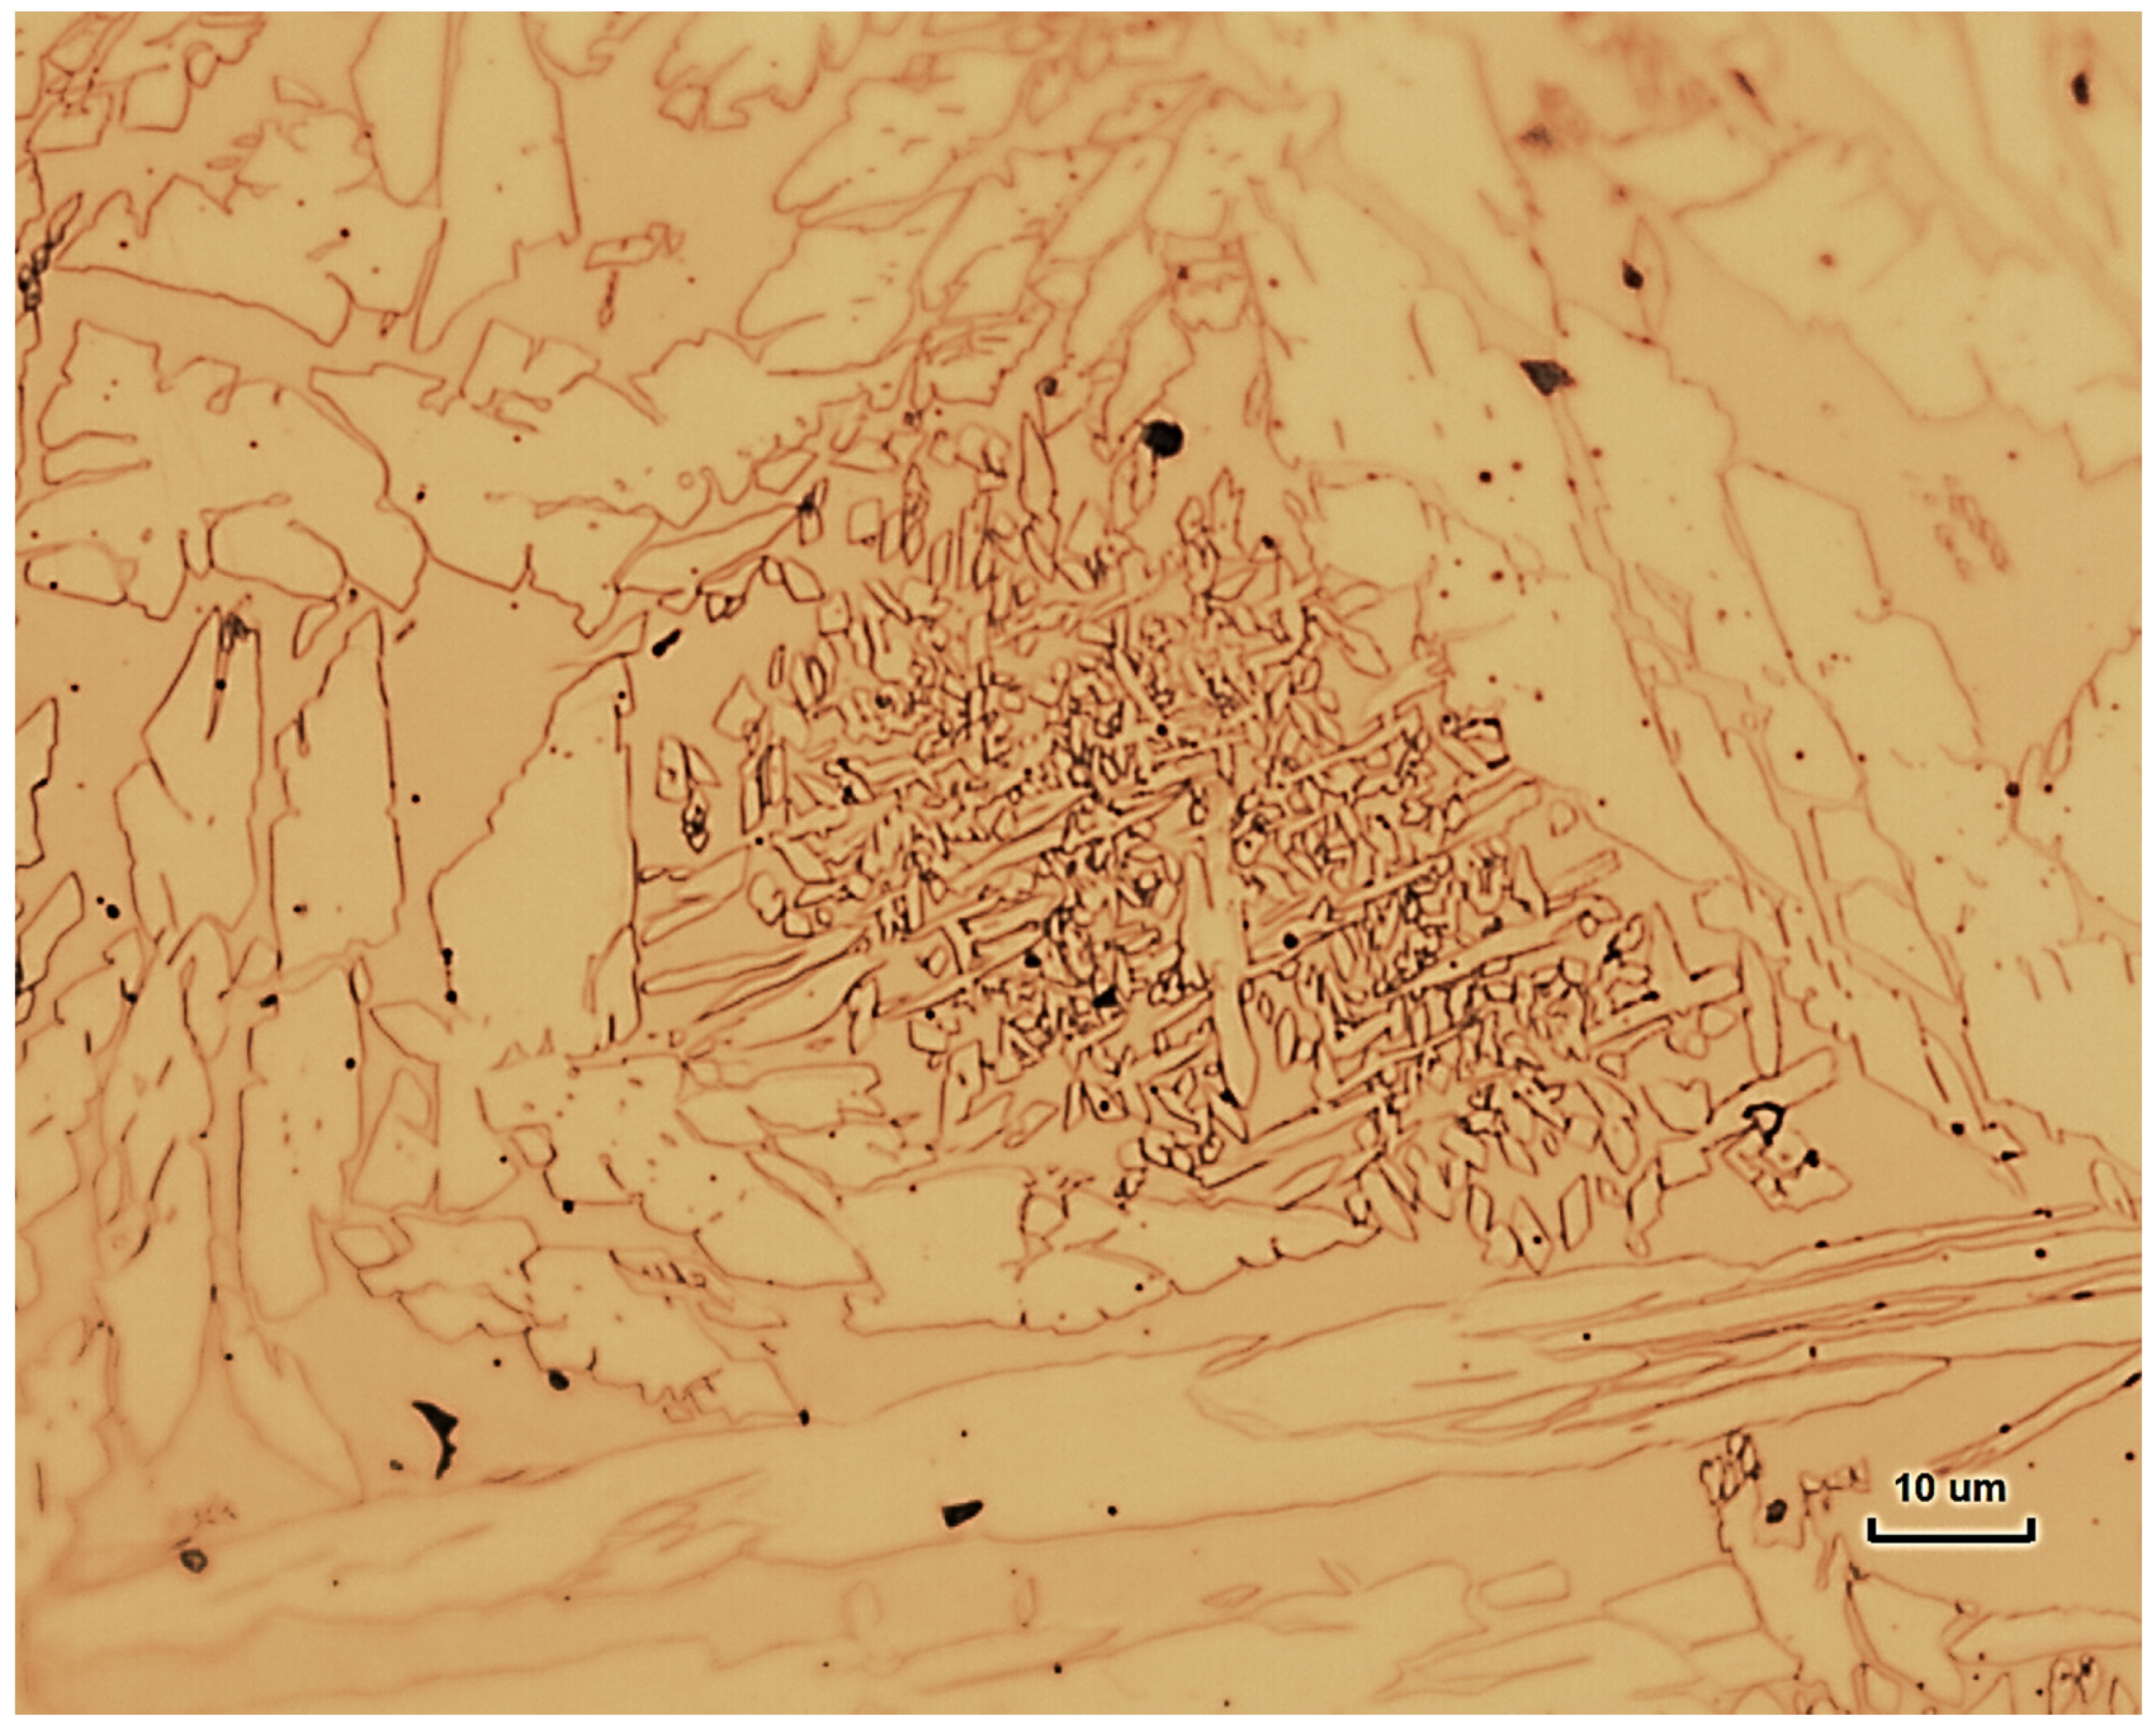
Eighteen weld passes were used in the preparation of the GM-R weldment (Figure 11). Figure 12 shows the location of intermetallics and secondary phases observed. The weld passes that were reheated more times, because of a larger number of vicinity passes, were the ones showing more evidence of secondary austenite (Figure 13). Sigma-phase was found only in few locations in weld pass 1 (Figure 14), which was reheated by four subsequent weld passes (weld pass 2, 3, 4 and 5).
3.1.4. Phase Balance
Table 3 presents the average ferrite content values evaluated by using image analysis in the HAZ and the overall weld metal. In the weld metal, the average ferrite values are detailed in three zones: the root, the center, and the top (see Figure 1). The ferrite measurements in the HAZ were performed in areas between the fusion line and the unaffected base metal, as described in Section 2.2.
The three weldments show ferrite contents in agreement with the M-601 specification [22], which is between 30% and 70% ferrite.
The HAZ presents around 10% higher ferrite content than the weld metal.
3.2. Chemical Analysis
Table 4 shows the average chemical composition of the weldments, which was analyzed as described in Section 2.3.
3.3. Impact Toughness
As described in Section 2.4, Charpy-V impact toughness specimens were extracted from the center of the weld section (root) and from bulk weld metal (side 1), to assess both the absorbed energy in the weld metal and the HAZ (considered as fusion line + 2 mm).
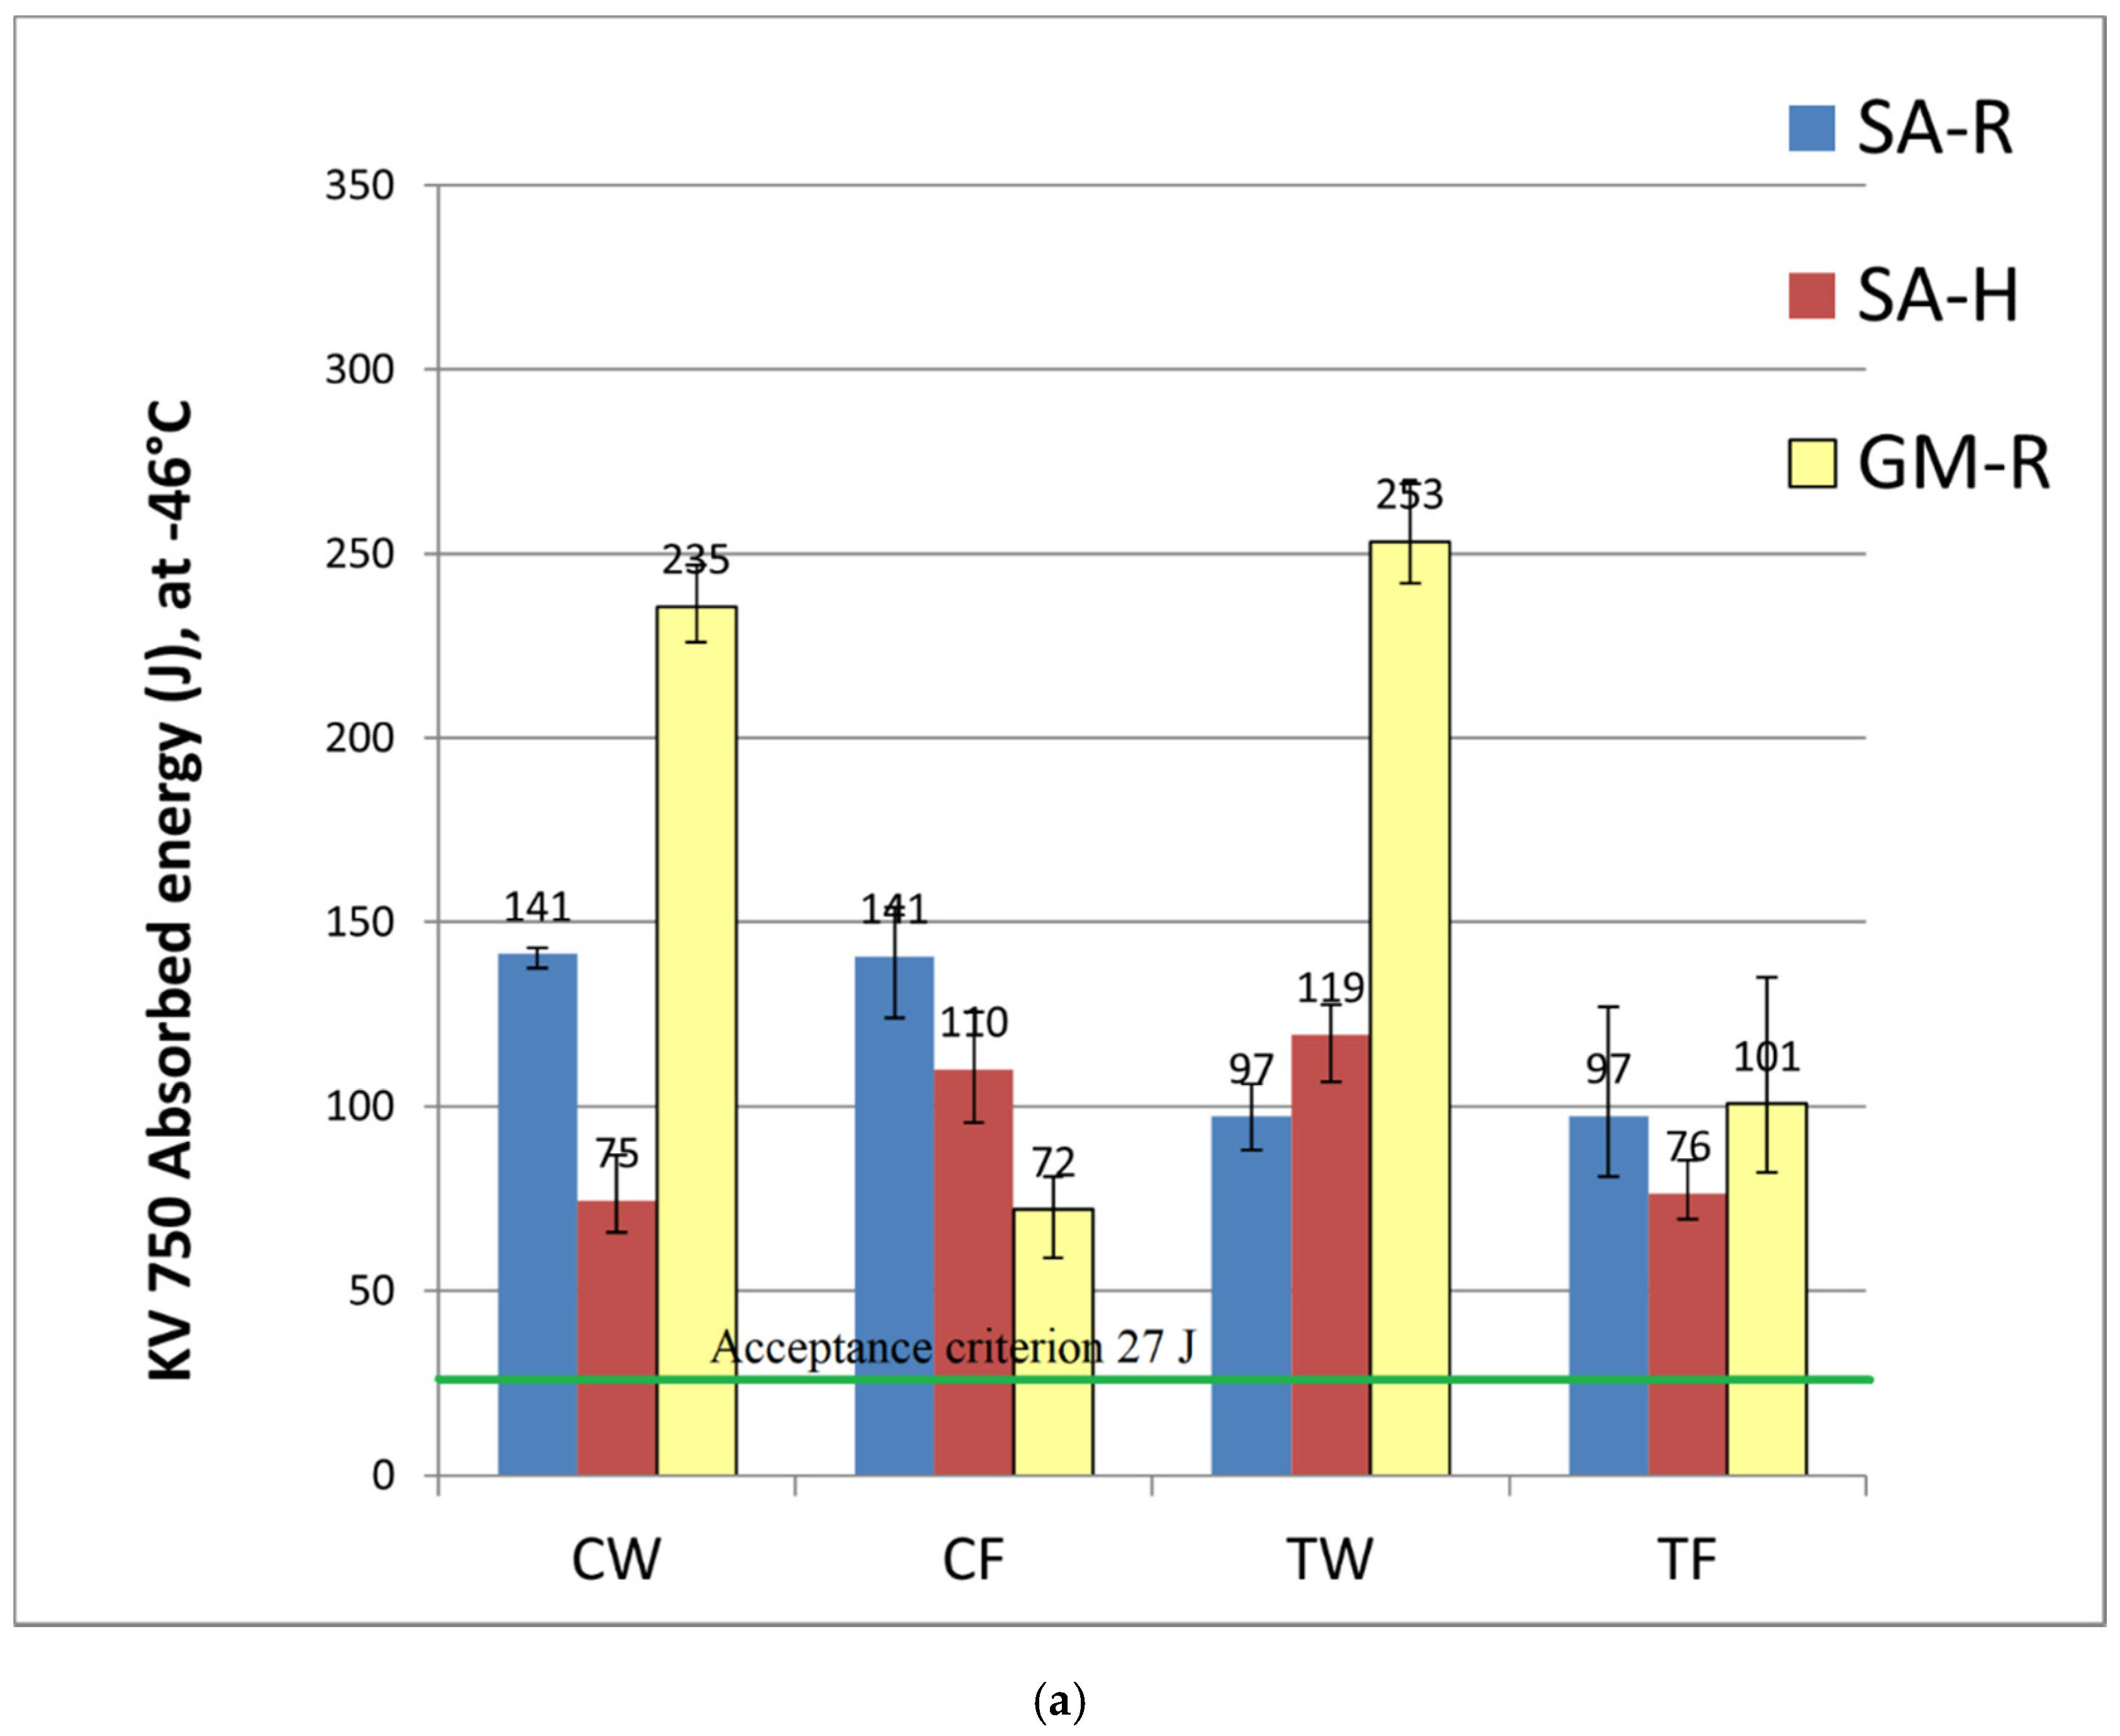
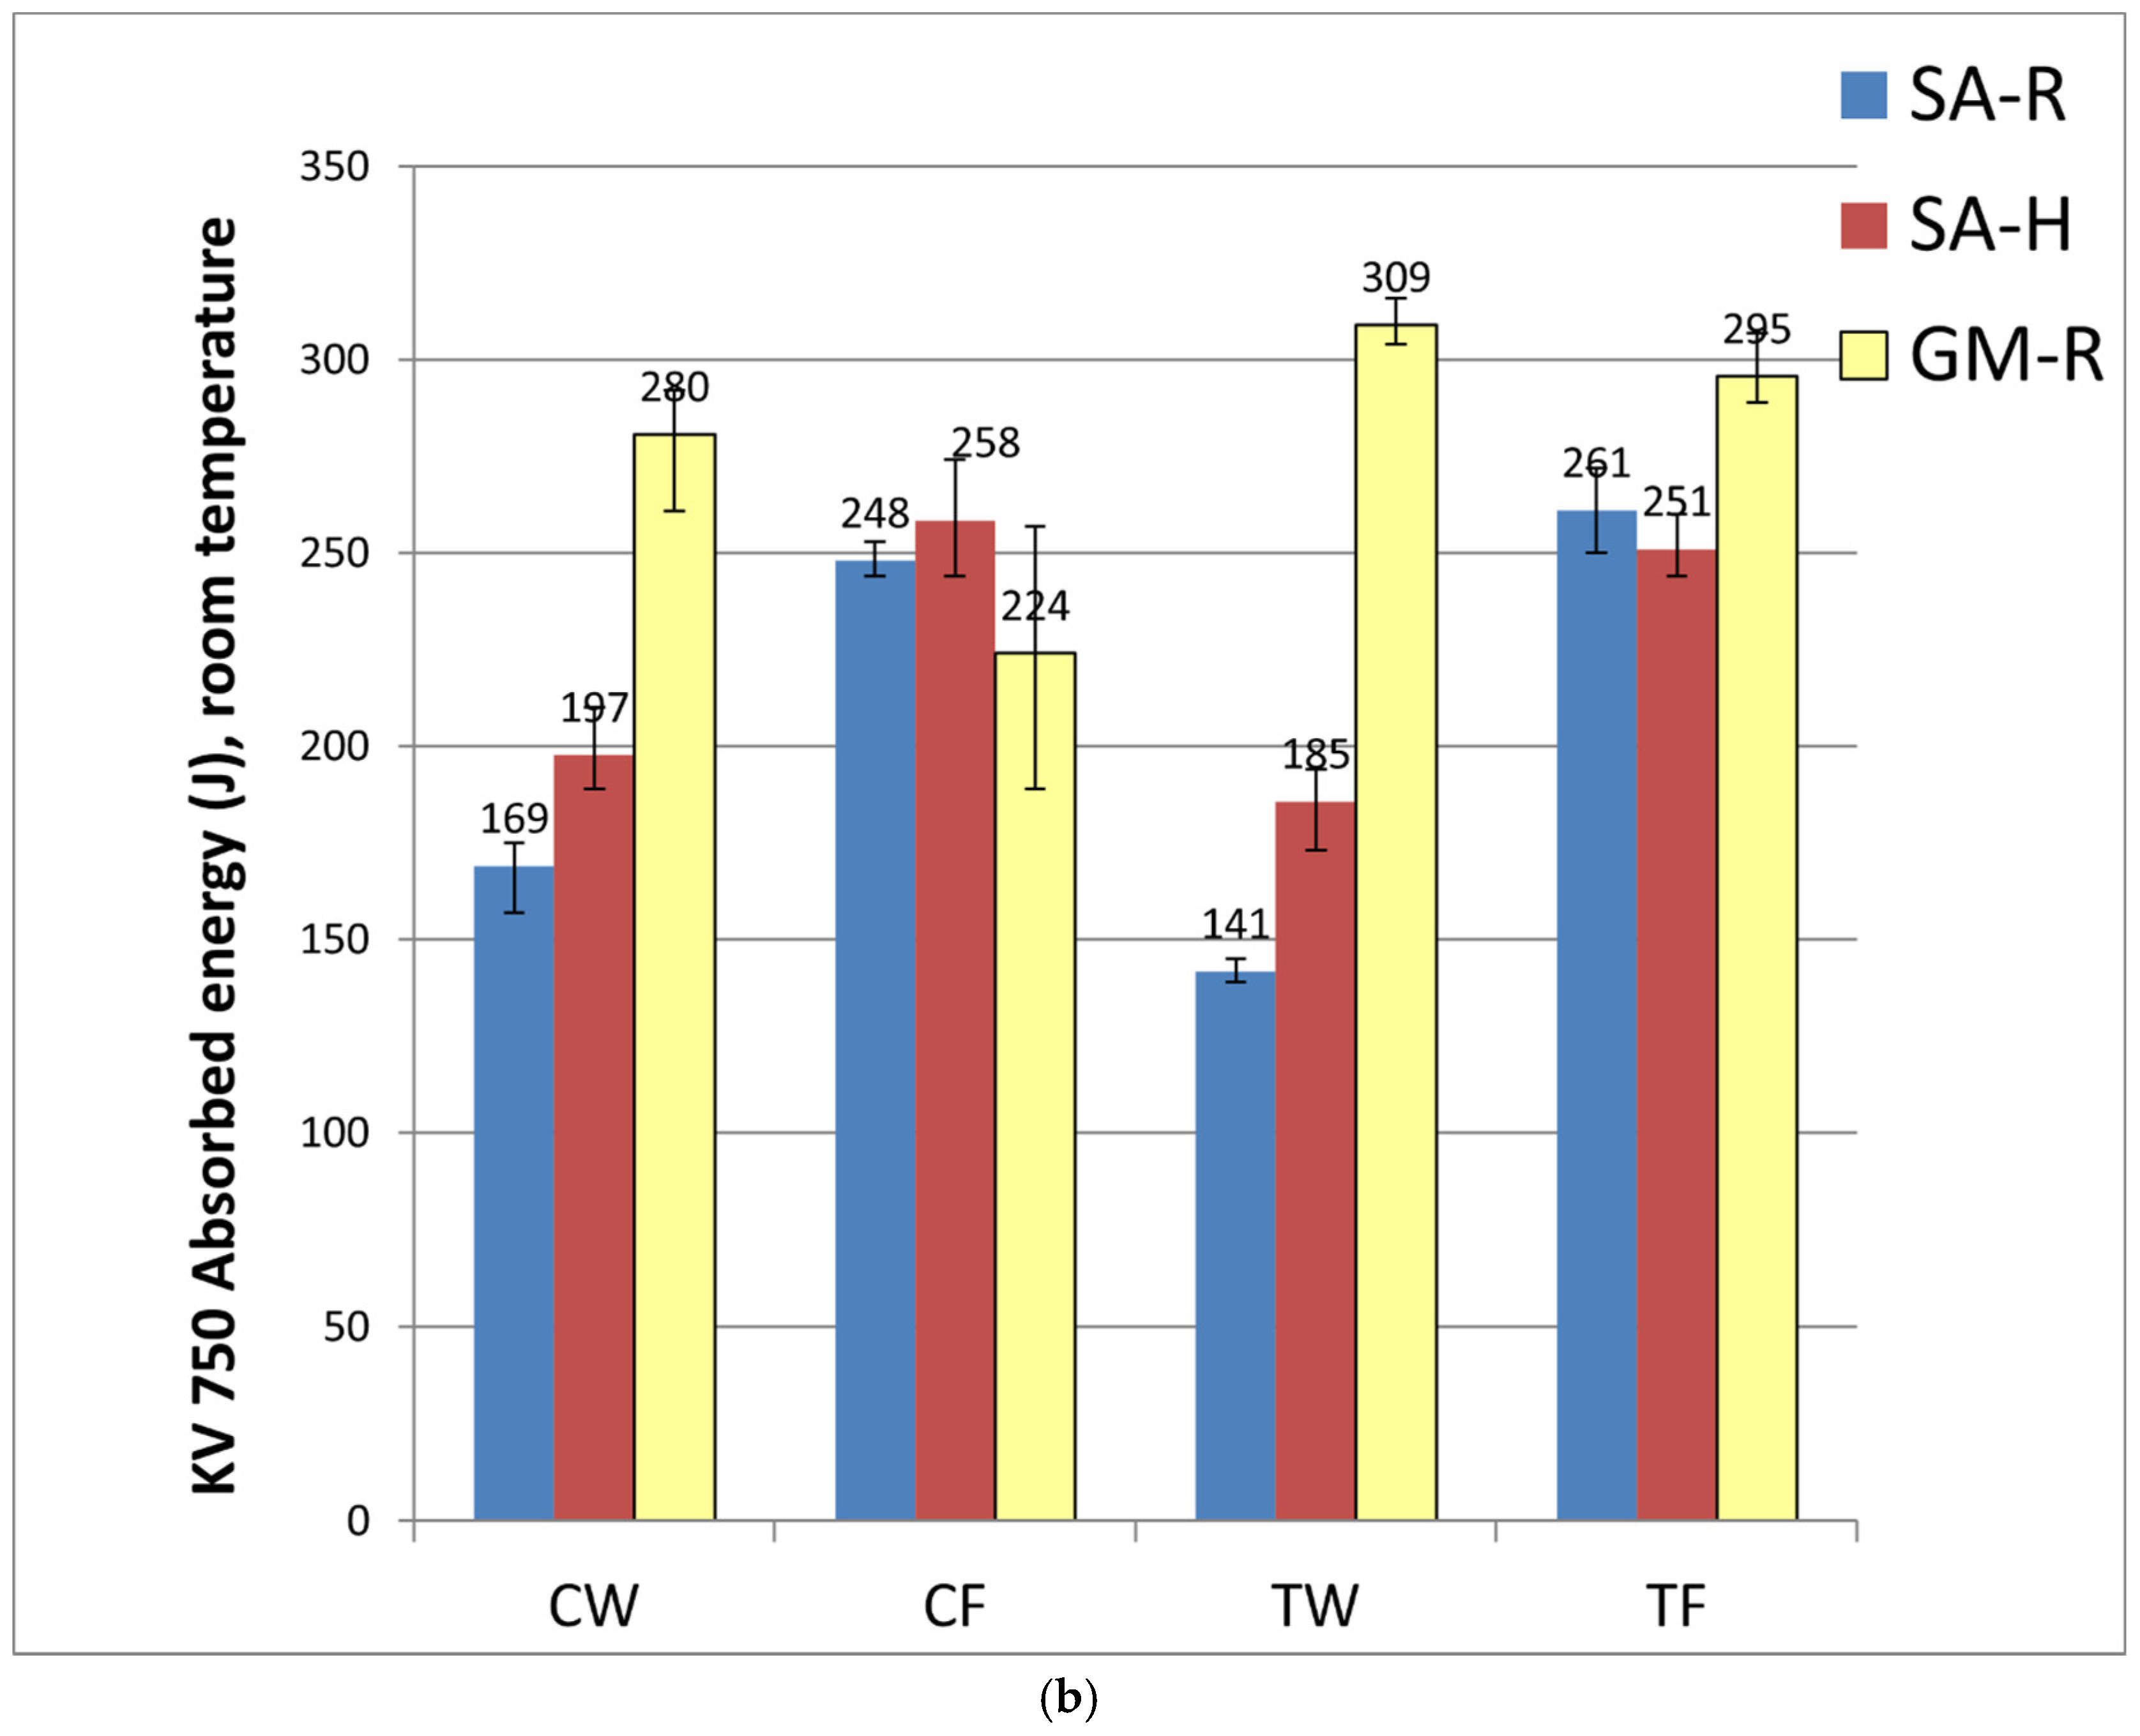
The acceptance criterion for super duplex stainless steel welds according to Norsok M-601 [22] is 27 J at −46 °C as an average and no single values below 70% of the average requirement. As shown in Figure 15, all the specimens exceeded the acceptance criterion at −46 °C, with values between 72 J and 253 J. As expected, the absorbed energy values were higher, and they were between 141 J and 309 J.
3.4. Tensile Testing
Figure 16 and Figure 17 summarize the results for the transverse tensile test and the longitudinal tensile test, respectively.
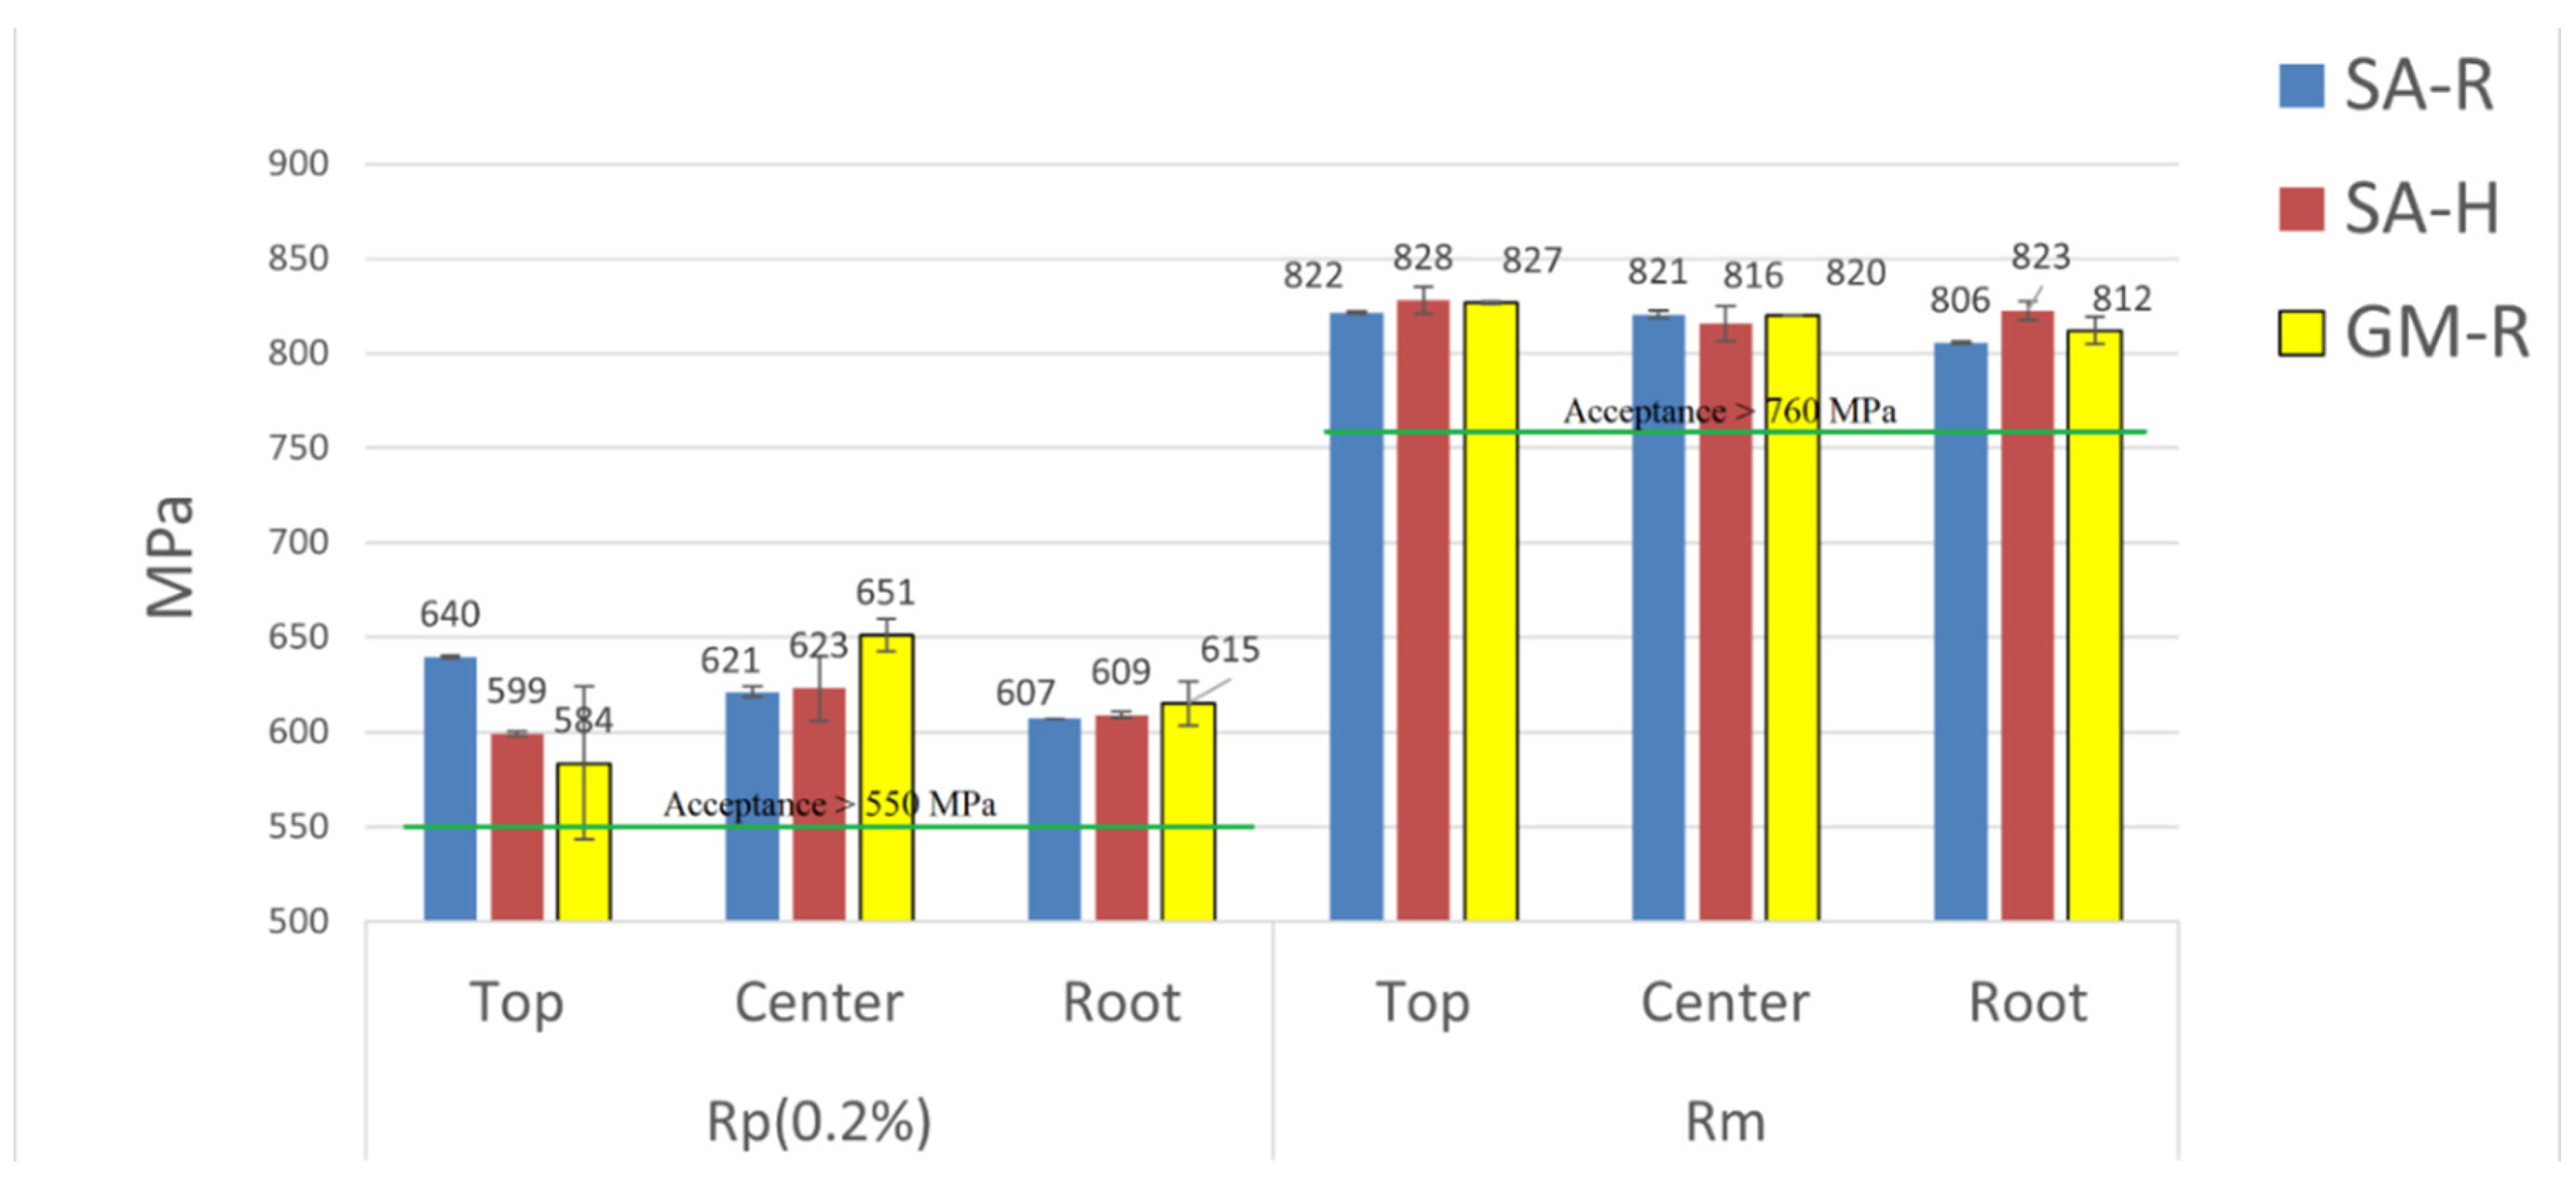
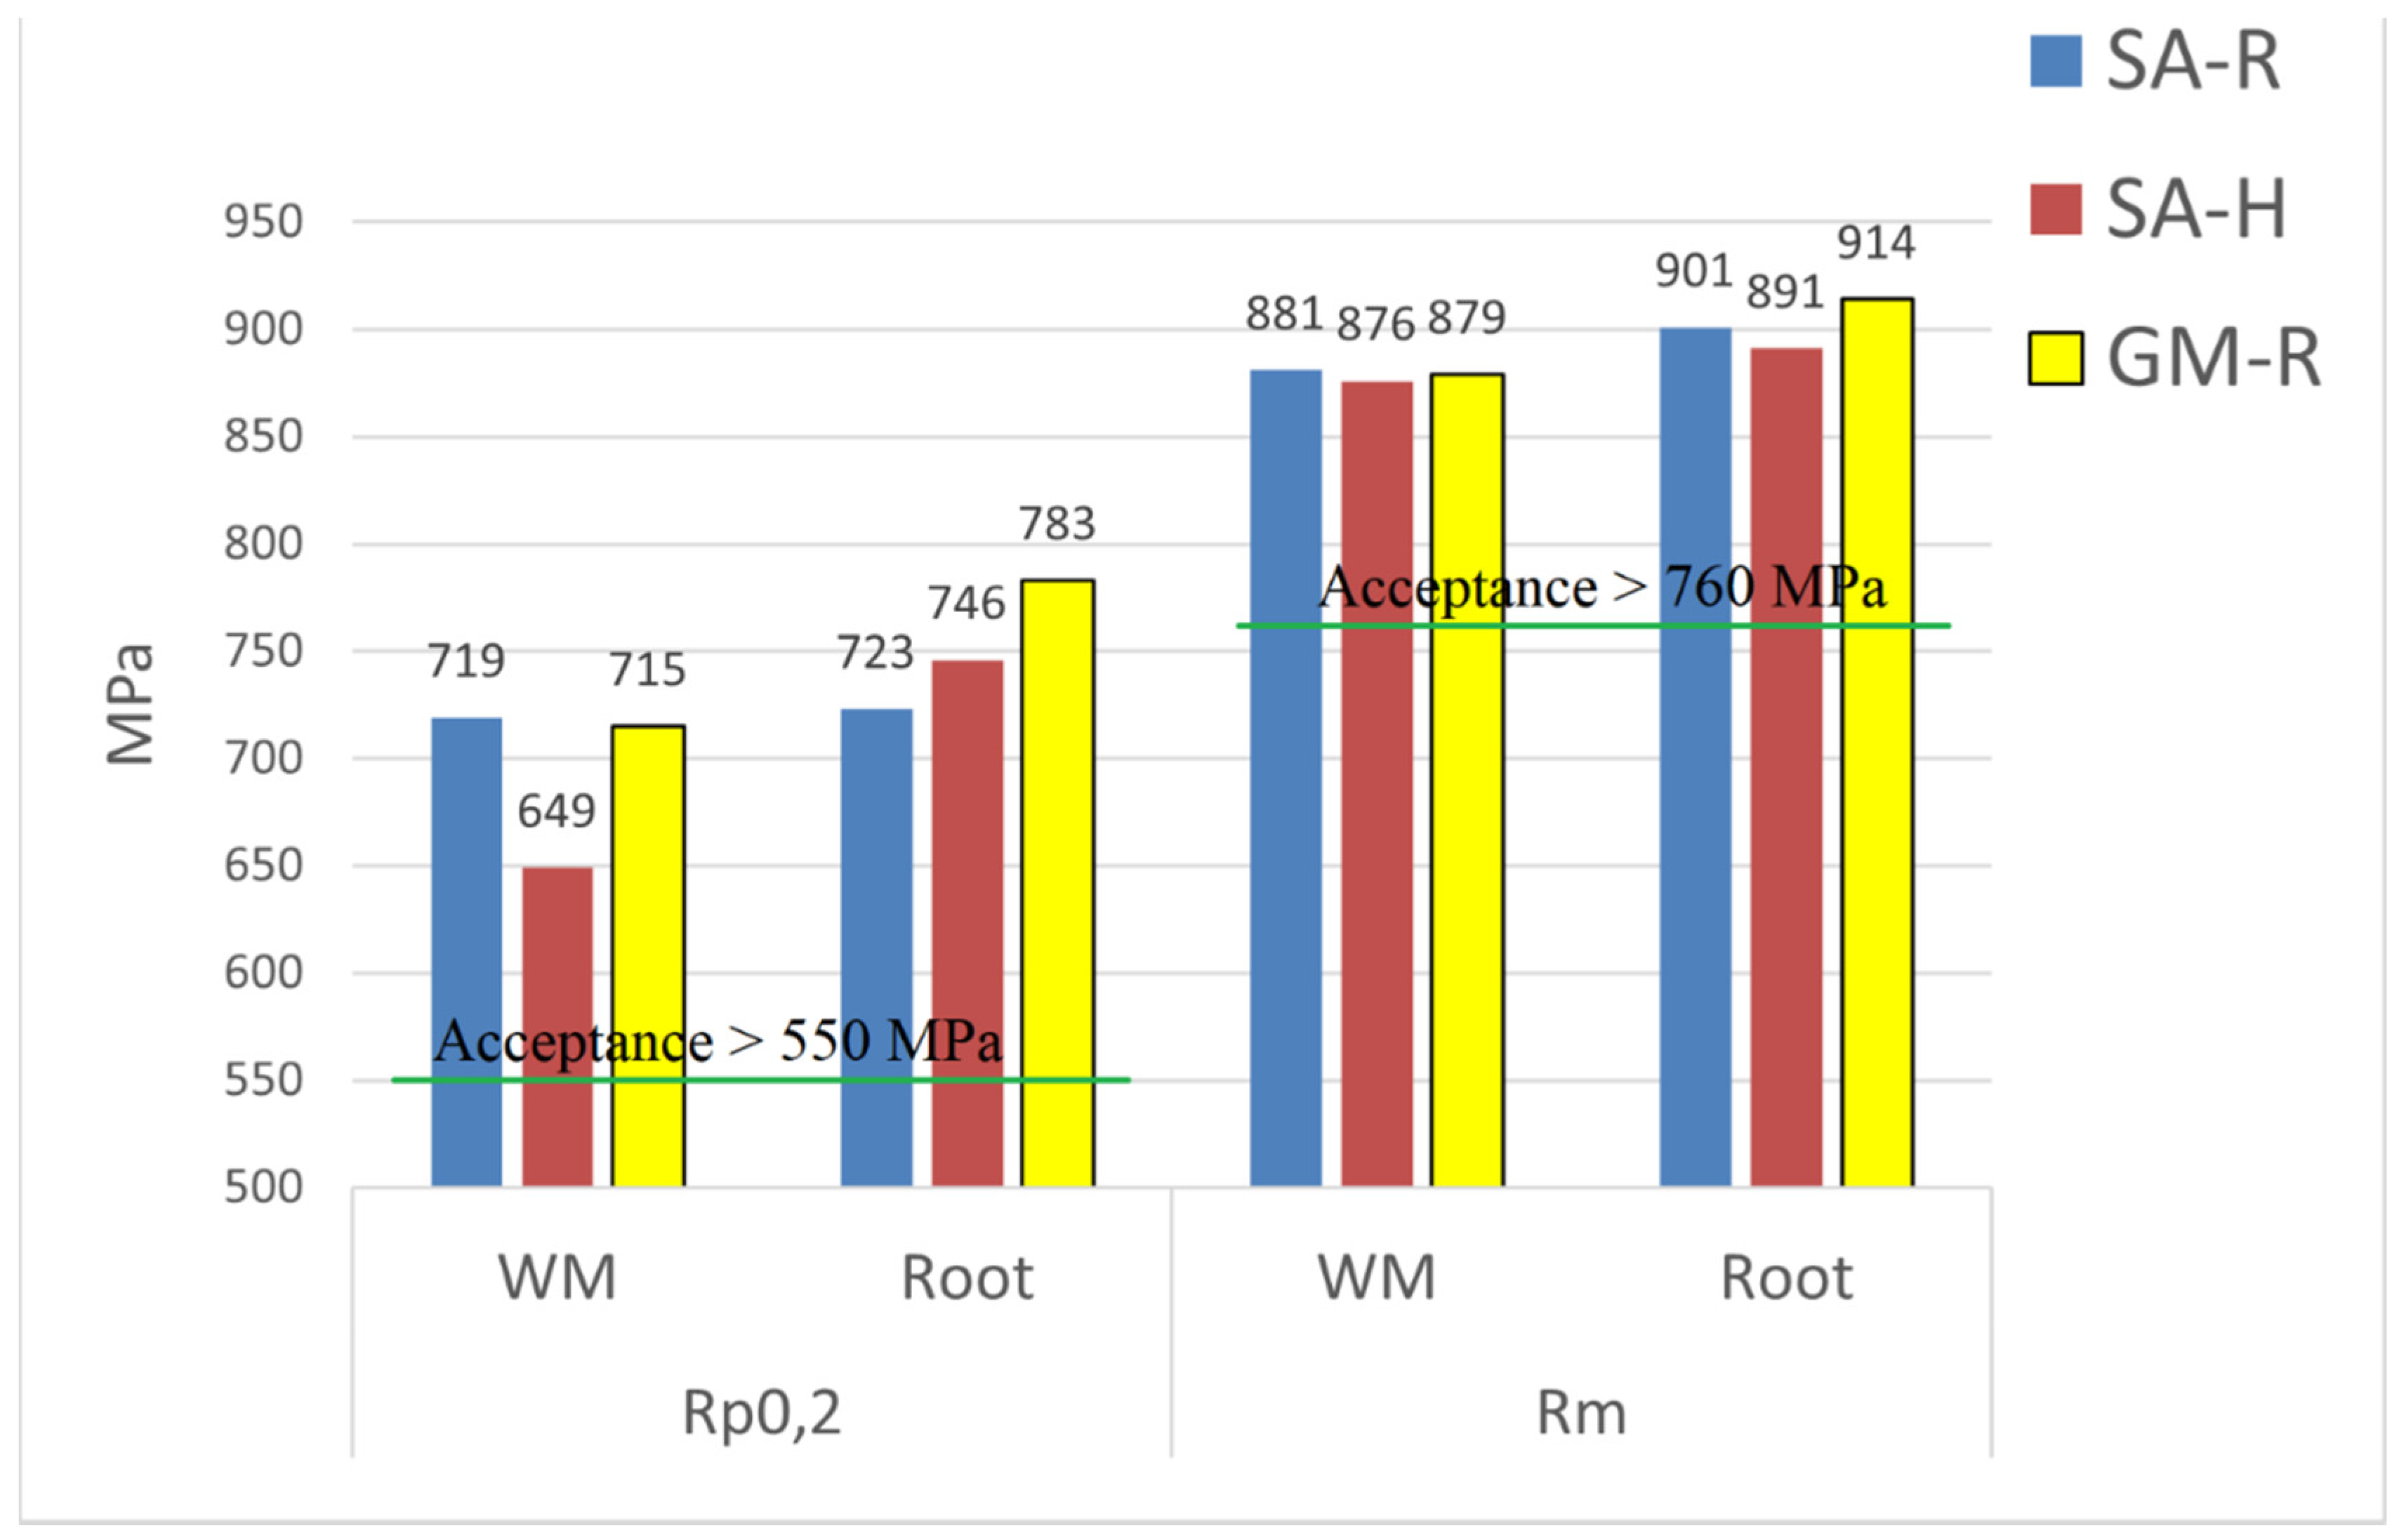
According to the filler specifications AWS SFA5.9 ER2594 and EN ISO 14343-A 25 9 4 N L, the acceptance criteria for welds (all-weld) is a minimum yield strength of 550 MPa and a minimum tensile strength of 760 MPa. In the transverse tensile test, all the specimens broke in the base material. Yield strengths between 584 MPa and 651 MPa in the transverse tensile test and between 649 MPa and 783 MPa in the longitudinal tensile test were measured. As per the tensile strength, in the transverse tensile test, the results were between 806 MPa and 828 MPa, and in the longitudinal tensile test, the measured tensile strengths were between 876 MPa and 914 MPa. Therefore, all the welds exceeded the acceptance criteria for tensile strength and yield strength.
3.5. Corrosion Testing Results
The ASTM G48E corrosion test was used to evaluate the CPT in the three experiments, and the results are summarized in Table 5. In addition to the CPT, the number and depth of the pits and the weight loss were additionally considered to rank the corrosion resistance of the welds. The GM-R weldment showed the best performance, whilst the SA-R weldment showed the worst. Therefore, their overall performance showed the same trend observed with the CPT values.
To compare the influence of the arc energy on the corrosion resistance of the SAW welds, the ASTM G150 test was conducted on SA-R and SA-H coupons. Table 5 summarizes the results from the ASTM G150 together with relevant microstructural features and the location of the pitting initiation. Because of the differences in the time settings with the standard, the temperatures registered were not CPT strictly speaking, but they served for comparison purposes. Results from ASTM G150 were in line with the trend observed in the results from the ASTM G48E test, showing higher CPT in the SA-H (55 °C) weldment than in the SA-R (45 °C). In the SA-R coupon, the weld metal was found more susceptible to pitting than the HAZ, whilst for the SA-H section, the highest susceptibility to pitting was found in the HAZ.
The CPT value for the as-delivered 2507 plate was 84 °C +/− 2 °C based on the ASTM G150 test.
3.6. Productivity: Welding Time
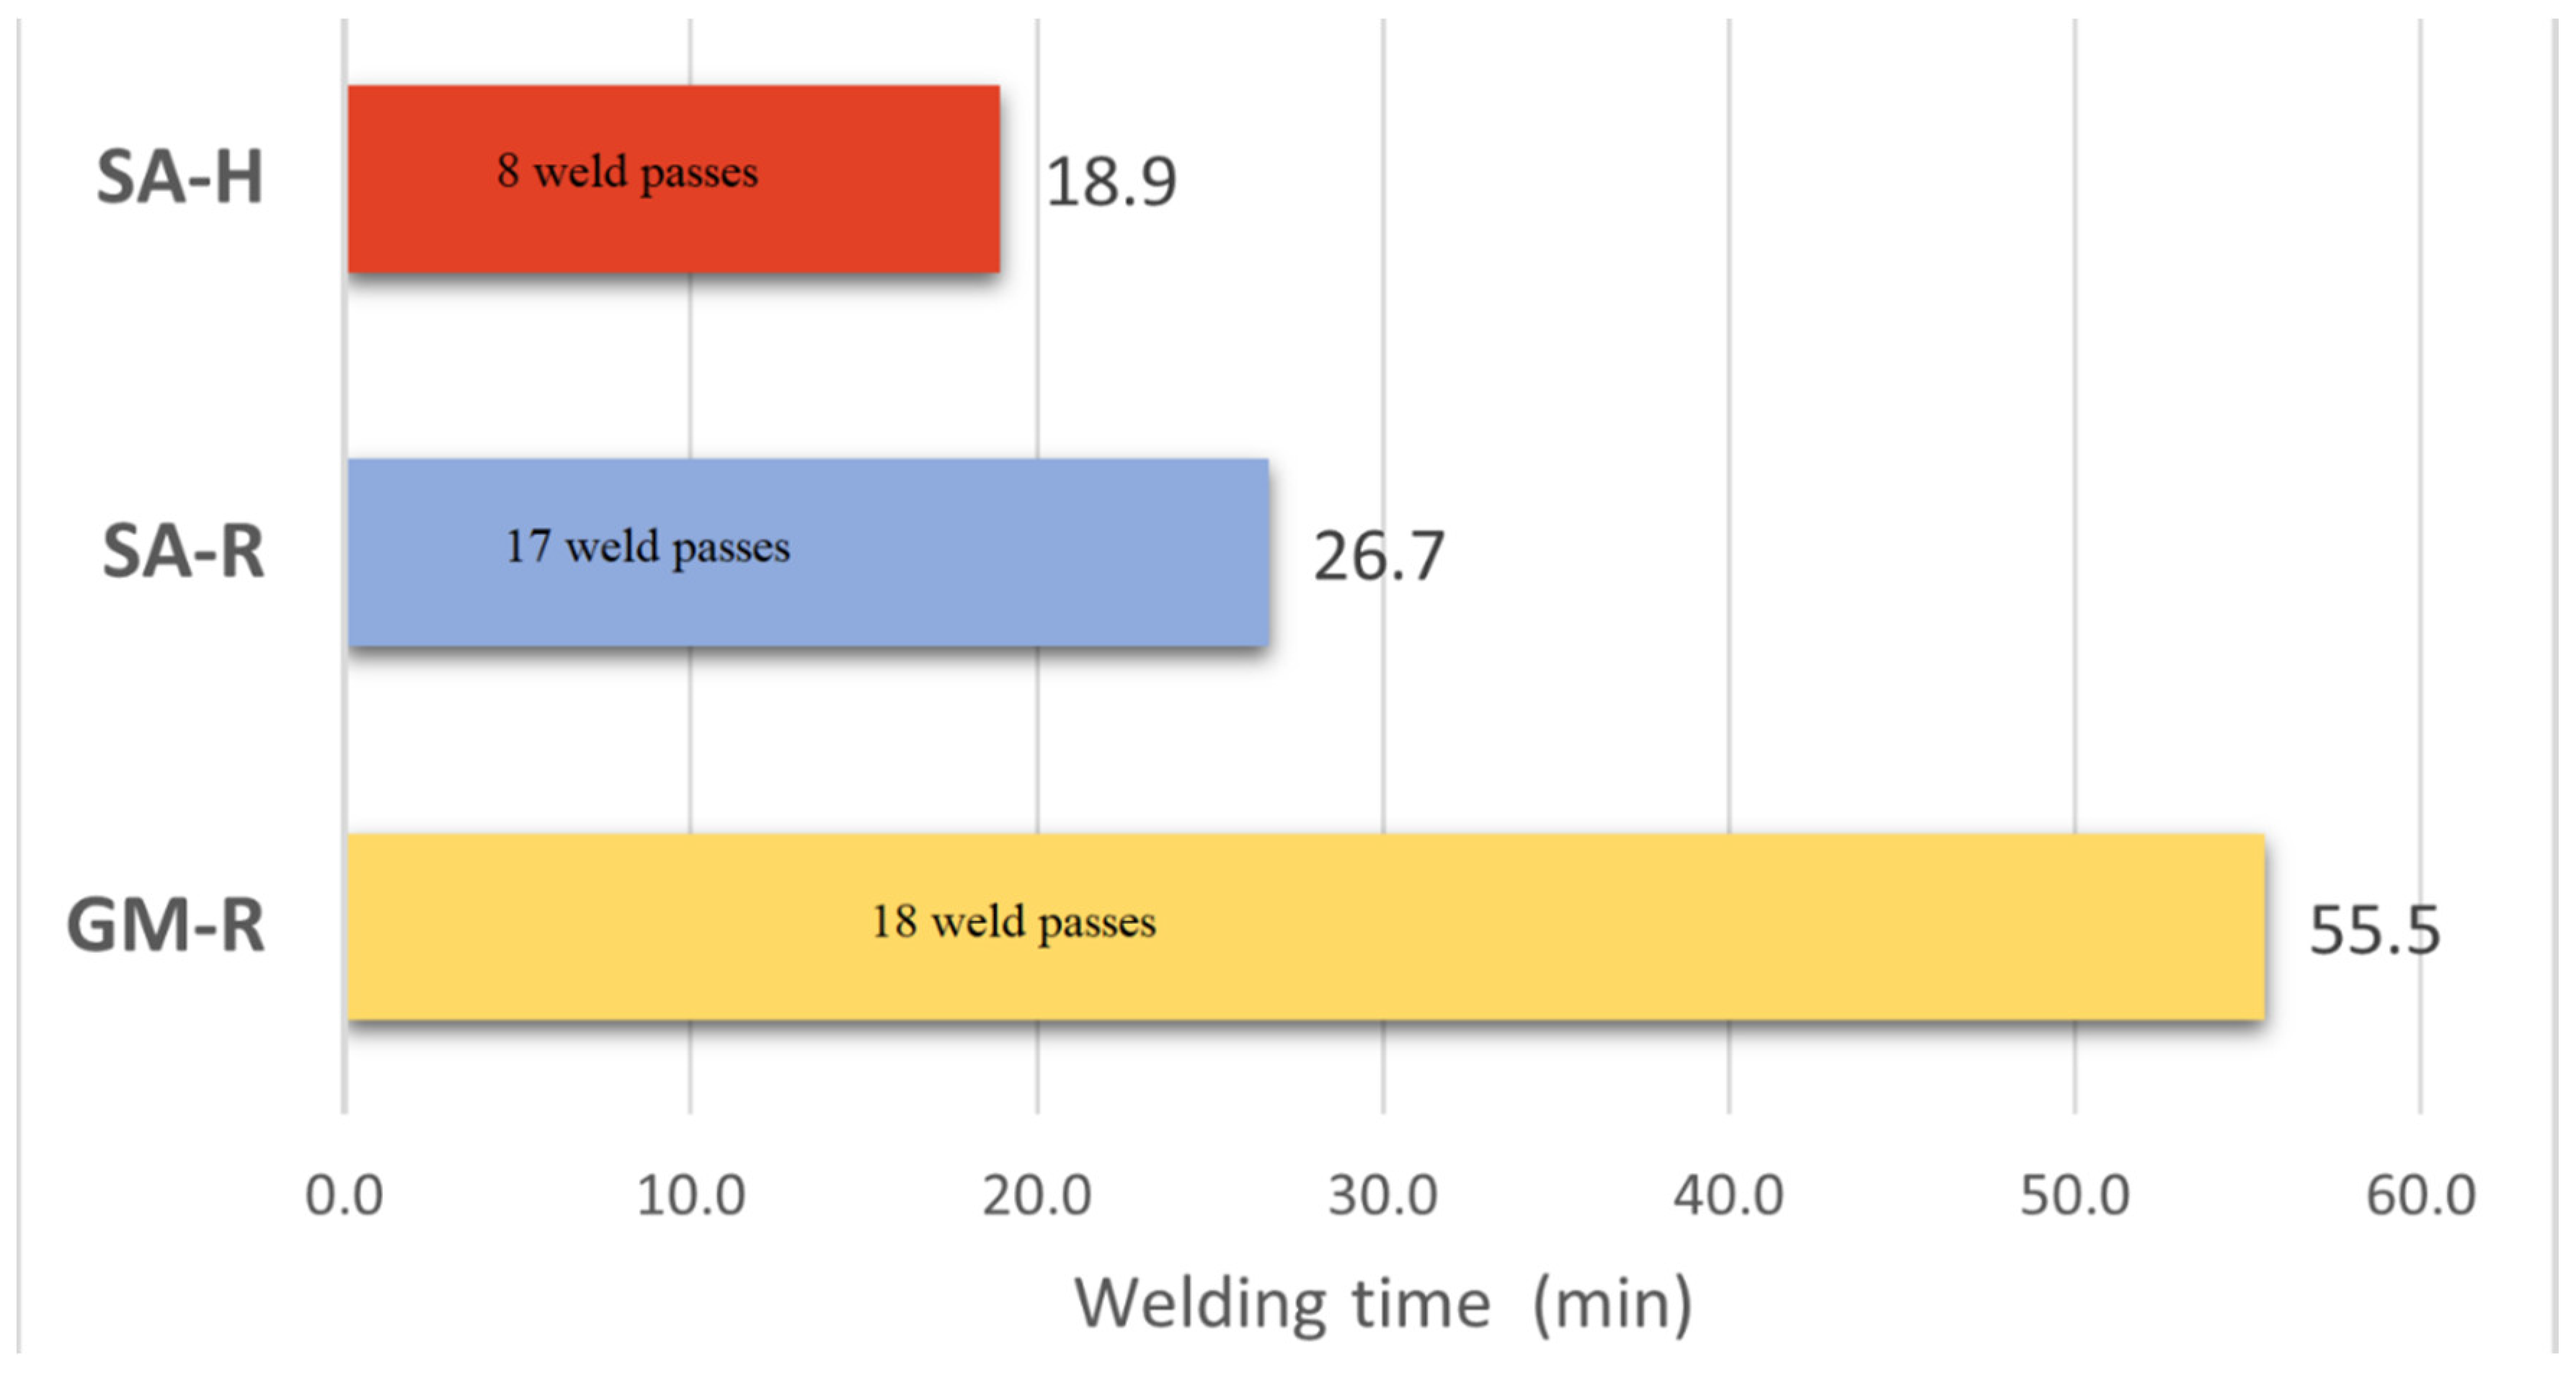
The welding time to produce a complete weldment for each experiment was calculated by considering the number of passes, the length of the welds (0.5 m), and the welding speed for each pass (Table 2). Only the time that the arc was ignited was considered for the calculations. Results are shown in Figure 18. The shortest welding time was achieved by using SAW with a higher than recommended arc energy (18.9 min for SA-H), whilst the experiment with the longest welding time corresponded to the GMAW with the recommended arc energy (55.5 min for GM-R). Experiments GM-R and SA-R had nearly the same number of welding passes (18 and 17, respectively), and both were prepared with recommended arc energy and interpass temperature, but the welding time for the GMAW weldment (55.5 min) was twice the welding time needed to prepare the SAW weldment (26.7 min).
4. Discussion
It is well-known that both high energy input and successive reheating (multi-pass welding) can promote the formation of intermetallics and secondary austenite, therefore impairing the impact toughness and corrosion resistance of the weldments [7,8,9,10,11,12,13]. In the SAW of the 33 mm thickness plates, the number of necessary weld passes decreased from 17 to 8 when the arc energy was increased from 1.2 kJ/mm to 2.3 kJ/mm. In this section, the results are compared and discussed to elucidate the relevance of both the energy input and the number of reheating cycles for the microstructure, mechanical properties, and corrosion resistance.
The results of GMAW and SAW weldments produced with recommended arc energy and interpass temperature are also compared and discussed. Finally, some considerations about productivity are made.
4.1. Chemical Composition
The chemical analysis of the deposits showed a typical composition for super duplex weldments (Table 4), with very similar concentrations in the main elements and fulfilling the expected nitrogen content, between 0.2 and 0.3%. However, a slightly lower nitrogen content was found in the GMAW weldment (0.228 +/− 0.005%) than in the SAW deposits (values around 0.25%). As nitrogen is an austenite promoter, a lower nitrogen content could contribute to the slightly higher overall ferrite values in the GM-R weldment (Table 5). The plates and the filler wires contained, respectively, 0.26% and 0.275% nitrogen (Table 1). Therefore, nitrogen loss [24,25] occurred during welding, and to a larger extent in GMAW than in SAW.
4.2. Microstructure
It was assumed that all the intermetallics found in the specimens were sigma-phase, but others may have been present (R-phase, χ-phase …). Further characterization (SEM + EDX, EBSD) would be necessary to prove the nature of the intermetallics observed. It was also assumed that nitrides found were Cr2N, but further characterization would be necessary to check if CrN was also present.
In the SA-R weldment, traces of sigma-phase were found in a localized area of weld pass 4 that was directly reheated by three subsequent weld passes (Figure 2, Figure 3 and Figure 4). Similarly, in the GM-R weldment, sigma-phase was only found in weld pass 1, directly reheated by four subsequent weld passes (Figure 11, Figure 12 and Figure 14). However, despite the use of higher than recommended arc energy, sigma-phase was not found in the cross-section of the SA-H weldment. In this case, fewer weld passes were used, and none of the weld passes was directly reheated by more than two subsequent weld passes.
Therefore, it can be concluded that the larger number of welding passes (reheating cycles) in the immediate vicinity of a deposited weld pass, the higher the possibility for sigma-phase to form. That agrees with previously published works [12,13].
By using the chemical composition of the weldments (Table 4), JMatPro (Sente Software Ltd., Surrey, UK) predicted a TTT curve for 1% sigma-phase with a nose at 990 °C and 34 s, and 5 s for 0.1% sigma-phase. Unfortunately, it was not possible to conduct temperature measurements in these experiments, but the lack of evidence of sigma-phase in the SA-H weldment suggests that the critical time and temperatures were not achieved for the formation of a significant amount of sigma-phase, and that the kinetics might require longer times.
In terms of intragranular secondary austenite, only one subsequent weld pass was enough to promote the formation of intragranular secondary austenite in the previously deposited pass. That was a common observation for the three experiments, and it is in agreement with previous works [13]. It is assumed that intragranular secondary austenite forms at temperatures higher than 500 °C [7,26], and it is known that the temperature and the holding time influence the size and amount of intragranular secondary austenite formed [9]. As a general observation, it was found that the larger the number of passes in the immediate vicinity of a specific weld pass, the more secondary austenite was found, which means that those areas were exposed at the transformation temperature range for a longer time.
Only in the SA-H experiment was it possible to find secondary austenite in the reheated base material HT-HAZ. That leads us to conclude that in the HAZ of the experiments GM-R and SA-R, with recommended arc energy, the time at which the HAZ was exposed at temperatures higher than 500 °C was not long enough to promote the formation of secondary austenite. The implication of the microstructure on the corrosion results will be discussed later.
Quantification of the nitrides has not been attempted in this work, but qualitatively the results indicate that the SA-H weldment shows less nitrides in comparison to the weldments produced with recommended arc energy. That can be explained by the slower cooling rates expected when using higher arc energies, allowing more time for nitrogen to diffuse from the ferritic matrix towards the austenite.
No significant differences were found when comparing the average ferrite content in the weldments produced with GMAW and with SAW with and without using recommended arc energy. However, when looking into specific areas of the weld (Table 3), the central part of the weldments (Figure 1) shows slightly lower ferrite content and therefore slightly higher austenite contents. The central part of the weldment is the area affected by a larger number of successive weld passes (Figure 3, Figure 7 and Figure 11). Therefore, new austenite is formed by the subsequent reheating, both in the intergranular zones with the formation of secondary austenite and the growth of the intergranular and Widmanstätten austenite laths [13,27].
4.3. Mechanical Properties
All the coupons exceeded the tensile test requirements regardless of the welding process used and the arc energy conditions (Figure 16 and Figure 17), and no significant differences were found when comparing the locations tested. When looking specifically into the longitudinal tensile results, the bulk weld metal of the SA-H sample shows slightly lower yield strength than the rest. However, as the longitudinal tensile tests were single tests, more repetitions would be necessary to draw conclusions on possible trends.
Regarding the impact toughness results (Figure 15), all the coupons exceeded the requirements regardless of the welding process used and the arc energy conditions. The GM-R weldment showed the highest absorbed energy values at both temperatures tested and in all the locations tested, except for the HAZ in the bulk weld (center, Figure 1). The HAZ in the GM-R weld experienced a larger number of reheating cycles than in the SAW weldments, and a high concentration of nitrides was observed (Section 3.1.1). That might explain the lower value in the HAZ of GM-R, but still above the requirement.
A higher amount of micro-slag inclusions was found in the SAW weldments in comparison to the GMAW weldments (Figure 10 and Figure 13). That is in line with the oxygen contents measured (Table 5), which were between 4 to 5 times lower in the GM-R than in the SAW weldments. This explains the higher absorbed energies in the GM-R welds. In the GMAW weldment, the toughness was higher in the weld metal than in the HAZ. However, in the SAW weldments, the opposite trend was found. That lead us to conclude that the micro-slag inclusions found in the SAW weld metal were more detrimental for toughness than the nitrides found in the HAZ.
4.4. Corrosion Resistance
From the ASTM G48E test, the SA-R weldment showed the lowest CPT, representing a 23% reduction of the CPT value compared to the non-welded 2507 base material. In the G48E test of SA-R, pitting was found in three locations of the weld metal: the cross-section, and the bottom and top surfaces in contact with the environment. This proneness to pitting corrosion could be explained by the unbalanced ferritic microstructure in both bottom and top surfaces, illustrated in Figure 6, and also by the large number of areas showing secondary austenite in the cross-section (Figure 3).
The results of the ASTM G150 corrosion test (Table 5) indicated that in the SA-H weldment, the HAZ was the preferred location for pitting initiation. That could be explained by the presence of both secondary austenite and nitrides in the HAZ, as it is well-known that nitrides and secondary austenite decrease the pitting resistance in super duplex stainless steel weldments [9,28,29,30]. However, in the SA-R weldment, where the weld metal contained traces of sigma-phase in addition to secondary austenite and nitrides, then the preferred location for pitting initiation was the weld metal instead of the HAZ. The detrimental effect of sigma-phase in the corrosion resistance of super duplex stainless weldments is well-known [10,31].
Further work including a metallographic inspection of corrosion tested specimens would be interesting to correlate the pitting locations, the microstructure, and the weld pass layout.
4.5. Productivity Aspects
Experimental results showed that higher than recommended arc energy in the production of 33 mm thick SAW weldments resulted in shorter welding times and in a smaller number of weld passes than when using recommended arc energies (Figure 18). Around 8 min of arc time were reduced per weldment, and it was possible to decrease the number of weld passes from 17 to 8.
When comparing the welding processes, the welding time to prepare the GMAW weldment was twice that needed to prepare the SAW deposit. This fact is consistent with other productivity indicators available in the literature, such as the higher deposition rates achievable with the SAW process (commonly from 5 to 25 kg/h) compared to the deposition rates obtained with GMAW (usually below 5 kg/h) [32].
In this study, it was shown that in the case of large thickness plates, a higher than recommended arc energy ended up in a reduction of the number of weld passes/reheating cycles and in shorter welding times, while fulfilling the common microstructural, mechanical, and corrosion requirements.
5. Conclusions
- Both GMAW and SAW processes were proved to produce large thickness (33 mm) weldments of super duplex 2507 plates, meeting the microstructural, mechanical, and corrosion resistance requirements.
- With SAW it was possible to exceed the recommended arc energy up to 2.3 kJ/mm and the recommended interpass temperature up to 180 °C, while meeting the microstructural, mechanical, and corrosion resistance requirements.
- By using higher than recommended arc energy and interpass temperatures, it was possible to reduce the number of welding passes by half, compared to the use of recommended settings.
- When using recommended arc energy and interpass temperature, the SAW process needed half of the welding time for the GMAW process to produce a weldment with the same number of weld passes.
- Based on the results of this investigation, the current practical recommendations for welding large thickness duplex and super duplex should be revised and updated.
Author Contributions
Conceptualization, M.A.V.B. and L.K.; Formal analysis, M.A.V.B. and D.E.; Funding acquisition, M.A.V.B., D.E. and L.K.; Investigation, M.A.V.B., D.E. and K.H.; Methodology, M.A.V.B., D.E. and K.H.; Project administration, M.A.V.B.; Resources, D.E.; Supervision, D.E. and L.K.; Visualization, M.A.V.B.; Writing—original draft, M.A.V.B.; Writing—review & editing, D.E. and L.K. All authors have read and agreed to the published version of the manuscript.
Funding
This research was funded by KK-stiftelsen (Stiftelsen för kunskaps-och kompetensutveckling), grant number 20140046.
Data Availability Statement
Not applicable.
Acknowledgments
Cecilia Lille (Outokumpu Stainless AB), Hans Åstrom (Elga AB), Per Bengtsson (AGA Gas AB), and Matti Karvinen (Howden Turbo Fans Oy) are gratefully acknowledged. The cooperation of Elisabeth Johansson and Jan Björk from the corrosion lab at Avesta R&D Center is sincerely acknowledged. A huge thanks goes to colleagues Vahid A. Hosseini, Kenneth Andersson, and Mattias Ottosson at University West for their support. Finally, the encouragement from Lars-Erik Svensson is highly appreciated.
Conflicts of Interest
The authors declare no conflict of interest.
References
- Charles, J. Duplex Stainless Steels, a Review after DSS’07 Held in Grado. In Proceedings of the Duplex Stainless Steel Conference, Maastricht, The Netherlands, 21–23 October 2009; pp. 1–22. [Google Scholar]
- Van der Mee, V.; Neessen, F.; Chadha, V. Welding Duplex Stainless Steel- Industry Guide. In Proceedings of the Duplex Stainless Steel Conference, Beaune, France, 13–15 October 2010; pp. 619–632. [Google Scholar]
- Wåle, J.; Utterström, P. Environmentally Induced Cracking of Duplex Stainless Steels in the Pulp & Paper Industry. In Proceedings of the Duplex Stainless Steel Conference, Beaune, France, 13–15 October 2010; pp. 203–208. [Google Scholar]
- Wensley, A. Duplex in the Pulp and Paper Industry—the Good, the Bad, and the Ugly. In Proceedings of the Duplex Stainless Steel Conference, Beaune, France, 13–15 October 2010; pp. 775–786. [Google Scholar]
- Thierry, D.; Larché, N.; Eidhagen, J.; Kivisäkk, U.; Cassagne, T.; Mehus, L. Service Performance of Super Duplex Umbilical Tubing within the Umbilical Design. In Proceedings of the Duplex Stainless Steel Conference, Beaune, France, 13–15 October 2010; pp. 517–528. [Google Scholar]
- Turbeville, E.; Busschaert, F.; Benum, S.; Madsen, B. A Summary of Recent Experience on Designing and Fabricating Subsea Oil and Gas Production Systems with 22Cr and 25Cr Piping Materials. In Proceedings of the Duplex Stainless Steel Conference, Beaune, France, 13–15 October 2010; pp. 545–560. [Google Scholar]
- Karlsson, L. Intermetallic Phase Precipitation in Duplex Stainless Steels and Weld Metals: Metallurgy, Influence on Properties, Welding and Testing Aspects; Welding Research Council Bulletin; Welding Research Council: New York, NY, USA, 1999; Volume 438. [Google Scholar]
- Karlsson, L.; Rigdal, S.; Pak, S. Effects of Elemental Distribution on Precipitation Behaviour and Properties of Duplex Stainless Steel Weldments. In Proceedings of the Duplex Stainless Steel Conference, Venice, Italy, 17–20 October 2000. [Google Scholar]
- Hosseini, V.; Karlsson, L.; Engelberg, D.; Wessman, S. Time-Temperature-Precipitation and Property Diagrams for Super Duplex Stainless Steel Weld Metals. Weld. World 2018, 62, 517–533. [Google Scholar] [CrossRef] [Green Version]
- Hosseini, V.; Karlsson, L.; Wessman, S.; Fuertes, N. Effect of Sigma Phase Morphology on the Degradation of Properties in a Super Duplex Stainless Steel. Materials 2018, 11, 933. [Google Scholar] [CrossRef] [PubMed] [Green Version]
- Hosseini, V.; Hurtig, K.; Karlsson, L. Bead by Bead Study of a Multipass Shielded Metal Arc-Welded Super-Duplex Stainless Steel. Weld. World 2020, 64, 283–299. [Google Scholar] [CrossRef] [Green Version]
- Hosseini, V. Influence of Multiple Welding Cycles on Microstructure and Corrosion Resistance of a Super Duplex Stainless Steel. Licentiate Thesis, University West, Trollhättan, Sweden, 2016. [Google Scholar]
- Valiente Bermejo, M.A.; Hurtig, K.; Eyzop, D.; Karlsson, L. A New Approach to the Study of Multi-Pass Welds–Microstructure and Properties of Welded 20-Mm-Thick Superduplex Stainless Steel. Appl. Sci. 2019, 9, 1050. [Google Scholar] [CrossRef] [Green Version]
- Avesta Welding AB. How to Weld Duplex Stainless Steels. In Technical Document 10601EN-GB; Avesta Welding AB: Avesta, Sweden, 2006. [Google Scholar]
- Metrode Products Ltd. Welding Guidelines for Duplex & Superduplex Stainless Steels; Metrode Products Ltd.: Chertsey, UK, 2005. [Google Scholar]
- Pettersson, C.-O.; Fager, S.-Å. Welding Practice for the Sandvik Duplex Stainless Steels SAF 2304, SAF 2205 and SAF 2507; Technical Document S-91-57; AB Sandvik Steel: Sandviken, Sweden, 1995. [Google Scholar]
- Karlsson, L. Welding Duplex Stainless Steels—A Review Of Current Recommendations. Weld. World 2012, 56, 65–76. [Google Scholar] [CrossRef]
- Swedish Standards Institute. Destructive Tests on Welds in Metallic Materials-Impact Test-Test Specimen Location, Notch Orientation and Examination; Swedish Standards Institute: Stockholm, Sweden, 2012. [Google Scholar]
- Swedish Standards Institute. Destructive Tests on Welds in Metallic Materials-Transverse Tensile Test; Swedish Standards Institute: Stockholm, Sweden, 2012. [Google Scholar]
- Swedish Standards Institute. Destructive Tests on Welds in Metallic Materials-Longitudinal Tensile Test on Weld Metal in Fusion Welded Joints; Swedish Standards Institute: Stockholm, Sweden, 2011. [Google Scholar]
- ASTM International. Standard Test Methods for Pitting and Crevice Corrosion Resistance of Stainless Steels and Related Alloys by Use of Ferric Chloride Solution; ASTM International: West Conshohocken, PA, USA, 2011. [Google Scholar]
- Standard, Norsok. NORSOK Standard M-601: Welding and Inspection of Piping; Standards Norway: Lysaker, Norway, 2004. [Google Scholar]
- ASTM International. Standard Test Method for Electrochemical Critical Pitting Temperature Testing of Stainless Steels; ASTM International: West Conshohocken, PA, USA, 1999. [Google Scholar]
- Sales, A.M.; Westin, E.M.; Jarvis, B.L. Effect of Nitrogen in Shielding Gas of Keyhole GTAW on Properties of Duplex and Superduplex Welds. Weld. World 2017, 61, 1133–1140. [Google Scholar] [CrossRef]
- Hosseini, V.; Karlsson, L. Physical and Kinetic Simulation of Nitrogen Loss in High Temperature Heat Affected Zone of Duplex Stainless Steels. Materialia 2019, 6, 100325. [Google Scholar] [CrossRef]
- Nilsson, J.-O.; Chai, G. The Physical Metallurgy of Duplex Stainless Steels. In Proceedings of the Duplex Stainless Steel Conference, Beaune, France, 13–15 October 2010; pp. 369–390. [Google Scholar]
- Ramirez, A.J.; Brandi, S.D.; Lippold, J.C. Secondary Austenite and Chromium Nitride Precipitation in Simulated Heat Affected Zones of Duplex Stainless Steels. Sci. Technol. Weld. Join. 2004, 9, 301–313. [Google Scholar] [CrossRef]
- Nilsson, J.-O.; Karlsson, L.; Andersson, J.-O. Secondary Austenite Formation and Its Relation to Pitting Corrosion in Duplex Stainless Steel Weld Metal. Mater. Sci. Technol. 1995, 11, 276–283. [Google Scholar] [CrossRef]
- Hosseini, V.; Hurtig, K.; Karlsson, L. Effect of Multipass TIG Welding on the Corrosion Resistance and Microstructure of a Super Duplex Stainless Steel: Multipass Welding of a Super Duplex Stainless Steel. Mater. Corros. 2017, 68, 405–415. [Google Scholar] [CrossRef]
- Yousefieh, M.; Shamanian, M.; Saatchi, A. Influence of Step Annealing Temperature on the Microstructure and Pitting Corrosion Resistance of SDSS UNS S32760 Welds. J. Mater. Eng. Perform. 2011, 20, 1678–1683. [Google Scholar] [CrossRef]
- Kobayashi, D.Y.; Wolynec, S. Evaluation of the Low Corrosion Resistant Phase Formed during the Sigma Phase Precipitation in Duplex Stainless Steels. Mat. Res. 1999, 2, 239–247. [Google Scholar] [CrossRef] [Green Version]
- American Welding Society. Welding Science and Technology, 9th ed.; American Welding Society: Miami, FL, USA, 2001; Volume 1. [Google Scholar]
Figure 1.
Locations for the transverse tensile test—Top means the upper part of the weldment, center is the central part of the weldment in the side, and root refers to the X root. The other side of the weld is considered symmetric.
Figure 1.
Locations for the transverse tensile test—Top means the upper part of the weldment, center is the central part of the weldment in the side, and root refers to the X root. The other side of the weld is considered symmetric.

Figure 2.
Welding sequence in weldment SA-R.

Figure 3.
Microstructural map of location of intermetallics and secondary phases in weldment SA-R.

Figure 4.
Sigma-phase (black phase) in weld pass 4, close to passes 5, 6, and 8.

Figure 5.
Secondary austenite (some areas marked with blue circles) in weld pass 3 close to the boundaries with weld passes 4 and 5.
Figure 5.
Secondary austenite (some areas marked with blue circles) in weld pass 3 close to the boundaries with weld passes 4 and 5.

Figure 6.
Cross-section showing high ferrite content in the surface of the SA-R weldment.

Figure 7.
Welding sequence in weldment SA-H. Weld pass 1 is not visible, probably re-melted by both weld pass 2 and weld pass 5.
Figure 7.
Welding sequence in weldment SA-H. Weld pass 1 is not visible, probably re-melted by both weld pass 2 and weld pass 5.

Figure 8.
Microstructural map of location of intermetallics and secondary phases in weldment SA-H.

Figure 9.
(a) Microstructure of non-reheated weld metal (in weld pass 8). (b) Microstructure of weld metal re-heated twice (in weld pass 6). The growth of the intergranular and Widmanstätten austenite is observed in the re-heated weld metal.
Figure 9.
(a) Microstructure of non-reheated weld metal (in weld pass 8). (b) Microstructure of weld metal re-heated twice (in weld pass 6). The growth of the intergranular and Widmanstätten austenite is observed in the re-heated weld metal.


Figure 10.
HT-HAZ close to weld pass 2 and weld pass 3 in experiment SA-H, showing secondary austenite (areas marked in blue).
Figure 10.
HT-HAZ close to weld pass 2 and weld pass 3 in experiment SA-H, showing secondary austenite (areas marked in blue).

Figure 11.
Welding sequence in weldment GM-R.

Figure 12.
Microstructural map of location of intermetallics and secondary phases in weldment GM-R.

Figure 13.
Secondary austenite in weld pass 2 with the intersection of weld passes 3, 4, and 18.

Figure 14.
Very few locations showing sigma-phase (dark etching) in weld pass 1.

Figure 15.
Impact toughness results. The absorbed energy in Joules has been plotted versus the testing location. (a) image: test conducted at −46 °C. (b) test conducted at room temperature. CW: coupons extracted from the root of the weld section and notch in the weld; CF: coupons extracted from the root of the weld section and notch in the fusion line + 2 mm; TW: coupons extracted from the bulk weld (side 1) and notch in the weld; TF: coupons extracted from the bulk weld (side 1) and notch in the fusion line +2 mm. The error bars show the standard deviation of the mean absorbed energy for each set of specimens.


Figure 16.
Results of the transverse tensile test: Yield strength (Rp 0.2%) and tensile strength (Rm) values are plotted versus the testing location. Test locations defined in Figure 1. The error bars refer to the standard deviation of the mean value in each set of experiments.
Figure 16.
Results of the transverse tensile test: Yield strength (Rp 0.2%) and tensile strength (Rm) values are plotted versus the testing location. Test locations defined in Figure 1. The error bars refer to the standard deviation of the mean value in each set of experiments.

Figure 17.
Results of the longitudinal tensile test: yield strength (Rp 0.2%) and tensile strength (Rm) values are plotted versus the testing location. WM is the bulk weld metal from the center of side 1, and Root refers to the weld metal in the X-root.
Figure 17.
Results of the longitudinal tensile test: yield strength (Rp 0.2%) and tensile strength (Rm) values are plotted versus the testing location. WM is the bulk weld metal from the center of side 1, and Root refers to the weld metal in the X-root.

Figure 18.
Welding time to produce a complete weldment for each experiment. The number of weld passes is included in the figure.
Figure 18.
Welding time to produce a complete weldment for each experiment. The number of weld passes is included in the figure.


Table 1.
Designation and chemical analysis (wt.%) of the plate and the fillers. For the GMAW and SAW wires, it refers to the wire composition (EN 10204-3.1), whilst for the flux it refers to all-weld metal (flux + 2594 wire), and it is a typical composition (EN10204-2.2). NR—not reported by the manufacturer.
| Product and Designation | C | Si | Mn | P | S | Cr | Ni | Mo | Cu | N | W |
|---|---|---|---|---|---|---|---|---|---|---|---|
| SDX 2507 33 mm thickness plate | 0.015 | 0.34 | 0.74 | 0.021 | 0.001 | 24.97 | 6.89 | 3.80 | 0.200 | 0.275 | 0.046 |
| GMAW: AWS SFA5.9 ER2594 ø 1.2 mm | 0.015 | 0.40 | 0.61 | 0.014 | 0.001 | 25.23 | 9.22 | 4.04 | 0.09 | 0.260 | 0.04 |
| SAW wire: AWS SFA5.9 ER2594 ø 2.4 mm | 0.012 | 0.44 | 0.60 | 0.015 | 0.001 | 24.94 | 9.21 | 3.88 | 0.09 | 0.260 | 0.008 |
| SAW All-weld metal. Flux: EN ISO 14174: S A AF 2 DC. | 0.01 | 0.45 | 0.6 | NR | NR | 22.5 | 9.2 | 4.0 | NR | 0.26 | NR |
Table 2.
Experiments and welding procedures—summary.
| Ref. | Welding Layout | Pass | Current (A) | Voltage (V) | Welding Speed (mm/s) | Arc Energy (kJ/mm) | Average Interpass T (°C) |
|---|---|---|---|---|---|---|---|
| GM-R |  | 1 | 209 | 31.7 | 4.2 | 1.58 | 25 |
| 2–18 | 207–246 | 31.9–28.9 | 5.5 | 1.18–1.29 | Side 1: 65 Side 2: 76 | ||
| SA-R |  | 1/side 1 | 450 | 28 | 8.3 | 1.5 | 20 |
| 2–17 | 450 | 30 | 10.8 | 1.2 | Side 1: 74 Side 2: 81 | ||
| SA-H |  | 1/side 1 | 450 | 28 | 8.3 | 1.5 | 24 |
| 2–4/side 1 | 450–550 | 30 | 6.7–8.3 | 2.0 | 140 | ||
| 5–8/side 2 | 500 | 30 | 6.7 | 2.3 | 180 |
Table 3.
Ferrite content evaluated by image analysis.
| Weldment | % Ferrite (Average Values) | |||||||||
|---|---|---|---|---|---|---|---|---|---|---|
| WM Top | Std | WM Center | Std | WM Root | Std | WM Overall | StD | HAZ | Std | |
| SA-R | 52 | 5 | 51 | 3 | 59 | 2 | 53 | 5 | 64 | 4 |
| SA-H | 51 | 4 | 49 | 3 | 51 | 3 | 51 | 4 | 61 | 7 |
| GM-R | 59 | 3 | 52 | 5 | 56 | 4 | 56 | 5 | 65 | 4 |
Table 4.
Chemical composition of the weldments: average values and standard deviations.
| Weldment | wt. (%) | ||||||||||
|---|---|---|---|---|---|---|---|---|---|---|---|
| Cr | Ni | Mo | C | Si | Mn | P | S | Cu | N | O | |
| SA-R | 24.5 +/− 0.1 | 8.2 +/− 0.5 | 4.0 +/− 0.0 | 0.04 +/− 0.01 | 0.5 +/− 0.0 | <0.8 | 0.02 +/− 0.00 | 0.005 +/− 0.000 | 0.1 +/− 0.0 | 0.248 +/− 0.004 | 0.045 +/− 0.005 |
| SA-H | 24.5 +/− 0.2 | 7.9 +/− 0.4 | 4.0 +/− 0.1 | 0.04 +/− 0.01 | 0.4 +/− 0.0 | <0.8 | 0.02 +/− 0.00 | 0.004 +/− 0.000 | 0.2 +/− 0.0 | 0.256 +/− 0.011 | 0.051 +/− 0.013 |
| GM-R | 24.9 +/− 0.1 | 8.6 +/− 0.3 | 4.1 +/− 0.1 | 0.04 +/− 0.00 | 0.4 +/− 0.0 | <0.8 | 0.02 +/− 0.00 | 0.004 +/− 0.001 | 0.1 +/− 0.0 | 0.228 +/− 0.005 | 0.013 +/− 0.004 |
Table 5.
Results of ASTM G48E and ASTM G150 corrosion tests, including CPT, location of pitting initiation, and microstructural features.
Table 5.
Results of ASTM G48E and ASTM G150 corrosion tests, including CPT, location of pitting initiation, and microstructural features.
| Weldment | ASTM G48E | ASTM G150 | ||
|---|---|---|---|---|
| CPT (°C) | Section Investigated and Microstructural Features Observed | CPT * (°C) | Location of Pitting Initiation | |
| GM-R | 60 | - | - | - |
| SA-R | 45 | Section investigated includes weld pass 2 (showing nitrides), weld pass 3 (showing ɣ2), weld pass 4 (showing nitrides +σ-phase), and HAZ (showing nitrides). | 64.7 | In the weld metal |
| SA-H | 55 | Section investigated includes weld pass 7 (showing ɣ2), weld pass 8 (free from secondary phases), and HAZ (showing nitrides and ɣ2). | 70.9 | In the HAZ |
* Not strictly critical pitting corrosion temperature because of the differences in the time settings with the standard.
Publisher’s Note: MDPI stays neutral with regard to jurisdictional claims in published maps and institutional affiliations. |
© 2021 by the authors. Licensee MDPI, Basel, Switzerland. This article is an open access article distributed under the terms and conditions of the Creative Commons Attribution (CC BY) license (https://creativecommons.org/licenses/by/4.0/).
Share and Cite
MDPI and ACS Style
Valiente Bermejo, M.A.; Eyzop, D.; Hurtig, K.; Karlsson, L. Welding of Large Thickness Super Duplex Stainless Steel: Microstructure and Properties. Metals 2021, 11, 1184. https://0-doi-org.brum.beds.ac.uk/10.3390/met11081184
AMA Style
Valiente Bermejo MA, Eyzop D, Hurtig K, Karlsson L. Welding of Large Thickness Super Duplex Stainless Steel: Microstructure and Properties. Metals. 2021; 11(8):1184. https://0-doi-org.brum.beds.ac.uk/10.3390/met11081184
Chicago/Turabian StyleValiente Bermejo, Maria Asuncion, Daniel Eyzop, Kjell Hurtig, and Leif Karlsson. 2021. "Welding of Large Thickness Super Duplex Stainless Steel: Microstructure and Properties" Metals 11, no. 8: 1184. https://0-doi-org.brum.beds.ac.uk/10.3390/met11081184
Note that from the first issue of 2016, this journal uses article numbers instead of page numbers. See further details here.