
Hydrogen Degassing of Zirconium under High-Vacuum Conditions


1
Laboratory for Nuclear Materials, Paul Scherrer Institut PSI, 5232 Villigen, Switzerland
2
Laboratory for Reactor Physics and Thermal-Hydraulics, Paul Scherrer Institut PSI, 5232 Villigen, Switzerland
*
Author to whom correspondence should be addressed.
Metals 2022, 12(5), 868; https://0-doi-org.brum.beds.ac.uk/10.3390/met12050868
Submission received: 9 March 2022
/
Revised: 9 May 2022
/
Accepted: 16 May 2022
/
Published: 19 May 2022
(This article belongs to the Special Issue Advanced Characterization and Testing of Nuclear Materials)
Abstract
:Micromechanics techniques, such as nano-indentation and micro-pillar compression, can be applied to study hydrogen-charged zirconium alloys at elevated temperatures, which is highly relevant for the nuclear industry. Such experiments are often conducted inside a scanning electron microscope (SEM) under high-vacuum conditions (10−5 mbar). The combination of a high-temperature and high-vacuum environment causes some hydrogen to escape from the sample into the chamber. Although this effect is evident at temperatures above 600 °C, the extent of hydrogen desorption at lower temperatures is still unclear. In the presented study, the desorption of hydrogen was assessed in zirconium cladding tube material under temperature and hydrogen content conditions comparable to those faced by used nuclear fuel during dry storage. The measured hydrogen loss due to the high vacuum was compared to the simulations obtained using an extended version of a hydrogen behavior tool developed at PSI.
1. Introduction
The in-reactor lifetime of zirconium-clad nuclear fuel assemblies is partially determined by the hydrogen pickup due to the clad waterside oxidation. Understanding how hydrogen affects the mechanical properties of zirconium-based claddings and ensuring the mechanical integrity of nuclear fuel rods are of primary importance, especially during the long-term storage phase.
The temperature of the nuclear fuel clad during storage varies over time due to the combination of the generated decay heat and the varying cooling capacity of the storage media. Evaluating the mechanical properties of zirconium alloys in conditions relevant to the industry necessarily implies testing the material at elevated temperatures (up to 500 °C) and in the presence of hydrogen (up to 1000 parts per million by weight (wppm)).
Recent developments in micromechanics techniques, such as nano-indentation and micro-pillar compression, allow a deeper understanding of the mechanical response of a material in connection to dislocation movement and interaction. Such tests are normally conducted inside a SEM in order to control and assess the induced mechanical response of the material. In situ heating allows the direct study of the effect of temperature on specific deformation mechanisms.
Applying such testing techniques to the study of the effect of hydrogen in zirconium alloys at elevated temperatures would clearly benefit the field. However, hydrogen at the typical pressures found in commercial SEMs (<10−5 mbar) is not stable inside the metal, and tends to escape into the chamber.
Understanding the degassing rate as a function of the temperature and hydrogen content at pressures typical for SEM analysis would therefore provide information for improving the use of state-of-the-art micromechanical techniques in the study of the hydrogen effects in zirconium at elevated temperatures.
In the presented study, the desorption of hydrogen was studied in Zircaloy-4 cladding tube material enriched with 100 or 350 wppm of hydrogen held at temperatures between 200 and 400 °C, and at a constant pressure of 10−6 mbar. The experiments were simulated using a hydrogen behavior tool developed at PSI. In this work, the aforementioned techniques were enhanced by implementing hydrogen desorption.
2. Methods
Two Zircaloy-4 cladding sections approximately 15 cm in length were used in this study. The samples were enriched in hydrogen to a target concentration of ~100 or ~350 wppm. The samples were sectioned, and the resulting rings were exposed to high-vacuum conditions at temperatures of 200 to 400 °C for a hold time of 6 to 48 h. The resulting hydrogen concentration prior to and after exposure to the high-vacuum/high-temperature environment was measured using the hot extraction method. The measured difference was used to indicate the amount of hydrogen desorption that had occurred, and a numerical simulation was performed to help interpret the experimental results. The details of each step are presented in the following sections.
2.1. Hydrogenation Procedure
The zirconium sections were enriched in hydrogen employing a method based on absorption and diffusion of gaseous hydrogen at 400 °C under high-vacuum conditions, as described by Gong et al. [1]. To facilitate hydrogen charging, the sections were polished with 2000 grit silica grinding paper and subsequently cleaned in acetone, followed by 3 min of an ultrasonic bath in ethanol. The samples were then blow-dried and weighted on a precision scale. The outer edges of the tube were then painted with high-temperature paint to prevent excessive localization of the hydrogenation due to shape effects.
The hydrogenation relied on archiving high-vacuum (10−7 mbar) conditions in the vacuum chamber to degas the sample prior to the exposure to a small atmosphere (~3 to 10 mbar) of pure hydrogen at high temperature. Once the sample was inserted into the chamber, the high vacuum pulled at room temperature for at least 12 h. The tubes were positioned, one at a time, inside the oven, balanced on supporting ceramic studs in the middle of the chamber, equidistant from the oven walls and heating elements. The tubes and vacuum chamber were then flushed three times with hydrogen at 100 mbar, where the high-vacuum condition was restored after each flush. The temperature of the system was then raised to the hydrogenation temperature and kept constant for at least 24 h to induce desorption of the residual humidity from the surfaces of the sample and environmental chamber. Controlled hydrogenation was achieved by controlling the initial () and final () pressure of hydrogen atmosphere as:
where is the sample weight in grams (g), is the target hydrogen content in wppm and is a dimensionless calibration factor that, for a furnace temperature of 400 °C, is .
Following the high-vacuum/high-temperature state, 107 and 352 wppm of hydrogen were loaded into the first and second samples, respectively, named S100 and S350, respectively. The hydrogenation process was conducted at 400 °C for the samples with high and low hydrogen contents.
In the sample enriched to 100 wppm, the charging temperature was much higher than the solid solubility limit, as reported by Motta et al. [2]. Therefore, the target concentration was achieved after one charging process. The sample charged at 350 wppm was at the solubility limit of hydrogen in zirconium at the charging temperature of 400 °C. To obtain such concentration, multiple gaseous loadings followed by homogenization were necessary, as shown in Table 1. Higher charging temperatures were not possible due to limitations of the equipment and we wanted to avoid allotropic transformations of the material.
After the hydrogenation process, the samples were subjected to homogenization process at 400 °C for 24 h conducted at ambient pressure, followed by quenching in water, to uniformly distribute the hydrogen along the radial direction. A picture of the hydrogenation equipment is provided in Figure 1, whereas the hydrogen chamber pressure at the moment of hydrogen injection and after hydrogen absorption is presented in Table 1.
2.2. Sample Sectioning and Exposure to High-Vacuum/High-Temperature Conditions
After hydrogenation, the ~15 cm tubes were sectioned in 5 mm sections, as shown in Figure 2. The first section of each sample was discharged, whereas the subsequent sections 1–10 were used for the analysis. At regular intervals of 10 mm, reference samples were reserved for gas extraction without any exposure to high-vacuum/high-temperature conditions (R1, R2, and R3). The remaining rings were subjected to high-vacuum conditions (10−6 mbar) at 200, 300, or 400 °C for 6, 12, 24, or 48 h. The test conditions for each sample are reported in Table 2. The hydrogen-desorption procedure was conducted in the same apparatus used for the hydrogen charging (presented in Figure 1). The heating was conducted by a resistive oven for irradiation through a temperature-resistant glass tube, whereas the high-vacuum condition was obtained by the usage of a turbomolecular pump.
2.3. Hydrogen Determination
The overall hydrogen concentration in samples can be effectively measured through hot gas vacuum extraction (HVE). During HVE, the sample was heated up to 1100 °C in high vacuum while a turbomolecular pump transferred the evolved gasses to a collection chamber, where the gas was then analyzed with a mass spectrometer. The ideal size for HVE measurement is 0.1 g. The machine adopted for the measurements was the LECO ONH836 at the laboratory of Metal Physics and Technology at ETH Zürich. For each ring, the measurement was repeated three times. The machine was calibrated prior to use using titanium calibration pins for hydrogen determination, allowing a precision of wppm.
2.4. Hydrogen Desorption Simulation
Hydrogen desorption from zirconium alloys into a vacuum has been the subject of experimental studies. Terrani et al. studied desorption from δ-zirconium hydride [3] and derived a temperature-dependent desorption rate. The work of Terrani et al. was continued by Hu et al. [4]. The authors submitted δ-zirconium hydride samples to vacuum conditions, observed that the desorption rate varied with time, and three stages were distinguished: desorption from δ-zirconium hydride, desorption from the two-phase α+δ region, and desorption from α-zirconium. Hu et al. proposed a model reproducing the experimental data. In the first stage, the desorption rate is represented by the correlation proposed by Terrani et al. In the second stage, the two-phase moving boundary problem is assumed; in the last stage, the desorption rate is proportional to the square of the hydrogen concentration in solid solution, which is based on the studies of Naito [5] and Ichimura et al. [6]. Juillet et al. also used second-order kinetics to study hydrogen desorption from Zircaloy-4 samples with low hydrogen content [7]. The authors used sophisticated sensitivity analyses to fit the desorption constant to the experimental data.
Given the range of temperatures and hydrogen concentrations used in the current study, we assumed that second-order kinetics would be applicable. Th simulations presented in this paper were carried out using the PSI in-house hydrogen behavior tool. It solved the transport equation using the finite volume method in 1D in cylindrical coordinates. The tool included the hydrogen nucleation-growth-dissolution (HNGD) model, allowing predictable hydrogen thermochemistry and its kinetics [8]. The aforementioned tool was designed to study in-reactor and storage performance of zirconium-based cladding tubes used in Switzerland. In this study, the tool was extended to model hydrogen desorption under high vacuum conditions. The hydrogen desorption flux used in this study was the one proposed by Juillet et al. [7]:
where is the hydrogen concentration in the current time step, is the gas constant and is temperature. The hydrogen desorption flux boundary condition is imposed on both inner and outer cladding surfaces. Because the temperature distribution within the samples during the experiment was constant, the only force driving hydrogen flux was the hydrogen concentration gradient :
where is the diffusion coefficient, which is equal to [9]:
The HNGD model requires the hydrogen terminal solid solubility for dissolution () and precipitation . The correlations proposed by Boldt [10] for Zircaloy-4 were used in this study:
3. Results
3.1. Initial Hydrogen Concentration
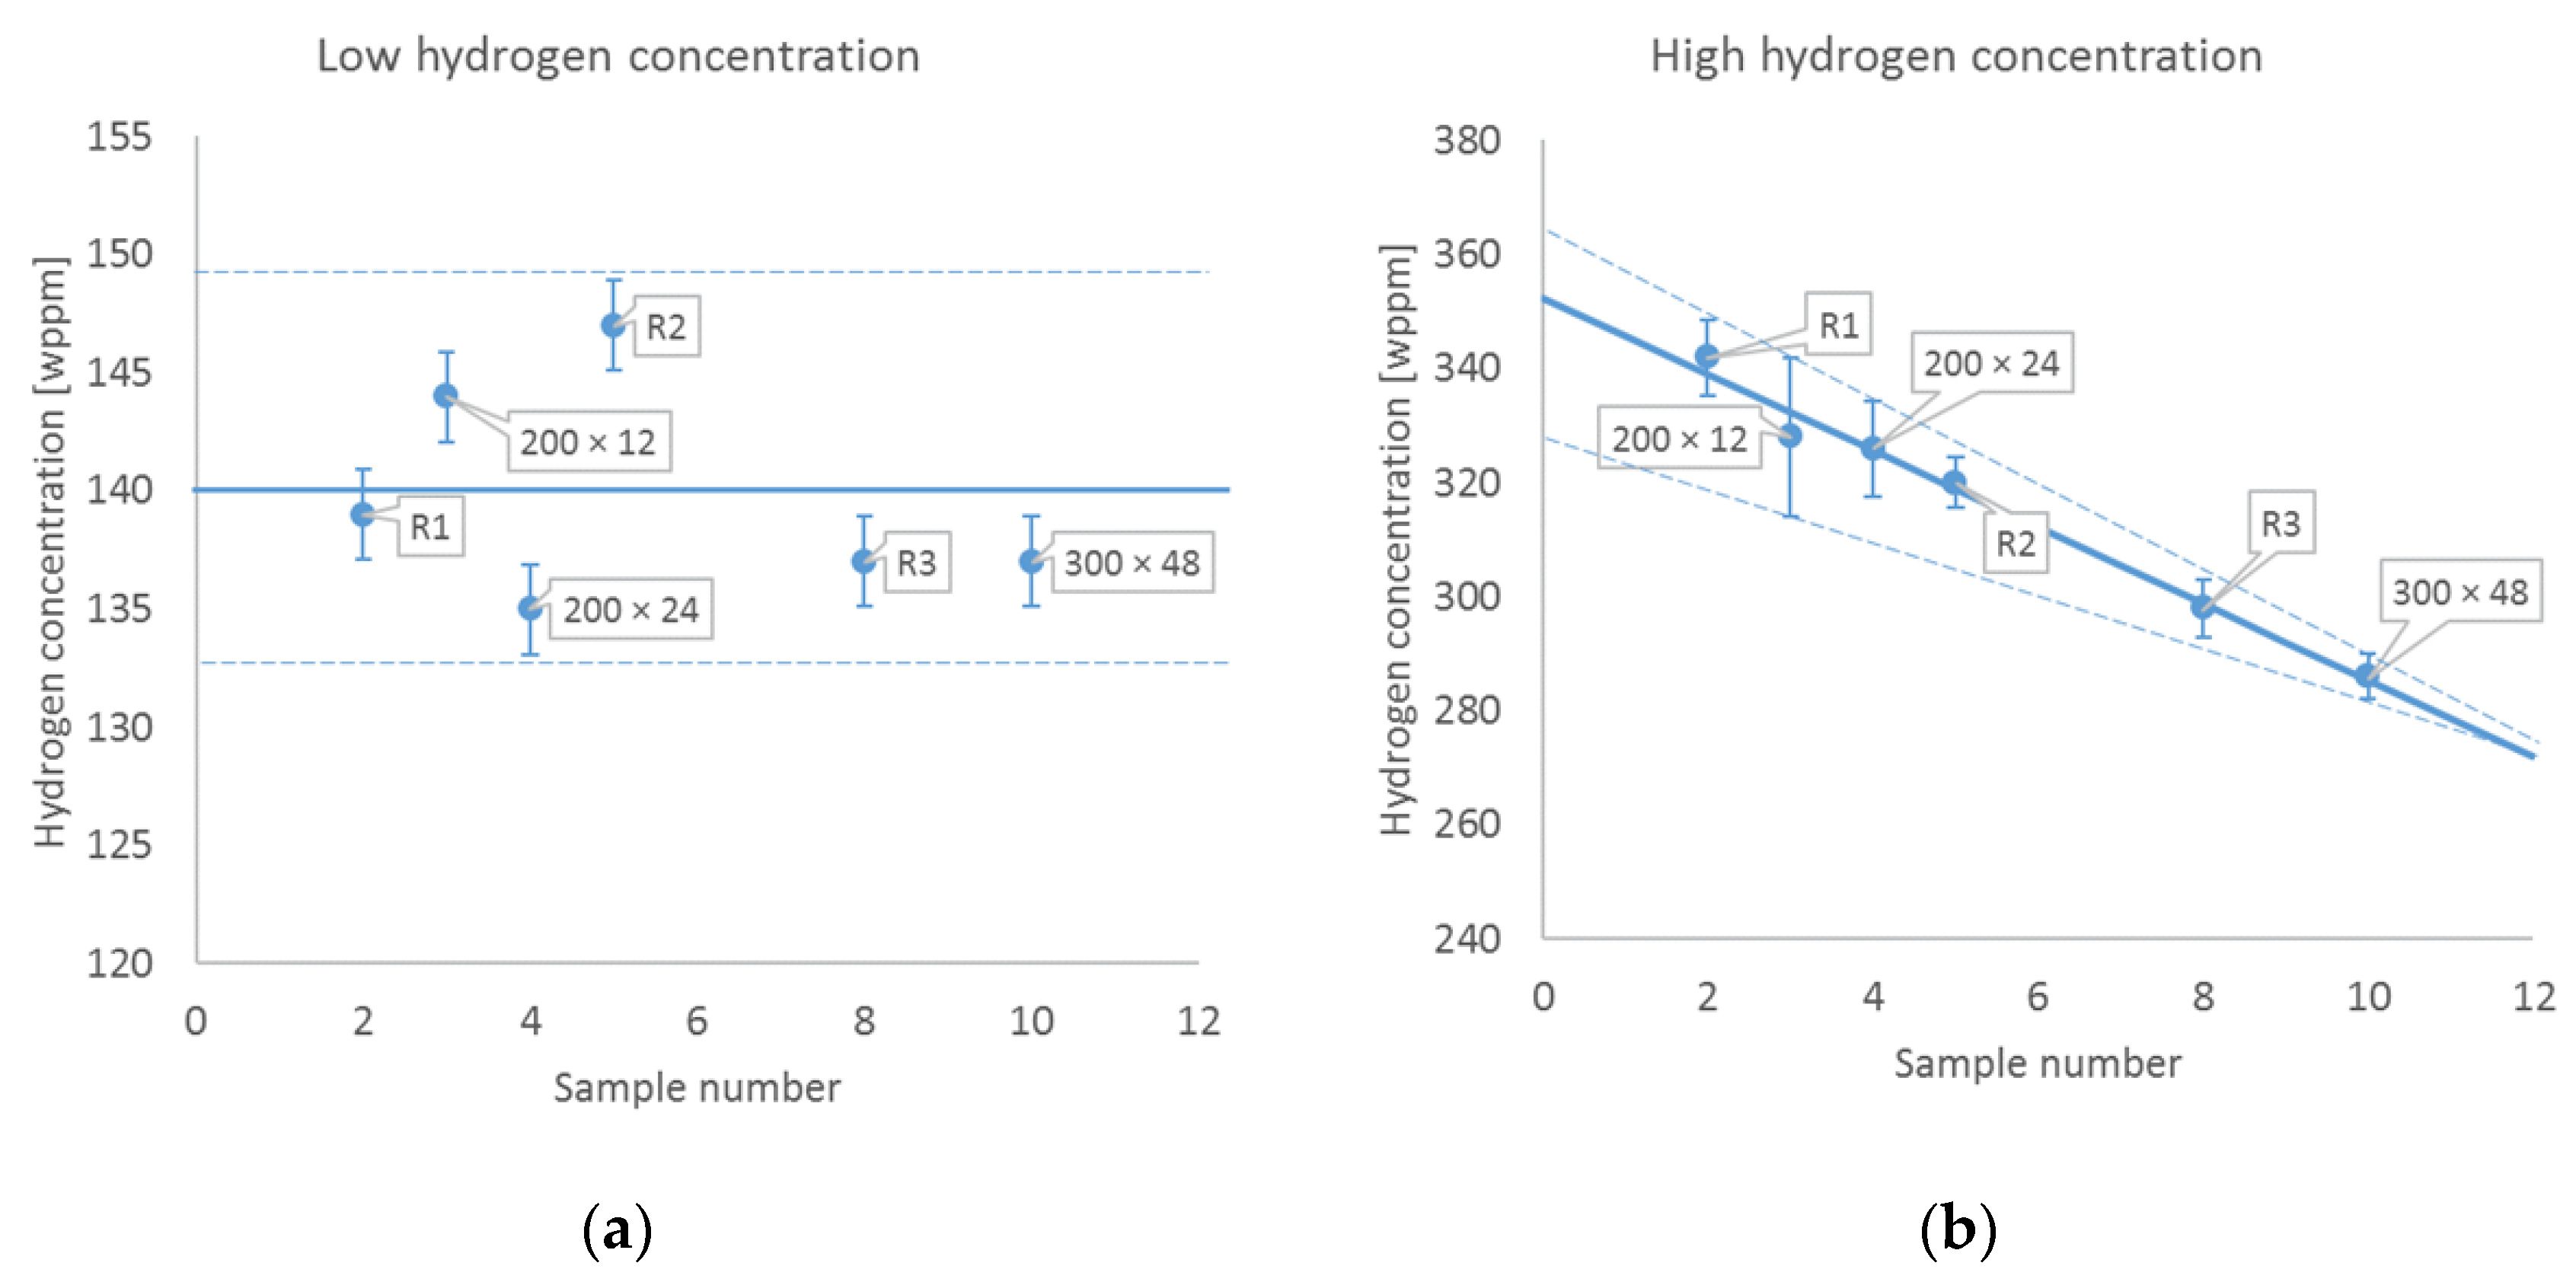
The initial hydrogen concentration in each sample prior to thermal treatment was determined based on the reference samples. According to Hu et al. [2], hydrogen desorption does not occur in the samples treated at low temperature such as 200 or 300 °C. Thus, the hydrogen content measured after the thermal treatment at these temperatures along with those of samples R1, R2, and R3, which were not submitted to thermal treatment, were used to determine the initial hydrogen concentration. As shown in the left subfigure in Figure 3, the samples with a low hydrogen concentration had an average content of 140 wppm (marked by a solid line), as measured by HVE. In the sample charged at the higher hydrogen content, visible in the right subfigure, the hydrogen concentration after gaseous charging linearly decreased from R1 towards R3. The effect probably occurred due to the temperature gradient inside the charging chamber, which is difficult to control and measure due to the absence of convection in the oven at low pressures during the charging process. The recorded difference in hydrogen content could be explained by a difference of about 40 °C along the length of the sample, which caused a variation in terminal solid solubility upon precipitation of H from the 290 wppm at 370 °C at one end of the sample to the 360 wppm expected at 410 °C at the other end of the sample, according to the solubility values reported by Motta et al. [2].
For determining the hydrogen desorption, therefore, the initial hydrogen concentration (marked by solid line) was expressed as a function of the sample number as:
3.2. Hydrogen Concentration after High-Vacuum/High-Temperature Exposure
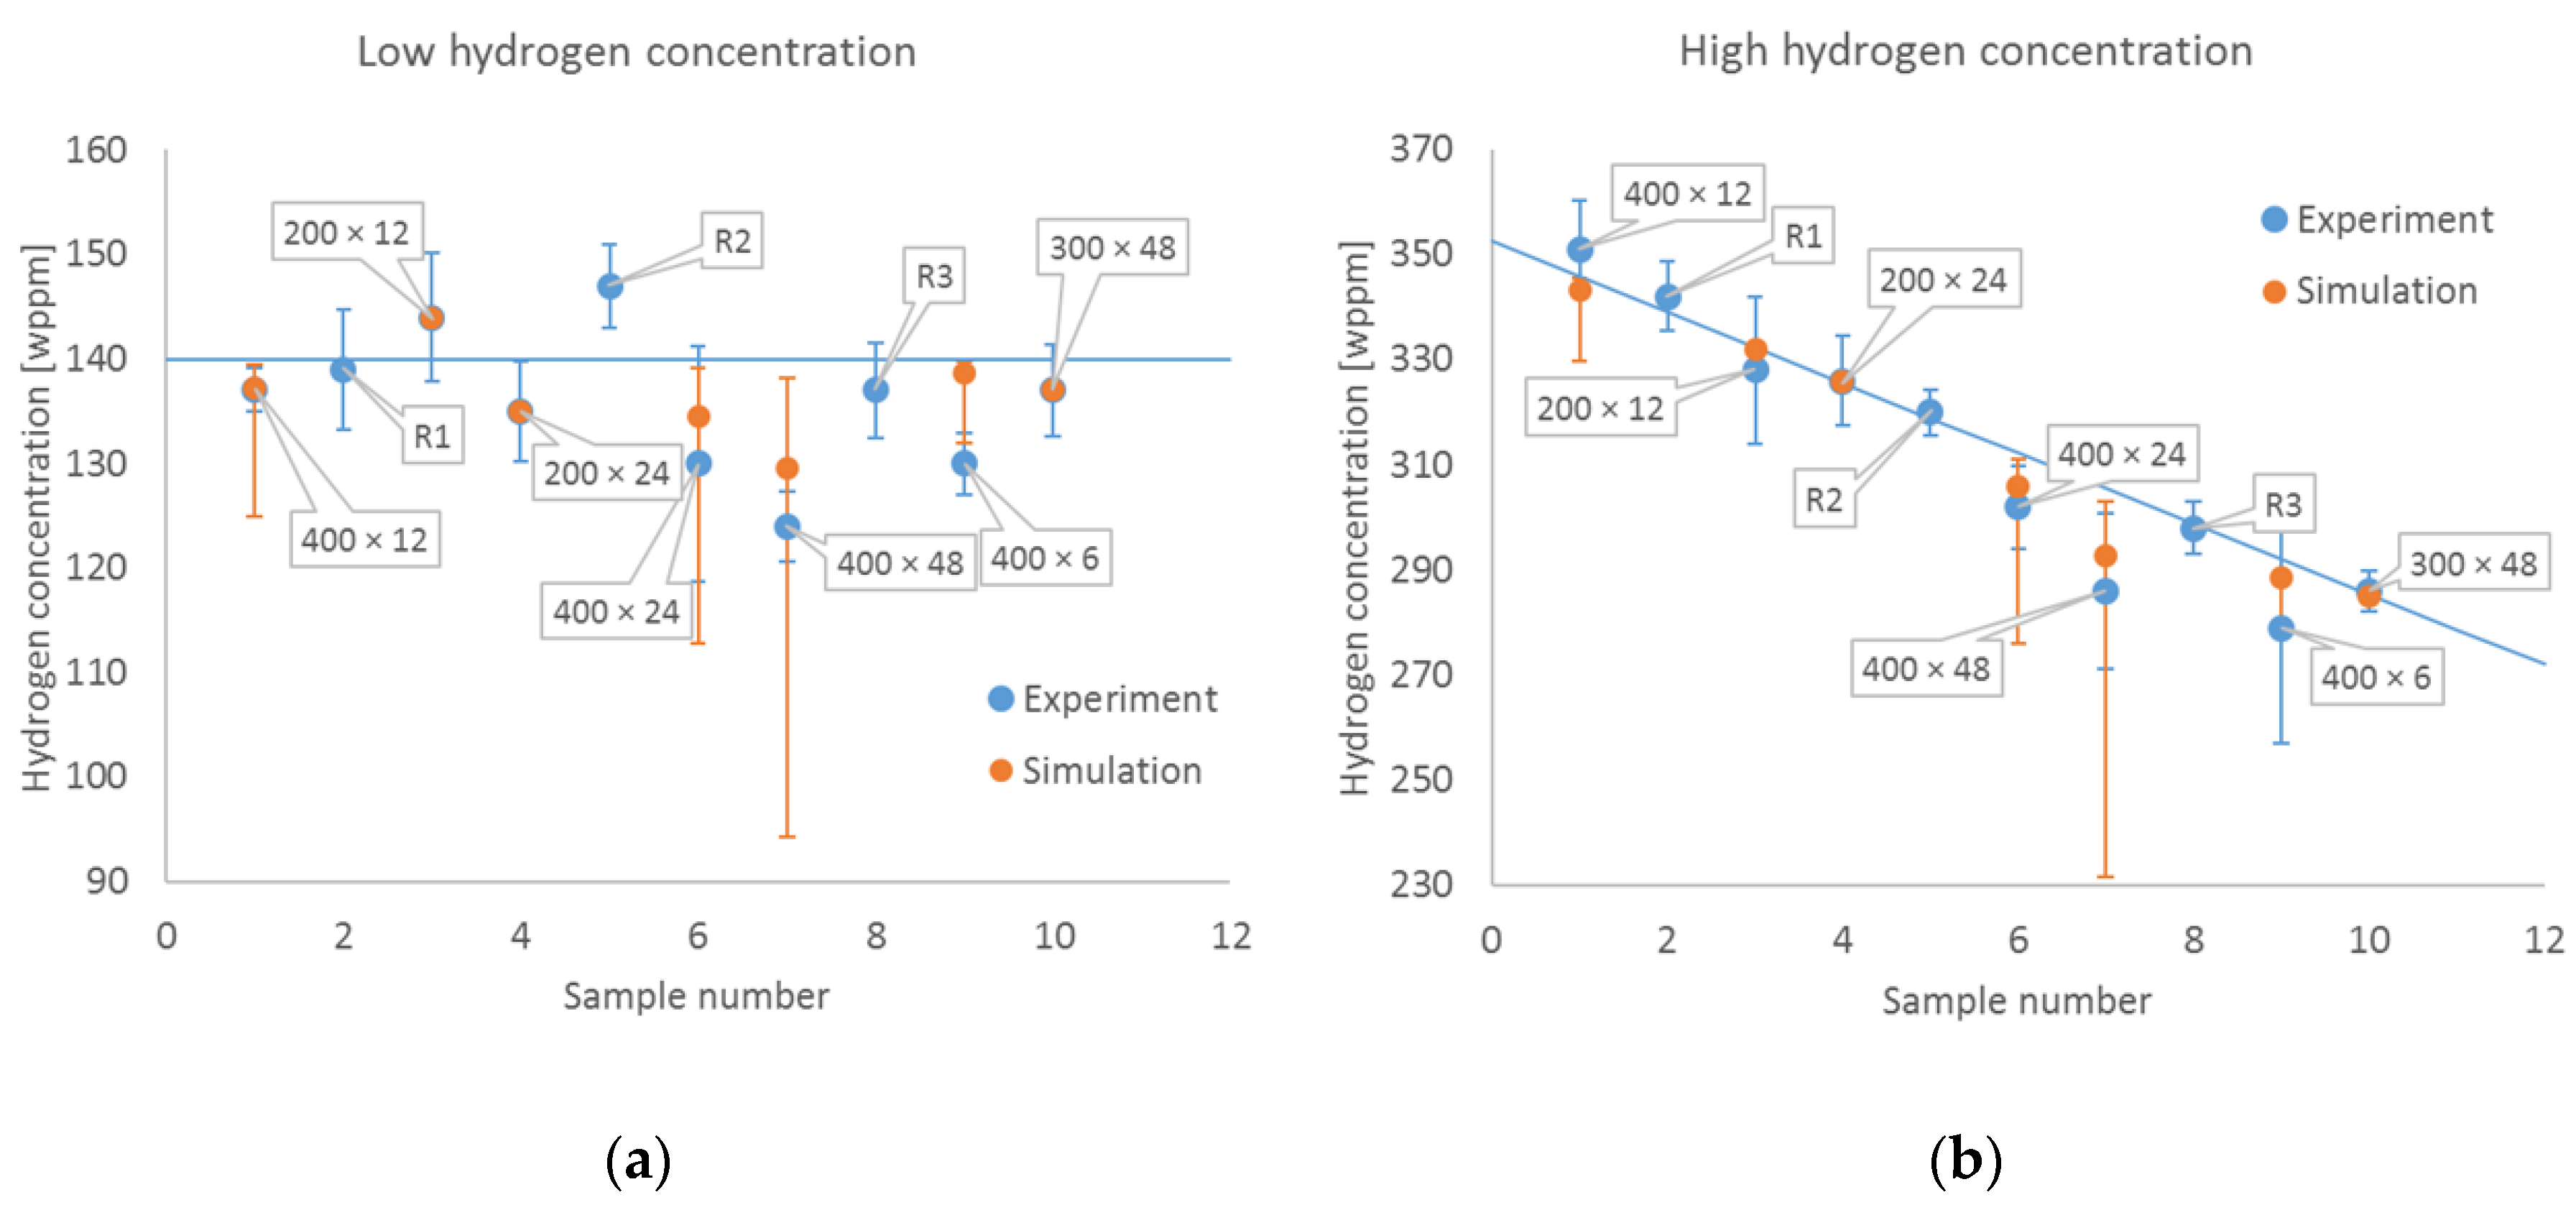
Each of the sample conditions were simulated, including the heating, holding, and cooling periods. The integral values calculated at the end of cooling are compared with the experimental data in Figure 4. The orange dots are the best estimate results, and the error bars were obtained by taking into account the uncertainty included in Equation (2). As shown, the samples treated at 200 and 300 °C did not exhibit any hydrogen content decrease, which is in agreement with other experimental observations [1,2]. The samples treated at 400 °C showed a visible change. In each case, the difference between the simulation and experiment was within the experimental and/or modeling uncertainty. However, the samples submitted to long thermal treatments were associated with very high modeling uncertainties, and the difference between the value accounting for the uncertainty and the best estimate result increased with the thermal treatment duration. For instance, the lower bound of sample 7 (400 × 48), which had high hydrogen concentration, was around 70 wppm lower than the best estimate result. Moreover, the upper and lower bounds were different because the modeling uncertainty significantly affected the amount of hydrogen desorbed from the sample.
Simulating the hydrogen radial profiles, we found no concentration gradient. The hydrogen escaping from the samples near the surfaces was quickly balanced by the hydrogen coming from the inner part. The lack of gradient was a consequence of faster hydrogen transport kinetics compared with desorption kinetics in the studied range of temperatures. The lack of hydrogen depletion near the surface proved that the samples were suitable for nano-indentation experiments, and the flat hydrogen radial profiles showed that the surface concentration was representative of the whole sample. This observation is in agreement with the statement presented by Juillet et al. [7]. Numerical analyses carried out by the authors revealed that hydrogen diffusion within the sample was not the desorption-rate-limiting factor.
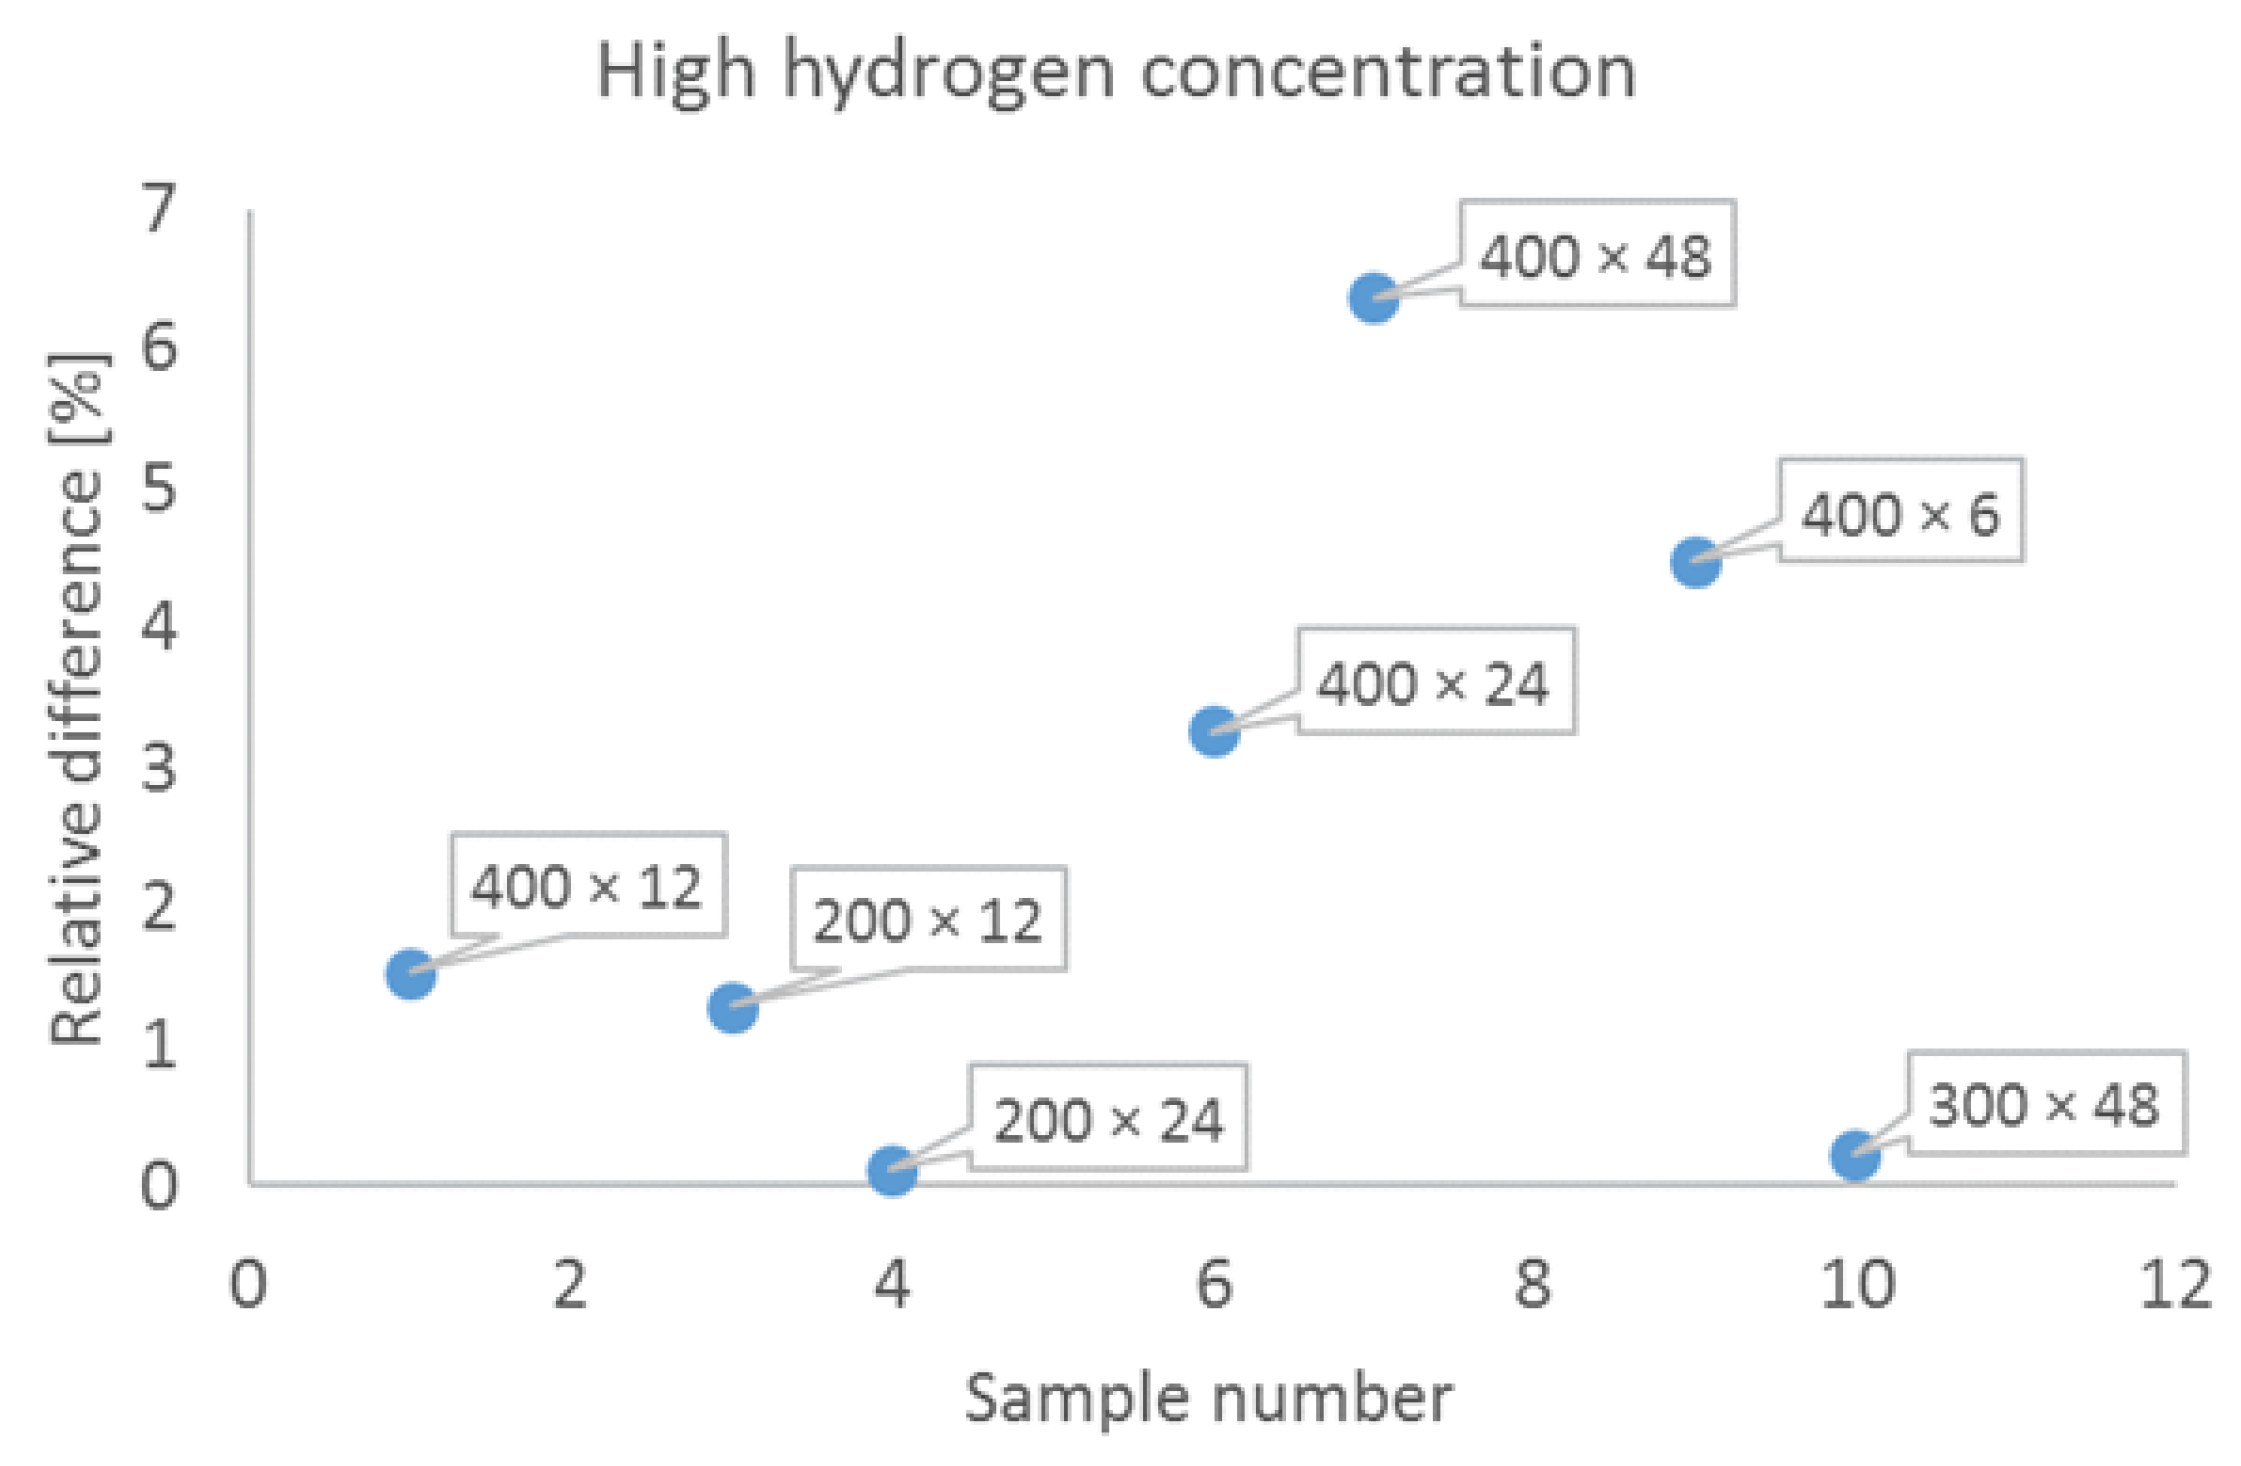
Figure 5 shows the relative difference between the initial estimated values and the measured ones. The relative difference was calculated according to Equation (8):
where and are the initial estimated concentration and the concentration measured after the thermal treatment, respectively. The relative differences of samples 6, 7, and 9 were higher compared with those of the other samples. These samples were treated at 400 °C, and the difference may have been due to desorption. Sample 1 was also submitted to 400 °C, but the difference remained small. This might have been caused by the wrong estimation of the initial value. As shown in the right side in Figure 3, the samples with low numbers were associated with higher uncertainties. A similar comparison for the low concentration samples was difficult due to the scatter of experimental data.
4. Conclusions
The hydrogen desorption in the tested conditions was minor compared with the uncertainty in the hydrogen content derived from the charging process in all the tests conducted at temperatures < 300 °C. In the tests conducted at 400 °C, a loss of 4 to 19 wppm was recorded with respect to the expected value, depending on the time and initial hydrogen concentration. The simulations are in agreement with the experimental values.
Modeling revealed the lack of radial hydrogen concentration gradients. We concluded that macroscale hydrogen diffusion does not have a significant impact on the hydrogen concentration near the surface because the hydrogen diffusion in the sample was faster than desorption from the surface. This finding is in line with the conclusion drawn by Juillet et al. [7], who stated that hydrogen diffusion is not the factor limiting the desorption rate. Consequently, surface measurements such as nano-indentation can be effectively conducted in high-vacuum/high-temperature conditions in hydrogen-rich zirconium samples.
In conclusion, micromechanical experiments in high-vacuum/high-temperature environments can be used as a tool to study the effect of hydrogen on the mechanical properties of zirconium alloys in the range of temperatures and hydrogen content relevant for the study of cladding mechanical behavior in dry storage conditions (T < 300 °C; H < 350 wppm).
Author Contributions
Conceptualization, F.F. and P.K.; methodology, F.F.; software, P.K.; validation, F.F. and P.K.; formal analysis, F.F. and P.K.; investigation, F.F. and P.K.; resources, F.F. and P.K.; data curation, F.F. and P.K.; writing—original draft preparation, F.F.; writing—review and editing, F.F. and P.K.; visualization, F.F. and P.K.; supervision, F.F. and P.K.; project administration, F.F. and P.K.; funding acquisition, F.F. and P.K. All authors have read and agreed to the published version of the manuscript.
Funding
We gratefully acknowledge the Swiss Federal Nuclear Safety Inspectorate (ENSI) for providing the financial means to conduct this work.
Data Availability Statement
Data resented in this article are available at request from the corresponding author.
Acknowledgments
We would like to thank Aaron W. Colldeweih and Robert Zubler for their support with the hydrogenation equipment; Mihai Stoica for his support with the hydrogen measurements by hot gas extraction; Johannes Bertsch, Liliana I. Duarte, and Jeffrey M. Wheeler for the scientific discussion that helped with the conceptualization of this article. Part of this wok was presented at the EUROSAFE Forum, Paris 2021, where it scored 3rd place in the ETSON Award competition.
Conflicts of Interest
The authors declare no conflict of interest. The funders had no role in the design of the study; in the collection, analyses, or interpretation of data; in the writing of the manuscript; or in the decision to publish the results.
References
- Gong, W.; Trtik, P.; Colldeweih, A.W.; Duarte, L.I.; Grosse, M.; Lehmann, E.; Bertsch, J. Hydrogen diffusion and precipitation in duplex zirconium nuclear fuel cladding quantified by high-resolution neutron imaging. J. Nucl. Mater. 2019, 526, 151757. [Google Scholar] [CrossRef]
- Motta, A.T.; Capolungo, L.; Chen, L.-Q.; Cinbiz, M.N.; Daymond, M.R.; Koss, D.A.; Lacroix, E.; Pastore, G.; Simon, P.-C.A.; Tonks, M.R.; et al. Hydrogen in zirconium alloys: A review. J. Nucl. Mater. 2019, 518, 440–460. [Google Scholar] [CrossRef] [Green Version]
- Terrani, K.A.; Balooch, M.; Wongsawaeng, D.; Jaiyen, S.; Olander, D.R. The kinetics of hydrogen desorption from and adsorption on zirconium hydride. J. Nucl. Mater. 2010, 397, 61–68. [Google Scholar] [CrossRef]
- Hu, X.; Terrani, K.A.; Wirth, B.D. Hydrogen desorption kinetics from zirconium hydride and zirconium metal in vacuum. J. Nucl. Mater. 2014, 448, 87–95. [Google Scholar] [CrossRef]
- Naito, S. Kinetics of hydrogen absorption by α-zirconium. J. Chem. Phys. 1983, 79, 3113–3120. [Google Scholar] [CrossRef]
- Ichimura, K.; Inoue, N.; Watanabe, K.; Takeuchi, T. Absorption and desorption of hydrogen, deuterium, and tritium for Zr–V–Fe getter. J. Vac. Sci. Technol. A 1984, 2, 1341–1347. [Google Scholar] [CrossRef]
- Juillet, C.; Tupin, M.; Martin, F.; Auzoux, Q.; Berthinier, C.; Miserque, F.; Gaudier, F. Kinetics of hydrogen desorption from Zircaloy-4: Experimental and modelling. Int. J. Hydrog. Energy 2019, 44, 21264–21278. [Google Scholar] [CrossRef]
- Passelaigue, F.; Lacroix, E.; Pastore, G.; Motta, A.T. Implementation and Validation of the Hydride Nucleation-Growth-Dissolution (HNGD) model in BISON. J. Nucl. Mater. 2021, 544, 152683. [Google Scholar] [CrossRef]
- Kearns, J.J. Diffusion coefficient of hydrogen in alpha zirconium, Zircaloy-2 and Zircaloy-4. J. Nucl. Mater. 1972, 43, 330–338. [Google Scholar] [CrossRef]
- Boldt, F. Implementation of Hydrogen Solid Solubility Data and Precipitation Threshold Stresses in the Fuel Rod Code TESPA-ROD. J. Nucl. Eng. Radiat. Sci. 2019, 5, 020904. [Google Scholar] [CrossRef]
Figure 1.
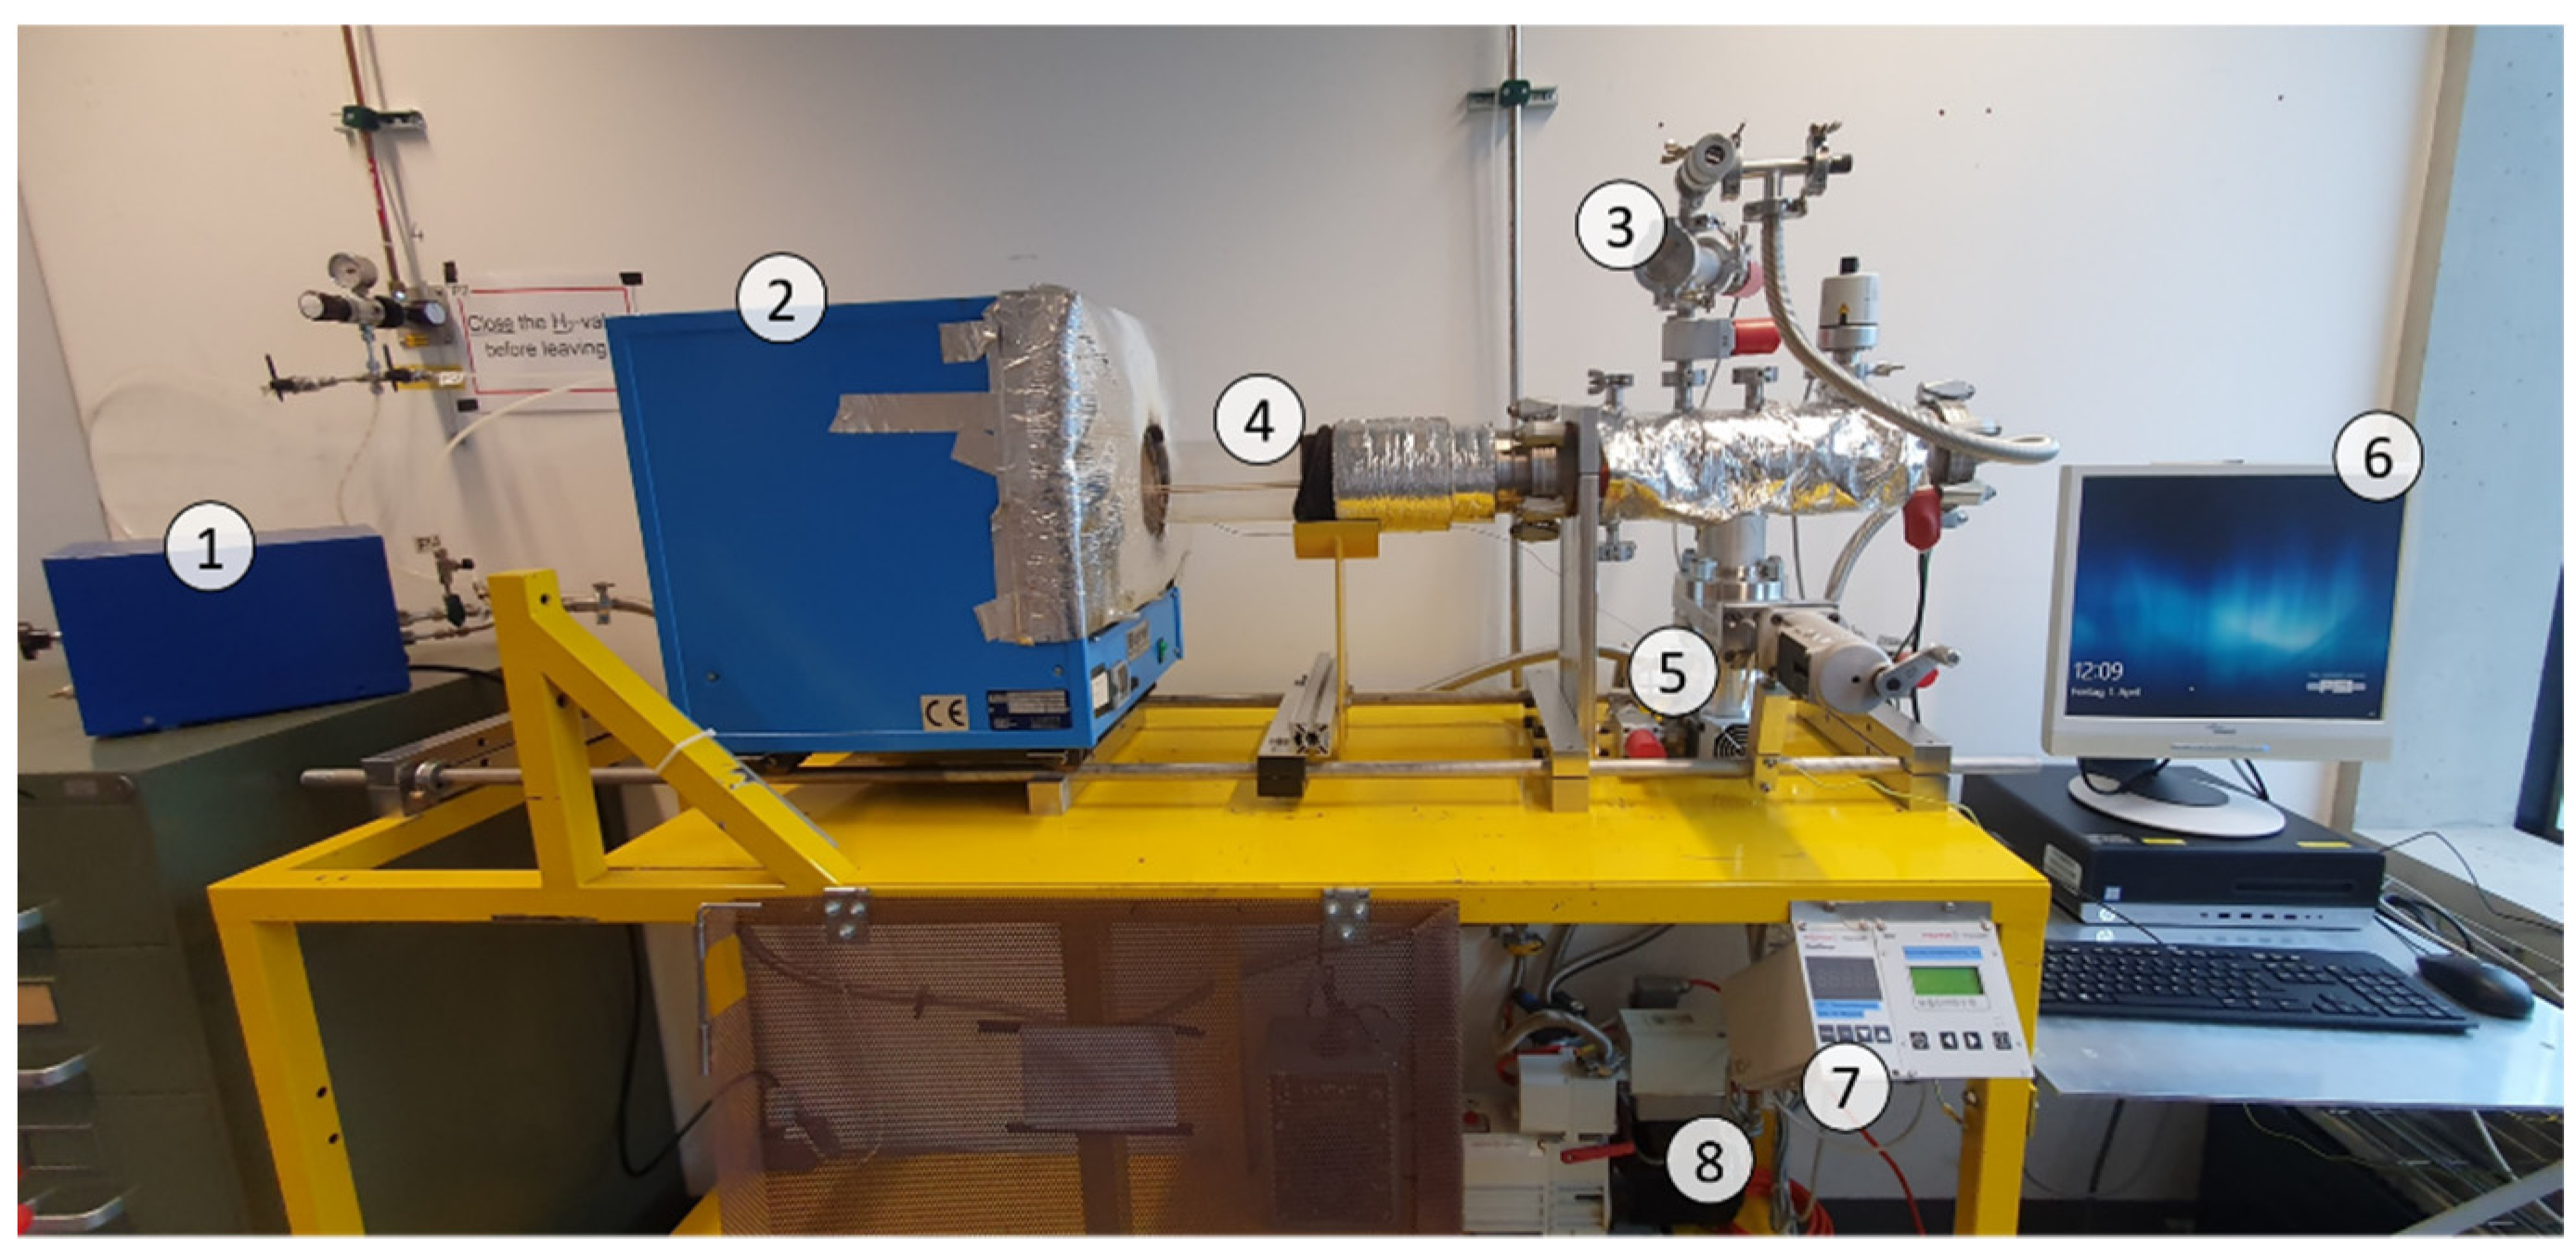
Hydrogenation equipment overview with highlighted main components: (1) hydrogen purifier, (2) furnace, (3) dosing cell, (4) high-vacuum cell, (5) high-vacuum pump, (6) computer monitoring, (7) pressure sensor controller, and (8) low-vacuum pump. The same equipment was used also to induce the hydrogen degassing in high-temperature/high-vacuum conditions.
Figure 1.
Hydrogenation equipment overview with highlighted main components: (1) hydrogen purifier, (2) furnace, (3) dosing cell, (4) high-vacuum cell, (5) high-vacuum pump, (6) computer monitoring, (7) pressure sensor controller, and (8) low-vacuum pump. The same equipment was used also to induce the hydrogen degassing in high-temperature/high-vacuum conditions.

Figure 2.
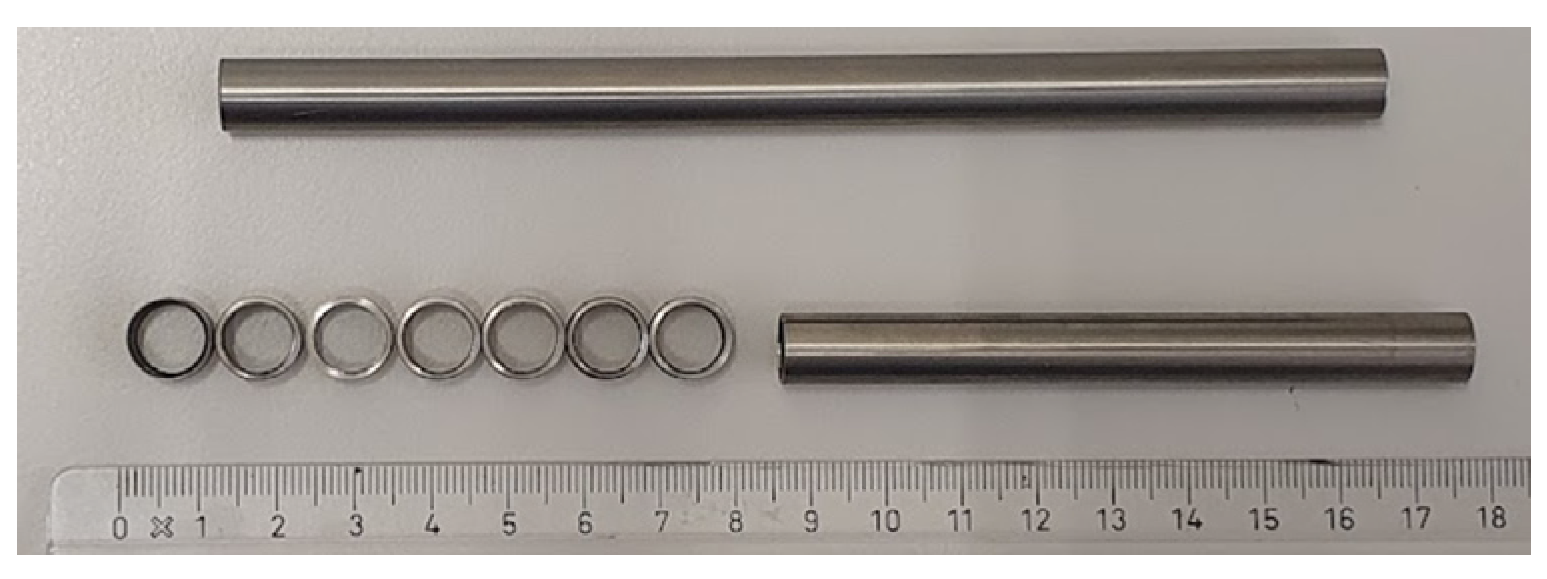
Cladding tube before hydrogenation (top) and after sectioning in 5 mm rings prior to desorption (bottom).
Figure 2.
Cladding tube before hydrogenation (top) and after sectioning in 5 mm rings prior to desorption (bottom).

Figure 3.
Hydrogen concentration measured in low (a) and high (b) hydrogen content cladding tubes. The dashed lines indicate upper and lower bounds, and the solid lines show the hydrogen concentration used as a target during hydrogen charging. The error bars correspond to the experimental uncertainty of the HVE measurements, equal to the highest between the uncertainty of the measurement due to the standard deviation in the hydrogen content of the calibration pins and the standard deviation among the three homologues sections of the measured rings.

Figure 4.
Simulation results (in orange) compared with experimental measurements (in blue) of the samples subjected to low (a) and high (b) hydrogen enrichment.
Figure 4.
Simulation results (in orange) compared with experimental measurements (in blue) of the samples subjected to low (a) and high (b) hydrogen enrichment.

Figure 5.
Relative difference between the estimated initial hydrogen concentration in the high-concentration samples and the concentration measured after the heat treatment.
Figure 5.
Relative difference between the estimated initial hydrogen concentration in the high-concentration samples and the concentration measured after the heat treatment.


Table 1.
Hydrogen pressures recorded during hydrogenation process. Sample S100 was obtained with a single dose. Sample S350 was obtained with three incremental small doses, followed by homogenization and quenching, followed by three subsequent hydrogenation doses.
Table 1.
Hydrogen pressures recorded during hydrogenation process. Sample S100 was obtained with a single dose. Sample S350 was obtained with three incremental small doses, followed by homogenization and quenching, followed by three subsequent hydrogenation doses.
| Sample Name (Calculated Hydrogen Concentration) | Charging Step | Chamber Pressure | Resulting ΔH (wppm) | ||
|---|---|---|---|---|---|
| Initial | Final | Delta | |||
| (mbar) | (mbar) | (mbar) | |||
| S100 (107 wppm) | 1st | 5.036 | 1.331 | 3.705 | 107 |
| S350 (352 wppm) | 1st | 4.610 | 1.694 | 2.915 | 84 |
| - | 2nd | 6.370 | 5.190 | 1.180 | 34 |
| - | 3rd | 11.150 | 9.588 | 1.562 | 45 |
| - | 4th | 4.696 | 1.086 | 3.610 | 104 |
| - | 5th | 5.758 | 3.918 | 1.839 | 53 |
| - | 6th | 6.211 | 5.101 | 1.110 | 32 |
Table 2.
Test conditions and name adopted for each section for the low- (S100) and high-hydrogen (S350) tubes.
Table 2.
Test conditions and name adopted for each section for the low- (S100) and high-hydrogen (S350) tubes.
| Section Number | Distance from Edge (mm) | Temperature (°C) | Dwell Time (h) | Sample Name in Figure 3 and Figure 4 |
|---|---|---|---|---|
| 1 | 5 | 400 | 12 | 400 × 12 |
| 2 | 10 | - | - | R1 |
| 3 | 15 | 200 | 12 | 200 × 12 |
| 4 | 20 | 200 | 24 | 200 × 24 |
| 5 | 25 | - | - | R2 |
| 6 | 30 | 400 | 24 | 400 × 24 |
| 7 | 35 | 400 | 48 | 400 × 48 |
| 8 | 40 | - | - | R3 |
| 9 | 45 | 400 | 6 | 400 × 6 |
| 10 | 50 | 300 | 48 | 300 × 48 |
Publisher’s Note: MDPI stays neutral with regard to jurisdictional claims in published maps and institutional affiliations. |
© 2022 by the authors. Licensee MDPI, Basel, Switzerland. This article is an open access article distributed under the terms and conditions of the Creative Commons Attribution (CC BY) license (https://creativecommons.org/licenses/by/4.0/).
Share and Cite
MDPI and ACS Style
Fagnoni, F.; Konarski, P. Hydrogen Degassing of Zirconium under High-Vacuum Conditions. Metals 2022, 12, 868. https://0-doi-org.brum.beds.ac.uk/10.3390/met12050868
AMA Style
Fagnoni F, Konarski P. Hydrogen Degassing of Zirconium under High-Vacuum Conditions. Metals. 2022; 12(5):868. https://0-doi-org.brum.beds.ac.uk/10.3390/met12050868
Chicago/Turabian StyleFagnoni, Francesco, and Piotr Konarski. 2022. "Hydrogen Degassing of Zirconium under High-Vacuum Conditions" Metals 12, no. 5: 868. https://0-doi-org.brum.beds.ac.uk/10.3390/met12050868
Note that from the first issue of 2016, this journal uses article numbers instead of page numbers. See further details here.