
Atomistic Investigation on the Strengthening Mechanism of Single Crystal Ni-Based Superalloy under Complex Stress States

1
School of Astronautics, Beihang University, Beijing 102206, China
2
School of Energy and Power Engineering, Beihang University, Beijing 102206, China
3
Research Institute of Aero-Engine, Beihang University, Beijing 102206, China
*
Author to whom correspondence should be addressed.
Metals 2022, 12(5), 889; https://0-doi-org.brum.beds.ac.uk/10.3390/met12050889
Submission received: 20 March 2022
/
Revised: 5 May 2022
/
Accepted: 18 May 2022
/
Published: 23 May 2022
(This article belongs to the Special Issue Microstructure and Mechanical Properties of Nanoscale Metallic Materials)
Abstract
:Single crystal Ni-based superalloy, with excellent mechanical properties in high temperature, always works under complex stress states, including multiaxial tension and compression, which results in various strengthening mechanisms. In this paper, the atomistic simulation is applied to investigate the microstructure evolution under complex mechanical loading conditions, including uniaxial, equibiaxial, and non-equibiaxial tensile–compressive loadings. By comparison of the strain–stress curves and analysis of dislocation motion, it is believed that the tension promotes the bowing out of dislocations into the channel at loading direction, while compression limits it. Moreover, the dislocation analysis shows that the initial dislocation network, comprised of Lomer dislocations, will dissociate to form Lomer–Cottrell lock upon loading, which acts as a barrier to the further glide of dislocations. The mechanism of dislocation evolution is analyzed in detail by combining Schmid factor analysis and the comparison of energy density difference between γ and γ′ phases.
1. Introduction
Single crystal (SC) Ni-based superalloy, known for its high strength, oxidation resistance, corrosion resistance, and creep resistance under high temperature, is a vital aerospace material, widely used in crucial components, such as aero-engine turbine blades, rocket engine nozzles, and aerospace aircraft thermal coatings [1,2]. With the development of material manufacture technology, the current SC Ni-based superalloy is composed of the face-centered cubic (FCC) Ni (γ) matrix phase and cubic morphology ordered L12 Ni3Al precipitates embedded in γ phase, namely γ’ phase, at as-received state [3]. The special microstructure of Ni-based superalloy requires a unique strengthening mechanism, which has a great influence on the mechanical property of the alloy during service [4,5,6].
In the past few decades, numerous experimental tests have been carried out to reveal the relation between the microstructure and mechanical property of the Ni-based superalloy [7,8,9]. Luo et al. [10] studied the variation of the lattice parameter with the temperature of SC Ni-based superalloy and found that the lattice misfit between γ and γ′ phases increases with temperatures below 1100 °C. Zhang et al. [11] and Chang et al. [12] reported that the interfacial dislocation networks can prevent the dislocation motion effectively, which leads to the prolonging of the creep rupture time. Pei et al. [13] investigated the evolution and influence mechanism on creep failure of the oxide layer, heat-affected layer, and substrate microstructure. They showed that creep properties are seriously affected by pre-oxidation. Ding et al. [14] displayed the mechanical behavior of SC Ni-based superalloy by tensile testing at various temperatures and revealed the deformation substructures and mechanisms from micrometer to atomic scales. In recent decades, plentiful worthwhile discoveries have been published by experiment researchers. However, due to the limitation of the experimental method and complexity of loading conditions, the in situ observations are difficult to conduct.
On the other hand, molecular dynamic (MD) simulation can capture dynamic deformation in real time and provide atomistic details, such as the interaction between dislocation and γ′/γ structure, atomistic stress, and energy distribution [15,16]. Zhu et al. [16] and Xiong et al. [17] performed the matrix dislocation motion in SC Ni-based superalloy and provided the interplay mechanism between the matrix dislocation and interfacial dislocation network by MD simulation. Wu et al. [18,19,20] established 2D and 3D MD models to observe the interfacial dislocation network evolution under uniaxial loading. Most of these MD investigations regarding the Ni-based superalloy adopt a uniaxial loading and overlook the fact that the multiaxial loading will result in a considerable difference in the microstructure evolution of SC Ni-based superalloy during the MD simulation.
In general, the SC Ni-based superalloy always works in a complex mechanical loading environment, resulting in numerous degeneration behaviors, such as rafting and precipitation of TCP phase [7]. Gebura and Lapin [21] studied the effect of multiaxial stress state, which is caused by a notch effect, on the microstructure degradation of CMSX-4 and showed that notches affect the degradation process of alloy significantly. Caccuri et al. [22] provided the orientation and type of rafting that are governed by the stress type and triaxiality in the initial and middle states during service of SC Ni3Al superalloys with a small strain. Cao et al. [23] investigated how the evolving multiaxial stress states affect the kinetics of rafting during creep of SC Ni-based superalloy. Their results supported the fact that the maximum principal stress is the key component of the overall stress state, which governs rafting.
Meanwhile, due to the L12 atomistic structure of γ′ phase, the SC Ni-based superalloy clearly illustrates the tension–compression asymmetry, which leads the compression loading to play an important role in the study of complex stress conditions [7,19,24,25,26,27]. The tension–compression asymmetry of yield and creep strengths was studied by Tsuno et al. [28], and they believed that the twin boundary dominated the tension–compression asymmetry mechanism. Wang et al. [29] examined the tension–compression asymmetry of SC Ni-based superalloy DD6 during low cycle fatigue. They found that the tensile–compressive stresses are related to the dislocation microstructures in the materials. Yin et al. [30] investigated the effect of orientation on tensile–compressive properties through 3D MD simulation and found that the orientation performed more evidently. In these researches, MD simulation fully demonstrates its advantages in capturing the microstructure evolution in real time. However, there is still a lack of systematic study of Ni-based superalloy deformation under complex stress states.
Based on the above discussion, the simulation results of tension and compression under uniaxial, equibiaxial, and non-equibiaxial loadings are compared and analyzed systematically, which can provide guidance for the design of working loading states of SC Ni-based superalloy. In addition, the strengthening mechanism of SC Ni-based superalloy under different loading conditions has been concluded in this paper. The MD model and loading conditions are constructed in detail in Section 2. Then, Section 3 presents the strain–stress relation and the dislocation evolution during the loading process for all loading modes. In Section 4, the dissociation of the initial dislocation network is explained, and the dislocation bowing mechanism is illustrated by analyzing the energy density distribution and calculation of the Schmid factor. Finally, this paper is summarized in Section 5.
2. Model and Method
To investigate the microstructure evolution of SC Ni-Al superalloy under multiaxial loading, large-scale MD simulations are performed using the classical MD code LAMMPS [31]. For the MD method, the input parameters are the atomic potential, atomic structure, ensemble, boundary conditions, loading states, temperature, etc. The atomic interactions are governed by the embedded atom method (EAM) potential developed by Mishin [32], which describes lattice properties of γ and γ′ fields on the Ni-Al phase diagram and compares fairly well with first-principles calculations. From the EAM potential, the lattice parameters of γ and γ′ phases can be obtained as and respectively. The lattice mismatch is then calculated as:
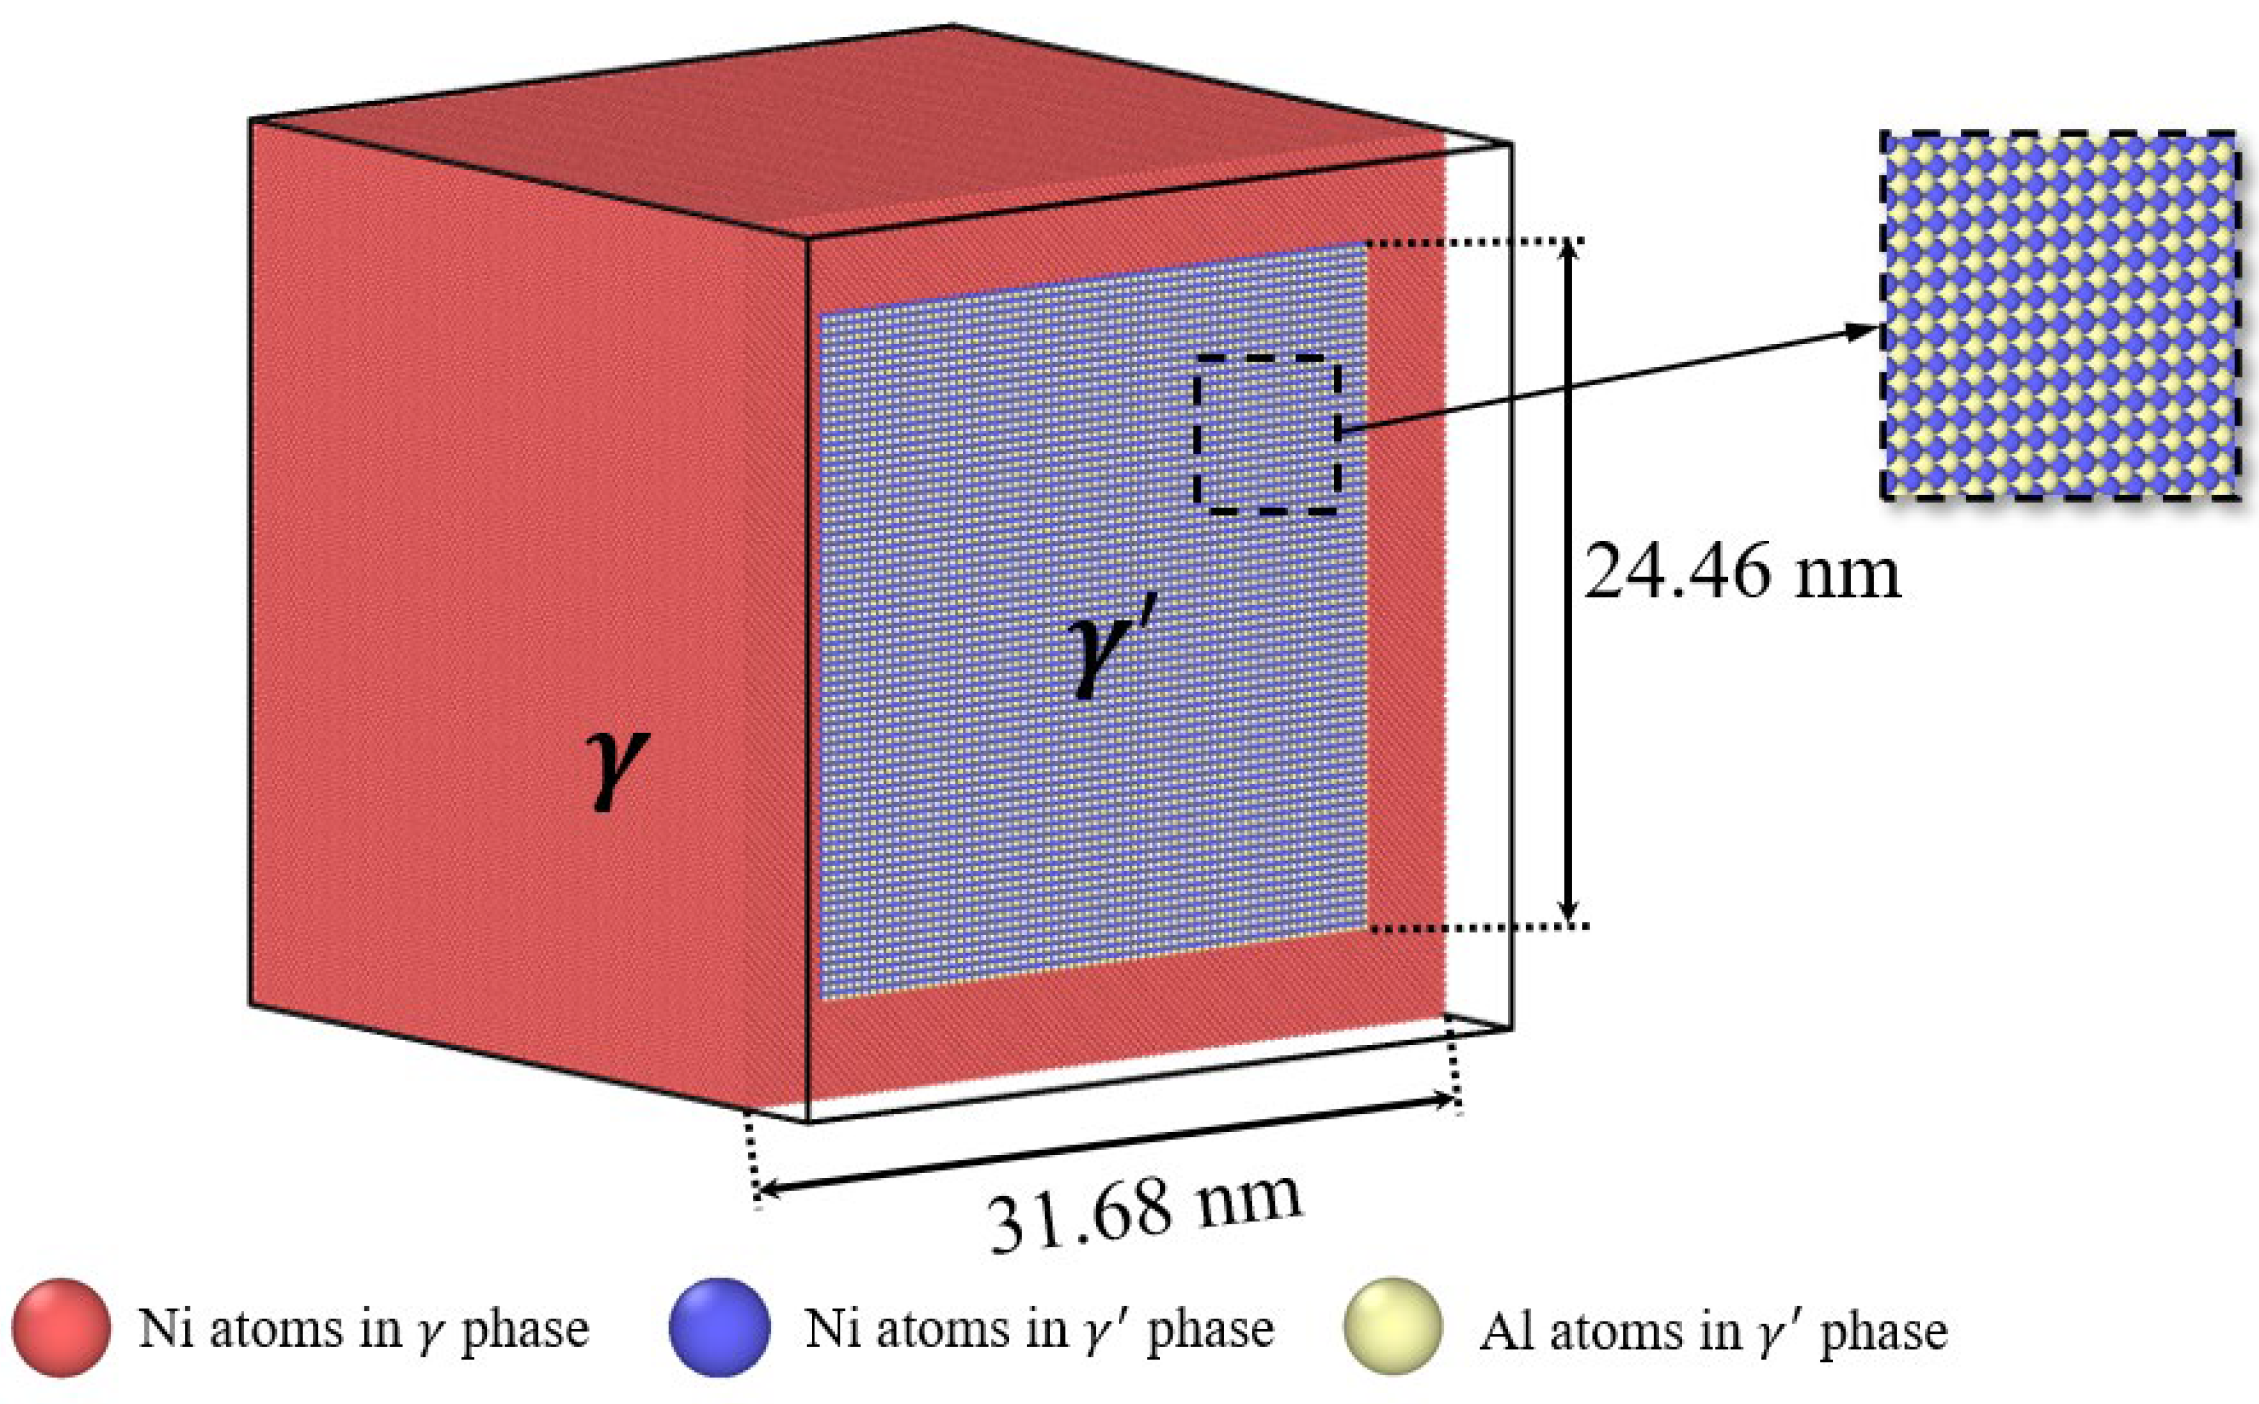
As the bulk lattice parameters of γ and γ′ phases nearly commensurate with the ratio , the lattice number ratio at γ′/γ interface is set as 69:70 to reduce the misfit stress and form the misfit dislocations network. The 3D MD model of SC Ni-Al superalloy is built by embedding a 69 × 69 × 69 cubical γ′ precipitate phase in a 100 × 100 × 100 γ matrix phase [19], as shown in Figure 1. The peripheral red atoms represent the Ni atoms in γ matrix phase, whereas the blue and white atoms in the center represent the Ni atoms and Al atoms in γ′ precipitate, respectively. A relatively wide matrix phase width is defined in this model to reduce the influence of periodic boundary conditions [33]. Accordingly, the initial box sizes of our typical MD models are nm, where the x, y, z axis directions represent [100], [010], and [001] orientations, respectively. Moreover, throughout this paper, the γ channels normal to the x, y, z axes denote X channel, Y channel, and Z channel, respectively. The length of the internal cubic γ′ precipitate phase is , which indicates that the volume fraction of γ′ phase is 46% less than the fifth-generation SC Ni-based superalloy [7]. As this work focuses on the microstructure evolution during the loading process, this difference will not have a considerable impact on our study. The entire model is comprised of 2,858,036 atoms, of which 2,529,527 are Ni atoms and 328,509 are Al atoms.
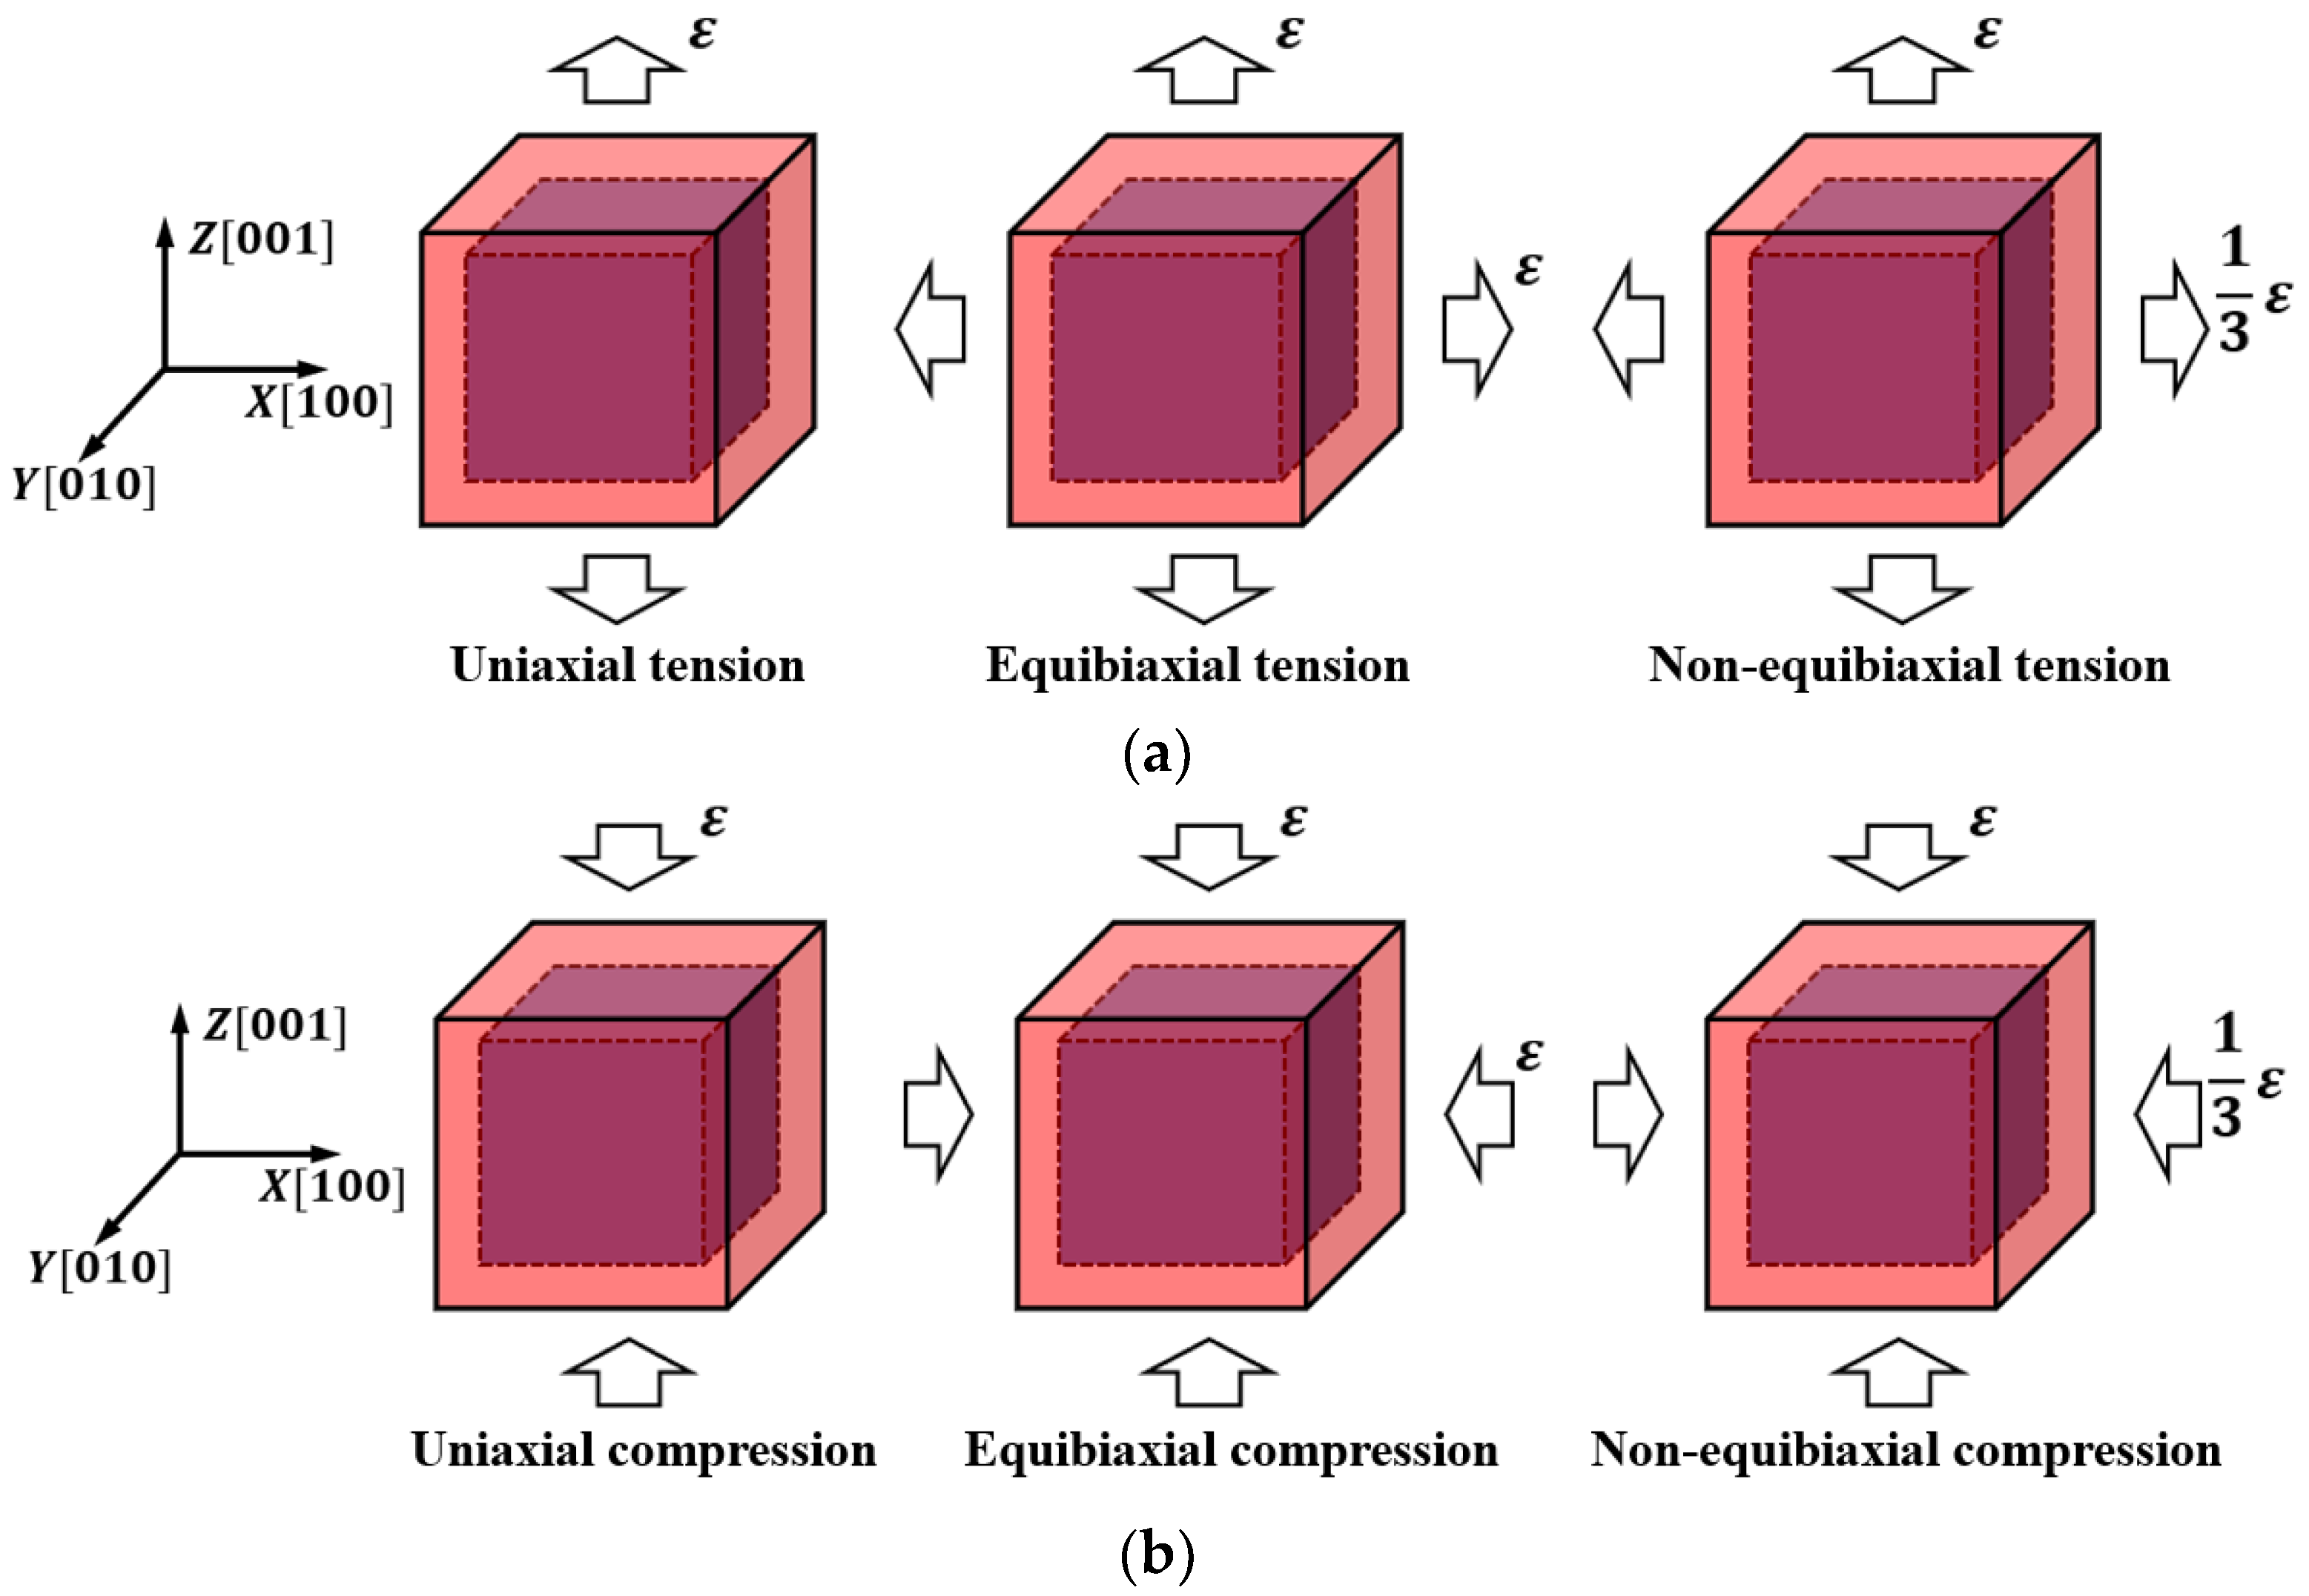
The MD simulations are performed with an NPT ensemble. Periodic boundary condition is applied on the three axes and the simulations are conducted with an integration time step of . First, the model is heated up to a temperature of 300 K by velocity rescaling and a Nose–Hoover thermostat is applied to maintain the temperature for 10,000 timesteps (10 picoseconds, ps) as a relaxing process. Meanwhile, the MD box dimensions are adjusted by a Berendsen barostat to maintain traction-free periodic boundary conditions in all three directions. The loadings are applied by deforming the simulation box at a fixed strain rate of , , and , () for tension and compression, respectively. It is worth mentioning that the loading is negative for compression, while maintaining zero box pressures in the other directions, as shown in Figure 2. The loading lasts 500 ps until for each simulation. The and represent the engineering strain and engineering strain rate in this paper, which are calculated by the ratio of length at the moment to the original length and its derivative with time, respectively. The loading states in this paper are considerably similar to the authors’ previous work [34]. The dislocation evolutions are analyzed by the dislocation analysis (DXA) proposed by Stukowski et al. [35], while the blue lines are perfect dislocations, green lines are Shockley partials, red lines are stair-rod partials, and yellow lines are stacking faults (SFs) atoms. The atomic configurations are visualized using visualization software OVITO in the subsequent analysis [36]. The output strain and stress for strain–stress curves are calculated by the box size evolution and global pressure from the built-in algorithm in LAMMPS.
3. Results
3.1. Uniaxial Loading
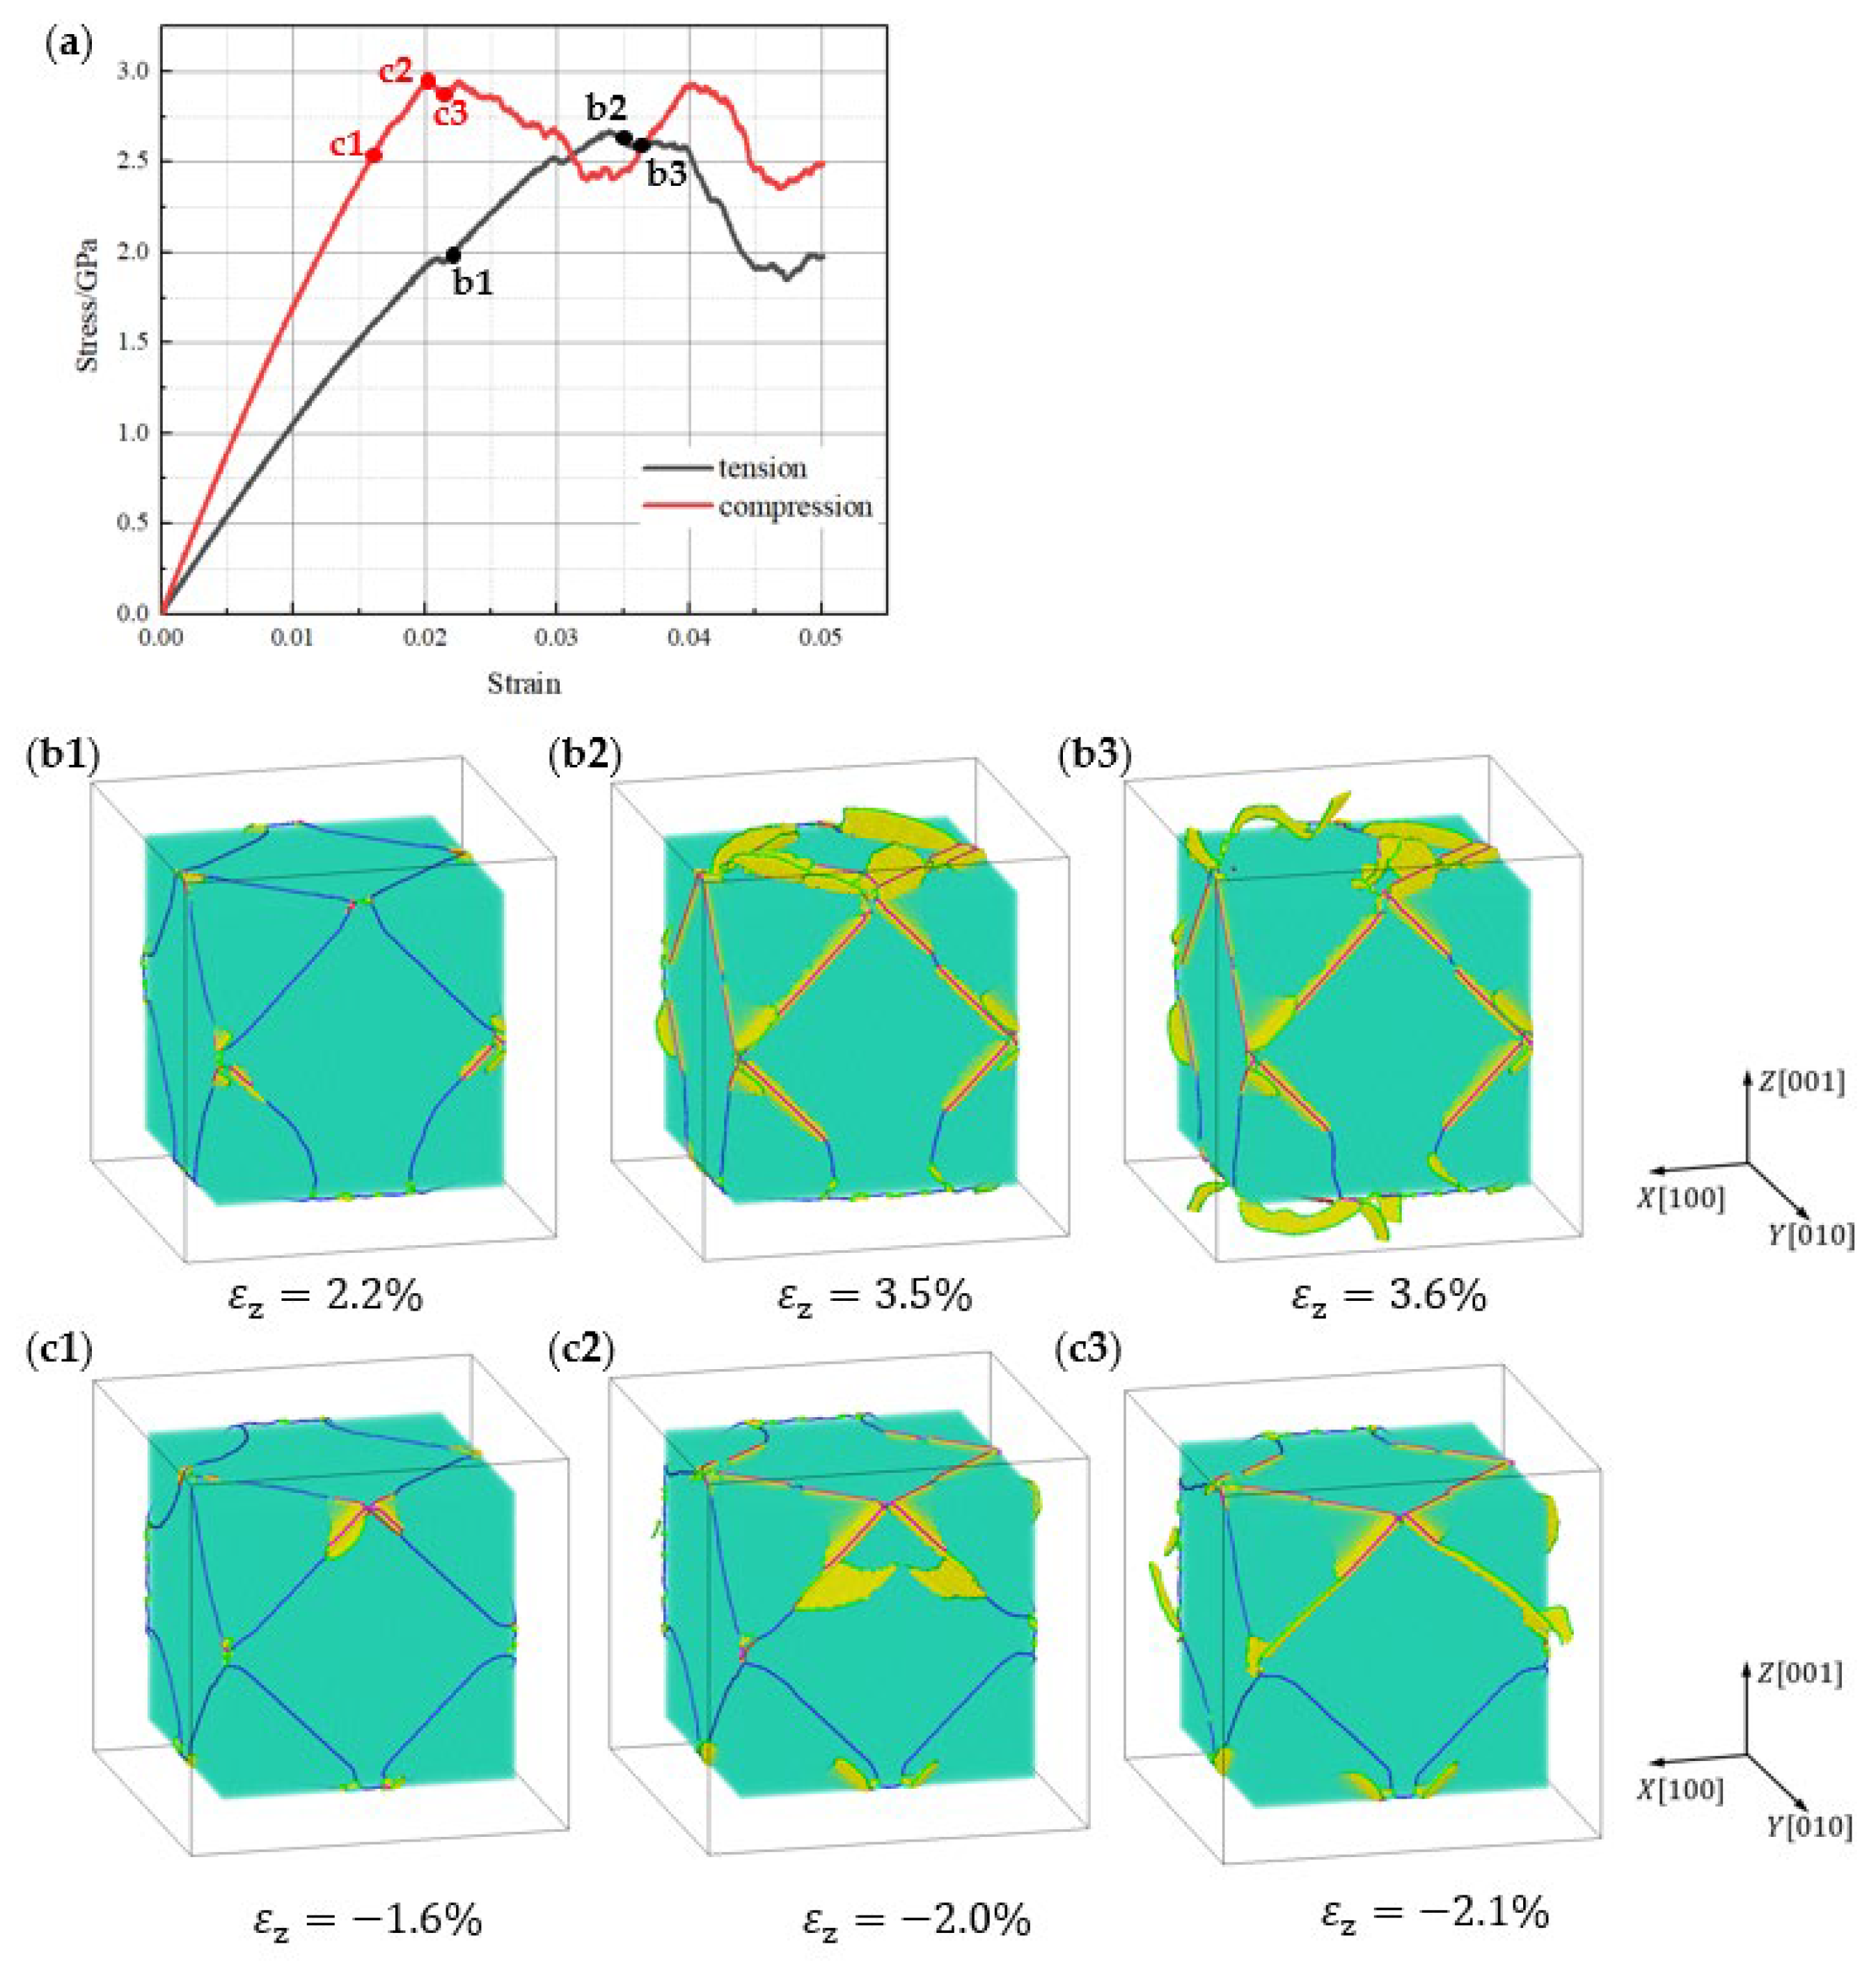
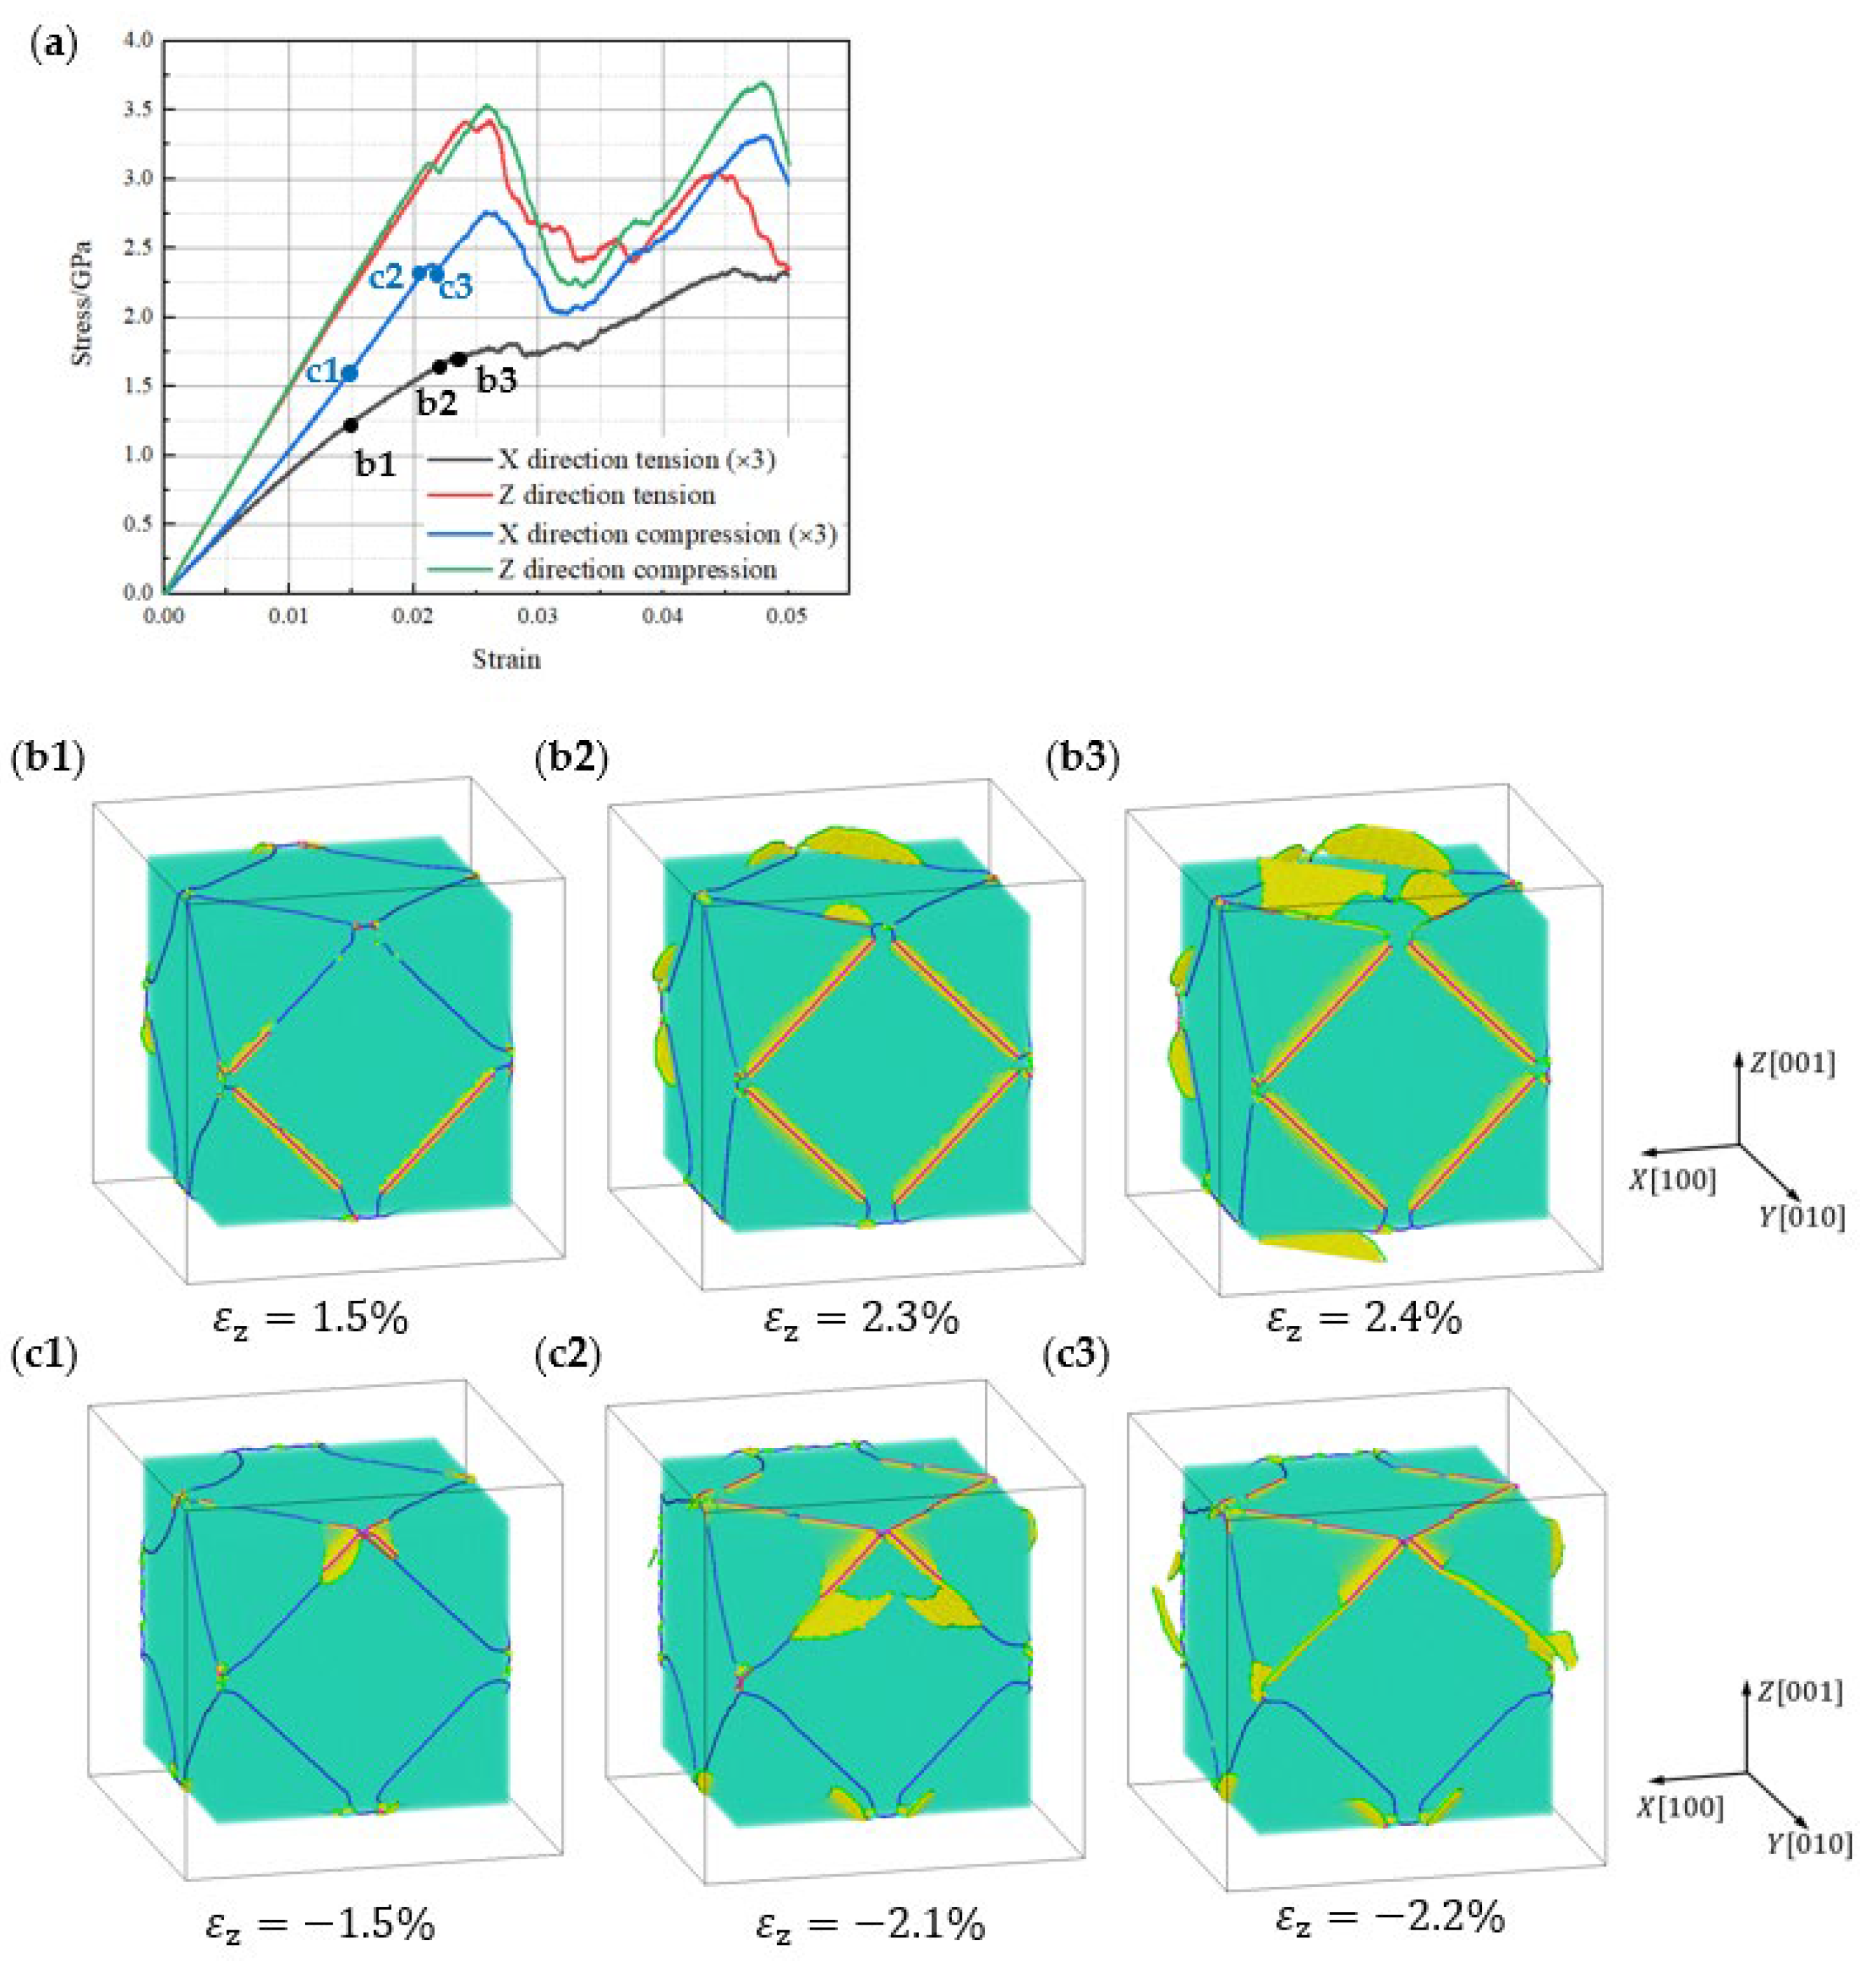
Figure 3a displays the strain–stress diagrams for uniaxial loading. Here, the absolute value of strain–stress is taken for compressive loading to show the difference between tension and compression. The marked dot in Figure 3a represents the moments of the initial stage of dislocation emission, the stage at which dislocations are about to cut through γ channel, and the stage when γ channel is already penetrated by dislocations, respectively. Figure 3(b1–b3,c1–c3) show the snapshots of these marked moments. These snapshots are analyzed by DXA and the transparent green cube at the center represents γ′ phase, while the stacking faults (SFs) atoms are coloured in yellow and the FCC atoms are hidden.
In Figure 3a, the uniaxial strain–stress curve for compression has a higher gradient at the early stage. By linear fitting with the elastic segment of the strain–stress diagram, the slopes represent the elastic modulus which are 96.5 and 149.3 GPa for tension and compression, respectively. This indicates that the SC Ni-based superalloy presents a larger elastic modulus for [100] orientation compression. Meanwhile, the maximum stress for compression is greater than the tensile stress and the tensile curve turns at a later time.
In Figure 3(b1–b3), it can be seen that the decomposed Shockley dislocations slip into [001] γ matrix channel, which follows the same direction of uniaxial loading at . The primary dislocation reaction has already been discussed in the authors’ previous work [34]:
The original pure edge misfit dislocation dissociates into one stair-rod dislocation locked in γ′/γ interface and two different Shockley partials with stacking faults bowing out into γ matrix channel, which is perpendicular to the external loading direction [37]. Then, the motion of decomposed dislocations is resisted by the γ′ precipitate phase in x and y directions. As a result, the bowing-out dislocations are mainly located in the channel of z direction at . When reaches , the dislocations emitted from upper and lower interfaces start to intersect in γ phase, while the original pure edge dislocations at the interface turn into mixed dislocations. At this moment, the dislocations are still largely in the channel of z direction, but a few dislocations start to bow out at x and y directions since the dislocation networks begin to dissociate.
In Figure 3(c1–c3), the snapshots of uniaxial compression are displayed and the motion of dislocation is very similar to the equibiaxial tension, as shown in Figure 4(b1–b3). Evidently, the main dislocation reaction during compression in Equation (2) and the dislocations cut through the γ phase near the stress peak of strain–stress curves. However, the dislocation evolution is considerably different from the tensile loading. At , the dislocations primarily dissociate at Z channel and then bow out toward the x and y directions. Therefore, when reaches , the dislocations are mainly distributed in X and Y channels, similar to the equibiaxial loading on x and y directions. In Figure 3(b1–b3,c1–c3), the dislocation network has been severely damaged, due to the fact that the strength of material rapidly decreased, as shown in Figure 3a.
3.2. Equibiaxial Loading
In Figure 4, the diagrams show the strain–stress lines and microstructure evolution under equibiaxial loading, while the snapshots are conducted in Figure 3. Figure 4a illustrates the strain–stress relation under equibiaxial loading. Here, the tensile–compressive curves have the same gradient at the early stage. As the strain reaches , the compressive graphs show a higher elastic modulus, which is 202.4 GPa compared with 157.4 GPa for tensile stress and eventually turns at almost the same strain. The x and z direction curves are in practical unanimity until the turning point for both loading states.
In Figure 4(b1–b3), the interfacial dislocations in the y direction, which bear no loading, are first decomposed by the reaction above at . As increases to , the decomposed dislocations cut into the channel at x and z directions, which have the loading, while the dislocations that cut toward the y direction are obstructed by the phase at the same time. When the dislocations cut through the X and Z channels at , there are still no dislocations in the Y channel. As shown in Figure 4(c1–c3), the dislocation evolution under equibiaxial compressive loading of x and z directions is the same as the uniaxial tension at y direction. The difference is that the dislocation networks decompose rapidly when the dislocations cut through the Y channel. Similar to uniaxial loading, the moment when the dislocations cut through the channel is also around the turning point in Figure 4a, which confirms that the completeness of the dislocation networks significantly contributes to the material strength.
3.3. Non-Equibiaxial Loading
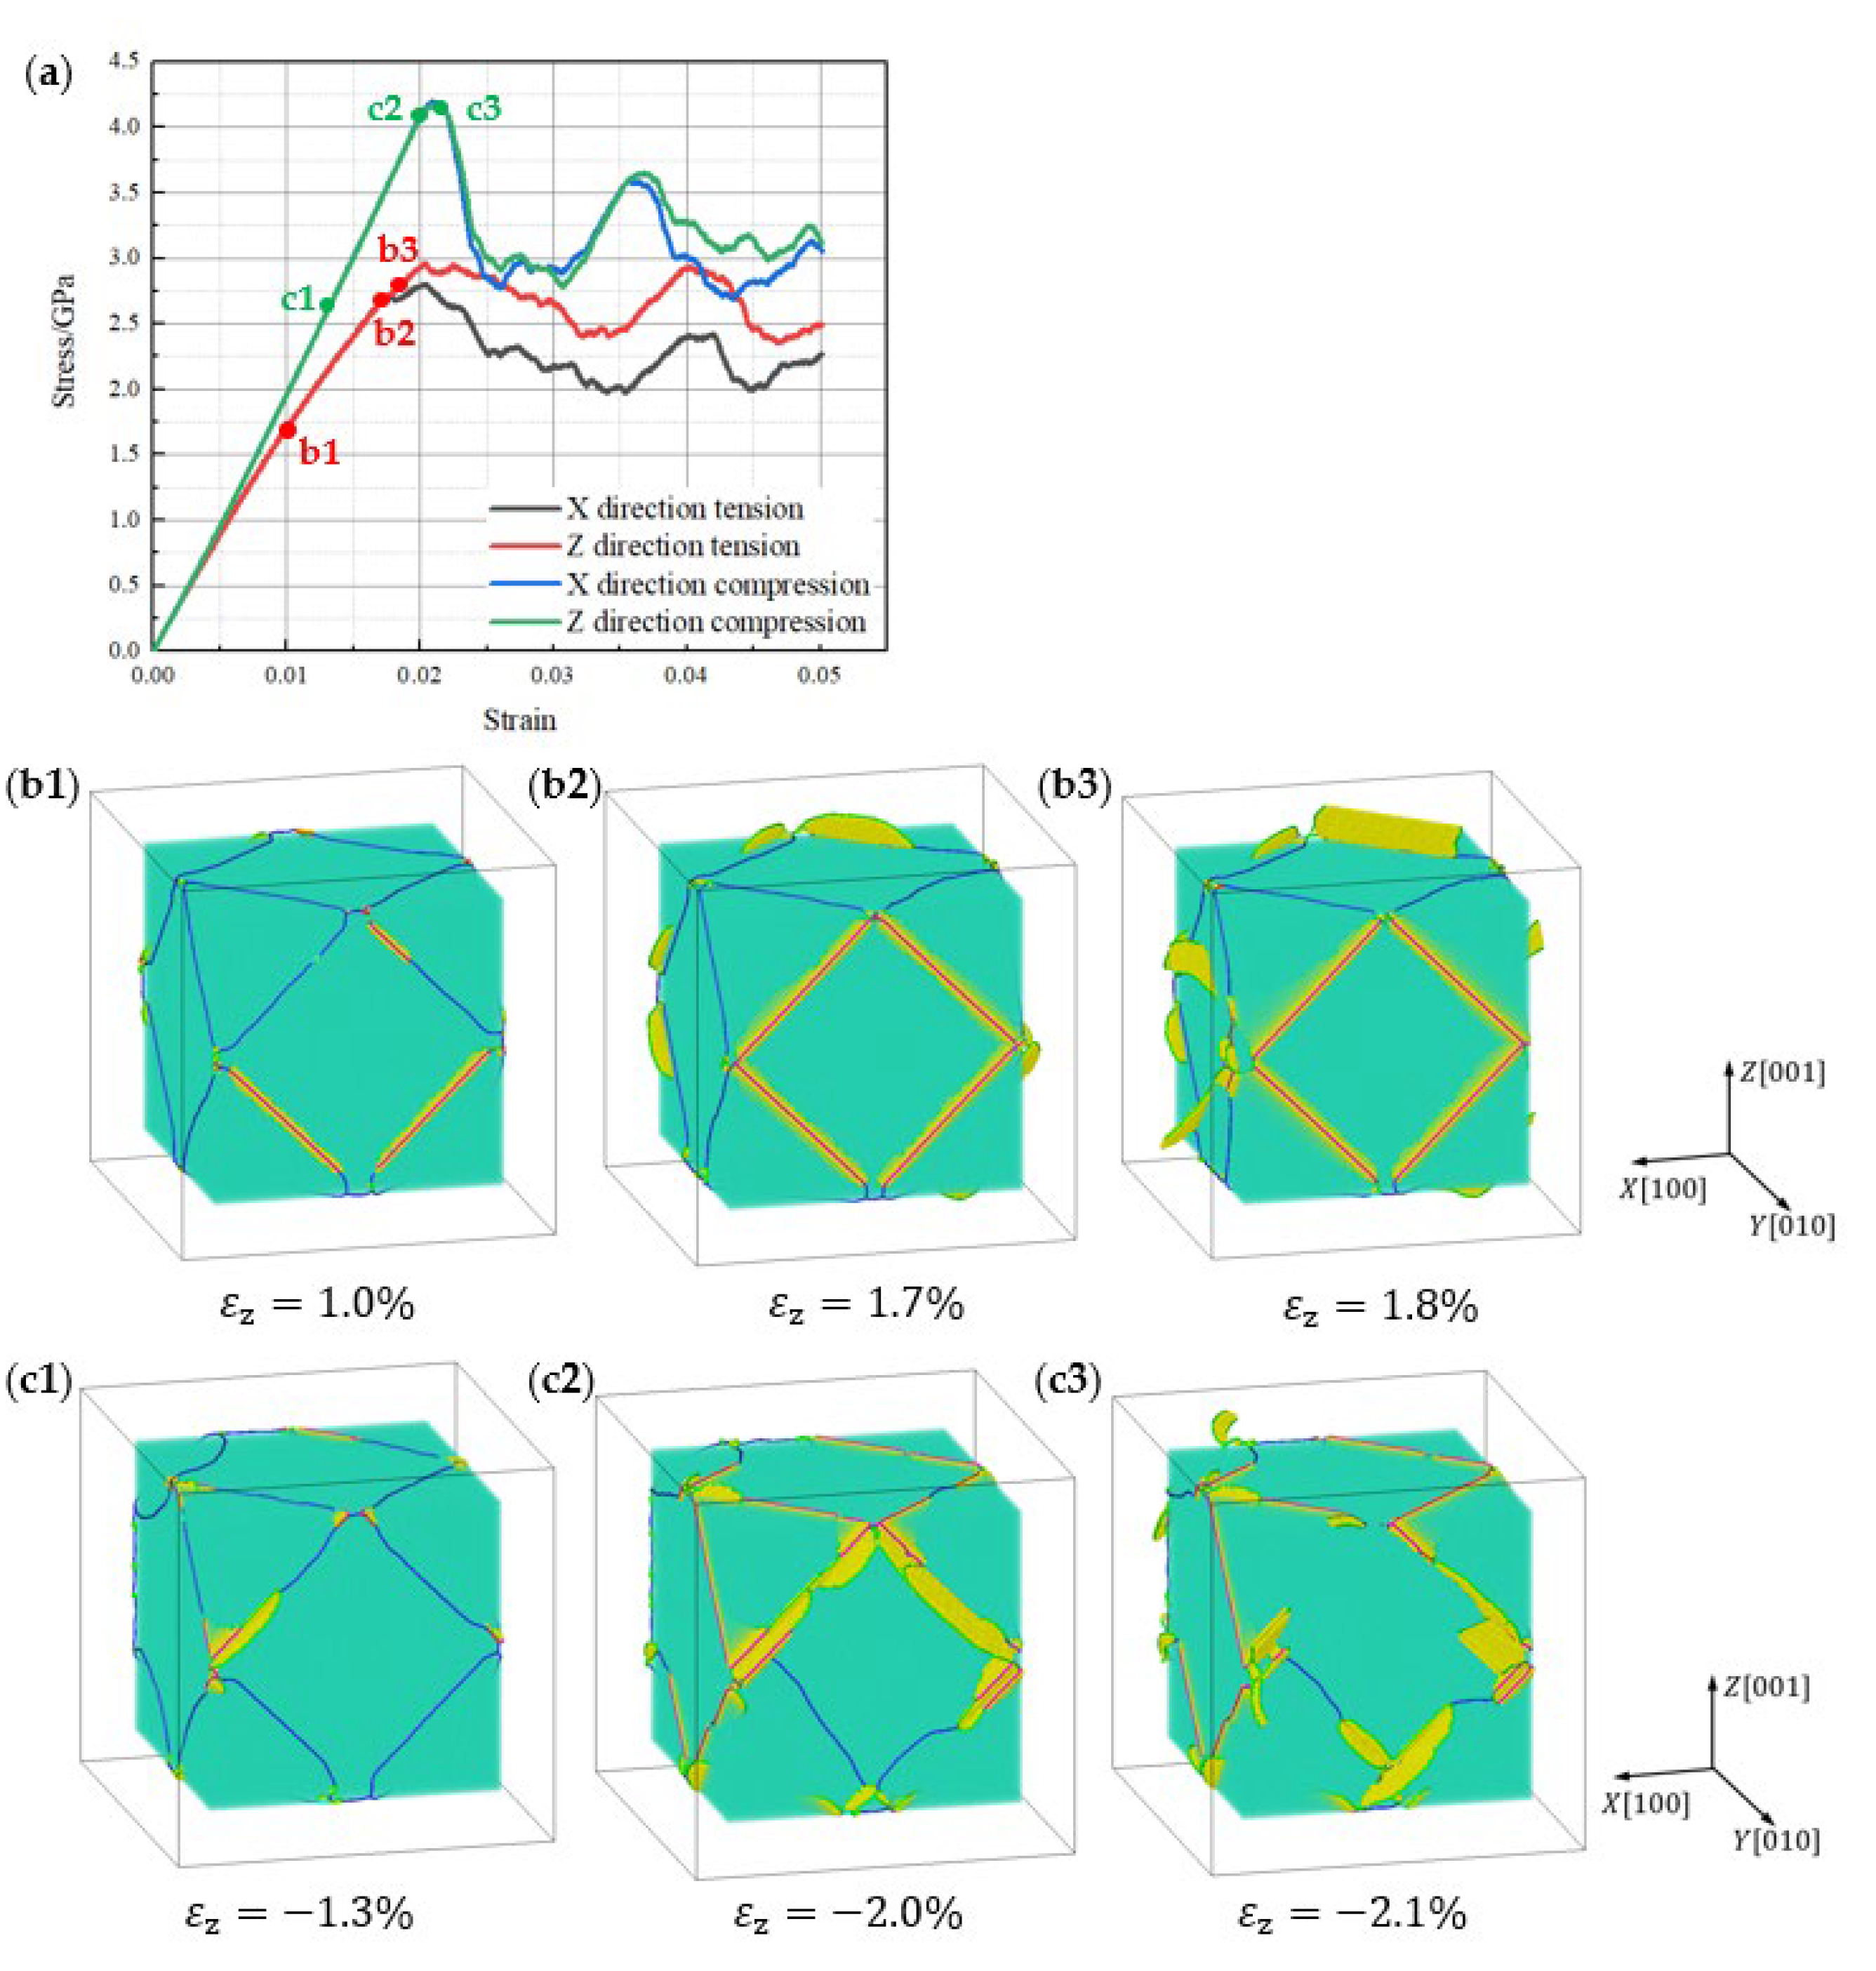
Figure 5 shows the strain–stress relation and microstructure change under non-equibiaxial loading, and the pictures are modified as previously mentioned. In particular, for comparison, the strain in the x direction for non-equibiaxial loading is magnified by three times. Figure 5a shows that the non-equibiaxial strain–stress curves, such as equibiaxial loading, also bend at a similar strain. In contrast to equibiaxial loading, the strain–stress curves of z direction are almost the same for tension and compression, while the elastic modulus for tension and compression in z direction are 144.9 and 149.2 GPa, respectively. Moreover, the curves of x direction show a higher compressive stress compared with tensile stress and the elastic modulus are 231.6 and 335.4 GPa for tension and compression in x direction. Compared with Figure 5(b2,c2), the dislocations in X channel are more stable than in Z channel. This is the reason the elastic modulus in x direction is larger than in z direction. From these strain–stress diagrams, it can be seen that the maximum stress for compression is slightly larger than tension at the same strain for all of the loading conditions.
For non-equibiaxial loading in Figure 5(b1–b3), the dislocation evolution at the initial stage is the same as equibiaxial loading. As the strain increases, the dislocations also appear at the X and Z channels, but the dislocations move more slowly in the x direction with lower loading evidently. In Figure 5(c1–c3), the dislocations bow out into the X and Y channels, which sustain a smaller loading compared with Z channel and no loading, respectively. The velocity of dislocation bowing is higher at y direction in comparison with x direction. In contrast to the uniaxial and equibiaxial loadings, the models still maintain the elastic performance after the first dislocation cuts through γ channel, as shown in Figure 5a. In Figure 5(b3,c3), the dislocation networks still have a relative complete morphology compared with Figure 4(b3,c3). As the dislocations in the x direction move more slowly than in other channels, when dislocations in other channels have penetrated the channel, they still move in the γ channel, which leads the dislocation network to remain more intact.
In summary, the dissociated dislocations always move into the tensile loading direction channels, and the bowing velocity shows a positive correlation with the magnitude of loading, while the compressive loading shows the opposite results. From the comparison of dislocation motion under tensile–compressive loadings, it can be concluded that tensile loading promotes the bowing out of dislocation into the loading channel, while compressive loading suppresses the bowing out of dislocation into the loading direction. In addition, the correlation of the turning point on the strain–stress curves to the moment in which the decomposed dislocations cut through the γ phase indicates that the accumulation of dislocation in γ channel is the starting point of the plastic deformation of SC Ni-based superalloy [38].
Moreover, compared with these strain–stress lines, an evident tension–compression asymmetry for SC Ni-based superalloy is observed during the loading process. This is due to the fact that the alloy crystals are subjected to different stresses as a result of different intergranular slip directions during tension and compression [39]. From our simulation, it can be concluded that the compression requires greater stress in the direction. From the experimental results by Wen et al. [25] and Leidermark et al. [40], the tension–compression asymmetry for [001] and [111] orientations is small, while the strength of [011] orientation is stronger in compression than in tension. Leidermark et al. found that the tension–compression asymmetry significantly relates to the critical resolved shear stress (CRSS) and the CRSS for compression in [001] direction is only slightly larger than tension. However, it has to be pointed out that the atomistic simulation is distinguished from the macroscopic experiment, as the real materials have many defects and the MD models are generally perfect in crystal structure. As a result, the value of CRSS can be magnified many times in atomistic simulation leading to an exaggerate tension–compression asymmetry in [001] direction in this paper. On the other hand, by comparing these graphs, it can be observed that the maximum stress of tension only changes from 10~20% under different loading states, while the maximum stress of compression at z direction transforms around 45% between uniaxial and equibiaxial loadings. This result demonstrates that the maximum stress for compression is more sensitive with biaxial loading.
4. Discussion
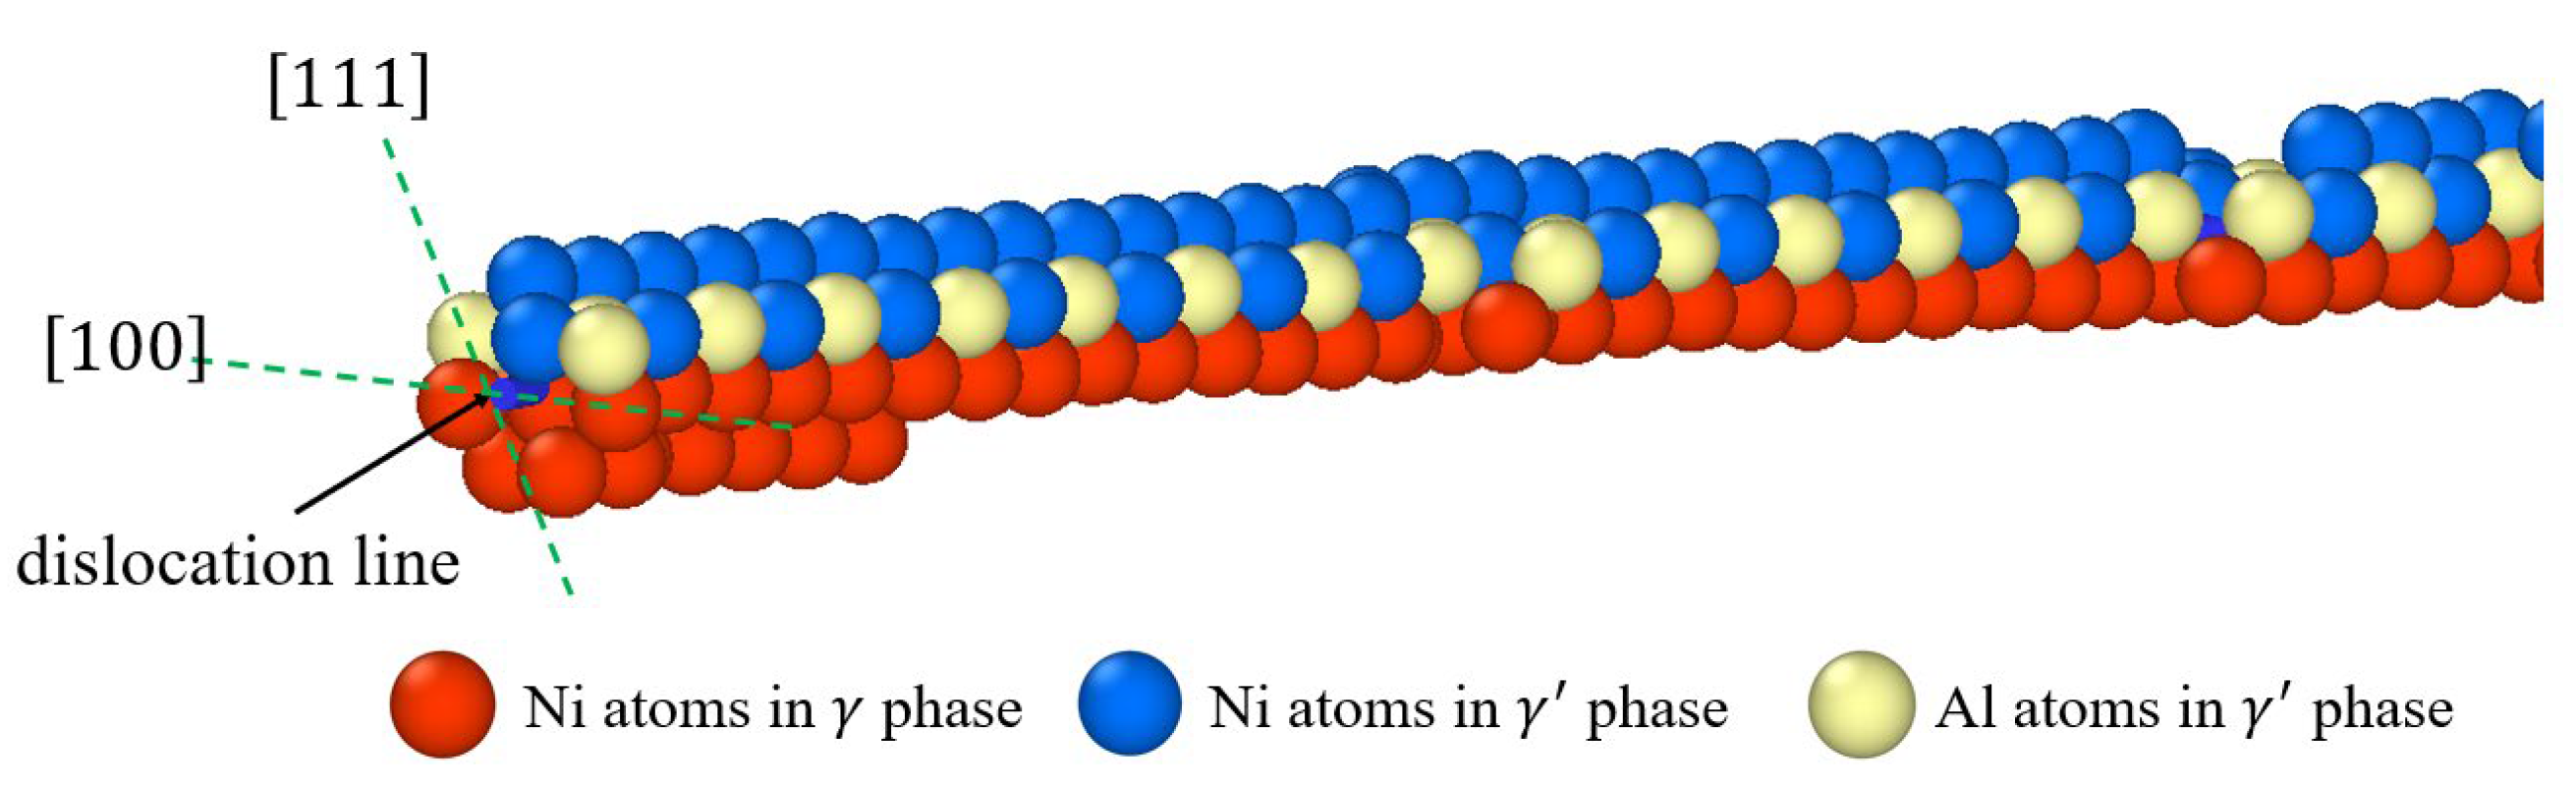
To explain the microstructure evolution, we first investigate the initial dislocation structure. Figure 6 illustrates a detailed view of the initial dislocations, where the dislocation line has been emphasized by an arrow, red atoms represent Ni atoms in γ phase, blue atoms represent Ni atoms in γ′ phase, and white atoms represent Al atoms in γ′ phase. The slip directions of and orientations have been indicated in dashed green line. From the DXA algorithm, the dislocation is considered as a perfect pure edge dislocation, pointed out by a black arrow in Figure 6. Nevertheless, the perfect dislocation is surrounded by both the γ and γ′ phases and the interface at plane, which indicates that the movements of the dislocation into different phases belong to different slip systems at the general slipping plane. In fact, the initial dislocation is known as Lomer dislocation, which is formed by dislocation reaction given below:
Under all of the loading states, the Lomer dislocation scarcely glides on any of the four planes and is always sessile as a result of its location in the plane [41]. Therefore, the reaction mentioned above represents the classical Lomer dislocation dissociation with a reduction in , according to:
where is the module of Burgers vector and is the lattice parameter. Therefore, the stair-rod partial exerts a repulsive force on the two Shockley partials and these three partial dislocations form a stable, sessile arrangement under incipient loading conditions. Moreover, it acts as a barrier to the glide of further dislocations on the two planes, which is known as Lomer–Cottrell lock, as shown in Figure 7 [37]. When the Shockley partials completely cut through the γ channel, the stress of alloy rapidly decreases. This is because the interaction between the dislocations breaks the Lomer–Cottrell lock and leads to a degeneration of material strength. The strengthening mechanism is considerably different from the normal metal materials, in which the yield stress is related to the dislocation nucleation [38,42].
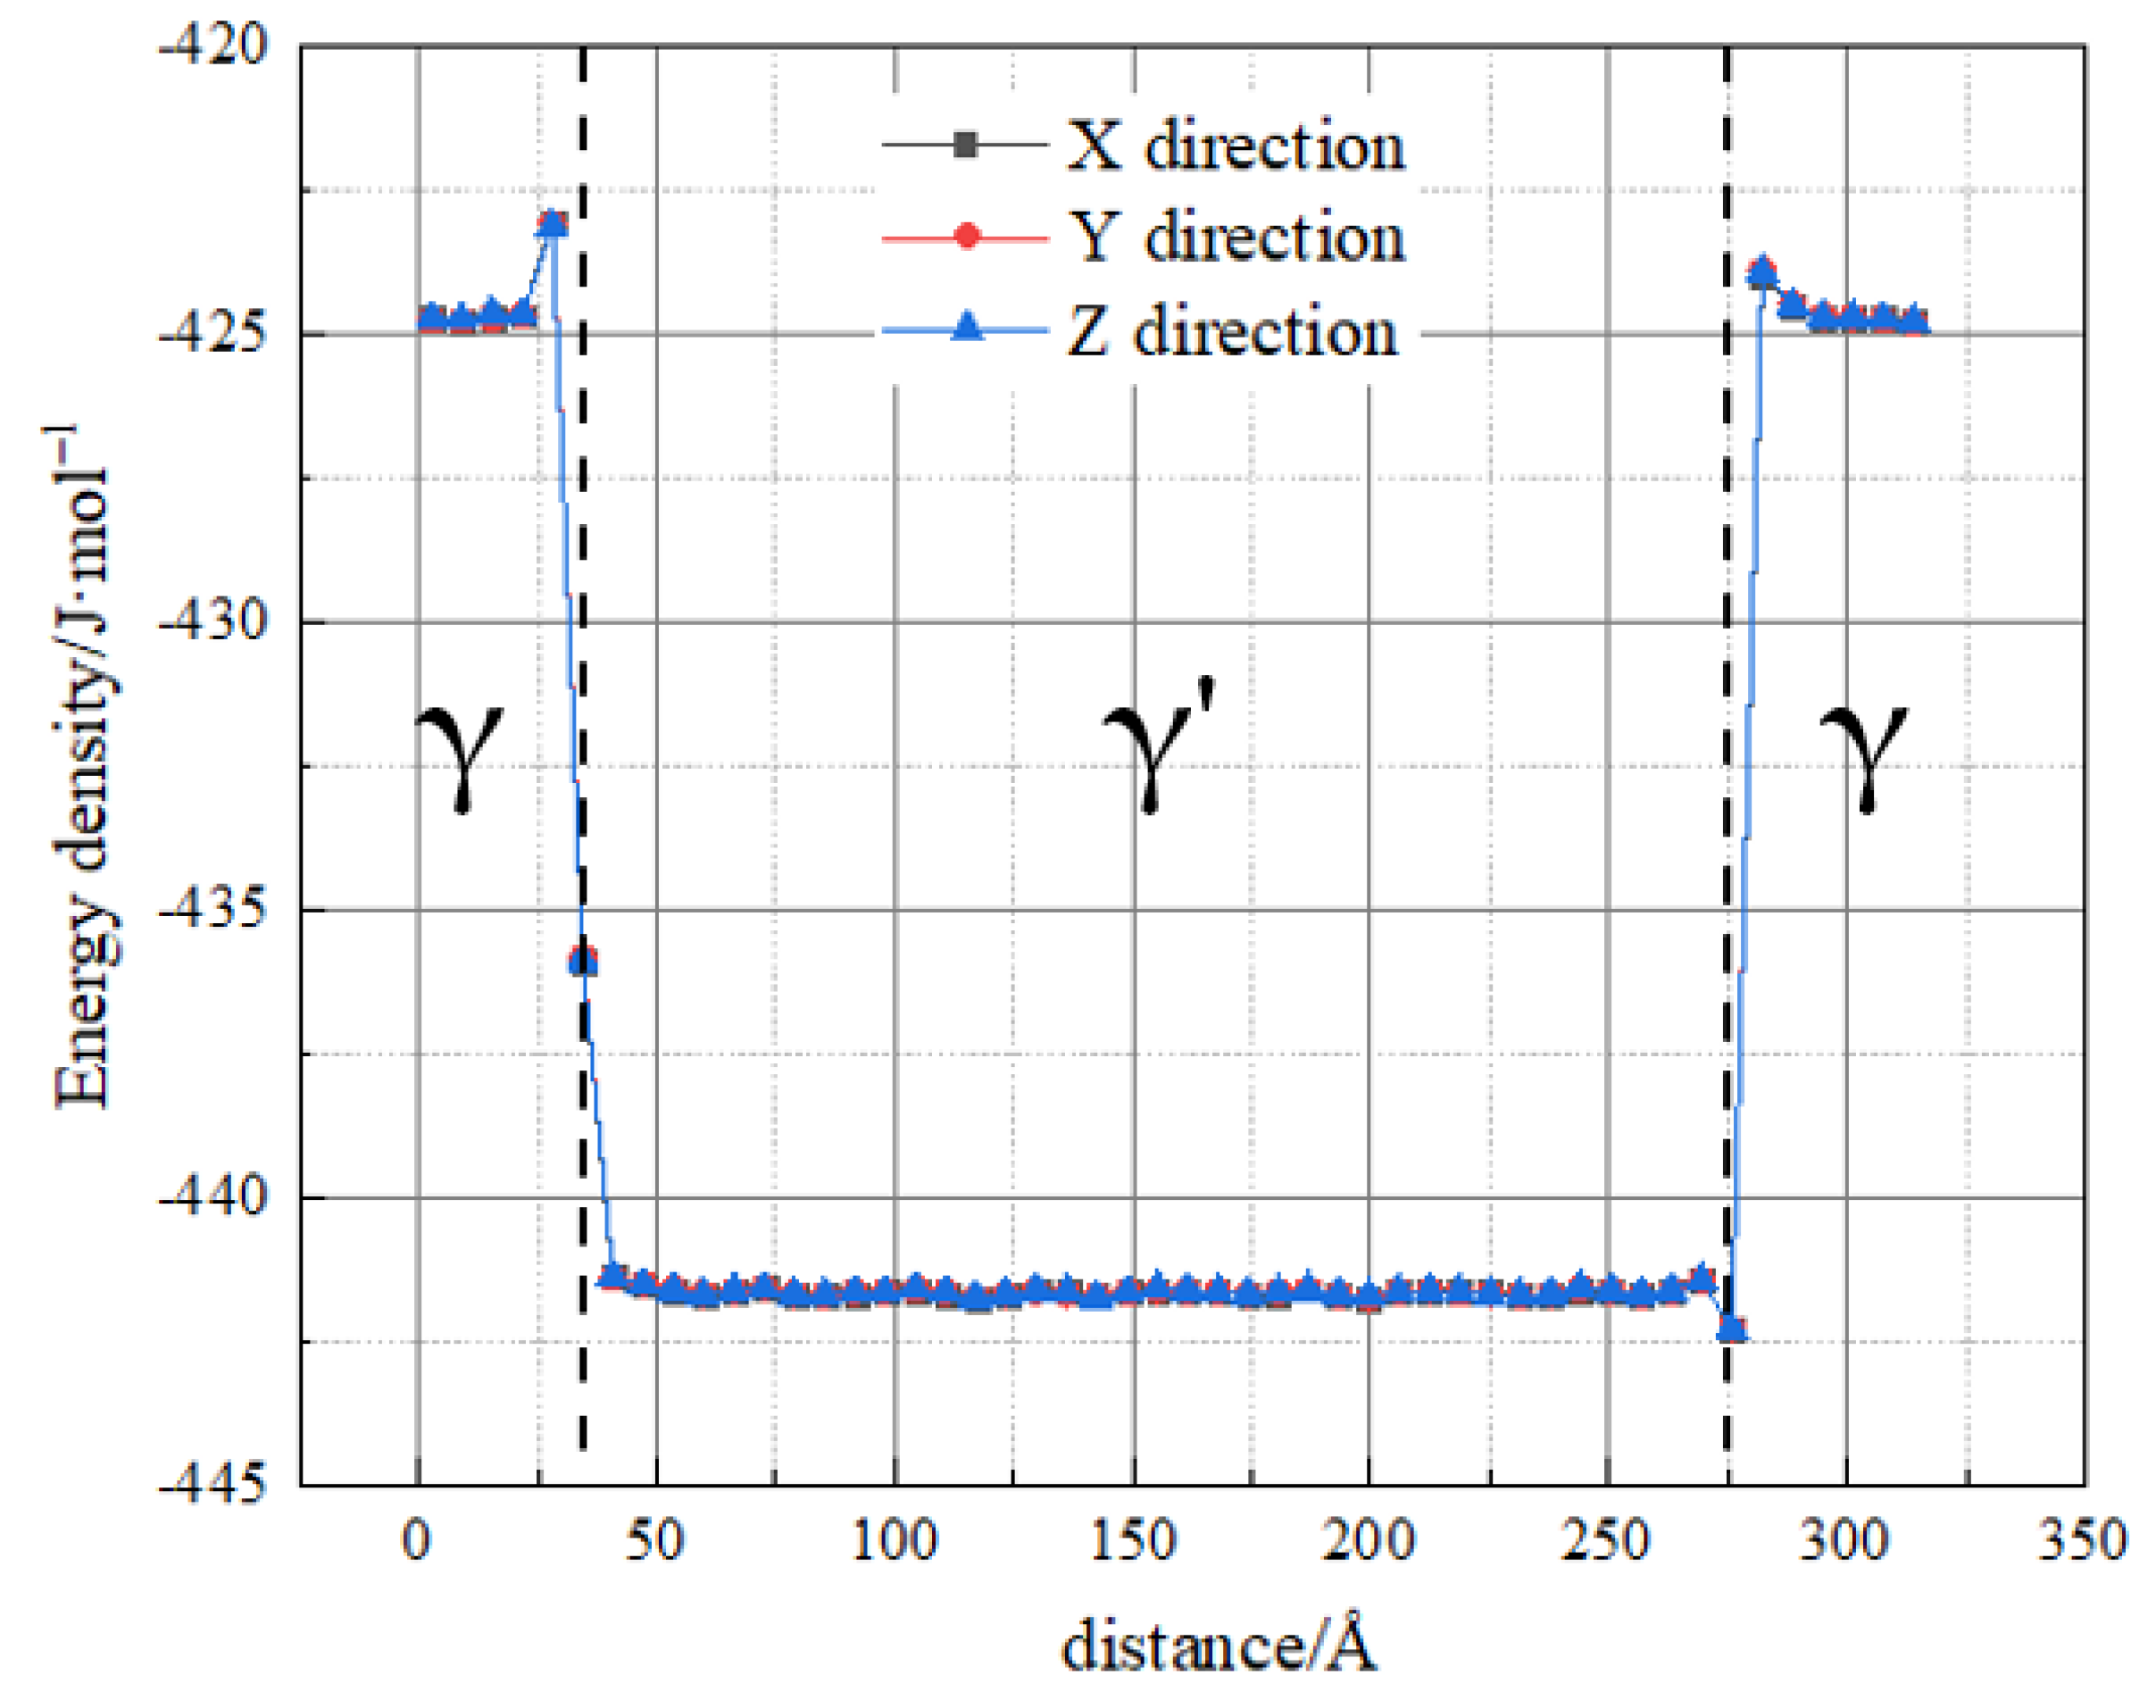
To investigate the mechanism of the Lomer dislocation dissociation in the interface, the energy density distribution of initial dislocation networks along all three directions is shown in Figure 8. The energy density is calculated by summing up the potential energy of each atom and then dividing by the volume. In addition, only the central part of the atom is selected in the calculation to avoid the influence of the interface at the other sides. In Figure 8, two dashed lines mark the location of the interface. From the curves, it is evident that the energy density of γ phase is considerably larger than γ′ phase and the atoms in γ phase have a higher energy density as they get closer to the interface. For all of the three directions, the energy density distribution curves are almost identical. As the dislocation tends to slip toward the lower energy states, the difference in energy density between γ and γ′ phases acts as an energy barrier, which allows the Lomer dislocations to dissociate toward γ′ in most of our simulation cases.
Traditionally, the Schmid factor of decomposed Shockley partials, which indicates the magnitude of the resolved shear stress, is calculated as Equation (5):
where is the angle between applied force and the norm of the slip plane, is the angle between applied force and the slip direction. The calculation details in each channel under different tension loading states have been shown in Table 1. For the Lomer dislocations in each channel, they all dissociated into two types of different Shockley partials, as shown in Table 1. The Schmid factors have been listed corresponding to the Burgers vector of slipping Shockley partials, which is calculated by combining the Burgers vectors and resultant force direction vector with Equation (5). The resultant force direction vector is calculated by summation of forces along x, y, and z directions. It is worth mentioning that the resultant force direction vector for non-equibiaxial loading, which is not on account of the loadings, is conducted by the strain rate. The actual stress ratio between the x and z directions is 1:2 rather than 1:3. For z direction uniaxial tension, the Schmid factor of dislocations in z direction is 0.47, which is greater than 0.24 in x and y directions. As a result, the dissociation of Lomer dislocations first bows out in z direction and then the dislocations in X and Y channels start to decompose. Nevertheless, for the dislocations in non-loading channels, they prefer to bow toward γ′ phase due to the stress caused by necking. Under biaxial loading, the mechanism is more complex. Under equibiaxial loading, the Schmid factor is 0.24 and 0 for the two decomposed Shockley partials in X and Z channels, while it is 0.47 at Y channel. In x and z directions, the Lomer dislocations cannot dissociate by virtue of only one Shockley partial, which has resolved shear stress, as shown in Figure 4(b1–b3). On the other hand, although the dislocations in Y channel are blocked by γ′ phase, the Shockley partials which are close to γ phase can still cut into phase in the X and Z channels under the continuous loading, resulting in numerous dislocations in X and Z channels, as shown in Figure 9. For non-equibiaxial loading, the Schmid factors of dislocation in X channel are 0.189 and 0, thus the interfacial dislocations in this direction do not decompose. In addition, since the Schmid factors of the dislocations in z direction are 0.42 and 0.24, while the ones in the y direction are both 0.42, the dislocations in the y direction interface are decomposed and cut through the γ channel first due to the fact that the dislocation decomposition is limited by the minimum Schmid factor.
For compressive loading, the energy barrier at the interface plays an important role in the bowing direction of dislocations. Under uniaxial compressive loading, the Lomer dislocation in z direction interface decomposes directly and is caused by the resolved shear stress. Meanwhile, the dislocations in x and y direction interface are affected by the tension stress as a result of the Poisson effect, and the dislocations tend to decompose directly into the γ′ channel phase. However, due to the action of the energy barrier between the two phases, the dislocations cannot be decomposed toward the γ phase, resulting in a situation similar to equibiaxial tension. The dislocations under equibiaxial and non-equibiaxial loading work in the same way. While under equibiaxial compressive stress states, the Lomer dislocation dissociates and bows out toward the γ channels different from compressive direction, while the dislocations maintain the original state in the loading direction interface. On the whole, the mechanism of dislocation bowing is controlled by the resolved shear stress together with the energy barrier at the interface.
5. Conclusions
In this paper, MD simulation is applied to investigate the microstructure evolution of SC Ni-based superalloy under multiaxial tension and compression. On the basis of our simulation results and dislocation analyses, several significative conclusions can be drawn:
- (1)
- The strain–stress response demonstrates a significant tension–compression asymmetry, and the strength of compression is larger than that under tension, which is consistent with the experimental observation. In addition, contrary to the tensile loading states, in which the maximum stress does not significantly change between uniaxial and multiaxial loadings, the maximum stress under compressive loading varies evidently.
- (2)
- From the atomistic simulation results, we conclude that tensile loading can promote the bowing of dislocations into the channel, while compressive loading restrains it. This phenomenon is believed to be caused by a coupling effect of both the difference of resolved shear stress and energy barrier at the interface.
- (3)
- The initial dislocation networks are comprised of Lomer dislocations, which dissociate and form the Lomer–Cottrell lock, acting as a barrier to the further glide of dislocations. Meanwhile, as the Lomer–Cottrell lock disappears, the tensile stress of the alloy declines rapidly, which indicates that the main strengthening mechanism of the SC Ni-based superalloy is the formation of the Lomer–Cottrell lock. To initiate the decomposition of one Lomer dislocation, resolved shear stress applied in both dissociated Shockley partials are required to exceed the critical value, that is why a large amount of Lomer dislocations remain undissociated under loading.
- (4)
- During the loading process, the dissociated direction of Lomer dislocation is affected by the energy barrier between and phase. Nevertheless, in the subsequent dislocation movement, the resolved shear stress plays a dominant role and the slip of Shockley partials is consistent with the calculation results of Schmid factors.
Supplementary Materials
The following supporting information can be downloaded at: https://0-www-mdpi-com.brum.beds.ac.uk/article/10.3390/met12050889/s1. Video S1: Uniaxial tension.mp4; Video S2: Uniaxial compression.mp4; Video S3: Equibiaxial tension.mp4; Video S4: Equibiaxial compression.mp4; Video S5: Non-equibiaxial tension.mp4; Video S6: Non-equibiaxial tensile.mp4.
Author Contributions
Conceptualization, R.L. and B.X.; methodology, R.L. and B.X.; formal analysis, B.X.; investigation, B.X., R.L., Y.F. and X.W.; resources, R.L.; data curation, R.L.; writing—original draft preparation, B.X.; writing—review and editing, R.L., B.X. and X.W. All authors have read and agreed to the published version of the manuscript.
Funding
This research was funded by the National Nature Science Foundation of China, grant number 11902013 and the KPI funding of Beihang University.
Institutional Review Board Statement
Not applicable.
Informed Consent Statement
Not applicable.
Data Availability Statement
Data sharing is not applicable.
Acknowledgments
The authors are grateful to the computational assistance provided by the Paratera platform.
Conflicts of Interest
The authors declare no conflict of interest.
References
- Caron, P.; Khan, T. Evolution of Ni-based superalloys for single crystal gas turbine blade applications. Aerosp. Sci. Technol. 1999, 3, 513–523. [Google Scholar] [CrossRef]
- Pollock, T.M.; Argon, A.S. Directional coarsening in nickel-base single crystals with high volume fractions of coherent precipitates. Acta Metall. Mater. 1994, 42, 1859–1874. [Google Scholar] [CrossRef]
- Xia, W.; Zhao, X.; Yue, L.; Zhang, Z. A review of composition evolution in Ni-based single crystal superalloys. J. Mater. Sci. Technol. 2020, 44, 76–95. [Google Scholar] [CrossRef]
- Xia, W.; Zhao, X.; Yue, L.; Zhang, Z. Microstructural evolution and creep mechanisms in Ni-based single crystal superalloys: A review. J. Alloy. Compd. 2020, 819, 152954. [Google Scholar] [CrossRef]
- Zhang, C.; Hu, W.; Wen, Z.; Tong, W.; Zhang, Y.; Yue, Z.; He, P. Creep residual life prediction of a nickel-based single crystal superalloy based on microstructure evolution. Mater. Sci. Eng. A 2019, 756, 108–118. [Google Scholar] [CrossRef]
- Long, H.; Mao, S.; Liu, Y.; Zhang, Z.; Han, X. Microstructural and compositional design of Ni-based single crystalline superalloys―A review. J. Alloy. Compd. 2018, 743, 203–220. [Google Scholar] [CrossRef]
- Reed, R.C. The Superalloys: Fundamentals and Applications; Cambridge University Press: Cambridge, UK; New York, NY, USA, 2006; ISBN 9780511246869. [Google Scholar]
- Fan, Y.S.; Yang, X.G.; Tan, L.; Shi, D.Q.; Li, S.L.; Wang, P. Experiment and modelling on the effect of microstructural morphology on fatigue life of a Ni-based superalloy. Mater. Sci. Eng. A 2020, 786, 139368. [Google Scholar] [CrossRef]
- Wang, R.Z.; Zhu, S.P.; Wang, J.; Zhang, X.C.; Tu, S.T.; Zhang, C.C. High temperature fatigue and creep-fatigue behaviors in a Ni-based superalloy: Damage mechanisms and life assessment. Int. J. Fatigue 2019, 118, 8–21. [Google Scholar] [CrossRef]
- Luo, L.; Ai, C.; Ma, Y.; Li, S.; Pei, Y.; Gong, S. Influence of temperature on the lattice misfit and elastic moduli of a Ni based single crystal superalloy with high volume fraction of γ′ phase. Mater. Charact. 2018, 142, 27–38. [Google Scholar] [CrossRef]
- Zhang, J.X.; Murakumo, T.; Harada, H.; Koizumi, Y. Dependence of creep strength on the interfacial dislocations in a fourth generation SC superalloy TMS-138. Scr. Mater. 2003, 48, 287–293. [Google Scholar] [CrossRef]
- Chang, C.; Jiang, L.; Wu, M.; Li, S.; Han, Y. Effect of temperature and stress on high temperature creep behavior of Ni3Al-based single crystal superalloy. Prog. Nat. Sci. Mater. Int. 2022, 32, 267–271. [Google Scholar] [CrossRef]
- Pei, H.; Yang, Y.; Gu, S.; Zhao, Y.; Yao, X.; Wen, Z.; Yue, Z. Study on oxidation-creep behavior of a Ni-based single crystal superalloy based on crystal plasticity theory. Mater. Sci. Eng. A 2022, 839, 142834. [Google Scholar] [CrossRef]
- Ding, Q.; Bei, H.; Yao, X.; Zhao, X.; Wei, X.; Wang, J.; Zhang, Z. Temperature effects on deformation substructures and mechanisms of a Ni-based single crystal superalloy. Appl. Mater. Today 2021, 23, 101061. [Google Scholar] [CrossRef]
- Wu, R.; Zhao, Y.; Yin, Q.; Wang, J.; Ai, X.; Wen, Z. Atomistic simulation studies of Ni-based superalloys. J. Alloy. Compd. 2021, 855, 157355. [Google Scholar] [CrossRef]
- Zhu, Y.; Li, Z.; Huang, M. Atomistic modeling of the interaction between matrix dislocation and interfacial misfit dislocation networks in Ni-based single crystal superalloy. Comput. Mater. Sci. 2013, 70, 178–186. [Google Scholar] [CrossRef]
- Xiong, J.; Zhu, Y.; Li, Z.; Huang, M. Quantitative study on interactions between interfacial misfit dislocation networks and matrix dislocations in Ni-based single crystal superalloys. Acta Mech. Solida Sin. 2017, 30, 345–353. [Google Scholar] [CrossRef]
- Wu, W.P.; Guo, Y.F.; Wang, Y.S.; Mueller, R.; Gross, D. Molecular dynamics simulation of the structural evolution of misfit dislocation networks at γ/γ′ phase interfaces in Ni-based superalloys. Philos. Mag. 2011, 91, 357–372. [Google Scholar] [CrossRef]
- Li, N.L.; Wu, W.P.; Nie, K. Molecular dynamics study on the evolution of interfacial dislocation network and mechanical properties of Ni-based single crystal superalloys. Phys. Lett. A 2018, 382, 1361–1367. [Google Scholar] [CrossRef]
- Chen, B.; Wu, W.P.; Chen, M.X.; Guo, Y.F. Molecular dynamics study of fatigue mechanical properties and microstructural evolution of Ni-based single crystal superalloys under cyclic loading. Comput. Mater. Sci. 2020, 185, 109954. [Google Scholar] [CrossRef]
- Gebura, M.; Lapin, J. The effect of multiaxial stress state on formation of rafts in CMSX-4 superalloy during creep. Adv. Mater. Res. 2011, 278, 222–227. [Google Scholar] [CrossRef] [Green Version]
- Caccuri, V.; Cormier, J.; Desmorat, R. γ′-Rafting mechanisms under complex mechanical stress state in Ni-based single crystalline superalloys. Mater. Des. 2017, 131, 487–497. [Google Scholar] [CrossRef]
- Cao, L.; Wollgramm, P.; Bürger, D.; Kostka, A.; Cailletaud, G.; Eggeler, G. How evolving multiaxial stress states affect the kinetics of rafting during creep of single crystal Ni-base superalloys. Acta Mater. 2018, 158, 381–392. [Google Scholar] [CrossRef]
- Kakehi, K. Tension/compression asymmetry in creep behavior of a Ni-based superalloy. Scr. Mater. 1999, 41, 461–465. [Google Scholar] [CrossRef]
- Wen, Z.; Pei, H.; Wang, B.; Zhang, D.; Yue, Z. The tension/compression asymmetry of a high γ′ volume fraction nickel-based single-crystal superalloy. Mater. High Temp. 2016, 33, 68–74. [Google Scholar] [CrossRef]
- Wang, B.Z.; Liu, D.S.; Wen, Z.X. The study of tension/compression asymmetry of [111] oriented nickel base single crystal superalloys. Rare Met. Mater. Eng. 2014, 43, 322–326. [Google Scholar]
- Yamashita, M.; Kakehi, K. Tension/compression asymmetry in yield and creep strengths of Ni-based superalloy with a high amount of tantalum. Scr. Mater. 2006, 55, 139–142. [Google Scholar] [CrossRef]
- Tsuno, N.; Shimabayashi, S.; Kakehi, K.; Rae, C.M.F.; Reed, R.C. Tension/compression asymmetry in yield and creep strengths of Ni-based superalloys. Superalloys 2008, 2008, 433–442. [Google Scholar]
- Wang, B.Z.; Liu, D.S.; Wen, Z.X.; Yue, Z.F. Tension/compression asymmetry of [001] single-crystal nickel-based superalloy DD6 during low cycle fatigue. Mater. Sci. Eng. A 2014, 593, 31–37. [Google Scholar] [CrossRef]
- Yin, Q.; Lian, Y.; Wen, Z.; Pei, H.; Wang, J.; Yue, Z. Atomic simulation of the effect of orientation on tensile/compressive properties in nickel-based single crystal superalloys. J. Alloy. Compd. 2022, 893, 162210. [Google Scholar] [CrossRef]
- Plimpton, S. Fast parallel algorithms for short-range molecular dynamics. J. Comput. Phys. 1995, 117, 1–19. [Google Scholar] [CrossRef] [Green Version]
- Mishin, Y. Atomistic modelling of the γ and γ′-phase of the Ni-Al system. Acta Mater. 2004, 52, 1451–1467. [Google Scholar] [CrossRef]
- Li, Y.L.; Wu, W.P.; Ruan, Z.G. Molecular dynamics simulation of the evolution of interfacial dislocation network and stress distribution of a Ni-based single-crystal superalloy. Acta Metall. Sin. (Engl. Lett.) 2016, 29, 689–696. [Google Scholar] [CrossRef] [Green Version]
- Li, R.Z.; Xie, B.; Yang, X.G.; Fan, Y.S.; Sun, Y.T.; Shi, D.Q. Multi-scale modelling of rafting behaviour under complex stress states for Ni3Al superalloys. Int. J. Plast. 2022, 152, 103255. [Google Scholar] [CrossRef]
- Stukowski, A.; Albe, K. Extracting dislocations and non-dislocation crystal defects from atomistic simulation data. Model. Simul. Mater. Sci. Eng. 2010, 18, 085001. [Google Scholar] [CrossRef]
- Stukowski, A. Visualization and analysis of atomistic simulation data with OVITO—The Open Visualization Tool. Model. Simul. Mater. Sci. Eng. 2010, 18, 015012. [Google Scholar] [CrossRef]
- Hull, D.; Bacon, D.J. Introduction to Dislocations; Butterworth-Heinemann: Oxford, UK, 2001. [Google Scholar]
- Rabkin, E.; Nam, H.S.; Srolovitz, D.J. Atomistic simulation of the deformation of gold nanopillars. Acta Mater. 2007, 55, 2085–2099. [Google Scholar] [CrossRef]
- Li, R.; Chew, H.B. Grain boundary traction signatures: Quantifying the asymmetrical dislocation emission processes under tension and compression. J. Mech. Phys. Solids 2017, 103, 142–154. [Google Scholar] [CrossRef] [Green Version]
- Leidermark, D.; Moverare, J.J.; Johansson, S.; Simonsson, K.; Sjöström, S. Tension/compression asymmetry of a single-crystal superalloy in virgin and degraded condition. Acta Mater. 2010, 58, 4986–4997. [Google Scholar] [CrossRef]
- Bourret, A.; Desseaux, J.; Renault, A. Core structure of the Lomer dislocation in germanium and silicon. Philos. Mag. A 1982, 45, 1–20. [Google Scholar] [CrossRef]
- Rabkin, E.; Srolovitz, D.J. Onset of plasticity in gold nanopillar compression. Nano Lett. 2007, 7, 101–107. [Google Scholar] [CrossRef]
Figure 1.
The unit cell atomic model of SC Ni-based superalloy: Red atoms represent Ni atoms in γ phase; blue atoms represent Ni atoms in γ′ phase; and white atoms represent Al atoms in γ′ phase.
Figure 1.
The unit cell atomic model of SC Ni-based superalloy: Red atoms represent Ni atoms in γ phase; blue atoms represent Ni atoms in γ′ phase; and white atoms represent Al atoms in γ′ phase.

Figure 2.
Diagram of loading condition of different loading states. (a) Tensile loading state. (b) Compressive loading state.
Figure 2.
Diagram of loading condition of different loading states. (a) Tensile loading state. (b) Compressive loading state.

Figure 3.
(a) Strain–stress curves of tension and compression under uniaxial loading conditions. (b1–b3) The snapshots of dislocation evolution under uniaxial tension (Video S1). (c1–c3) The snapshots of dislocation evolution under uniaxial compression (Video S2).

Figure 4.
(a) Strain–stress curves of tension and compression under equibiaxial loading conditions. (b1–b3) The snapshots of dislocation evolution under equibiaxial tension (Video S3). (c1–c3) The snapshots of dislocation evolution under equibiaxial compression (Video S4).

Figure 5.
(a) Strain–stress curves of tension and compression under non-equibiaxial loading conditions. (b1–b3) The snapshots of dislocation evolution under non-equibiaxial tension (Video S5). (c1–c3) The snapshots of dislocation evolution under non-equibiaxial compression (Video S6).

Figure 6.
Detailed view of the initial dislocation at the interface: Red atoms represent Ni atoms in γ phase; blue atoms represent Ni atoms in γ′ phase; and white atoms represent Al atoms in γ′ phase.
Figure 6.
Detailed view of the initial dislocation at the interface: Red atoms represent Ni atoms in γ phase; blue atoms represent Ni atoms in γ′ phase; and white atoms represent Al atoms in γ′ phase.

Figure 7.
The composition of Lomer–Cottrell lock.

Figure 8.
The energy density distribution along all of the three directions of the relaxed SC Ni-based superalloy MD model. The two dashed lines mark the location of the interface and the corresponding phase has been indicated.
Figure 8.
The energy density distribution along all of the three directions of the relaxed SC Ni-based superalloy MD model. The two dashed lines mark the location of the interface and the corresponding phase has been indicated.

Figure 9.
The dislocation bowing mechanism under equibiaxial loading is analyzed by DXA and the blue region represents γ′ phase.
Figure 9.
The dislocation bowing mechanism under equibiaxial loading is analyzed by DXA and the blue region represents γ′ phase.


Table 1.
Details of the Schmid factor for the slipping Shockley partials in each channel under different tension loading states.
Table 1.
Details of the Schmid factor for the slipping Shockley partials in each channel under different tension loading states.
| Loading State and Directions | Resultant Force Direction Vector | Direction of Channels | Burgers Vector and Schmid Factor of Slipping Shockley Partials | |||
|---|---|---|---|---|---|---|
| Burgers Vector | Schmid Factor | Burgers Vector | Schmid Factor | |||
| Uniaxial tension [001] | [001] | [100] | 0.236 | 0.236 | ||
| [010] | 0.236 | 0.236 | ||||
| [001] | 0.471 | 0.471 | ||||
| Equibiaxial tension [100] [001] | [101] | [100] | 0 | 0.236 | ||
| [010] | 0.471 | 0.471 | ||||
| [001] | 0 | 0.236 | ||||
| Non-equibiaxial tension [100] [001] | [102] | [100] | 0.189 | 0 | ||
| [010] | 0.424 | 0.424 | ||||
| [001] | 0.236 | 0.424 | ||||
Publisher’s Note: MDPI stays neutral with regard to jurisdictional claims in published maps and institutional affiliations. |
© 2022 by the authors. Licensee MDPI, Basel, Switzerland. This article is an open access article distributed under the terms and conditions of the Creative Commons Attribution (CC BY) license (https://creativecommons.org/licenses/by/4.0/).
Share and Cite
MDPI and ACS Style
Xie, B.; Wang, X.; Fan, Y.; Li, R. Atomistic Investigation on the Strengthening Mechanism of Single Crystal Ni-Based Superalloy under Complex Stress States. Metals 2022, 12, 889. https://0-doi-org.brum.beds.ac.uk/10.3390/met12050889
AMA Style
Xie B, Wang X, Fan Y, Li R. Atomistic Investigation on the Strengthening Mechanism of Single Crystal Ni-Based Superalloy under Complex Stress States. Metals. 2022; 12(5):889. https://0-doi-org.brum.beds.ac.uk/10.3390/met12050889
Chicago/Turabian StyleXie, Bin, Xinyu Wang, Yongsheng Fan, and Ruizhi Li. 2022. "Atomistic Investigation on the Strengthening Mechanism of Single Crystal Ni-Based Superalloy under Complex Stress States" Metals 12, no. 5: 889. https://0-doi-org.brum.beds.ac.uk/10.3390/met12050889
Note that from the first issue of 2016, this journal uses article numbers instead of page numbers. See further details here.