
Effect of Cooling Rate after Solution Treatment on Subsequent Phase Separation Evolution in Super Duplex Stainless Steel 25Cr-7Ni (wt.%)

 , , ,
, , ,
Abstract
:1. Introduction
2. Materials and Methods
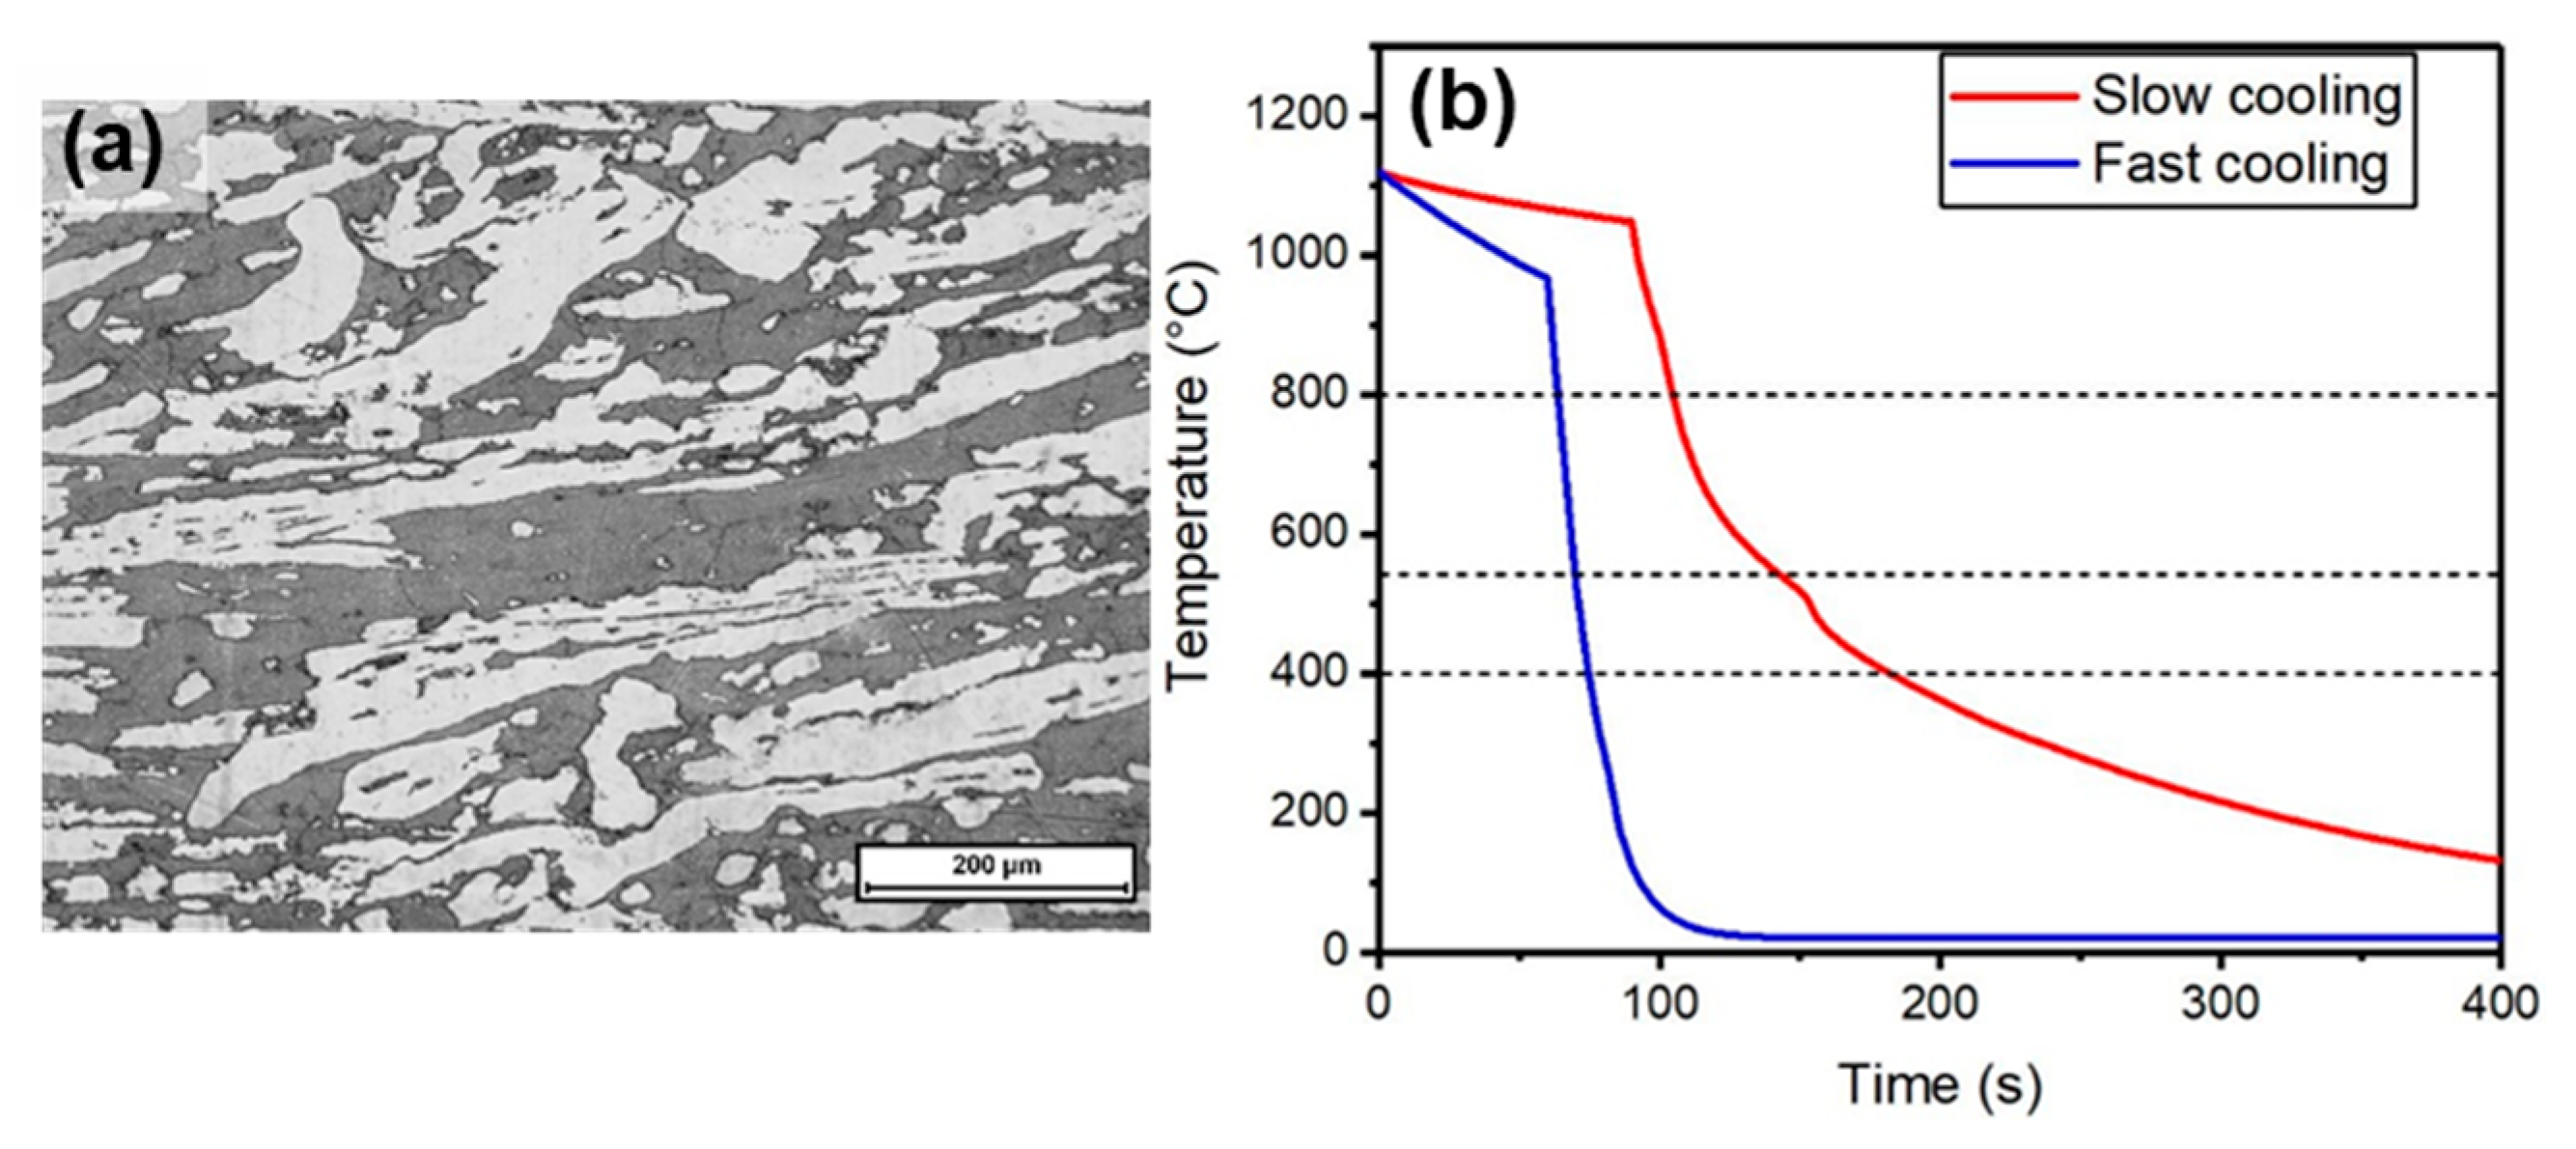
2.1. Material and Heat Treatment
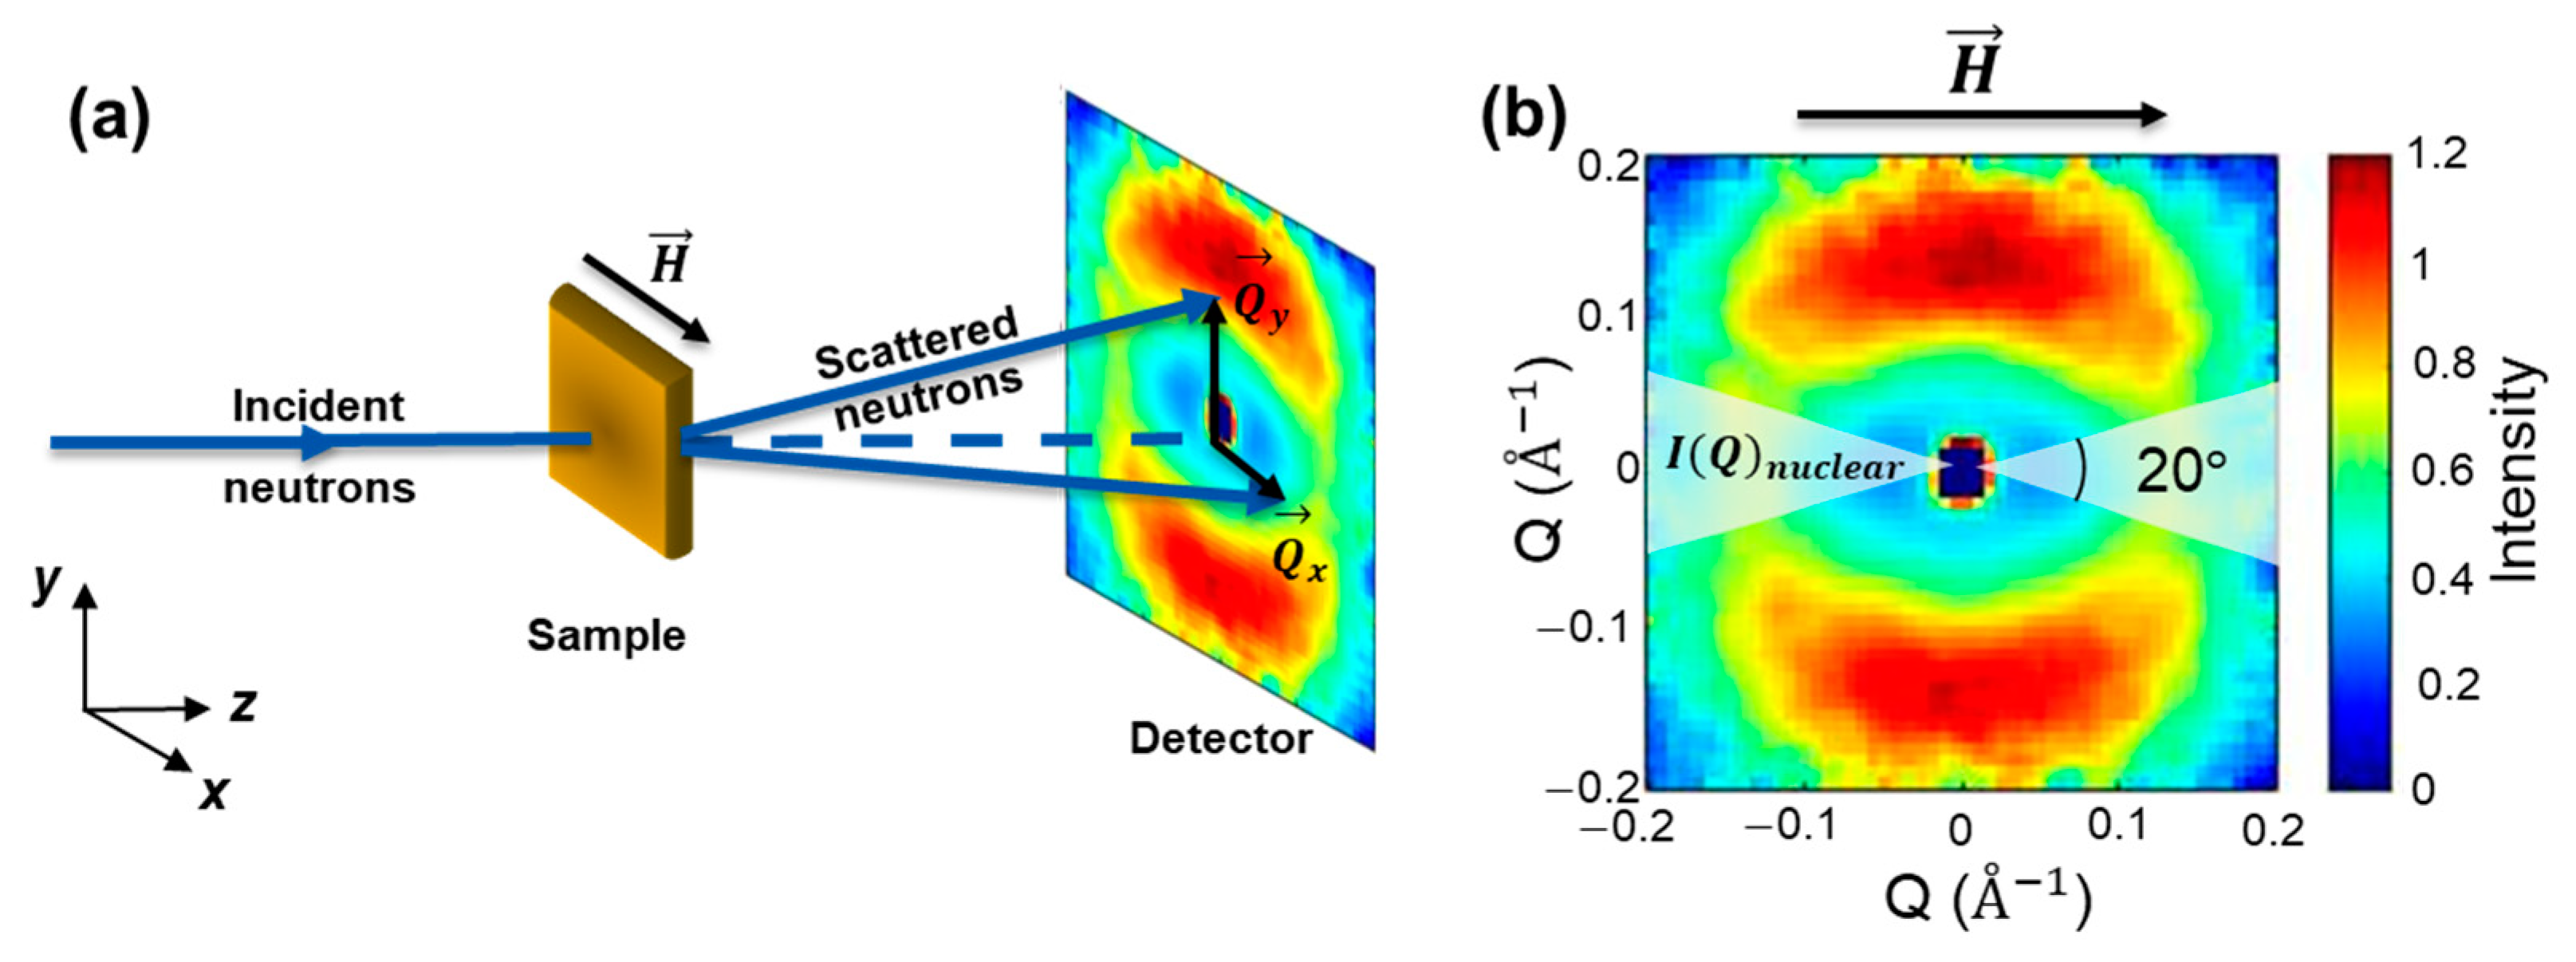
2.2. Small-Angle Neutron Scattering (SANS)
3. Results
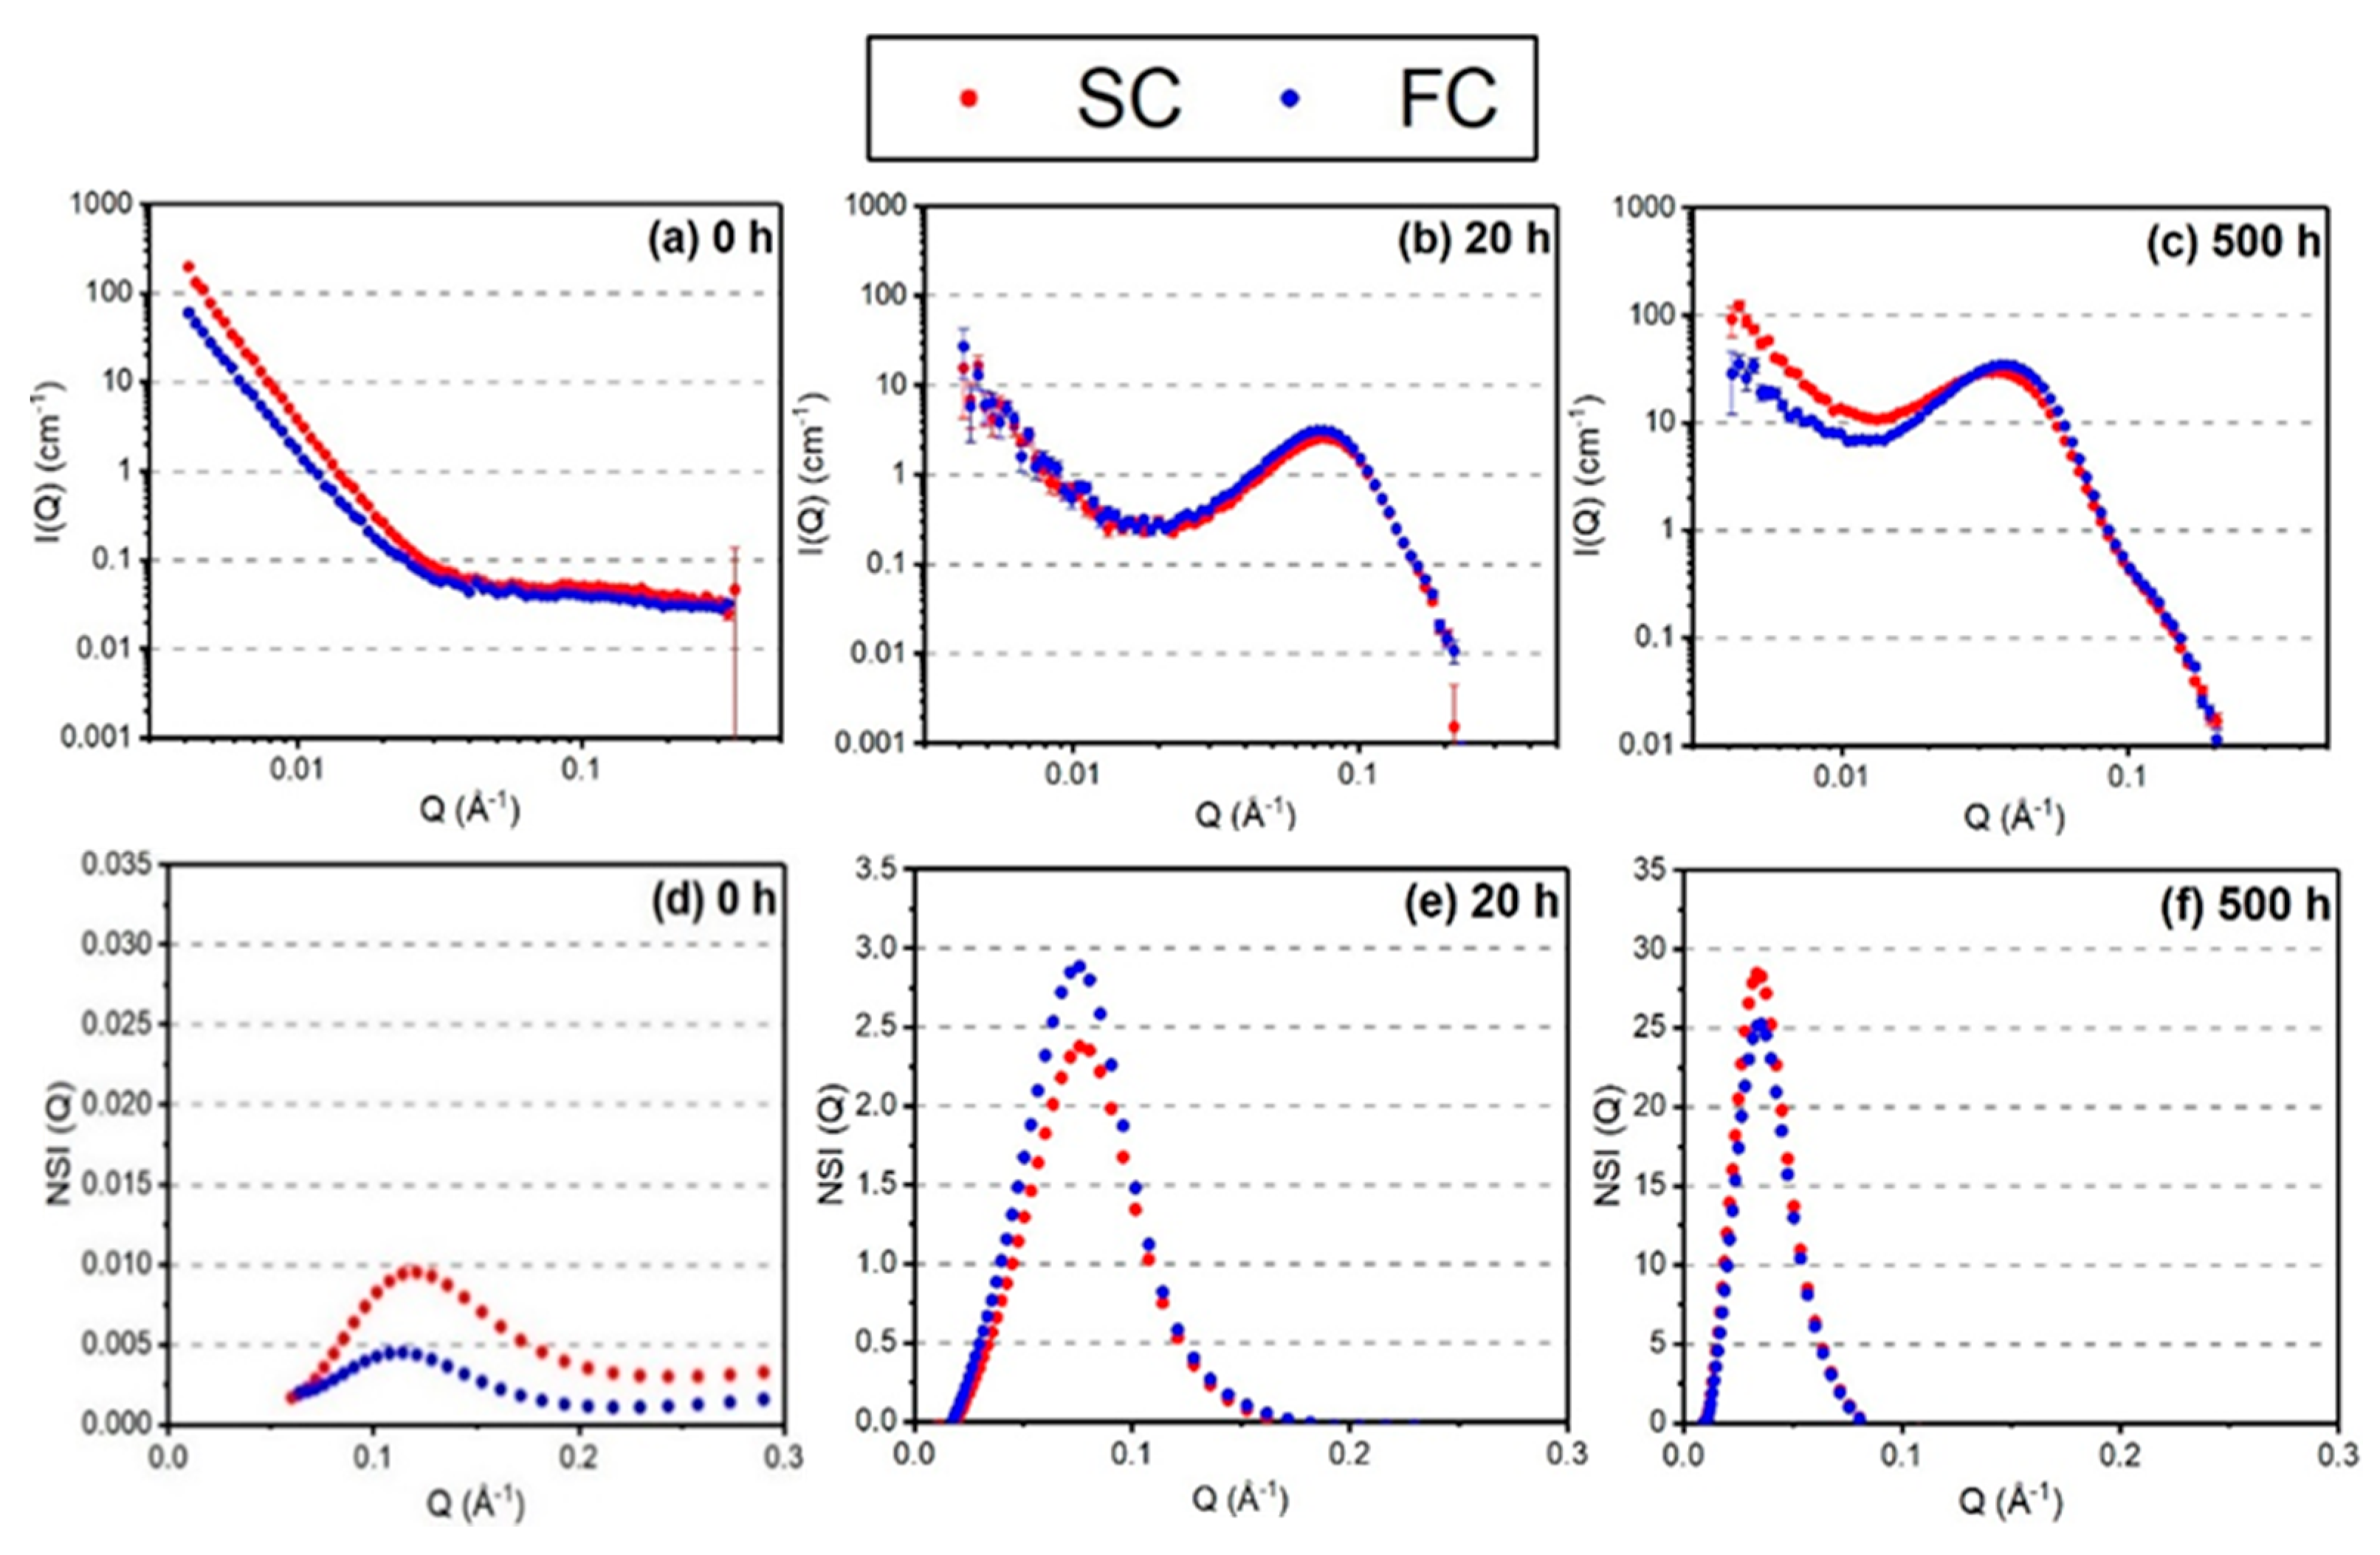
3.1. Ex Situ SANS
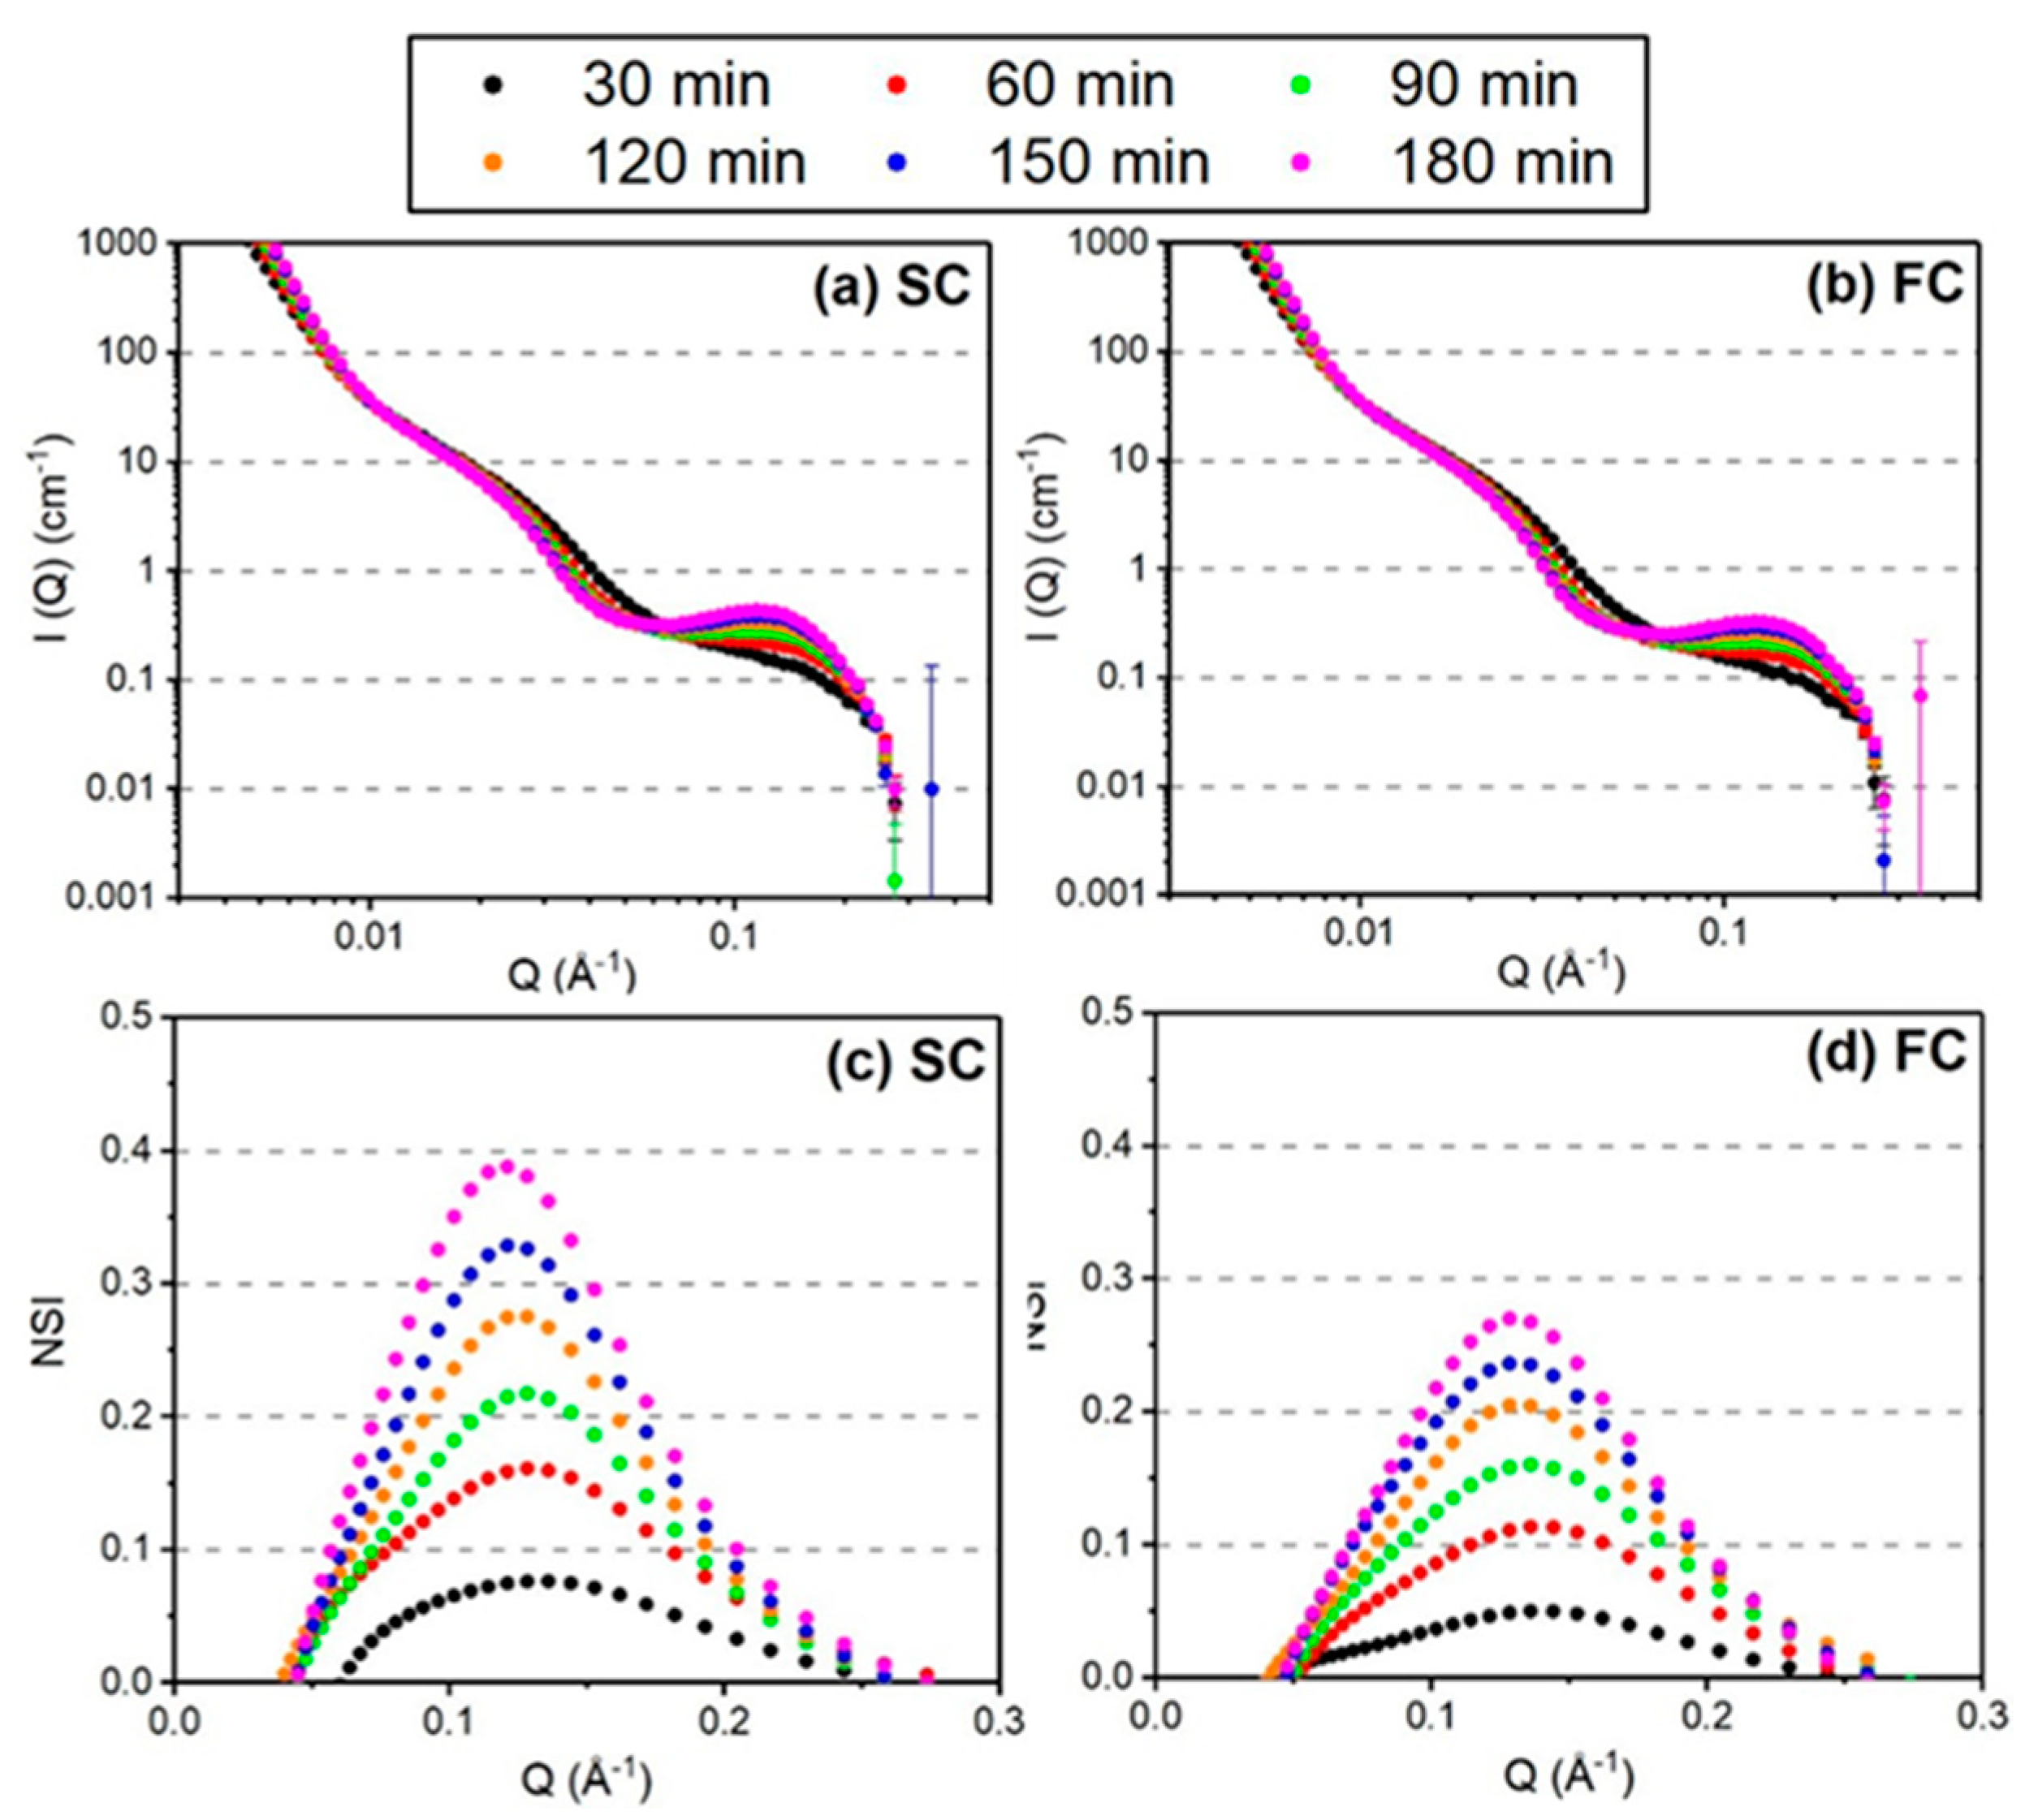
3.2. In Situ SANS
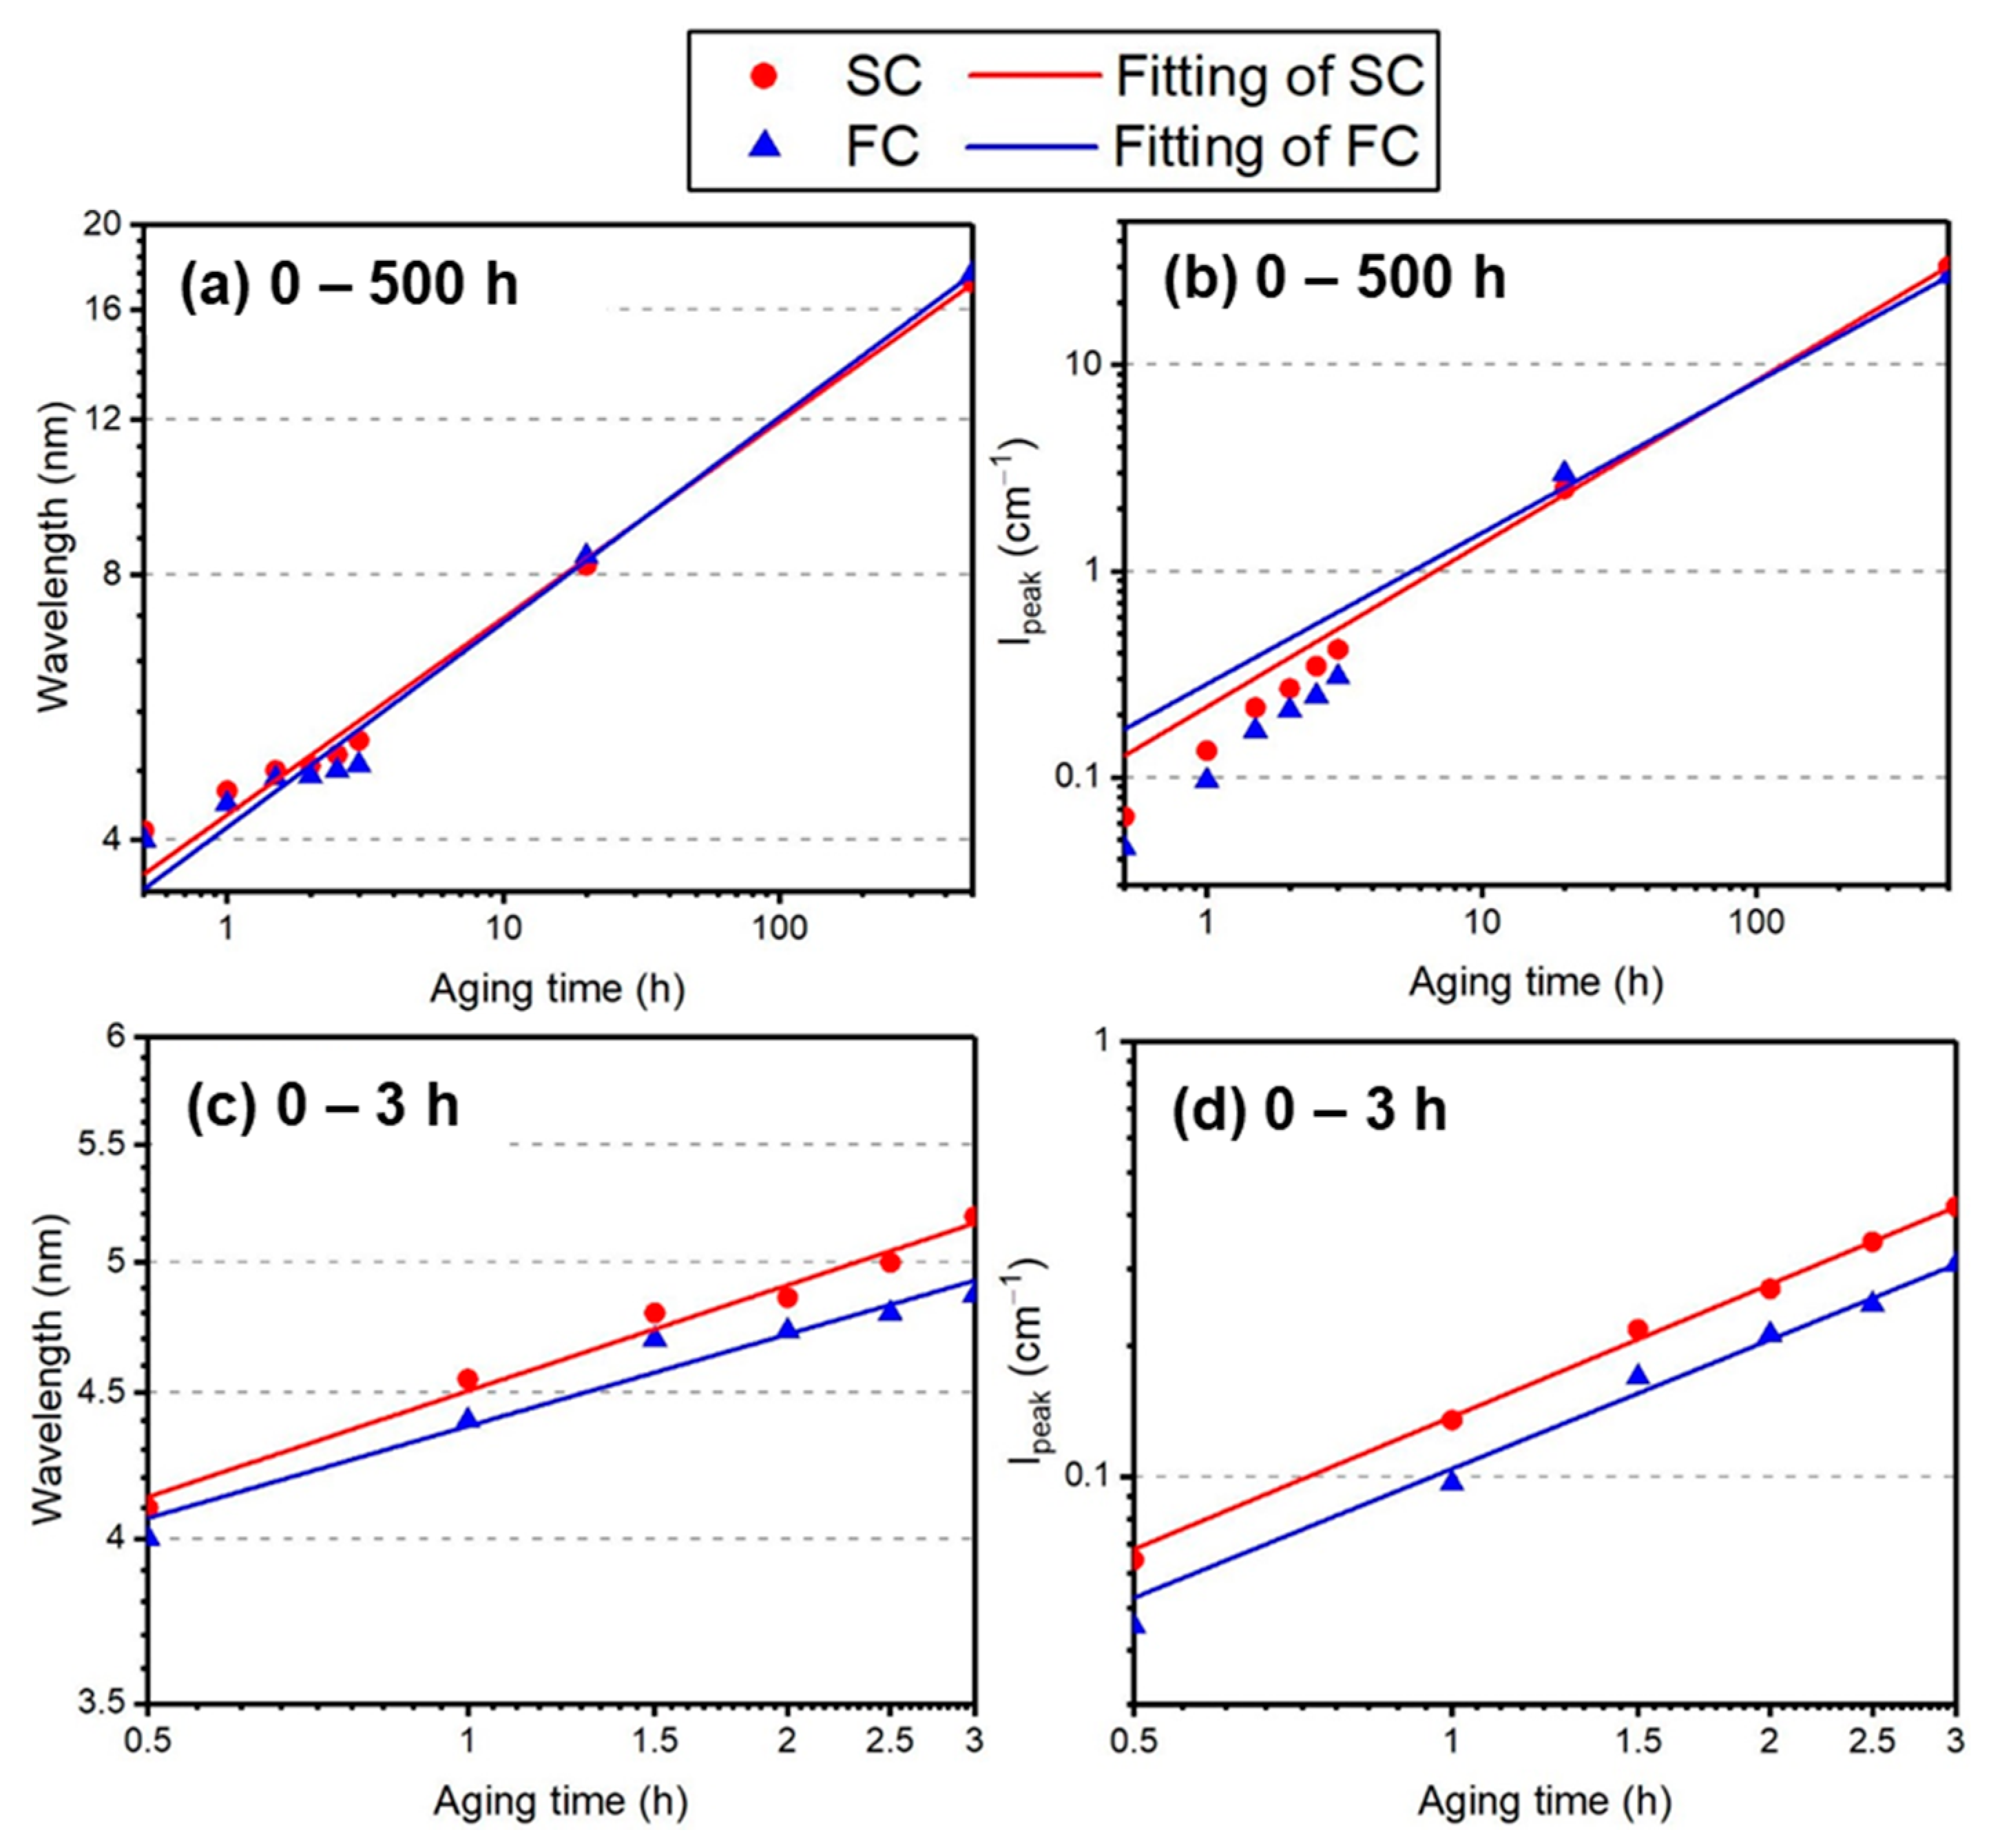
3.3. Power-Law Fitting
4. Discussion
5. Conclusions
Author Contributions
Funding
Institutional Review Board Statement
Informed Consent Statement
Data Availability Statement
Acknowledgments
Conflicts of Interest
References
- Sahu, J.K.; Krupp, U.; Ghosh, R.N.; Christ, H.J. Effect of 475 °C embrittlement on the mechanical properties of duplex stainless steel. Mater. Sci. Eng. A 2009, 508, 1–14. [Google Scholar] [CrossRef]
- Nilsson, J.-O. Super duplex stainless steels. Mater. Sci. Technol. 1992, 8, 685–700. [Google Scholar] [CrossRef]
- Guttmann, M. Intermediate temperature aging of duplex stainless steels. A review. Duplex Stainl. Steels’91 1991, 1, 79–92. [Google Scholar]
- Hosseini, V.A.; Thuvander, M.; Wessman, S.; Karlsson, L. Spinodal decomposition in functionally graded super duplex stainless steel and weld metal. Metall. Mater. Trans. A 2018, 49, 2803–2816. [Google Scholar] [CrossRef] [Green Version]
- Das, Y.; Liu, J.; Ehteshami, H.; Odqvist, J.; Holländer Pettersson, N.; Wessman, S.; King, S.; Hedström, P. Quantitative Nanostructure and Hardness Evolution in Duplex Stainless Steels: Under Real Low-Temperature Service Conditions. Metall. Mater. Trans. A 2021, 53, 723–735. [Google Scholar] [CrossRef]
- Pollak, H.; Karfunkel, U.; Lodya, J.A.; Mala, N. Decomposition of an Fe-Cr 38 wt.% chromium stainless steel at 475 °C. Hyperfine Interact. 1994, 94, 2355–2360. [Google Scholar] [CrossRef]
- Lemoine, C.; Fnidiki, A.; Teillet, J.; Hédin, M.; Danoix, F. Mossbauer study of the ferrite decomposition in unaged duplex stainless steels. Scr. Mater. 1998, 39, 61–66. [Google Scholar] [CrossRef]
- Zhou, J.; Odqvist, J.; Höglund, L.; Thuvander, M.; Barkar, T.; Hedström, P. Initial clustering–a key factor for phase separation kinetics in Fe–Cr-based alloys. Scr. Mater. 2014, 75, 62–65. [Google Scholar] [CrossRef]
- Zhou, J.; Odqvist, J.; Ruban, A.; Thuvander, M.; Xiong, W.; Ågren, J.; Olson, G.B.; Hedström, P. Effect of solution treatment on spinodal decomposition during aging of an Fe-46.5 at.% Cr alloy. J. Mater. Sci. 2016, 52, 326–335. [Google Scholar] [CrossRef] [Green Version]
- Xu, X.; Westraadt, J.E.; Odqvist, J.; Youngs, T.G.; King, S.M.; Hedström, P. Effect of heat treatment above the miscibility gap on nanostructure formation due to spinodal decomposition in Fe-52.85 at.% Cr. Acta Mater. 2018, 145, 347–358. [Google Scholar] [CrossRef]
- LaSalle, J.; Schwartz, L. Further studies of spinodal decomposition in Fe-Cr. Acta Metall. 1986, 34, 989–1000. [Google Scholar] [CrossRef]
- Huston, E.; Cahn, J.W.; Hilliard, J. Spinodal decomposition during continuous cooling. Acta Metall. 1966, 14, 1053–1062. [Google Scholar] [CrossRef]
- Carmesin, H.O.; Heermann, D.W.; Binder, K. Influence of a continuous quenching procedure on the initial stages of spinodal decomposition. Z. Phys. B Condens. Matter. 1986, 65, 89–102. [Google Scholar] [CrossRef]
- Hedin, M.; Massoud, J.; Danoix, F. Influence of the quenching rate on the spinodal decomposition in a duplex stainless steel. J. Phys. IV 1996, 6, C5–C235. [Google Scholar] [CrossRef] [Green Version]
- Lemoine, C.; Fnidiki, A.; Danoix, F.; Hédin, M.; Teillet, J. Mössbauer and atom probe studies on the ferrite decomposition in duplex stainless steels caused by the quenching rate. J. Phys. Condens. Matter. 1999, 11, 1105. [Google Scholar] [CrossRef]
- Xu, X.; Odqvist, J.; Colliander, M.H.; King, S.; Thuvander, M.; Steuwer, A.; Hedström, P. Effect of cooling rate after solution treatment on subsequent phase separation during aging of Fe-Cr alloys: A small-angle neutron scattering study. Acta Mater. 2017, 134, 221–229. [Google Scholar] [CrossRef] [Green Version]
- Hosseini, V.A.; Lindgren, K.; Thuvander, M.; Gonzalez, D.; Oliver, J.; Karlsson, L. Nanoscale phase separations in as-fabricated thick super duplex stainless steels. J. Mater. Sci. 2021, 56, 12475–12485. [Google Scholar] [CrossRef]
- Xu, X.; Wessman, S.; Odqvist, J.; King, S.M.; Hedström, P. Nanostructure, microstructure and mechanical properties of duplex stainless steels 25Cr-7 Ni and 22Cr-5Ni (wt.%) aged at 325 °C. Mater. Sci. Eng. A 2019, 754, 512–520. [Google Scholar] [CrossRef]
- Das, Y.; Liu, J.; Wessman, S.; Xu, X.; Odqvist, J.; King, S.; Hedström, P. Small-angle neutron scattering quantification of phase separation and the corresponding embrittlement of a super duplex stainless steel after long-term aging at 300 °C. Materialia 2020, 12, 100771. [Google Scholar] [CrossRef]
- Heenan, R.; Penfold, J.; King, S. SANS at pulsed neutron sources: Present and future prospects. J. Appl. Crystallogr. 1997, 30, 1140–1147. [Google Scholar] [CrossRef]
- Xu, X.; Odqvist, J.; King, S.M.; Venero, D.A.; Hedström, P. Nuclear and magnetic small-angle neutron scattering in self-organizing nanostructured Fe1−xCrx alloys. Mater. Charact. 2020, 164, 110347. [Google Scholar] [CrossRef]
- Cahn, J.W. Magnetic aging of spinodal alloys. J. Appl. Phys. 1963, 34, 3581–3586. [Google Scholar] [CrossRef]
- Arnold, O.; Bilheux, J.-C.; Borreguero, J.; Buts, A.; Campbell, S.I.; Chapon, L.; Doucet, M.; Draper, N.; Leal, R.F.; Gigg, M. Mantid—Data analysis and visualization package for neutron scattering and μ SR experiments. Nucl. Instrum. Methods Phys. Res. Sect. A Accel. Spectrometers Detect. Assoc. Equip. 2014, 764, 156–166. [Google Scholar] [CrossRef] [Green Version]
- Manipulation and Analysis Toolkit for Instrument Data. Mantid Project. Available online: http://0-doi-org.brum.beds.ac.uk/10.5286/SOFTWARE/MANTID (accessed on 25 October 2021).
- Wignall, G.T.; Bates, F.S. Absolute calibration of small-angle neutron scattering data. J. Appl. Crystallogr. 1987, 20, 28–40. [Google Scholar] [CrossRef]
- Hammouda, B. Probing Nanoscale Structures-The SANS Toolbox; National Institute of Standards and Technology, Center for Neutron Research: Gaithersburg, MD, USA, 2016.
- Furukawa, H. Dynamics-scaling theory for phase-separating unmixing mixtures: Growth rates of droplets and scaling properties of autocorrelation functions. Phys. A Stat. Mech. Its Appl. 1984, 123, 497–515. [Google Scholar] [CrossRef]
- Available online: http://www.sasview.org (accessed on 25 October 2021).
- Xiong, W.; Selleby, M.; Chen, Q.; Odqvist, J.; Du, Y. Phase equilibria and thermodynamic properties in the Fe-Cr system. Crit. Rev. Solid State Mater. Sci. 2010, 35, 125–152. [Google Scholar] [CrossRef]
- Cahn, J.W. On spinodal decomposition. Acta Metall. 1961, 9, 795–801. [Google Scholar] [CrossRef]
- Marro, J.; Bortz, A.B.; Kalos, M.H.; Lebowitz, J.L. Time evolution of a quenched binary alloy. II. Computer simulation of a three-dimensional model system. Phys. Rev. B 1975, 12, 2000–2011. [Google Scholar] [CrossRef]
- Marro, J.; Lebowitz, J.L.; Kalos, M.H. Computer Simulation of the Time Evolution of a Quenched Model Alloy in the Nucleation Region. Phys. Rev. Lett. 1979, 43, 282–285. [Google Scholar] [CrossRef]
- Hyde, J.; Miller, M.; Hetherington, M.; Cerezo, A.; Smith, G.; Elliott, C. Spinodal decomposition in Fe-Cr alloys: Experimental study at the atomic level and comparison with computer models—II. Development of domain size and composition amplitude. Acta Metall. Mater. 1995, 43, 3403–3413. [Google Scholar] [CrossRef]
- Lifshitz, I.M.; Slyozov, V.V. The kinetics of precipitation from supersaturated solid solutions. J. Phys. Chem. Solids 1961, 19, 35–50. [Google Scholar] [CrossRef]
- Wagner, C. Theory of precipitate change by redissolution. Z. Elektrochem. 1961, 65, 581–591. [Google Scholar]
- Huse, D.A. Corrections to late-stage behavior in spinodal decomposition: Lifshitz-Slyozov scaling and Monte Carlo simulations. Phys. Rev. B 1986, 34, 7845–7850. [Google Scholar] [CrossRef] [PubMed]


| Material | Fe | C | Si | Mn | P | Cr | Ni | Mo | Cu | N |
|---|---|---|---|---|---|---|---|---|---|---|
| SDSS 2507 | Bal. | 0.012 | 0.30 | 0.83 | 0.023 | 24.84 | 6.90 | 3.80 | 0.18 | 0.28 |
| Samples | Cooling Rate (800–550 °C) | Cooling Rate (550–400 °C) | Cooling Rate (400–25 °C) |
|---|---|---|---|
| SC | 6 °C/s | 3.5 °C/s | 0.5 °C/s |
| FC | 40 °C/s | 30 °C/s | 5 °C/s |
| Aging Time (h) | Wavelength (nm) | Amplitude (at.%) | ||
|---|---|---|---|---|
| SC | FC | SC | FC | |
| 0 | 5.60.16 | 5.80.20 | 7.70.27 | 5.40.51 |
| 20 | 8.20.01 | 8.40.01 | 59.90.09 | 62.60.08 |
| 500 | 17.20.01 | 16.90.01 | 67.60.06 | 65.70.06 |
| Aging Time (min) | Wavelength (nm) | Amplitude (at.%) | ||
|---|---|---|---|---|
| SC | FC | SC | FC | |
| 30 | 4.10.08 | 4.00.16 | 26.90.95 | 23.11.37 |
| 60 | 4.50.04 | 4.40.08 | 33.30.60 | 29.60.84 |
| 90 | 4.80.02 | 4.70.03 | 39.20.43 | 35.40.36 |
| 120 | 4.90.02 | 4.70.03 | 42.90.47 | 39.40.37 |
| 150 | 5.00.01 | 4.80.02 | 46.20.36 | 42.70.45 |
| 180 | 5.20.01 | 4.90.02 | 48.10.24 | 45.40.30 |
| Scheme | ||||
|---|---|---|---|---|
| SC in (a) | 0.22 | 0.99 | 0.79 | 0.99 |
| FC in (b) | 0.23 | 0.99 | 0.73 | 0.99 |
| SC in (c) | 0.12 | 0.98 | 1.01 | 0.99 |
| FC in (d) | 0.10 | 0.95 | 0.98 | 0.99 |
Publisher’s Note: MDPI stays neutral with regard to jurisdictional claims in published maps and institutional affiliations. |
© 2022 by the authors. Licensee MDPI, Basel, Switzerland. This article is an open access article distributed under the terms and conditions of the Creative Commons Attribution (CC BY) license (https://creativecommons.org/licenses/by/4.0/).
Share and Cite
Liu, J.; Das, Y.; King, S.M.; Jonsson, J.Y.; Wessman, S.; Hedström, P. Effect of Cooling Rate after Solution Treatment on Subsequent Phase Separation Evolution in Super Duplex Stainless Steel 25Cr-7Ni (wt.%). Metals 2022, 12, 890. https://0-doi-org.brum.beds.ac.uk/10.3390/met12050890
Liu J, Das Y, King SM, Jonsson JY, Wessman S, Hedström P. Effect of Cooling Rate after Solution Treatment on Subsequent Phase Separation Evolution in Super Duplex Stainless Steel 25Cr-7Ni (wt.%). Metals. 2022; 12(5):890. https://0-doi-org.brum.beds.ac.uk/10.3390/met12050890
Chicago/Turabian StyleLiu, Jianling, Yadunandan Das, Stephen M. King, Jan Y. Jonsson, Sten Wessman, and Peter Hedström. 2022. "Effect of Cooling Rate after Solution Treatment on Subsequent Phase Separation Evolution in Super Duplex Stainless Steel 25Cr-7Ni (wt.%)" Metals 12, no. 5: 890. https://0-doi-org.brum.beds.ac.uk/10.3390/met12050890