Impact of MiFID II on the Market Volatility—Analysis on Some Developed and Emerging European Stock Markets


Faculty of Economics and Business Administration, West University of Timisoara, 300115 Timisoara, Romania
Laws 2021, 10(3), 55; https://0-doi-org.brum.beds.ac.uk/10.3390/laws10030055
Submission received: 1 June 2021
/
Revised: 21 June 2021
/
Accepted: 25 June 2021
/
Published: 30 June 2021
(This article belongs to the Special Issue Securitization and Financial Innovation in a Post Crisis World)
Abstract
:The paper investigates whether the implementation of MiFID II, a packet of financial legislation applying broadly to European Union financial markets, has led to a change in the volatility of some European developed and emerging stock markets. We show that for the developed capital markets considered in the analysis, MiFID II did not lead to a decrease in the volatility of capital markets. On the contrary, for all analysis intervals considered (3 months, 6 months, 12 months, 18 months and 24 months), the impact on volatility is positive, with volatility increasing in the case of the FTSE 100, CAC40 and DAX stock indexes. There is a similar significant relationship for the Czech stock market, but only over the three-month interval. For the Polish and Romanian stock markets, which enforced MiFID II later, a negative impact of MiFID II on volatility could also be observed. In the Romanian market, MiFID II had a negative impact on volatility on the short-term horizon, while for the Polish market, the impact of MiFID II on volatility is noticeable on a longer term of 24 months.
1. Introduction
MiFID II, a packet of financial legislation applying broadly to European Union financial markets with key provisions related to transparency and record-keeping, is considered by many the cornerstone of European securities regulation. The purpose of this study is to investigate the regulatory impact of MiFID II on the volatility of some of the most important European stock markets, in which stock markets it had the strongest effects and whether the reaction to MiFID II was similar between developed and emerging markets. The most recent financial crisis has highlighted the impact that speculative trading can have on the real economy. Price movements that are not based on economic fundamentals might impact the efficiency of the capital allocation ensured by the stock market, leading investors out of the market. Regulators trying to ensure stable financial markets will try to reduce fluctuations on the stock exchanges (ESMA 2020).
Over the past two decades, European financial markets have undergone significant changes: regulatory reforms, technological advances as well as growing competition (ESMA 2014). Developments in trading technologies fostered the use of an automated and very fast trading infrastructure. The increase in algorithmic trading over recent years, considered beneficial by many in terms of increasing market efficiency due to increased liquidity (Hendershot et al. 2011), facilitation of larger trades (Hasbrouck and Saar 2013), improved pricing discovery (Brogaard and Garriott 2019), lower trading costs (Chlistalla 2011) and narrower bid-ask spreads (Hagströmer and Norden 2013) also created new risks. The regulation of high-frequency algorithmic trading by MiFID II has an aim of promoting financial stability and ensuring orderly markets, interrupting period of excessive volatility in order to give investors the possibility to reassess their positions.
However, the application of circuit breakers (volatility halts) and other requirements imposed may have effects that are not straight-forward to anticipate (ESMA 2020). On the other hand, one of the most important goals of MiFID II was to secure a high level of market transparency and fairness. This is meant to address the potential conflicts of interest in the financial services industry, which is in the best interest of the investors (Fang et al. 2020). The pre-trade and post-trade increased transparency demanded in the MiFID II should have also impacted the volatility of the stock markets, given the existing association between volatility and accuracy of stock prices. However, there has not been a thorough investigation of the impact of MiFID II regulations on the European market volatility. This paper compares the volatility of six European stock exchanges before and after the implementation of MiFID II, considering five different analysis periods (3 months, 6 months, 12 months, 18 months and 24 months). While a short-term horizon is usually employed in event studies (with a maximum length of 12 months), the event studies that have in consideration long horizons (of 1 year and more) can also provide important information regarding stock market efficiency (Fama 1991), and can better capture possible differentiation in the impact of the MiFID II regulation over the analysed periods. The rest of the paper is organized as follows. In Section 2, we review the theoretical literature on the channels through which regulation might impact stock market volatility, as well as the empirical research that has actually investigated the impact of MiFID II on stock markets. In Section 3, we describe the methodological approach and main results. Section 4 concludes, presents study limitations and gives recommendations about further research.
2. Theoretical Background
Daly (2008) shows why volatility is a particularly important feature of capital markets. For one thing, significant fluctuation in the prices of financial assets over short periods diminishes investors’ confidence in the relevance of economic information revealed by stock market price changes, leading to a lower flow of capital to the capital markets. For the companies trading on a regulated market, volatility has a significant impact on their default risk. Moreover, volatility influences the gap between bid and ask prices and affects stock market liquidity. Hedging strategies also have higher costs to cover the risks associated with trading financial instruments on more volatile stock markets. Finally, investors in general have risk aversion, with a higher level of risk resulting in higher transaction costs for investors, which will result in a less efficient allocation of existing capital in the economy.
The theoretical basis for the interpretation of volatility is based on the existing connection between volatility and the accuracy of stock prices. Lower volatility on the stock market is associated with higher price accuracy. Volatility is higher during periods of increased uncertainty and risk (Hassan and Wu 2015). Lee et al. (2015) conclude that companies that are less transparent on the market have higher idiosyncratic risk and total risk than other companies. If price formation is efficient and the information is incorporated quickly and effectively into asset pricing, this will generate less asset volatility (Oxera 2019).
One of the most important objectives of stock market regulation is to maintain transparency. Market transparency, ensured by dissemination of both trade and quote information, plays a fundamental role in the fairness and efficiency of the stock markets (Bloomfield and O’Hara 1999). While pre-trade transparency ensures the observation of the order flow, quotes and information about market participants (Boehmer et al. 2005), post-trade transparency ensures the observation of execution quality, as well as execution prices (Dumitrescu 2010). Acording to Aghanya et al. (2020), MiFID I led to an increase in the market transparency by enabling market participants to observe information in real time during the trading process, which helped them make more informed trade decisions. However, there are some studies that demonstrate the opposite effect, finding that the increase in market transparency can actually increase market volatility (Madhavan 1996; Madhavan et al. 2005). More recently, Anselmi and Petrella (2021), investigating the impact of MiFID II on the stock market quality, have not observed any significant change in the bid-ask spread (as a proxy of market quality) following the introduction of the new regulation.
Another important objective of financial regulation is to maintain stable financial markets (Buss et al. 2013). Buss et al. (2013) show that different regulatory constraints (such as the Tobin financial transactions tax, constraints on short selling or leverage) can impact stock markets and the welfare of investors, reaching the conclusion that the most effective regulations are the ones that reduce volatility, but do not inhibit risk sharing. Other regulatory measures used by stock exchanges in order to curb stock price volatility are margins, price limits or circuit breakers (Anshuman 2003). Although regulatory intervention is meant to dampen the sources of market instability, the theoretical literature has been clear about the direction and efficiency of such intervention. It should address the transitory volatility and not the fundamental volatility, which allows for a normal price swing due to incorporating new information on fundamental values (Ackert et al. 2005). In the EU regulatory framework, MiFID II addresses the volatility topic in at least two important areas. First, by imposing different requirements concerning trading halts in order to reduce excessive volatility, the realized volatility of the stock market could be dampened. Secondly, by increasing the pre-trade transparency requirements and post-trade public disclosure in markets (providing to market participants near real-time broadcast of basic trade data around firm quotes, respectively execution trades) and enhancing control around prevention of market abuse, the volatility on the stock markets can also be reduced.
While there is little empirical evidence that shows a decrease in the European stock market liquidity following MiFID II (Fang et al. 2020; Utkilen and Wakeford-Wesmann 2019; Anselmi and Petrella 2020), there are only a handful of studies that have approached the impact of the implementation of MiFID II on the volatility of European Union stock markets. Meijers (2018) investigated whether the pre- and post-trade transparency requirements imposed through MiFID I and MiFID II/MiFIR led to reduced volatility in European equity markets, considering three stock market indexes. Although they find empirical evidence that supports the negative impact of MiFID I on the volatility, concluding that the implied volatility decreased after the implementation of MiFID I, the evidence on MiFID II is the reverse, with increases in implied and realised volatility. The main limit of their study is the short-term post-implementation analysis period of only 5 months. ESMA (2020) investigated whether the introduction of volatility safeguards (price collars, circuit breakers or both) by EU trading venues according to MiFID II has had any impact of the price discovery process. Using 10,000 financial instruments traded on the European stock exchanges, they conclude that price volatility declines significantly in both halted and cross-listed stocks using different short-term intervals of 10, 5 and even 2 min after the halts. They observe, however, that the bid-ask spread increases after the halts, especially in cross-listed stocks.
3. Methodological Approach
3.1. Data and Methodology
Data were obtained from Investing.com for the most representative capital markets in Eastern Europe—Warsaw Stock Exchange, Prague Stock Exchange and Bucharest Stock Exchange—as well as the three largest capital markets in Western Europe—London Stock Exchange, Deutsche Börse and Euronext Paris. We consider the most important stock indexes for these markets (BET, WIG20, PX, FTSE100, DAX 30, CAC40).
The data include daily information on closing prices, volumes of traded shares, high quotes and low quotes. In the case of the Polish index, we use daily data from April 2016 to April 2020. For the Romanian index, we use daily data from July 2016 to July 2020. For the other stock indexes, the daily data used is from January 2016 to January 2020 (due to the different time of transposition of MiFID II into national law and the entry into force of national legislation) (Table 1).
We use five analysis periods (3 months, 6 months, 1 year, 1.5 years and 2 years), which we consider from the moment of the transposition of MiFID II. For example, in the case of the Romanian stock index, BET, the pre-event period is the period before the implementation of MiFID II in Romania and the post-event period is any period after MiFID II is implemented in Romania, so the maximum analysis horizon is 6 July 2016 to 6 July 2020. Similarly, we considered the analysis periods for the other five stock indexes, depending on when national legislation transposing MiFID II entered into force (Table 2).
The historical (realized) volatility is most often measured by the standard deviation of stock returns. We compute volatility in a similar way, considering a 30-day moving analysis period, so the calculation formula is as follows:
where represents the daily return and represents the average return calculated over the previous 30 days. This is used to calculate the standard deviation on a 30-day rolling basis. In the econometric analysis, we use this historical (realized) volatility. Obviously, variations in volatility may not only result from the impact of MiFID II, so control variables are taken into account to determine more clearly the effects of MiFID II regulation on volatility. The econometric analysis is based on the following linear regression model:
where represents the 30-day historical volatility of the stock market. is a dummy variable equal to 1 for the post-MIFID II period and 0 otherwise. is a vector of control variables with corresponding coefficients and is the error term. Based on the overall linear regression model, we arrive at the model used:
where Priceind represents the daily price index, Tradevol represents the daily traded volume of shares and HLSpread is the daily spread between high and low quotes. We also use interaction terms to observe whether the impact of HLSpread on volatility is differrent after MiFID II implementation.
According to Dufour et al. (2012), the price index is expected to have a negative connection with volatility. We use log values of Priceind, given the asymmetric relationship established between this variable and volatility in previous studies, which assumes that a negative change in the stock market affects more significantly the volatility as a positive one (Hibbert et al. 2008; Bollerslev et al. 2006). The relationship between return volatility and trading volume is highly documented in the literature (Harris 1987; Andersen 1996; Darrat et al. 2003). A market with higher liquidity is likely to have lower price volatility (Chordia et al. 2002). More recently, Chiang et al. (2010), supporting the sequential information hypothesis1, suggests that there is a bi-directional non linear causality between these two variables, supporting the idea of using lagged values of trading volume to predict return volatility. Conseqently, we use log values of trading volume in our model. We test different numbers of lags for statistically significant results. Finally, the connection between high and low spread and volatility is analysed by Corrado and Truong (2007). The high and low spread is used in this analysis as a proxy of liquidity, with a lower spread indicating higher liquidity and conseqently having a positive influence on volatility. Pástor and Stambaugh (2003) confirm the existence of a negative relationship between liquidity and volatility in their empirical approach.
3.2. Results and Interpretation
Table 3 shows the regression estimates from the Romanian stock market. We consider first the Romanian case, given the fact that in this case there is a statistically different impact on volatility generated by the transposition of MiFID II. There is a decrease in the realized volatility registered in the 3 months and 6 months following MiFID II implementation. We can see that the impact of MiFID II on decreasing the volatility of the Romanian capital market is higher in the case of the latter period. The results after 12 months and 18 months are similar, but they are not statistically significant. For the 24 months period after the implementation of MiFID II, the volatility is higher, but this could be due to the analysis period, which includes the COVID-19 pandemic (Table 3 and Appendix A).
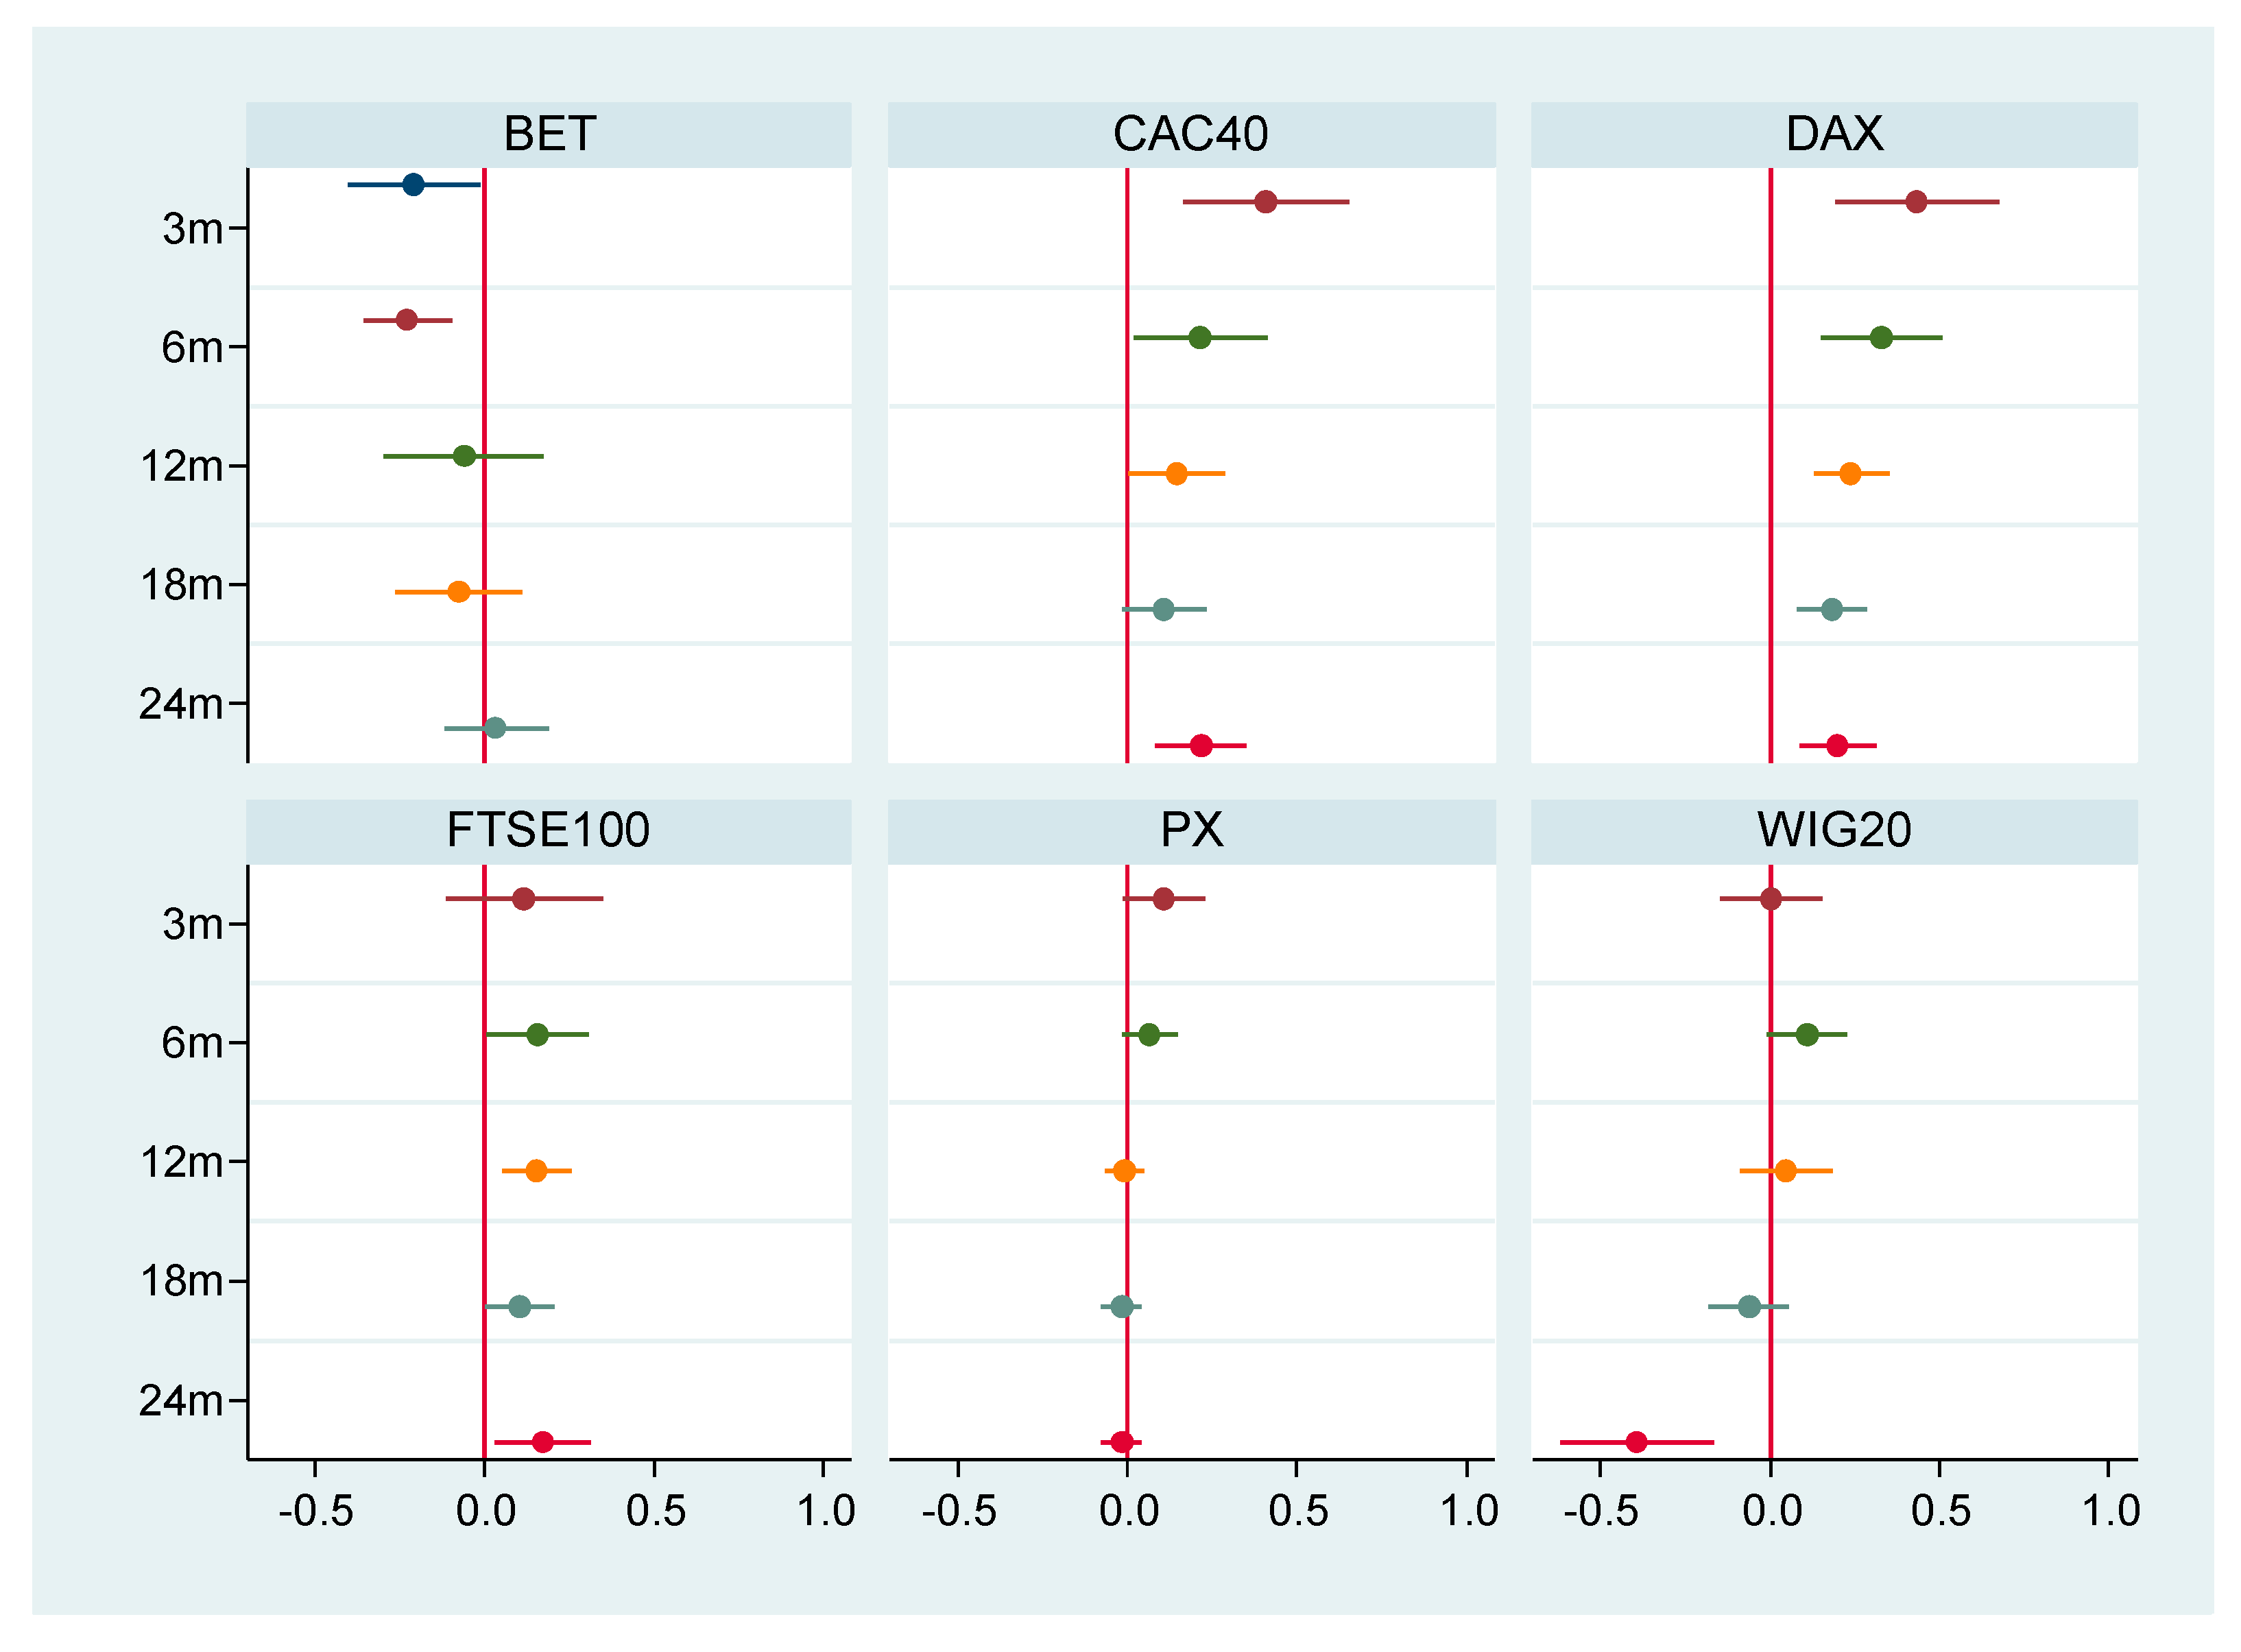
Figure 1 shows results from the other stock markets, which, with the exception of Poland, exhibit an effect of MiFID II in a reverse direction to what was found in Romania.
For the developed capital markets considered in the analysis, the enforcement of MiFID II did not lead to a decrease in the volatility of capital markets. On the contrary, for all considered time-periods (3 months, 6 months, 12 months, 18 months and 24 months), the impact on volatility is positive, with volatility increasing in the case of the FTSE 100, CAC40 and DAX stock indexes. There is a similar relationship in the Czech stock market, for the smallest time period considered (of three months). For the Polish stock market, a significant negative impact of MiFID II on volatility is only observed toward the end of the analysis period (24 months) (Table 4).
From the analysis of the control variables used in the econometric study, the impact of high-low spread is always positive for all six stock indexes, meaning that, controlling for the other factors included in the model, an increase in the gap between maximum and minimum prices results in an increase in volatility (a result which confirms the conclusions drawn in literature that a large spread between quotes generates a higher stock market instability). The interaction between spread and the MiFID II variable shows that for BET and WIG-20, the positive impact of spread on volatility increases after MiFID II is implemented. For a 2-year analysis period, in the FTSE100, DAX and CAC40 stock indexes, the interaction variable coefficients become negative, meaning that the impact of spread on volatility decreases after MiFID II has been implemented.
There is also a general trend highlighted by the impact of trading volume and price of stock indexes on volatility. In general, there is a negative connection with volatility for trading volume and a positive one for price index for all considered stock exchanges. In other words, volatility increases with the increase in the value of stock indexes, and decreases when trading volume is low.
4. Conclusions
This paper aimed to provide evidence on the impact of MiFID II on volatility in European stock markets. The core conclusion is that MiFID II legal provisions did not lead to a decrease in the volatility in the case of the considered Western European stock exchanges. There was also no effect in the Czech stock market, except for the smallest time period (3 months), in which volatility increased. For the Romanian stock market, which enforced the MiFID II regulation later, there was a negative impact of MiFID II on volatility in the first 3 months and 6 months post-implementation. A similar relationship could be observed in the case of Poland, but on a longer-term horizon (24 months).
Limitations of this study include general issues related to the use of event studies, such as the selection of event window and event period (Lamdin 2001). MiFID II was published, debated, transposed into national legislation and ultimately implemented in the European Union countries. The event window could theoretically encompass all this entire timeframe, given the fact that market participants were informed about MiFID II obligations prior to the moment of actual enforcement of the regulation. However, we assume that the market did not adapt to the structural changes in regulation before it was necessary. On the other hand, some legal obligations stipulated in MiFID I strengthened with the MiFID II/MiFIR, such as in case of transaction reporting. A future study should consider the impact of both MiFID regulations on the volatility of the same stock exchanges. Moreover, the realized volatility could be impacted by other control factors that were not considered in this analysis (such as bid-ask spread). Structural break tests and more parameter stability tests could also be employed in order to test the robustness of the model. Directions for future research include also extending our research to more European stock market indexes (from both developed and emerging stock markets) or using other methodologies (such as the DID technique) and comparing the empirical results.
Funding
This research received no external funding.
Institutional Review Board Statement
Not applicable.
Informed Consent Statement
Not applicable.
Data Availability Statement
Data are available in a publicly accessible repository. The data presented in this study are openly available in Mendeley Data at http://0-dx-doi-org.brum.beds.ac.uk/10.17632/6nstrjxjvv.1 (accessed on 25 June 2021).
Acknowledgments
I thank Laura Raisa Milos for using the software, validating the data and completing data visualization.
Conflicts of Interest
The author declares no conflict of interest.
Appendix A

Table A1.
Augmented Dickey–Fuller tests for a 2-year horizon.
| BET | CAC40 | DAX | FTSE100 | PX | WIG20 | |
|---|---|---|---|---|---|---|
| −4.4428 *** | −4.443 *** | −4.0937 *** | −4.109 *** | −3.5605 ** | −1.3538 | |
| (0.0019) | (0.0019) | (0.0064) | (0.0061) | (0.0333) | (0.874) | |
| −2.8729 | −2.4511 | −1.8789 | −2.4979 | −2.2412 | −0.9305 | |
| (0.1715) | (0.3528) | (0.6655) | (0.329) | (0.4667) | (0.9528) | |
| −6.8858 *** | −8.2455 *** | −8.0313 *** | −7.4196 *** | −10.8376 *** | −6.8573 *** | |
| (0.000) | (0.000) | (0.000) | (0.000) | (0.000) | (0.000) | |
| −9.6168 *** | −8.335 *** | −8.6793 *** | −9.8804 *** | −6.374 *** | −7.4217 *** | |
| (0.000) | (0.000) | (0.000) | (0.000) | (0.000) | (0.000) |
The augmented Dickey–Fuller test under the null hypothesis that a unit root is present in the sample window. The value between brackets is equal to the p-value. ***, ** denote statistical significance at a 1% and 5% level, respectively. Except for log(Price), we reject the null hypothesis and conclude that these series are stationary. Hence, we will use first difference of log(Price) in the empirical models.
References
- Ackert, Lucy F., Bryan K. Church, and Narayanan Jayaraman. 2005. Circuit breakers with uncertainty about the presence of informed agents: I know what you know…I think. Financial Markets, Institutions & Instruments 14: 135–68. [Google Scholar]
- Aghanya, Daniel, Vineet Agarwal, and Sunil Poshakwale. 2020. Market in financial instruments directive (MiFID), stock price informativeness and liquidity. Journal of Banking and Finance 113: 105730. [Google Scholar] [CrossRef]
- Andersen, Torben G. 1996. Return volatility and trading volume: An information flow of stochastic volatility. The Journal of Finance 51: 169–204. [Google Scholar] [CrossRef]
- Anselmi, Giulio, and Giovanni Petrella. 2020. Regulation and Stock Market Quality: The Impact of MiFID II on Liquidity and Efficiency on European Stocks. Working Paper. Available online: https://www.efmaefm.org/0EFMAMEETINGS/EFMA%20ANNUAL%20MEETINGS/2020-Dublin/papers/EFMA%202020_stage-1301_question-Full%20Paper_id-428.pdf (accessed on 25 June 2021).
- Anselmi, Giulio, and Giovanni Petrella. 2021. Regulation and stock market quality: The impact of MiFID II provision on research unbundling. International Review of Financial Analysis 76: 101788. [Google Scholar] [CrossRef]
- Anshuman, Ravi V. 2003. Regulatory measures to curb stock price volatility. Money, Banking and Finance 38: 677–79. [Google Scholar]
- Bloomfield, Robert, and Maureen O’Hara. 1999. Market transparency: Who wins and who loses? The Review of Financial Studies 12: 5–35. [Google Scholar] [CrossRef]
- Boehmer, Ekkehart, Gideon Sarr, and Lei Yu. 2005. Lifting the veil: An analysis of pre-trade transparency at the NYSE. The Journal of Finance 60: 783–815. [Google Scholar] [CrossRef] [Green Version]
- Bollerslev, Tim, Julia Litvinova, and George Tauchen. 2006. Leverage and volatility feedback effects in high-frequency data. Journal of Financial Econometrics 4: 353–84. [Google Scholar] [CrossRef] [Green Version]
- Brogaard, Jonathan, and Corey Garriott. 2019. High-frequency trading competition. Journal of Financial and Quantitative Analysis 54: 1469–97. [Google Scholar] [CrossRef] [Green Version]
- Buss, Adrian, Bernard Dumas, Raman Uppal, and Grigory Vilkov. 2013. Comparing Different Regulatory Measures to Control Stock Market Volatility: A General Equilibrium Analysis. Available online: https://www.erim.eur.nl/fileadmin/erim_content/documents/Uppal_May7.pdf (accessed on 12 December 2020).
- Chiang, Thomas C., Zhuo Qiao, and Wing-Keung Wong. 2010. New evidence on the relation between return volatility and trading volume. Journal of Forecasting 29: 502–15. [Google Scholar]
- Chlistalla, Michael. 2011. High-Frequency Trading. Better Than Its Reputation? Deutsche Bank Research. Available online: https://secure.fia.org/ptg-downloads/dbonhft2-11.pdf (accessed on 12 December 2020).
- Chordia, Tarun, Richard Roll, and Avanidhar Subrahmanyam. 2002. Order imbalance, liquidity and market returns. Journal of Financial Economics 65: 3–28. [Google Scholar] [CrossRef] [Green Version]
- Copeland, Thomas E. 1976. A model of asset trading under the assumption of sequential information arrival. Journal of Finance 31: 1149–68. [Google Scholar] [CrossRef]
- Corrado, Charles, and Cameron Truong. 2007. Forecasting stock index volatility: Comparing implied volatility and the intraday high–low price range. Journal of Financial Research 30: 201–15. [Google Scholar] [CrossRef]
- Darrat, Ali F., Shafiqur Rahman, and M. Maosen Zhang. 2003. Intraday trading volume and return volatility of the DJIA stocks: A note. Journal of Banking and Finance 27: 2035–43. [Google Scholar] [CrossRef]
- Dufour, Jean-Marie, René Garcia, and Abderrahim Taamouti. 2012. Measuring High-Frequency Causality Between Returns, Realised Volatility, and Implied Volatility. Journal of Financial Econometrics 10: 124–63. [Google Scholar] [CrossRef]
- Dumitrescu, Ariadna. 2010. Liquidity and Optimal Market Transparency. European Financial Management 16: 599–623. [Google Scholar] [CrossRef]
- ESMA. 2014. High-Frequency Trading Activity in EU Equity Markets. Economic Report, No.1. Available online: https://www.esma.europa.eu/sites/default/files/library/2015/11/esma20141_-_hft_activity_in_eu_equity_markets.pdf (accessed on 12 December 2020).
- ESMA. 2020. Market Impacts of Circuit Breakers—Evidence from EU Trading Venues, Working Paper, No.1. Available online: https://www.esma.europa.eu/sites/default/files/library/esmawp-2020-1_market_impacts_of_circuit_breakers.pdf (accessed on 12 December 2020).
- Fama, Eugene F. 1991. Efficient capital markets: II. The Journal of Finance 46: 1575–617. [Google Scholar] [CrossRef]
- Fang, Bingxu, Ole Kristian Hope, Zhongwei Huang, and Rucsandra Moldovan. 2020. The Effects of MiFID II on Sell- Side Analysts, Buy-Side Analysts, and Firms. Review of Accounting Studies 25: 855–902. [Google Scholar] [CrossRef]
- Hagströmer, Björn, and Lars Norden. 2013. The diversity of high-frequency traders. Journal of Financial Markets 16: 741–70. [Google Scholar] [CrossRef]
- Harris, Lawrence. 1987. Transaction data test of the mixture of distributions hypothesis. Journal of Financial and Quantitative Analysis 22: 127–41. [Google Scholar] [CrossRef]
- Hasbrouck, Joel, and Gideon Saar. 2013. Low latency trading. Journal of Financial Markets 16: 646–79. [Google Scholar] [CrossRef]
- Hassan, Gazi M., and Eliza Wu. 2015. Sovereign credit ratings, growth volatility and the global financial crisis. Applied Economics 47: 1–16. [Google Scholar] [CrossRef] [Green Version]
- Hendershot, Terrence, Charles M. Jones, and Albert J. Menkveld. 2011. Does algorithmic trading improve liquidity? The Journal of Finance LXVI: 1–33. [Google Scholar] [CrossRef] [Green Version]
- Hibbert, Ann M., Robert T. Daigler, and Brice Dupoyet. 2008. A behavioural explanation for the negative asymmetric return-volatility relation. Journal of Banking and Finance 32: 2254–66. [Google Scholar] [CrossRef]
- Jennings, Robert H., Laura T. Starks, and John C. Fellingham. 1981. An equilibrium model of asset trading with sequential information arrival. Journal of Finance 36: 143–61. [Google Scholar] [CrossRef]
- Lamdin, Douglas J. 2001. Implementing and interpreting event studies of regulatory changes. Journal of Economics and Business 53: 171–83. [Google Scholar] [CrossRef]
- Lee, Jen-Sin, Kuan-Ling Lai, and Yu-Ko Huang. 2015. Information transparency and idiosyncratic risk. Applied Economics Letters 22: 934–37. [Google Scholar] [CrossRef]
- Madhavan, Ananth, David Porter, and Daniel Weaver. 2005. Should securities markets be transparent? Journal of Financial Markets 8: 265–87. [Google Scholar] [CrossRef]
- Madhavan, Ananth. 1996. Security prices and market transparency. Journal of Financial Intermediation 5: 255–83. [Google Scholar] [CrossRef]
- Meijers, Julian. 2018. The Effect of the MiFID I and MiFID II/MiFIR Transparency Requirements on the Volatility: Evidence from European Equity Markets. Available online: https://scripties.uba.uva.nl (accessed on 12 December 2020).
- Oxera. 2019. The Design of Equity Trading Markets in Europe. An Economic Analysis of Price Formation and Market Data Services, Prepared for Federation of European Securities Exchanges. Available online: https://www.oxera.com/wp-content/uploads/2019/03/design-of-equity-trading-markets-1.pdf (accessed on 12 December 2020).
- Pástor, Ľuboš, and Robert F. Stambaugh. 2003. Liquidity risk and expected stock returns. Journal of Political Economy 111: 642–85. [Google Scholar] [CrossRef] [Green Version]
- Utkilen, Henriette, and Synne Wakeford-Wesmann. 2019. Liquidity Following MiFID II. Estimating the Effect of Research Unbundling on Norwegian Small- and Mid-Cap Stocks. Master’s thesis, Norwegian School of Economics, Bergen, Norway. Available online: https://openaccess.nhh.no/nhh-xmlui/bitstream/handle/11250/2609729/masterthesis.PDF?sequence=1&isAllowed=y (accessed on 12 December 2020).
| 1 | The “sequential information” hypothesis e.g., Copeland (1976), Jennings et al. (1981) assumes that not all traders receive the information simultaneously, but rather sequentially and randomly, revising their expectations accordingly, with a new equilibrium being reestablished when all fully react to new information. |
Figure 1.
Estimated coefficients for the MiFID II variable (for a confidence interval of 95%).

Table 1.
Stock market indexes and their composition.
| Stock Market Index | Number of Companies Included in the Stock Market Index |
|---|---|
| BET | 17 most traded companies on the Bucharest Stock Exchange (Romania) |
| WIG-20 | 20 most traded companies on the Warsaw Stock Exchange (Poland) |
| PX | 12 most traded companies on the Prague Stock Exchange (Czech Republic) |
| FTSE100 | 100 largest companies traded on the London Stock Exchange (UK) |
| DAX30 | 30 largest companies traded on Deutsche Börse (Germany) |
| CAC40 | 40 largest companies traded on Bourse de Paris (France) |
Table 2.
Date of entering into force of MiFID II directive.
| Country | National Regulation That Transposes MiFID II Directive | Date of Enforcement |
|---|---|---|
| Romania | Law no.126/2018 regarding financial instruments market | 6 July 2018 |
| Poland | Act of 21 March 2018, amending the Financial Instruments Trading Act from 29 July 2005 | 21 April 2018 |
| Czech Republic | Act no. 204/2017 Coll. from 14th July 2017, for amending Act no. 256/2004 Coll. Capital Market Undertakings Act | 3 January 2018 |
| UK | Financial Services and Markets Act 2000 (Regulated Activities) (Amendment) Order 2017 Financial Services and Markets Act 2000 (Markets in Financial Instruments) Regulations 2017 Data Reporting Services Regulations 2017 | 3 January 2018 |
| Germany | Second Financial Markets Amendment Act (Zweites Finanzmarktnovellierungsgesetz—2nd FiMaNoG, from 24 June 2017 | 3 January 2018 |
| France | Ordinance no. 827 of 23 June 2016 (Ordonnance n° 2016-827 du 23 June 2016 relative aux marchés d’instruments financiers) the Monetary and Financial Code (Code monétaire et financier, CMF) General Regulation of the Financial Markets Authority (Règlement général de l’Autorité des marchés financiers, RGAMF) | 3 January 2018 |
Table 3.
Results of the econometric study in the case of the Romanian stock market.
| Variables | BET-3 Months | BET-6 Months | BET-12 Months | BET-18 Months | BET-24 Months |
|---|---|---|---|---|---|
| Post MIFID-II | −0.210 ** | −0.226 *** | −0.0620 | −0.0743 | 0.0347 |
| (0.0984) | (0.0670) | (0.120) | (0.0953) | (0.0779) | |
| High-Low Spread | 0.000696 | 0.000927 *** | 0.000932 ** | 0.00138 *** | 0.00156 *** |
| (0.000537) | (0.000270) | (0.000377) | (0.000315) | (0.000288) | |
| MIFID II * Spread | 0.000247 | 0.00260 *** | 0.00372 *** | 0.00321 ** | 0.00321 *** |
| (0.000714) | (0.000584) | (0.00131) | (0.00126) | (0.000756) | |
| Log(Trade Volume) | −0.0455 * | −0.0424 ** | 0.00902 | 0.0155 | 0.0296 |
| (0.0239) | (0.0214) | (0.0321) | (0.0234) | (0.0245) | |
| Log(Price Index) | 1.960 | 4.750 * | 5.739 | 4.037 | 8.975 *** |
| (1.815) | (2.758) | (3.876) | (3.530) | (2.810) | |
| Constant | 1.505 *** | 1.393 *** | 0.498 | 0.310 | 0.0460 |
| (0.411) | (0.360) | (0.523) | (0.382) | (0.395) | |
| 0.4158 | 0.3666 | 0.2956 | 0.2805 | 0.3858 | |
| Observations | 124 | 246 | 491 | 738 | 981 |
Note: Models are estimated using Newey–West standard errors, which account for heteroskedasticity and autocorellation. Standard errors in parentheses. The coefficients are estimated by OLS regression. *** p < 0.01, ** p < 0.05, * p < 0.1.
Table 4.
Results of the regressions for the other investigated stock markets.
| 3 months | |||||
| (1) | (2) | (3) | (4) | (5) | |
| VARIABLES | CAC40_3 | DAX_3 | FTSE100_3 | PX_3 | WIG20_3 |
| Post MIFID-II | 0.407 *** | 0.434 *** | 0.117 | 0.109 * | 0.00457 |
| (0.124) | (0.123) | (0.117) | (0.0608) | (0.0753) | |
| High-Low Spread | 0.00329 ** | 0.00186 *** | 0.000516 | 0.00767 *** | 0.00109 |
| (0.00132) | (0.000440) | (0.000540) | (0.00292) | (0.00113) | |
| MIFID II * Spread | −0.000944 | −0.000664 | 0.00198 * | 0.00190 | 0.000449 |
| (0.00167) | (0.000579) | (0.00113) | (0.00537) | (0.00148) | |
| Log(Trade Volume) | −0.0541 | −0.0874 | −0.0917 * | −0.00663 | 0.00234 |
| (0.105) | (0.0831) | (0.0508) | (0.0216) | (0.0326) | |
| Log(Price Index) | 3.176 | 2.739 | 6.266 ** | 0.522 | 1.309 |
| (2.392) | (1.790) | (2.499) | (1.498) | (0.913) | |
| Constant | 1.318 | 1.965 | 2.306 ** | 0.498 | 1.045 * |
| (1.902) | (1.530) | (1.033) | (0.306) | (0.543) | |
| 0.6038 | 0.6340 | 0.4437 | 0.3937 | 0.0354 | |
| Observations | 124 | 123 | 124 | 123 | 125 |
| 6 months | |||||
| (1) | (2) | (3) | (4) | (5) | |
| VARIABLES | CAC40_3 | DAX_3 | FTSE100_3 | PX_3 | WIG20_3 |
| Post MIFID-II | 0.215 ** | 0.327 *** | 0.156 ** | 0.0670 | 0.109 * |
| (0.0994) | (0.0909) | (0.0758) | (0.0411) | (0.0601) | |
| High-Low Spread | 0.00365 *** | 0.00127 *** | 0.00128 *** | 0.00218 | 0.00133 |
| (0.00110) | (0.000358) | (0.000441) | (0.00343) | (0.000940) | |
| MIFID_II * Spread | −0.00144 | −0.000361 | 0.000389 | 0.00323 | 0.000369 |
| (0.00155) | (0.000459) | (0.000691) | (0.00412) | (0.00119) | |
| Log(Trade Volume) | −0.0527 | −0.117 ** | −0.127 *** | −0.00190 | 0.0206 |
| (0.0593) | (0.0469) | (0.0426) | (0.0193) | (0.0236) | |
| Log(Price Index) | 1.996 | 1.318 | 2.093 | −0.408 | 0.548 |
| (1.736) | (1.182) | (1.401) | (0.911) | (0.737) | |
| Constant | 1.389 | 2.648 *** | 3.045 *** | 0.507 * | 0.628 |
| (1.079) | (0.858) | (0.862) | (0.270) | (0.395) | |
| 0.2252 | 0.5116 | 0.3547 | 0.2535 | 0.1914 | |
| Observations | 251 | 248 | 249 | 248 | 248 |
| 12 months | |||||
| (1) | (2) | (3) | (4) | (5) | |
| VARIABLES | CAC40_3 | DAX_3 | FTSE100_3 | PX_3 | WIG20_3 |
| Post MIFID-II | 0.147 ** | 0.241 *** | 0.154 *** | −0.00862 | 0.0488 |
| (0.0722) | (0.0563) | (0.0522) | (0.0297) | (0.0698) | |
| High-Low Spread | 0.00137 | 0.000683 *** | 0.00112 *** | 0.000720 * | 0.00323 *** |
| (0.000946) | (0.000220) | (0.000305) | (0.000392) | (0.000893) | |
| MIFID_II * Spread | 0.000259 | 0.000112 | 0.000569 | 0.00625 *** | 0.00332 ** |
| (0.00110) | (0.000300) | (0.000501) | (0.00237) | (0.00153) | |
| Log(Trade Volume) | 0.116 | −0.0199 | −0.0923 ** | 0.00142 | 0.0512 * |
| (0.0710) | (0.0349) | (0.0357) | (0.0150) | (0.0280) | |
| Log(Price Index) | 2.043 * | 1.641 ** | 2.292 ** | 0.242 | 1.078 |
| (1.146) | (0.830) | (0.930) | (0.778) | (0.770) | |
| Constant | −1.553 | 0.948 | 2.356 *** | 0.474 ** | 0.000794 |
| (1.271) | (0.639) | (0.721) | (0.215) | (0.468) | |
| 0.2075 | 0.4669 | 0.4122 | 0.0799 | 0.2689 | |
| Observations | 504 | 498 | 500 | 445 | 493 |
| 18 months | |||||
| (1) | (2) | (3) | (4) | (5) | |
| VARIABLES | CAC40_3 | DAX_3 | FTSE100_3 | PX_3 | WIG20_3 |
| Post MIFID-II | 0.109 * | 0.183 *** | 0.104 ** | −0.0159 | −0.0622 |
| (0.0636) | (0.0518) | (0.0517) | (0.0307) | (0.0608) | |
| High-Low Spread | 0.00282 *** | 0.00116 *** | 0.00176 *** | 0.00168 | 0.00262 *** |
| (0.00106) | (0.000289) | (0.000369) | (0.00148) | (0.000849) | |
| MIFID_II * Spread | −0.000846 | −0.000257 | −1.05 × 10⁻⁵ | 0.00356 | 0.00404 *** |
| (0.00116) | (0.000327) | (0.000482) | (0.00277) | (0.00141) | |
| Log(Trade Volume) | 0.0623 | −0.0853 ** | −0.0680 | 0.0422 ** | 0.0423 |
| (0.0558) | (0.0383) | (0.0469) | (0.0184) | (0.0285) | |
| Log(Price Index) | 3.193 *** | 2.502 *** | 2.199 *** | 0.0460 | 1.901 *** |
| (1.194) | (0.930) | (0.827) | (0.933) | (0.728) | |
| Constant | −0.530 | 2.196 *** | 1.901 ** | −0.0883 | 0.205 |
| (1.002) | (0.699) | (0.944) | (0.262) | (0.477) | |
| 0.0721 | 0.1593 | 0.1516 | 0.0686 | 0.1358 | |
| Observations | 757 | 748 | 749 | 536 | 737 |
| 24 months | |||||
| (1) | (2) | (3) | (4) | (5) | |
| VARIABLES | CAC40_3 | DAX_3 | FTSE100_3 | PX_3 | WIG20_3 |
| Post MIFID-II | 0.216 *** | 0.200 *** | 0.171 ** | −0.0159 | −0.391 *** |
| (0.0686) | (0.0584) | (0.0716) | (0.0307) | (0.115) | |
| High-Low Spread | 0.00722 *** | 0.00298 *** | 0.00459 *** | 0.00168 | 0.00125 |
| (0.00118) | (0.000375) | (0.000959) | (0.00148) | (0.00136) | |
| MIFID_II * Spread | −0.00562 *** | −0.00207 *** | −0.00286 *** | 0.00356 | 0.0180 *** |
| (0.00126) | (0.000418) | (0.000995) | (0.00277) | (0.00441) | |
| Log(Trade Volume) | 0.227 *** | 0.0277 | −0.0469 | 0.0422 ** | 0.339 *** |
| (0.0662) | (0.0518) | (0.0485) | (0.0184) | (0.129) | |
| Log(Price Index) | 4.443 *** | 3.601 *** | 3.954 *** | 0.0460 | 4.667 ** |
| (1.414) | (1.249) | (1.287) | (0.933) | (2.067) | |
| Constant | −3.612 *** | 0.0789 | 1.399 | −0.0883 | −4.751 ** |
| (1.197) | (0.946) | (0.975) | (0.262) | (2.160) | |
| 0.2384 | 0.1796 | 0.2181 | 0.0686 | 0.3324 | |
| Observations | 1011 | 999 | 1000 | 536 | 984 |
Note: Models are estimated using Newey–West standard errors, which account for heteroskedasticity and autocorellation. Standard errors in parentheses. The coefficients are estimated by OLS regression. *** p < 0.01, ** p < 0.05, * p < 0.1.
Publisher’s Note: MDPI stays neutral with regard to jurisdictional claims in published maps and institutional affiliations. |
© 2021 by the author. Licensee MDPI, Basel, Switzerland. This article is an open access article distributed under the terms and conditions of the Creative Commons Attribution (CC BY) license (https://creativecommons.org/licenses/by/4.0/).
Share and Cite
MDPI and ACS Style
Miloș, M.C. Impact of MiFID II on the Market Volatility—Analysis on Some Developed and Emerging European Stock Markets. Laws 2021, 10, 55. https://0-doi-org.brum.beds.ac.uk/10.3390/laws10030055
AMA Style
Miloș MC. Impact of MiFID II on the Market Volatility—Analysis on Some Developed and Emerging European Stock Markets. Laws. 2021; 10(3):55. https://0-doi-org.brum.beds.ac.uk/10.3390/laws10030055
Chicago/Turabian StyleMiloș, Marius Cristian. 2021. "Impact of MiFID II on the Market Volatility—Analysis on Some Developed and Emerging European Stock Markets" Laws 10, no. 3: 55. https://0-doi-org.brum.beds.ac.uk/10.3390/laws10030055
Note that from the first issue of 2016, this journal uses article numbers instead of page numbers. See further details here.