Seismic Upgrading of a Historical Masonry Bell Tower through an Internal Dissipative Steel Structure


School of Architecture and Design, University of Camerino, 63100 Ascoli, Piceno, Italy
*
Author to whom correspondence should be addressed.
Buildings 2021, 11(1), 24; https://0-doi-org.brum.beds.ac.uk/10.3390/buildings11010024
Submission received: 2 December 2020
/
Revised: 4 January 2021
/
Accepted: 5 January 2021
/
Published: 9 January 2021
(This article belongs to the Special Issue Advanced Methods for Structural Rehabilitation)
Abstract
:Masonry towers are part of a valuable architectural heritage characterizing the landscape of many historical areas. These towers are vulnerable structures that are prone to earthquake damage. Hence, the design of effective seismic upgrading interventions is an important task for preserving such architectural forms for future generations. In view of that, the objective of this study is to contribute a possible addition to the portfolio of available approaches for seismic upgrading of masonry towers. This goal was pursued by exploring an innovative structural solution that does not alter the external appearance of the tower and its static scheme under gravity loads, yet is able to increase its capacity to withstand seismic actions through added damping. Specifically, the proposed solution consists of a steel structure internal to the masonry tower that incorporates fluid viscous dampers. In order to evaluate its potentialities, a real case study was taken as a testbed structure, historic analysis as well as geometric and architectural surveys were undertaken, an initial design for the upgrading was made, and numerical simulations were performed. The obtained results, although preliminary, highlight the potentialities of the proposed structural solution for the seismic upgrading of masonry towers and might open the way to future developments and applications.
1. Introduction
Masonry towers represent a distinctive feature of the numerous urban agglomerations that have developed since the Middle Ages, playing a role that was both practical and symbolic. Today, these emblems of the past are part of our historical and architectural heritage and represent a link to the tradition and culture of our ancestors that needs to be protected and handed down to future generations. Masonry towers are vulnerable structures that are prone to earthquake damage, as we have been unfortunately reminded by recent seismic events, e.g., [1,2,3,4,5,6,7,8,9,10]. Many studies on the structural modeling and analysis of masonry towers can be found in the technical literature, e.g., [11,12,13,14,15,16,17,18,19,20,21,22,23,24,25,26,27,28,29], which testifies to the interest of the structural engineering community in understanding and predicting their seismic behavior. Indeed, vulnerability assessments are crucial to design proper maintenance and retrofit interventions. Such assessments might benefit from the support of in situ structural monitoring, e.g., [30,31,32,33,34], as a tool for model updating and damage identification. As is often the case in cultural heritage, e.g., [14,15,35,36], it is important to adopt a multidisciplinary approach to the subject, which includes competence in architectural history and art, construction materials and chemistry, survey technologies, geology and geotechnics, in addition to seismic and structural engineering. Diverse expertise contributes to defining the most suitable strategies for static and seismic upgrading while preserving the historical values. The review of the seismic interventions in historic masonry towers documented in the technical literature shows a variety of possible solutions such as: the use of strengthening techniques that include local injections, rebuilding and repointing of mortar joints, local or diffused metallic or composite reinforcements, tie rods and confining rings, e.g., [37,38,39,40,41]; the application of vertical external prestressing tendons made of steel, composite or smart materials, e.g., [42,43,44,45]; the adoption of vertical prestressing tendons with added hysteretic dissipative devices at the base [46]; the use of base isolation [47]; and the realization of internal steel structures to bear horizontal loads [48].
The objective of this study is to explore the possibility of an innovative solution that starts from the idea of a steel structure that is internal to the masonry tower as proposed and realized by Jurina [48] and adds to such steel structure dissipative devices. In this way no alteration of the external architectural appearance is required and no modifications of the mechanisms bearing vertical loads are made. In addition, this meets the principle of architectural restoration that requires reversibility of the upgrade.
The idea of exploiting dissipative towers for the seismic upgrading of existing structures with deficient seismic performance is not new in structural engineering, e.g., [49,50,51], and some applications have recently been implemented in reinforced concrete buildings. The retrofit solution proposed in this article exploits fluid viscous dampers (FVDs), a class of dissipative devices widely used for passive seismic protection of both new and existing structures, which can be employed for improving the seismic response of structures by using either external or internal configurations [49,50,52,53,54]. A real case study was considered (a historic masonry bell tower in Italy) and used as a testbed structure to evaluate the potentialities of the proposed approach. After a description of the case study, the finite element models of both the masonry tower and the dissipation system were developed and numerical seismic simulations were performed in order to assess the feasibility of the proposed retrofit strategy. A stochastic set of ground motion time series was used to perform structural nonlinear dynamic (time-history) analyses and subsequent design verifications. The results highlight the suitability of the proposed retrofit strategy, which leads to a significant improvement in the seismic response of the upgraded masonry bell tower under seismic actions.
2. Historical Analysis
The case study considered in this article is the bell tower of the Church of San Zenone (Figure 1) in Fermo, a town in the Marche region (Central Italy) that is characterized by historical stratification dating back to the Roman age including medieval transformations and reconstructions.
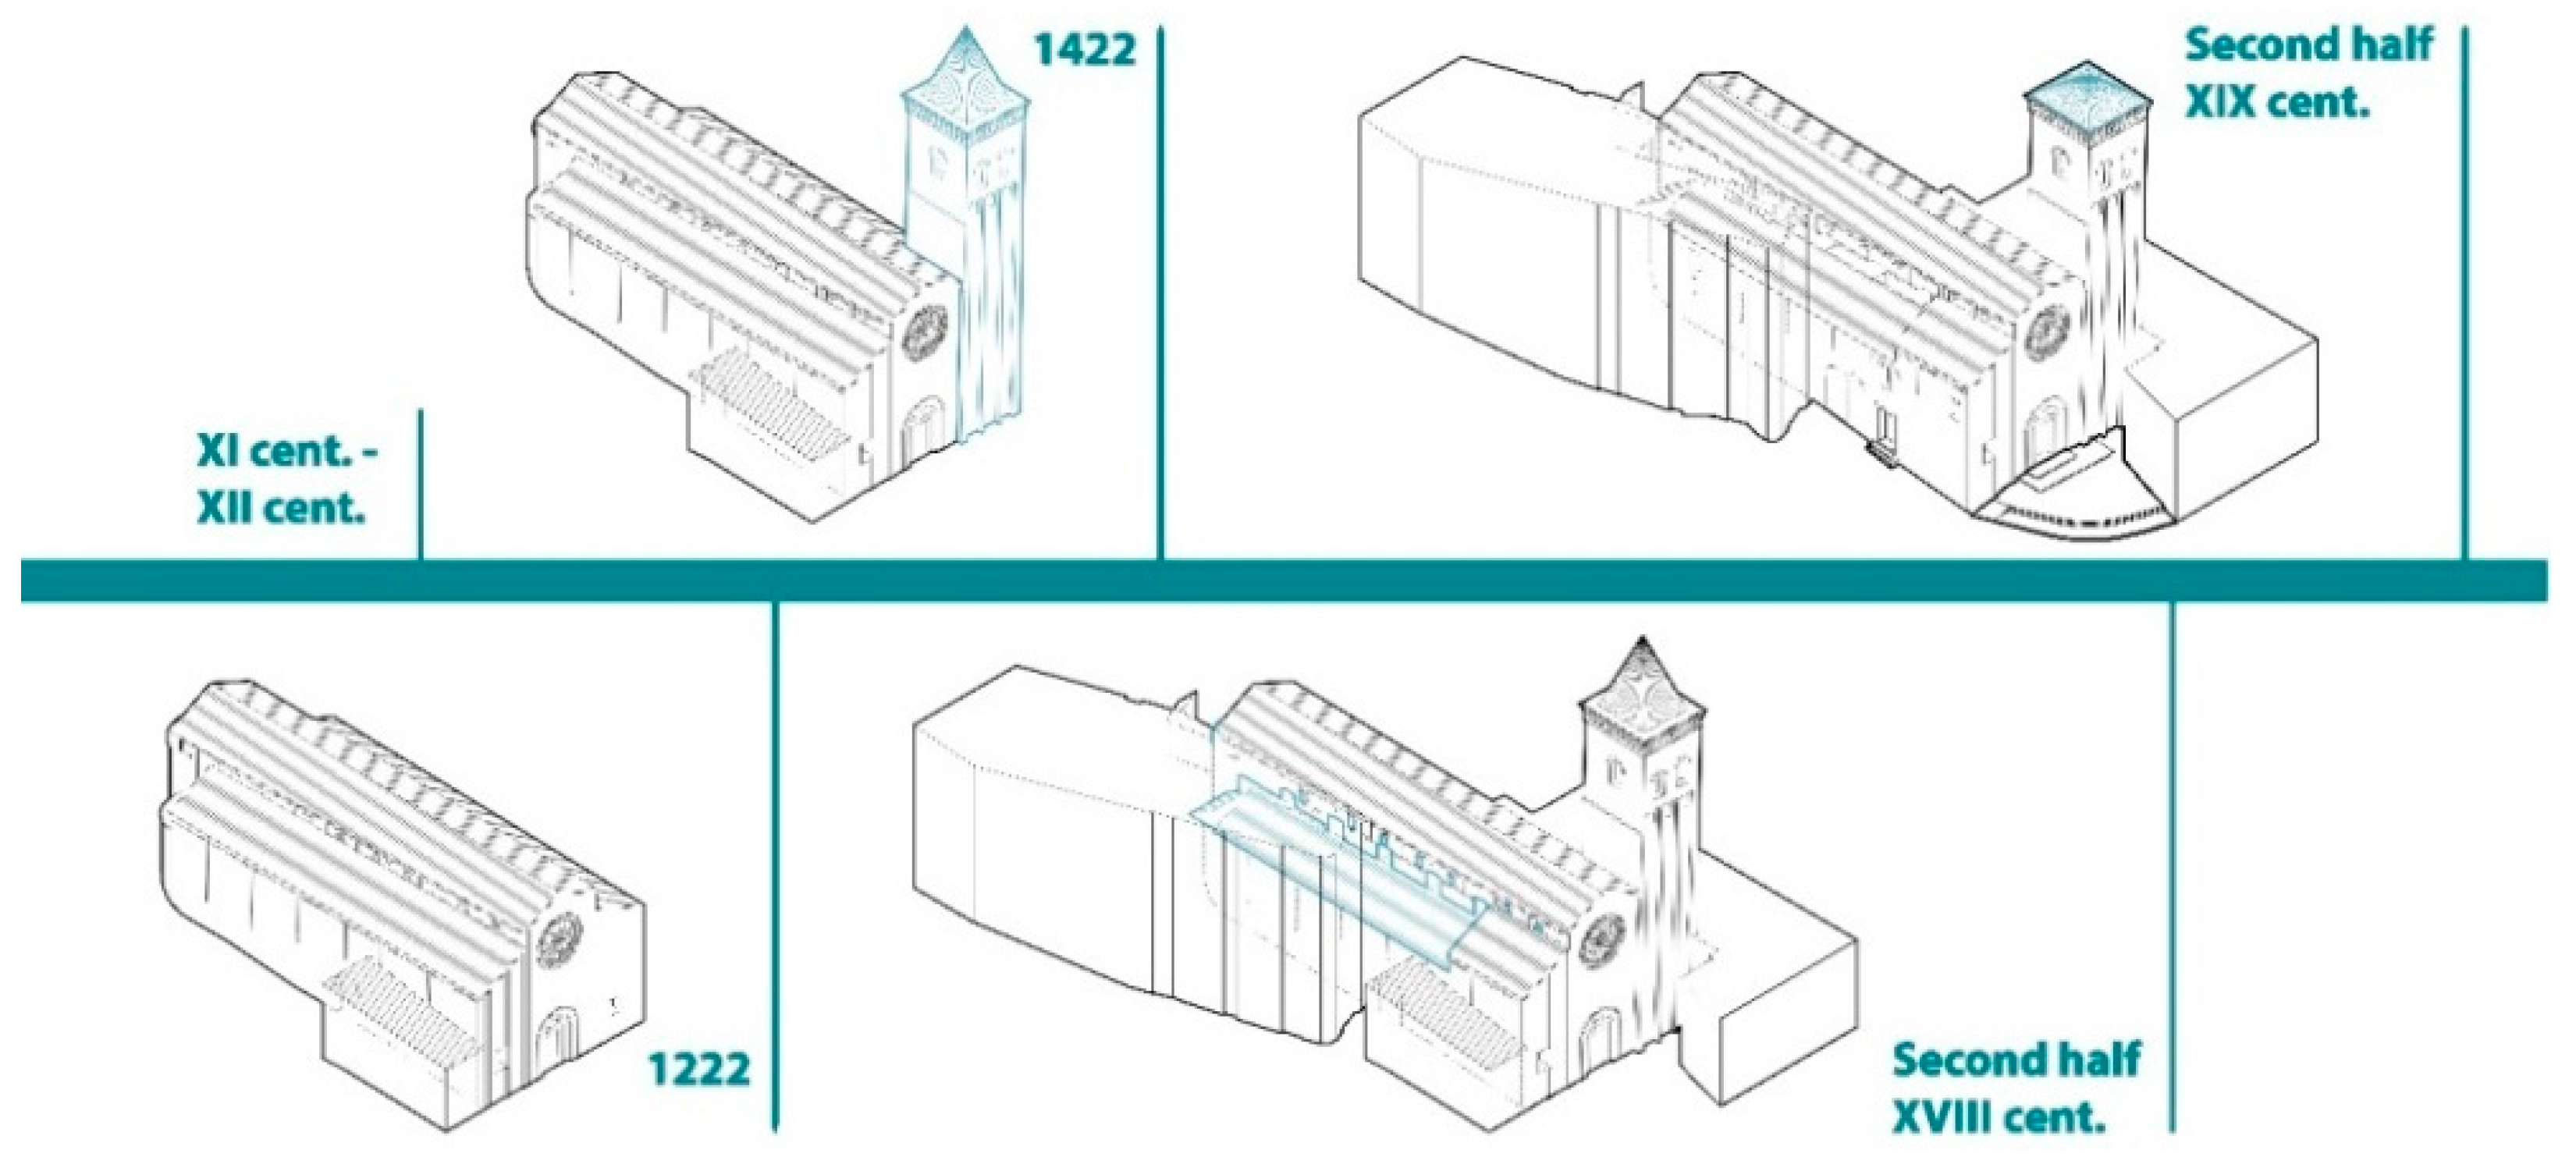
Historical analyses using available bibliographic and archival sources [55,56,57,58,59,60,61] as well as the analysis of the stratigraphy and wall apparatus allowed us to trace the transformations of the asset over the centuries. The main construction phases of the church can be summarized as follows (see also Figure 2):
- (1)
- (XI–XII century)—On the site of the current Church of San Zenone there was a primitive church dedicated to San Leucio, owned by the Sabine abbey of “Santa Maria di Farfa”, an ecclesiastical body.
- (2)
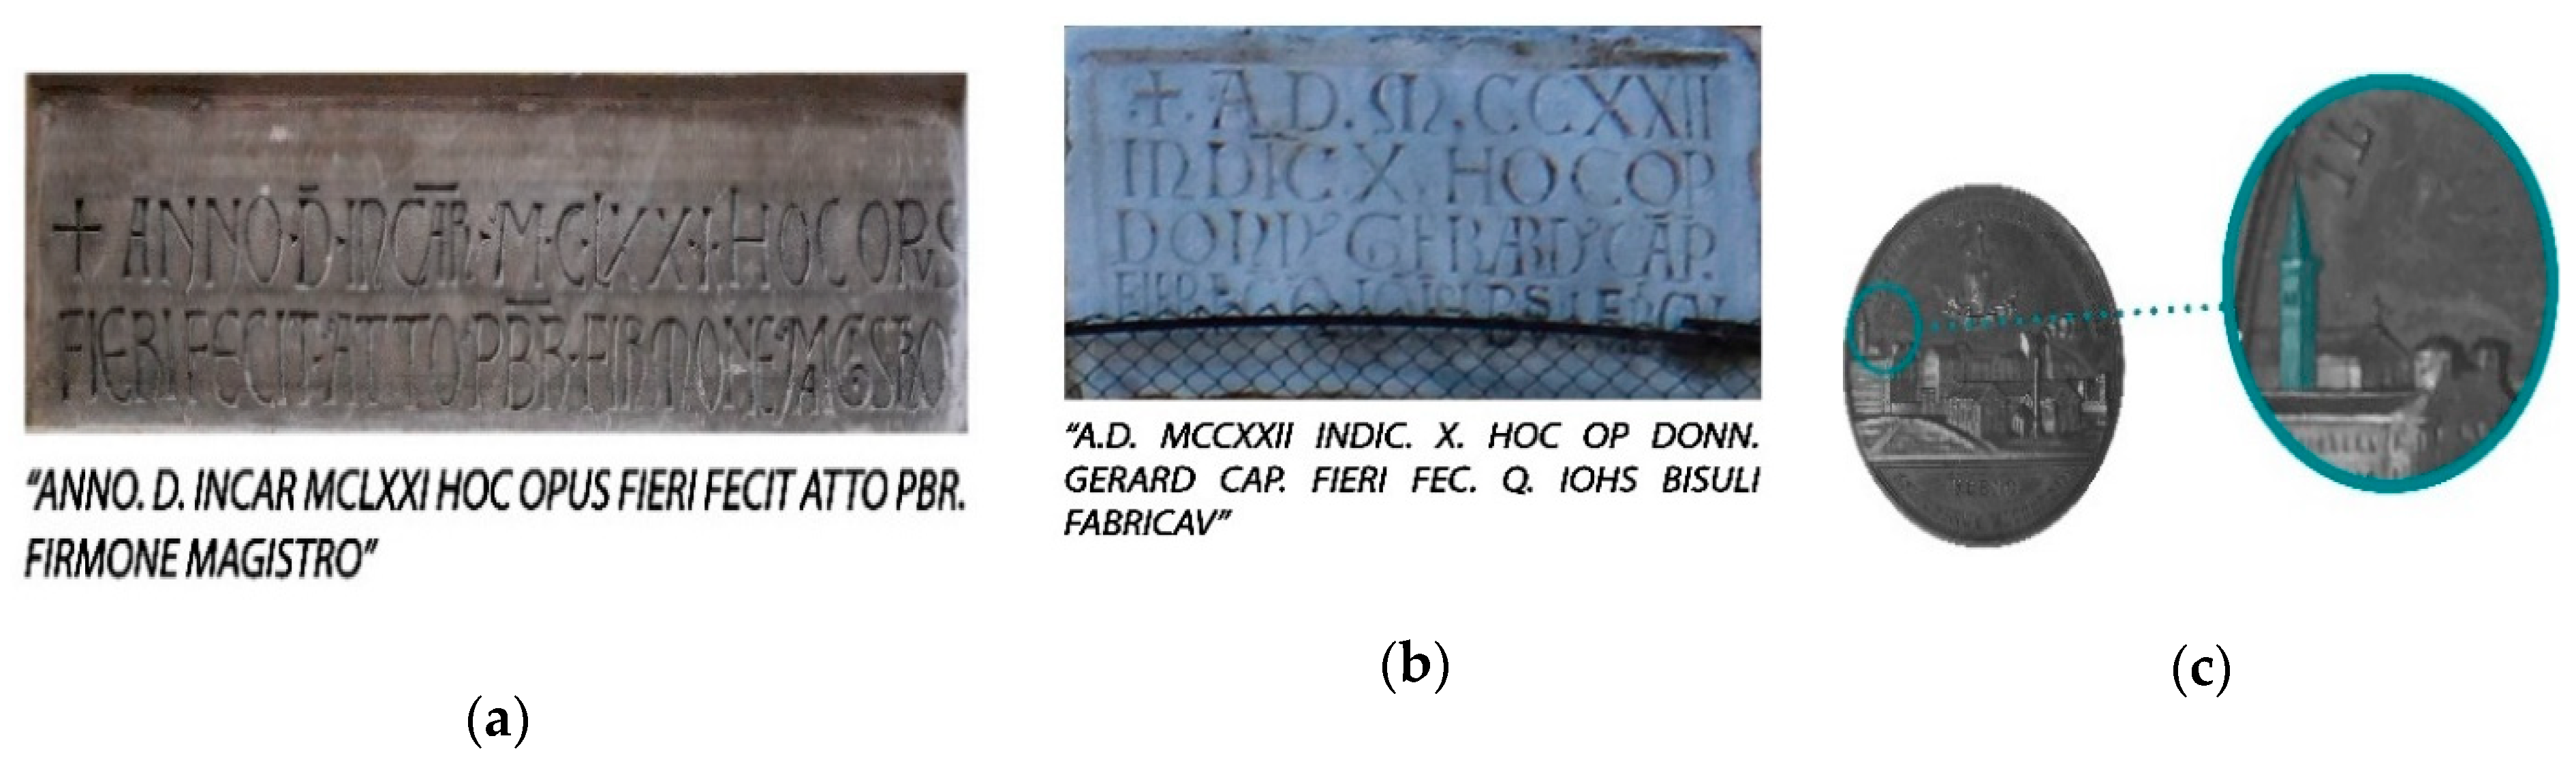
- (1171)—The in-office bishop demolished the church and the construction of the Church of San Zenone began, as attested by a walled inscription inside the church (Figure 3a). The main entrance portal was realized with features that can still be appreciated today.
- (3)
- (1222)—Refurbishment of the construction, as attested by the inscription placed above the rose window (Figure 3b); the church was given a new configuration with three naves, each ending with a semicircular apse. New single lancet windows were made in the clerestory, to provide light inside, as well as a large rose window made of white stone.
- (4)
- (1422)—Construction of a bell tower, located to the right of the main facade. The bell tower is square in plan and was built using brick masonry, punctuated by half pilaster, small arches and the single lancet windows of the bell cell. The cuspidate roof (as depicted in a celebratory coin in Figure 3c) was damaged because it was repeatedly struck by lightning and thus it was rebuilt between 1624 and 1634.
- (5)
- (Second half of the 18th century)—The church was modernized according to the design of the architect Pietro Augustoni, who maintained the three-nave structure, the main facade and the tower, making a neoclassical modification to the interior. The internal works also involved modifications to the outer part where the pitched roof of the side naves was lowered to make way for the larger windows, which replaced the original single lancet windows.
- (6)
- (Second half of the 19th century)—The pinnacle of the bell tower collapsed and was replaced with a simple hip roof.
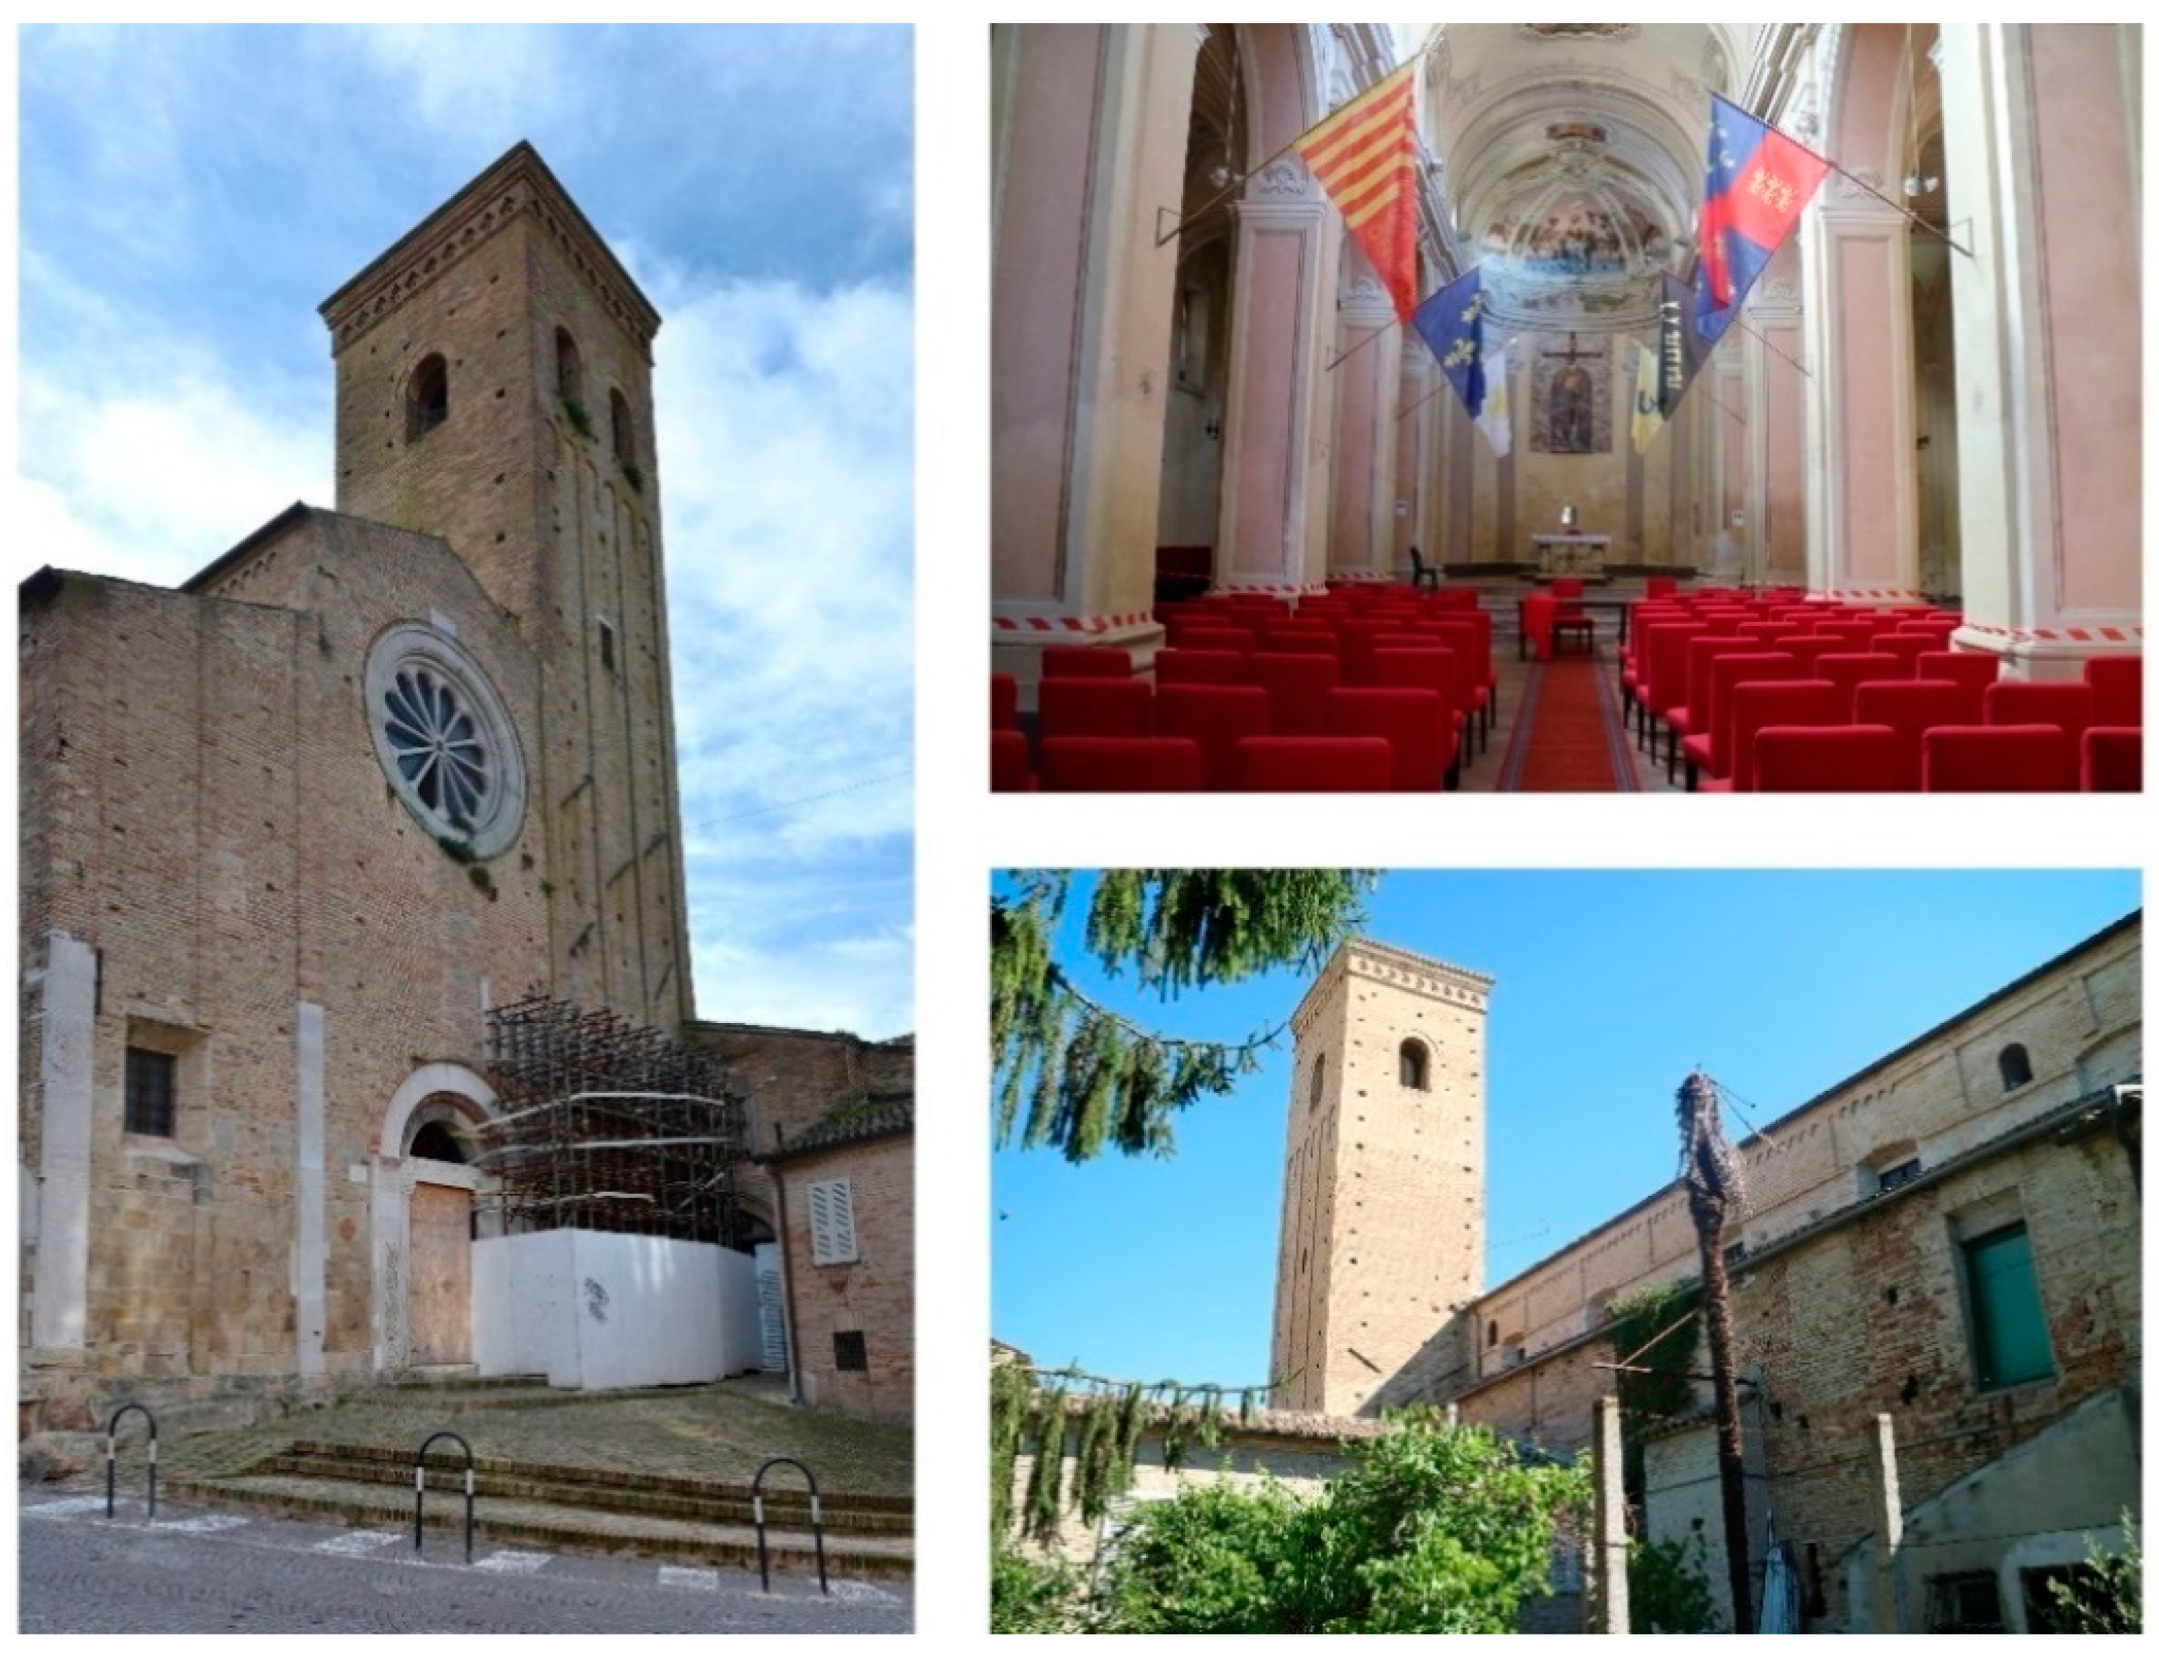
In 2012, the Church was reopened for worship after 35 years and following restoration works, and became the official seat of the Order of the Knights of Malta. Following a number of seismic events in Central Italy on 30 October 2016, the Church suffered substantial damage, which mainly affected the bell tower. Provisional measures were taken to secure the bell tower from the risk of collapse (see left-hand-side picture in Figure 1).
2.1. Methodology for the Geometric and Architectural Survey
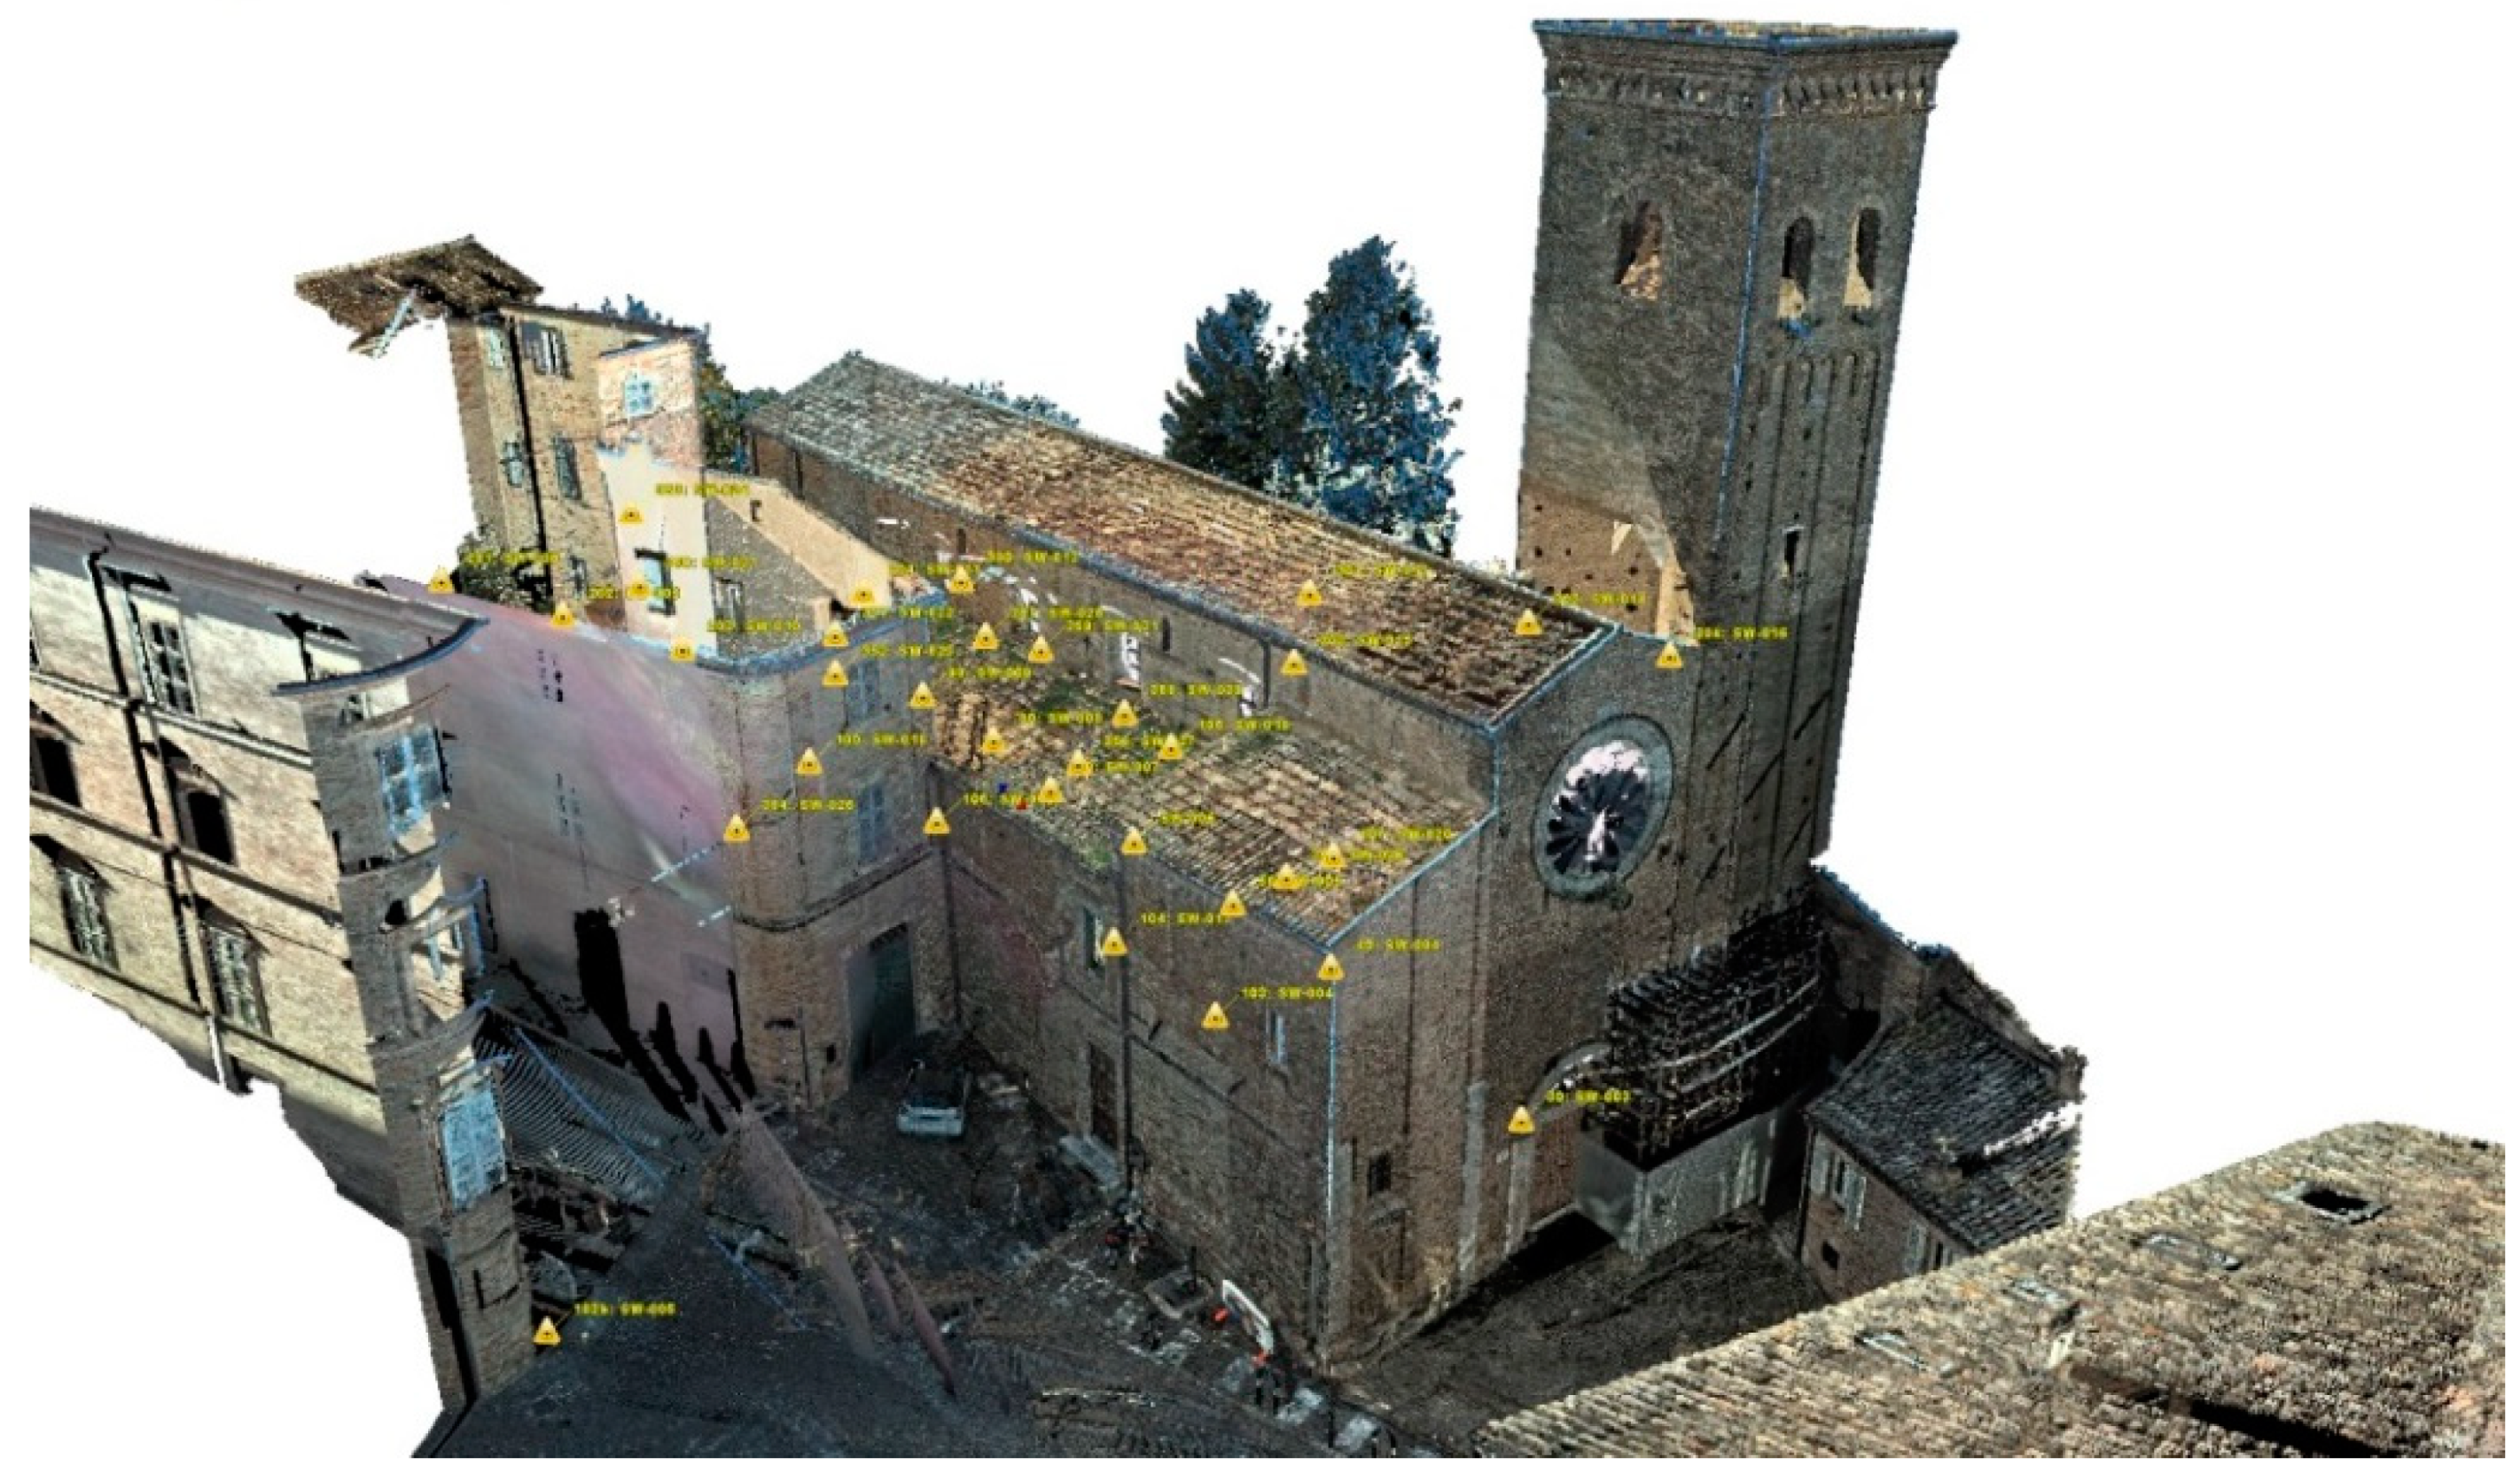
The geometric survey was carried out by high definition surveying (HDS) methodology using the Leica ScanStation C10 terrestrial laser scanner, whose performance has an accuracy of 4 to 6 mm (the point cloud thus obtained consists of 36 scans and is of medium density). These data were cross-referenced and georeferenced with the topographic base obtained by total station. The cloud of the points obtained (Figure 4) made possible the geometric and architectural drawings of the architectural asset, both for the exterior and for the interior, and allowed the highlighting of the material and decorative components. In this way, we obtained an in-depth and accurate rendition of the geometry of the current state of the entire complex (bell tower included).
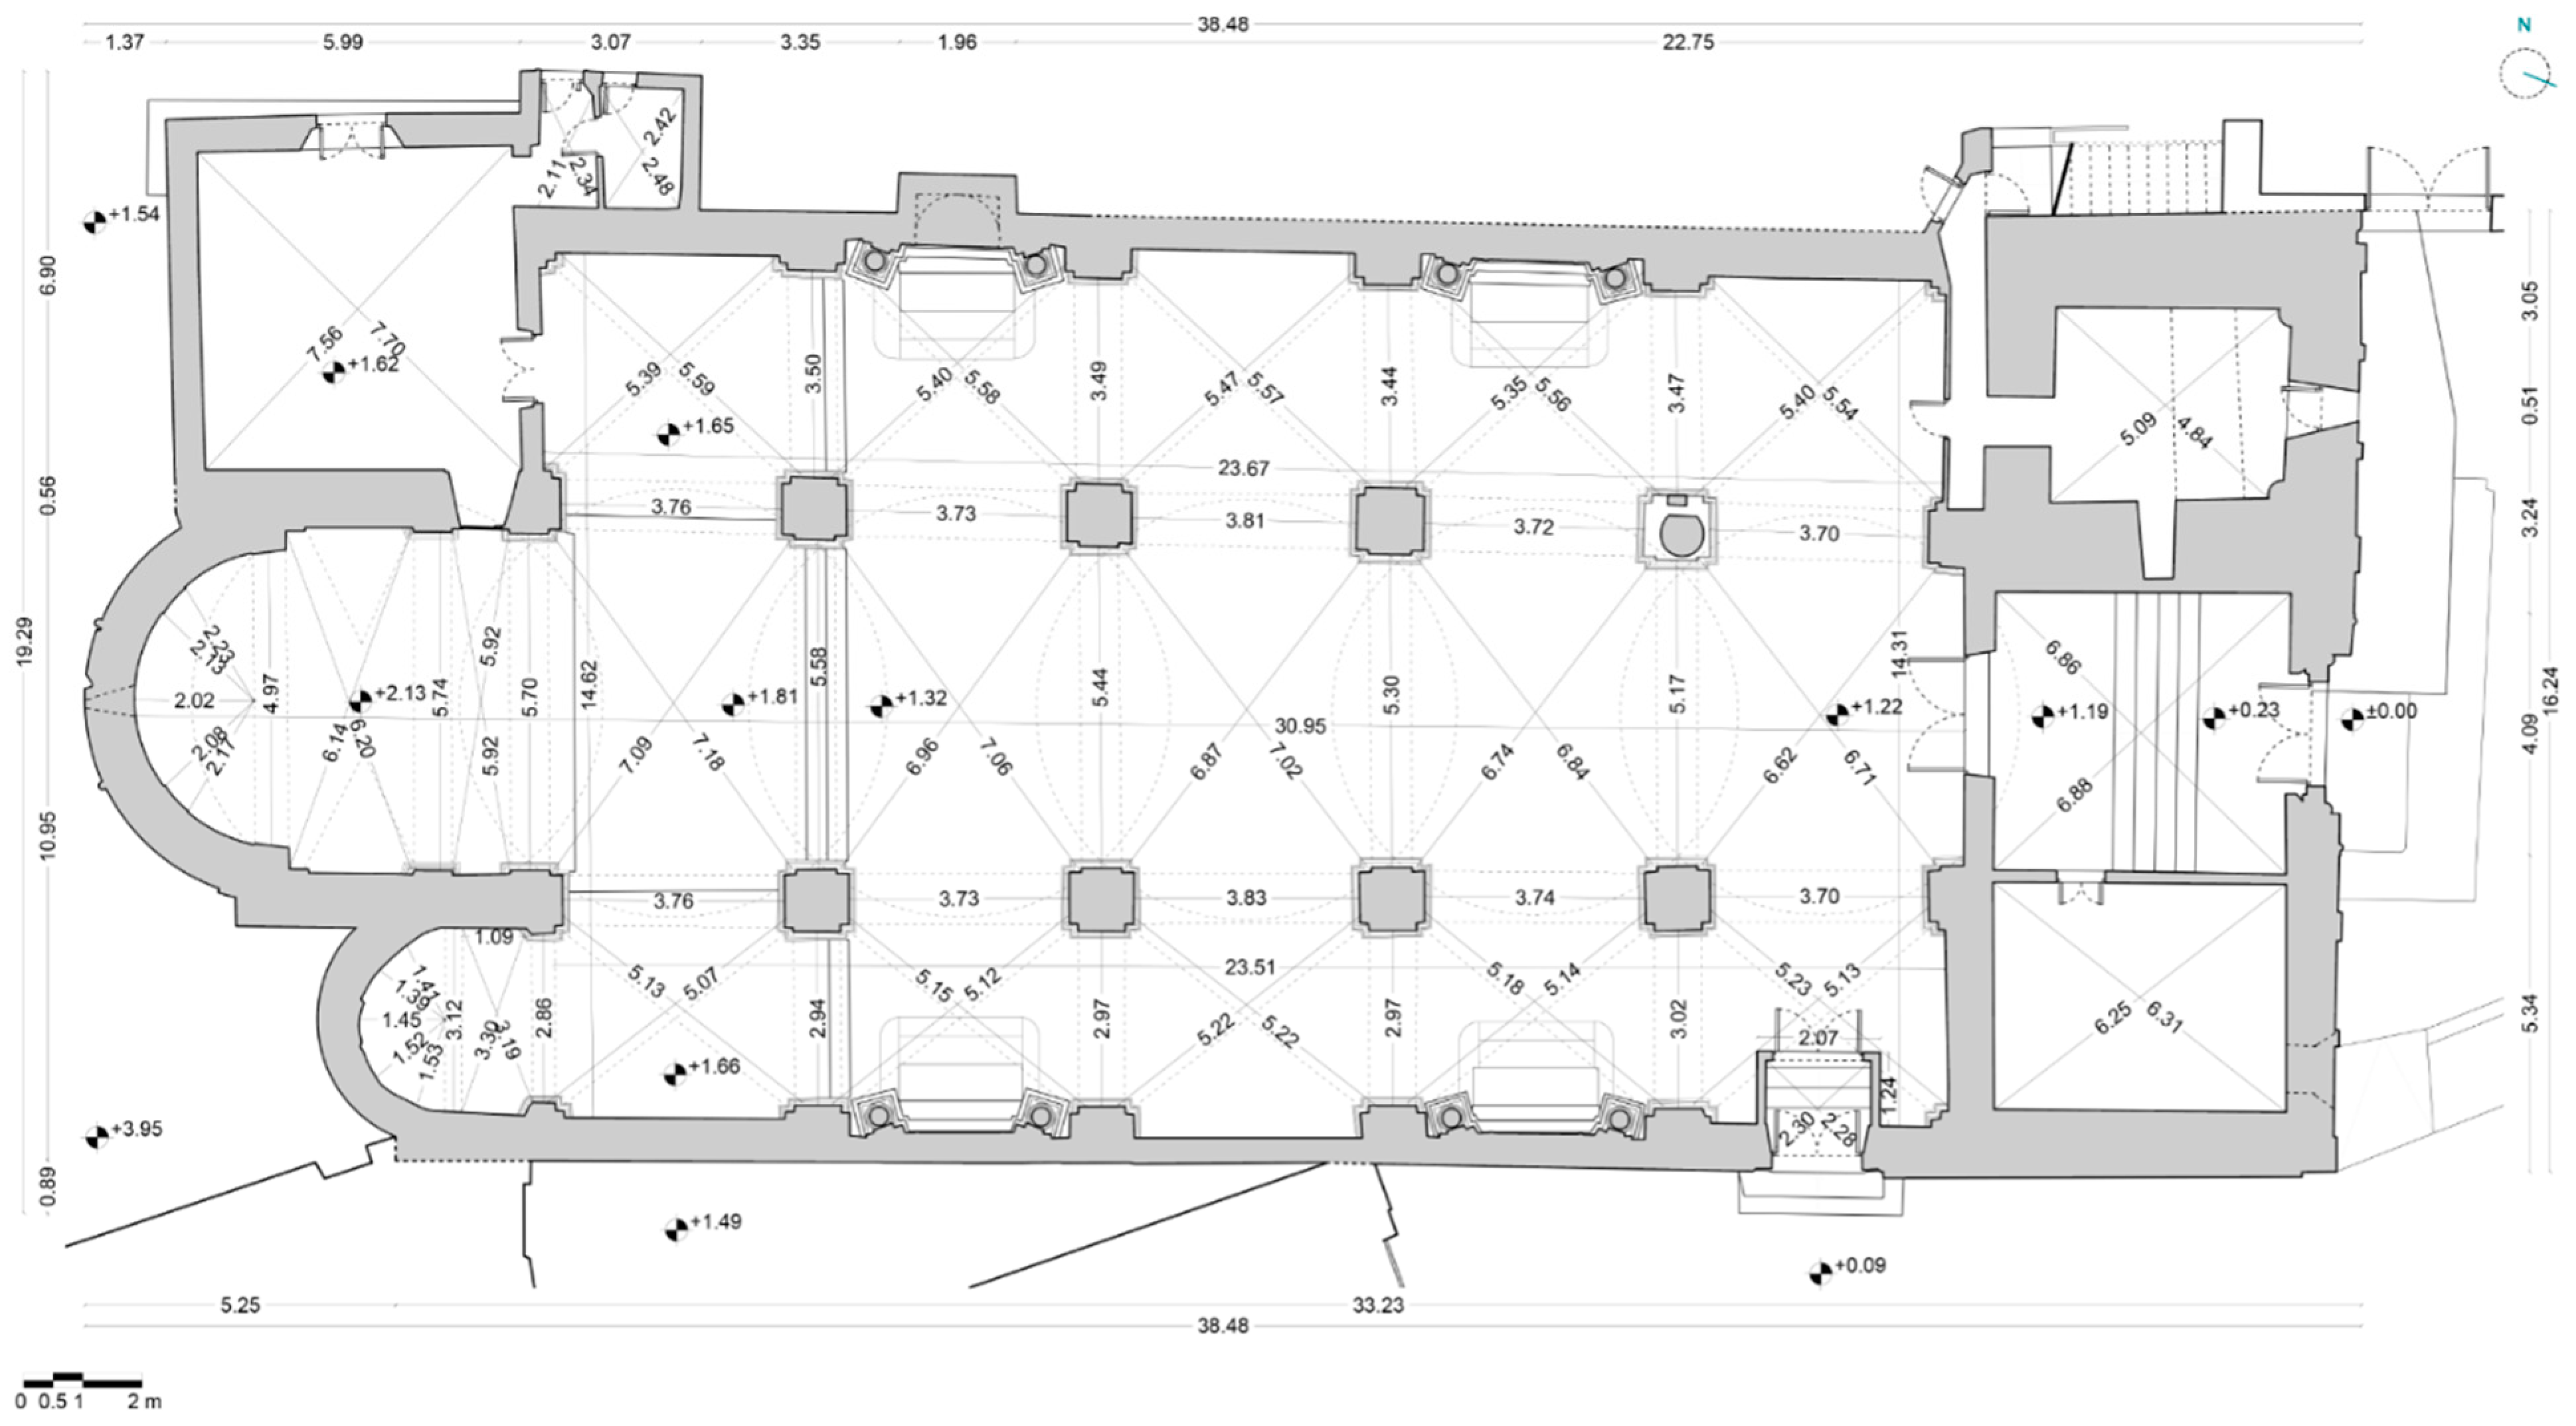
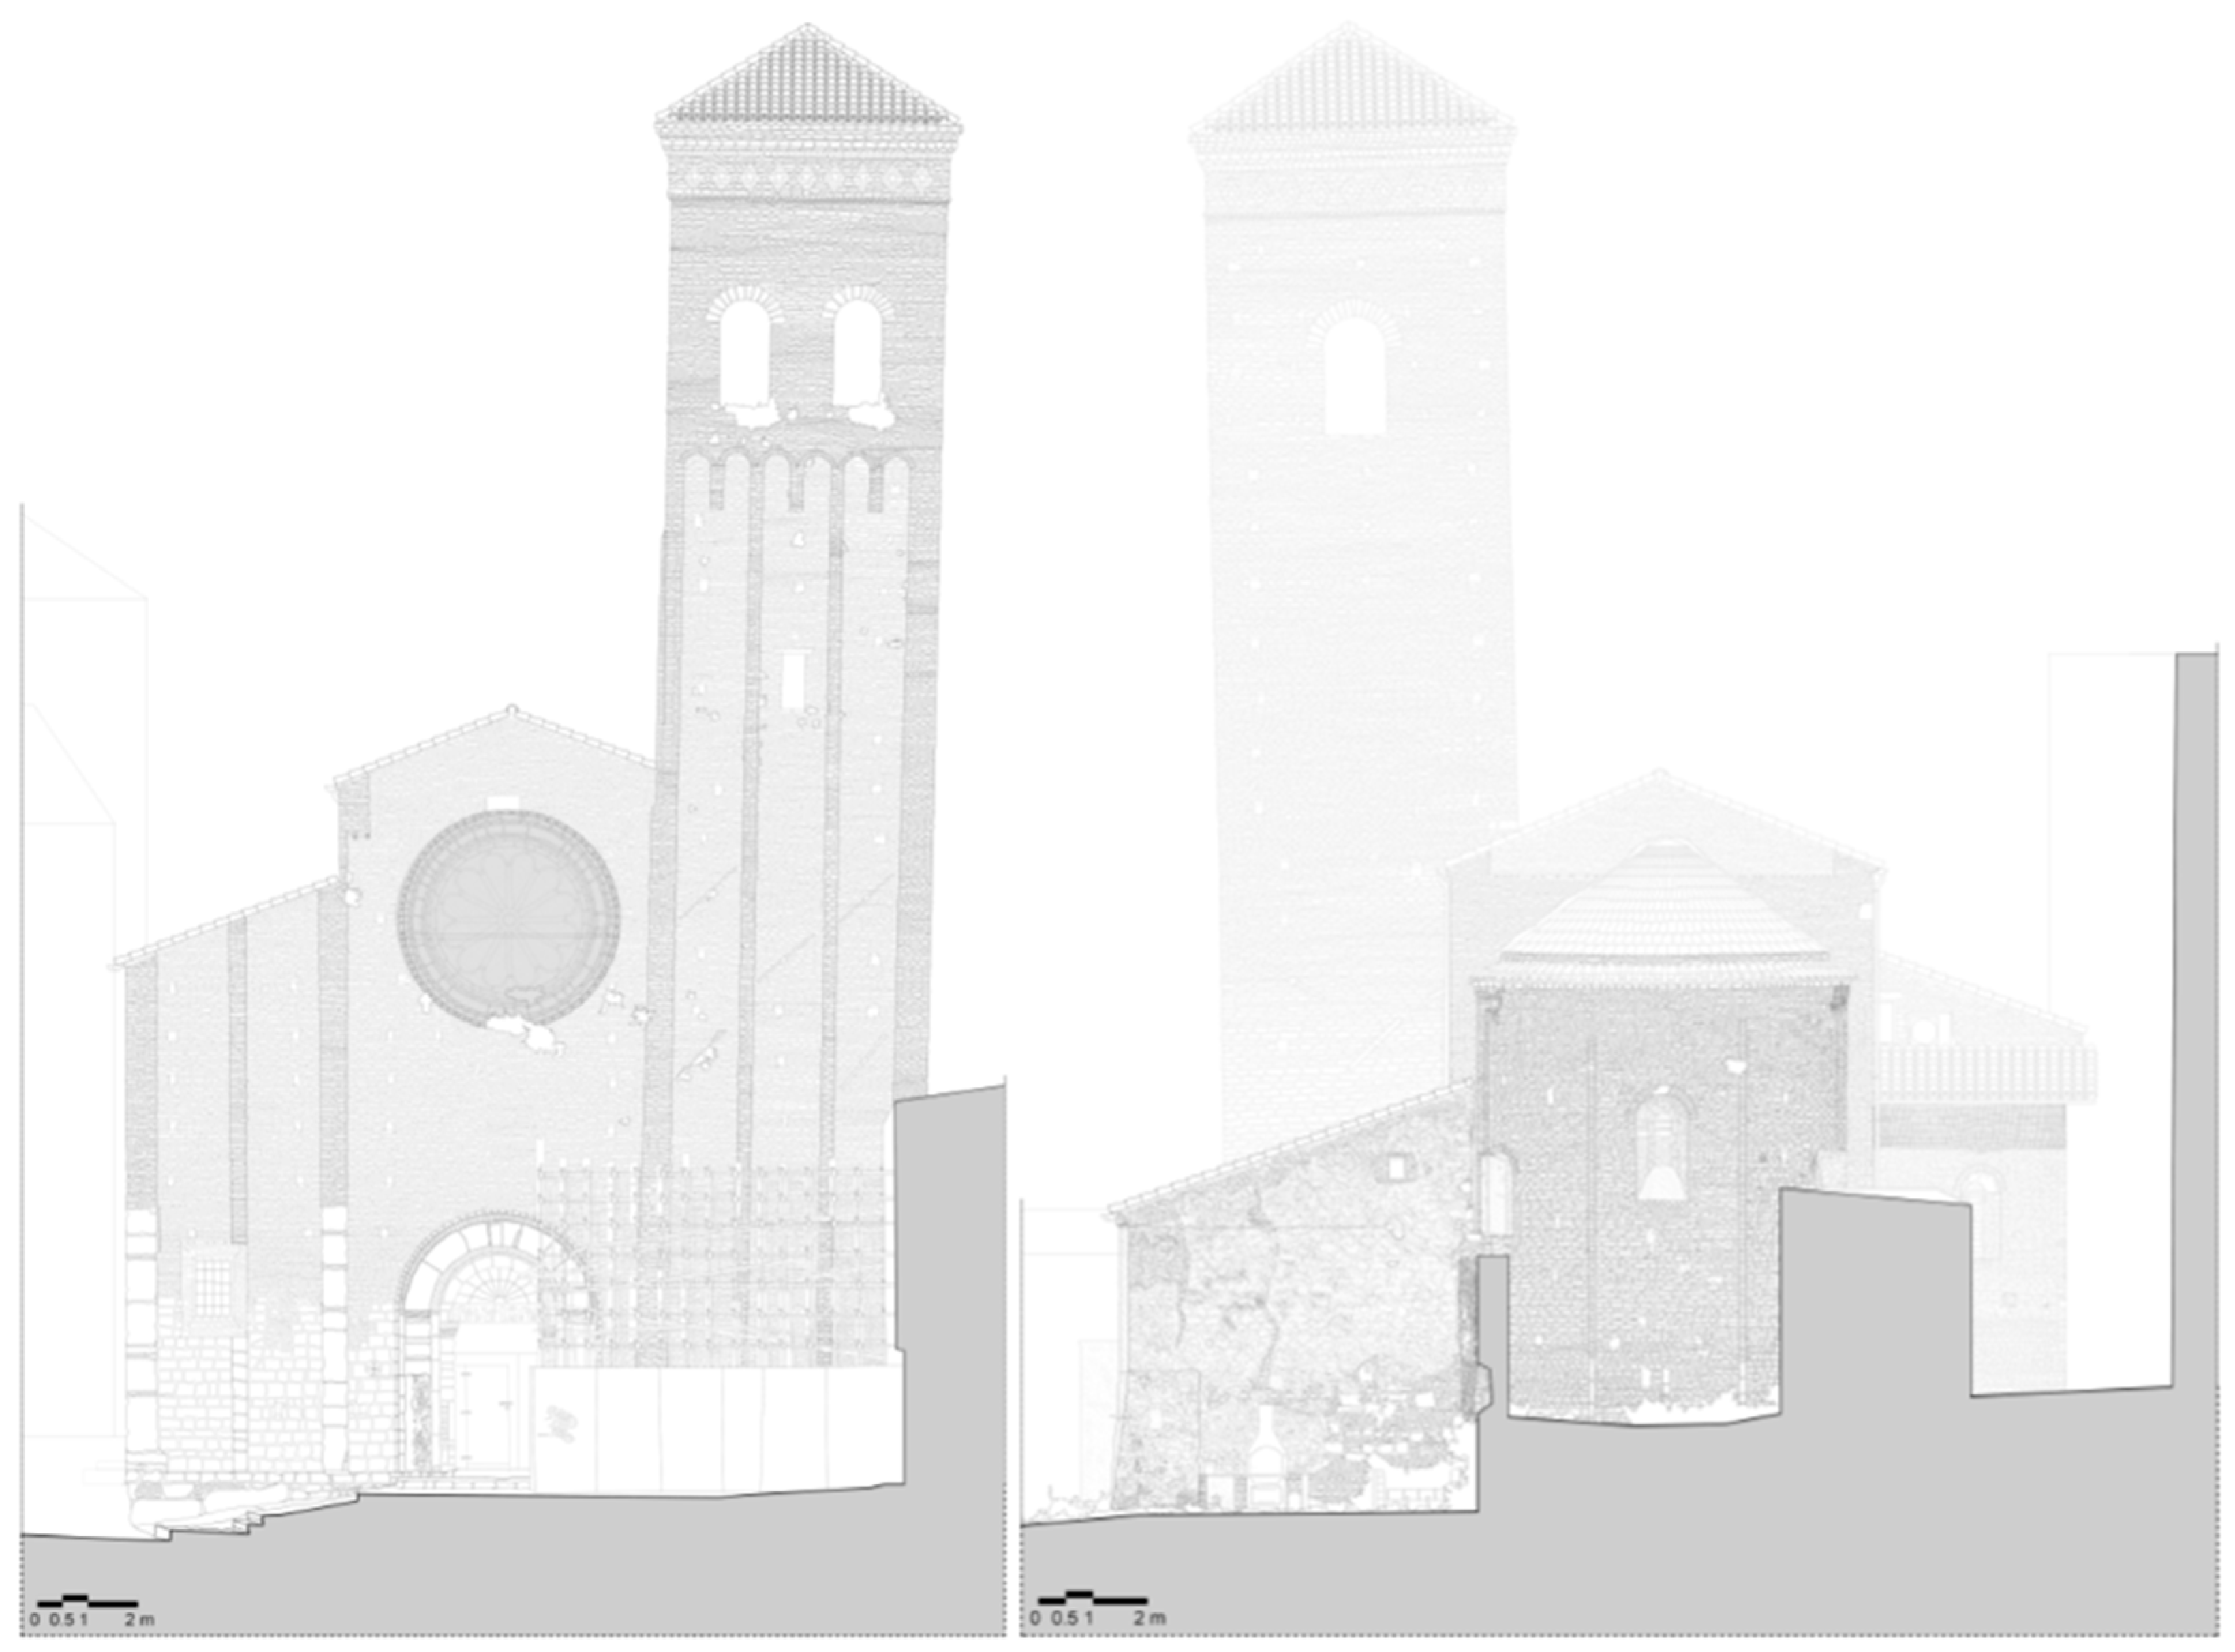
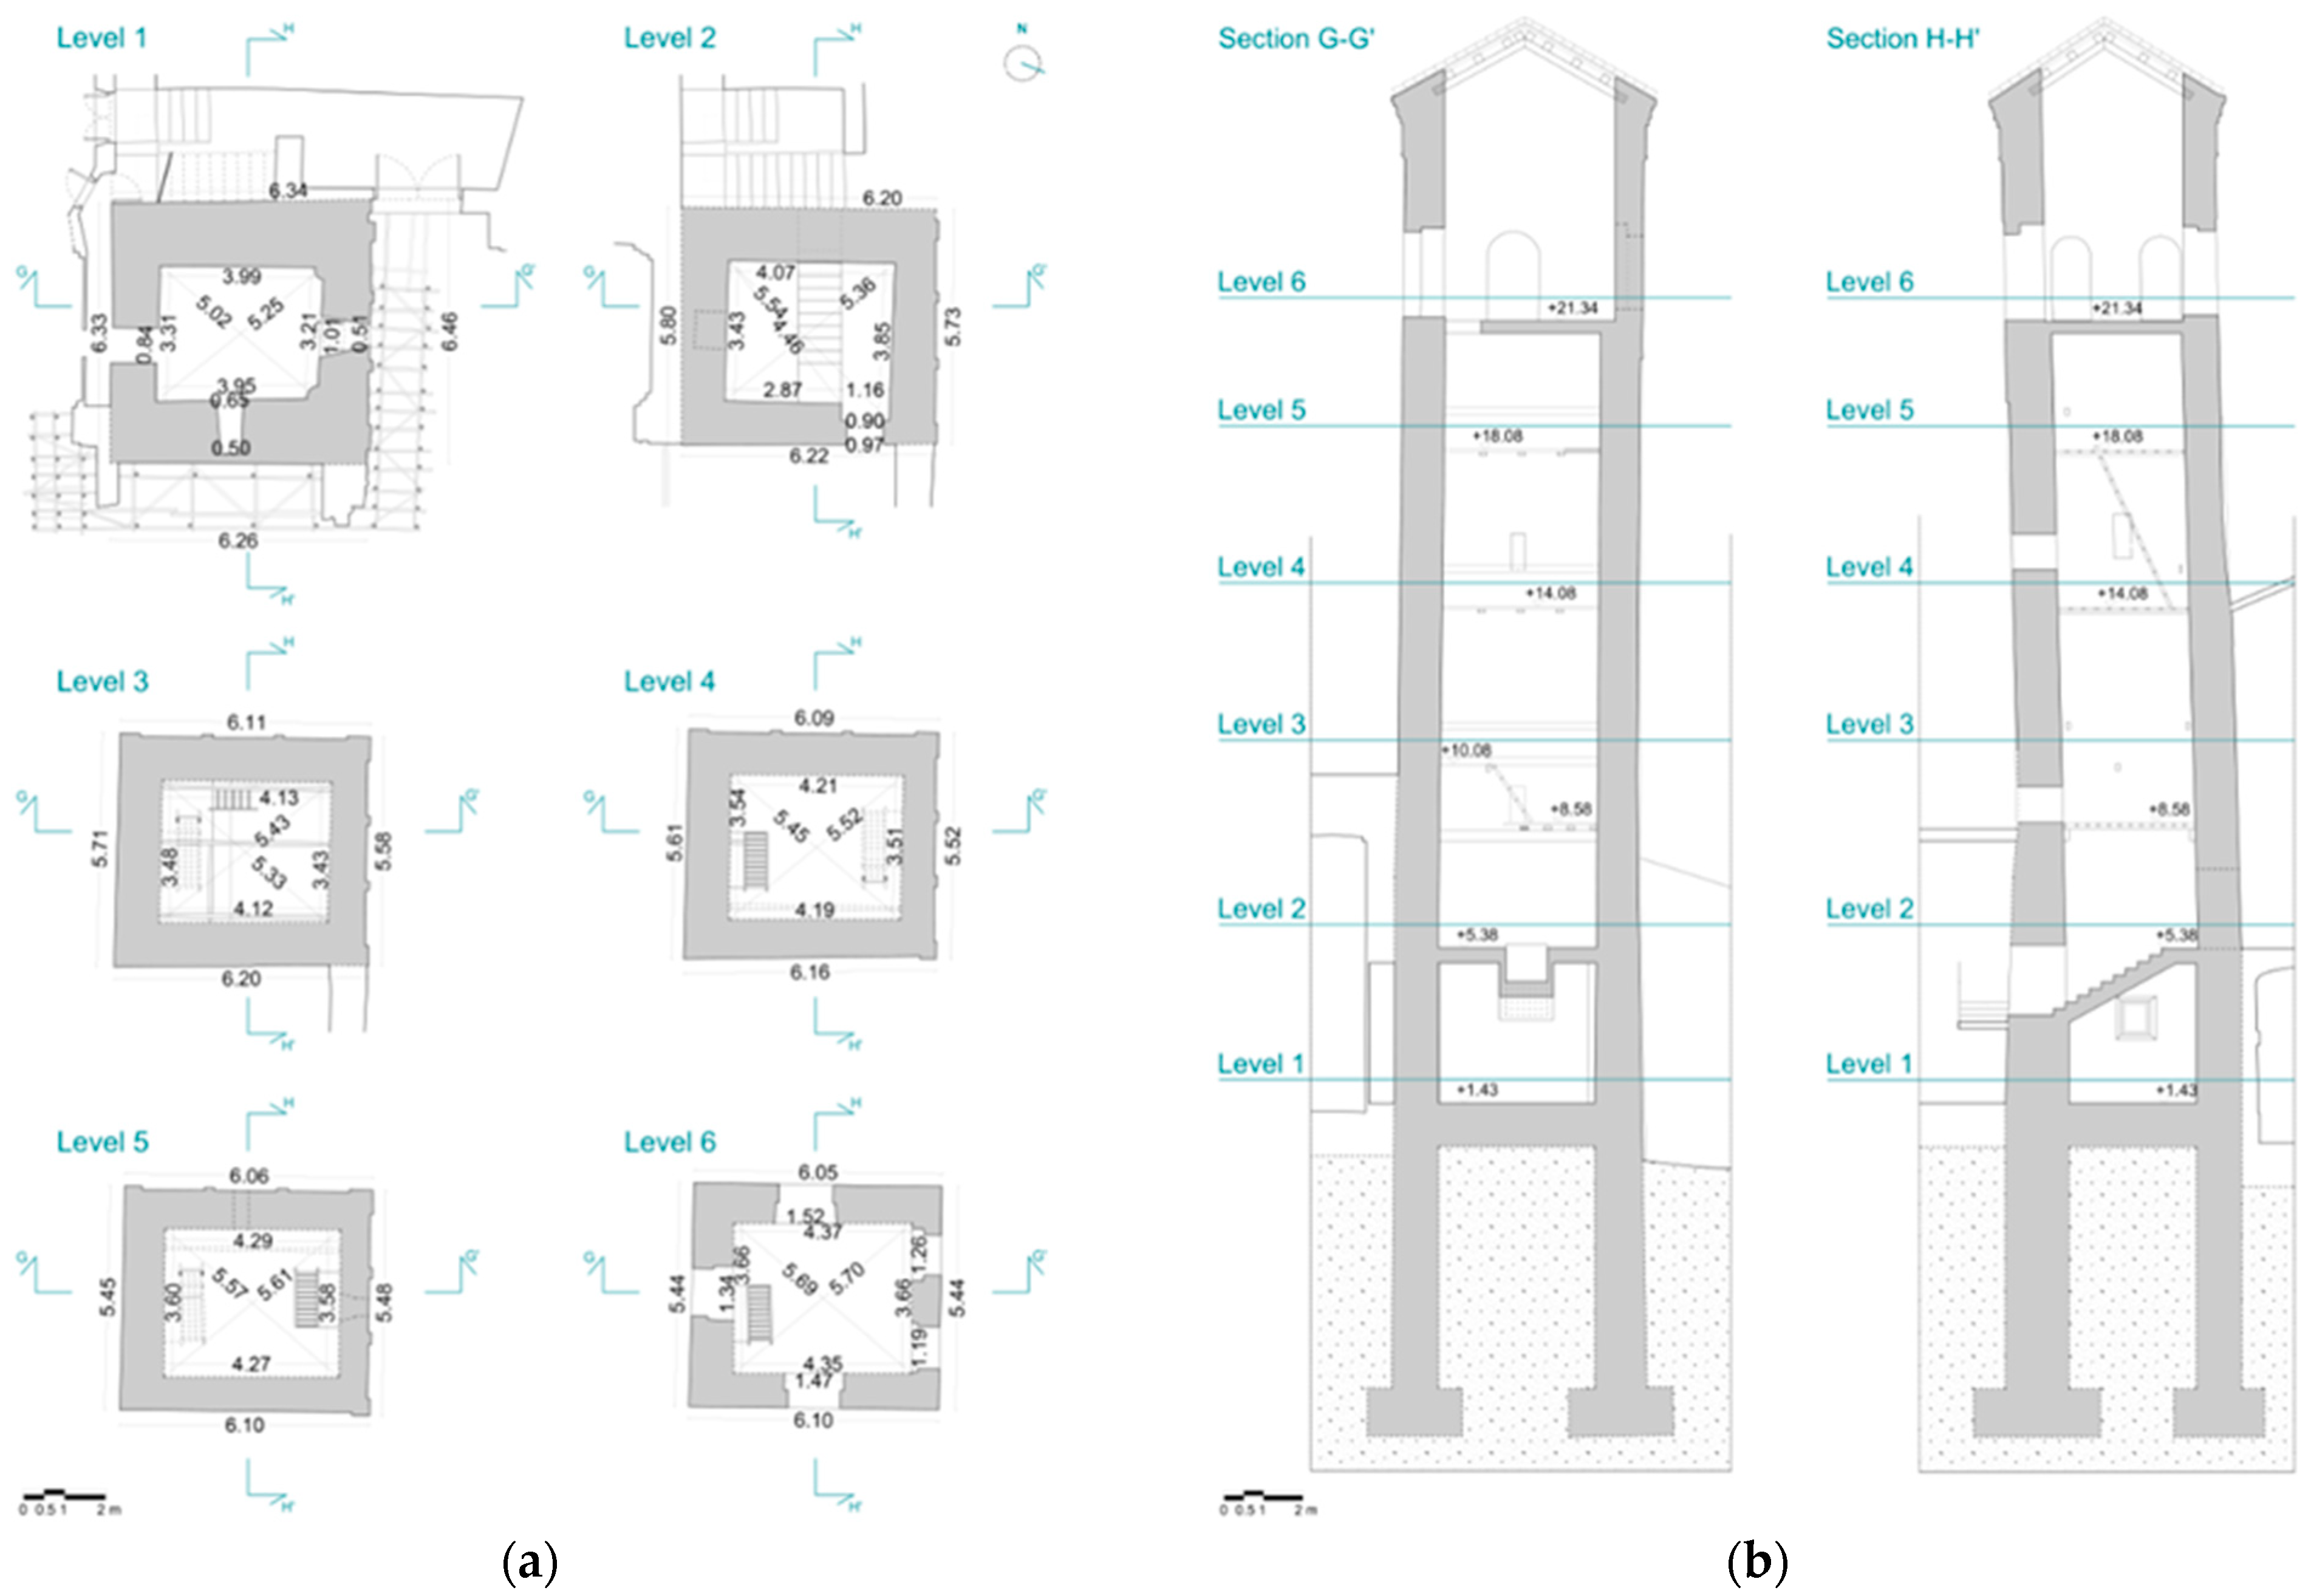
The church (Figure 5, Figure 6 and Figure 7) stands on three naves, the main and the left side ending with apses, while the right side ends with a square-shaped sacristy. The dimensions are: 46 m in length, 19.29 m in width and a height of 12.31 m for the side aisles and 15.36 m for the central nave. The bell tower (Figure 8) located on the right side of the main elevation, measures 6.26 × 6.33 m2 in plan and 29.13 m in height. From the access atrium to the main altar the altitude jump is 2.22 m.
2.2. Materials, Construction Techniques and Pathologies of Decay
Further studies carried out on masonry samples highlighted the modifications that had occurred on the structural complex over the centuries, thus, confirming the historical-critical reading provided in Section 2.1. Moreover, the studies helped to identify the following two different masonry typologies that characterize the building: bricks and mortar at the upper part of the North fronts, including the bell tower (Figure 9a); and sandstone blocks and mortar at the bottom of the main elevation (Figure 9b), which belong to the early construction phases of the church.
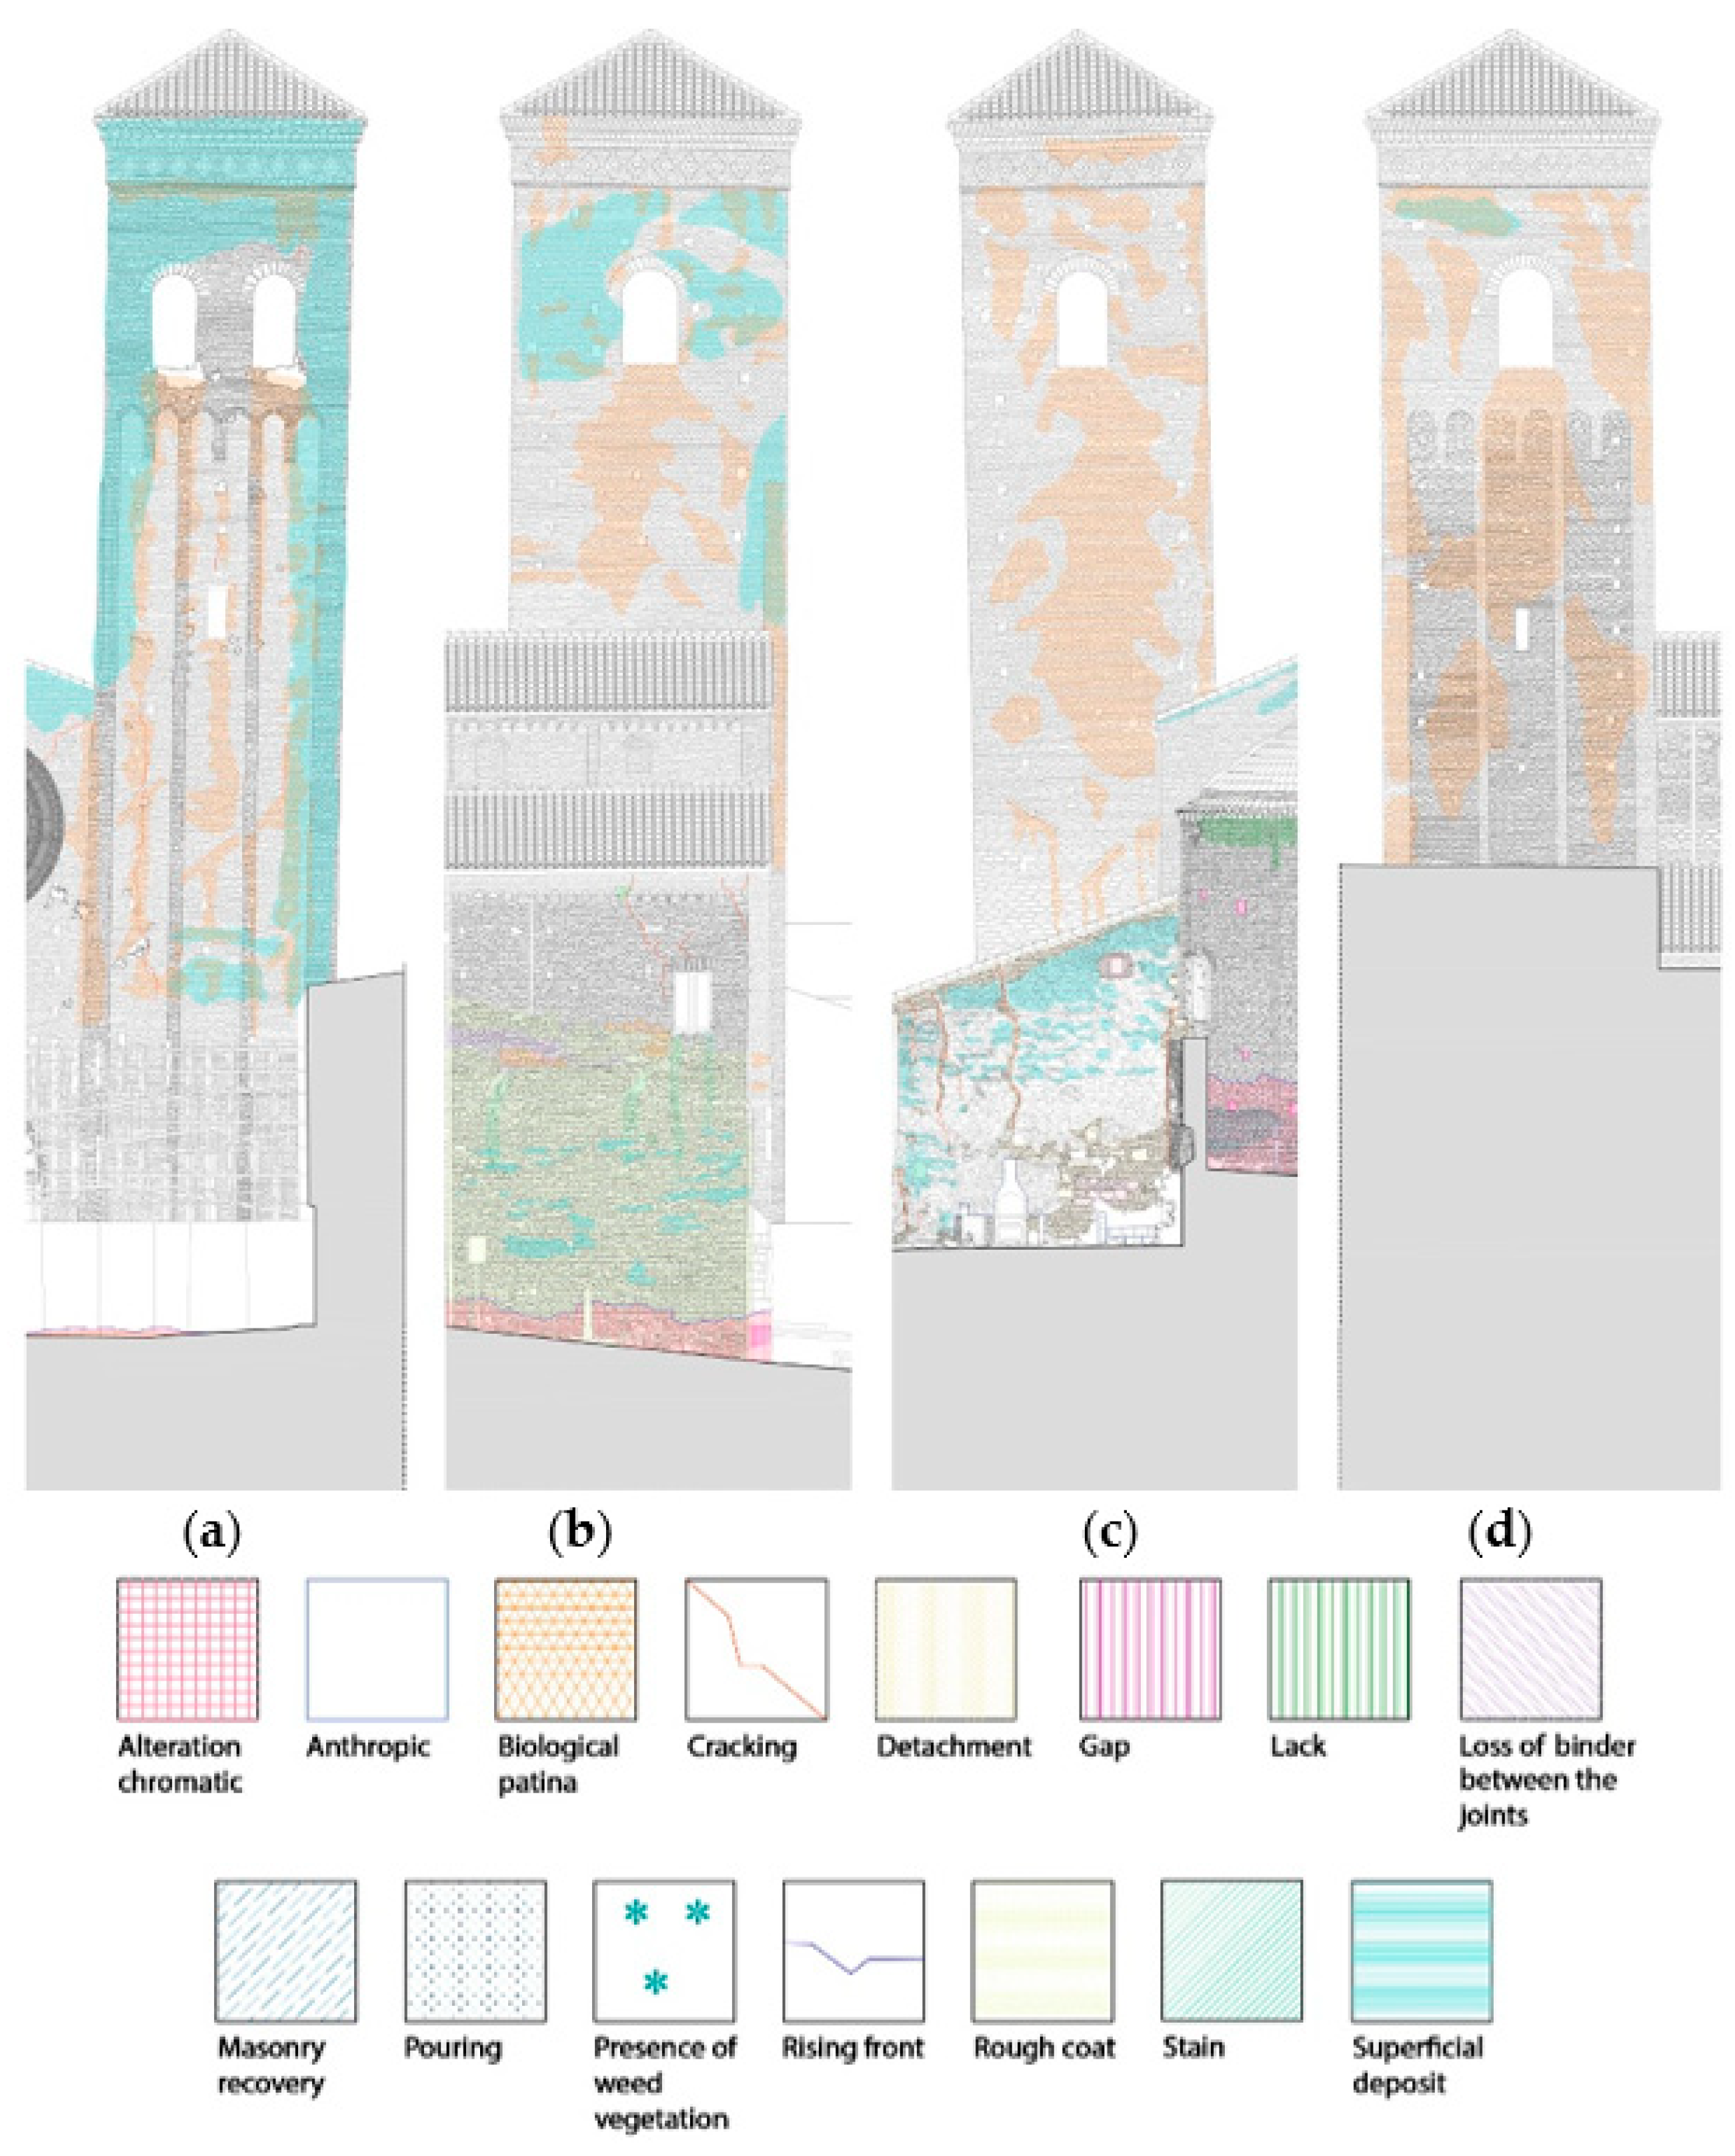
The analysis of decay pathologies was made using the glossary Nor.Mal 1/88 [62]. The exterior of the asset has rather widespread decay phenomena, mostly related to the moisture rising from the ground. Besides humidity, other phenomena are observed, such as superficial deposits, biological patina and the presence of weeds, which also largely affect the bell tower (Figure 10).
2.3. Foundation and Soil Characterization
The Church of San Zenone is located in an area that is characterized by layers of inorganic loam, fine smooth sands and clayey loams from 3 to 10 m and the subsequent stratification of clays, sandy clays, clay sands, sandstones and roof conglomerates up to a depth of 30 m. Based on preliminary studies conducted on this site, the soil condition is characterized by values of the shear-wave velocity (VS30) within the interval of 180 m/s and 360 m/s (soil category C according to the Eurocode 8 classification [63]). A shallow foundation system is present.
2.4. Survey of the Damage after the 2016–2017 Central Italy Earthquakes and Safety Interventions
The seismic sequence that struck central Italy began on 24th August 2016 with a mainshock of magnitude Mw 6.0, and the hypocenter was located at the borders of the Lazio, Abruzzo, Marche, and Umbria regions. The earthquake was initially reported by the Geophysics and Vulcanology National Institute (INGV) to have occurred at a depth of approximately 5 km, with a magnitude of 6.0 Mw and an epicenter in Accumoli (Lazio Region). The initial earthquake was followed by at least 2500 aftershocks. The tremor and a number of aftershocks were felt across the whole of Central Italy: four regions, six provinces (Perugia, Ascoli Piceno, Fermo, Rieti, L’Aquila and Teramo) and 17 municipalities. The 17 municipalities affected by the earthquake and which suffered serious structural damage cover an area of 1728 km2.
Another mainshock of Mw 5.9 occurred on 26th October and afterwards, on 30th October, the largest shock of the sequence, which measured Mw 6.5, took place, with the epicenter located between Norcia, Preci, and Castelsantangelo sul Nera (Umbria Region) with a 9.4 km deep hypocenter. The maximum PGA recorded near the epicenter was about 0.48 g with a peak of 0.76 g recorded in Arquata del Tronto (Marche Region), where the earthquakes and the related accelerations are linked to the local site amplification [64]. The strong motion observations between August and December 2016 were also analyzed by Luzi et al. [65].
In addition to the loss of human life, widespread destruction of cultural heritage was also reported; in particular, many churches were damaged or partially collapsed. The damage mechanisms were similar to those already observed in other seismic events. Several studies classified the damage caused by the seismic events, which affected churches and the various macro-elements, including slender and towering elements such as bell towers [6,7].
2.5. Seismic Hazard
The location of the tower is characterized by medium/high seismicity according to the Italian seismic map [66], and shows peak ground acceleration (on rigid soil, with VS30 > 800 m/s) of about 0.2 g with an exceedance probability of 10% over 50 years. In this study, a stochastic ground motion model was exploited to characterize the underlying seismicity and provide a set of simulated earthquake samples to perform structural analyses. To this aim, a probabilistic characterization of the following seismological parameters is provided: moment magnitude M, and the epicentral distance R. The magnitude is assumed to follow the Gutenberg-Richter recurrence law [67], :
in which a and b are parameters accounting for the mean number of earthquakes expected from the seismic source and the regional seismicity, respectively. The recurrence law of Equation (1), bounded within the range of magnitudes of interest [m0, mmax] leads [67,68] to the probability density function, :
being β = b* loge(10), m0 is the minimum significant magnitude value (i.e., negligible effects are expected on the structure for m < m0), and mmax the maximum magnitude expected from the seismic source. The epicentral distance is modelled according to the following probability density function, :
which is obtained assuming that the seismic source produces earthquakes having equal likelihood anywhere within a distance rmax from the site; seismic effects are assumed to be non-significant for r > rmax. The soil category is fully characterized by the shear-wave velocity value, VS30.
The Atkinson–Silva [69] source-based ground motion model was used in this work, and was combined with the stochastic point source simulation approach [70] to describe the attenuation from the source to the building site and for generating synthetic accelerograms conditional on M and R.
For the simulation of two horizontal ground motion components, the stochastic model was modified as suggested in [71], according to which the radiation spectra are considered to have the same shape for the two horizontal orthogonal directions, but the intensities are scaled by two different scaling random parameters (random scaling disturbance ɛ1, ɛ2) generated as samples of a multivariate lognormal distribution with a zero mean, standard deviation σ = 0.523 and correlation ρ = 0.8. This way, the target radiation spectra along directions 1 and 2 will be equal to A1(ω) = ɛ1A(ω) and A2(ω) = ɛ2A(ω).
The random scaling disturbance (ɛ1, ɛ2), together with the Gaussian white noise process, ensures that the ground motions record-to-record variability is accounted for. More specifically, the ground motion generation procedure is as follows: first, a Gaussian white noise signal is generated, then an envelope-function e(t) is applied to model the energy variation in time, and finally, the normalized frequency spectrum is scaled to the target radiation spectrum, in order to characterize the spectral content variability. The obtained variability is further amplified by the lognormally-distributed multiplicative factors (ɛ1, ɛ2) of the radiation spectra.
3. Preliminary Study for Seismic Upgrading through a Steel Dissipative Tower
3.1. Structural Model of the Masonry Tower and Modal Properties
A three-dimensional finite element model (FEM) of the tower was developed in SAP2000 v.20 [72]. The masonry walls were modelled through four-node thick shell elements, thus accounting for transverse shear deformation according to the Mindlin–Reissner formulation [73]. The in-plan geometry of the tower was accurately reproduced as well as the variation in the wall thickness and the openings along the height of the structure (Figure 11). The tilted configuration (almost 2° with respect to the vertical) of the tower was also modelled. Concerning the boundary conditions, the base of the tower was assumed to be fixed. The presence of the adjacent building was considered in the model by following a simplified approach [74,75], according to which the portions of the structure at which the interference is expected are restrained along specific degree of freedom by means of proper supports. It was assumed that the walls of the adjacent building (the main façade of the church and the inner parallel wall) only affect the tower motion along the X direction, hence a set of simply supports effective in X were distributed at a height of 10.00 m along the two corners of the tower (as shown in Figure 11a). The equivalent height of 10.00 m was set based on the consideration that the part of the façade up to the rose window inferior level (up to 10.00 m from the base) is sufficiently rigid to affect the dynamic behavior of the tower, whereas the upper part is more deformable and thus it is neglected in terms of boundary conditions. It is also worth noting that other approaches could be used to account for such structural interaction (e.g., modelling of the entire adjacent walls [74,75,76], fictitious elements with equivalent stiffness [74,75,76,77], equivalent springs [78], upper/lower bound analysis [74,75,76]), however, the adopted approach is considered suitable, especially given also the purposes of the present preliminary study. Gravity loads and masses were derived directly by the software based on both geometry and specific weights (20.00 kN/m3 for masonry elements, 25.00 kN/m3 for reinforced concrete ones), with the exception of the bell’s’ loads (and mass), which were inserted as concentrated forces (masses) with values derived from technical sheets (four bells of different sizes and weights: 3.38 kN, 1.99 kN, 0.97 kN, 0.42 kN).
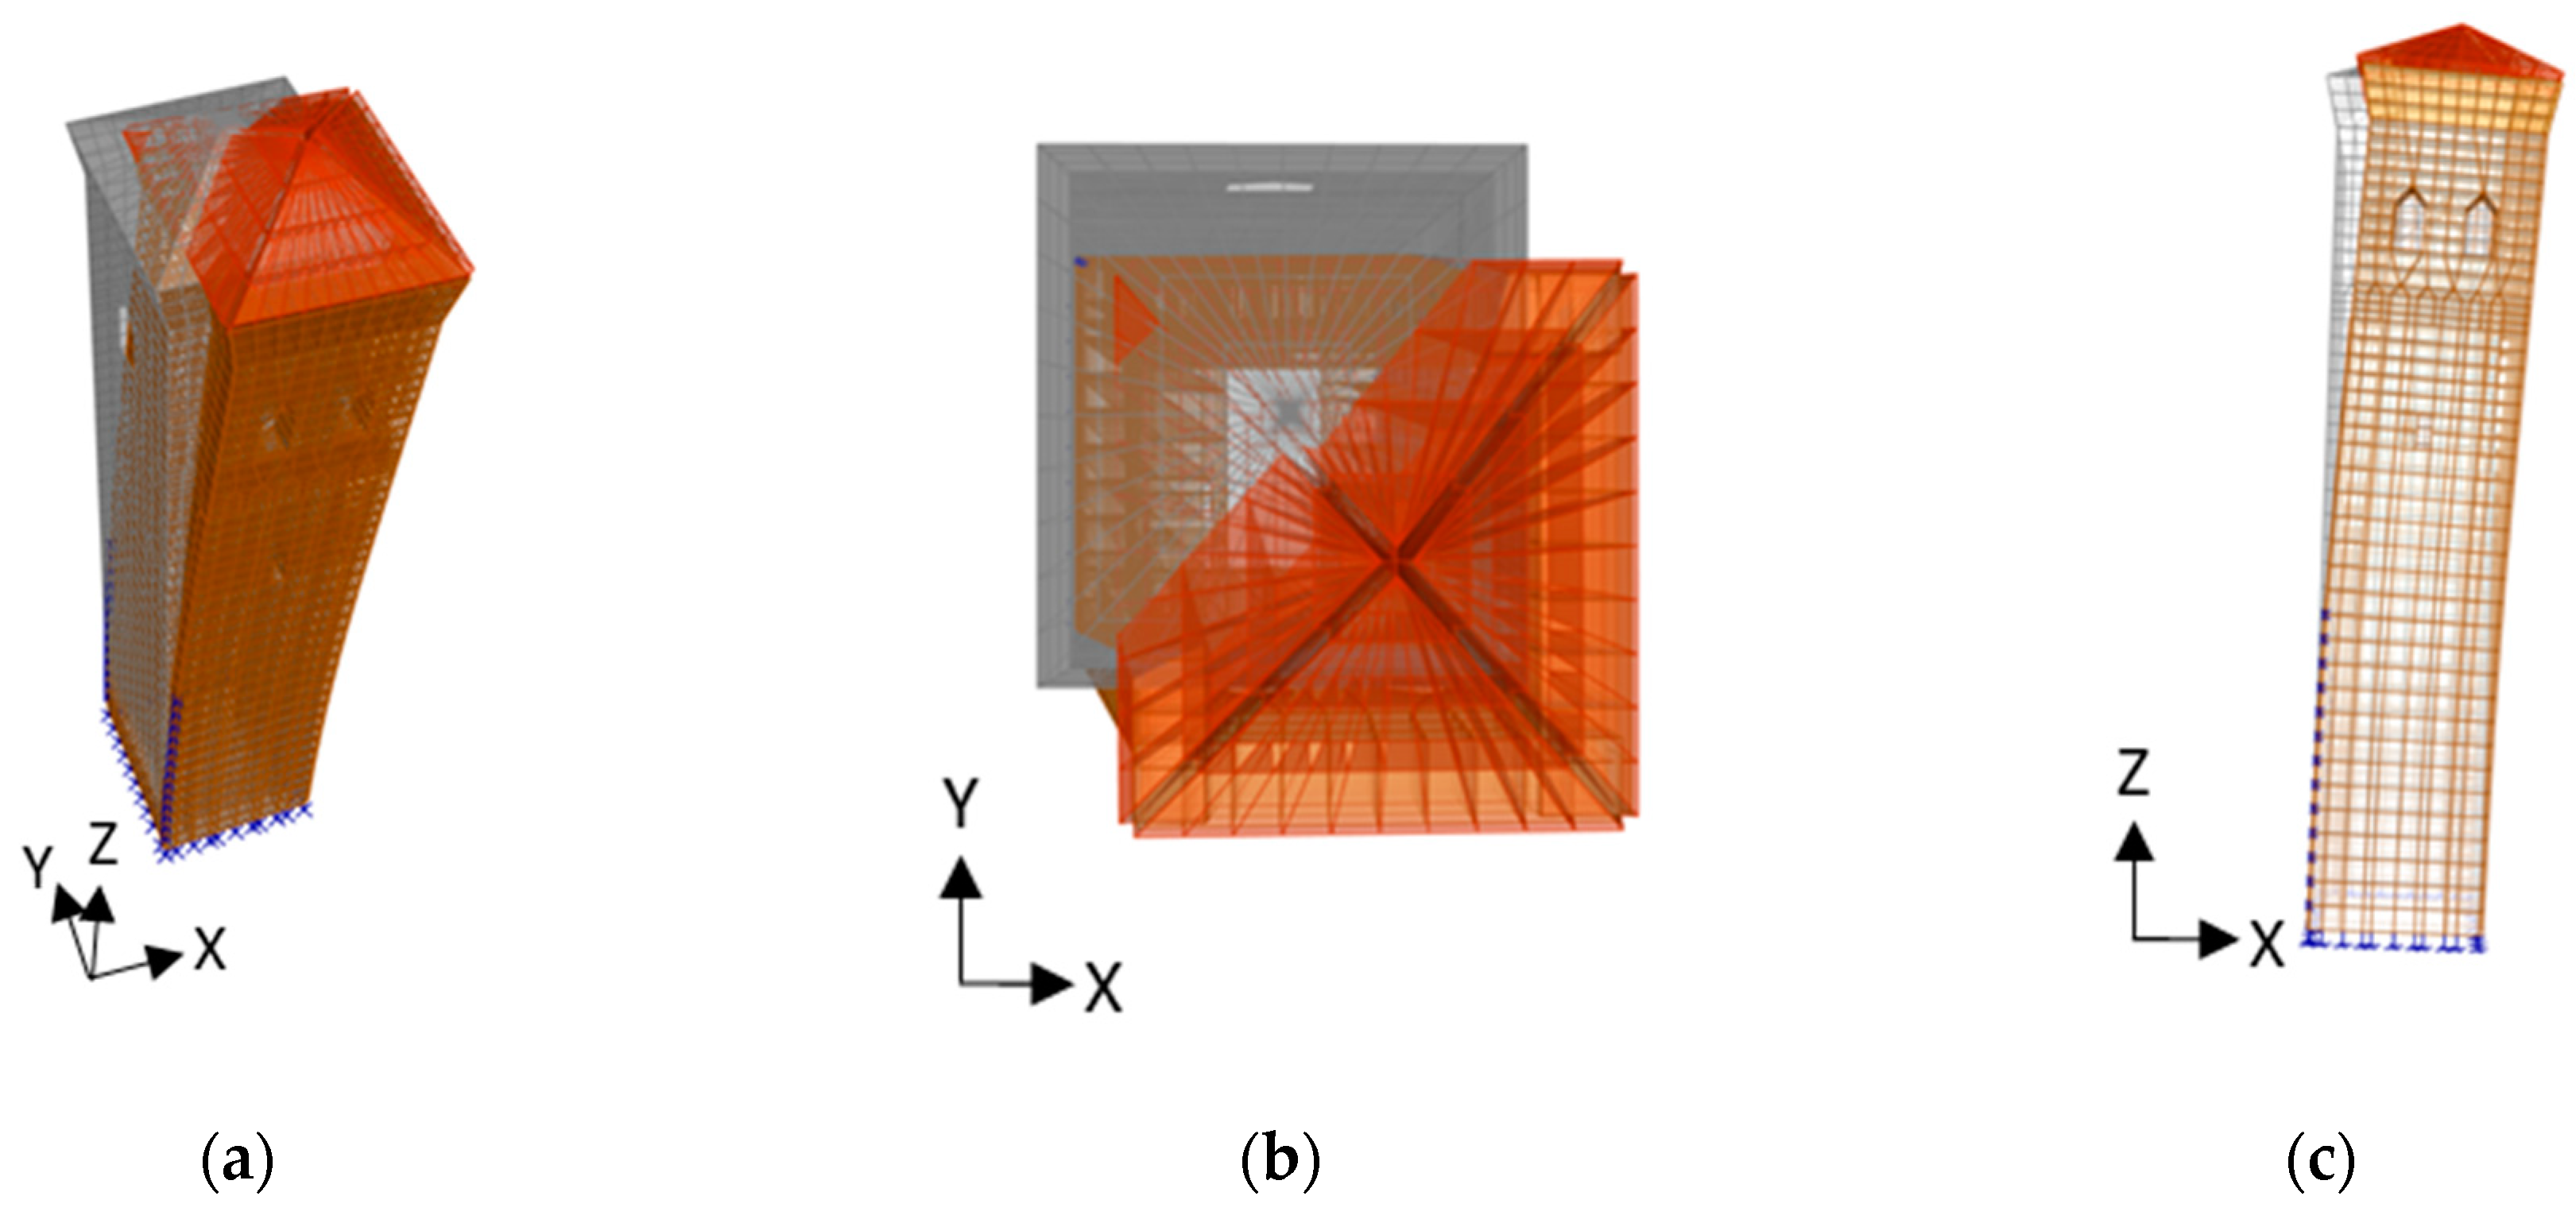
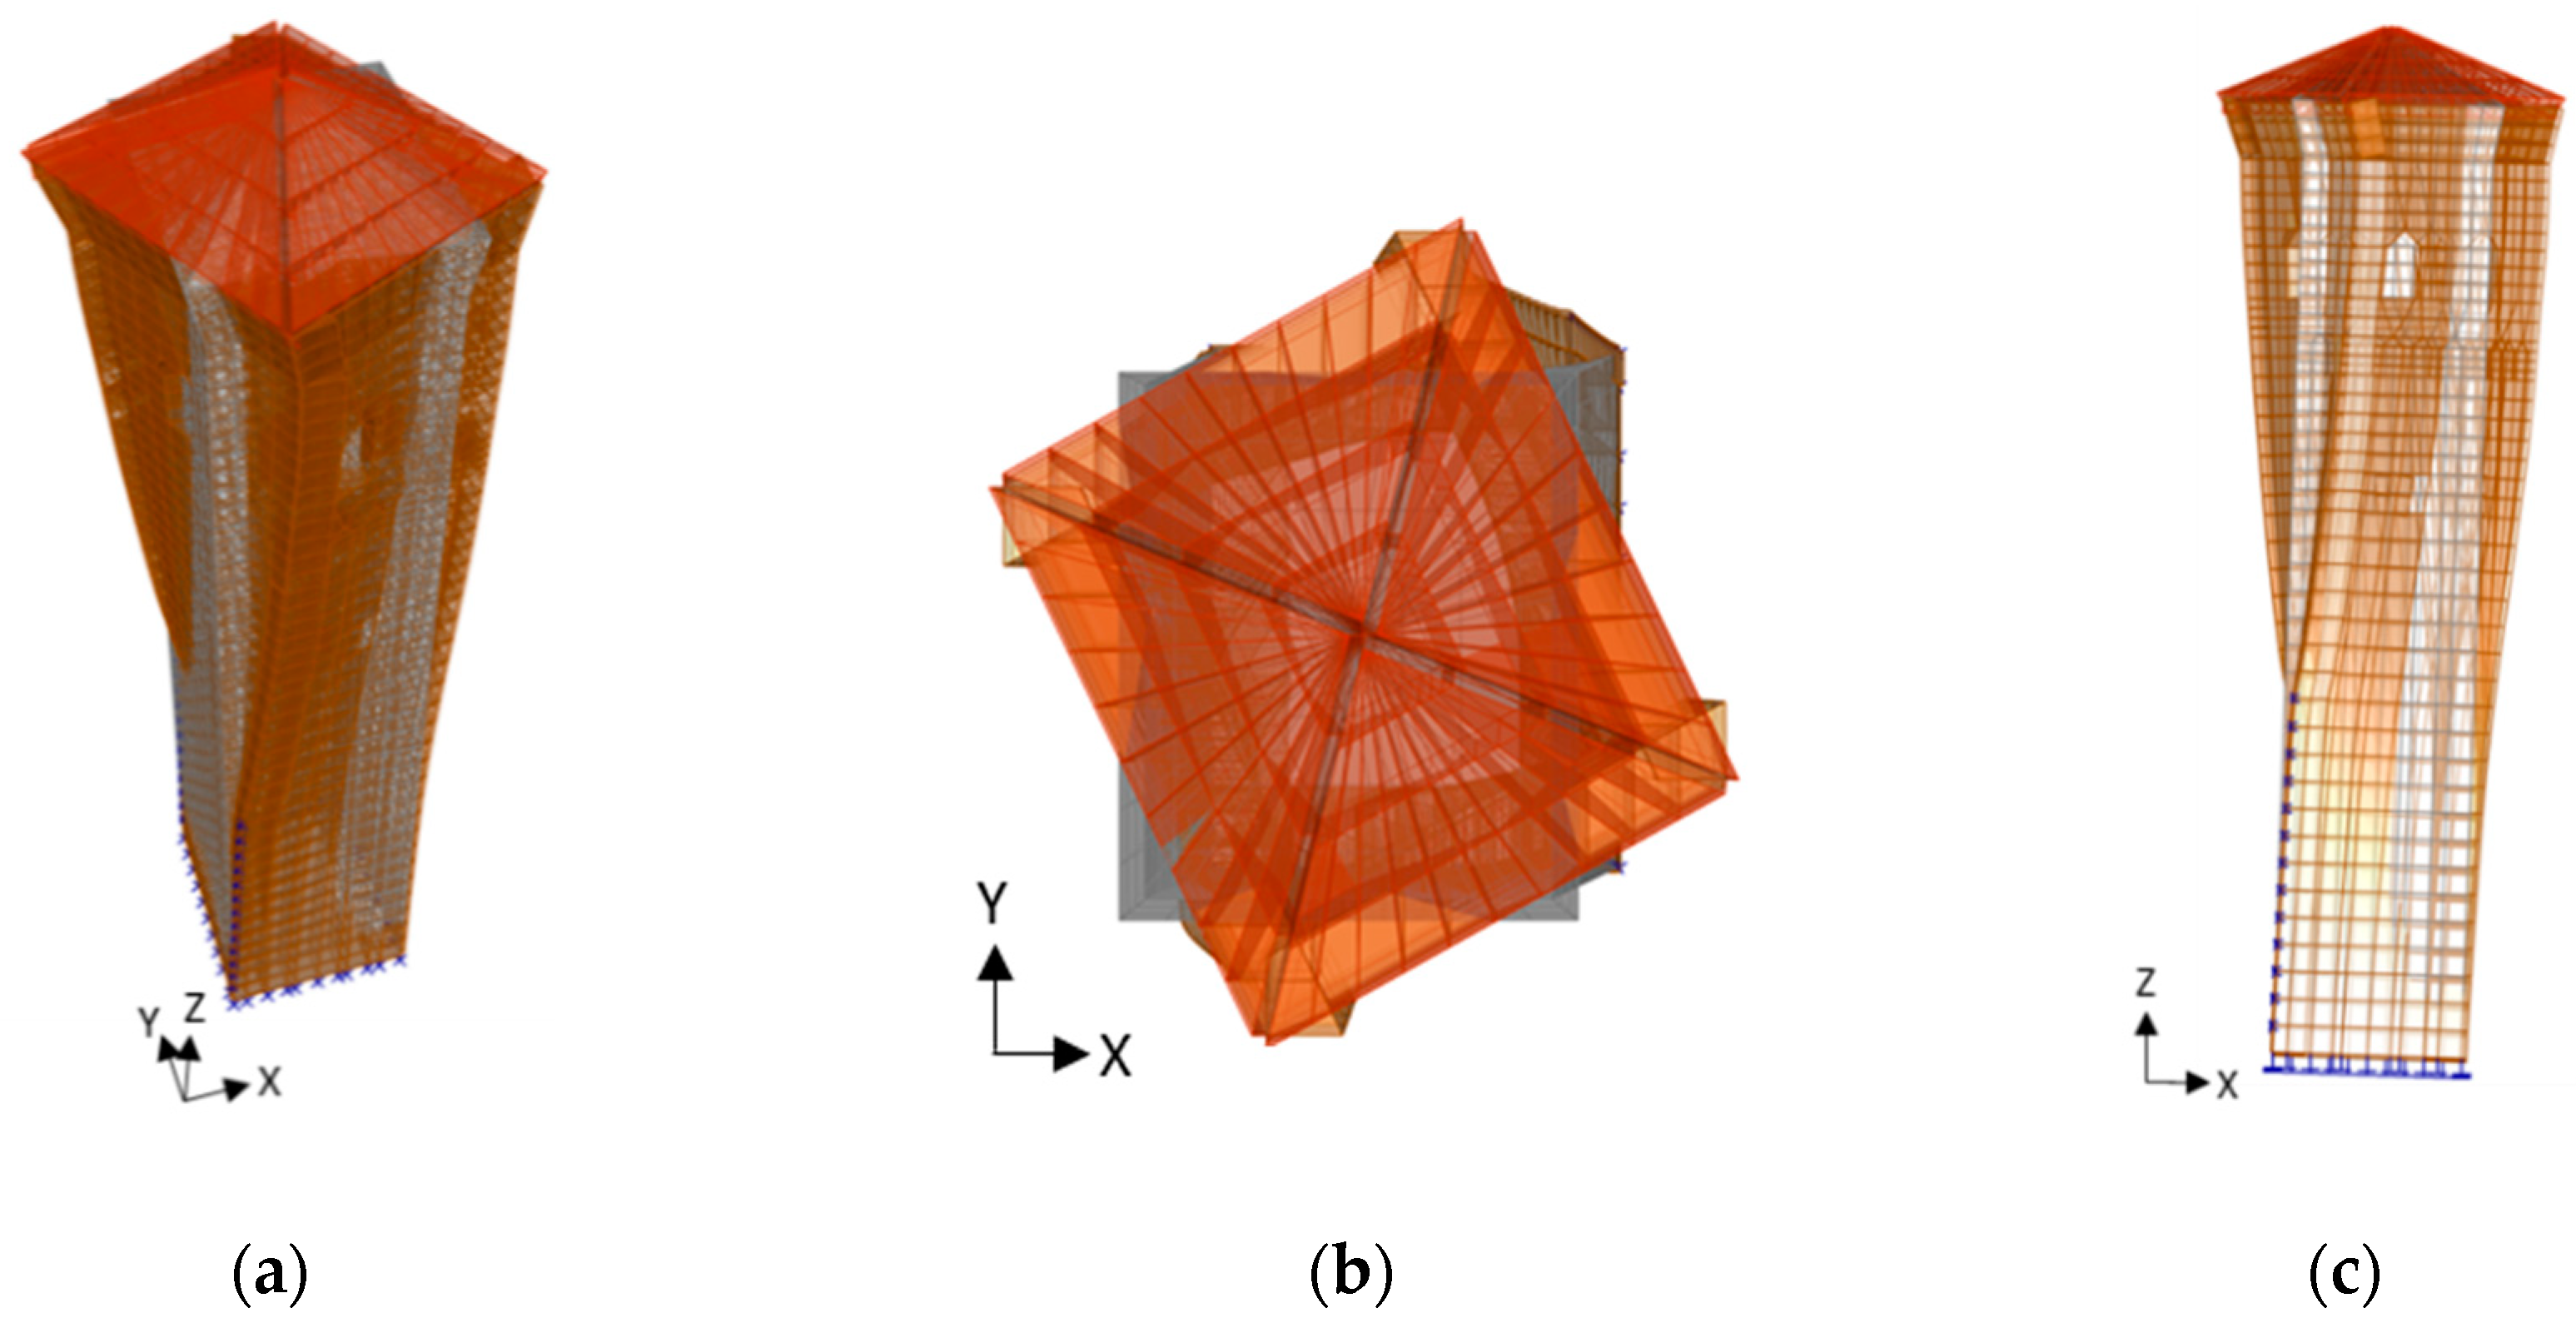
The structural model was used to analyze the modal properties of the bell tower, thus, helping us to understand the dynamic behavior of the system before the retrofit intervention. The former three modal shapes are graphically shown in Figure 12, Figure 13 and Figure 14, whereas the other modal parameters (periods T, modal participating mass ratios R) are collected in Table 1 for all the modes needed to achieve the dynamic activation of the 85% mass. Based on these results, the following observation can be made: (i) the first two modes are translational (first mode along Y with RY = 44%, second mode along X with RX = 32%) with a slight coupling (RY/X ≈ 18%) between the X and Y directions; (ii) the third mode is purely torsional (RZ = 65%); and (iii) 85% of the mass activation along Y is achieved with 10 modes, while 18 modes are required along the X direction. Accordingly, a total of 18 modes were used to perform the dynamic analyses discussed below.
3.2. Ground Motion Samples
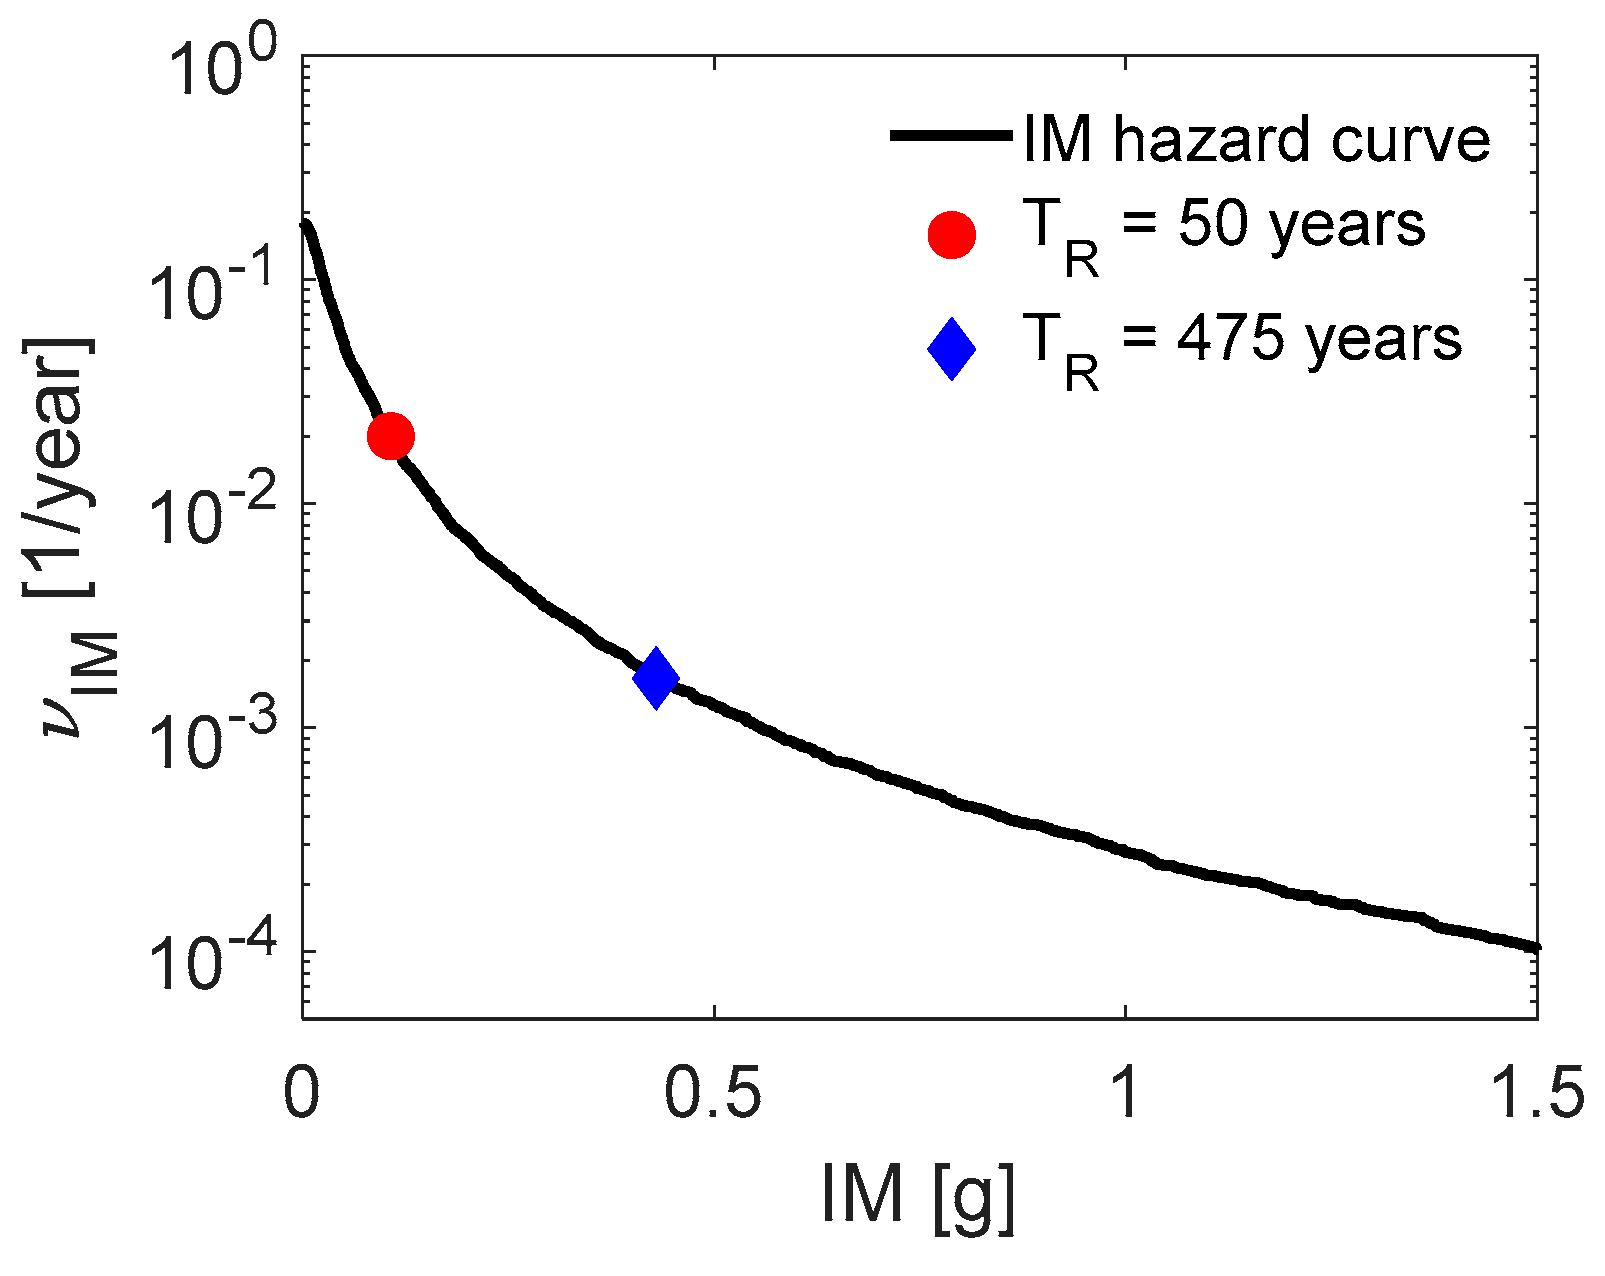
The values of the parameters governing the seismic scenario (M, R, a, b, VS30) are set in order to provide an hazard curve representative of the seismicity expected at the site of the tower. The following values were assumed: m0 = 5.0, mmax = 8, a = 4.5; b = 1.0, rmax = 50 km, and VS30 = 310 m/s, as representative of deformable soil conditions. The maximum component Sa(T*) was used as the intensity measure (IM) in this study, where T* is equal to 0.75 s, i.e., the average period from the two principal modes of vibration of the tower. The IM curve is shown in Figure 15.
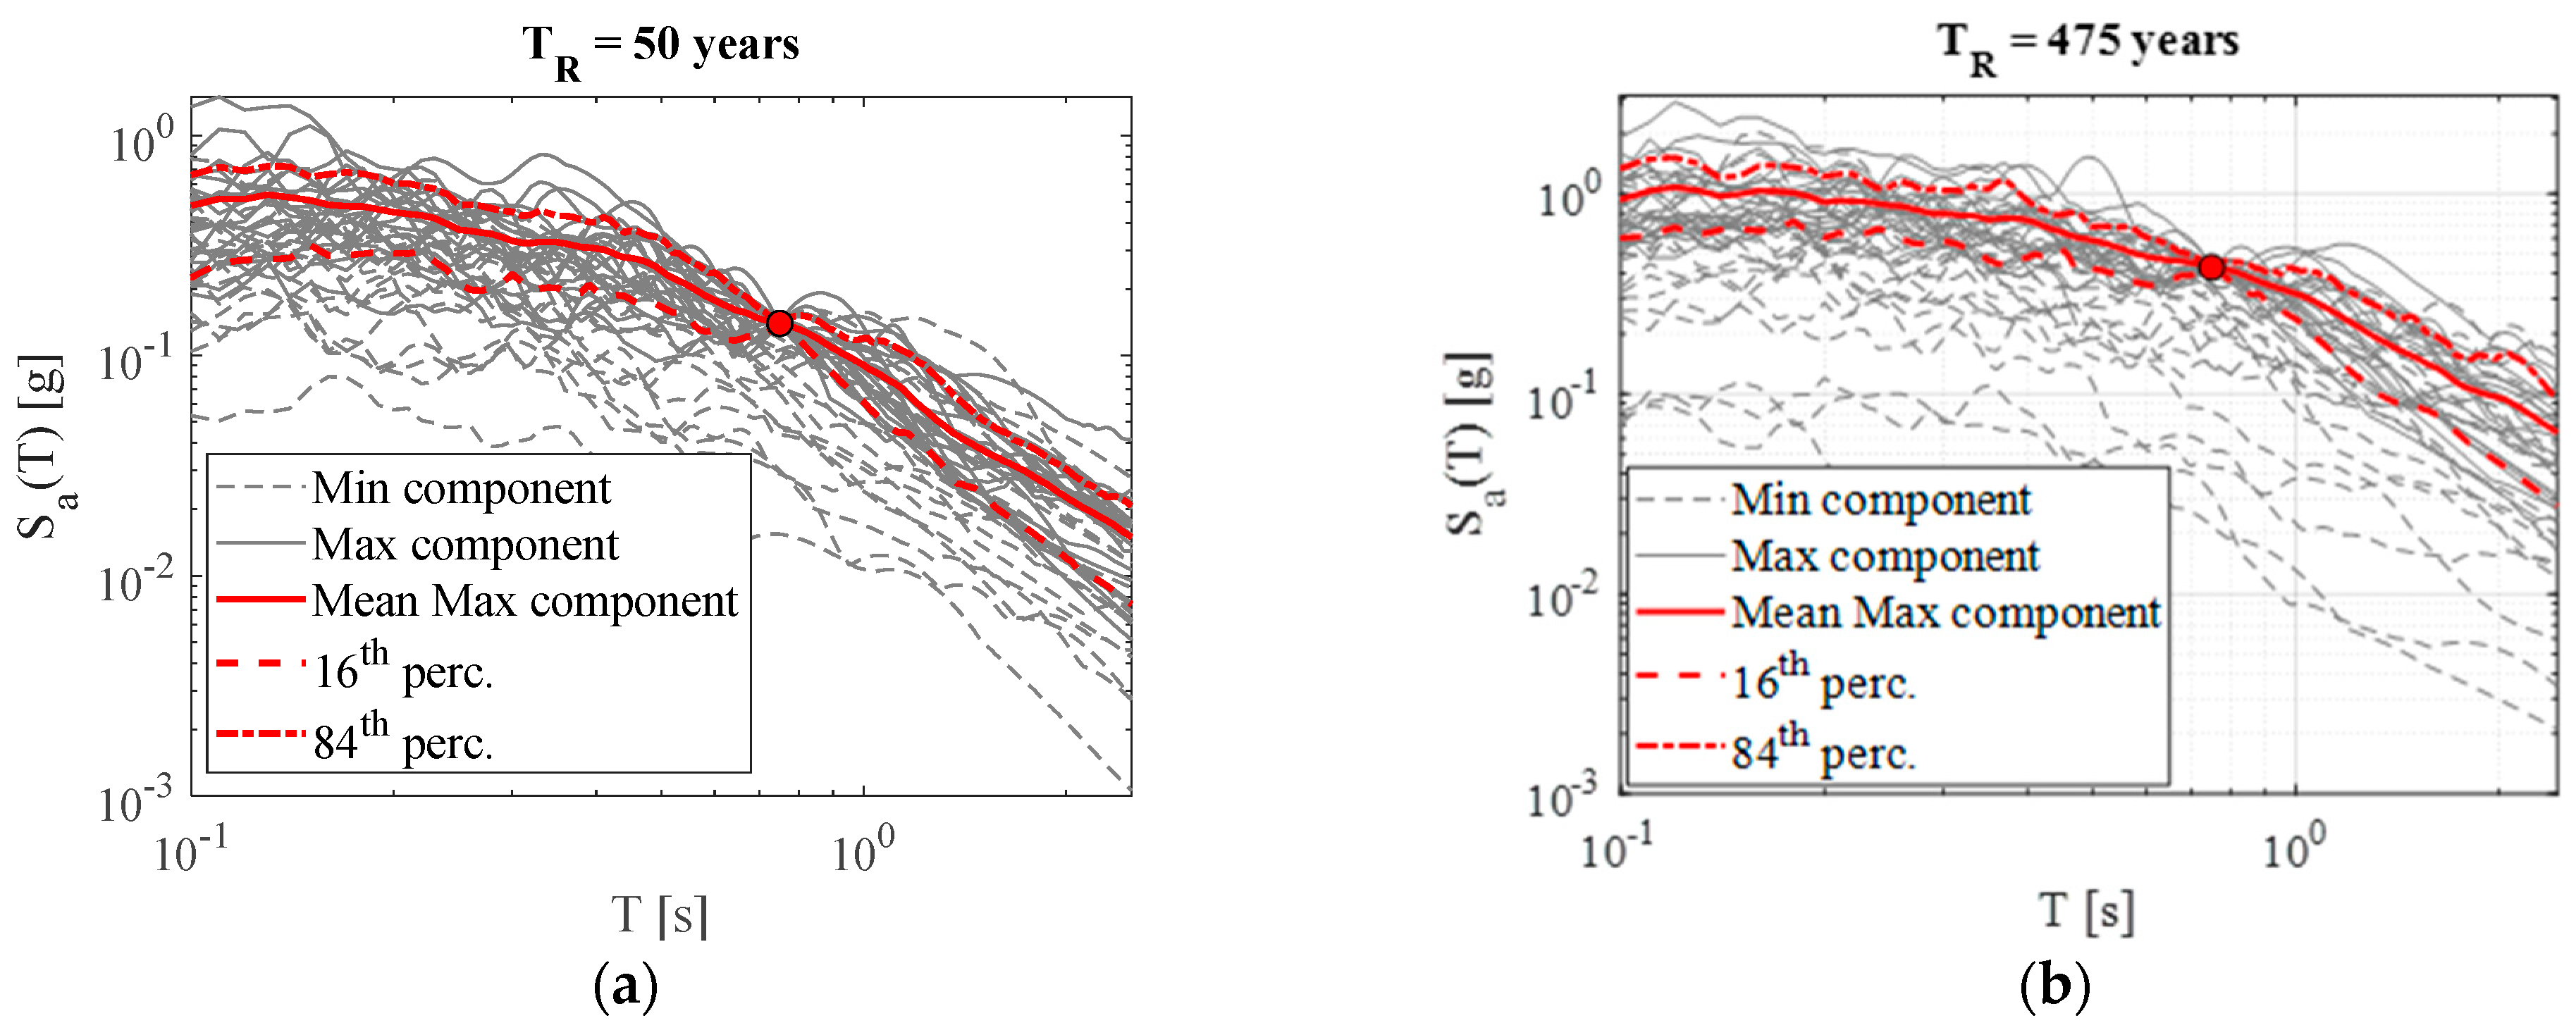
Two reference intensity levels were considered, corresponding to different limit states [79]: the damage prevention limit state, with return period TR = 50 years, and the life safety limit state, with TR = 475 years, which are highlighted by colored markers in Figure 15. A set of 20 pairs of earthquake samples was selected at each of the aforementioned IM levels, and the response spectra of both the horizontal components of the seismic input (conditional to the two intensity levels) are depicted in Figure 16. In particular, spectra of the 20 pairs of individual samples are depicted by thin grey lines, continuous for the maximum components (with respect to which the conditioning procedure is operated) and dashed for the minimum ones; the mean and the 16th and 84th percentiles of the maximum spectra are also shown with red lines (a continuous line for the average, a dashed line for the 16th percentile, and a dot-dashed line for the 84th percentile). The life safety limit state was used to perform numerical seismic simulations and investigate the effectiveness of the retrofit strategy.
3.3. Design of the Steel Tower with Dissipative Devices
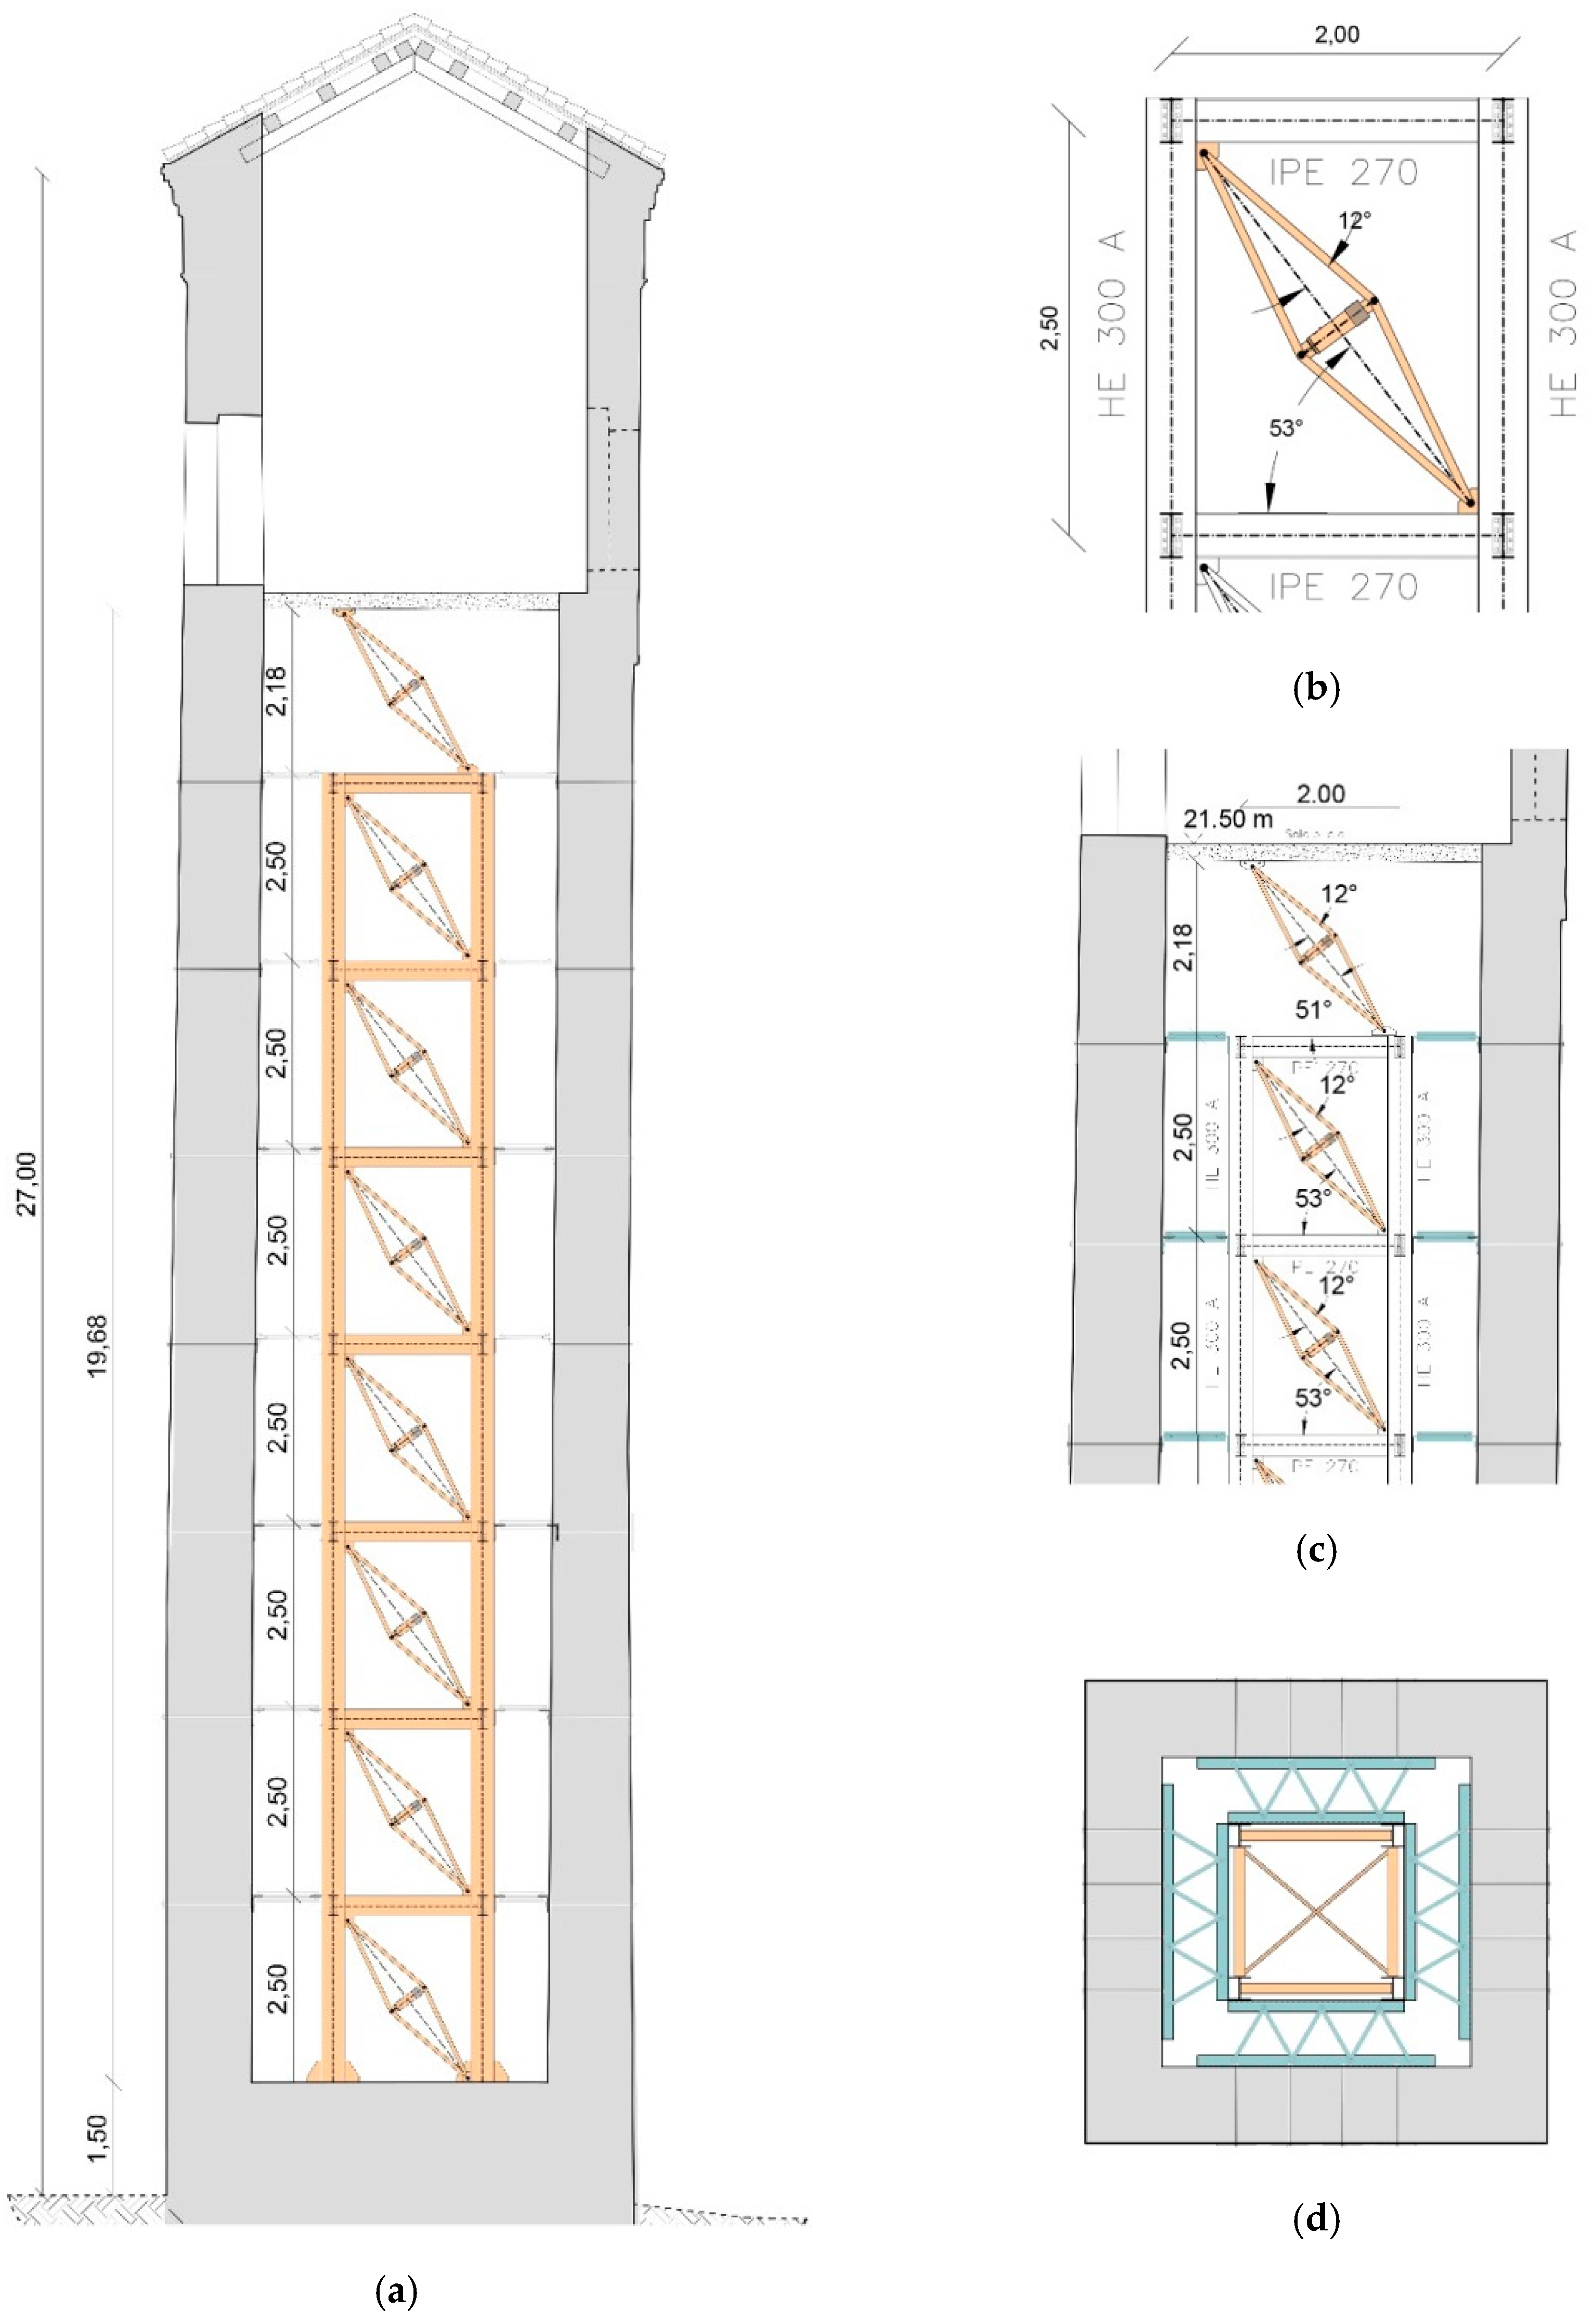
The intervention strategy has three main aims, namely: (1) to provide the tower with a source of supplemental damping that is able to reduce the seismic demand in terms of displacement, acceleration and stress on the masonry elements; (2) to preserve the modal dynamic properties of the original tower without adding stiffness to the system in order not to force the structure to behave differently from its natural tendency, i.e., modal shapes and periods are preserved; and (3) to leave unaltered the vertical static behavior of the tower that does not reveal deficiencies. Accordingly, solution that was chosen was a dissipative tower inside the masonry bell tower and extended from the base up to the bell chamber level, located 21.50 m from the ground level. For the sake of brevity, the dissipative tower will be referred to as the “inner tower” and the original masonry tower as the “outer tower”. The inner tower consists of a steel structure with in-plane dimensions of 2.00 m × 2.00 m2 and a total height of 20.00 m, with 8 stories of 2.50 m each. Every level of the inner tower is equipped with four fluid viscous dampers (two along the X-direction and 2 along the Y-direction). Dampers are not located according to standard diagonal configuration, rather they are placed exploiting a scissor-jack configuration [80,81] (Figure 17), whose geometry was defined in order to significantly amplify the damper’s axial deformation, and thus, the effectiveness of the damping system, without requiring high displacements of the main structural system. It is worth noting that the obtained displacement magnification factor (i.e., the ratio of the damper’s relative axial deformation, , over the horizontal interstory deformation of the tower, ) of the adopted dissipation system is f = 2.8, while a standard configuration (within the same frame geometry) would have led to f = 0.63, which is almost five times less efficient.
The steel structure of the inner tower has the role of hosting the viscous devices and transferring the motion of the outer tower. For this reason, the structure does not need to be rigid, on the contrary, it is designed to be as flexible as possible in order not to alter the dynamic behavior of the masonry bell tower. The inner tower is made of four HEA 300 (European standard wide flange H-section [82]) columns continuous from the ground to the top with the strong axis oriented along the Y direction, which is the most deformable direction. Beams are made of IPE 270 (European standard narrow flange I-section [82]) profiles, with webs linked to the columns through bolted connections working as hinge restraints. In this way, the inner tower stiffness is basically governed by the four columns, working like cantilevers. As can be observed from Figure 17, the frame structure of the inner tower is actually arrested one level below the bell chamber floor. Indeed, the latter set of scissor-jack dampers is directly connected from the top of the inner tower to the bottom of the reinforced concrete slab. The connection between the inner and the outer tower is realized through a strut-and-tie steel system (Figure 17c,d) that is able to rigidly connect the towers in the horizontal plan by uniformly distributing the stresses (generated from viscous devices) on the masonry structure. At the same time, the connection is sufficiently flexible to accommodate the relative rotations arising from the dynamic motion without undergoing bending.
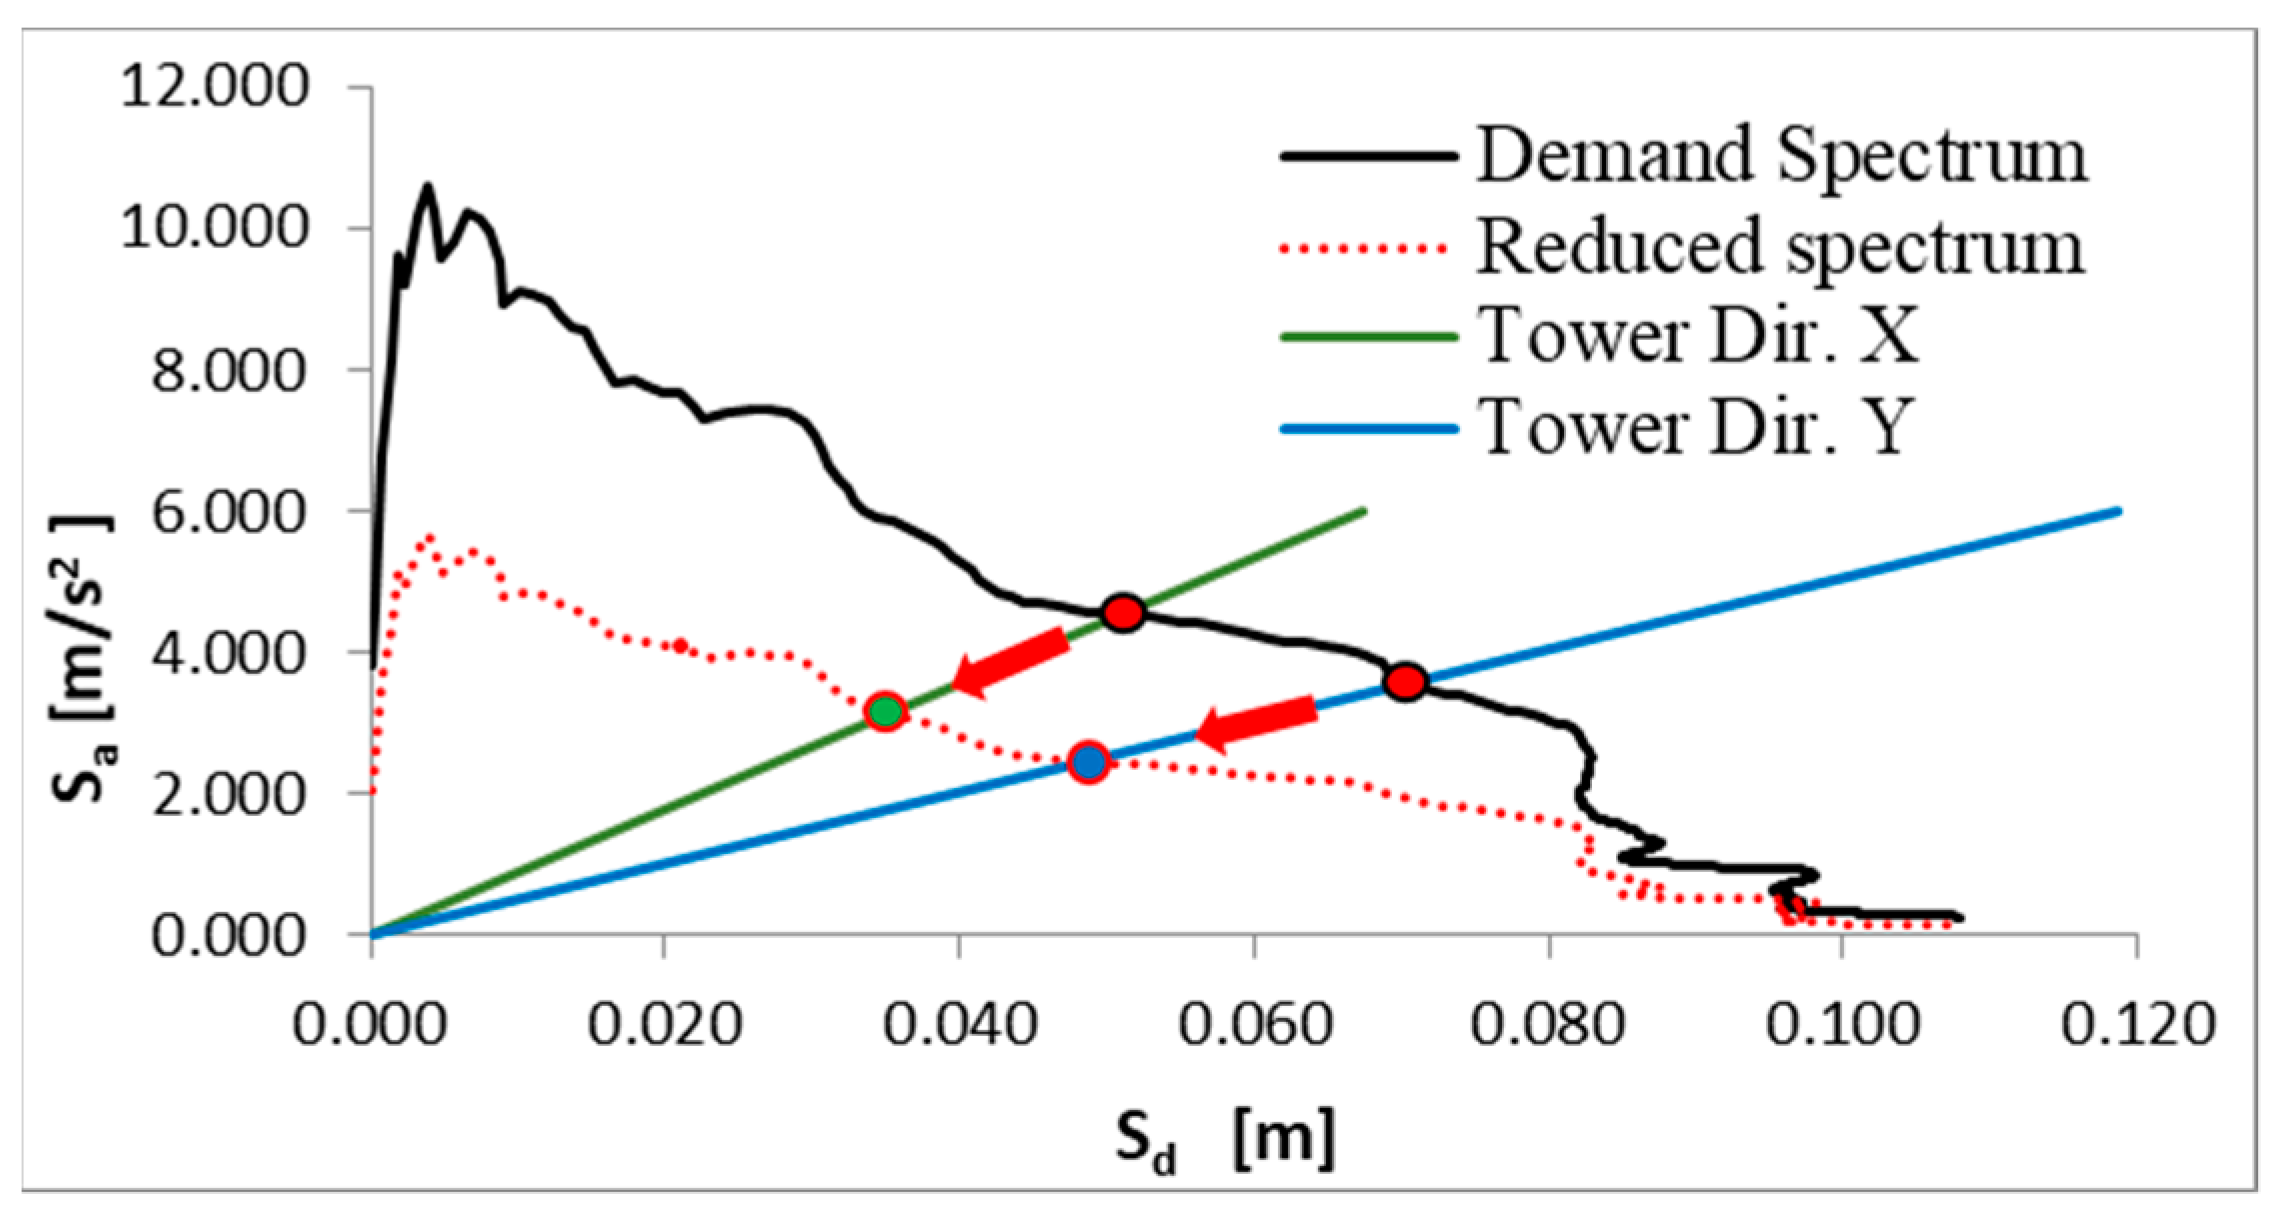
Fluid viscous dampers are designed to add supplemental damping for a total amount equal to ξd = 20%, which is high enough to improve the seismic performance of the outer tower without negatively affecting the response in absolute acceleration, which might be worse if the added damping levels are too high [83,84]. The target design strategy of the retrofit intervention is summarized in Figure 18, where the mean acceleration (Sa)-displacement (Sd) response spectrum at TR = 475 years is shown, along with the elastic system response in the two orthogonal directions (X and Y). The reduction expected in both the spectral acceleration and displacement because of the added damping is schematically depicted in the same figure.
The response of the fluid viscous dampers can be described through the following constitutive law [53,85,86]
where v is the velocity between the device’s ends, Fd is the damper force, | v | is the absolute value of v, sgn is the sign operator, c and α are the damper constitutive parameters; in particular, c is a force scale factor, and α describes the degree of nonlinearity of the damper force-velocity response.
Linear viscous dampers (α = 1.0) are considered in this application. Once assigned the target damping ratio (ξd = 20%), there are infinite combinations of dampers’ viscous coefficients able to fulfil such a requirement. Indeed, several methods are available [83,87,88] for distributing the dampers at the various stories of the building. Some methods, often referred to as heuristic [83], are based on problem-specific knowledge of the system behavior, e.g., the viscous coefficients can be uniformly distributed or distributed in proportion to the story stiffness or shear. In the present work, the size of the dampers (viscous coefficients c) was set according to a story-shear proportional distribution approach (based on the first mode of vibration), for its simplicity and given its acknowledged suitability [89].
The shear value Vk at a given level of the masonry tower can be assumed as proportional to the parameter Sk, which is expressed as follows [87,89]:
where is the mass of the i-th level of the tower, and is the horizontal modal (first mode) displacement of the i-th level. Based on the hypothesis above, the formula for distributing the damping coefficients to each tower level is provided.
in which the meaning of , , and is already provided above, while the other terms are: , the relative displacement between the ends of the damper i measured in the horizontal direction; , the fundamental vibration period corresponding to the first mode; , the magnification (efficiency) factor of the damper at the i-th level; and , the number of dampers per level and direction. By specializing the formula of Equation (6) to the present case study (see parameter values in Table 2), one obtains the dampers’ properties as summarized in Table 3.
The finite element model of the masonry outer tower, performed in SAP2000 v.20 and presented previously, is integrated with the model of the inner steel tower equipped with fluid viscous devices. Steel elements are modelled as frame elements, while the dampers are introduced as a link element with an “exponential damper” property. The whole 3D model is shown Figure 19.
3.4. Structural Analyses for the Evaluation of the Expected Structural Performance after Seismic Upgrading
The structural seismic performance of the retrofitted tower was evaluated and compared to the seismic response of the structure before the intervention. Nonlinear dynamic (time-history) analyses were performed in SAP2000 by exploiting the solution algorithm of fast nonlinear dynamic analysis (FNA) [72], which is recommended for reducing the computational cost during time-history analysis of structural models with a predefined limited number of nonlinear members; in this specific case, all nonlinearities are lumped within properly defined link elements, thus, the FNA is well-suited. A constant 2% modal damping was assigned to account for the inner dissipative capacity of the masonry structure whereas the supplemental damping contribution provided by viscous devices was directly evaluated during FNA. A set of 20 seismic simulations were performed at the intensity level with TR = 475 years, and a pair of ground motion time-series (X, Y accelerograms) was used in each case of analysis.
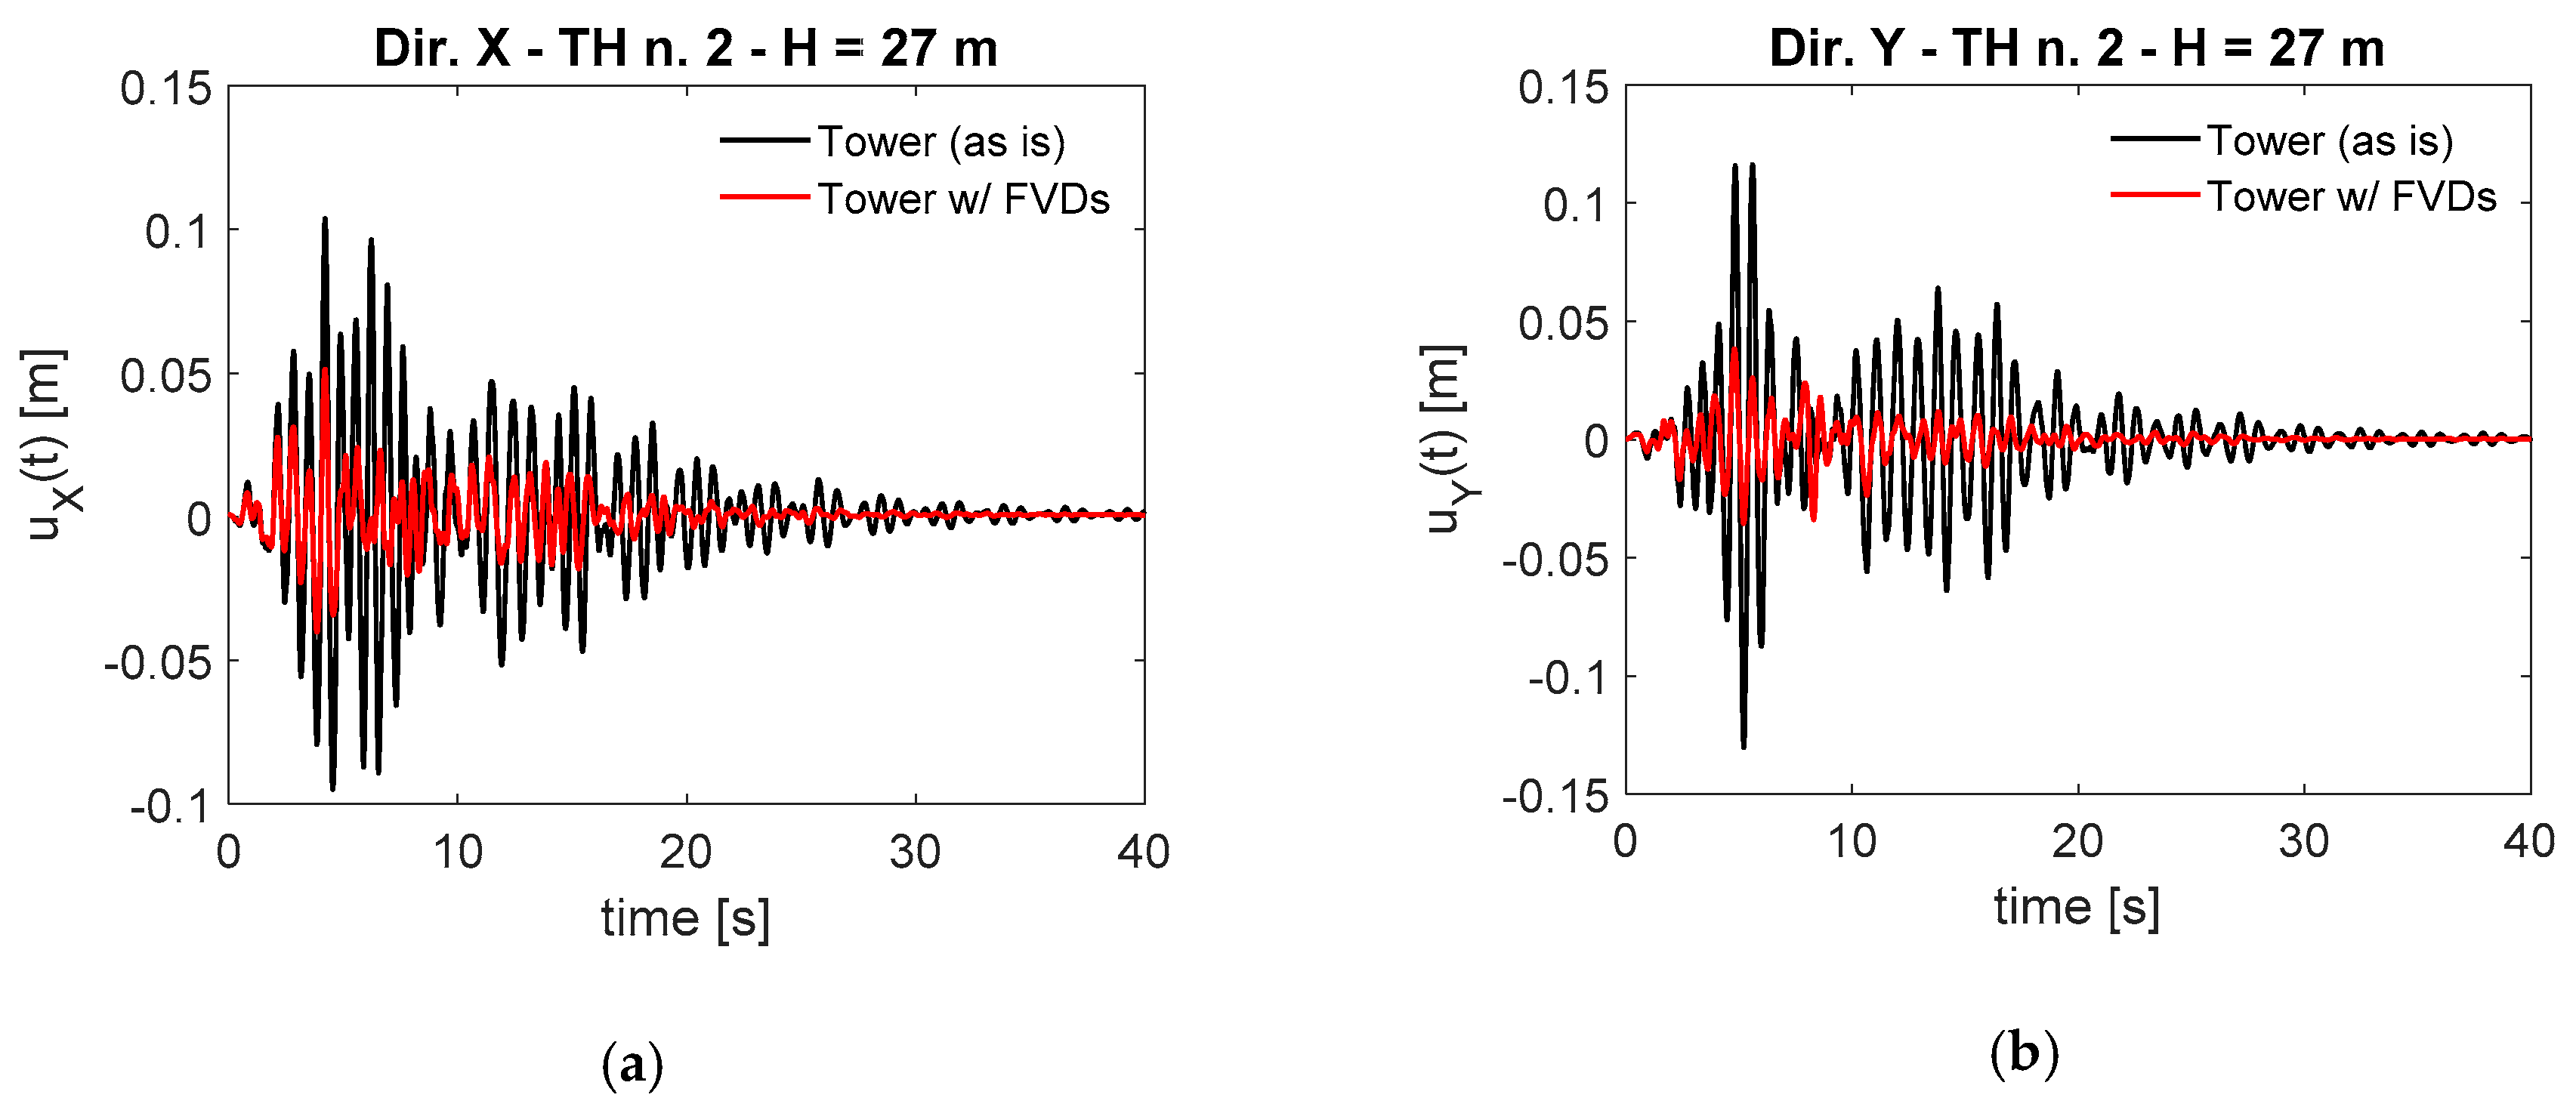
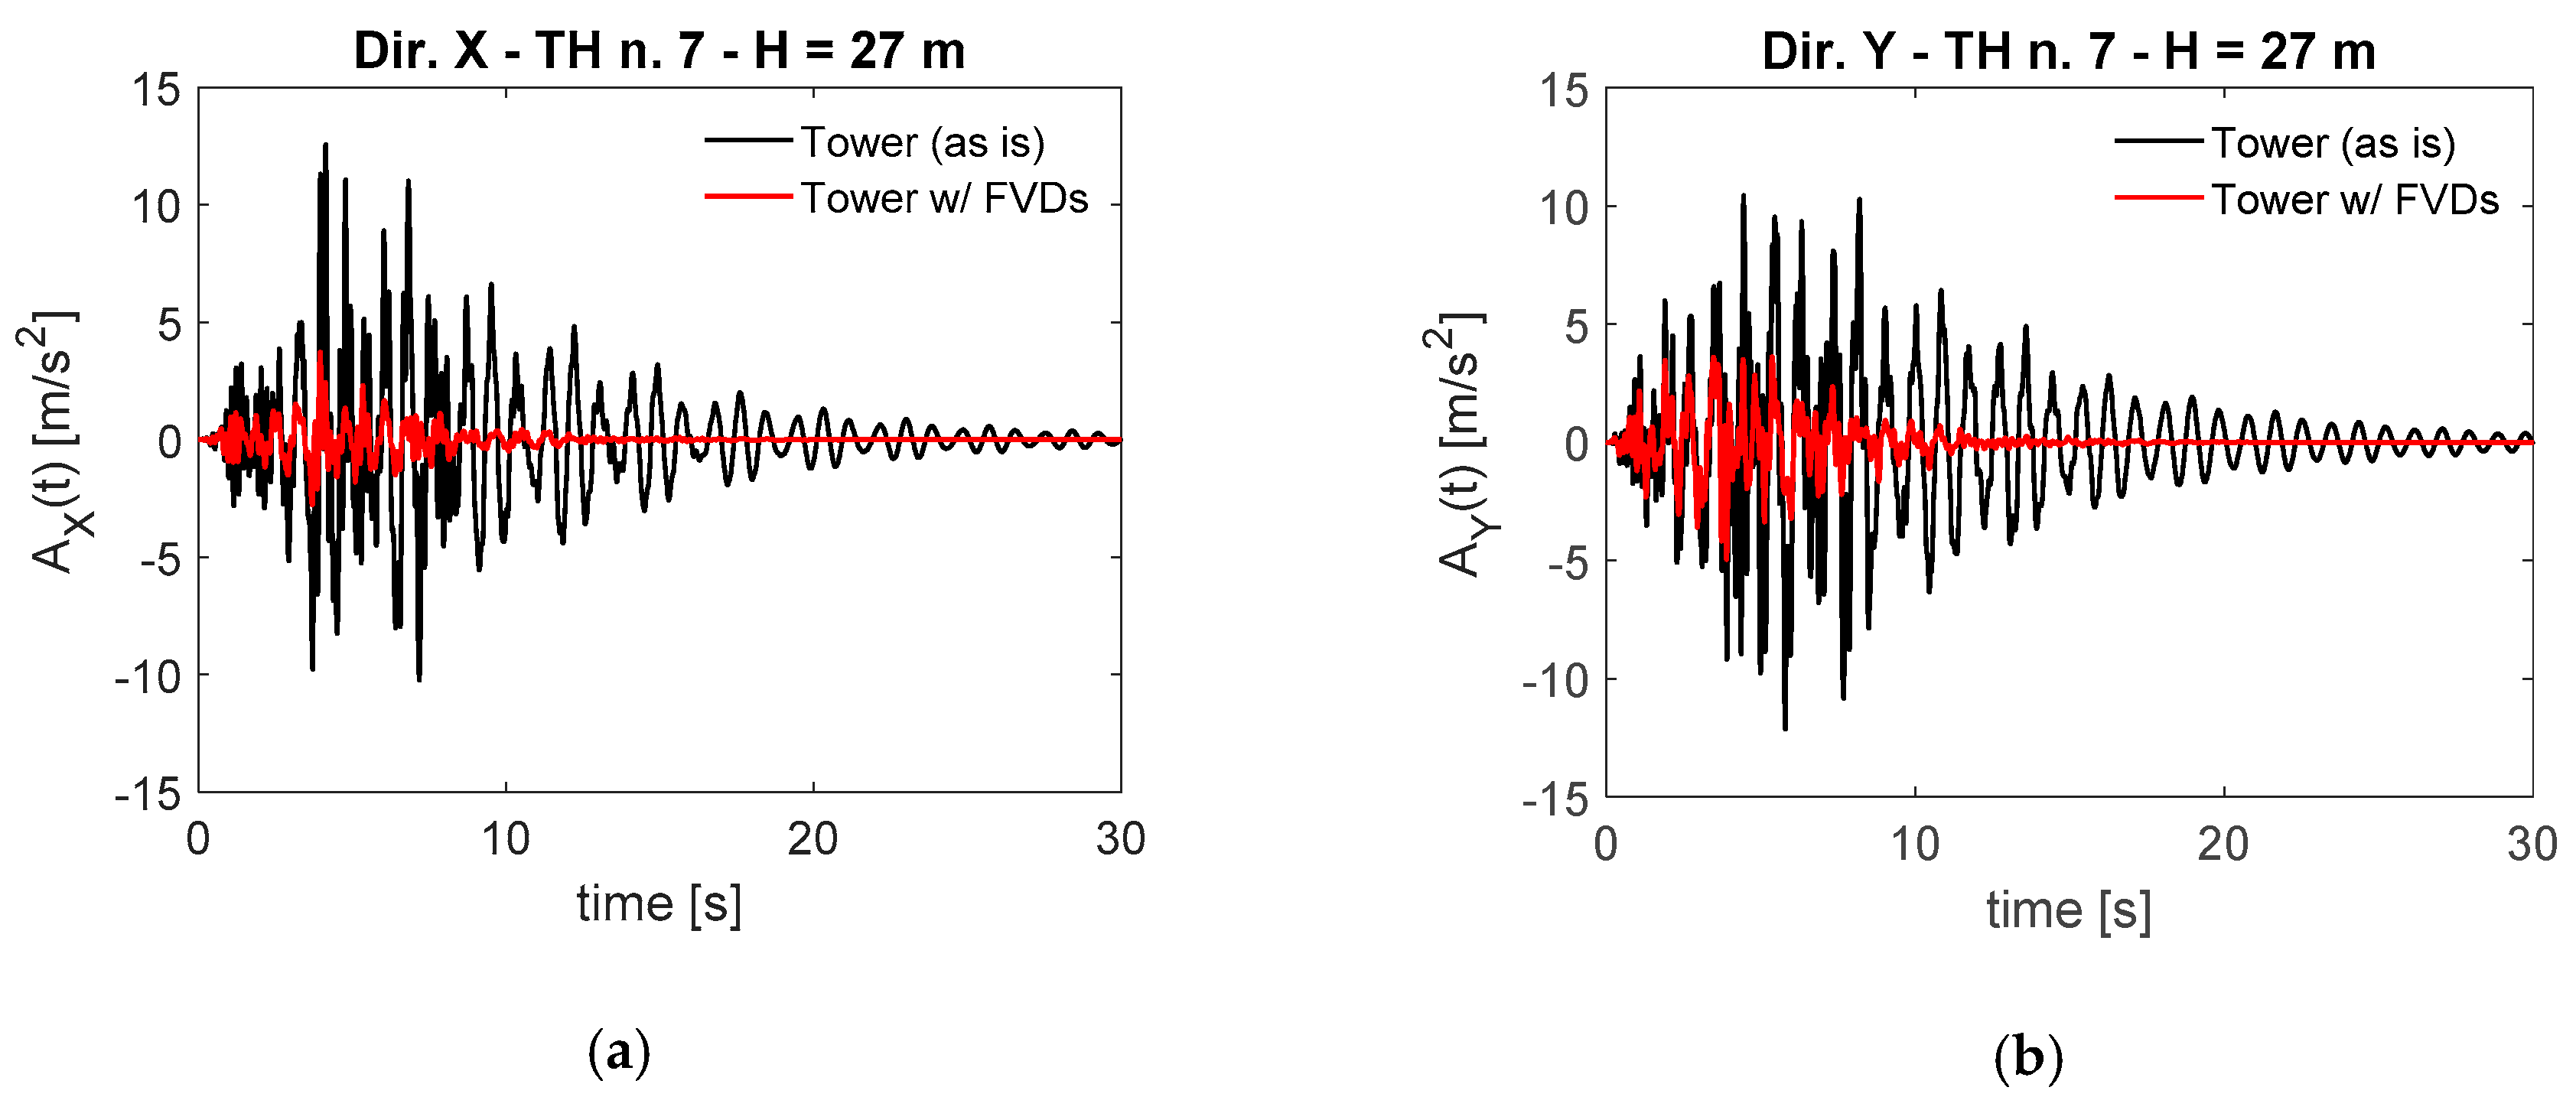
A comparison between the seismic performance before and after retrofitting was done using the following methods: a direct comparison of the response time history in terms of displacements and absolute accelerations; charts of the maximum response quantities at different levels of the tower; and charts of the maximum stresses on the masonry structure. The response time series of the displacements along X and Y are shown in Figure 20. The node monitored was placed at the top of the tower (H = 27 m, as shown in the scheme of Figure 17) and the case of analysis time history (TH) n. 2 was considered. As can be observed, the response after the retrofit intervention is almost halved with respect to the original structure. For the same node, the response time series of the absolute accelerations are plotted in Figure 21, this time referring to the case of analysis TH n. 7. Again, it can be observed that the response of the retrofitted tower is notably reduced.
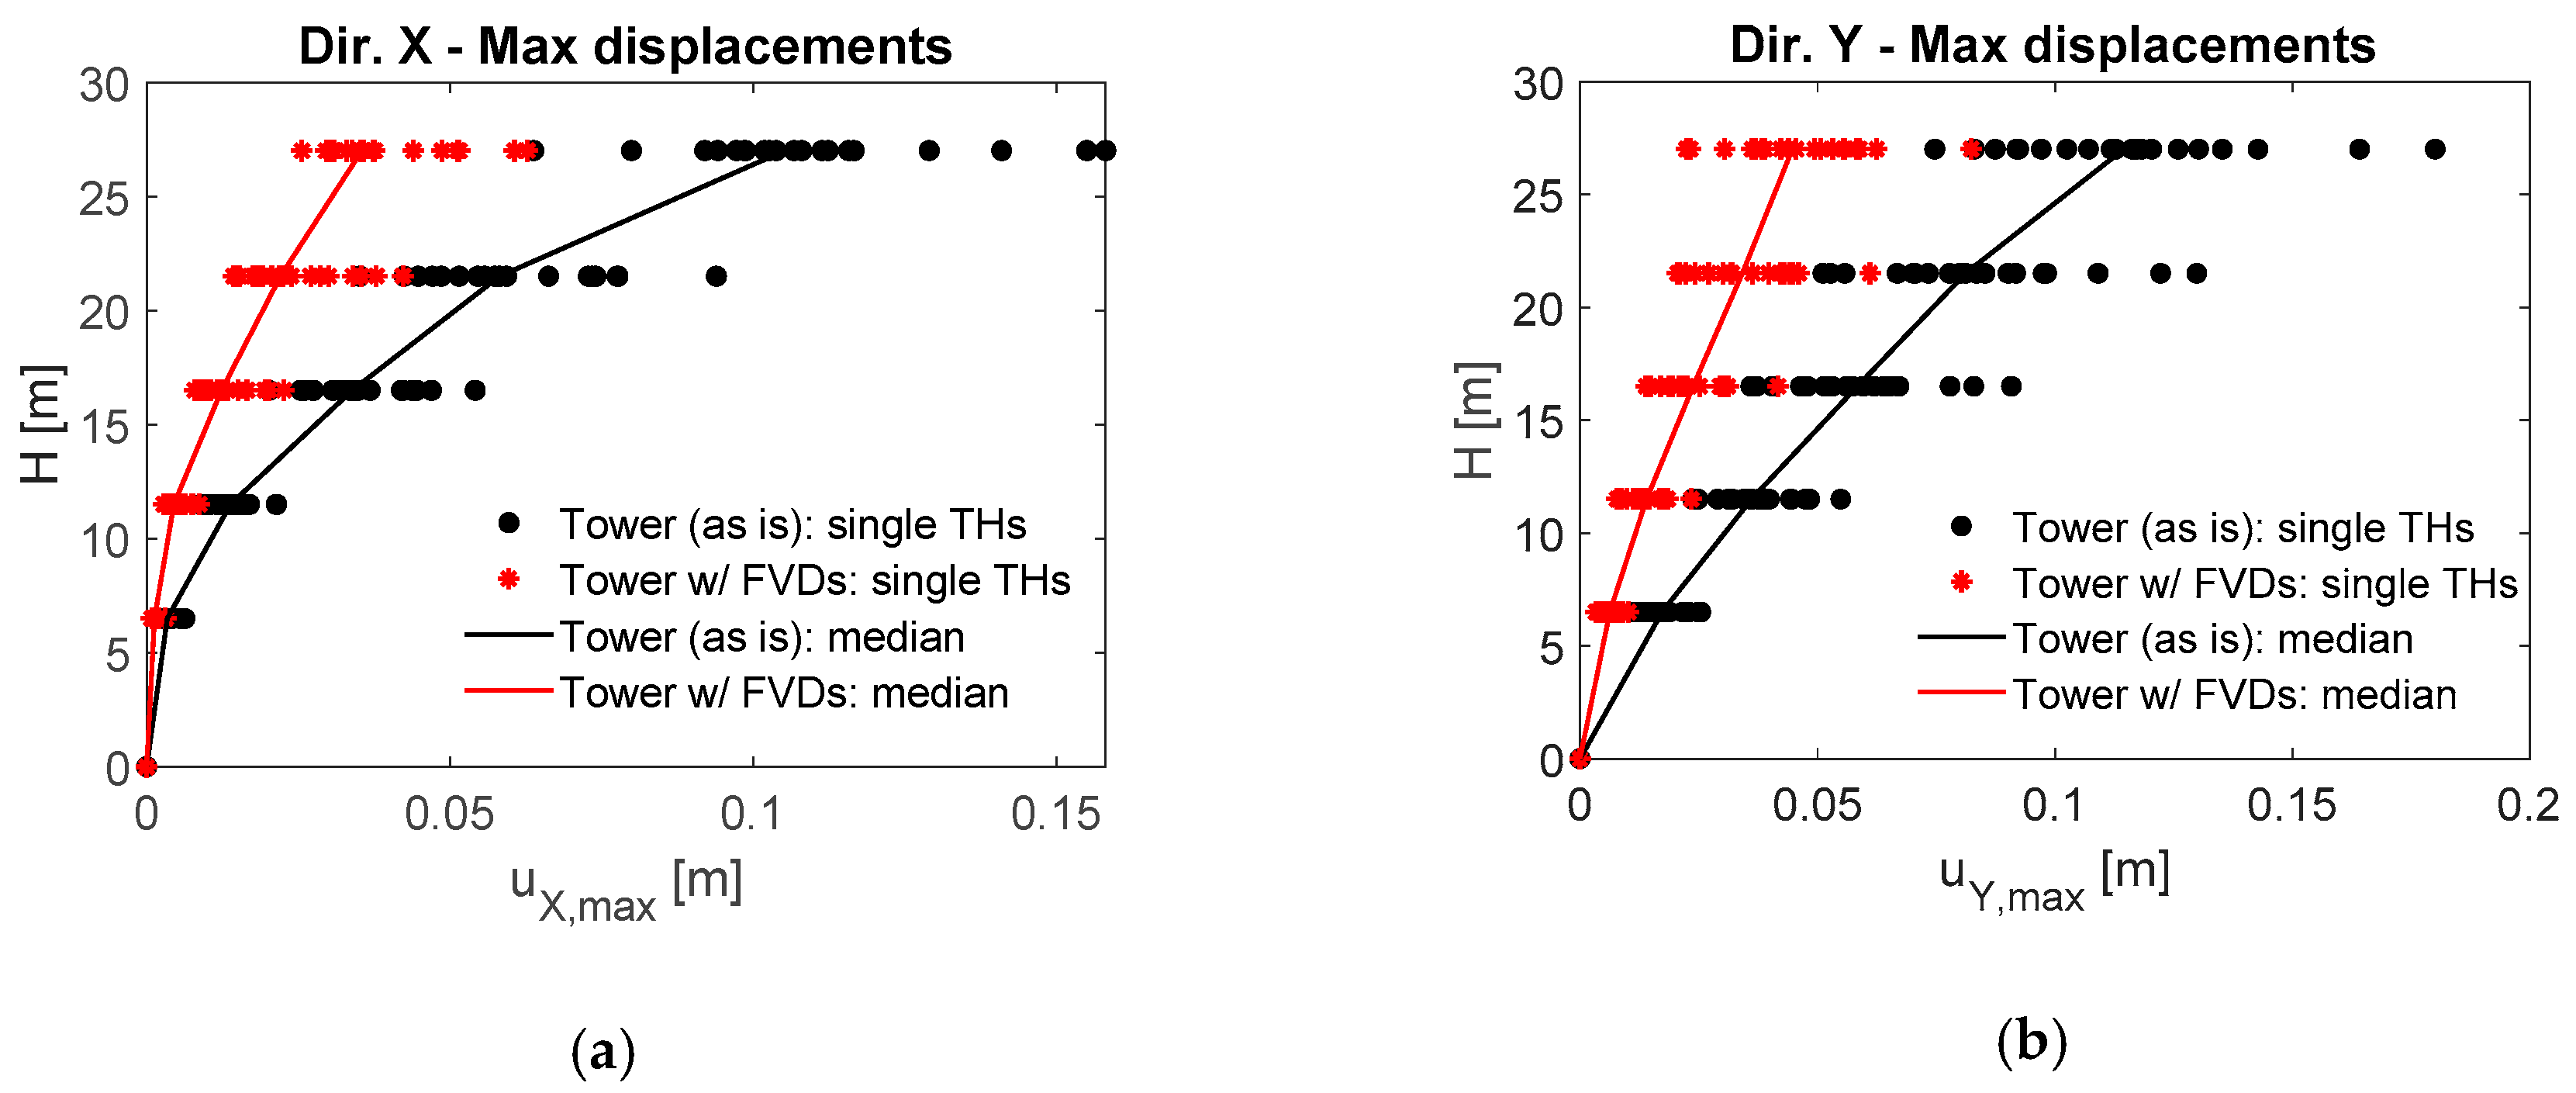
The efficiency of the proposed retrofit strategy is more systematically assessed in the following charts. In Figure 22, the maximum displacement profiles along the height of the tower, before and after retrofitting, are compared. In particular, the responses of single time-history analyses (THs) are plotted by colored markers (black dots for the “as is” structural system, red stars for the tower with FVDs), while the median trends are superimposed by using solid lines (black and red, based on the predefined colors convention). According to the presented results, the following comments are provided: (1) limited displacements are observed over the first 10.00 m along the X direction (both with and without FVDs) because of the retaining effect exerted by the adjacent building; (2) the dissipative tower (with FVDs) is effective in reducing the structure’s seismic deformation, in both X and Y directions; and (3) the median maximum top displacement experienced by the tower with FVDs is approximately 0.04 m, about 55% less than that of the non-retrofitted tower. Moreover, although a more refined nonlinear model would be required to properly assess the damage state of the tower, some preliminary comments can be provided based on the interstory drift values resulting from the numerical simulations. Indeed, at the maximum tower deformation, a median maximum drift value of about 0.01 is observed on the tower before the intervention, whereas in the retrofitted conditions this value is reduced to 0.004, with the latter value conventionally assumed to characterize the shear strength limit capacity of masonry structures (0.006 is usually related to the flexural capacity) [79].
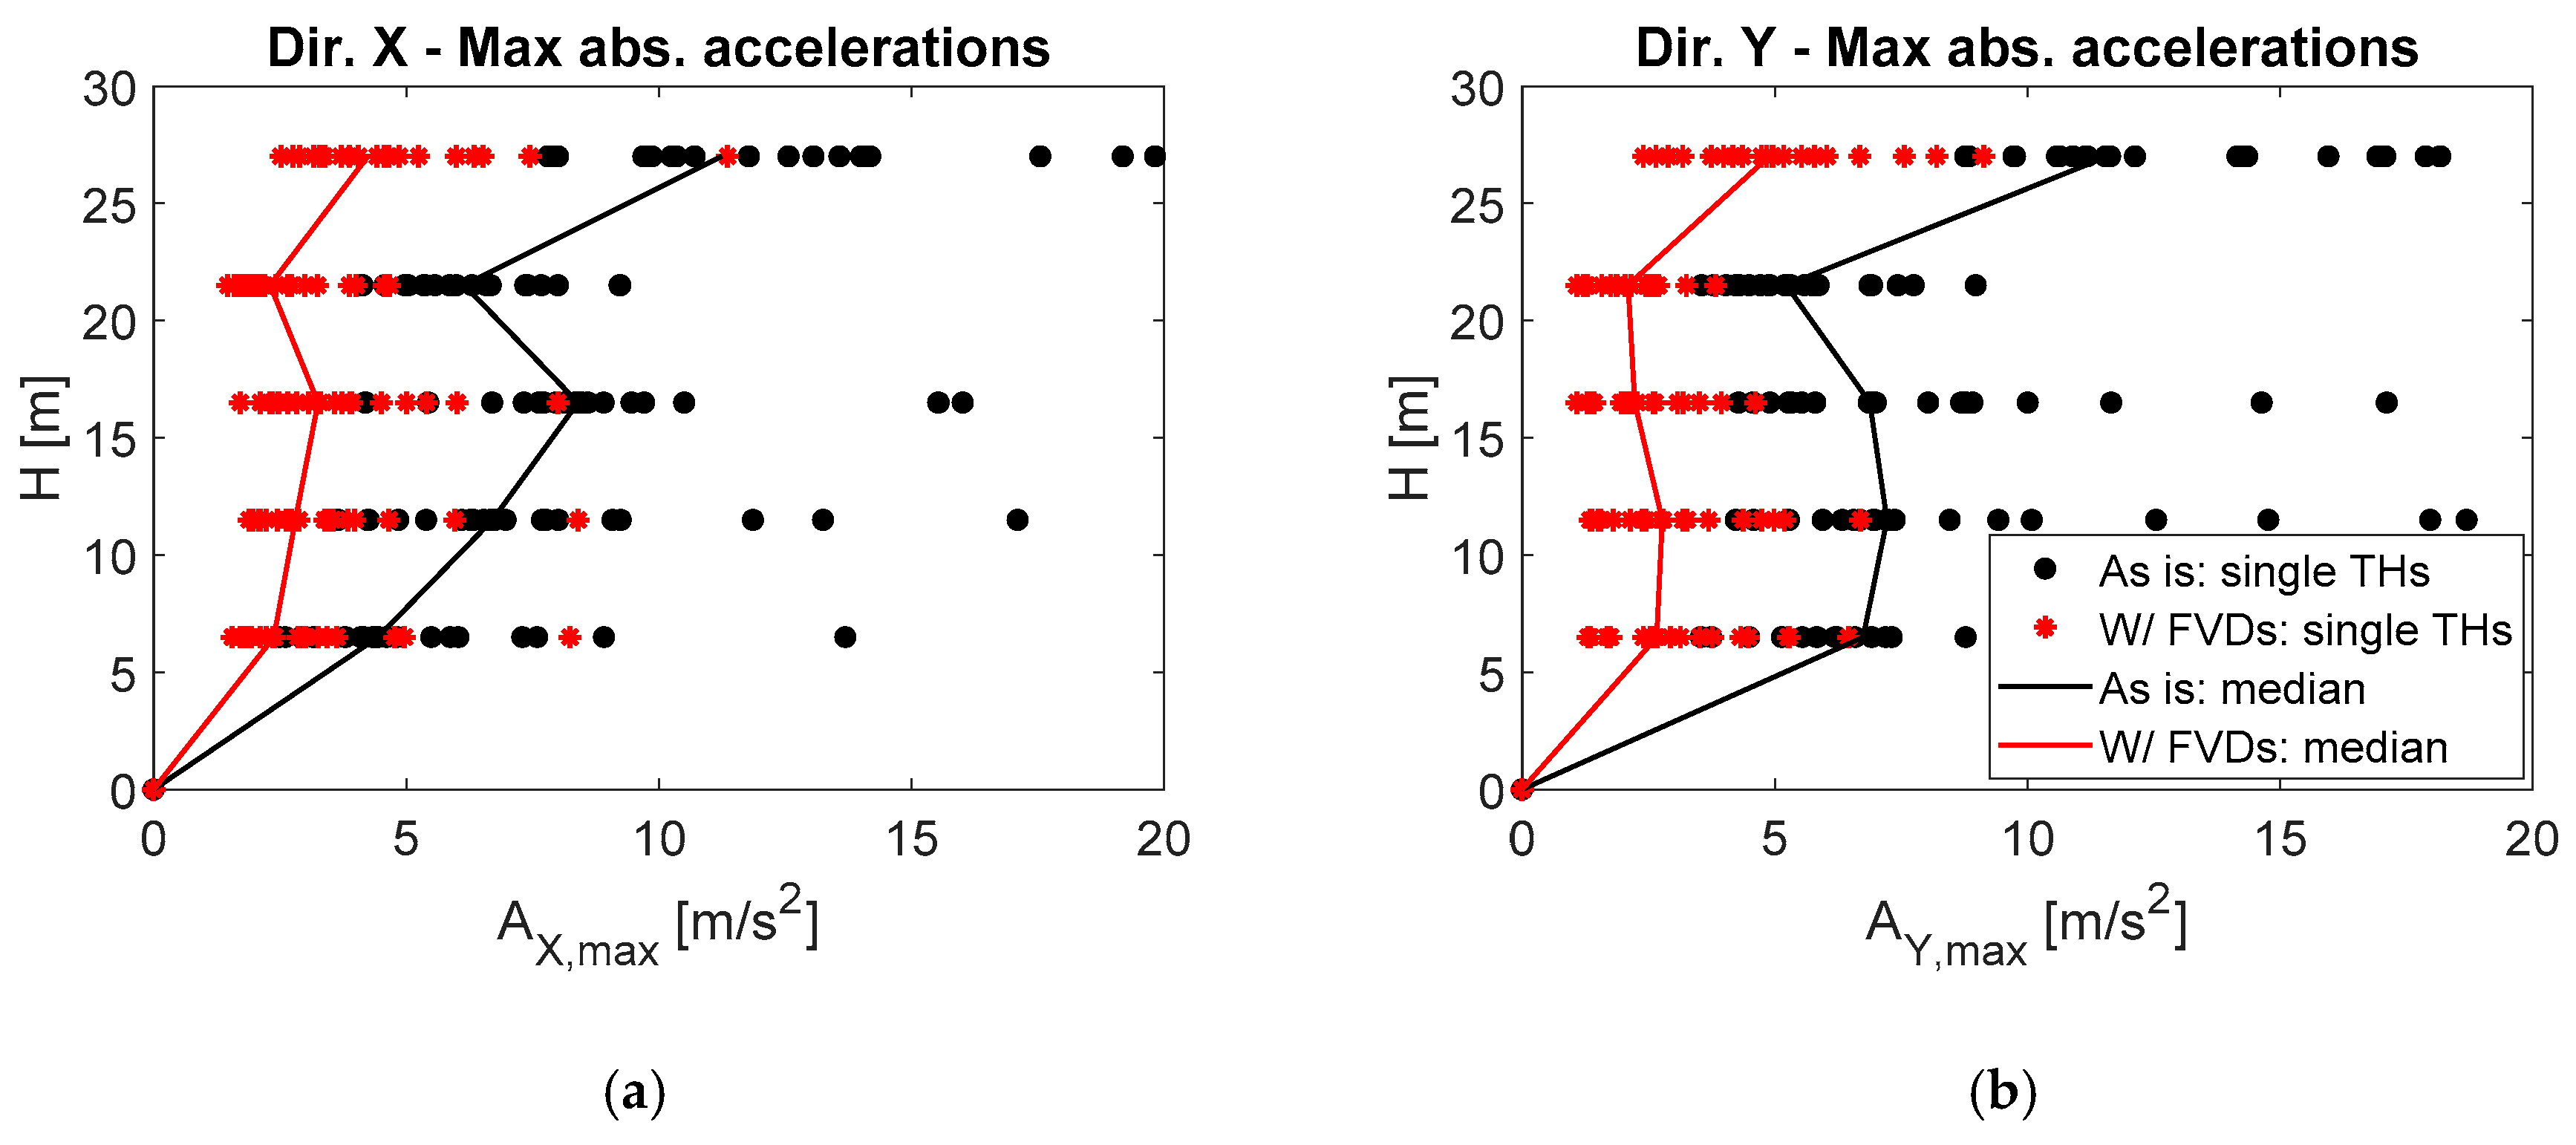
In Figure 23, the maximum absolute acceleration profiles along the height of the tower, before and after retrofitting, are compared. The same colors and notation presented above are used. Based on these charts, the following comments are provided: (1) the dissipative tower (with FVDs) is effective in reducing the structure seismic-induced absolute accelerations at all levels, in both the X and Y direction; (2) the abrupt rise observed above the 21.50 m is due to the dissipative tower interruption at that level, therefore the whole mass deriving from the roof and the bell chamber is not directly linked to the dissipative steel tower; and (3) nevertheless, the upper part of the tower can benefit as well from the reduction in demand that results from the devices’ energy dissipation.
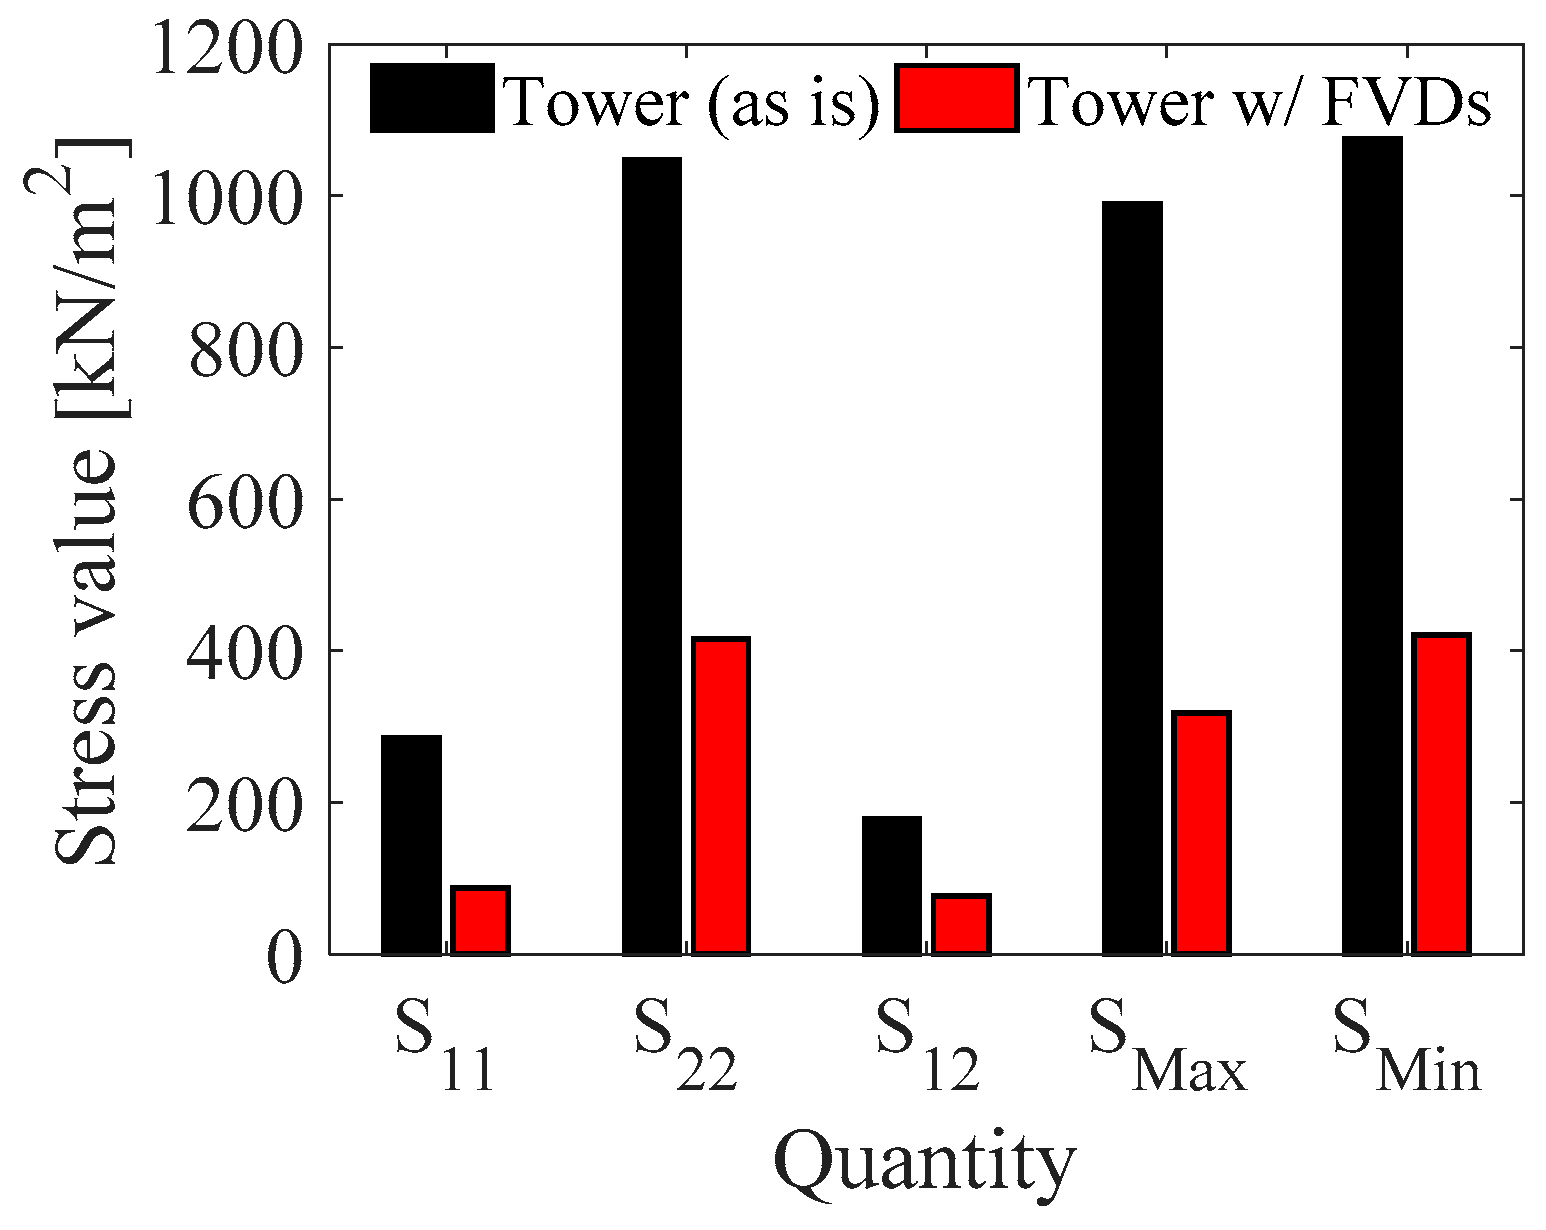
The influence of the dissipation system on the state of stress experienced by the masonry structure was also analyzed. A single shell element at the base of the tower was monitored and the corresponding median stress values (of the maxima stemming from the 20 TH analyses) are summarized in Figure 24. This chart uses a bar plot to compare different components of the stress tensor before (black bars) and after retrofitting (red bars). Specifically, the following stress components were observed: S11, maximum (tension) direct horizontal stress; S22, minimum (compression) direct vertical stress; S12, maximum absolute shearing stress; SMax, maximum principal component; SMin, minimum principal component. A significant reduction in terms of all the stress components can be observed in the chart of Figure 24.
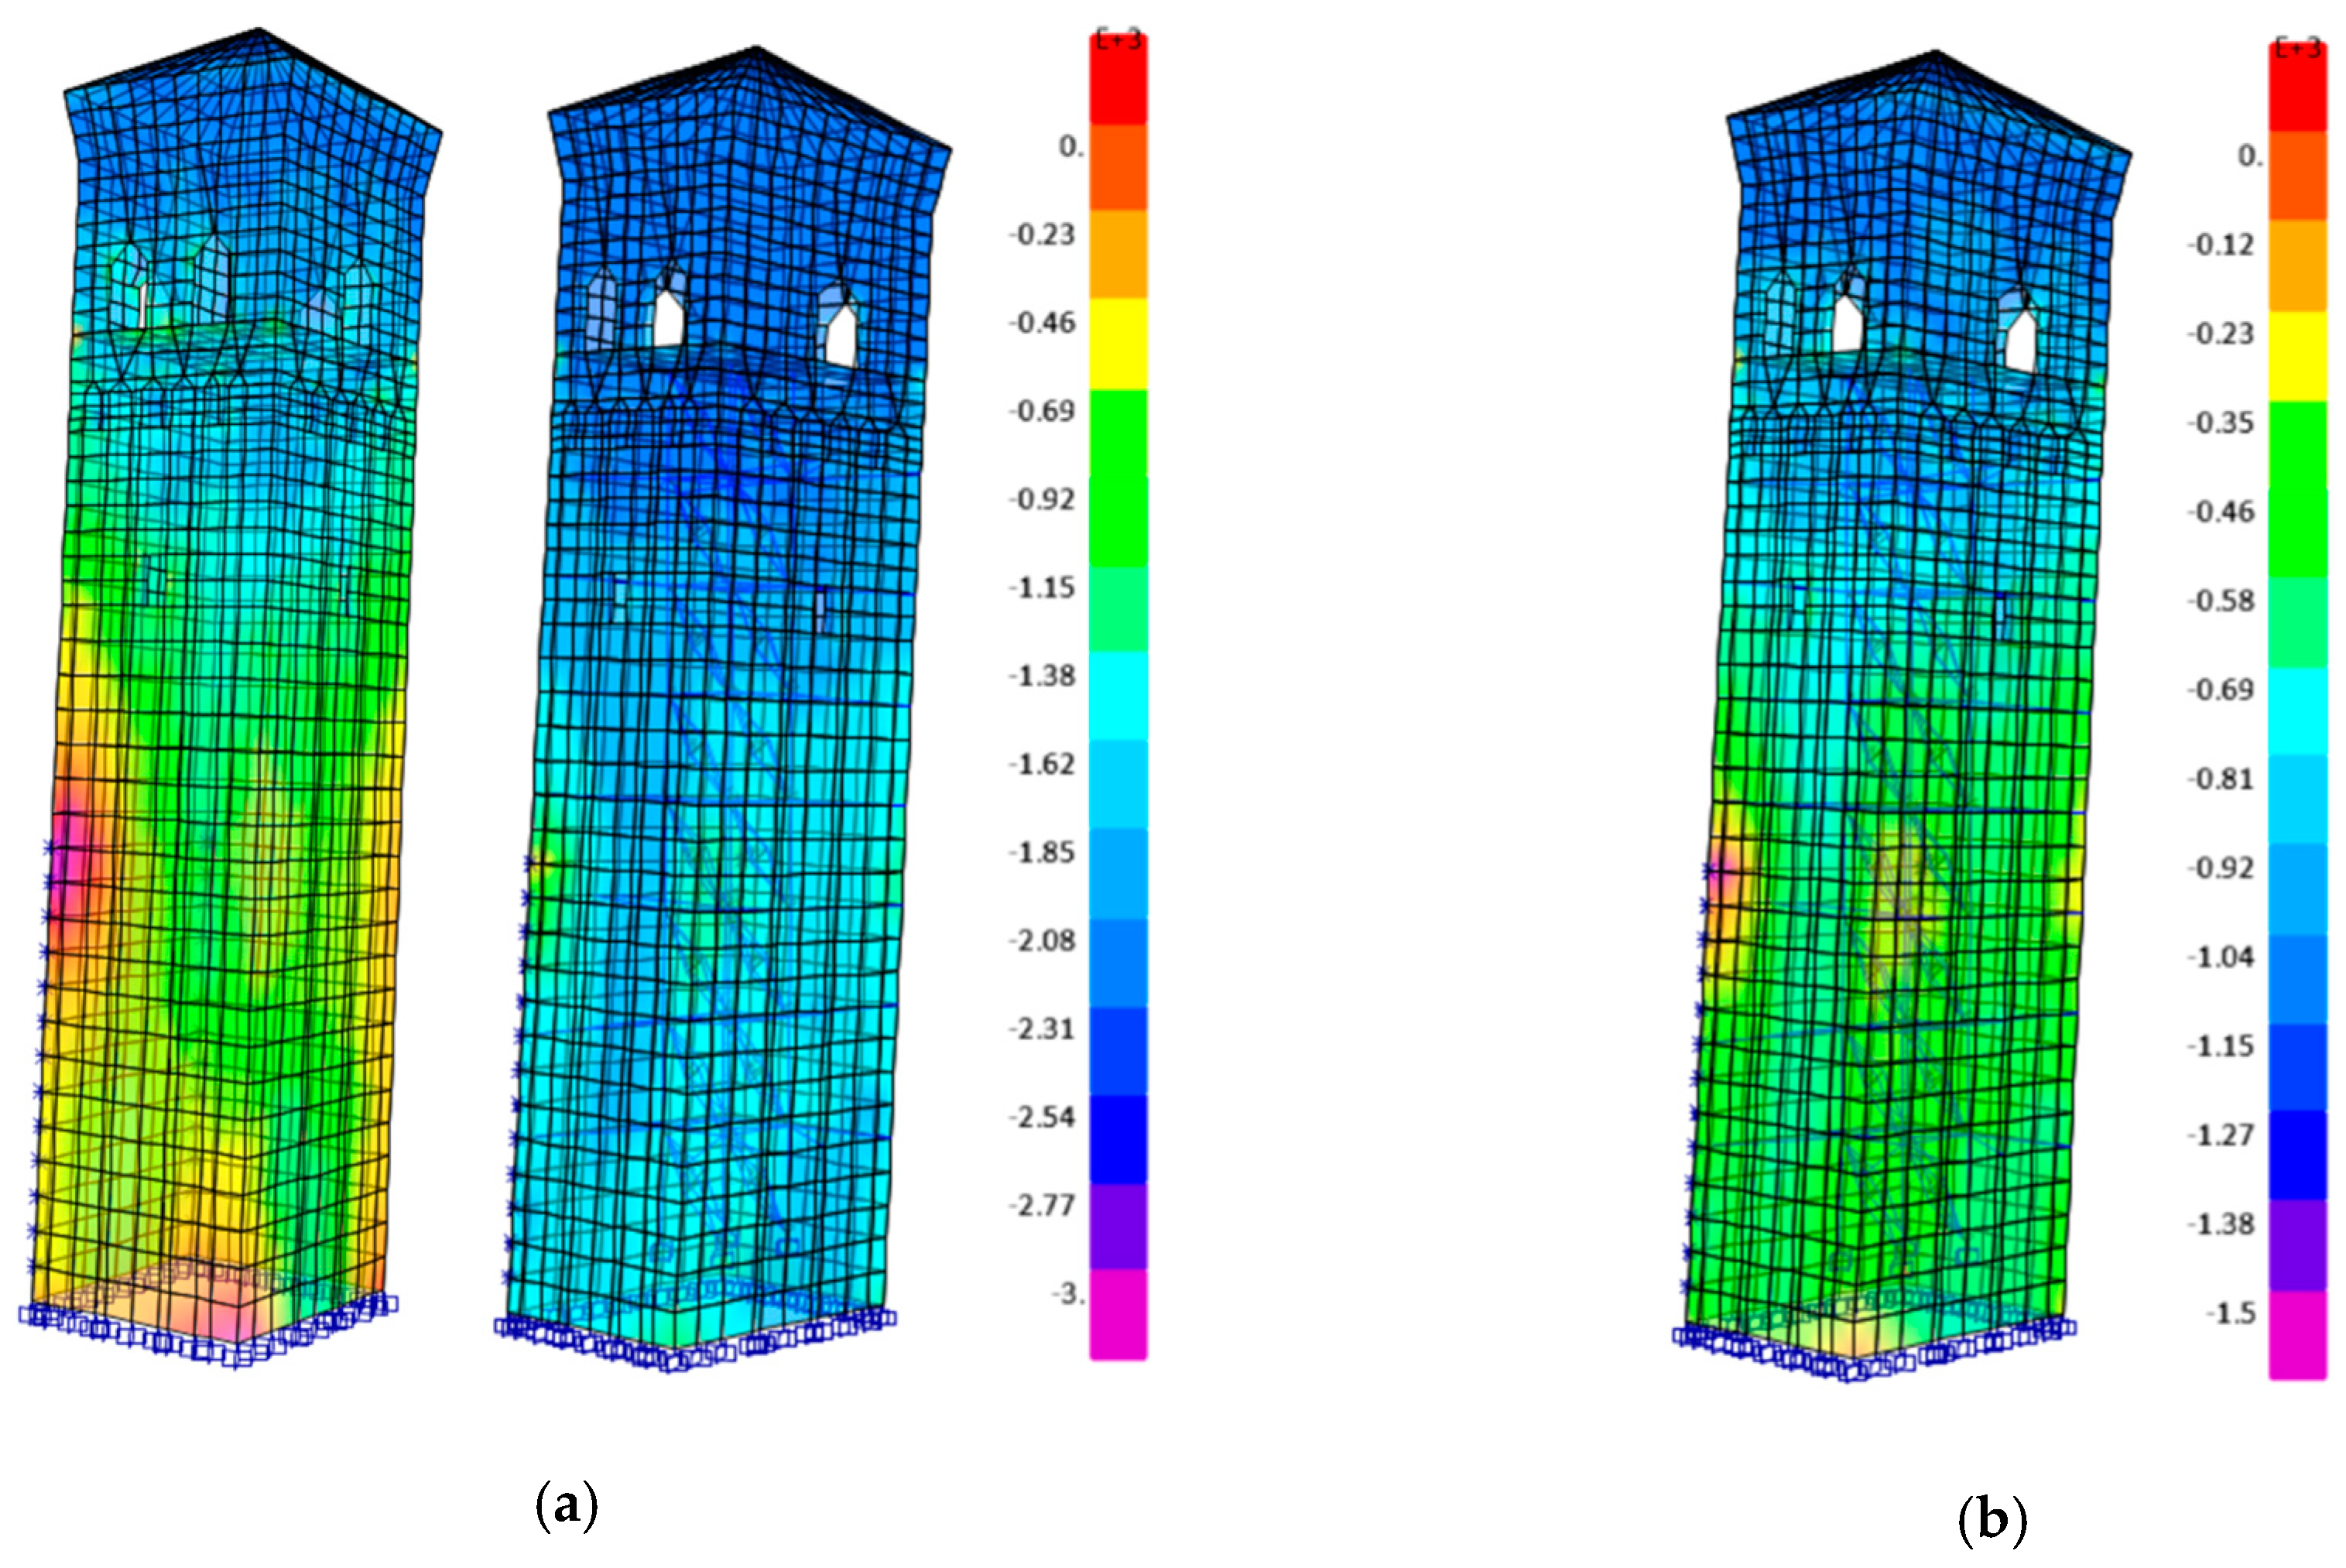
For the sake of clarity, a contour plot of S22 (vertical compressive stress) for the whole tower is presented in Figure 25. In particular, in Figure 25a, the tower models before and after retrofitting are shown together by using the same contour stress interval, with shades of color going from red (no stress) to magenta (−3000 kN/m2). This image highlights the overall stress reduction on the tower achieved when FVDs are installed. For details of the actual stress level of the retrofitted structure one can refer to Figure 25b, in which the tower after retrofitting is shown alone with a specific contour interval setting going from red (no stress) to magenta (−1500 kN/m2). The notable reduction in the stresses on the retrofitted tower is evident.
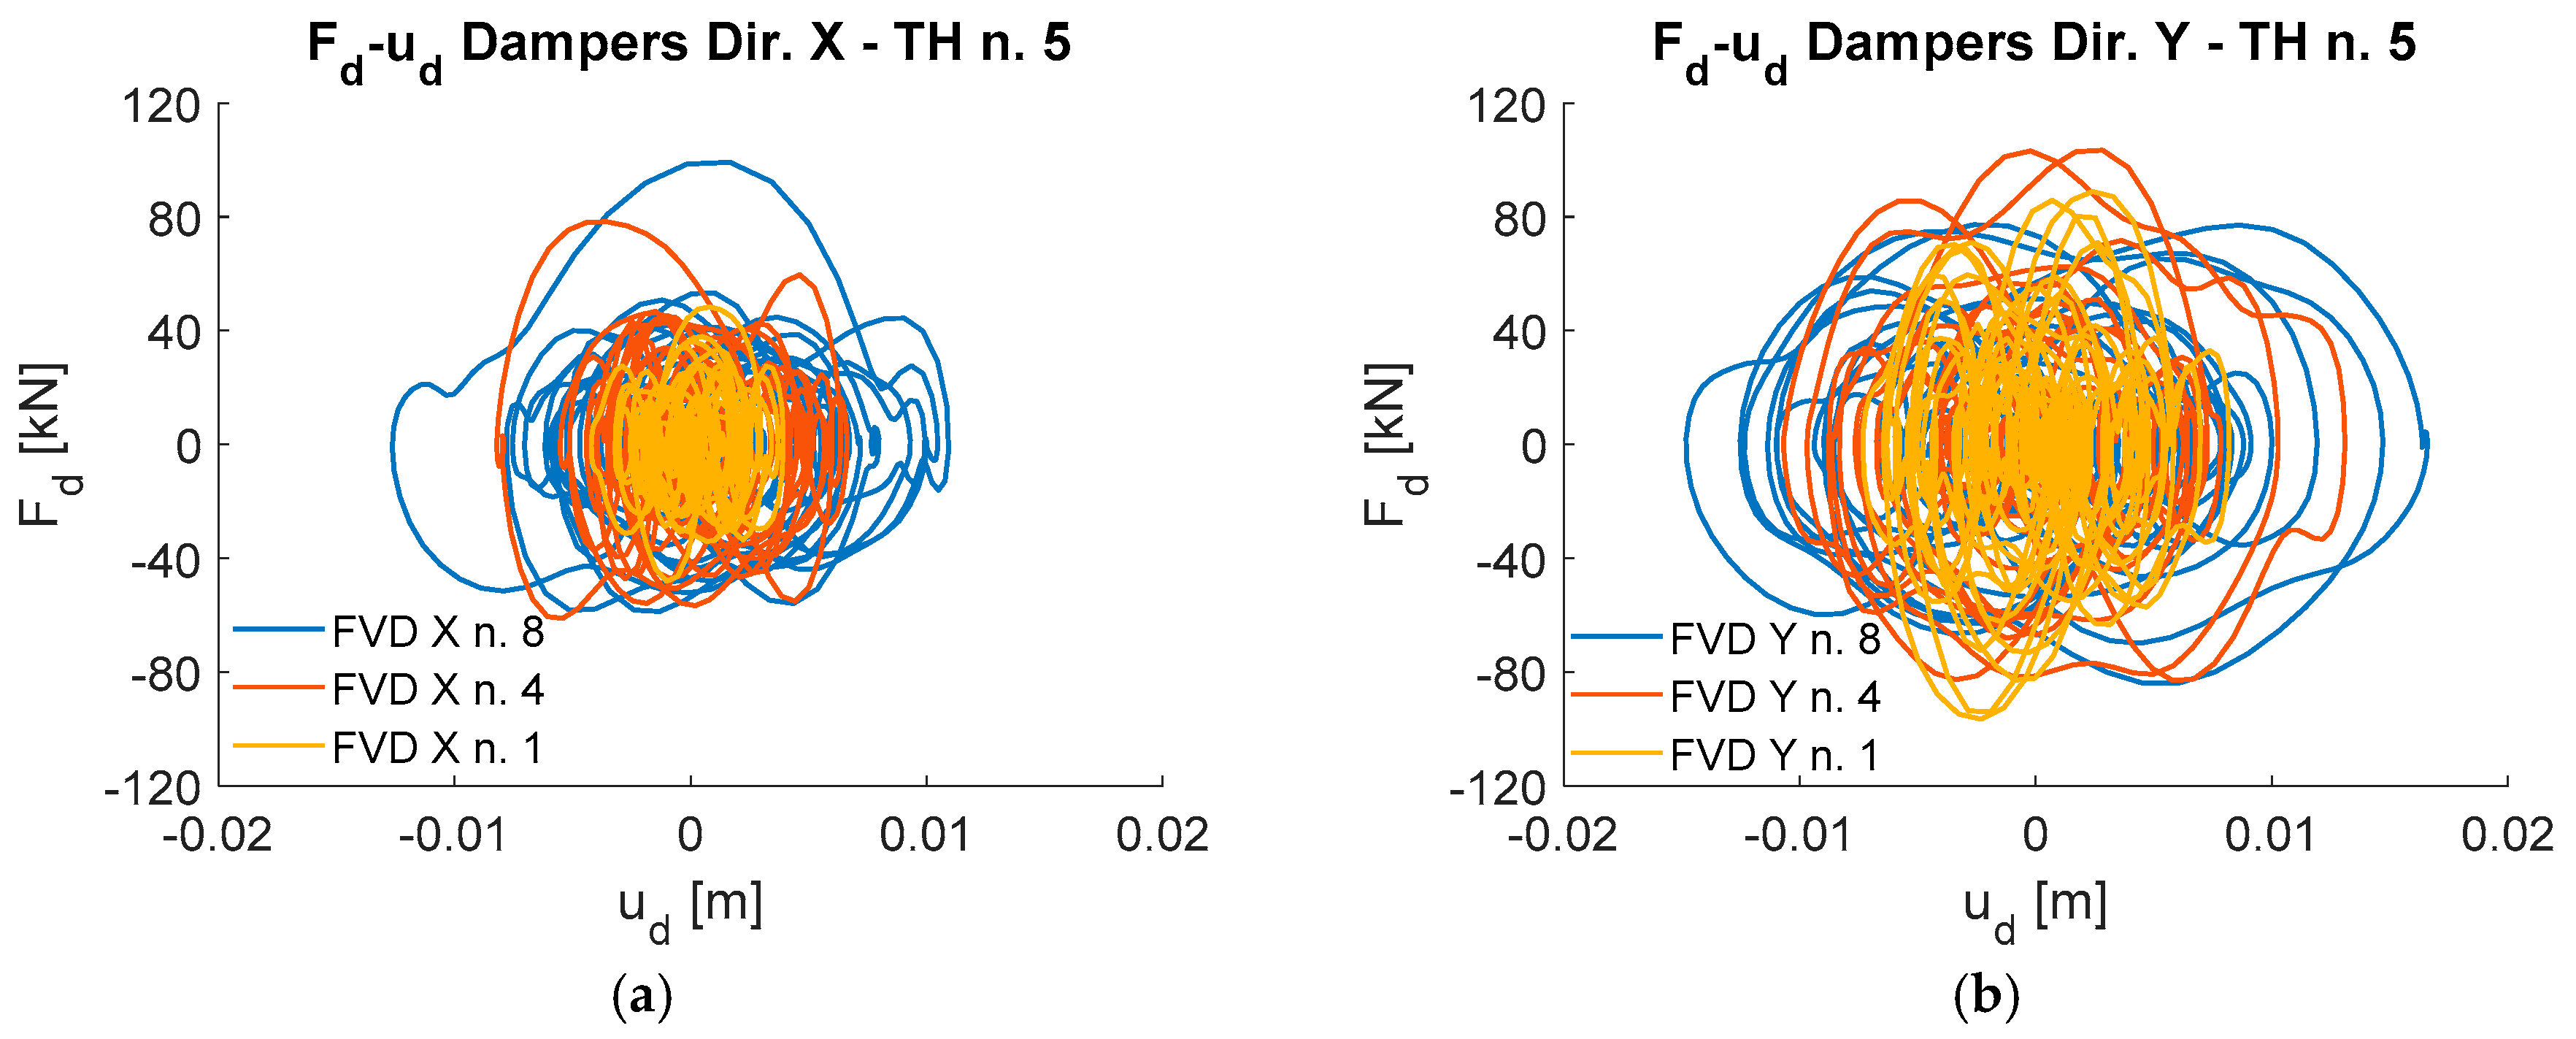
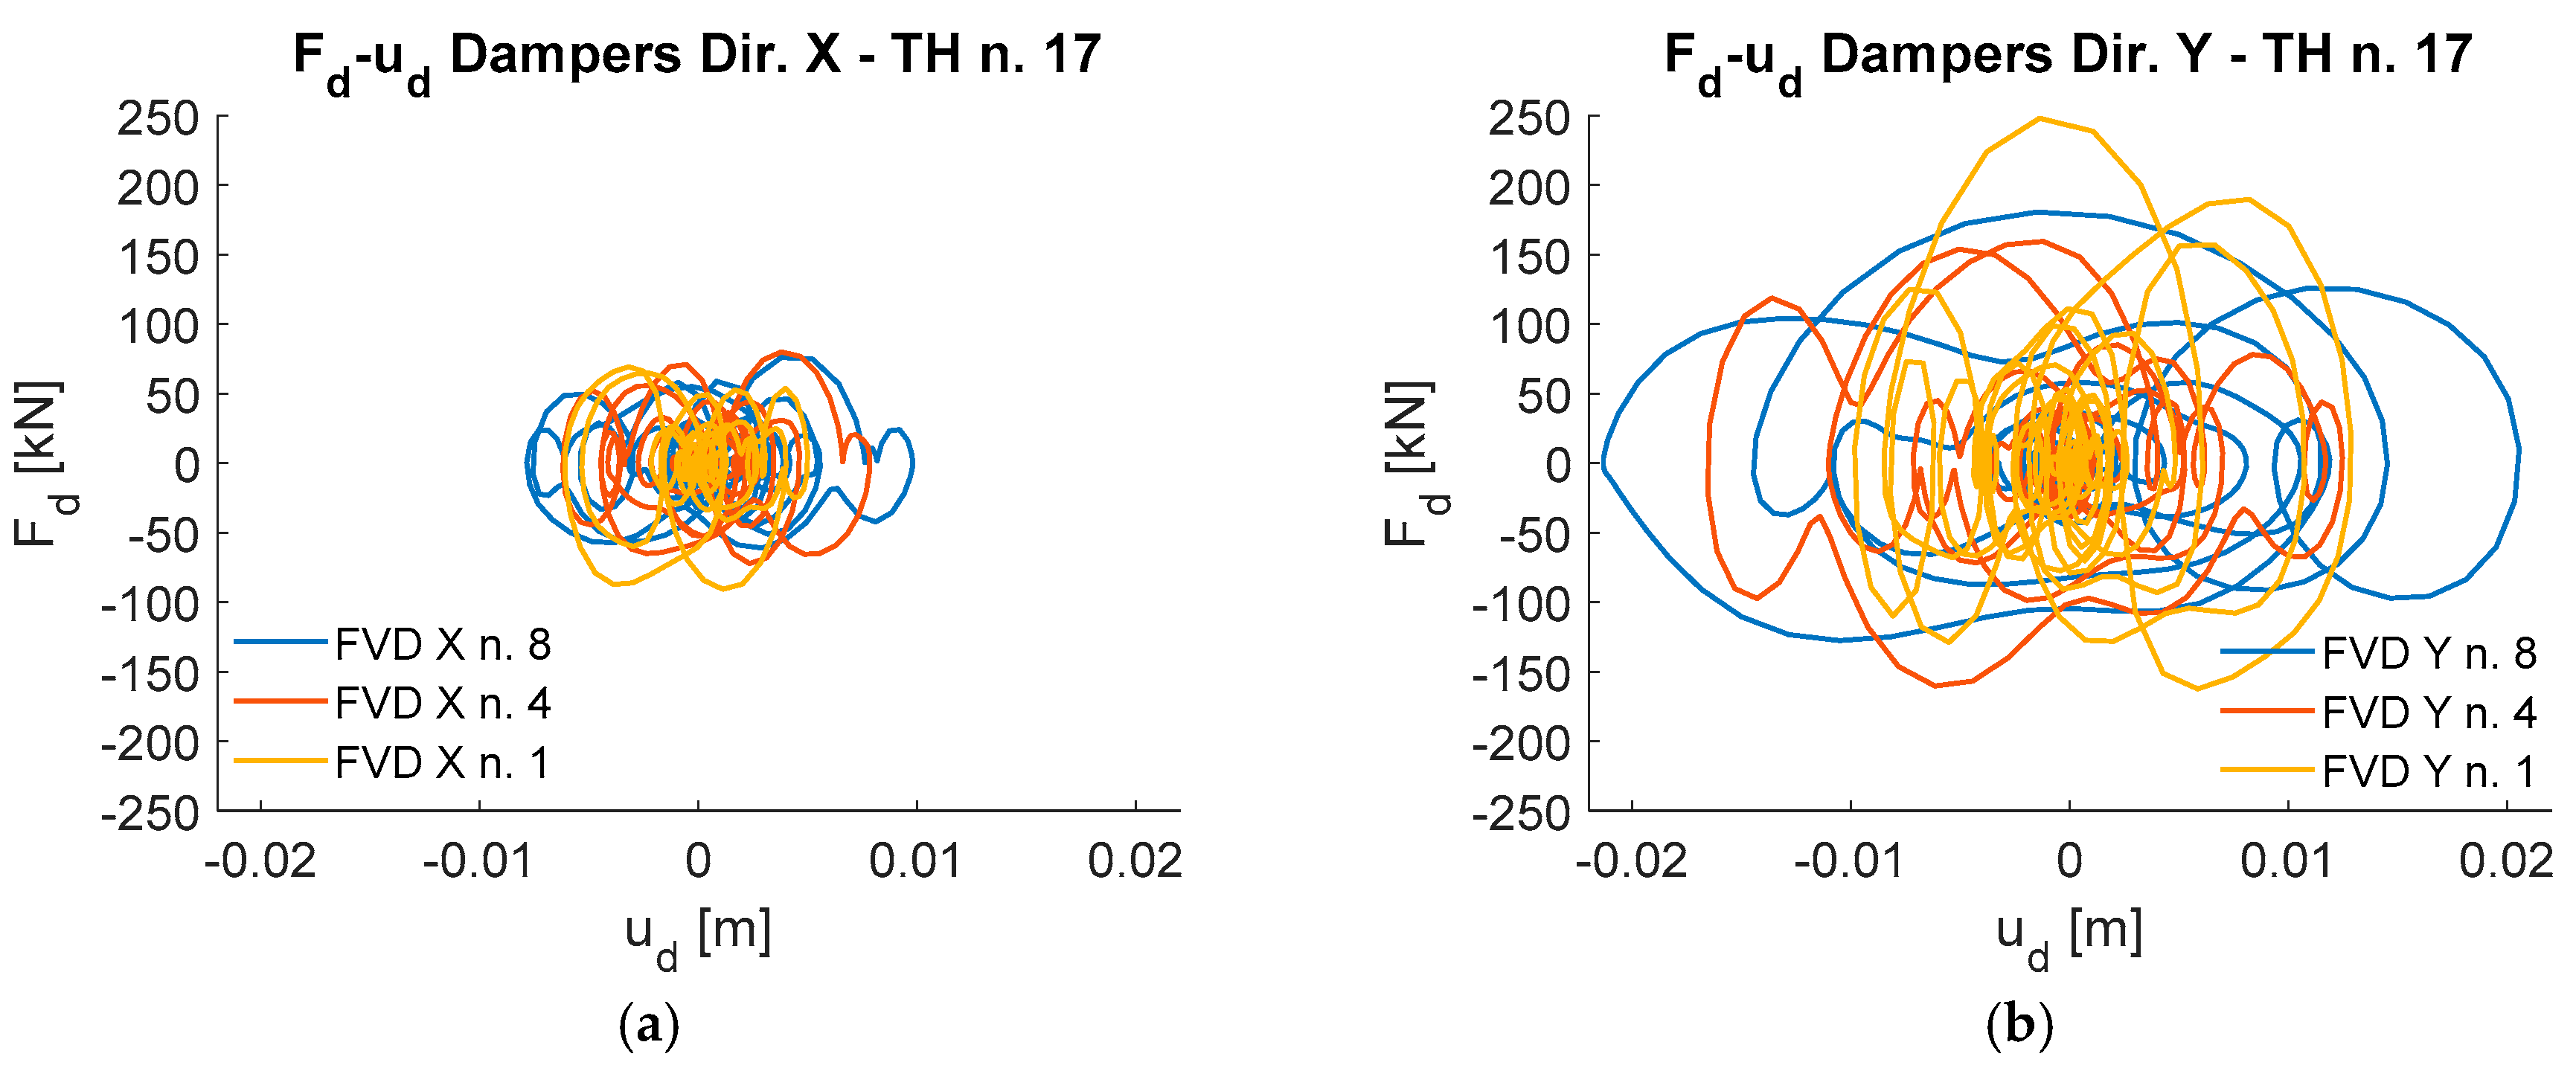
To conclude the presentation of the results with the life safety limit state, several dampers’ force-deformation hysteresis cycles are presented in Figure 26 and Figure 27, for dampers located at different levels of the inner tower (i.e., levels 1, 4, 8) and in both X and Y directions. The cycles shown in Figure 26 stem from the nonlinear dynamic analysis TH n. 5, and those of Figure 27 are from TH n. 17.
The following observations can be made: (1) the amplitude of the loops is influenced by the specific TH due to record-to-record variability among the earthquake samples, despite being conditional on the same intensity levels (in particular, the spectral content variability is responsible for such differences, being devices velocity-dependent); (2) the stroke is higher in dampers at higher levels, as expected; (3) cycles in the Y direction are generally wider because of the higher deformability of the tower along this direction (no adjacent buildings interference); (4) forces produced by the dampers are not very large, therefore they may be well resisted by the tower by exploiting a proper connection system (also able to uniformly distribute the forces); and (5) strokes are compatible with the scissor-jack configuration without inducing a complete alignment of the rods of the crank mechanism.
4. Discussion and Conclusions
A preliminary study for seismic upgrading of a bell masonry tower through an internal dissipative steel tower with added dissipative fluid viscous dampers was conducted in this paper. A numerical model of the masonry tower and the dissipation system was first developed, and then numerical seismic simulations were performed in order to assess the feasibility of the proposed retrofit strategy. Based on the outcomes of this work, the seismic response of the upgraded bell tower could be significantly improved. Seismic displacements and absolute accelerations were mitigated and effective seismic energy dissipation was observed with consequent beneficial effects on the level of stress of masonry elements. Of course, this preliminary investigation needs further developments before possible real-world application. To this end, the following future investigations and improvements are suggested: (1) the adopted linear viscous dampers obtained promising results, however, nonlinear fluid viscous dampers could also be considered and may lead to a further reduction in both the damper size and transmitted forces; (2) experimental vibration monitoring of the tower as well as non-destructive testing of materials should be undertaken to support the calibration of more refined finite element models in order to achieve higher fidelity of the numerical predictions of the seismic response of the masonry walls, possibly using three-dimensional finite elements and nonlinear material constitutive laws, e.g., [90]; (3) a thorough fragility characterization of the retrofitted tower could be performed by exploiting IM-based approaches available in the literature [91,92]; and (4) the points of interaction between the historical masonry tower and the dissipative steel structure should be the subject of in-depth numerical analyses and experimental validations.
Author Contributions
Conceptualization, A.P., F.S., E.P. and A.Z.; methodology, A.P., F.S., E.P. and A.Z.; software, F.S.; formal analysis, A.P. and F.S.; investigation, A.P. and F.S.; resources, E.P. and A.Z.; data curation, A.P.; writing—original draft preparation, A.P., F.S., E.P. and A.Z.; writing—review and editing, F.S. and A.Z.; visualization, A.P. and F.S; supervision, E.P. and A.Z.; project administration, E.P. and A.Z. All authors have read and agreed to the published version of the manuscript.
Funding
This research received no external funding.
Institutional Review Board Statement
Not applicable.
Informed Consent Statement
Not applicable.
Data Availability Statement
The data presented in this study are available on reasonable request from the corresponding author. The data are not publicly available due to privacy restrictions concerning the property of the building used as case study.
Acknowledgments
The Authors gratefully acknowledge the priest of the San Zenone Church, Fra Andrea Patanè; the “Romolo Spezioli” Civic Library in Fermo, especially Cecilia Giacinti, Luca Berdini, Maurizio Sciortino and Anna Iezzoni; the Cultural Heritage Office of the Curia of Fermo, especially Alma Monelli; the Archiepiscopal Historical Archives of Fermo, especially Pierangela Romanelli; the State Archives of Fermo, especially Stefano Degli Esposti; the Archaeological, Fine Arts and Landscape Superintendence of the Marche, especially Caterina Cocchi and Marusca Pasqualini.
Conflicts of Interest
The authors declare no conflict of interest.
References
- Lagomarsino, S. Damage assessment of churches after L’Aquila earthquake (2009). Bull. Earthq. Eng. 2012, 10, 73–92. [Google Scholar] [CrossRef]
- Brandonisio, G.; Lucibello, G.; Mele, E.; De Luca, A. Damage and performance evaluation of masonry churches in the 2009 L’Aquila earthquake. Eng. Fail. Anal. 2013, 34, 693–714. [Google Scholar] [CrossRef]
- Penna, A.; Morandi, P.; Rota, M.; Manzini, C.F.; Da Porto, F.; Magenes, G. Performance of masonry buildings during the Emilia 2012 earthquake. Bull. Earthq. Eng. 2014, 12, 2255–2273. [Google Scholar] [CrossRef]
- Penna, A.; Calderini, C.; Sorrentino, L.; Carocci, C.F.; Cescatti, E.; Sisti, R.; Borri, A.; Modena, C.; Prota, A. Damage to churches in the 2016 Central Italy earthquakes. Bull. Earthq. Eng. 2019, 17, 5763–5790. [Google Scholar] [CrossRef]
- Sorrentino, L.; Cattari, S.; Da Porto, F.; Magenes, G.; Penna, A. Seismic behaviour of ordinary masonry buildings during the 2016 Central Italy earthquakes. Bull. Earthq. Eng. 2019, 17, 5583–5607. [Google Scholar] [CrossRef] [Green Version]
- Carbonari, S.; Dall’Asta, A.; Dezi, L.; Gara, F.; Leoni, G.; Morici, M.; Prota, A.; Zona, A. First analysis of data concerning damage occurred to churches of the Marche region following the 2016 Central Italy earthquakes. Boll. Geofis. Teor. Appl. 2019, 60, 183–196. [Google Scholar] [CrossRef]
- Canuti, C.; Carbonari, S.; Dall’Asta, A.; Dezi, L.; Gara, F.; Leoni, G.; Morici, M.; Petrucci, E.; Prota, A.; Zona, A. Post-earthquake damage and vulnerability assessment of churches in the Marche region struck by the 2016 Central Italy seismic sequence. Int. J. Archit. Heritage 2019, 1–22. [Google Scholar] [CrossRef]
- Morici, M.; Canuti, C.; Dall’Asta, A.; Leoni, G. Empirical predictive model for seismic damage of historical churches. Bull. Earthq. Eng. 2020, 18, 6015–6037. [Google Scholar] [CrossRef]
- Cescatti, E.; Salzano, P.; Casapulla, C.; Ceroni, F.; Da Porto, F.; Prota, A. Damages to masonry churches after 2016–2017 Central Italy seismic sequence and definition of fragility curves. Bull. Earthq. Eng. 2020, 18, 297–329. [Google Scholar] [CrossRef]
- Ruggieri, S.; Tosto, C.; Rosati, G.; Uva, G.; Ferro, G.A. Seismic vulnerability analysis of masonry churches in Piemonte after 2003 Valle Scrivia earthquake: Post-event screening and situation 17 years later. Int. J. Archit. Heritage 2020, 1–29. [Google Scholar] [CrossRef]
- Casolo, S. A three-dimensional model for vulnerability analysis of slender medieval masonry towers. J. Earthq. Eng. 1998, 2, 487–512. [Google Scholar] [CrossRef]
- Riva, P.; Perotti, F.; Guidoboni, E.; Boschi, E. Seismic analysis of the Asinelli Tower and earthquakes in Bologna. Soil Dynam. Earthq. Eng. 1998, 17, 525–550. [Google Scholar] [CrossRef]
- Carpinteri, A.; Invernizzi, S.; Lacidogna, G. In situ damage assessment and nonlinear modelling of a historical masonry tower. Eng. Struct. 2005, 27, 387–395. [Google Scholar] [CrossRef]
- Ceroni, F.; Pecce, M.; Voto, S.; Manfredi, G. Historical, architectural, and structural assessment of the bell tower of Santa Maria del Carmine. Int. J. Archit. Herit. 2009, 3, 169–194. [Google Scholar] [CrossRef]
- Anzani, A.; Binda, L.; Carpinteri, A.; Invernizzi, S.; Lacidogna, G. A multilevel approach for the damage assessment of historic masonry towers. J. Cult. Herit. 2010, 11, 459–470. [Google Scholar] [CrossRef]
- Pena, F.; Lourenço, P.B.; Mendez, N.; Oliveira, D. Numerical models for the seismic assessment of an old masonry tower. Eng. Struct. 2010, 32, 1466–1478. [Google Scholar] [CrossRef] [Green Version]
- Milani, G.; Russo, S.; Pizzolato, M.; Tralli, A. Seismic behavior of the San Pietro di Coppito church bell tower in Italy. Open Civ. Eng. J. 2012, 6, 131–147. [Google Scholar] [CrossRef]
- Milani, G.; Casolo, S.; Naliato, A.; Tralli, A. Seismic assessment of a medieval masonry tower in Northern Italy by limit, non-linear static and full dynamic analyses. Int. J. Archit. Herit. 2012, 6, 489–524. [Google Scholar] [CrossRef]
- Casolo, S.; Milani, G.; Uva, G.; Alessandri, C. Comparative seismic vulnerability analysis on ten masonry towers in the coastal Po Valley in Italy. Eng. Struct. 2013, 49, 465–490. [Google Scholar] [CrossRef]
- Acito, M.; Bocciarelli, M.; Chesi, C.; Milani, G. Collapse of the clock tower in Finale Emilia after the May 2012 Emilia Romagna earthquake sequence: Numerical insight. Eng. Struct. 2014, 72, 70–91. [Google Scholar] [CrossRef]
- Lagomarsino, S. Seismic assessment of rocking masonry structures. Bull. Earthq. Eng. 2015, 13, 97–128. [Google Scholar] [CrossRef]
- Salvatori, L.; Marra, A.M.; Bartoli, G.; Spinelli, P. Probabilistic seismic performance of masonry towers: General procedure and a simplified implementation. Eng. Struct. 2015, 94, 82–95. [Google Scholar] [CrossRef]
- Penna, A. Seismic assessment of existing and strengthened stone-masonry buildings: Critical issues and possible strategies. Bull. Earthq. Eng. 2015, 13, 1051–1071. [Google Scholar] [CrossRef]
- Valente, M.; Milani, G. Non-linear dynamic and static analyses on eight historical masonry towers in the North-East of Italy. Eng. Struct. 2016, 114, 241–270. [Google Scholar] [CrossRef]
- Valente, M.; Milani, G. Seismic assessment of historical masonry towers by means of simplified approaches and standard FEM. Constr. Build. Mater. 2016, 108, 74–104. [Google Scholar] [CrossRef]
- Pineda, P. Collapse and upgrading mechanisms associated to the structural materials of a deteriorated masonry tower. Nonlinear assessment under different damage and loading levels. Eng. Fail. Anal. 2016, 63, 72–93. [Google Scholar] [CrossRef]
- Marra, A.M.; Salvatori, L.; Spinelli, P.; Bartoli, G. Incremental dynamic and nonlinear static analyses for seismic assessment of medieval masonry towers. J. Perform. Constr. Facil. 2017, 31, 04017032. [Google Scholar] [CrossRef]
- Sarhosis, V.; Milani, G.; Formisano, A.; Fabbrocino, F. Evaluation of different approaches for the estimation of the seismic vulnerability of masonry towers. Bull. Earthq. Eng. 2018, 16, 1511–1545. [Google Scholar] [CrossRef] [Green Version]
- Milani, G. Fast vulnerability evaluation of masonry towers by means of an interactive and adaptive 3D kinematic limit analysis with pre-assigned failure mechanisms. Int. J. Archit. Herit. 2019, 13, 941–962. [Google Scholar] [CrossRef]
- Ivorra, S.; Pallarés, F.J. Dynamic investigations on a masonry bell tower. Eng. Struct. 2006, 28, 660–667. [Google Scholar] [CrossRef]
- Bayraktar, A.; Türker, T.; Sevim, B.; Altunişik, A.C.; Yildirim, F. Modal parameter identification of Hagia Sophia bell-tower via ambient vibration test. J. Nondestr. Eval. 2009, 28, 37–47. [Google Scholar] [CrossRef]
- Foti, D.; Diaferio, M.; Giannoccaro, N.I.; Mongelli, M. Ambient vibration testing, dynamic identification and model updating of a historic tower. NDT e Int. 2012, 47, 88–95. [Google Scholar] [CrossRef]
- Gentile, C.; Guidobaldi, M.; Saisi, A. One-year dynamic monitoring of a historic tower: Damage detection under changing environment. Meccanica 2016, 51, 2873–2889. [Google Scholar] [CrossRef] [Green Version]
- Cavalagli, N.; Comanducci, G.; Ubertini, F. Earthquake-induced damage detection in a monumental masonry bell-tower using long-term dynamic monitoring data. J. Earthq. Eng. 2018, 22, 96–119. [Google Scholar] [CrossRef]
- Dall’Asta, A.; Leoni, G.; Meschini, A.; Petrucci, E.; Zona, A. Integrated approach for seismic vulnerability analysis of historic massive defensive structures. J. Cult. Herit. 2019, 35, 86–98. [Google Scholar] [CrossRef]
- Grazzini, A.; Chiabrando, F.; Foti, S.; Sammartano, G.; Spanò, A. A multidisciplinary study on the seismic vulnerability of St. Agostino Church in Amatrice following the 2016 seismic sequence. Int. J. Archit. Herit. 2020, 14, 885–902. [Google Scholar] [CrossRef]
- Modena, C.; Valluzzi, M.R.; Tongini Folli, R.; Binda, L. Design choices and intervention techniques for repairing and strengthening of the Monza cathedral bell-tower. Constr. Build. Mater. 2002, 16, 385–395. [Google Scholar] [CrossRef]
- Valluzzi, M.R.; Binda, L.; Modena, C. Mechanical behaviour of historic masonry structures strengthened by bed joints structural repointing. Constr. Build. Mater. 2005, 19, 63–73. [Google Scholar] [CrossRef]
- Cosenza, E.; Iervolino, I. Case study: Seismic retrofitting of a medieval bell tower with FRP. J. Compos. Constr. 2007, 11, 319–327. [Google Scholar] [CrossRef] [Green Version]
- Milani, G.; Shehu, R.; Valente, M. A kinematic limit analysis approach for seismic retrofitting of masonry towers through steel tie-rods. Eng. Struct. 2018, 160, 212–228. [Google Scholar] [CrossRef]
- Formisano, A.; Milani, G. Seismic vulnerability analysis and retrofitting of the SS. Rosario Church Bell Tower in Finale Emilia (Modena, Italy). Front. Built Environ. 2019, 5, 70. [Google Scholar] [CrossRef]
- Preciado, A.; Sperbeck, S.T.; Ramírez-Gaytán, A. Seismic vulnerability enhancement of medieval and masonry bell towers externally prestressed with unbonded smart tendons. Eng. Struct. 2016, 122, 50–61. [Google Scholar] [CrossRef]
- Preciado, A.; Budelmann, H.; Bartoli, G. Earthquake protection of colonial bell towers in Colima, Mexico with externally prestressed FRPS. Int. J. Archit. Herit. 2016, 10, 499–515. [Google Scholar] [CrossRef]
- Preciado, A.; Bartoli, G.; Ramírez-Gaytán, A. Earthquake protection of the Torre Grossamedieval tower of San Gimignano, Italy by vertical external prestressing. Eng. Fail. Anal. 2017, 71, 31–42. [Google Scholar] [CrossRef]
- Preciado, A.; Ramirez-Gaytan, A.; Gutierrez, N.; Vargas, D.; Falcon, J.M.; Ochoa, G. Nonlinear earthquake capacity of slender old masonry structures prestressed with steel, FRP and NiTi SMA tendons. Steel Compos. Struct. 2018, 26, 213–226. [Google Scholar] [CrossRef]
- De Stefani, L.; Scotta, R.; Lazzari, M.; Saetta, A. Seismic improvement of slender masonry tower by using hysteretic devices and partial prestressing technique. Bull. Earthq. Eng. 2014, 12, 829–853. [Google Scholar] [CrossRef]
- Habieb, A.H.; Valente, M.; Milani, G. Effectiveness of different base isolation systems for seismic protection: Numerical insights into an existing masonry bell tower. Soil Dyn. Earthq. Eng. 2019, 125, 105752. [Google Scholar] [CrossRef]
- Jurina, L. La “Torre nella Torre: Due casi di consolidamento a Pavia. In Proceedings of the REUSO 2016, IV Convegno Internazionale Sulla Documentazione, Conservazione e Recupero del Patrimonio Architettonico e Sulla Tutela Paesaggistica, Pavia, Italy, 6–8 October 2016; Parrinello, S., Besana, D., Eds.; Edifir Edizioni: Firenze, Italy, 2016. [Google Scholar]
- Gioiella, L.; Tubaldi, E.; Gara, F.; Dezi, L.; Dall’Asta, A. Modal properties and seismic behaviour of buildings equipped with external dissipative pinned rocking braced frames. Eng. Struct. 2018, 172, 807–818. [Google Scholar] [CrossRef] [Green Version]
- Gioiella, L.; Tubaldi, E.; Gara, F.; Dezi, L.; Dall’Asta, A. Stochastic seismic analysis and comparison of alternative external dissipative systems. Shock Vib. 2018, 5403737. [Google Scholar] [CrossRef] [Green Version]
- Foti, D.; Ruggiero, F.; Sabbà, M.F.; Lerna, M. A dissipating frames for seismic retrofitting and building energy-efficiency. Infrastructures 2020, 5, 74. [Google Scholar] [CrossRef]
- Tubaldi, E.; Gioiella, L.; Scozzese, F.; Ragni, L.; Dall’Asta, A. A design method for viscous dampers connecting adjacent structures. Front. Built Environ. 2020, 6, 25. [Google Scholar] [CrossRef] [Green Version]
- Scozzese, F.; Dall’Asta, A.; Tubaldi, E. Seismic risk sensitivity of structures equipped with anti-seismic devices with uncertain properties. Struct. Saf. 2019, 77, 30–47. [Google Scholar] [CrossRef] [Green Version]
- Pavlou, E.; Constantinou, M.C. Response of nonstructural components in structures with damping systems. J. Struct. Eng. 2006, 132, 1108–1117. [Google Scholar] [CrossRef]
- Cipolletti, C. Fermo. Storia Artistica della Città del Girfalco; Andrea Livi Editore: Fermo, Italy, 2009; pp. 138–143. [Google Scholar]
- Di Nicolò, A. Cronaca della Città di Fermo; Andrea Livi Editore: Fermo, Italy, 2008; p. 178. [Google Scholar]
- Maranesi, F. Guida Storica e Artistica della Città di Fermo; Andrea Livi Editore: Fermo, Italy, 1957; pp. 136–137. [Google Scholar]
- Tomei, L. Genesi e Primi Sviluppi del Comune della Marca Meridionale in Società e Cultura della Marca Meridionale tra alto e Basso Medioevo. Atti del 4° Seminario di Studi per Personale Direttivo e Docente della Scuola; Media Print 2000: Grottammare, Italy, 1995; pp. 258–270. [Google Scholar]
- Trebbi, F.; Filoni Guerrieri, G. La Chiesa Metropolitana di Fermo. Erezione della Chiesa Cattedrale di Fermo a Metropolitana; Andrea Livi Editore: Fermo, Italy, 1890; pp. 168–169. [Google Scholar]
- Catalani, M. De ecclesia firmana. In I Vescovi e gli Arcivescovi della Chiesa Fermana; Andrea Livi Editore: Fermo, Italy, 2012; p. 203. [Google Scholar]
- Guidi, E. Il Romanico Nella Marca Fermana; Arti Grafiche Motta: Milano, Italy, 2002; p. 16. [Google Scholar]
- UNI 11182:2006, Beni Culturali-Materiali Lapidei Naturali ed Artificiali-Descrizione della Forma di Alterazione-Termini e definizioni; Ente Italiano di Normazione: Roma, Italy, 2006.
- European Committee for Standardization. Eurocode 8-Design of Structures for Earthquake Resistance. Part 1: General Rules, Seismic Actions and Rules for Buildings; European Committee for Standardization: Brussels, Belgium, 2004. [Google Scholar]
- Laurenzano, G.; Barnaba, C.; Romano, M.A.; Priolo, E.; Bertoni, M.; Bragato, P.L.; Comelli, P.; Dreossi, I.; Garbin, M. The Central Italy 2016–2017 seismic sequence: Site response analysis based on seismological data in the Arquata del Tronto–Montegallo municipalities. Bull. Earthq. Eng. 2018, 17, 5449–5469. [Google Scholar] [CrossRef] [Green Version]
- Luzi, L.; Pacor, F.; Puglia, R.; Lanzano, G.; Felicetta, C.; D’Amico, M.; Michelini, A.; Faenza, L.; Lauciani, V.; Iervolino, I.; et al. The central Italy seismic sequence between August and December 2016: Analysis of strong-motion observations. Seismol. Res. Lett. 2017, 88, 1219–1231. [Google Scholar] [CrossRef]
- Stucchi, M.; Meletti, C.; Montaldo, V.; Akinci, A.; Faccioli, E.; Gasperini, P.; Malagnini, L.; Valensise, G. Pericolosità Sismica di Riferimento per il Territorio Nazionale MPS04 [Data Set]; Istituto Nazionale di Geofisica e Vulcanologia (INGV): Roma, Italy, 2004; (In Italian). [CrossRef]
- Kramer, S.L. Geotechnical Earthquake Engineering; Prentice-Hall: Englewood Cliffs, NJ, USA, 2003. [Google Scholar]
- Au, S.K.; Beck, J.L. Subset simulation and its application to seismic risk based on dynamic analysis. J. Eng. Mech. 2003, 129, 901–917. [Google Scholar] [CrossRef]
- Atkinson, G.M.; Silva, W. Stochastic modeling of California ground motions. Bull. Seismol. Soc. Am. 2000, 90, 255–274. [Google Scholar] [CrossRef]
- Boore, D.M. Simulation of ground motion using the stochastic method. Pure Appl. Geophys. 2003, 160, 635–676. [Google Scholar] [CrossRef] [Green Version]
- Hong, H.P.; Liu, T.J. Assessment of coherency for bidirectional horizontal ground motions and its application for simulating records at multiple stations. Bull. Seismol. Soc. Am. 2014, 104, 2491–2502. [Google Scholar] [CrossRef]
- SAP2000, Computers and Structures Inc. v20 Integrated Finite Element Analysis and Design of Structures; Computers and Structures Inc.: Berkely, CA, USA, 2018. [Google Scholar]
- Bathe, K.J.; Dvorkin, E.N. A four-node plate bending element based on Mindlin/Reissner plate theory and a mixed interpolation. Int. J. Numer. Meth. Eng. 1985, 21, 367–383. [Google Scholar] [CrossRef]
- Bartoli, G.; Betti, M.; Vignoli, A. A numerical study on seismic risk assessment of historic masonry towers: A case study in San Gimignano. Bull. Earthq. Eng. 2016, 14, 1475–1518. [Google Scholar] [CrossRef]
- Bartoli, G.; Betti, M.; Monchetti, S. Seismic risk assessment of historic masonry towers: Comparison of four case studies. J. Perf. Constr. Facil. 2017, 31, 04017039. [Google Scholar] [CrossRef] [Green Version]
- Torelli, G.; D’Ayala, D.; Betti, M.; Bartoli, G. Analytical and numerical seismic assessment of heritage masonry towers. Bull. Earthq. Eng. 2020, 18, 969–1008. [Google Scholar] [CrossRef] [Green Version]
- Bartoli, G.; Betti, M.; Galano, L.; Zini, G. Numerical insights on the seismic risk of confined masonry towers. Eng. Struct. 2019, 180, 713–727. [Google Scholar] [CrossRef]
- Pieraccini, M.; Dei, D.; Betti, M.; Bartoli, G.; Tucci, G.; Guardini, N. Dynamic identification of historic masonry towers through an expeditious and no-contact approach: Application to the ‘Torre del Mangia’ in Siena (Italy). J. Cult. Herit. 2014, 15, 275–282. [Google Scholar] [CrossRef]
- Ministero delle Infrastrutture e dei Trasporti. Aggiornamento delle Norme Tecniche per le Costruzioni (NTC2018); Ministero delle Infrastrutture e dei Trasporti: Rome, Italy, 2018. (In Italian)
- Zhu, L.; Guo, P.; Hua, C.; Shan, S. Seismic Performance of an Efficient Scissor-Jack-Damper Configuration. Shock Vib. 2020, 2403640. [Google Scholar] [CrossRef] [Green Version]
- Sigaher, A.N.; Constantinou, M.C. Scissor-jack-damper energy dissipation system. Earthq. Spectra 2003, 19, 133–158. [Google Scholar] [CrossRef]
- European Sections Arcelor Mittal. Available online: https://constructalia.arcelormittal.com/en/products/european_sections (accessed on 7 January 2021).
- De Domenico, D.; Ricciardi, G.; Takewaki, I. Design strategies of viscous dampers for seismic protection of building structures: A review. Soil Dyn. Earthq. Eng. 2019, 118, 144–165. [Google Scholar] [CrossRef]
- Occhiuzzi, A. Additional viscous dampers for civil structures: Analysis of design methods based on effective evaluation of modal damping ratios. Eng. Struct. 2009, 31, 1093–1101. [Google Scholar] [CrossRef]
- Constantinou, M.; Symans, M. Experimental and Analytical Investigation of Seismic Response of Structures with Supplemental Fluid Viscous Dampers; Technical Report NCEER-92-0032; National Center for Earthquake Engineering Research: Buffalo, NY, USA, 1992; pp. 1–25. [Google Scholar]
- Dall’Asta, A.; Scozzese, F.; Ragni, L.; Tubaldi, E. Effect of the damper property variability on the seismic reliability of linear systems equipped with viscous dampers. Bull. Earthq. Eng. 2017, 15, 5025–5053. [Google Scholar] [CrossRef] [Green Version]
- Hwang, J.S.; Lin, W.C.; Wu, N.J. Comparison of distribution methods for viscous damping coefficients to buildings. Struct. Infrastruct. Eng. 2013, 9, 28–41. [Google Scholar] [CrossRef]
- Whittle, J.K.; Williams, M.S.; Karavasilis, T.L.; Blakeborough, A. A comparison of viscous damper placement methods for improving seismic building design. J. Earthq. Eng. 2012, 16, 540–560. [Google Scholar] [CrossRef]
- Pekcan, G.; Mander, J.; Chen, S. Design and Retrofit Methodology for Building Structures with Supplemental Energy Dissipating Systems; Technical Report MCEER-99-0021; University at Buffalo, State University of New York: Buffalo, NY, USA, 1999; pp. 1–177. [Google Scholar]
- Scozzese, F.; Ragni, L.; Tubaldi, E.; Gara, F. Modal properties variation and collapse assessment of masonry arch bridges under scour action. Eng. Struct. 2019, 199, 109–665. [Google Scholar] [CrossRef]
- Scozzese, F.; Tubaldi, E.; Dall’Asta, A. Assessment of the effectiveness of multiple-stripe analysis by using a stochastic earthquake input model. Bull. Earthq. Eng. 2020, 18, 3167–3203. [Google Scholar] [CrossRef]
- Jalayer, F.; Cornell, C.A. Alternative non-linear demand estimation methods for probability-based seismic assessments. Earthq. Eng. Struct. D 2009, 38, 951–972. [Google Scholar] [CrossRef]
Figure 1.
External and internal views of the Church of San Zenone (Fermo, Italy) with its bell tower.
Figure 1.
External and internal views of the Church of San Zenone (Fermo, Italy) with its bell tower.

Figure 2.
Timeline of the San Zenone Church, from the XI Century to the Second half of XIX Century.

Figure 3.
(a) Walled inscription inside the Church; (b) inscription placed above the rose window; and (c) commemorative coin depicting the roof of the bell tower.
Figure 3.
(a) Walled inscription inside the Church; (b) inscription placed above the rose window; and (c) commemorative coin depicting the roof of the bell tower.

Figure 4.
Point cloud with targets of the laser scanner and total station.

Figure 5.
Geometric plan of the whole building at 4.00 m height.

Figure 6.
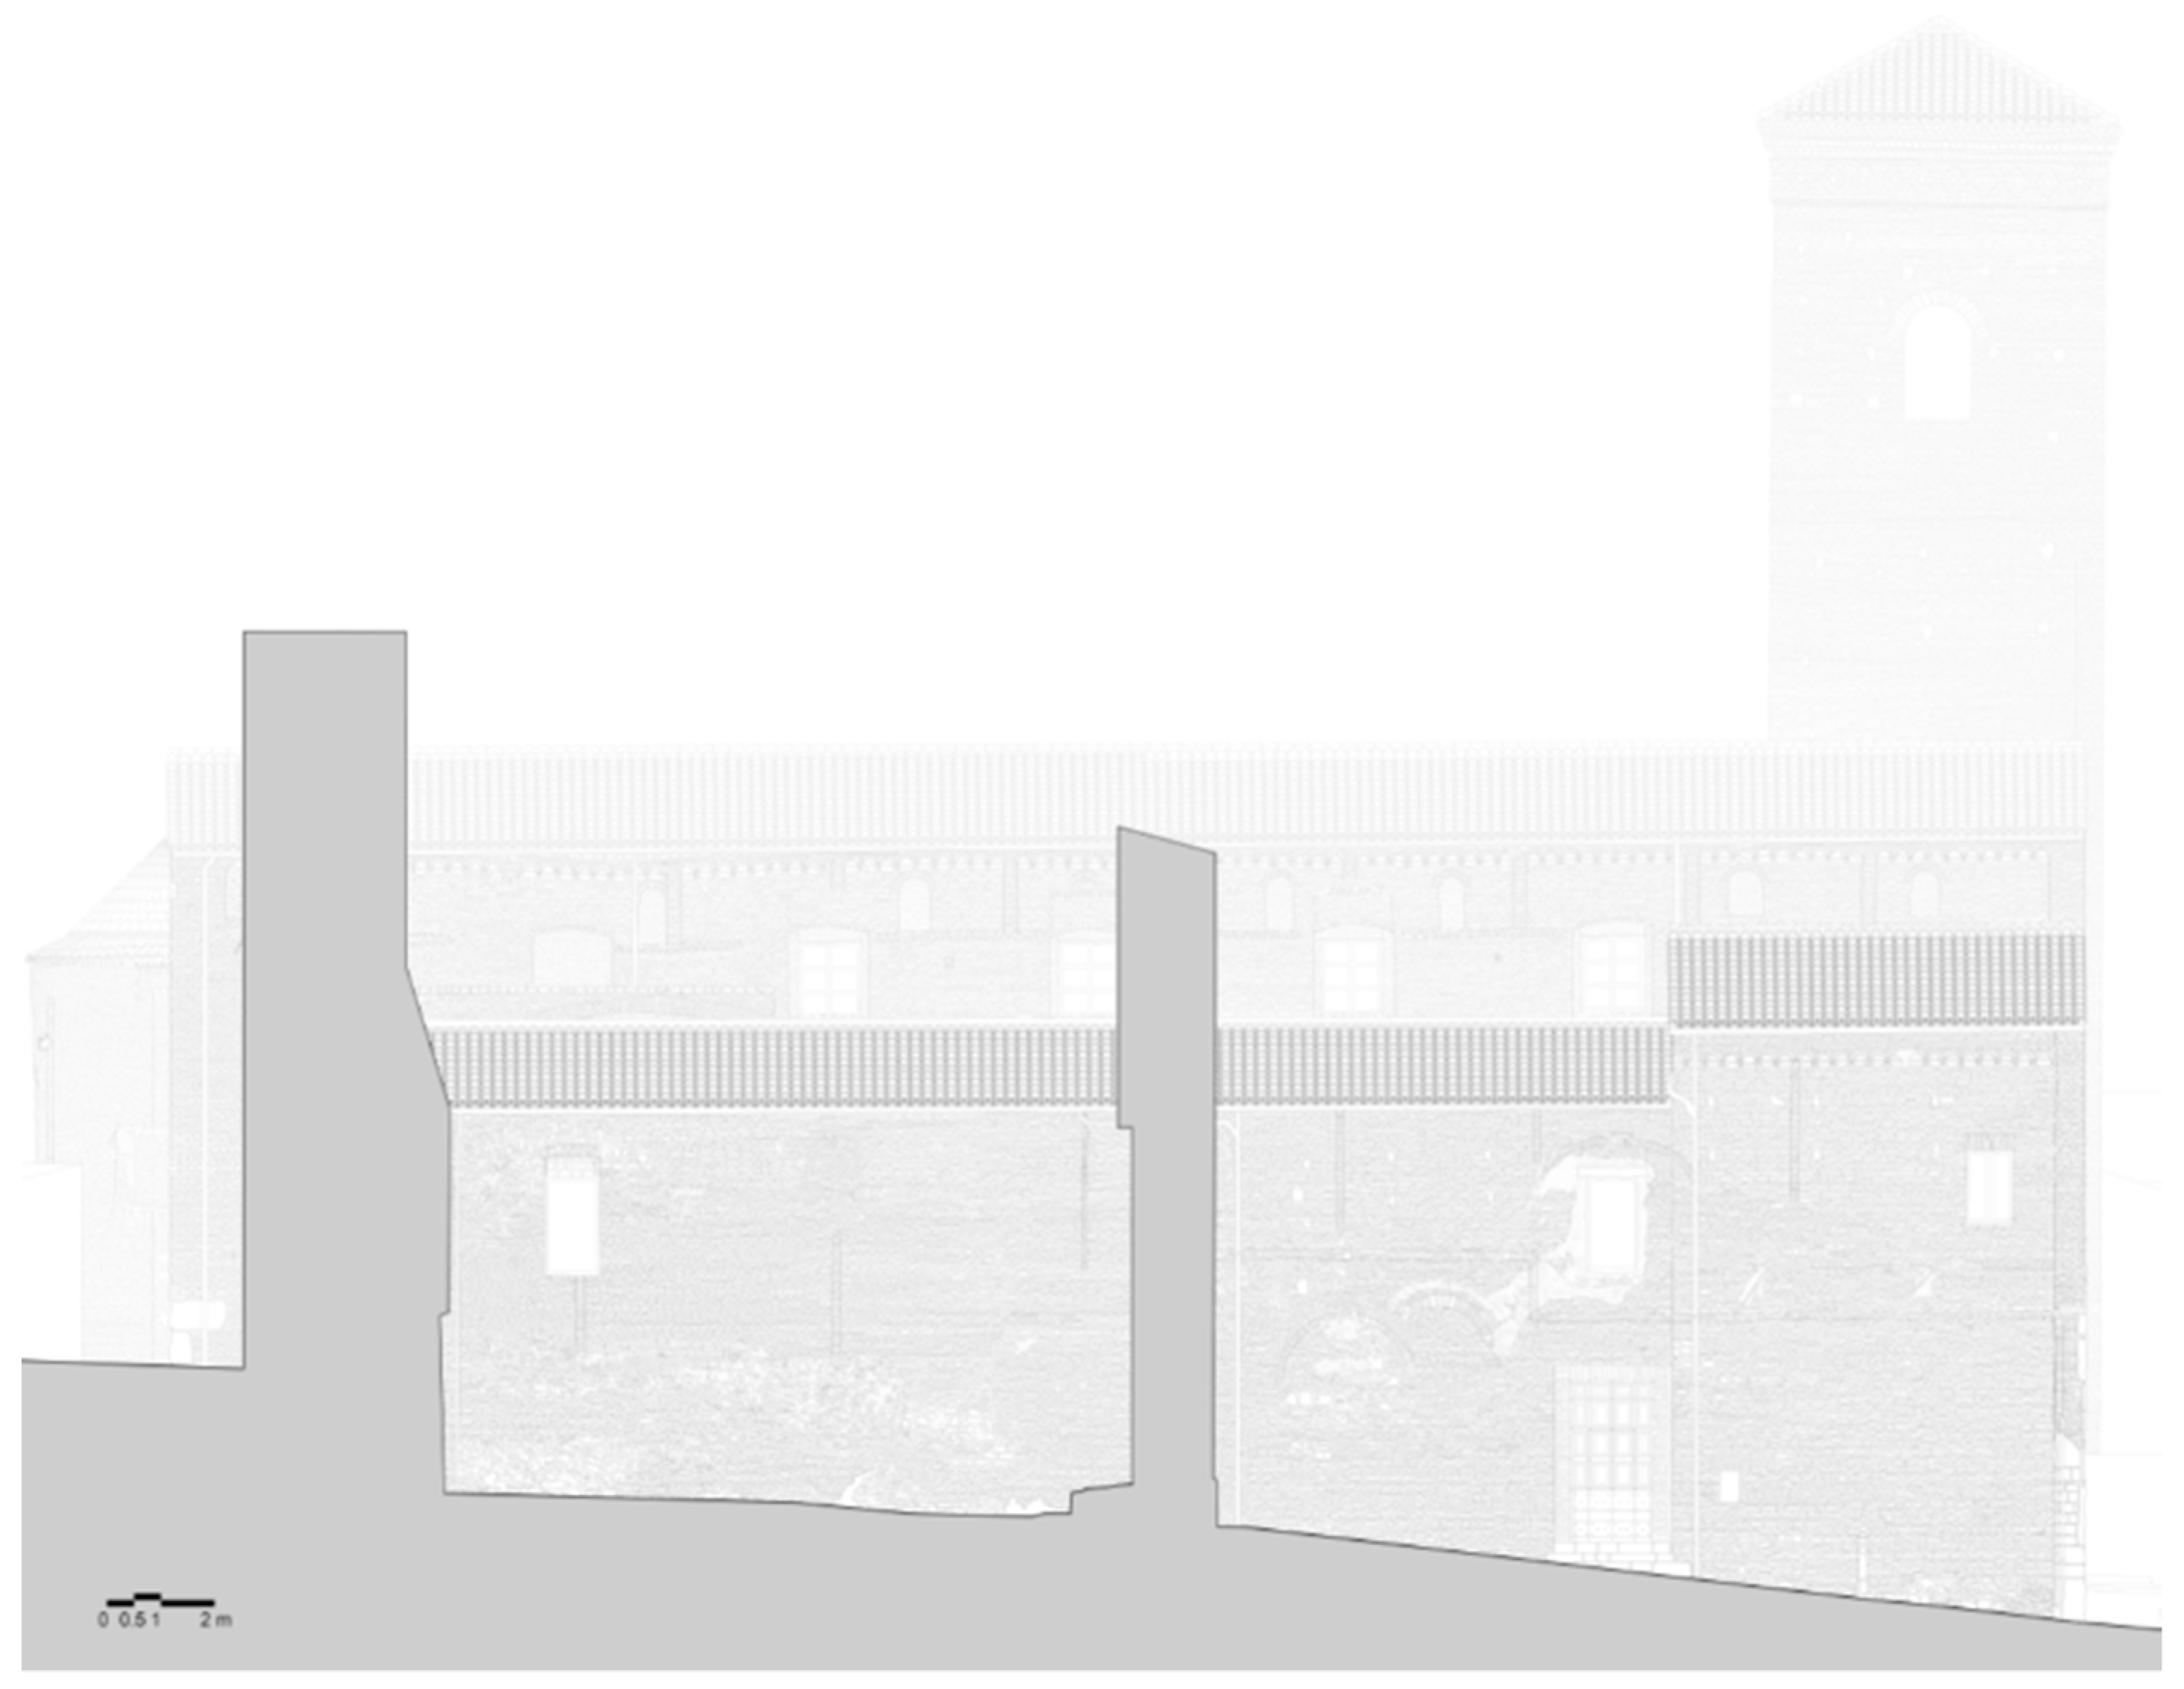
Northern facade and Southern back side of the church (architectural survey).

Figure 7.
Eastern prospect of the building (architectural survey).

Figure 8.
(a) Tower plans at different heights and (b) vertical sections (geometric survey).

Figure 9.
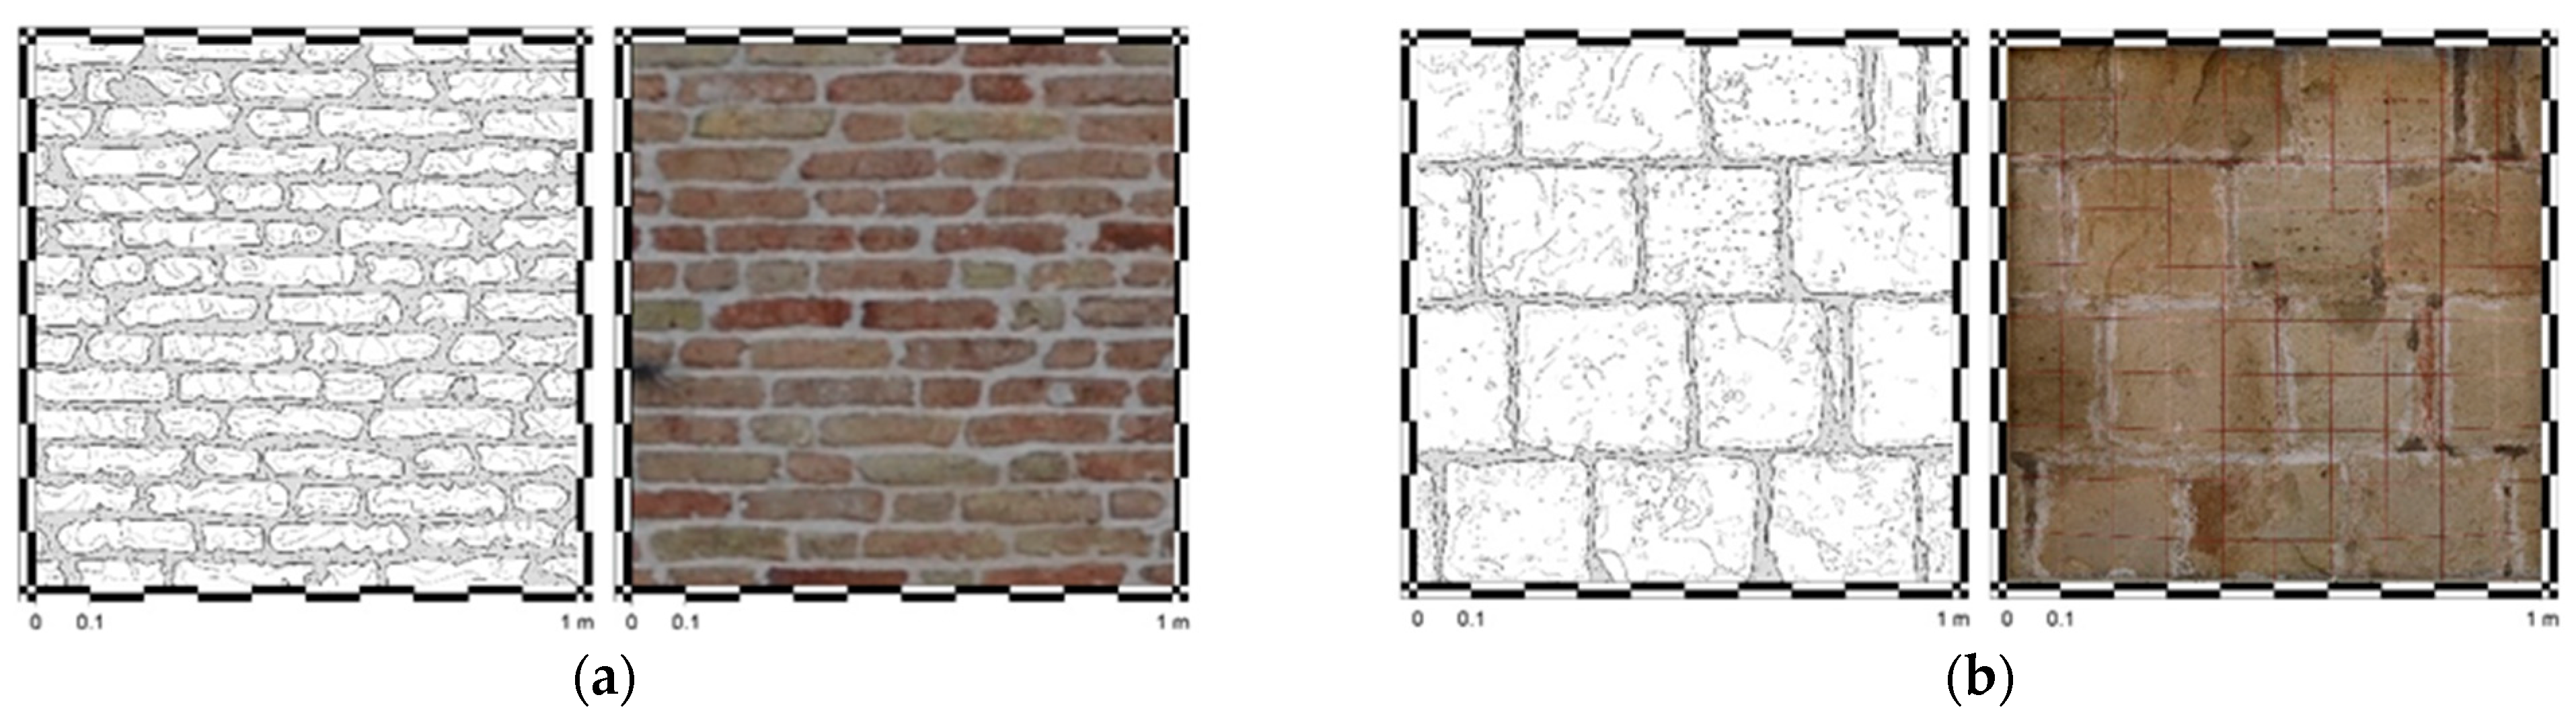
(a) Masonry sample of upper part North front, bricks and mortar and (b) masonry sample of lower part North front, sandstone and mortar.
Figure 9.
(a) Masonry sample of upper part North front, bricks and mortar and (b) masonry sample of lower part North front, sandstone and mortar.

Figure 10.
Bell tower decay: (a) front North; (b) front East; (c) front South; (d) front West.

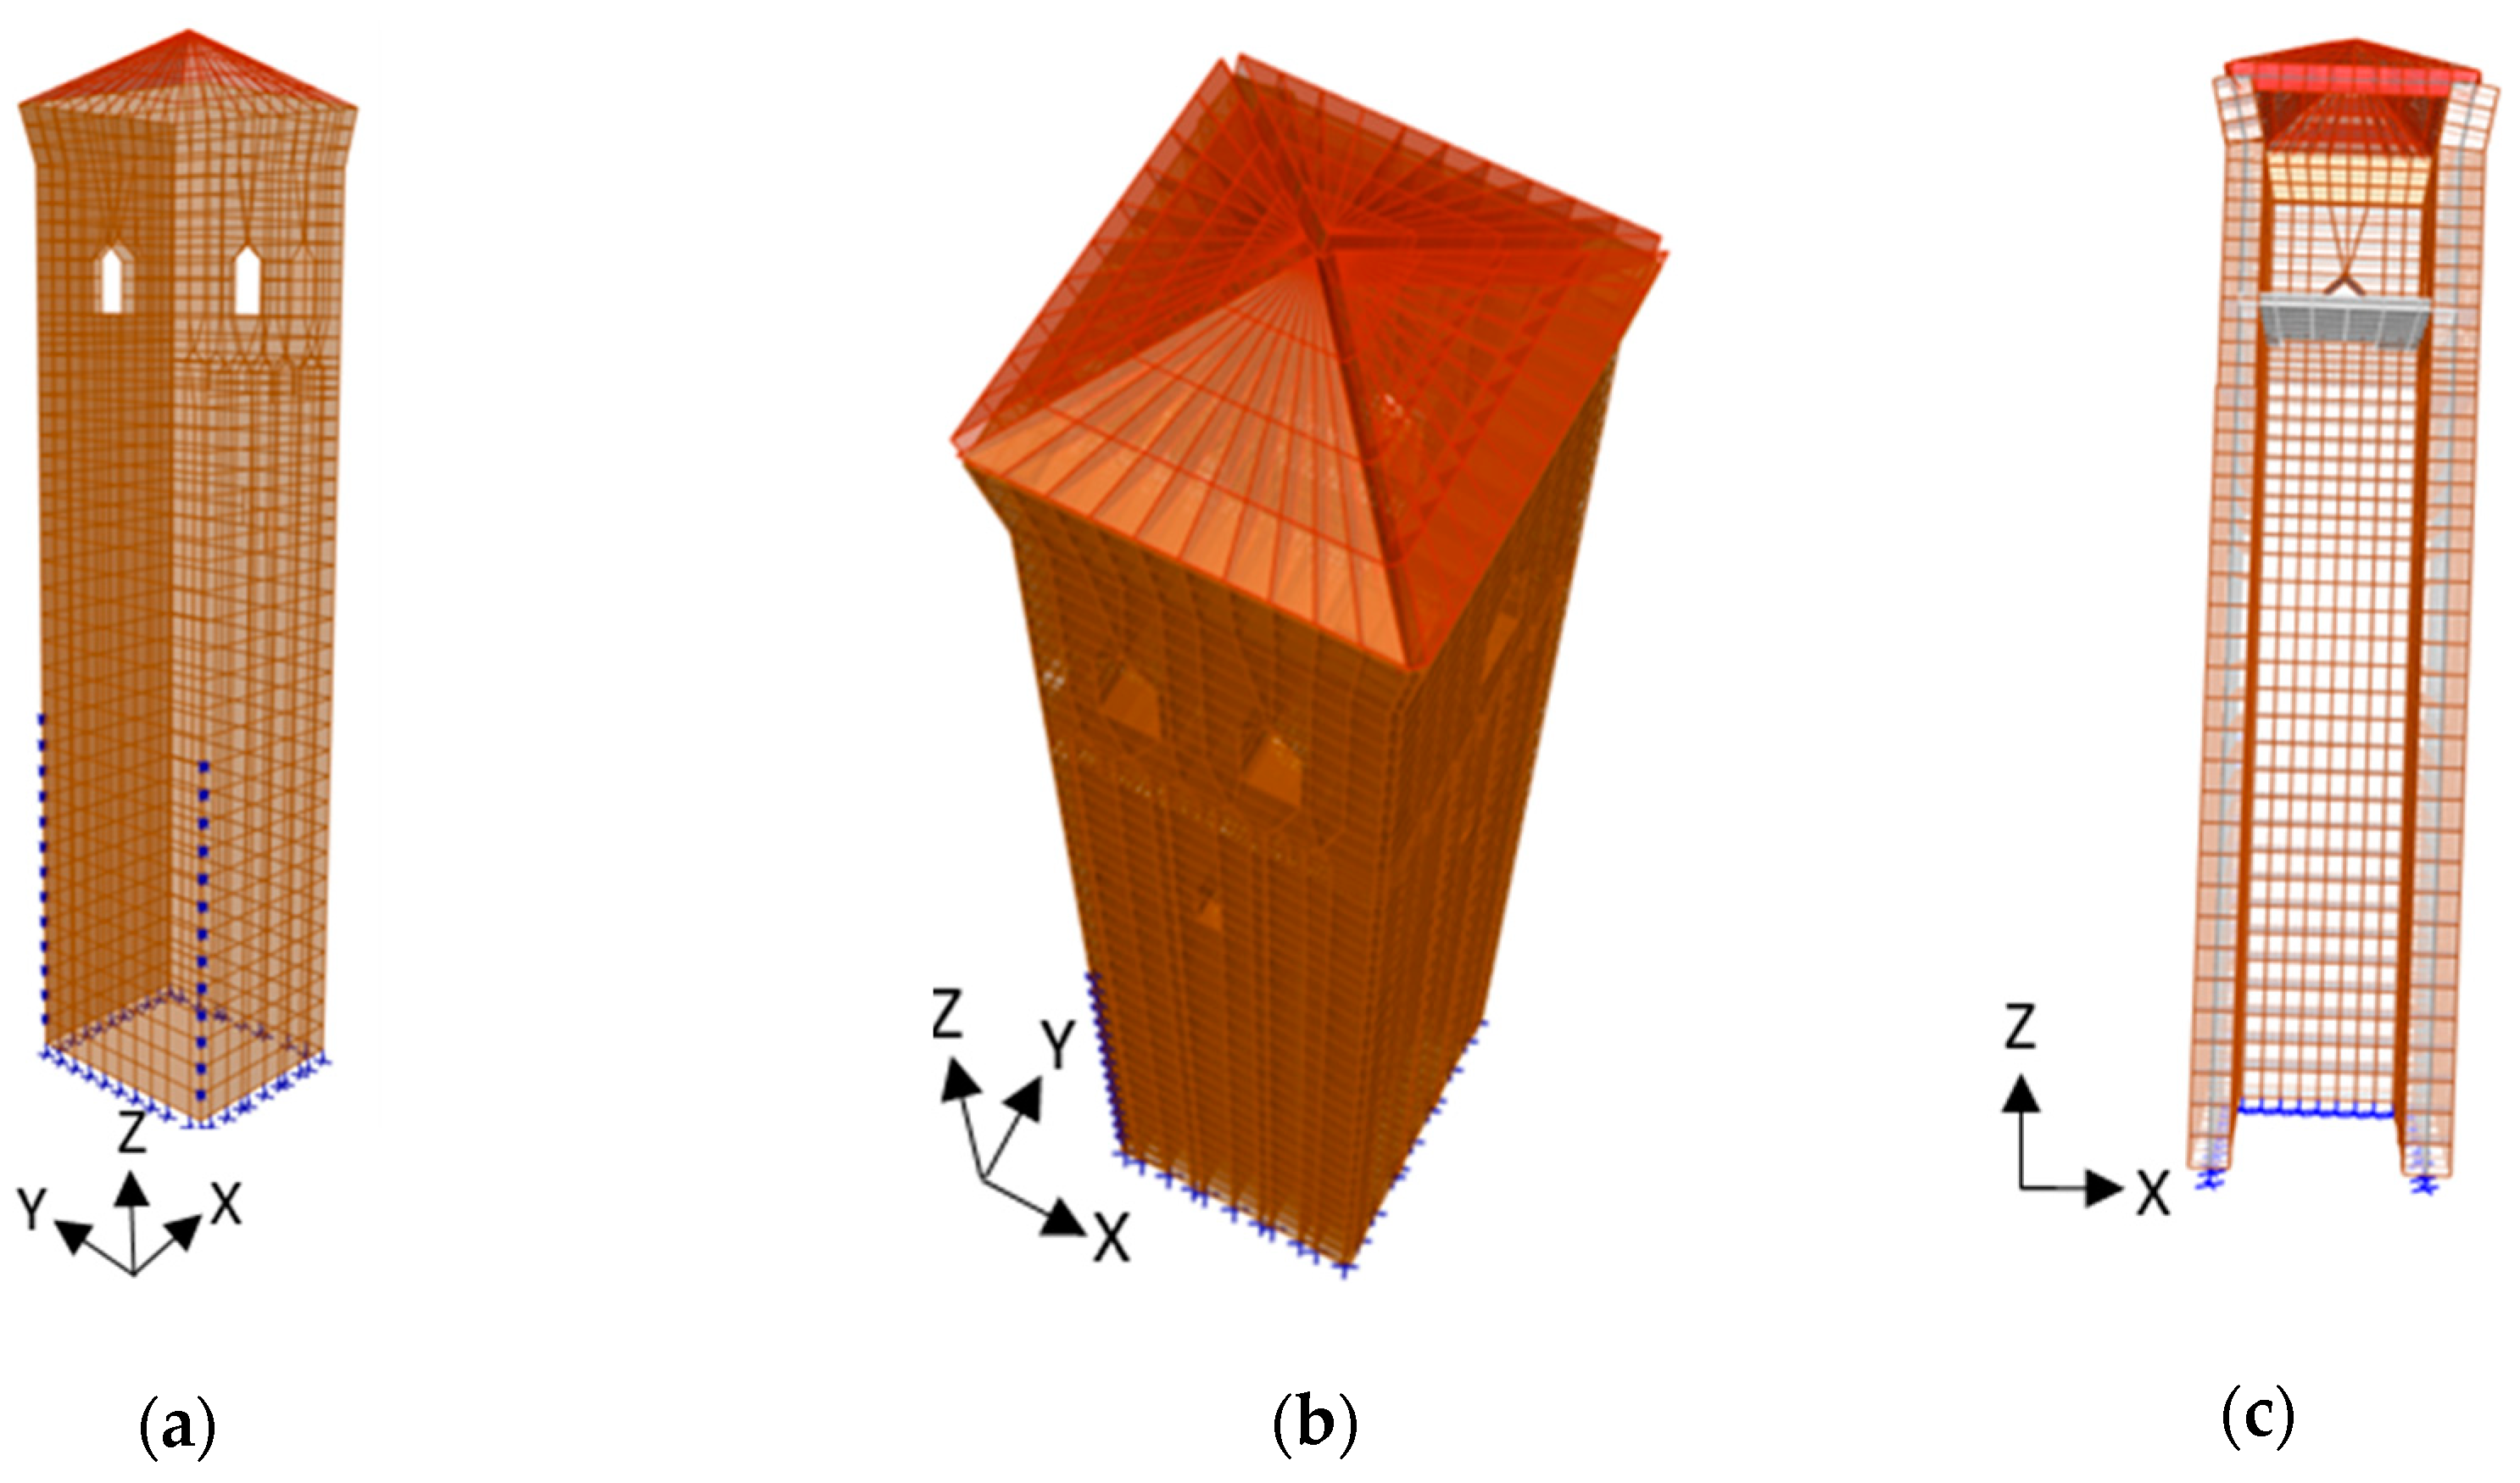
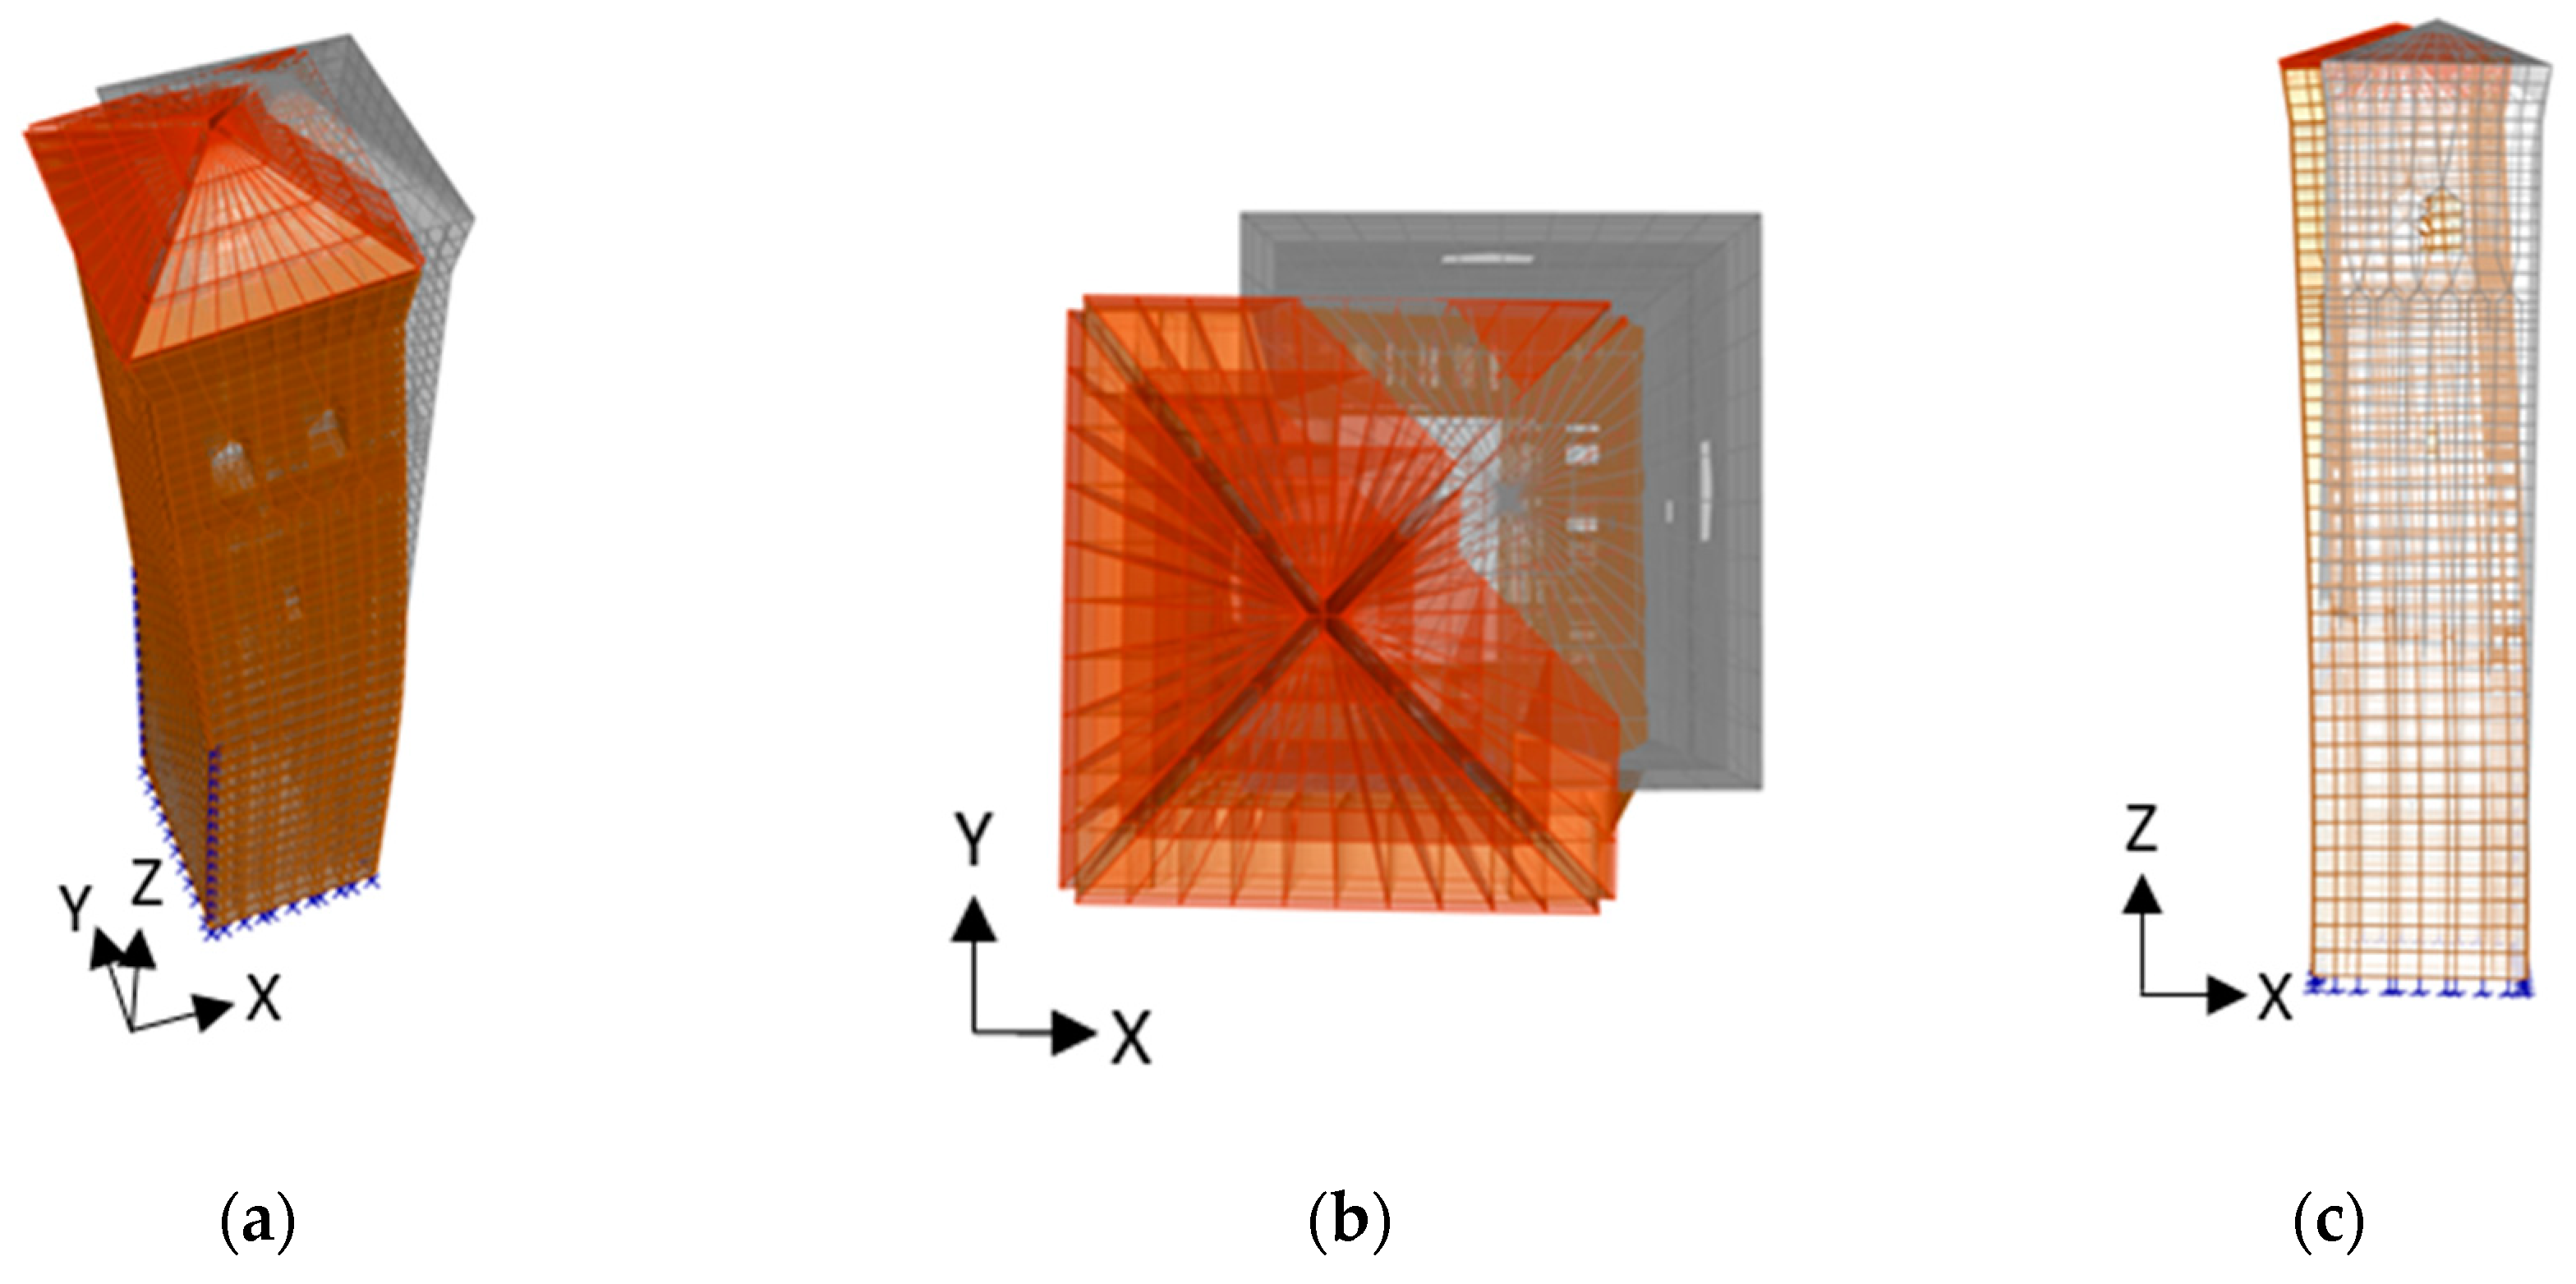
Figure 11.
Bell tower finite element model: (a,b) 3D views with boundary conditions highlighted in blue; (c) front view (XZ plan), in which the tilted geometrical configuration can be appreciated.
Figure 11.
Bell tower finite element model: (a,b) 3D views with boundary conditions highlighted in blue; (c) front view (XZ plan), in which the tilted geometrical configuration can be appreciated.

Figure 12.
First vibration mode shape of the tower (T = 0.884 s): (a) 3D view; (b) top view; (c) front view.
Figure 12.
First vibration mode shape of the tower (T = 0.884 s): (a) 3D view; (b) top view; (c) front view.

Figure 13.
Second vibration mode shape of the tower (T = 0.666 s): (a) 3D view; (b) top view; (c) front view.
Figure 13.
Second vibration mode shape of the tower (T = 0.666 s): (a) 3D view; (b) top view; (c) front view.

Figure 14.
Third vibration mode shape of the tower (T = 0.295 s): (a) 3D view; (b) top view; (c) front view.
Figure 14.
Third vibration mode shape of the tower (T = 0.295 s): (a) 3D view; (b) top view; (c) front view.

Figure 15.
Intensity measure (IM) hazard curve for Sa(T*) at T* = 0.75 s and reference IM levels.

Figure 16.
Response spectra of both horizontal components of the seismic samples at two intensity levels: (a) TR = 50 years and (b) TR = 475 years.
Figure 16.
Response spectra of both horizontal components of the seismic samples at two intensity levels: (a) TR = 50 years and (b) TR = 475 years.

Figure 17.
Scheme of the inner dissipative tower: (a) section in the XZ plan; (b) detail of the scissor-jack-damper configuration within the inner steel tower; (c) XZ plan view; and (d) in-plan view (XY) of the connections between the inner and outer tower.
Figure 17.
Scheme of the inner dissipative tower: (a) section in the XZ plan; (b) detail of the scissor-jack-damper configuration within the inner steel tower; (c) XZ plan view; and (d) in-plan view (XY) of the connections between the inner and outer tower.

Figure 18.
Target design strategy representation in the acceleration (Sa)-displacement (Sd) response spectrum plane.
Figure 18.
Target design strategy representation in the acceleration (Sa)-displacement (Sd) response spectrum plane.

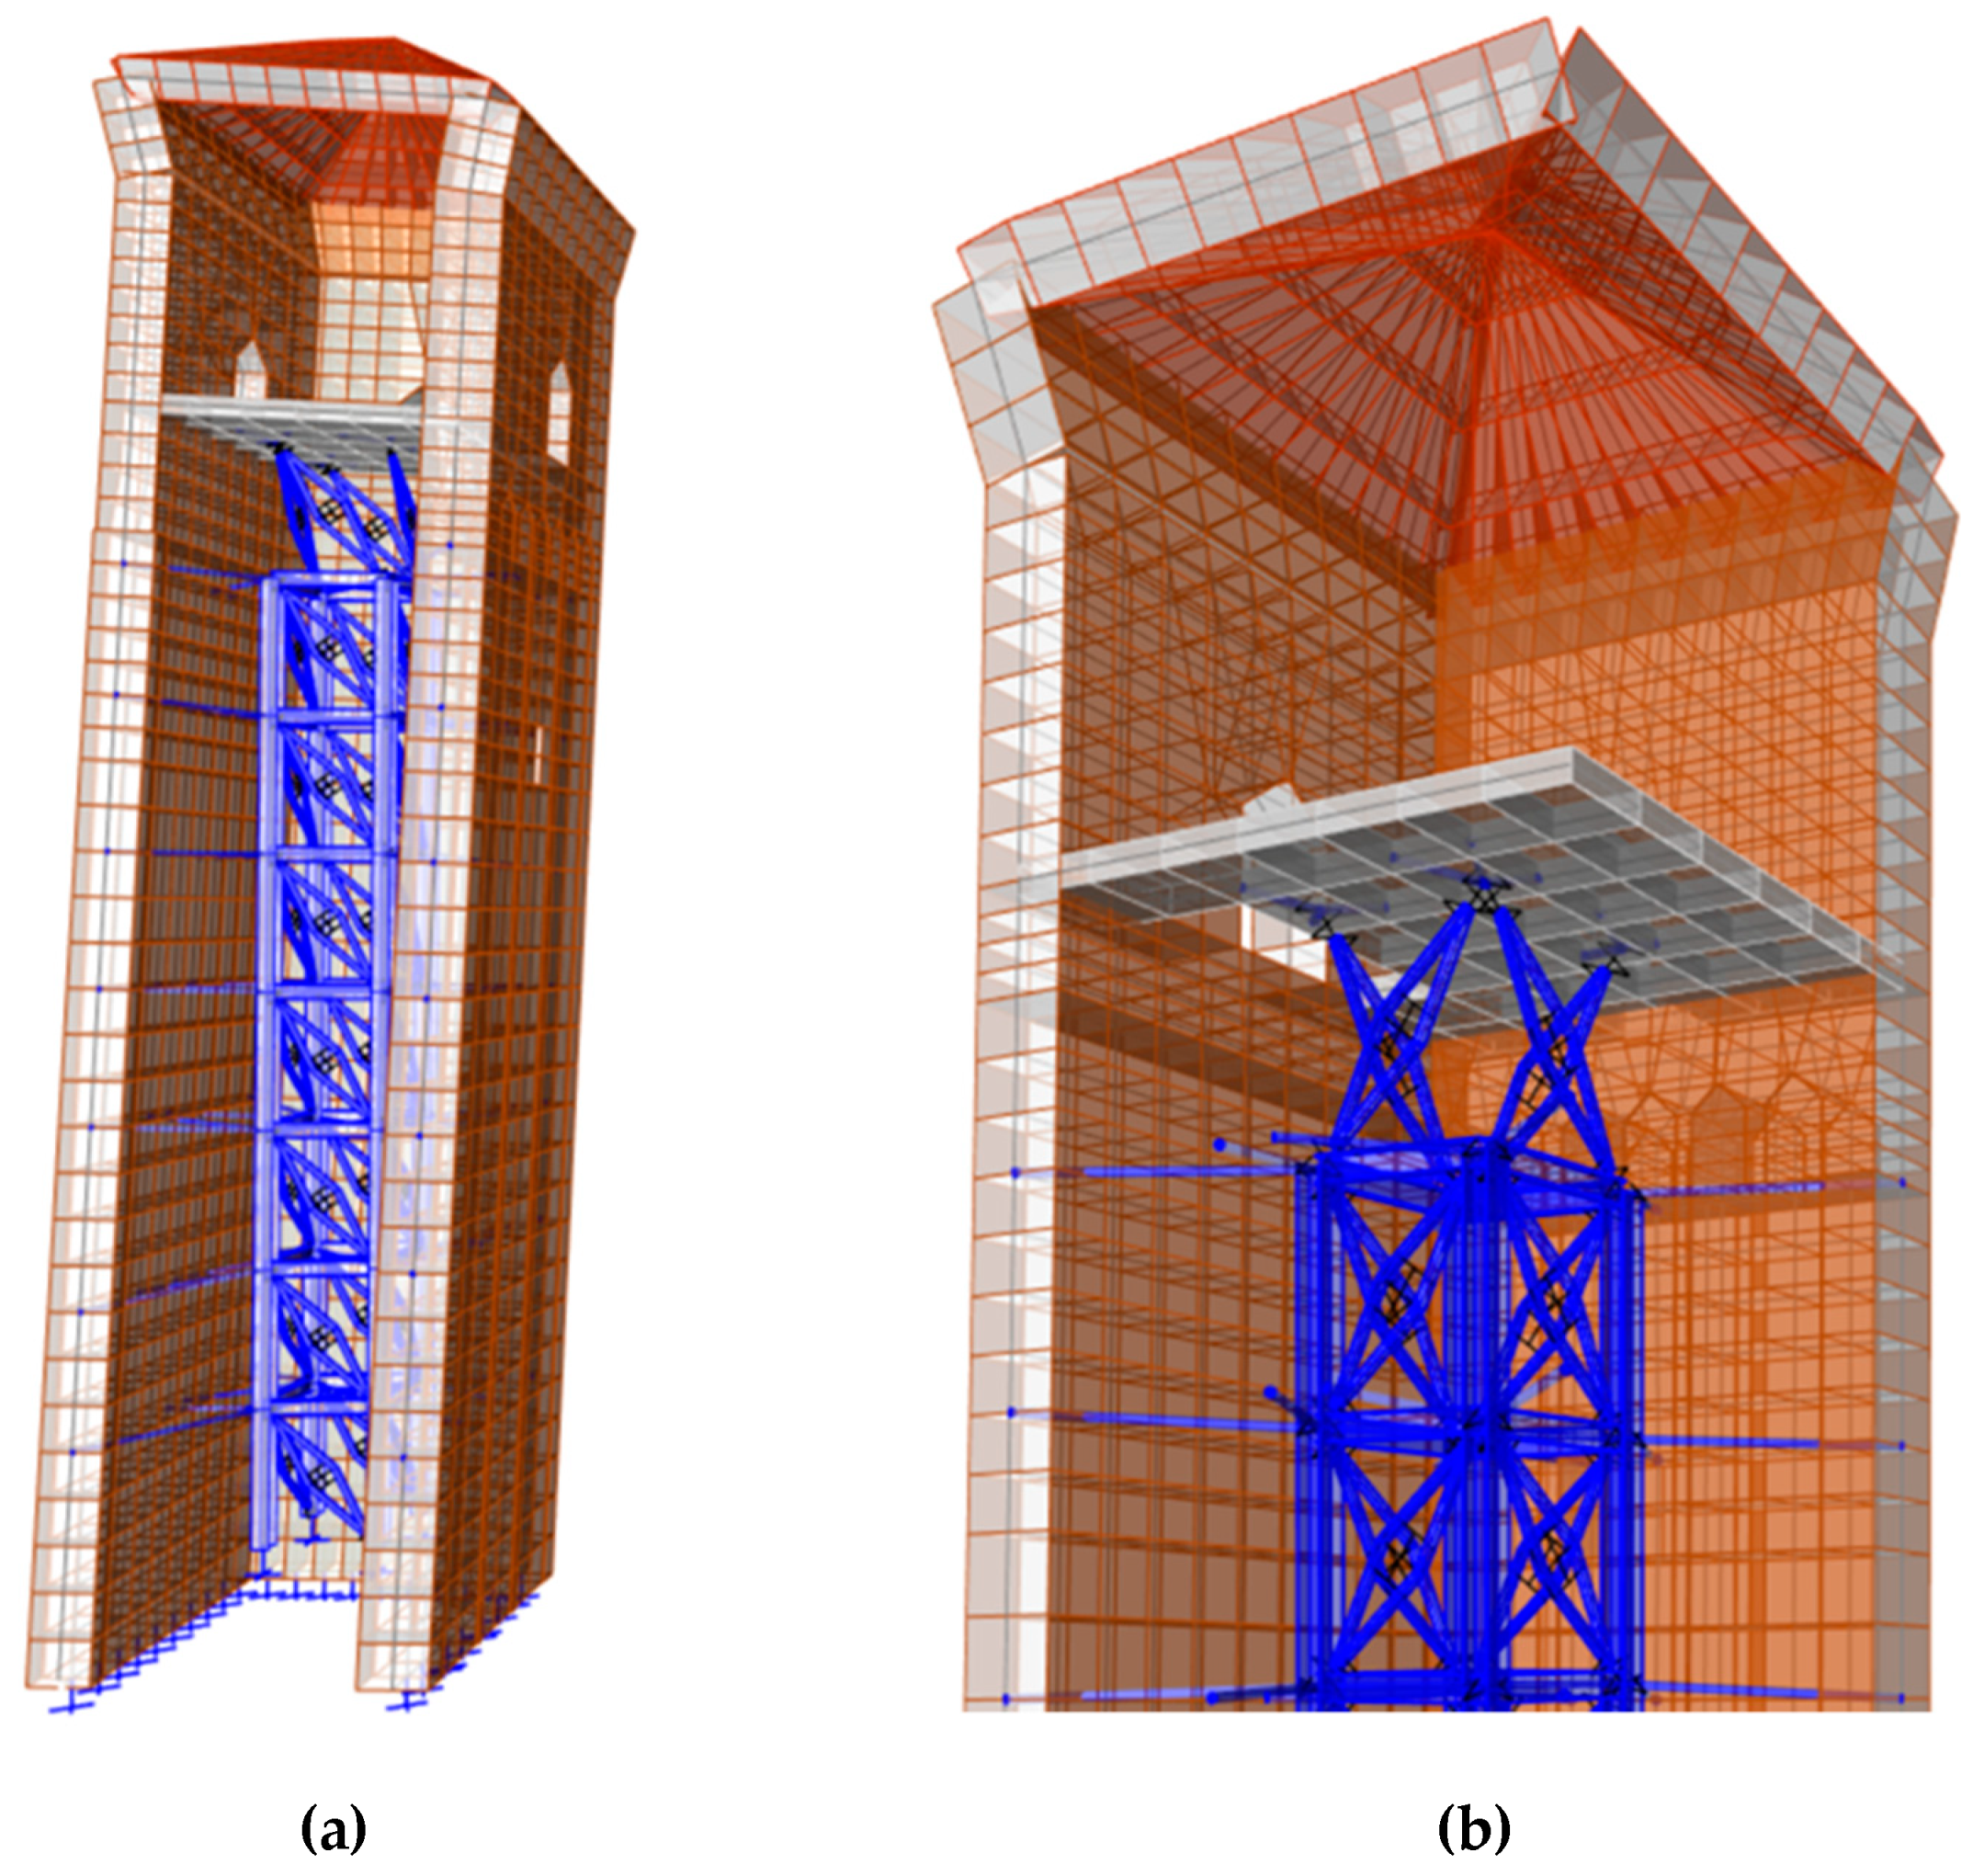
Figure 19.
Inner and outer tower finite element model: (a) global view; (b) detail of the steel tower connection to the reinforced concrete slab.
Figure 19.
Inner and outer tower finite element model: (a) global view; (b) detail of the steel tower connection to the reinforced concrete slab.

Figure 20.
Maximum displacement time series for the nonlinear dynamic case of analysis time history (TH) n. 2. Response comparison before and after retrofitting: (a) X direction; and (b) Y direction.
Figure 20.
Maximum displacement time series for the nonlinear dynamic case of analysis time history (TH) n. 2. Response comparison before and after retrofitting: (a) X direction; and (b) Y direction.

Figure 21.
Maximum absolute acceleration time series for the nonlinear dynamic case of analysis TH n. 7. Response comparison before and after retrofitting: (a) X direction; and (b) Y direction.
Figure 21.
Maximum absolute acceleration time series for the nonlinear dynamic case of analysis TH n. 7. Response comparison before and after retrofitting: (a) X direction; and (b) Y direction.

Figure 22.
Maximum displacements along the height of the tower, before and after retrofitting: (a) X direction; and (b) Y direction.
Figure 22.
Maximum displacements along the height of the tower, before and after retrofitting: (a) X direction; and (b) Y direction.

Figure 23.
Maximum absolute accelerations along the height of the tower, before and after retrofitting: (a) X direction; and (b) Y direction.
Figure 23.
Maximum absolute accelerations along the height of the tower, before and after retrofitting: (a) X direction; and (b) Y direction.

Figure 24.
Masonry median stress values (single shell element at the base of the tower). Comparison before and after retrofitting.
Figure 24.
Masonry median stress values (single shell element at the base of the tower). Comparison before and after retrofitting.

Figure 25.
Contour plot of S22 (vertical compression) stress values: (a) tower before and after retrofitting shown together by using the same contour interval ([−3000, 0] kN/m2); (b) tower after retrofitting shown alone with a specific contour interval setting ([−1500, 0] kN/m2). Results were derived from nonlinear dynamic analysis TH n. 2.

Figure 26.
Force-deformation cycles for dampers located at different levels of the inner tower. Nonlinear dynamic analysis TH n. 5: (a) X direction; and (b) Y direction.
Figure 26.
Force-deformation cycles for dampers located at different levels of the inner tower. Nonlinear dynamic analysis TH n. 5: (a) X direction; and (b) Y direction.

Figure 27.
Force-deformation cycles for dampers located at different levels of the inner tower. Nonlinear dynamic analysis TH n. 17: (a) X direction; and (b) Y direction.
Figure 27.
Force-deformation cycles for dampers located at different levels of the inner tower. Nonlinear dynamic analysis TH n. 17: (a) X direction; and (b) Y direction.


Table 1.
Modal properties.
| Mode [–] | T [s] | RX [–] | RY [–] | RZ [–] | ∑RX [–] | ∑RY [–] |
|---|---|---|---|---|---|---|
| 1 | 0.884 | 0.193 | 0.437 | 0.002 | 0.193 | 0.437 |
| 2 | 0.666 | 0.318 | 0.171 | 0.002 | 0.511 | 0.608 |
| 3 | 0.295 | 0.001 | 0.000 | 0.656 | 0.512 | 0.608 |
| 4 | 0.210 | 0.069 | 0.148 | 0.001 | 0.58 | 0.76 |
| 5 | 0.161 | 0.117 | 0.060 | 0.000 | 0.70 | 0.82 |
| 6 | 0.144 | 0.002 | 0.001 | 0.000 | 0.70 | 0.82 |
| 7 | 0.123 | 0.001 | 0.002 | 0.010 | 0.70 | 0.82 |
| 8 | 0.106 | 0.004 | 0.000 | 0.082 | 0.71 | 0.82 |
| 9 | 0.101 | 0.039 | 0.025 | 0.001 | 0.75 | 0.84 |
| 10 | 0.088 | 0.038 | 0.032 | 0.010 | 0.78 | 0.88 |
| 11 | 0.078 | 0.000 | 0.000 | 0.001 | 0.78 | 0.88 |
| 12 | 0.075 | 0.001 | 0.005 | 0.008 | 0.78 | 0.88 |
| 13 | 0.072 | 0.013 | 0.000 | 0.002 | 0.80 | 0.88 |
| 14 | 0.068 | 0.032 | 0.000 | 0.007 | 0.83 | 0.88 |
| 15 | 0.065 | 0.005 | 0.027 | 0.004 | 0.83 | 0.91 |
| 16 | 0.063 | 0.007 | 0.002 | 0.045 | 0.84 | 0.91 |
| 17 | 0.062 | 0.004 | 0.002 | 0.008 | 0.84 | 0.91 |
| 18 | 0.059 | 0.001 | 0.000 | 0.000 | 0.85 | 0.91 |
Table 2.
Supplemental damping system parameters.
| ξd [%] | Τ1 [s] | Nd [–] | fi [–] | n [–] |
|---|---|---|---|---|
| 20 | 0.88 | 2 | 2.80 1 | 11 |
1 The same geometrical scissor-jack-damper configuration is adopted at all the tower levels except for the last one (n), at which fn = 2.96.
Table 3.
Viscous damping coefficients (α = 1.0).
| Tower Level [–] | ci [(kN∙s/m)α] |
|---|---|
| 1 | 1000 |
| 2 | 993 |
| 3 | 968 |
| 4 | 927 |
| 5 | 868 |
| 6 | 788 |
| 7 | 676 |
| 8 | 543 |
Publisher’s Note: MDPI stays neutral with regard to jurisdictional claims in published maps and institutional affiliations. |
© 2021 by the authors. Licensee MDPI, Basel, Switzerland. This article is an open access article distributed under the terms and conditions of the Creative Commons Attribution (CC BY) license (http://creativecommons.org/licenses/by/4.0/).
Share and Cite
MDPI and ACS Style
Pavia, A.; Scozzese, F.; Petrucci, E.; Zona, A. Seismic Upgrading of a Historical Masonry Bell Tower through an Internal Dissipative Steel Structure. Buildings 2021, 11, 24. https://0-doi-org.brum.beds.ac.uk/10.3390/buildings11010024
AMA Style
Pavia A, Scozzese F, Petrucci E, Zona A. Seismic Upgrading of a Historical Masonry Bell Tower through an Internal Dissipative Steel Structure. Buildings. 2021; 11(1):24. https://0-doi-org.brum.beds.ac.uk/10.3390/buildings11010024
Chicago/Turabian StylePavia, Arianna, Fabrizio Scozzese, Enrica Petrucci, and Alessandro Zona. 2021. "Seismic Upgrading of a Historical Masonry Bell Tower through an Internal Dissipative Steel Structure" Buildings 11, no. 1: 24. https://0-doi-org.brum.beds.ac.uk/10.3390/buildings11010024
Note that from the first issue of 2016, this journal uses article numbers instead of page numbers. See further details here.