1. Introduction
Building energy efficiency attracts enormous attention from industry and academia. Buildings take up more than one third of the world’s total energy use [
1]. In the United States, increasing building energy demands resulted in a 60% growth in electricity generation in the past 30 years, making the US the second largest electricity consumer in the world [
2]. Needless to say, there is a great potential to reduce greenhouse gas emissions and pursue the ultimate goal of sustainability by improving building energy performance. Building energy modeling (BEM) is one of the most effective paths to enable an energy–efficient built environment, which assists in both the design and operation phases of a building. A valid simulation model makes it convenient for users to assess building energy performance, identify system control strategies, and explore opportunities for occupant comfort enhancement [
3]. In current BEM approaches, a wide range of factors associated with building energy use can be captured and simulated, such as: (1) climate, (2) building characteristics and material properties, (3) building service systems and user-related operation, (4) economic factors, (5) indoor environmental quality and other criteria, and (6) occupant behavior and activities [
4,
5]. However, as potentially one of the most significant factors for building energy use, occupant behaviors are often neglected or mis–estimated in most BEMs, which result in shortcomings including simulation accuracy and functionality limitations [
5,
6]. The most common method for representing occupant behaviors in BEM is to use a representative or unified profile based on surveys or observations from occupants in similar buildings, which are usually defined by organizations such as ASHRAE [
7]. In reality, not only do occupants dynamically interact with building components and systems, but each individual may also act and react differently within a building. This issue is one of the main reasons that leads to a gap between predicted and measured building energy consumption [
8]. Studies have indicated that the discrepancy can be as large as 30% [
9].
Consequently, researchers have modeled building occupant behaviors for the purpose of providing more comprehensive information for building design and operation [
10,
11]. Related studies started by tracking occupant presence/absence status and the number of occupants in rooms or buildings [
12,
13,
14], which is referred to as “occupancy” information. However, occupancy is passive data and is less complicated to model in contrast to active behaviors of occupants in the building. Occupant behaviors are related to more elements and thus are more complex in terms of the format and context. For instance, occupant behaviors can be divided into interactions with the building (e.g., open/close window, adjust lighting) and personal activities (e.g., walking, sitting, reading) with regards to behavior types. In addition, occupants have different behavioral patterns within different building types, such as commercial and residential buildings. Accordingly, various modeling approaches have been proposed to understand occupant behaviors from diverse perspectives [
15].
Since the primary goal of studying occupant behaviors in the context of the built environment is to implement more energy–efficient buildings, it is necessary to investigate the impact brought by building occupants to its overall performance. Generally, there are two approaches, i.e., using measured and observed data, or building simulation models. On one hand, several studies focused on monitoring electricity use and thus derived behavioral patterns based on the usage of certain appliances or equipment to analyze how occupants affect energy use [
16,
17]. On the other hand, more researchers tend to use building energy models to virtually evaluate the influence. In [
18], the researchers implemented a few occupant behavior models from the literature using a building energy modeling tool—EnergyPlus™ [
19], to compare the effect and practicality of those models. It was found that model predictions vary significantly from one model to another. Recently, it was identified that the generality, flexibility, and interpretability and comprehensiveness of simulation outputs can be improved through a seamless integration of a robust occupant behavior model to existing building simulation tools [
20]. An active information exchange system increases the capability of quantifying the impact of occupant behaviors. This can help system optimization and update according to occupant needs and preferences inferred through behavior pattern analysis or encourage behavior modification based on sensitivity analysis.
This paper presents a study that combines both observed data and simulation model for occupant behaviors as separate scenarios, in order to assess the impact on building performance of different occupant behaviors profiles. In this paper, the scope of occupant behaviors is defined as interactions with windows, doors, and window blinds. Only single–occupancy offices are used as test bed spaces. A BEM is developed with a common building simulation tool, EnergyPlus™, based on an actual educational building. Then, an occupant behavior model using an agent–based modeling (ABM) approach in a human behavior modeling platform is applied in a co-simulation framework with the BEM. The occupant behavior model mimics how occupants adapt to the surrounding building components under changing ambient conditions [
21]. In addition, an on–site survey is conducted to collect actual behavioral records of selected building occupants, as another source of input for the BEM. Finally, a simulation experiment with three scenarios is conducted to compare the building energy simulation results within the behavior data collection period. The proposed research method can also be expanded to other behaviors or building types. A preliminary study of the authors [
22] was conducted to understand the interactivity of the ABM and EnergyPlus™. In this paper, we expanded the simulation scenarios and focused on how different occupant behaviors input influence building performance from two aspects: building energy use, and occupants’ comfort level. The implementation of the co-simulation function is also described in detail for feasibility discussion of the ABM platform.
This paper’s contribution is two–fold: first, the simulation experiment quantifies the mutual impact of building and its occupants, under multiple behavioral input using the same test bed, essentially enabling the test bed to plan energy conservation measures (ECM); and second, the findings of this study reveal potential development areas and open up avenues for future enhancement of BEM tools.
2. Related Research
Integrating occupant behavior information with BEMs will be able to quantitatively describe the influences of occupant behaviors on building performance [
23,
24,
25,
26]. Additionally, the information has the potential to diminish the discrepancy between measured and simulated energy consumption in buildings. A common method to compare impact of different behavior patterns in simulation tools is to pre–define multiple categories of occupants in terms of their behavioral attitude towards building energy use and use specific features to characterize these generic occupant categories. Sun and Hong [
27] presented a framework to evaluate the energy saving potentials of energy conservation measures based on three occupant behavior styles. Specifically, austerity, normal, and wasteful styles were defined to represent the proactive energy savers, average occupants, and energy spenders. To distinguish these styles, seven parameters with each related to one behavior were used. With several energy conservation measures being introduced in the building energy model, guidance can be provided to interpret corresponding energy conservation measures savings to support future decision making. Similarly, Peng et al. [
28] generalized human behaviors in residential buildings into time related, environmentally related, and random modes. They described three typical lifestyles in China in terms of energy use habits, and only compared their differences with air conditioning (AC) usage conditions. Simulation results for four days showed an obvious difference in AC operation schedules, indoor temperature fluctuations, and household load, etc. Azar and Menassa [
29] developed an occupant behavior model to study the interactions among occupants. They assumed that high energy consumers and medium energy consumers will eventually turn into low energy consumers, given events of energy conservation training and individual preaching. To quantify the impact of occupants on energy use, window blind position, lighting and equipment schedules, and water consumption were selected to reflect three types of occupants. The study found a gradual drop over a three-year simulation in a box–shape building. Wang and Greenberg [
30] specifically focused on window operation behavior and the impact on indoor environment and building energy consumption. A medium–size office building consisting of 15 thermal zones was used as the BEM prototype. Four simulation scenarios with different control strategies for window operation and related parameters were created using the energy management feature in EnergyPlus™. The results of that research highlighted observable heating, ventilation, and air conditioning (HVAC) energy savings with a mixed–mode ventilation.
It can be noted that the majority of the previous research that attempted to study the impact of occupant behavior information in a BEM used pre–defined behavior patterns before simulating building performance. Although this approach can provide valuable information about the impact of occupant behaviors on building performance and promote better design decisions, it suffers from some disadvantages. For one, the assumed behavior types may not represent the occupants holistically, and the classification method could be subjective and generalized for obtaining reliable and convincing results. Furthermore, as occupants behave dynamically in the building, these pre–defined settings always stay constant during the simulation process, which deviate from the reality significantly. To address this issue, some studies applied empirically developed models to BEM for a more dynamic behavior information input. Gilani et al. [
31] adopted three probabilistic occupant models derived from other researchers’ studies about occupancy, light switch, and window blind use and implemented them in the energy management system (EMS) feature of EnergyPlus™. As the behavior probability changes with the update of relevant environmental factors, the simulated results can improve when compared to the actual data. In [
32], the objective behaviors included both window opening and thermostat adjustment, and the occupant behavior model implemented in the BEM was based on a multiple logistic regression model with statistical data of 15 buildings over eight months. In general, this method was considered more dynamic as opposed to a static setting throughout the whole simulation process but was less transferable to other building models as the statistical coefficients rely on the particular data collection target.
In recent years, a more advanced technique, namely co-simulation, was used to combine BEM with an independent occupant behavior model. co-simulation increases the model flexibility, but the approach is not yet sophisticated, since only a few researchers applied this method for the research topic. One example is from Lee and Malkawi [
33], wherein the researchers integrated an ABM programmed in MATLAB with EnergyPlus™. In a similar way, Langevin et al. [
20] paired a model of occupants’ thermal comfort and adaptive behaviors with whole building energy simulation of office buildings, and examined the simulation results from the energy, indoor environmental quality, and cost perspectives. However, these two studies narrowly focused on the thermal condition as the trigger mechanism for the modeled behaviors. Hong et al. [
34] and Chen et al. [
35] considered a relatively comprehensive scenario in which different environmental indicators were involved. They developed an ABM named obFMU that could simulate the presence, movement, and interaction with building equipment of each occupant. obFMU uses the Functional Mock–up Interface (FMI) of EnergyPlus™ for co-simulation purpose instead of using a separate tool. Yet, the studies of obFMU focused on the simulation functioning implementation and application testing, rather than behavior impact analysis for the building performance.
Although co-simulation can be a feasible solution for improving building energy simulation, the performance largely depends on the occupant behavior model. In most cases, the behavior model and BEM often relied on simulations rather than actual data input. This, on one hand, is inevitable as building simulation models were usually used during the design process, and therefore the actual occupant behaviors are unknown. Andrews et al. [
36] generated synthetic population data with the combination of three data sets from different sources in field surveys and stated that the combined data inherits characteristics of all the field data sets which satisfied the needs of the associated modeling framework. However, on the other hand, using actual occupant behavior information of an existing building in a BEM may help optimize operation and control for the building, and yield more thorough and holistic understanding of building occupants for future building design. The study of Blight and Coley [
37] applied realistic data relevant to occupancy, lighting, and appliance use in a BEM, and established a regression equation to test the impact of behavioral variables on space heating demand. The researchers found the buildings in their experiment were less sensitive to behavior than anticipated.
In summary, a systematic approach to incorporating occupant behavior information in a BEM to comprehensively investigate the impact of occupants is still a critical need. To the best of the authors’ knowledge, this paper is the first–ever attempt to combine and compare a simulation–based occupant behavior model and actual behavior record as two data sources for input in a BEM based on a realistic building. The paper also compared results among multiple zones (occupants) to seek individual differences from both the building’s and occupants’ perspectives.
3. Methods
This section briefly discusses the development of the occupant behavior model and acquisition of actual behavior records, followed by detailed methods of using the two sources of occupant behavior information in a BEM as a simulation case study.
3.1. Overview of ABM–Based Occupant Behavior Model
An agent–based modeling approach was adopted to mimic building users’ behavior patterns under certain indoor and outdoor conditions [
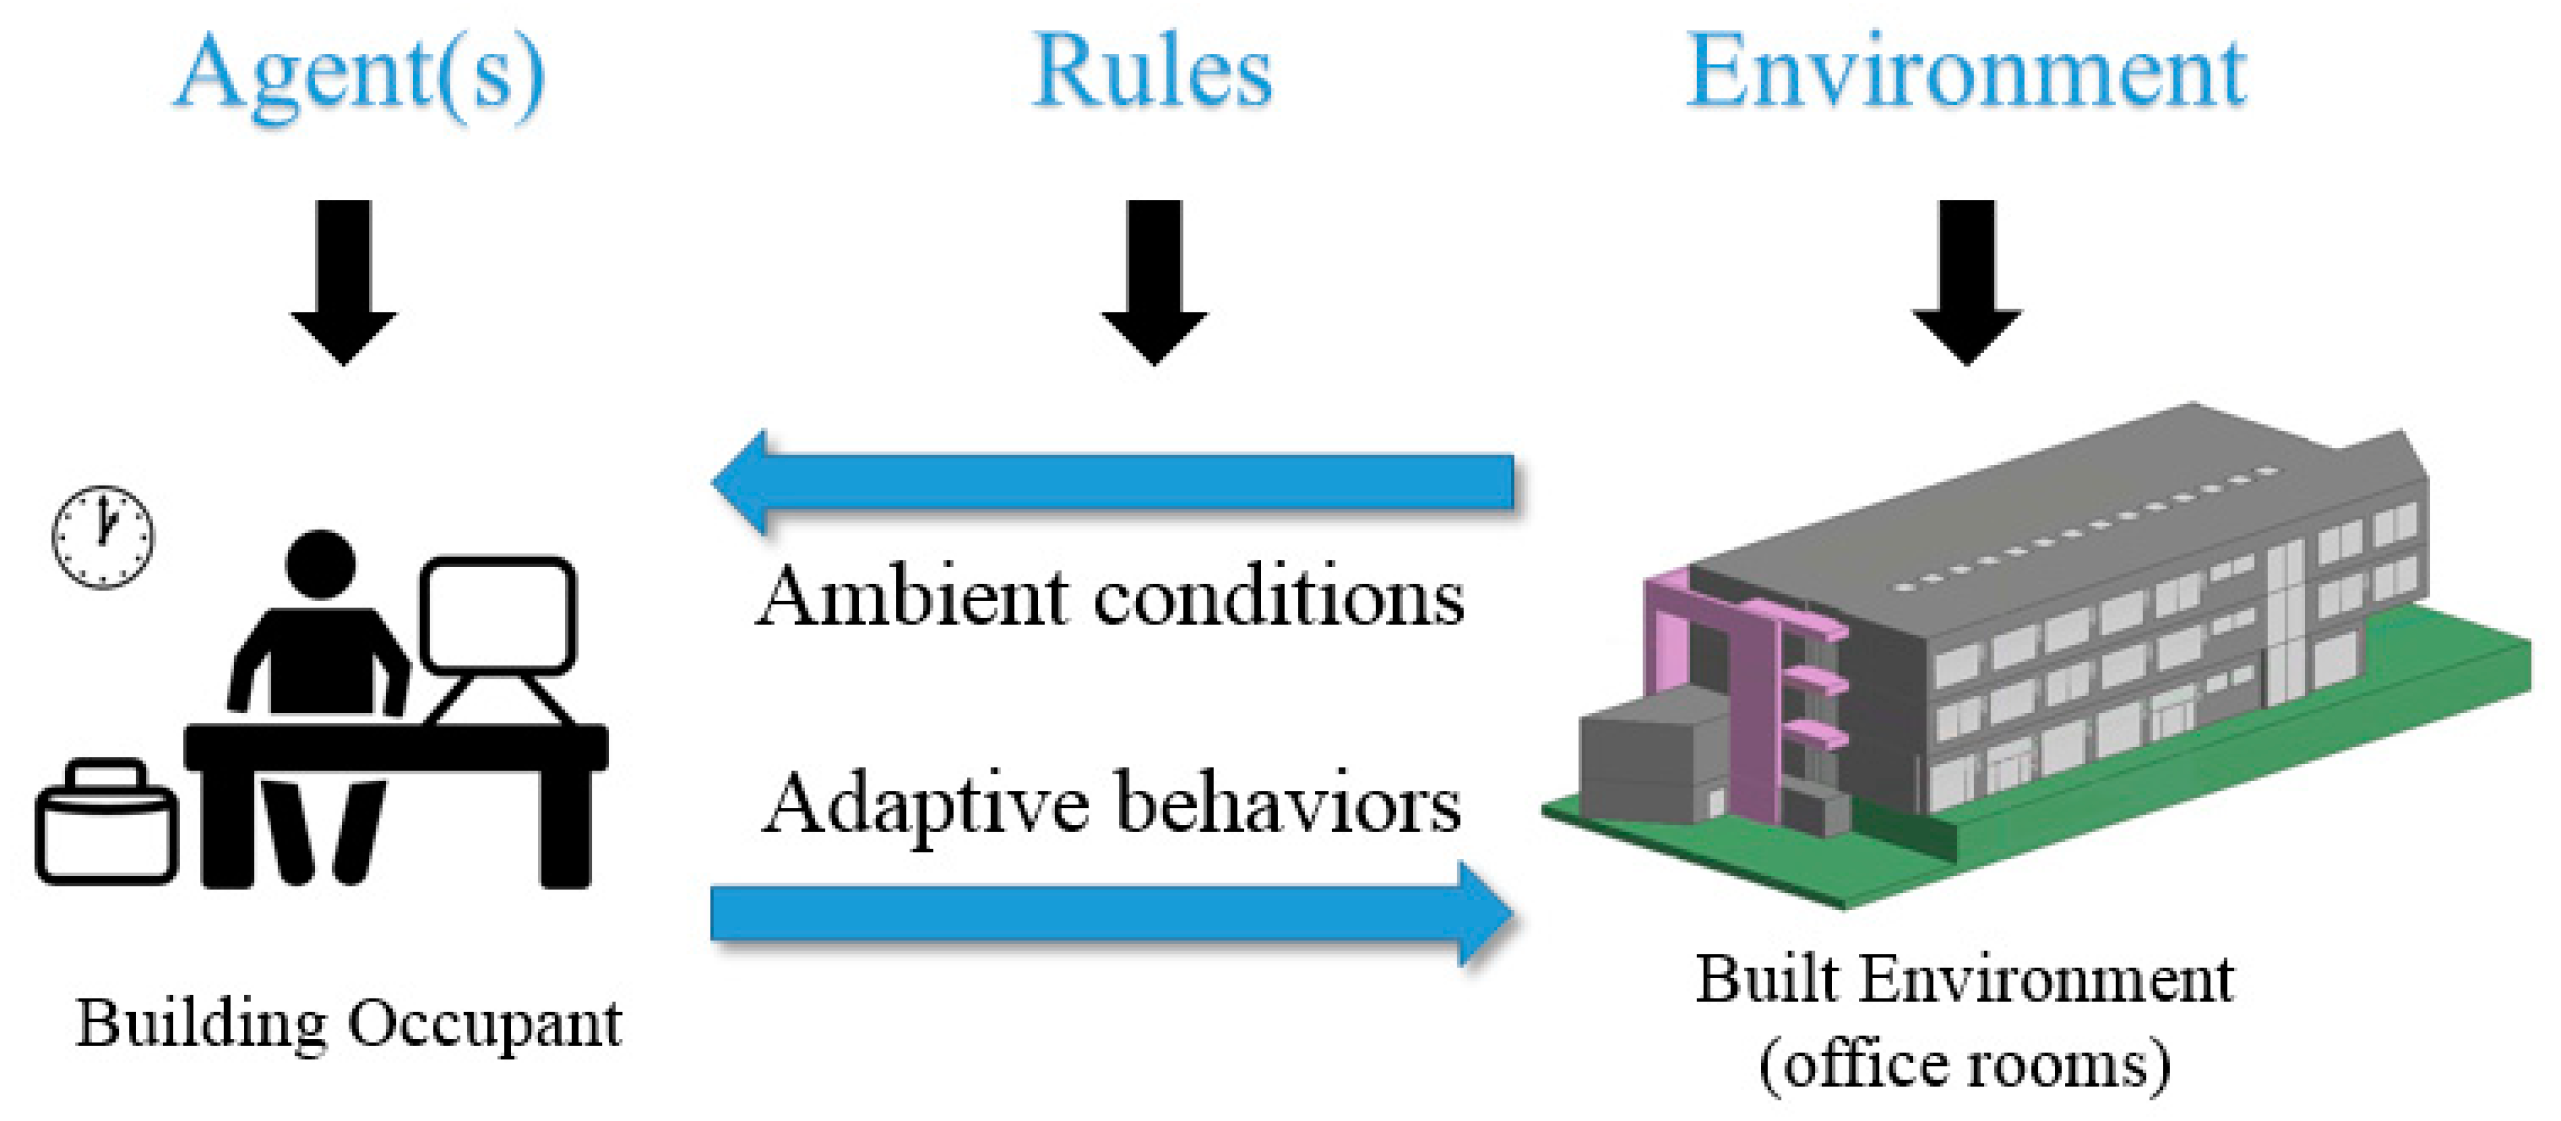
21]. The building occupant was virtualized in a human behavior modeling platform that considers the external context and internal value systems of the agent. Specifically, for office buildings, the surrounding environmental conditions have been recognized by many researchers as the main stimulus that results in behavior adaptations. An overview of the ABM development scheme is depicted in
Figure 1, where the three elements for an ABM are projected to the context of commercial buildings. On one hand, a series of environmental variables that can be perceived by the agent were created as model
inputs, as well as supporting parameters such as comfortable ranges. These environment indicators directly influence certain perceptions of agents including thermal, visual, and air quality comfort. On the other hand, related cognitive value senses and the agent’s innate properties are, in turn, aroused by the perceptions that are associated with input values, thus activating the available behavior options for the agent to adapt to the ambient conditions. Finally, the
output of the ABM is the agent’s decision on which behavior to take at the given time step. The modeled behavior options are aligned with reality of the test bed building in this paper. According to the observation and interviews with building occupants, three behaviors, namely interactions with windows, doors, and blinds were modeled, due to the fact that most of the studied occupants have access to these building components while other available behavior options are not common and not shared by the population. In addition, interactions or communications between different occupants were not included in the model as the research scope is limited to single–occupancy offices. Since the focus of this paper is not on the development and characteristics of the occupant behavior model, details are available in [
21] for reference.
The ABM was developed in a unique human behavior modeling platform—PMFserv [
38]. The major novelty of the ABM is the consideration of different perceptual types, as well as the value systems of human. The ABM executes on a time–step basis (15-min in this case) for the purpose of integration with EnergyPlus™. The application of the ABM was implemented in a co-simulation framework at the zone level, which is discussed in
Section 3.3.
3.2. Behavioral Record Acquisition Methods
In order to have a comprehensive understanding of the impact brought by occupant behaviors, a paper–based survey was conducted to record the actual behavior data related to the studied building components. A survey sheet was designed in tabular form, with the row filled with time stamps of 15 min from 8:00 a.m. to 5:00 p.m. for one day, and column information associated with the status (e.g., open or closed) of the three building components. For the data collection period, the occupants in the experiment were asked to manually mark the corresponding box when a behavior occurs at a certain time stamp, for the days they are staying in the office for more than 15 min. The occupants were also allowed to provide more information in the sheet, such as the times when they are absent from the office, or overtime working hours beyond the given time frame. It is noted that the time granularity degree was determined based on two aspects. First, a 15-min interval can sufficiently cover the frequency that occupants generally operate on the building components; second, the information can be directly imported into EnergyPlus™ as external data input, and the impact of the behavior changes can be captured for four time steps an hour. Moreover, the survey design of one sheet per day was considered as a concise and clear format for manual recording of events.
The behavior record acquisition was performed in the same test bed building on which the ABM is based, an educational building in the University of Florida campus, Gainesville, Florida, USA. Five faculty offices situated at the third level of the building were used for data collection. The selection of occupants relied on a variety of aspects including gender and age. Each occupant was given one month of survey sheets, and approximately four weeks of behavior records were returned given the occupants’ schedules. All the occupants recorded their behavior over the same experimental time period. To validate the reliability of manually recorded behavior data, an off–the–shelf magnetic sensor system was installed in one of the experiment rooms for window and door status measurement. The collected data over the period showed a good matching result with paper–based survey in that room.
The behavior record was not only used for the simulation study, but also for a validation study of the ABM. Over the same time period, each office in the study was equipped with a smart sensor node with several environmental sensors to collect relevant ambient data. The environmental data served as input for the ABM, and the simulation outcome of the ABM was systematically compared with actual behavior record to examine the ABM’s performance in predicting behaviors. The reader is referred to [
21] for details on the ABM validation study.
3.3. Co-Simulation Implementation
In office buildings, occupants tend to interact with accessible building components, appliances, or systems to adapt to their working environment based on their comfort perceptions [
39,
40]. As shown in
Figure 1, a building and its occupants influence each other mutually and dynamically. Hence, this mutual interaction must be reflected in the building energy model to simulate a virtual environment that is closer to reality. Considering the developed ABM as a valid black–box model that can provide occupant behavior information to BEM, integration of the two models is necessary to realize the goal.
Similar to the co-simulation studies by other researchers but uniquely designed for our platform, a framework between the ABM and BEM engine was implemented. The integration process works as follows. At the starting point of the co-simulation, the BEM created in EnergyPlus™, initializes all the necessary parameters, and runs simulation on a time–step basis. At each time step, EnergyPlus™ calculates and outputs the zone–level environmental conditions to the occupant behavior model (ABM created in PMFserv). Meanwhile, user–defined occupancy status is also transmitted to the ABM. With the updated information, the agent will perceive the level of comfort and make a decision on what action to take that can satisfy his/her most urgent comfort needs, if the agent is present in the room at the moment. The outcome generated in the zone is then transmitted back to EnergyPlus™ as the input for the next time step, where corresponding schedule settings are adjusted if needed to reflect the particular behavior change for the calculation in the next time step. This procedure repeats as the two simulators exchange data at each time step in a loop until the end of the simulation period. The entire workflow runs automatically via a bridging program, namely the Building Control Virtual Test Bed (BCVTB), with the time step defined by user. BCVTB is a software environment that allows users to couple different simulation programs for co-simulation [
41].
Figure 2 conceptually illustrates the input and output exchange principle for the two simulation tools.
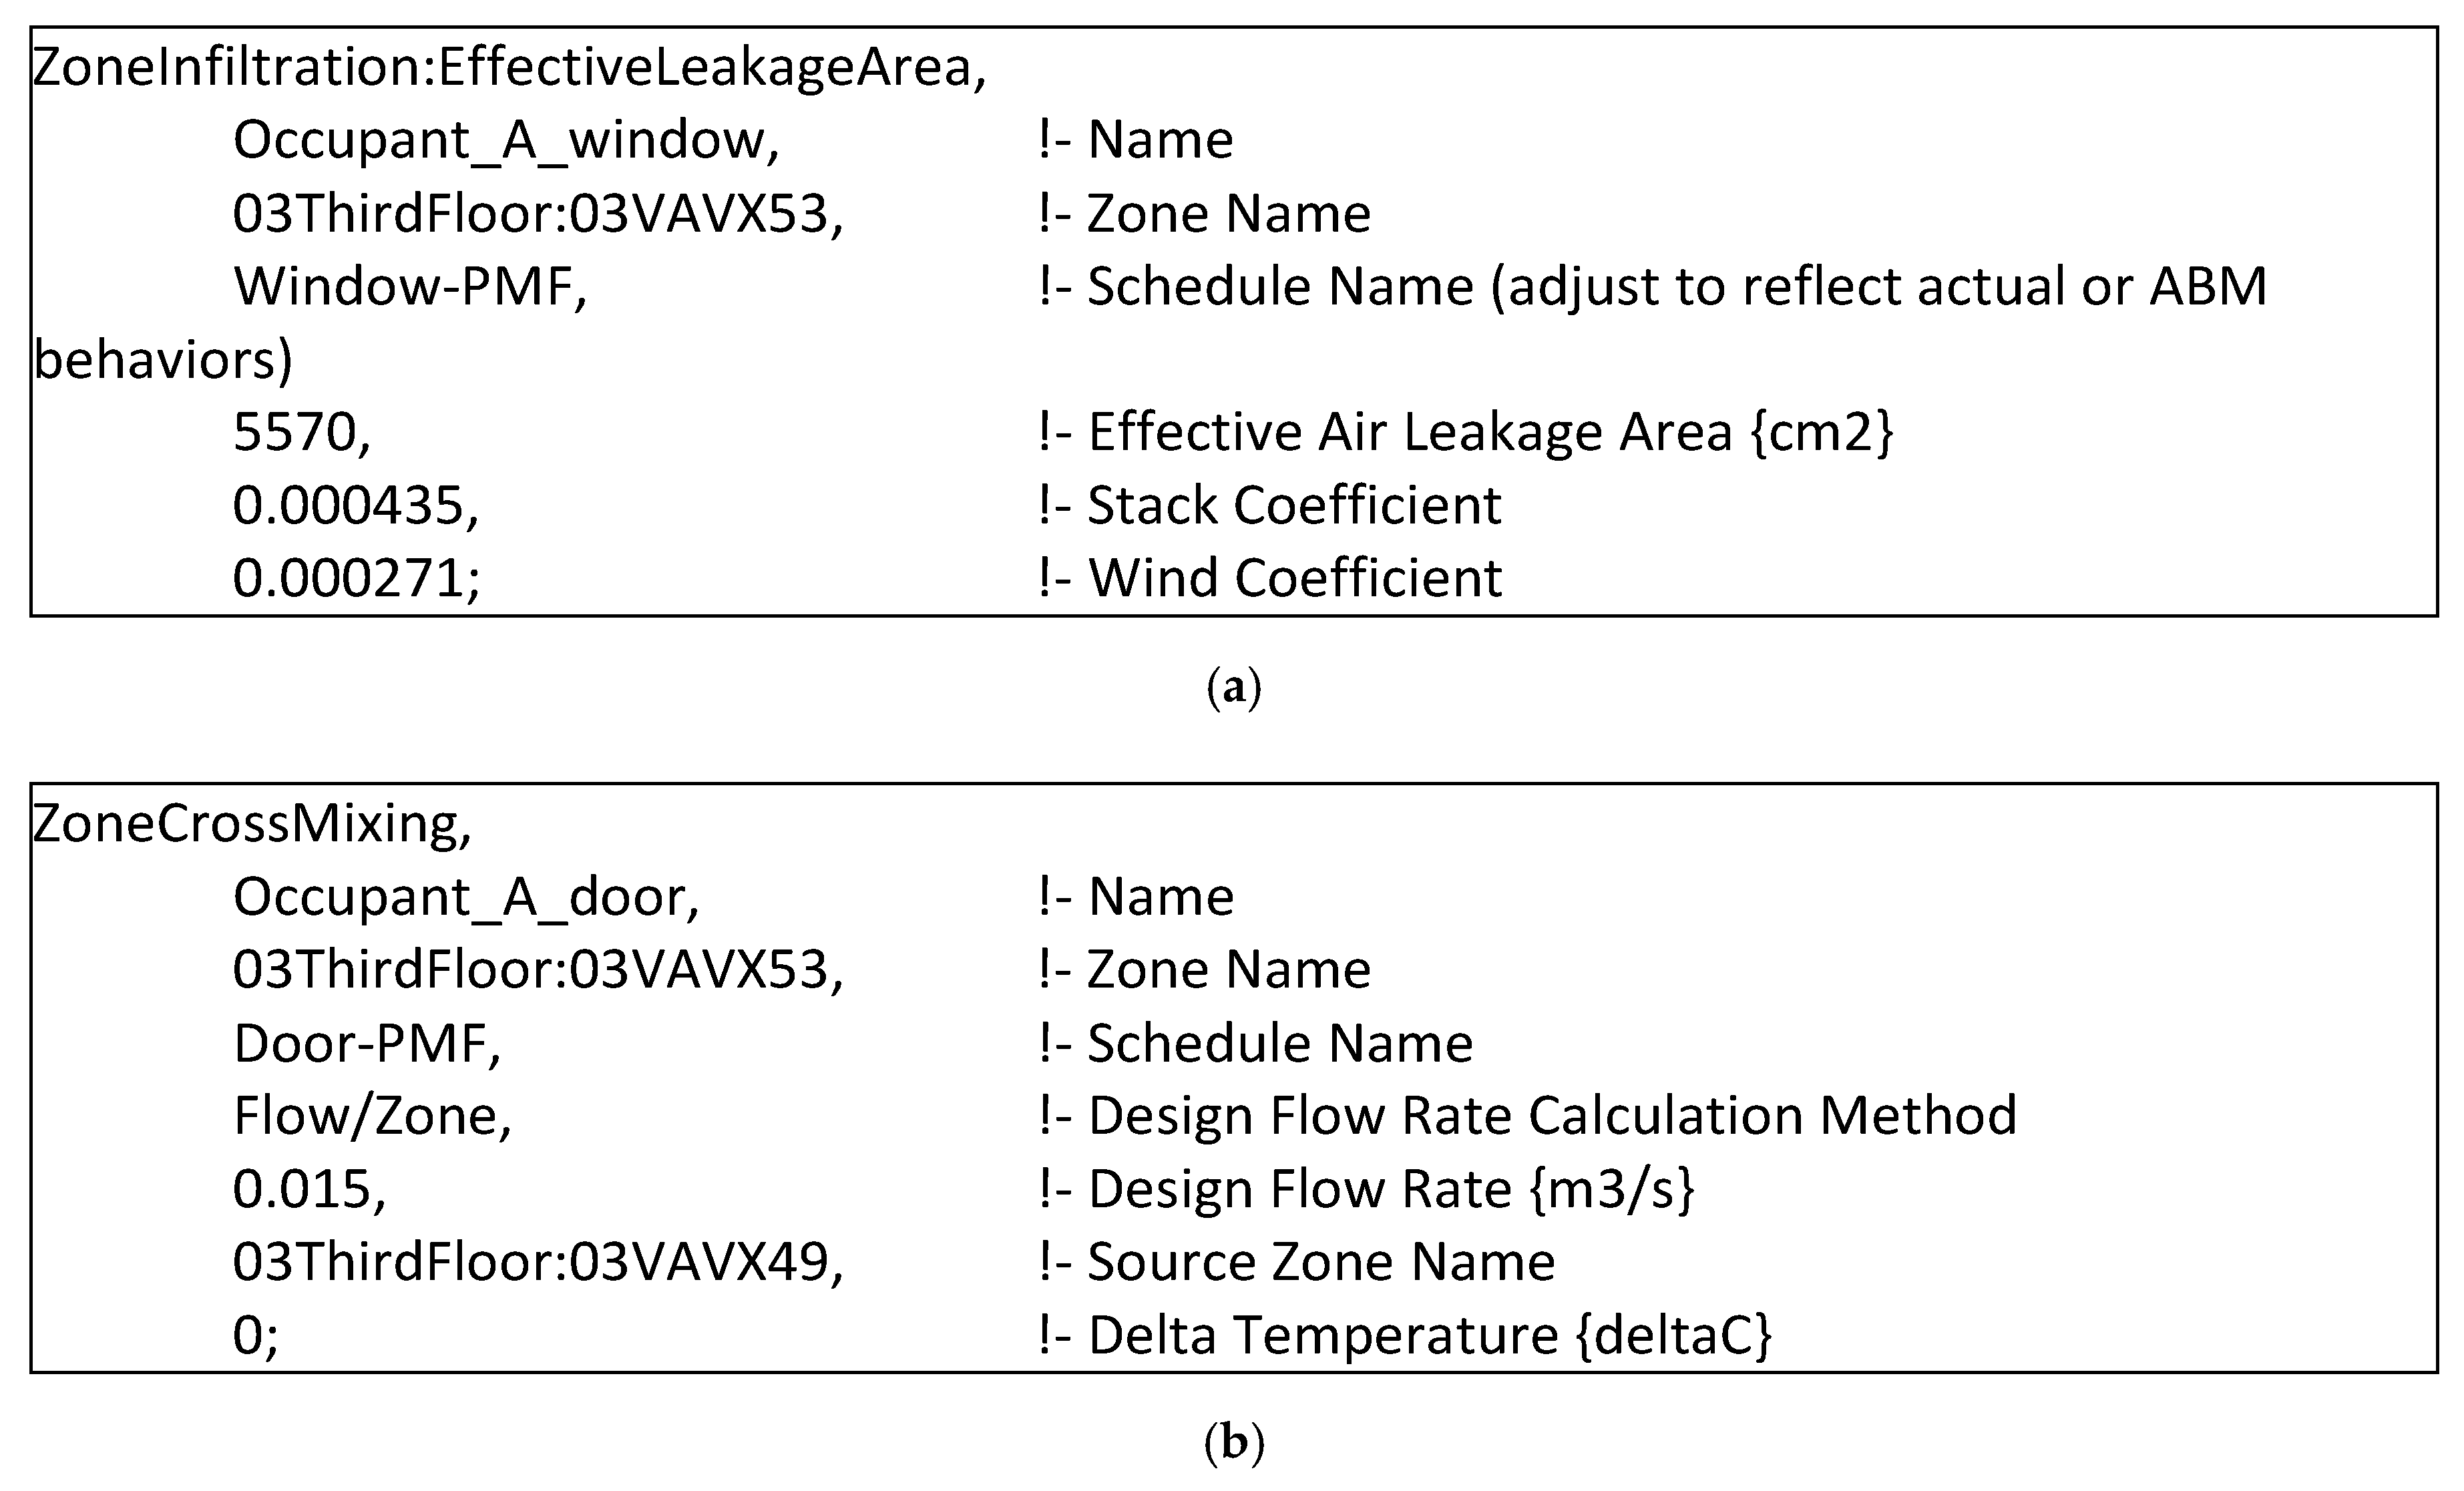
As shown in the co-simulation diagram, at the EnergyPlus™ interface port, the schedules of targeted building components need be manipulated in certain field of the engine to represent a behavior change.
Table 1 presents the field settings of behavioral adaptations for the three building components. It is noted that the selected objects are among one of the available parameters to reflect these behaviors, while more detailed modeling can be implemented. In addition, in this research, the status of these modeled objects is only defined in two modes, namely “open” or “closed”. In other words, the values in the schedule for each field are either “1” or “0”.
At the ABM interface port, the occupant behavior model takes seven input variables from EnergyPlus™, including indoor and outdoor temperature and humidity, CO2 concentration, illumination, and occupancy at the zone level, and then, outputs all the building component status under the current conditions in a vector form.
Finally, BCVTB connects the two simulation engines by establishing internal links to both ends. When executing the co-simulation function, BCVTB allows arguments for both simulators, which increases the flexibility of the framework. Different models could be loaded to the two simulation tools to enable co-simulation without the need of developing a whole new structure in the bridging program. In
Section 3.3.1, a specific data exchange schema under this co-simulation architecture based on the case study building is described.
3.3.1. Co-Simulation Data Exchange Schema
The co-simulation framework requires four main steps under the BCVTB virtual environment. First, the variables to be exchanged between two simulation tools were identified. For the ABM (PMFserv), seven input variables are needed that are output from EnergyPlus™ at each simulation time step, as stated above. Therefore, corresponding or equivalent output parameters in EnergyPlus™ were confirmed from the output list file. For the BEM, field values in
Table 1 would be updated based on the ABM output vector to represent the operation of window, door, and blinds.
Next, EnergyPlus™ was configured for co-simulation. To activate the external interface of EnergyPlus™, objects must be created and initiated with name and values to which the external interface writes [
42]. Details of this configuration are shown in
Figure 3. The schedule updates from the external interface were used in the objects and fields related to the corresponding building components, which is similar to the survey–based simulation scenario (see
Section 3.4.1 for details).
Third, an XML file was created that maps the data to be exchanged between EnergyPlus™ and PMFserv and specifies the order of the input/output signal vector. In
Appendix A Figure A1, sample code is shown for the XML file that describes the data exchange mechanism for one occupant. Then, a graphical model (Ptolemy II) was created in the BCVTB graphical interface to establish a logical connection for the two simulators. Some auxiliary modules were also created and connected for input/output format manipulation and real–time results showing during the simulation process, as shown in
Figure A2.
Finally, PMFserv must be configured to be called by BCVTB. An executable application was developed based on the prototype model and simulation scenario created in the graphical interface of PMFserv. To comply with the input/output format with EnergyPlus™, the application was configured to receive the environment and occupancy data from EnergyPlus™ and feed the values to corresponding parameters in the “Built_Environment” object in PMFserv (
Table 2). After the internal calculation of the utility of each behavior option, the application updates the status of the three building components according to the behavior decision at each time step and outputs a vector consisting of the current status that is returned to EnergyPlus™ for the next simulation time step.
After the configurations are completed, BCVTB can start the co-simulation process as the manager. The simulation period and time step settings were defined in the bridging program in correspondence with the same field values in EnergyPlus™.
3.4. Simulation Experiment Design
The co-simulation function is able to apply the occupant behavior model to provide dynamic behavior information for building energy estimation. From a result–oriented perspective, the supplementary information could potentially improve the simulation performance, especially with the occupant behavior model being validated at certain extent. However, the ABM may not fully represent the actual behavior patterns for all the building occupants, and EnergyPlus™ may not be able to replicate the building and environmental conditions. As a result, the application of the ABM, though validated in a certain form, does not necessarily result in higher estimation accuracy for the BEM. Therefore, it is significant to involve actual behavior records in the BEM as a gauge to evaluate the simulation results as a whole. Besides, feeding different types of behavior information into EnergyPlus™ can help understand and quantify the impact of occupant behaviors to building performance simulation, so that corresponding energy conservation policy can be established.
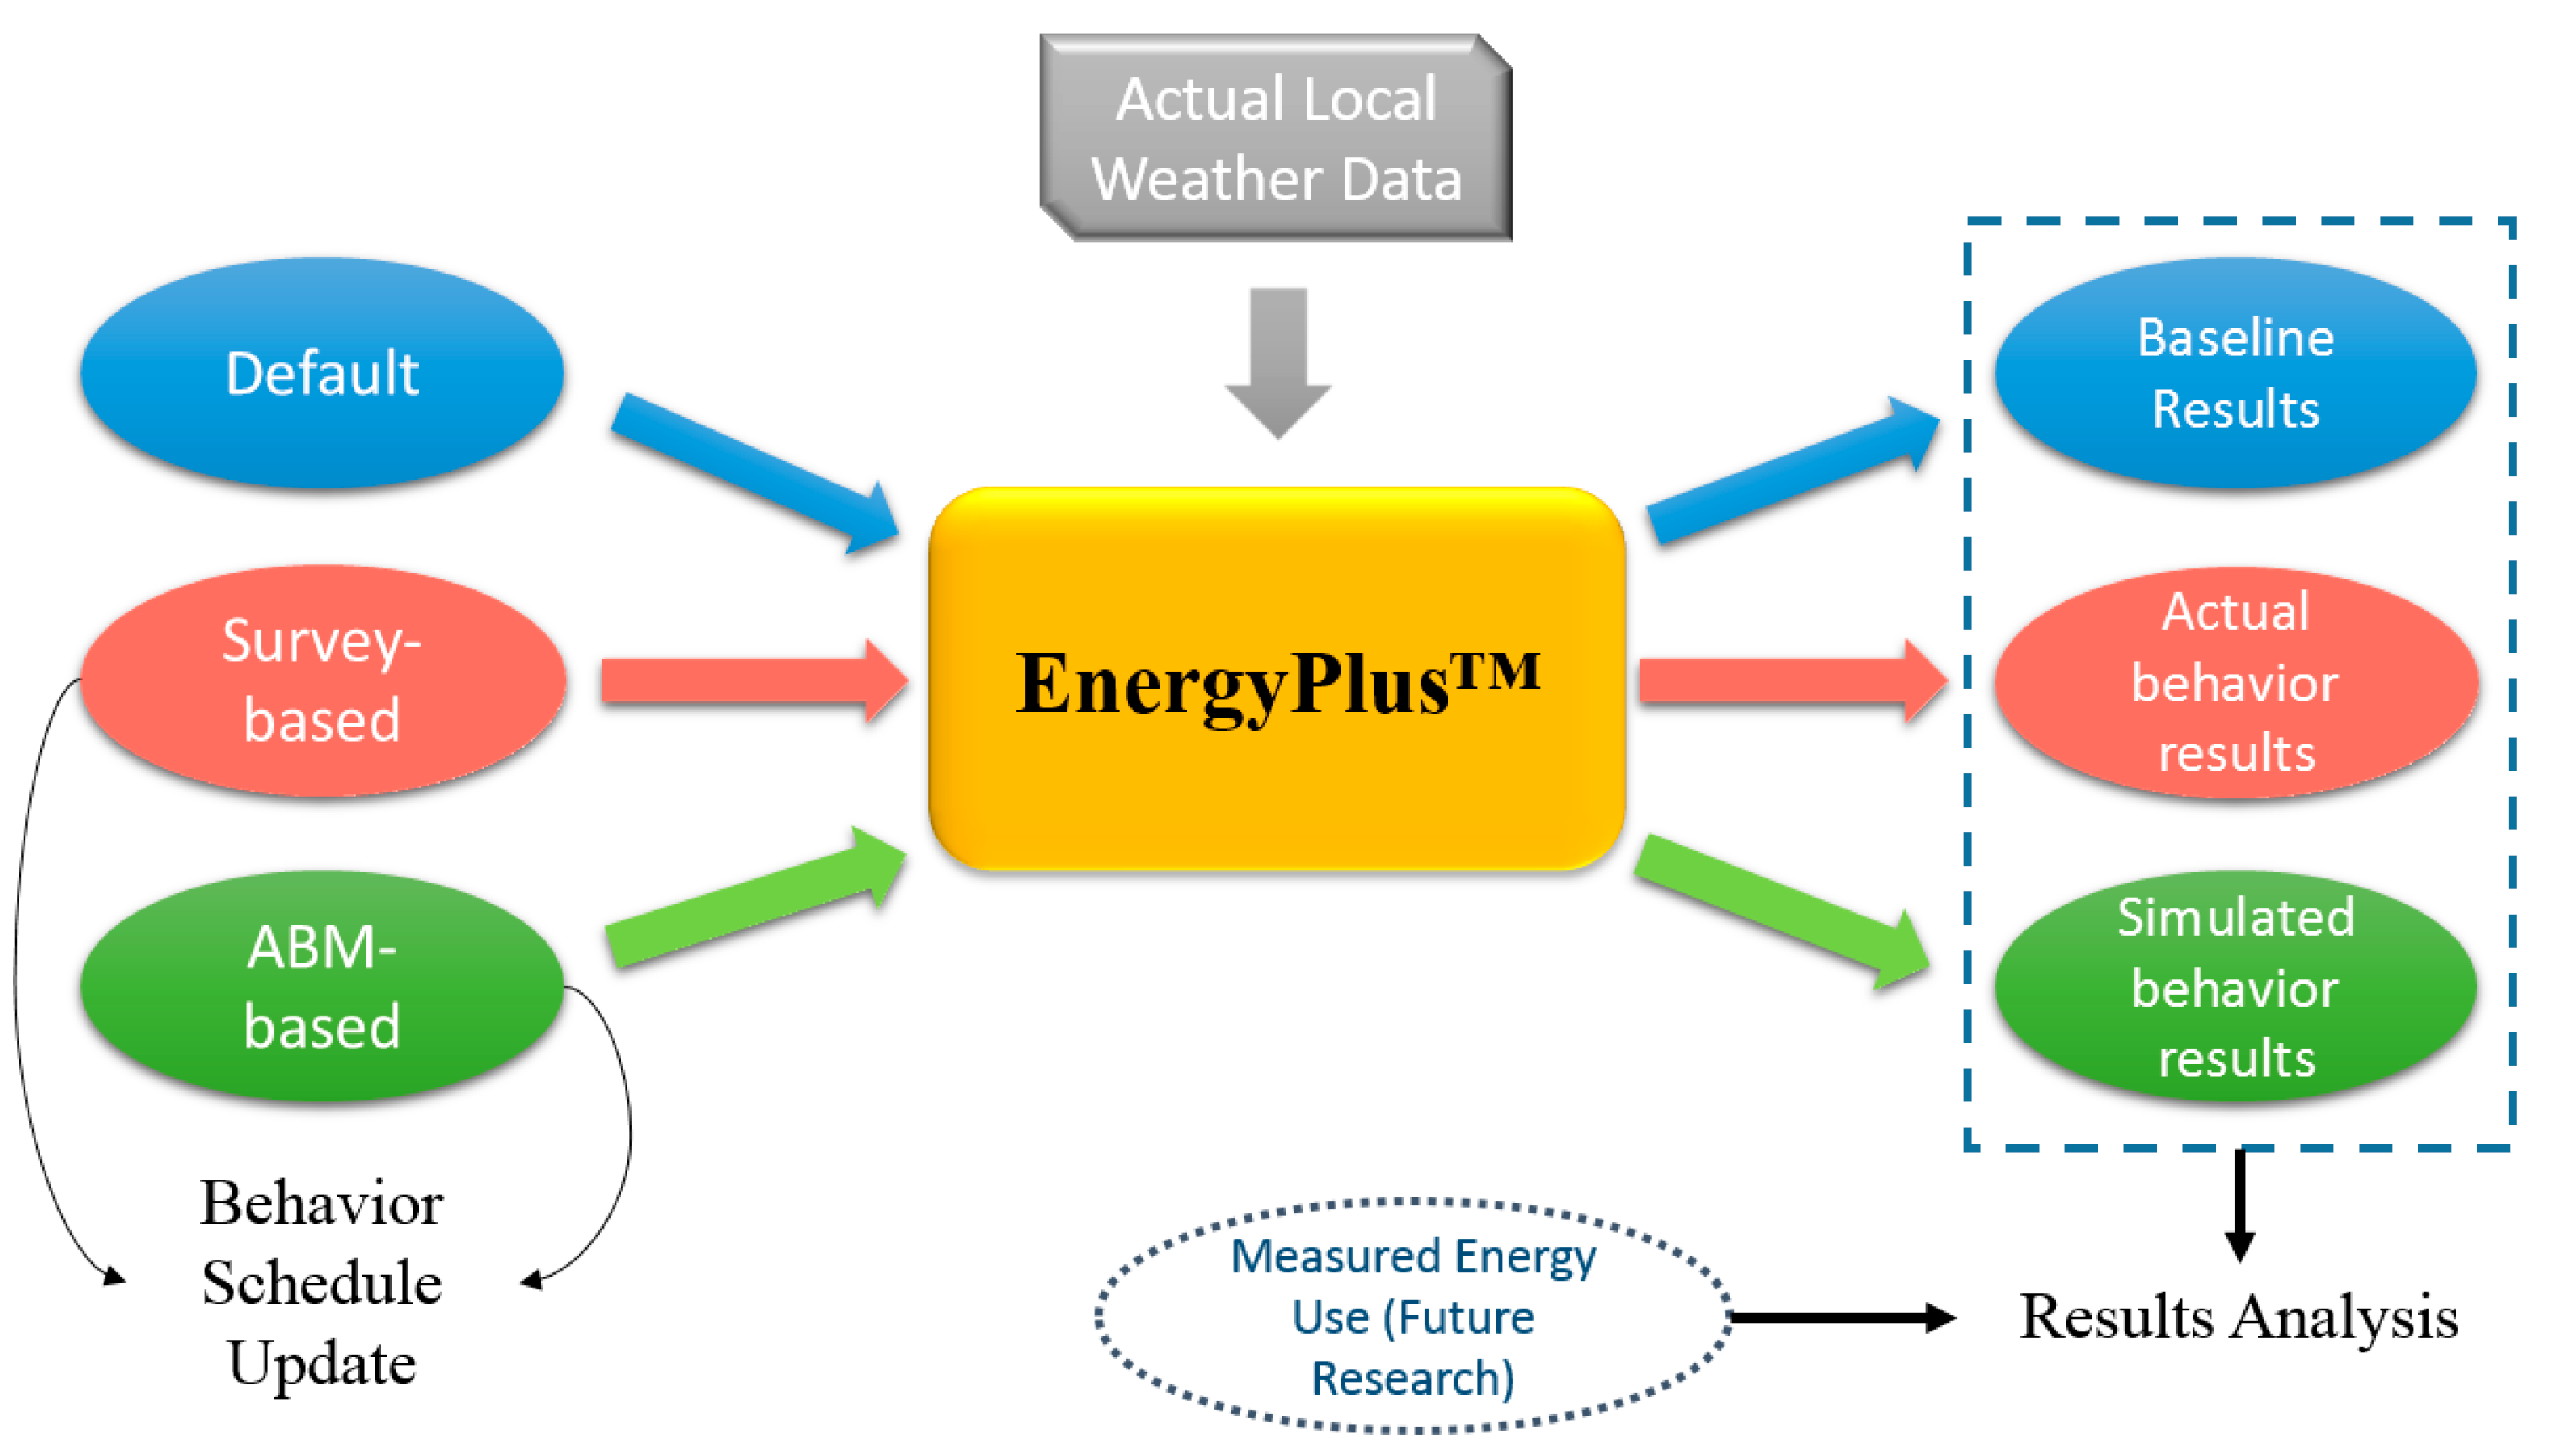
To explore this idea, three scenarios were developed for building energy simulation, namely default setting (Scenario #1), actual behavior setting (Scenario #2), and co-simulation with ABM setting (Scenario #3) (
Figure 4). For the default setting, all the behavior–related parameters were set to default values and were static over the simulation period; for the actual behavior setting, the original operation schedules of target building components were replaced with survey data over the simulation period; for the co-simulation with ABM, the occupant behavior model would be executing simulation coupling with EnergyPlus™. The simulation period uses the same time period and time of year as the survey data collection. The result comparison was decided to be mainly at the room/zone level where the occupants in the experiment are located. The results at the building level will also be presented. However, differences between scenarios are expected to be relatively small at the whole building level. Particularly, it must be pointed out that the energy simulation result of Scenario 2 (with actual behavior input) is not necessarily equivalent to the actual energy use due to the complexity of energy consuming mechanism of a real building. The simulation results of different scenarios above need to be compared with actual building energy use in future research.
3.4.1. Detailed Settings of the Building Energy Model
The simulation case study used an existing building (
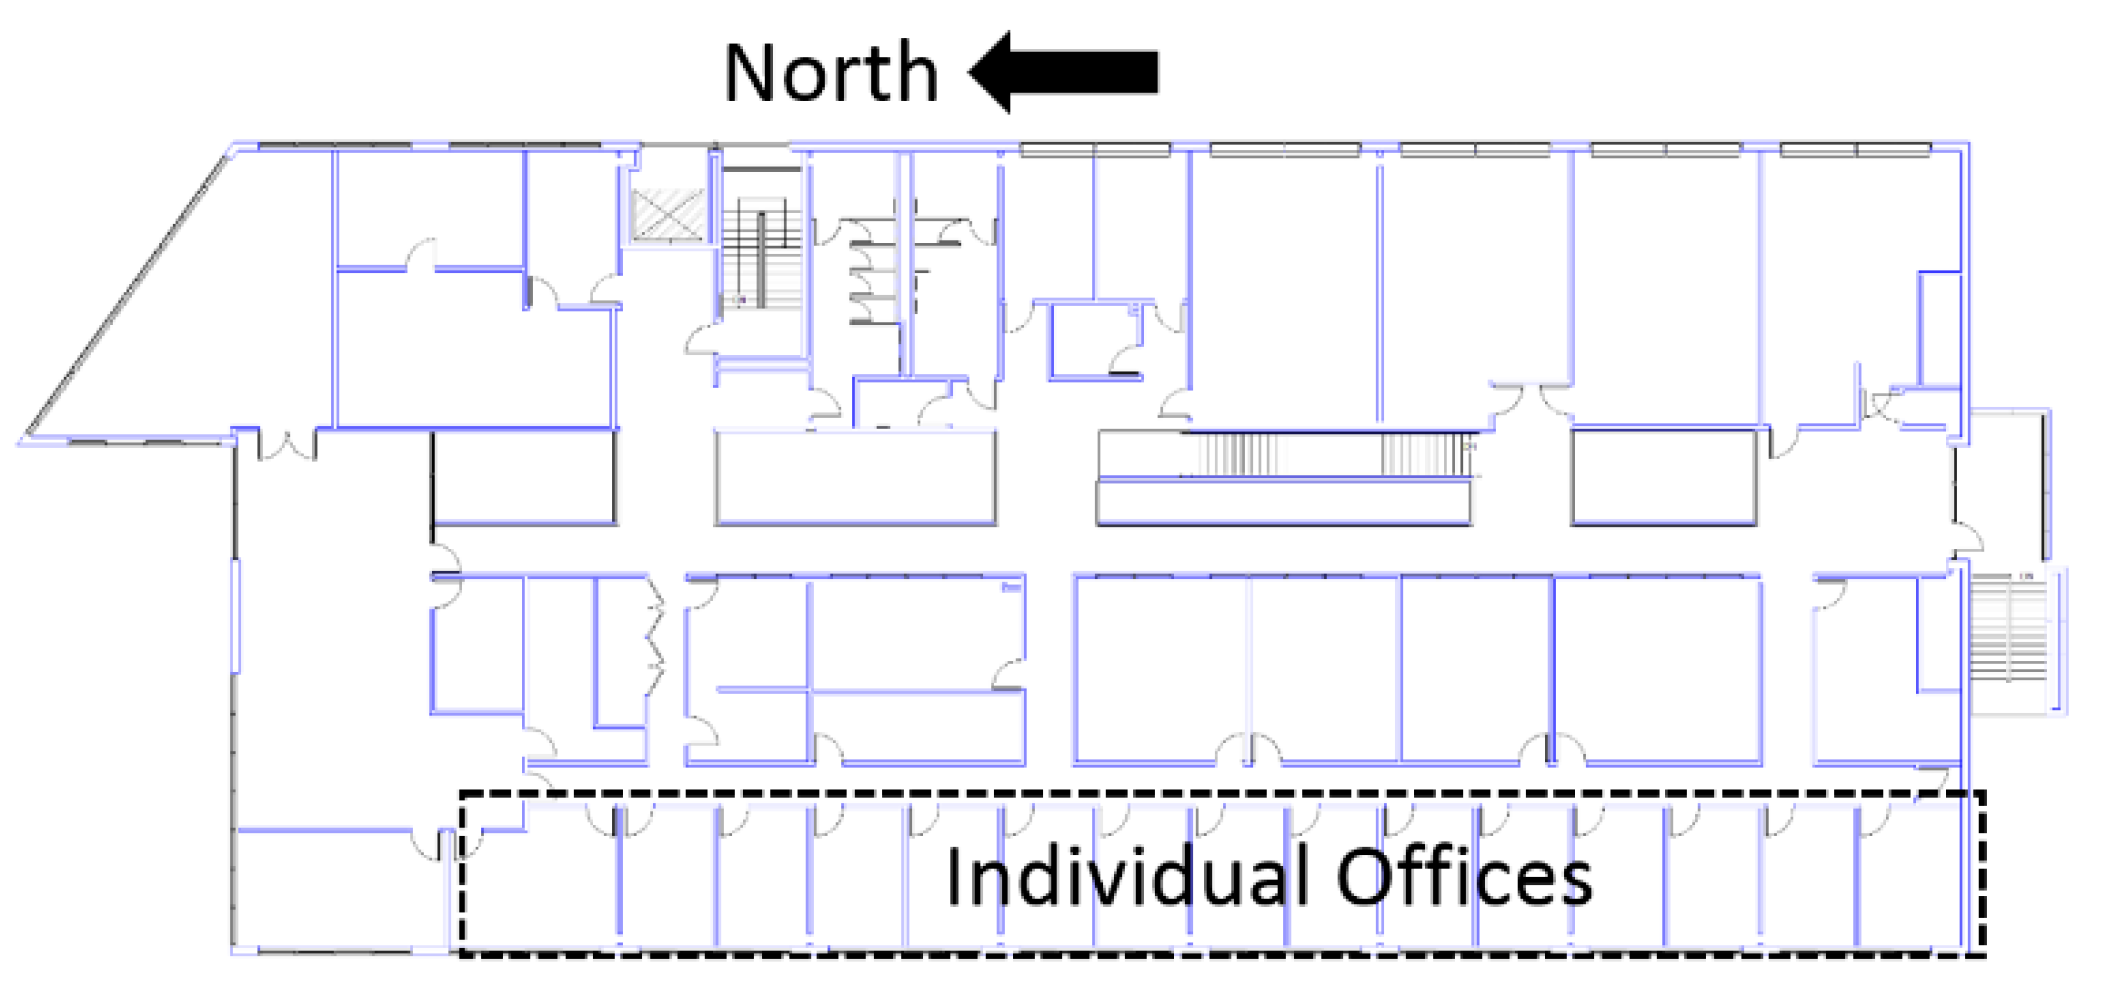
Figure 1) as an experimental test bed to increase the practicality of the research. The case study building has three stories which is comprised of offices, classrooms, laboratories, and some student facilities. The building is supported with steel and the envelope is covered by composite wall panels of aluminum which enclose exterior insulation and finish systems. The exterior glazing (including windows, skylights, and external doors) adopts dual low–emissivity vertical glazing technology for improved daylight utilization. The building has a central HVAC system that contains two air–handling units (AHU) to serve 54 thermal zones from variable air volume (VAV) boxes. A thermal zone usually covers several individual office rooms residing next to each other. The faculty offices are located on the west side of the third floor along a corridor (
Figure 5), where each occupant has an individual office room. Each office has an operable window and door, window blinds, and a light switch that controls ceiling mounted direct/indirect T8 fixtures. The five offices selected for simulation study are among the corridor of rooms, where room B to E have similar areas and thermal zone distributions, and room A locates at the southwest corner with a slightly larger room area and distinct thermal zone arrangement.
The virtual model of the building was developed with EnergyPlus™. Basic settings were identical to the actual conditions of the building, and the simulation period was set to the same four weeks as the survey period. Instead of using a typical EnergyPlus™ weather file that provides historical statistical weather information, the weather data used in the simulation experiment was acquired from [
43], which contains the realistic weather information for the designated location and time period. The weather data covers a full year over two consecutive calendar years (from May 2017 to April 2018). The simulation time step was set to 15 min, which is identical to the survey.
In addition to the default settings, the simulation scenario based on the survey data was created. The raw survey results were translated into the EnergyPlus™ schedule format. For each occupant, there are three separate schedule documents created for the targeted building components. Following this manner, a separate IDF file (EnergyPlus™ input file format) was created for each occupant with the building component operation schedules being filled with the survey record.
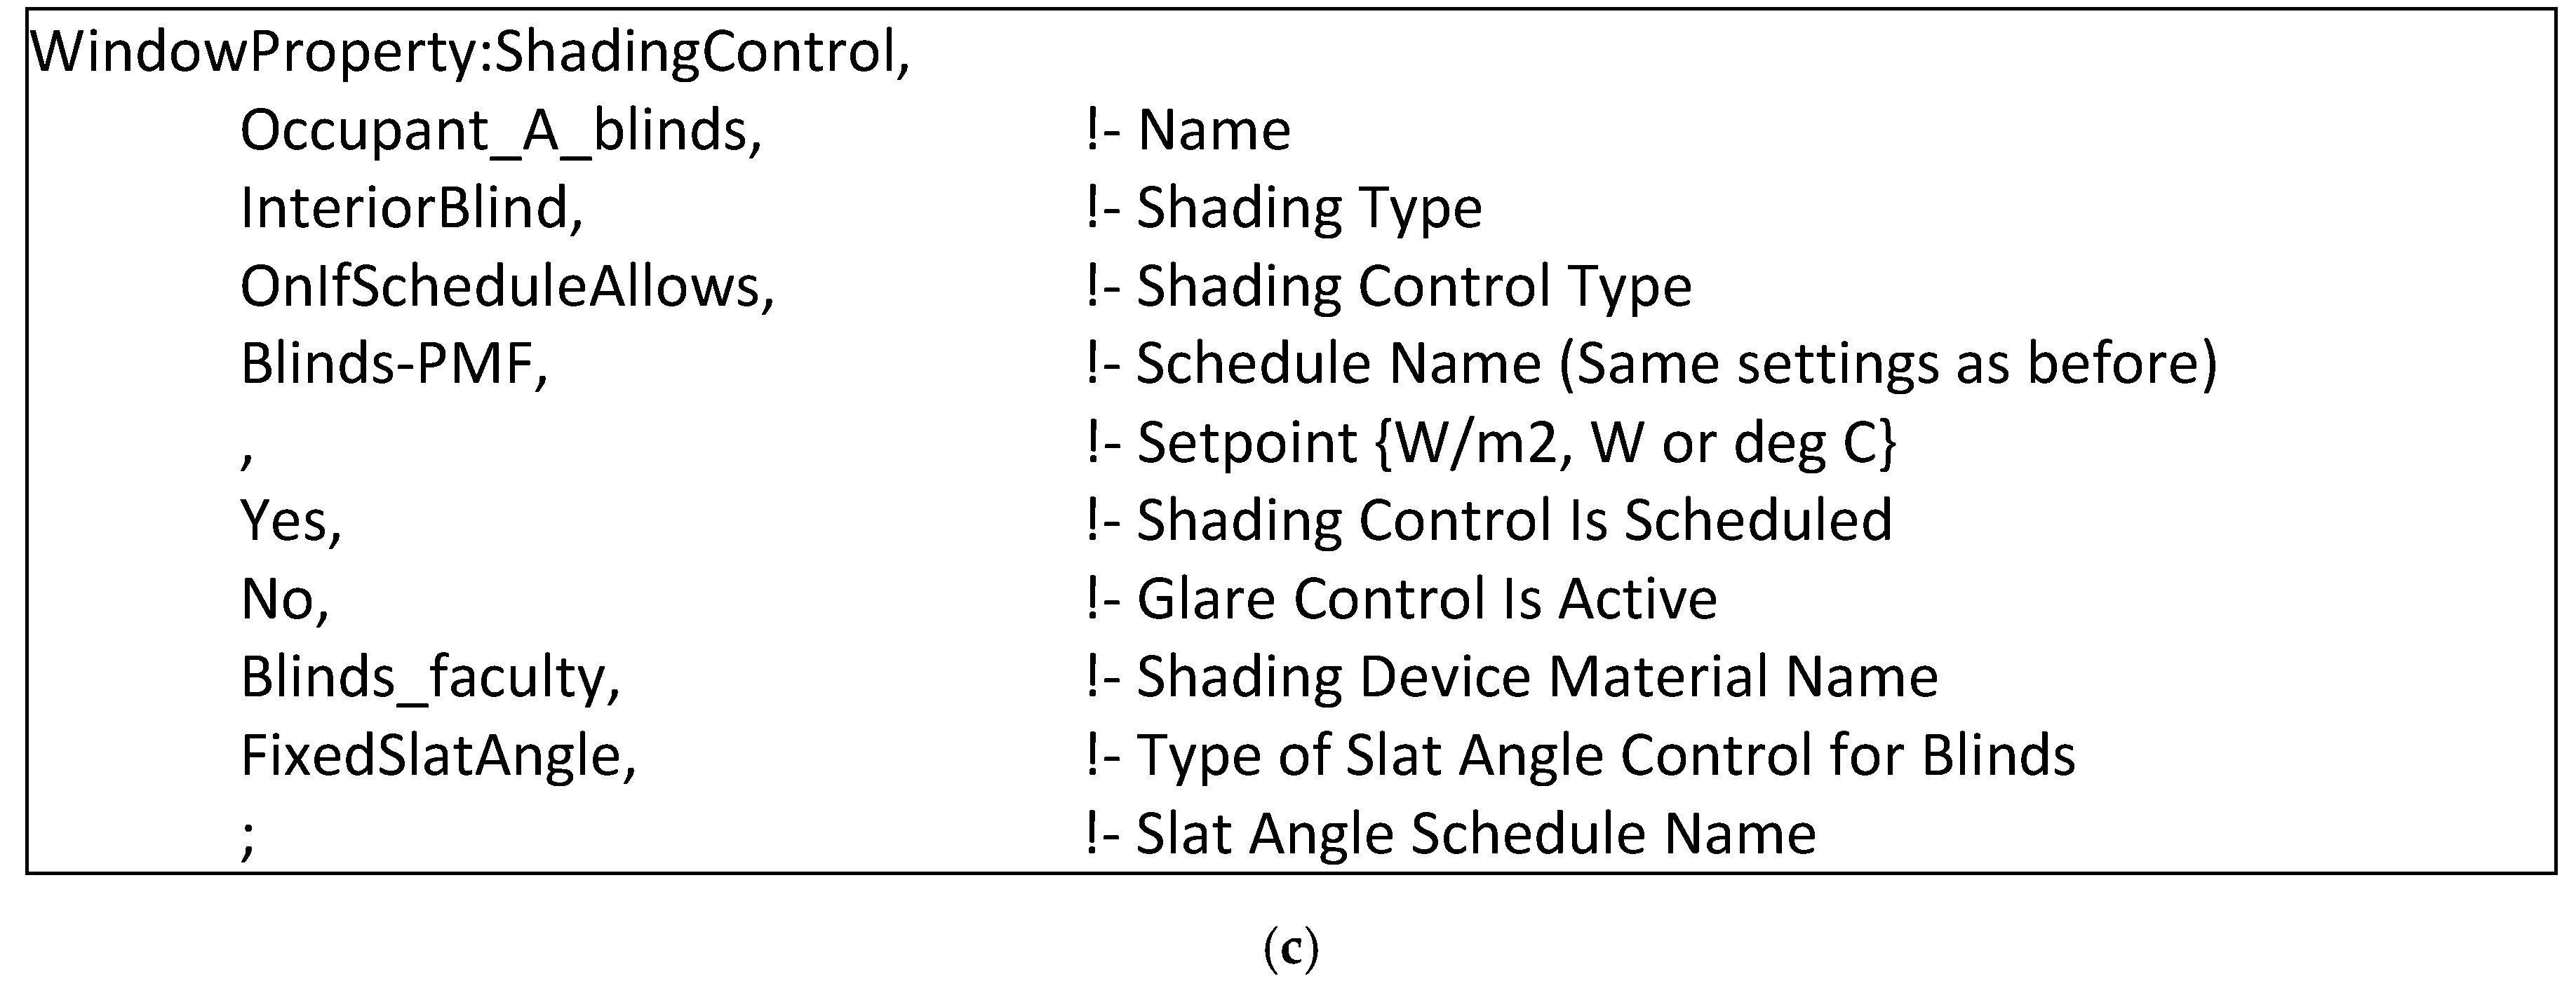
After importing the schedule files in the IDF file, the corresponding parameters information were updated to reflect behavior variations. The specific values for each field of the key variables in EnergyPlus™ in the case study, are shown in
Figure 6 for one of the occupants. It is noted that for window blinds opening behavior, after creating a new object shown in
Figure 6c, the object was applied in the field of “Shading Control Name” in “FenestrationSurface:Detailed” at the corresponding room location.
The relevant settings of the ABM–based scenario are identical to the survey–based scenario, except for the “Schedule Name” variable, where the survey–based scenario uses the imported schedule files while the ABM–based scenario uses the dynamic input with co-simulation.
4. Results and Analysis
Based on the simulation scenario designs, the three simulation scenarios defined in
Section 3.4 are compared in parallel. In particular, the schedule update process was carried out for each occupant in five separate IDF files rather than a simultaneous execution, considering the computational speed and a more specific comparison among different individuals. This setting is applied to survey– and ABM–based scenarios respectively, with each file representing the behavior information change of one occupant. The simulation period was set from the end of February to end of March 2018 (28 days). The results are explained in the following sections.
4.1. Energy Use and Cooling/Heating Demand Differences
Occupant behaviors influence the building performance in various aspects. The involvement of behavior information directly causes variation on the building side such as energy use and building system loads. Although the analysis focuses on the zone level, differences at the building level for some factors can be observed.
Figure 7 shows the building–level energy use intensity (EUI, kWh/m
2 per month) comparison for the simulation period among five occupants’ behaviors, respectively. It can be seen that an individual’s behaviors can cause whole building energy use variation differently. Since the simulation period is restricted to approximately a month, the absolute difference for an annual energy consumption may be proportionately greater. Moreover, even though the adjustment of windows, doors, and blinds are not direct energy–consuming behaviors, their impact on total energy use are still observable, especially for the ABM–based scenario. Specifically, for the survey–based scenario, all the occupants caused a slight increase in the total energy use, except for occupant A; for the ABM–based scenario, the energy use shows a descending trend when compared to default and survey–based scenarios. Intuitively, the decreased energy use results can be partially explained by the window opening behavior, as natural ventilation would lower the overall energy use with the mitigated use of mechanically conditioned air. This was in fact reflected in the actual (occupant A) and simulated behavior results, where operations on the window occurred alternatively over the simulation period. However, it is also possible that the outdoor air will increase the HVAC load for maintaining the set point, which may compensate for the ventilation effect. Hence, more case studies should be conducted to explore the causality of changes in energy use and specific occupant behaviors. In addition, the reduced EUI under the ABM–based scenario indicates that energy saving could be achieved if adequate energy–efficient occupant behavior is encouraged.
Besides the total energy use variation, the end use distribution also changed. In
Table 3, the end use differences at the building level among three simulation scenarios are shown. In this table, it can be seen that the ABM–based scenario shows a larger use of electricity comparing to the other two scenarios. One potential reasoning is that the opening of windows and doors caused unintended flow of air from the external environment, and therefore the fan electric consumption was increased to maintain a balanced ventilation. Meanwhile, district cooling and heating use decreased in the ABM–based scenario, probably due to the window operations that aided temperature adjustment and the blind operation behavior that blocked external heat gain at the end of the day. The survey–based scenario generally deviates less for the three end uses, except for occupant A, who recorded more window and window blinds operation behaviors than others.
Apart from the comparison at the building level, selected parameters at the zone level also show differences (
Table 4). Among these energy–related parameters, zone air system sensible heating and cooling energy report the heating or cooling delivered by the HVAC system to a zone. This does not always indicate the operation of heating or cooling coils, as outside air can also be supplied for cooling or heating even if the coils are off [
44]. The results show that the survey–based scenario generates similar trends for cooling energy and differences on heating energy. This is because most of the time the outside air was warmer during the simulation period, which can contribute to zone heating. For the total internal latent gain, although a slight deviation is observed, the percentage of difference is subtle. It can be inferred that the behaviors that are not directly consuming energy will only influence the internal gain from people and building equipment a limited amount.
Figure 8 depicts the selected results of heat gain factors for the targeted spaces. Unexpected results appear in the window heat addition and infiltration heat addition rows, considering the seasonal effect of the simulation period. For window heat addition, the occasionally closed window blinds could be a cause for blocking the heat energy from the sun outside. For infiltration heat gain, the survey–based scenario is showing a slight decrease for occupants C, D, and E. The possibilities may include no opening window records for the occupants, and infiltration through zones kept stable and balanced under the same HVAC set point. However, despite how the values of these factors change, it is clear that the heat gain factors will eventually influence the working conditions of the entire facility, thus leads to building energy use and built environment variation under different behavior patterns.
4.2. Occupant Comfort Level Differences
The interactions between occupants and building components also have an impact on the building occupant side. One way to understand occupant’s comfort level is to examine the Predicted Mean Vote Index (PMV) values within designated time period. Fanger’s PMV stands as one of the most recognized thermal comfort models [
45]. Fanger’s equations are used to calculate the mean response of a large group of people for a combination of thermal and metabolic conditions, according to the ASHRAE thermal sensation scale, which is a seven–point scale from −3 (cold) to +3 (hot), with the value of “0” being the neutral sense or the most ideal value. In EnergyPlus™, the PMV information is available to extract in the “People” object. In this study, hourly PMV values were declared for the targeted thermal zones of the building and aggregated for the simulation period.
Table 5 summarizes the average PMV values for each experiment zone where the occupant is situated respectively, for the three simulation scenarios.
From the table, all the PMV values are below zero, and have a lower comfortable range than as defined by ASHRAE. This complies with reality in that most permanent occupants of the third floor of the case study building often express that the indoor temperature in general is too cold. From the survey–based results, the PMV values were almost the same as default or slightly closer to the neutral value, due to the fact that most occupants do not operate on the window frequently, while window is the main building component for thermal condition adjustment. The only exception is occupant A, who obtained a “colder” PMV with the actual behavior inputs. One of the reasons can be that this occupant’s behavior is not only driven by thermal comfort but air quality as well. Besides, factors that are not modeled may also lead to occupant actions on the building components. Similarly, for all ABM–based scenarios, the PMV values are moving away from the ideal value. This is mainly because the ABM considers three perceptual types (thermal, air quality, and visual perceptions) of the agent, while not limited to, the traditional models that only focused on thermal sensation. This also demonstrates and calls for the need to include different perceptions when using ABM for occupant behavior modeling in order to have a thorough representation and understanding of how occupants interact with building. Aside from the analysis of the ABM, other aspects can also be responsible for the results above, for example:
The parameters settings and calculation algorithms for the criteria in EnergyPlus™ does not fully reflect the actual impact of the targeted behaviors;
The environment setpoint is out of the range of actual occupant preferences, and the comfort level based on ASHRAE does not conform to the actual needs of the case study building occupants;
The environmental data simulated by EnergyPlus™ should also be considered as a factor and must be fully validated for improved building performance simulation.
In general, the simulation outcome does not fully meet the anticipated result that occupant comfort level will increase with behavioral information involved. Nevertheless, the potential reasons given above provide guidance for further studies to explore the exact causes of the outcome.
To provide a more specific view of PMV,
Figure 9,
Figure 10 and
Figure 11 display the PMV trends for occupant A as an example during the simulation period, i.e., 672 h. For all other occupants, the default and survey–based results show a parallel fluctuation with only magnitude differences. For occupant A, although the general trend is similar, obvious differences can be observed over certain time intervals. For example, the extreme value for default scenario almost reached −3.5, while the survey–based scenario tends to have a more moderate value. The average PMV in the survey–based scenario (
Table 5) is lower because the positive numbers have a generally descending tendency. However, it is noted that a lower positive number indicates a more comfortable “warm” environment, which is the goal of ideal built environment. On the other hand, according to the variance of hourly PMVs for occupant A, the default, survey–based, and ABM–based scenarios achieve the value of 0.763, 0.642, and 1.165, respectively. The survey–based scenario reveals a more stable indoor environment in terms of thermal conditions.
As for the ABM–based scenario, the variation is more significant compared to the other two cases. The result is mainly due to the explanation previously given. It also implies potential room for improvement in the occupant behavior model. Further research needs to be conducted to ascertain the results and analysis of PMV trends in a meaningful way, based on the preliminary study. Moreover, since the calculation of PMV requires extra variables in addition to air temperature and humidity, uncertainties can be largely involved and therefore the PMV values presented in the study are not the absolute or definitive outcomes. In the case study, the related variables were modeled based on ASHRAE standard and actual conditions of the testbed building and remained consistent for different simulation scenarios.
4.3. Summary
The simulation results reveal the mutual impact of building and its occupants quantitatively. On the building side, total energy use and energy use distribution variation showed the estimated amount that zone level occupant behaviors influence building energy use. Although the differences are not obvious, considering there are 54 thermal zones in total, the comparative discrepancy could be more significant. Thus, the corresponding load design for mechanical systems must be adjusted accordingly. On the occupant side, the adaptation to the indoor environment results in the comfort level change. However, thermal comfort is not the sole perception for a typical occupant working in the office environment. There is a need to involve other comfort indices pertinent to air quality and visual comfort for a more comprehensive understanding of building performance. Additionally, extended research needs to be conducted to verify and examine the potential explanation for the lower average PMV value.
With respect to comparison among different simulation scenarios, a common phenomenon from the result is that survey–based scenarios tend to be closer to the default scenario, except for occupant A, while ABM–based scenarios deviate more for all the presented results. According to the survey record and individual interview with the occupants in the experiment, most occupants seldom operate the three building components unless special cases arise and therefore the components have a rather stable pattern, either because they are mostly satisfied with the environment, or they have particular preferences and habits. For the ABM, the agent is regulated by certain rules, which in this research, are bounded by the ambient conditions within which they reside. Moreover, each person may behave differently according to his/her own situation. Hence, the ABM does not replicate different individual’s behavior patterns, while focuses more on representing a generic form. Considering a validation study was performed for the ABM in the same test building and putting aside the validity of the assumption basis of the ABM, two reasons can be attributed to the simulation results. First, the environment data output from EnergyPlus™ may not be accurate in contrast to the actual environment. Second, the comfortable range used for the ABM does not fit in each individual’s desire. However, the limitation of the ABM itself cannot be ignored, which is further discussed in
Section 5.
Through the analysis, the impact of occupant behaviors among individuals to building performance simulation is assessed. The comparison across different occupants and simulation scenarios reveals the existing research questions that need to be addressed by both modeling tool developers and practitioners, which include but are not limited to:
Additional parameters could be developed to explicitly reflect the effect of typical occupant behaviors in building energy modeling;
Corresponding occupant comfort indices for perceptions other than thermal comfort (i.e., PMV) should be involved more in building performance evaluation;
Factors that are not directly related to the built environment (e.g., time, season, etc.) should also be considered in occupant behavior modeling.
5. Discussion
The significance of the simulation experiment focused on the impact analysis of different occupant behavior inputs to building performance, rather than improving estimation accuracy for building energy modeling. In other words, the simulation study does not intend to claim a higher accuracy is achieved, until measured energy data is collected for comparison. Additionally, the experimental approach is not limited to the case study rooms, which can be expanded to other zones or new buildings. With the ABM–based scenario, the simulation results showed a decreased tendency of energy use with the dynamic occupant behavior input compared to default scenario. This can facilitate feasible energy conservation measures through human–in–the–loop operations and management. In general, exploration of the occupant dimension’s influence to building performance simulation will create a human–centered built environment and improve informed decision–making that could benefit all the stakeholders of a building.
The use of two sources of occupant behavior information that represents actual and simulated worlds respectively, is a complementary solution to evaluate the occupants’ impact on building performance in a more comprehensive way. However, for future buildings, the actual behavior data is unavailable. Even for existing buildings, a long–term behavior record process may not be practical due to privacy issues. Hence, co-simulation by integrating a BEM with a robust occupant behavior model is one of the most suitable methods to address the issue. Among others, ABM has been demonstrated to have high potential for this purpose. It is suggested that when available, actual behavior records should be used to adjust and tune the ABM for different building types, season changes, or occupant customs. The simulation setup in this paper offers a feasible way to contrast the results from two different data sources in order to make further changes to the ABM.
This study has the following limitations. First, the scope of the simulation experiment is restricted with regards to both simulation time period and space coverage of occupant behavior data. Due to the occupants’ availability and privacy conditions, the actual behavior data was only recorded for four weeks in the spring season. Also, only five occupants were taken as samples for data collection. Therefore, to maintain the same level of data input for all simulation scenarios, the simulation period is in compliance with the data collection duration. Nevertheless, occupants may have different behavior patterns among different seasons owing to climate and personal schedule changes. There could also be different occupant behavior patterns in other building occupants such that the full range of behaviors are not included in the study. The simulation results will be more holistic and informative if the data collection span could be expanded. However, this limitation again indicates that collecting actual occupant behavior data for building energy modeling is not practical, especially for larger buildings. This indicates the necessity of developing robust occupant behavior prediction models for integration with BEM. Second, the behavior record was conducted manually, which can cause problems such as distractions to occupants and data missing or errors. Although the data collection granularity was set to 15 min to reduce the load and pressure for the occupants, there can be some missing data records over the experiment duration. In the future, the paper–based survey sheets can be replaced by smart sensors that are attached to monitored building components, for a more accurate and non–intrusive data collection approach. Third, the co-simulation functions can be improved as research progresses. Currently, the data exchange is performed at the zone–level, which hinders the extensibility of the framework. Fortunately, the ABM applied in this research is a library–based model and is able to create multiple instances to represent different behaviors. Accordingly, the co-simulation bridging program will also need to create the same number of actors. This step is theoretically feasible but is pending implementation. Last but not least, as mentioned in
Section 4, the ABM itself is limited to modeling assumptions. For example, the ABM considers environmental factors as the main driver of occupant behaviors, while sometimes it may not obey that rule in reality. This is part of the reasons why survey– and ABM–based scenarios have different simulation results. Meanwhile, the output of the ABM is deterministic instead of stochastic, which fails to reflect the uncertain nature of occupant behaviors. A possible solution is to involve probabilistic models in the ABM rules and execute the model multiple times to derive an “average” state of targeted building components. Furthermore, some derivative research questions including the PMV value fluctuation discussed in
Section 4 should also be studied further.


