Article

Numerical Simulation and Parametric Analysis of Precast Concrete Beam-Slab Assembly Based on Layered Shell Elements

1
Key Laboratory of Concrete and Prestressed Concrete Structures of the Ministry of Education, Southeast University, Nanjing 211189, China
2
European Centre for Training and Research in Earthquake Engineering, 27100 Pavia, Italy
3
Department of Structures for Engineering and Architecture, University of Naples Federico II, 80125 Naples, Italy
*
Author to whom correspondence should be addressed.
Submission received: 3 December 2020 / Revised: 18 December 2020 / Accepted: 22 December 2020 / Published: 24 December 2020
(This article belongs to the Collection Structural Analysis for Earthquake-Resistant Design of Buildings)

Abstract

:
Precast concrete (PC) plays an important role in the industrialization processes of buildings, so it is critical to study the seismic performance of such structures. Several experimental and numerical studies have been conducted to investigate the behavior of PC beam-to-column connections. However, most of the previous studies neglect the contribution of slabs. In light of this, this paper presents a numerical simulation method for dry connected beam-slab assemblies based on the layered shell element available in OpenSees. The beams were modeled with fiber elements, while the slabs were modeled with layered shell elements. The developed model was validated by simulating a typical beam-slab assembly test, with the characteristics of hysteretic performance found to be well reflected by the model. Moreover, a parametric study was performed to quantify the influence of slab parameters. The results showed that the thickness of the slab had a significant effect on the hysteretic performance of the specimen and that the influence of the slab width was obviously reduced after it exceeded a certain limit. Besides, the effect of the reinforcement ratio on stiffness and loadbearing capacity was not obvious and was accompanied by a slight positive correlation with the energy dissipation capacity.

1. Introduction

Precast concrete (PC) structures have been widely used around the world in recent years, especially in China [1]. In accordance with their connection type, they can be divided into “wet” connected structures and “dry” connected structures. The “wet” connected structures consist of cast-in-place concrete in the beam column joint area and prefabricated beams and columns, while the “dry” connected structures are connected by welded plates, bolts or prestressed steel bars, and there is no cast-in-place concrete in the core area. In recent decades, a large number of experimental tests and numerical studies on the “wet” connected structures have been completed, while studies of “dry” connected structures are still very limited. Furthermore, current studies on dry-type structures are mainly focused on experiments on beam-to-column connections, which do not reflect the influence of floor slabs on the overall seismic behavior.
Traditional dry-type structures can be mainly categorized into prestressed splicing joints, welding connection joints and bolt connection joints. In recent years, other new types of dry connections have been proposed in the context of the development of energy-saving industrialized buildings, such as tenon connections, key-way connections and mechanical connections [2]. Among all these dry connection types, prestressed connections are preferred as they are easy to assemble in engineering practice and provide better performance. Since the 1990s, the PRESSS project [3] (a precast seismic structure system project carried out in the United States and Japan) has undertaken special joint tests and finite element analyses for this kind of connection and built the related constructions. The project finally recommended four kinds of prestressed connections, as shown in Figure 1, namely pre-tension with/without damping and post-tension with/without damping.
At present, relevant research has mainly focused on the post-tensioned prestressed connection since it can be used as an assembly method in the construction stage and can also withstand the bending moment at the beam ends during service, thus forming an overall structure. A structure with this kind of connection has very small residual deformations and also has very good recovery performance. However, the corresponding energy dissipation capacity is relatively poor and the shear capacity of the beam end is insufficient. Consequently, supplemental energy dissipation elements are usually attached to the connections.
Many experimental studies, as well as numerical simulations, have been conducted to assess the seismic performance of dry-type precast connections. Cheok et al. [4] performed ten prestressed precast joint tests and four cast-in-situ joint tests as comparisons, finding that the energy dissipation capacity of bonded prestressed joints was higher than that of their unbonded counterparts. Cai et al. [5] conducted cyclic loading tests on three middle joints with different key-way lengths, highlighting that the seismic performance of joints with long key-way lengths were better than those with short lengths. Guo et al. [6] proposed a web friction self-centering prestressed beam-column joint, which has the advantages of self-centering after an earthquake and of providing a clear energy dissipation mechanism. The steel sleeve at the end of the beam avoids local compression of and damage to the beam and column during relative rotation, whereas the friction device at the web of the beam end provides good energy dissipation capability. Alver et al. [7] applied displacement controlled cyclic loading to four precast connections, one specimen without short cantilever beam and three others formed with short cantilever beam in different dimensions. Numerical simulation was also conducted by SAP2000 and showed good agreement with the experiment. Yuksel et al. [8] performed monotonic and cyclic pushover tests on industrial connection joints (”dry” type) and civilian connection joints (“wet” type). All the joints exhibited good hysteretic performance but a significant degree of pinching effect appeared when the displacement angle, namely drift, became large. In addition, the authors also conducted a finite element simulation of the corresponding joints and a good analysis result was shown, which verified the credibility of this type of finite element analysis. Zhang et al. [9] proposed a kind of unbonded, prefabricated, post-tensioned hybrid prestressed (PTHP) concrete frame structure, as well as providing a related simulation method for this kind of joint using OpenSees. Compared with cast-in-place structures, PTHP joints are characterized by higher levels of bearing capacity, stiffness, ductility and energy dissipation capacity. Han et al. [10] proposed a new type of joint that consists of a prestressed concrete beam and high-strength reinforced concrete column with plates and bolts. Moreover, Liao et al. [11] proposed a new type of joint consisting of prefabricated columns, prestressed T-shaped composite beams and cast-in-situ core area. The test results of these two types showed that the hysteretic curves of the new-type joint specimens were plump and the seismic performance was good. Brunesi et al. [12,13,14,15,16] conducted several pseudostatic cyclic tests and dynamic shake-table tests on full-scale reinforced PC structures between 2015 and 2020, studying the performance of these structural systems and their failure modes as well as providing further data for future research. To study the properties and the force transfer mechanism of ultra-high performance concrete (UHPC), Valikhani et al. [17] presented an experimental and numerical program for calculation and analysis; related nonlinear finite element analysis was conducted and the numerical error was greatly reduced. Sucharda et al. [18] proposed a numerical procedure for the identification of fracture mechanical parameters for a specific concrete through the use of developed inverse analysis combining multicriteria decision analysis, stochastic modelling and nonlinear analysis. Li et al. [19] used commercial code LS-DYNA to perform numerical simulations of segmental columns under different blast loadings, investigating the blast loading resistance capacities of segmental reinforced concrete (RC) columns. Romain et al. [20] proposed a new numerical model accounting for friction, dowel behavior and the contribution of the neoprene components. The model was verified by comparing data with existing experimental tests; moreover, a parametric study was performed to study the contributions of the different components, especially those which were most influential on the maximum horizontal strength and hysteretic energy dissipation.
However, most existing studies undertake experiments to investigate the resisting mechanisms of connections under seismic loading, only evaluating the influence of limited engineering parameters due to the high costs in time and money. To this end, several numerical models have also been developed for dry-type connections. The most famous method is to use fiber-based elements to model beams and columns, truss elements to model the prestressed tendons and rotational springs to model the energy dissipation elements. Though this method has been validated by simulating several beam-to-column connections, a key factor is neglected in the modeling approach, that is, the floor slabs. Based on this background information, the present paper developed a new method to model dry-type precast beam-slab assembly. This method was based on 2D layered shell elements in the OpenSees software. Two beam-slab assembly cyclic tests were used to validate the proposed method and a parametric analysis was performed to investigate the influence of slab parameters on the cyclic behavior of the beam–slab assembly.

2. Modeling Strategy for Precast Beam–Slab Assembly Based on Layered Shell Element

2.1. Layered Shell Element-Based Modeling Approach

A general simulation method for dry-type precast connections can refer to that proposed by Cao et al. [21]. The schematic numerical model is shown in Figure 2a. The truss element is used to simulate the prestressed tendons, the zero-length element to simulate the energy dissipating elements near the core area and the nonlinear fiber-based element to simulate either the beam or column. The rigidLink or equal degree-of-freedom (DOF) connection (equal DOF command in OpenSees) is adopted to simulate the mechanical behavior of portions in between the beam and the column. To consider the effect of the slab, the beam is divided into 5–8 elements according to a certain ratio in order to connect the beam and the slab at the intermediate nodes and end nodes of the beam through equal DOF; then, the layered shell element is used to build the slab. The schematic graphical representation of the spatial numerical model is shown in Figure 2b.
The layered shell element was implemented in OpenSees by Prof. Lu’s group from Tsinghua University in 2015 [22,23], proving the reliability of this element and formulation in simulating reinforced concrete shear wall structures. The walls or slabs can be divided into several layers, indicating concrete material and/or reinforcement material in multiple directions, as shown in Figure 3, to simulate the spatial mechanical behavior of concrete walls or slabs with distributed reinforcement mesh. Therefore, several kinds of material models should be implemented to accurately reflect the mechanism of the dry-type beam–slab assembly.

2.2. Material Models

The concrete02 model, which is based on the modified Kent-Park model [24], was selected for concrete. This nonlinear model consists of three parts: a parabola ascending part, a linear descending part and a constant residual part, as shown in Figure 4a. The Young’s modulus Ec of concrete can be calculated based on the peak compressive strength fcʹ of concrete and the corresponding strain ε0, whereas the residual stress fcu was defined as 20% of peak strength, as follows [25]:
E c = 2 f c / ε 0
f c u = 0.2 f c
The confinement effect provided by stirrups was considered by multiplying the peak compressive strength by a coefficient falling in the range [1.2, 1.4]. For the interface part of the beam-to-column connection, the concrete01 model was selected. Compared with concrete02, concrete01 neglects the tensile properties of concrete so as to simulate the force of the dry-connected assembled joint at the beam–column contact surfaces.
Reinforcing steel was modeled with the steel02 model, as shown in Figure 4b. The model can reflect the Bauschinger effect and its loading–unloading curve is determined by two asymptotic straight lines, the slopes of which are the Young’s modulus Es and the hardening modulus Eh. The shape of the transition section of the loading–unloading curve is controlled by the parameter R, which is expressed by the following equation [26]:
R = R 0 a 1 ξ a 2 + ξ
where R0 is the initial value of the parameter R when it is first loaded and also related to the parameters CR1 and CR2; a1 and a2 are parameters determined by testing; ξ is the strain difference between the intersection point A of the current asymptote and the reverse point B of the previous loading branch. Recommended values for such parameters are R0 = 15, CR1 = 0.925 and CR2 = 0.15, according to the OpenSees manual.
The prestressed rebars were also modeled by the steel02 model but the initial stress should be defined along with the model to reflect the prestressing effect. The ElasticPPGap material model, as shown in Figure 4c, was also used at the beam–column interface to simulate the open–closure effect between the precast elements. For other energy dissipation elements, such as welding, energy-consuming steel bars, energy-consuming steel plates and dampers, the hysteretic material model available in OpenSees can be (and was) selected to simulate the material properties, as shown in Figure 4d.

3. Model Validation and Discussion

Based on the above numerical modeling method for dry-type beam–slab assembly, this paper simulated a total of five specimens under cyclic loading tests from two test sets. Four of those specimens were representative of interior joints and the other one was an exterior joint specimen. The effectiveness of the numerical simulation method was validated by comparing the experimental data with numerical simulation results, as discussed below.

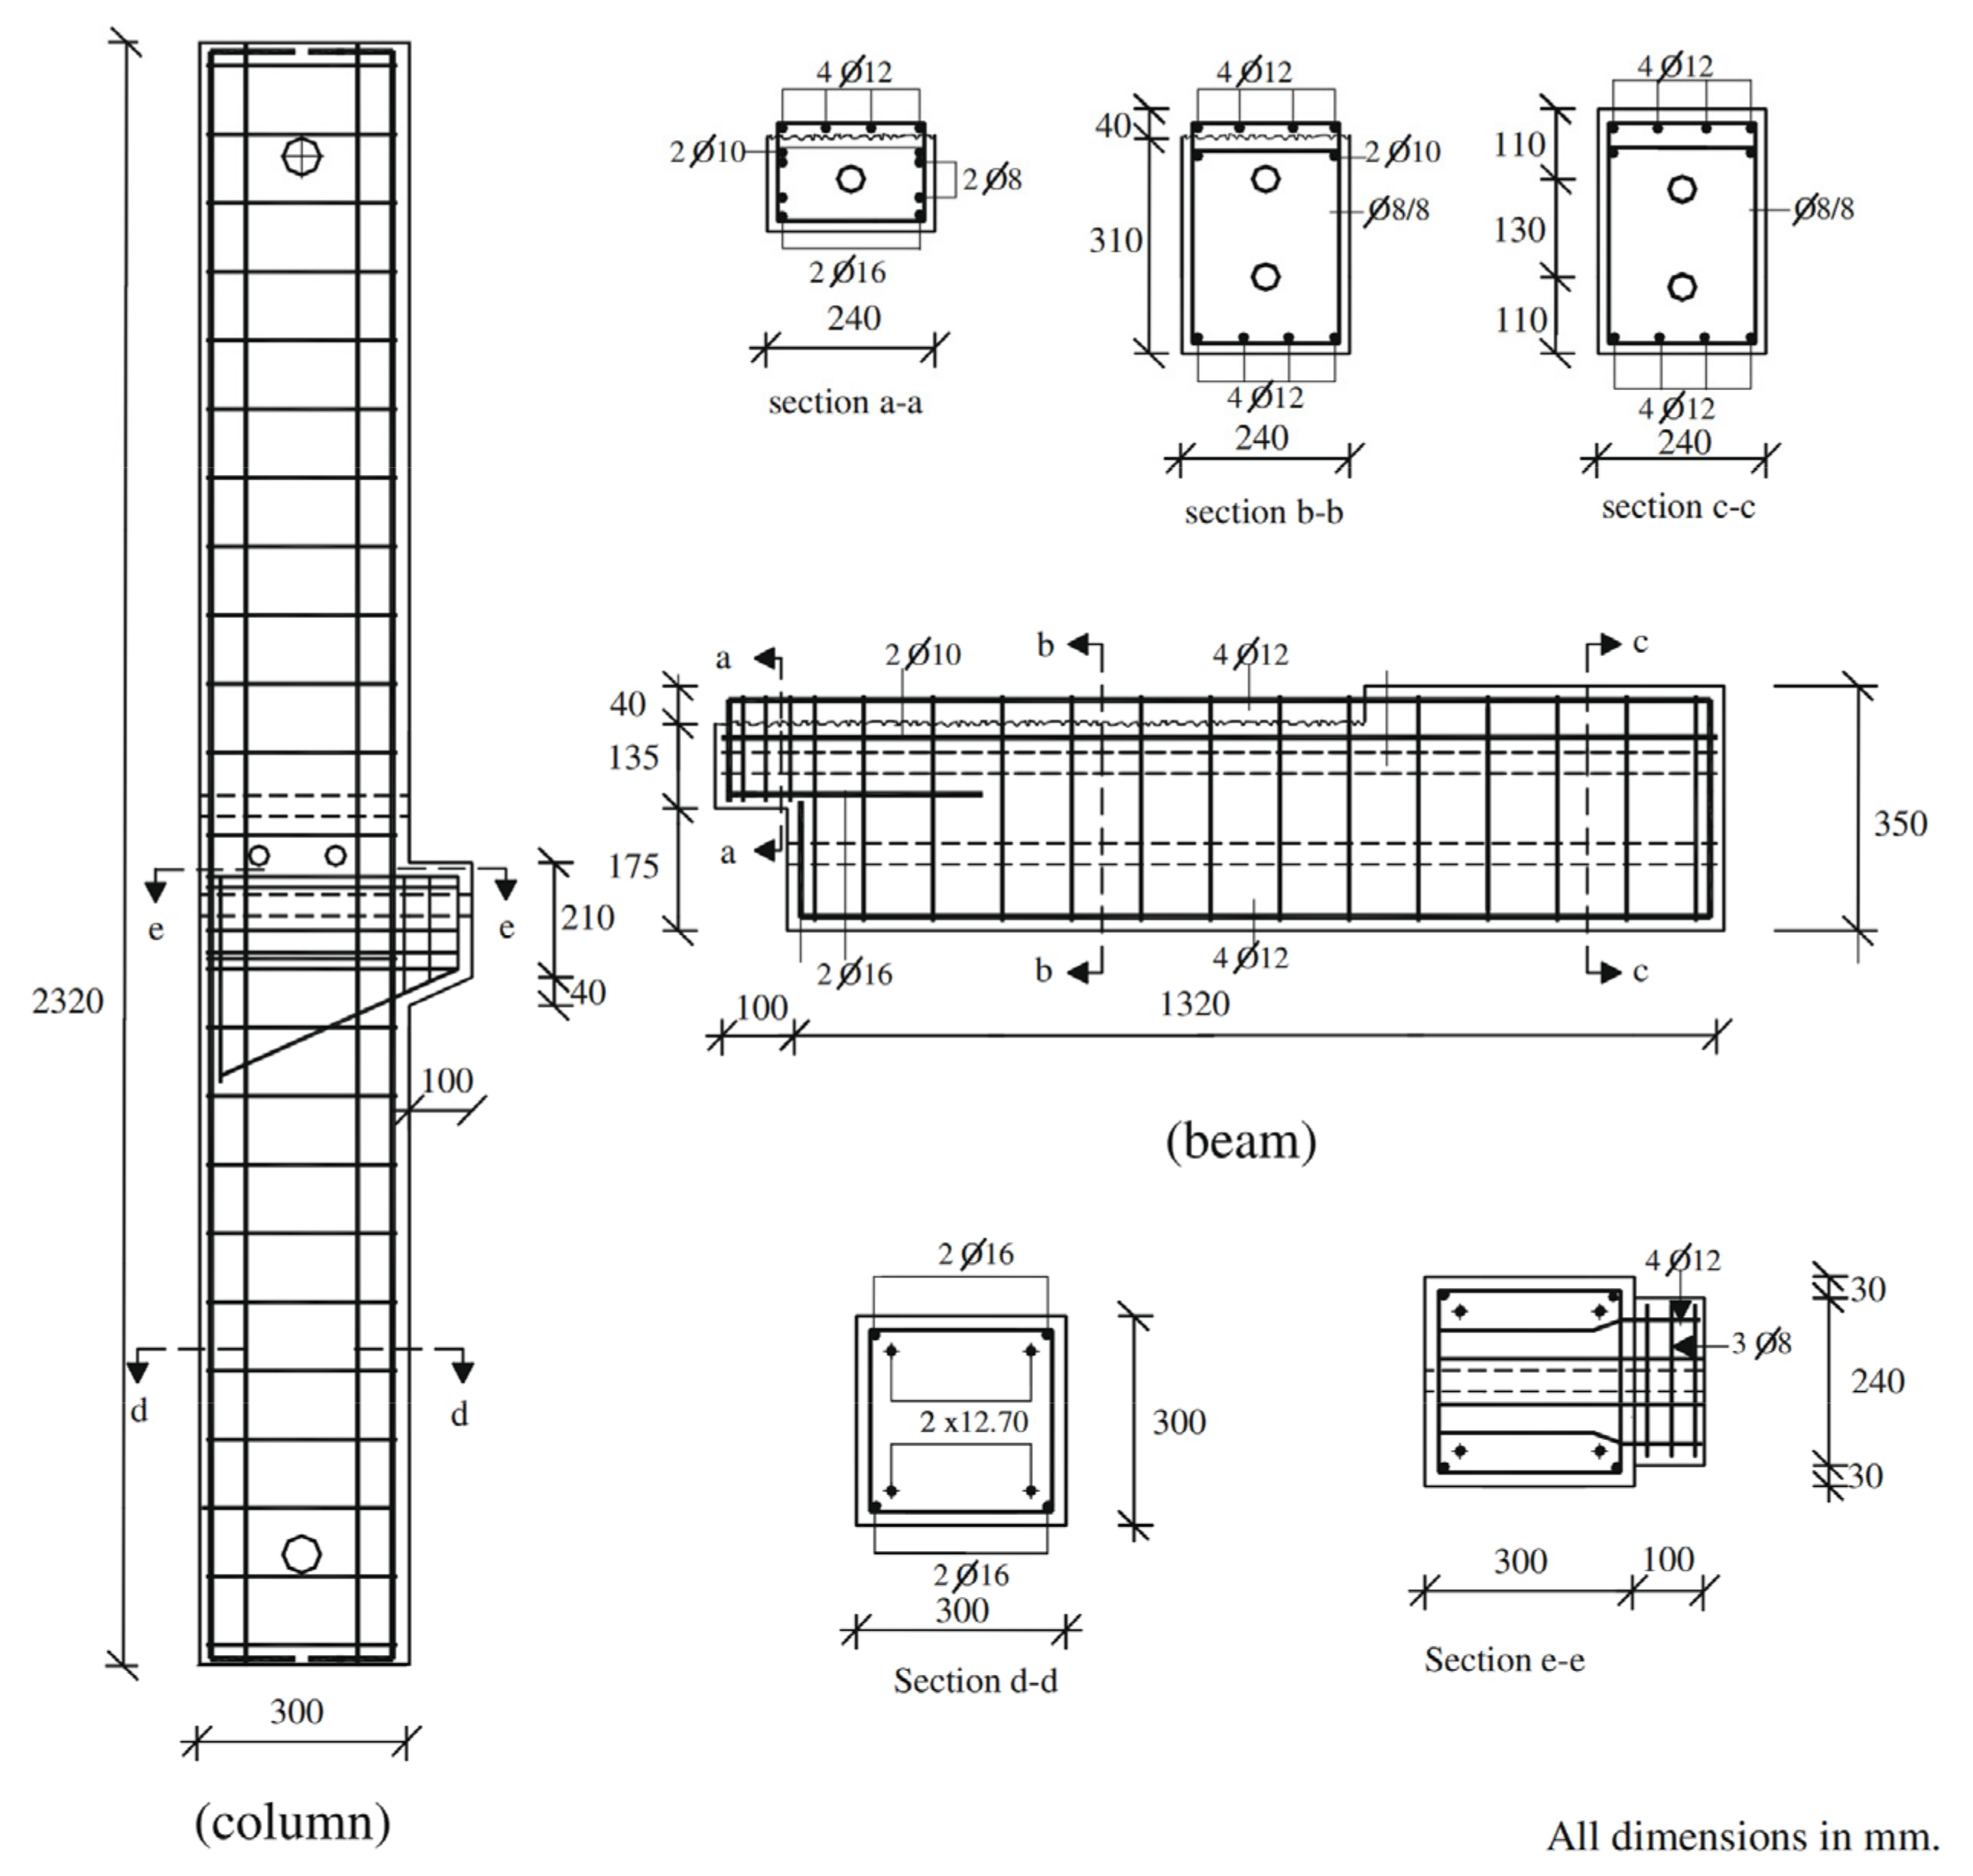
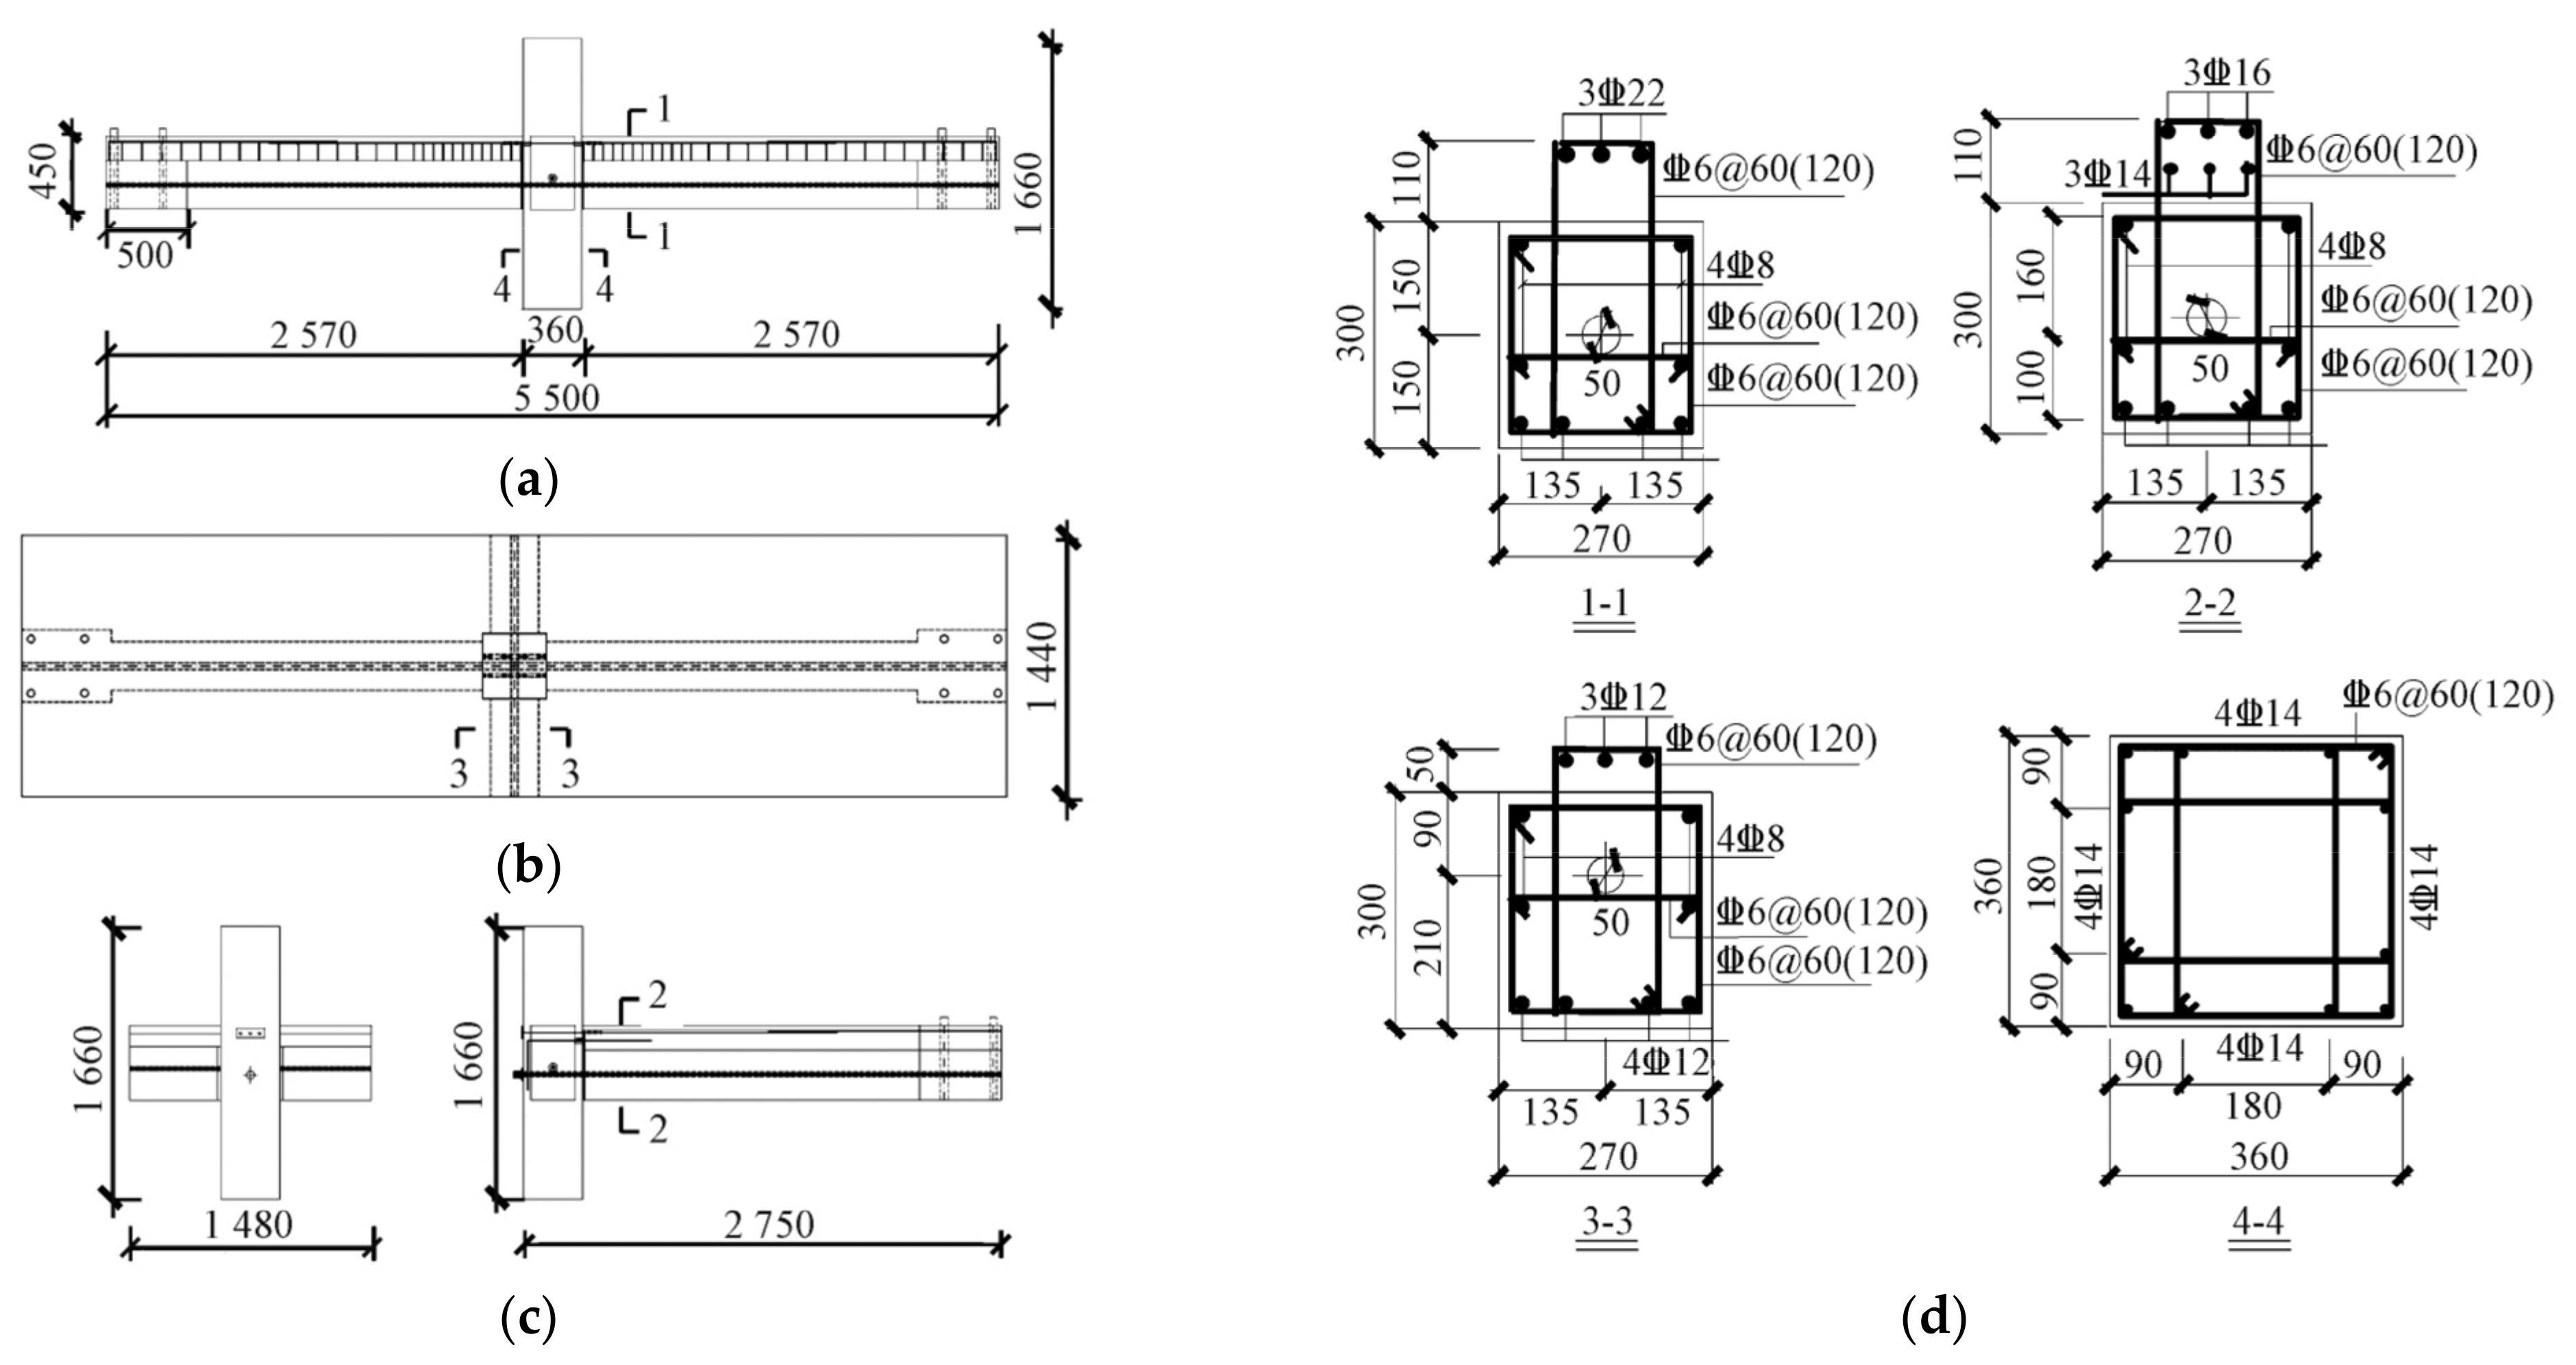
3.1. Cyclic Loading Test on Precast Beam–Slab Assembly

Kaya et al. [27] used a 3D nonlinear finite element modeling method, which was implemented in ANSYS to simulate quasistatic loading tests on three dry-connected assembled joints and one cast-in-place joint. The joints were prestressed with superimposed floor slabs. According to the initial stress level of the prestressing bars, the specimens were divided into three groups named CP1 (40%), AP1 (50%) and DP1 (60%). Figure 5 shows the size and reinforcement of the joints. The loading protocol of all tests adopted the load control mode before yielding and the displacement control mode after yielding. The maximum interlayer angles imposed in displacement control mode were 1/150, 1/100, 1/80, 1/60, 1/50, 1/40, 1/30, 1/25, 1/20 and 1/15. The crack development and damage of the specimens were well reflected in the simulation process but some of the simulation results were hardly comparable to the experiment data. Readers are referred to the upcoming section for more details on this issue.
Pan et al. [28] conducted cyclic loading tests on dry-connected assembled joints with floor slabs in 2018, comparing their hysteretic performance, stiffness, loadbearing capacity and energy dissipation capacity with cast-in-place joints. In the experimental program, four fabricated joint specimens were designed, mid-joint A2 (unbonded inside the column), mid-joint A3 (unbonded outside the column), edge-joint B2 (unbonded inside the column) and edge-joint B3 (unbonded outside the column). Two comparative cast-in-situ specimens were also designed, namely mid-joint A1 and edge-joint B1. Figure 6 shows the cross sections of the specimen. The loading mode of that experiment consisted of a single cycle for the story drift ratio 1/2000 and three cycles for the additional stages of the loading protocol corresponding to 1/1000, 1/800, 1/550, 1/400, 1/300, 1/200, 1/100, 1/67, 1/50, 1/40, 1/30, 1/25, 1/20 and 1/18.
In this study, a total of five joints, CP1, AP1 and DP1 specimens from [27] and mid-joint A2 and edge-joint B2 specimens from [28], were simulated. Some key parameters of the steel rebars and concrete adopted for simulation are shown in Table 1. Section 3.2 presents the numerical results in comparison with the original experimental results.

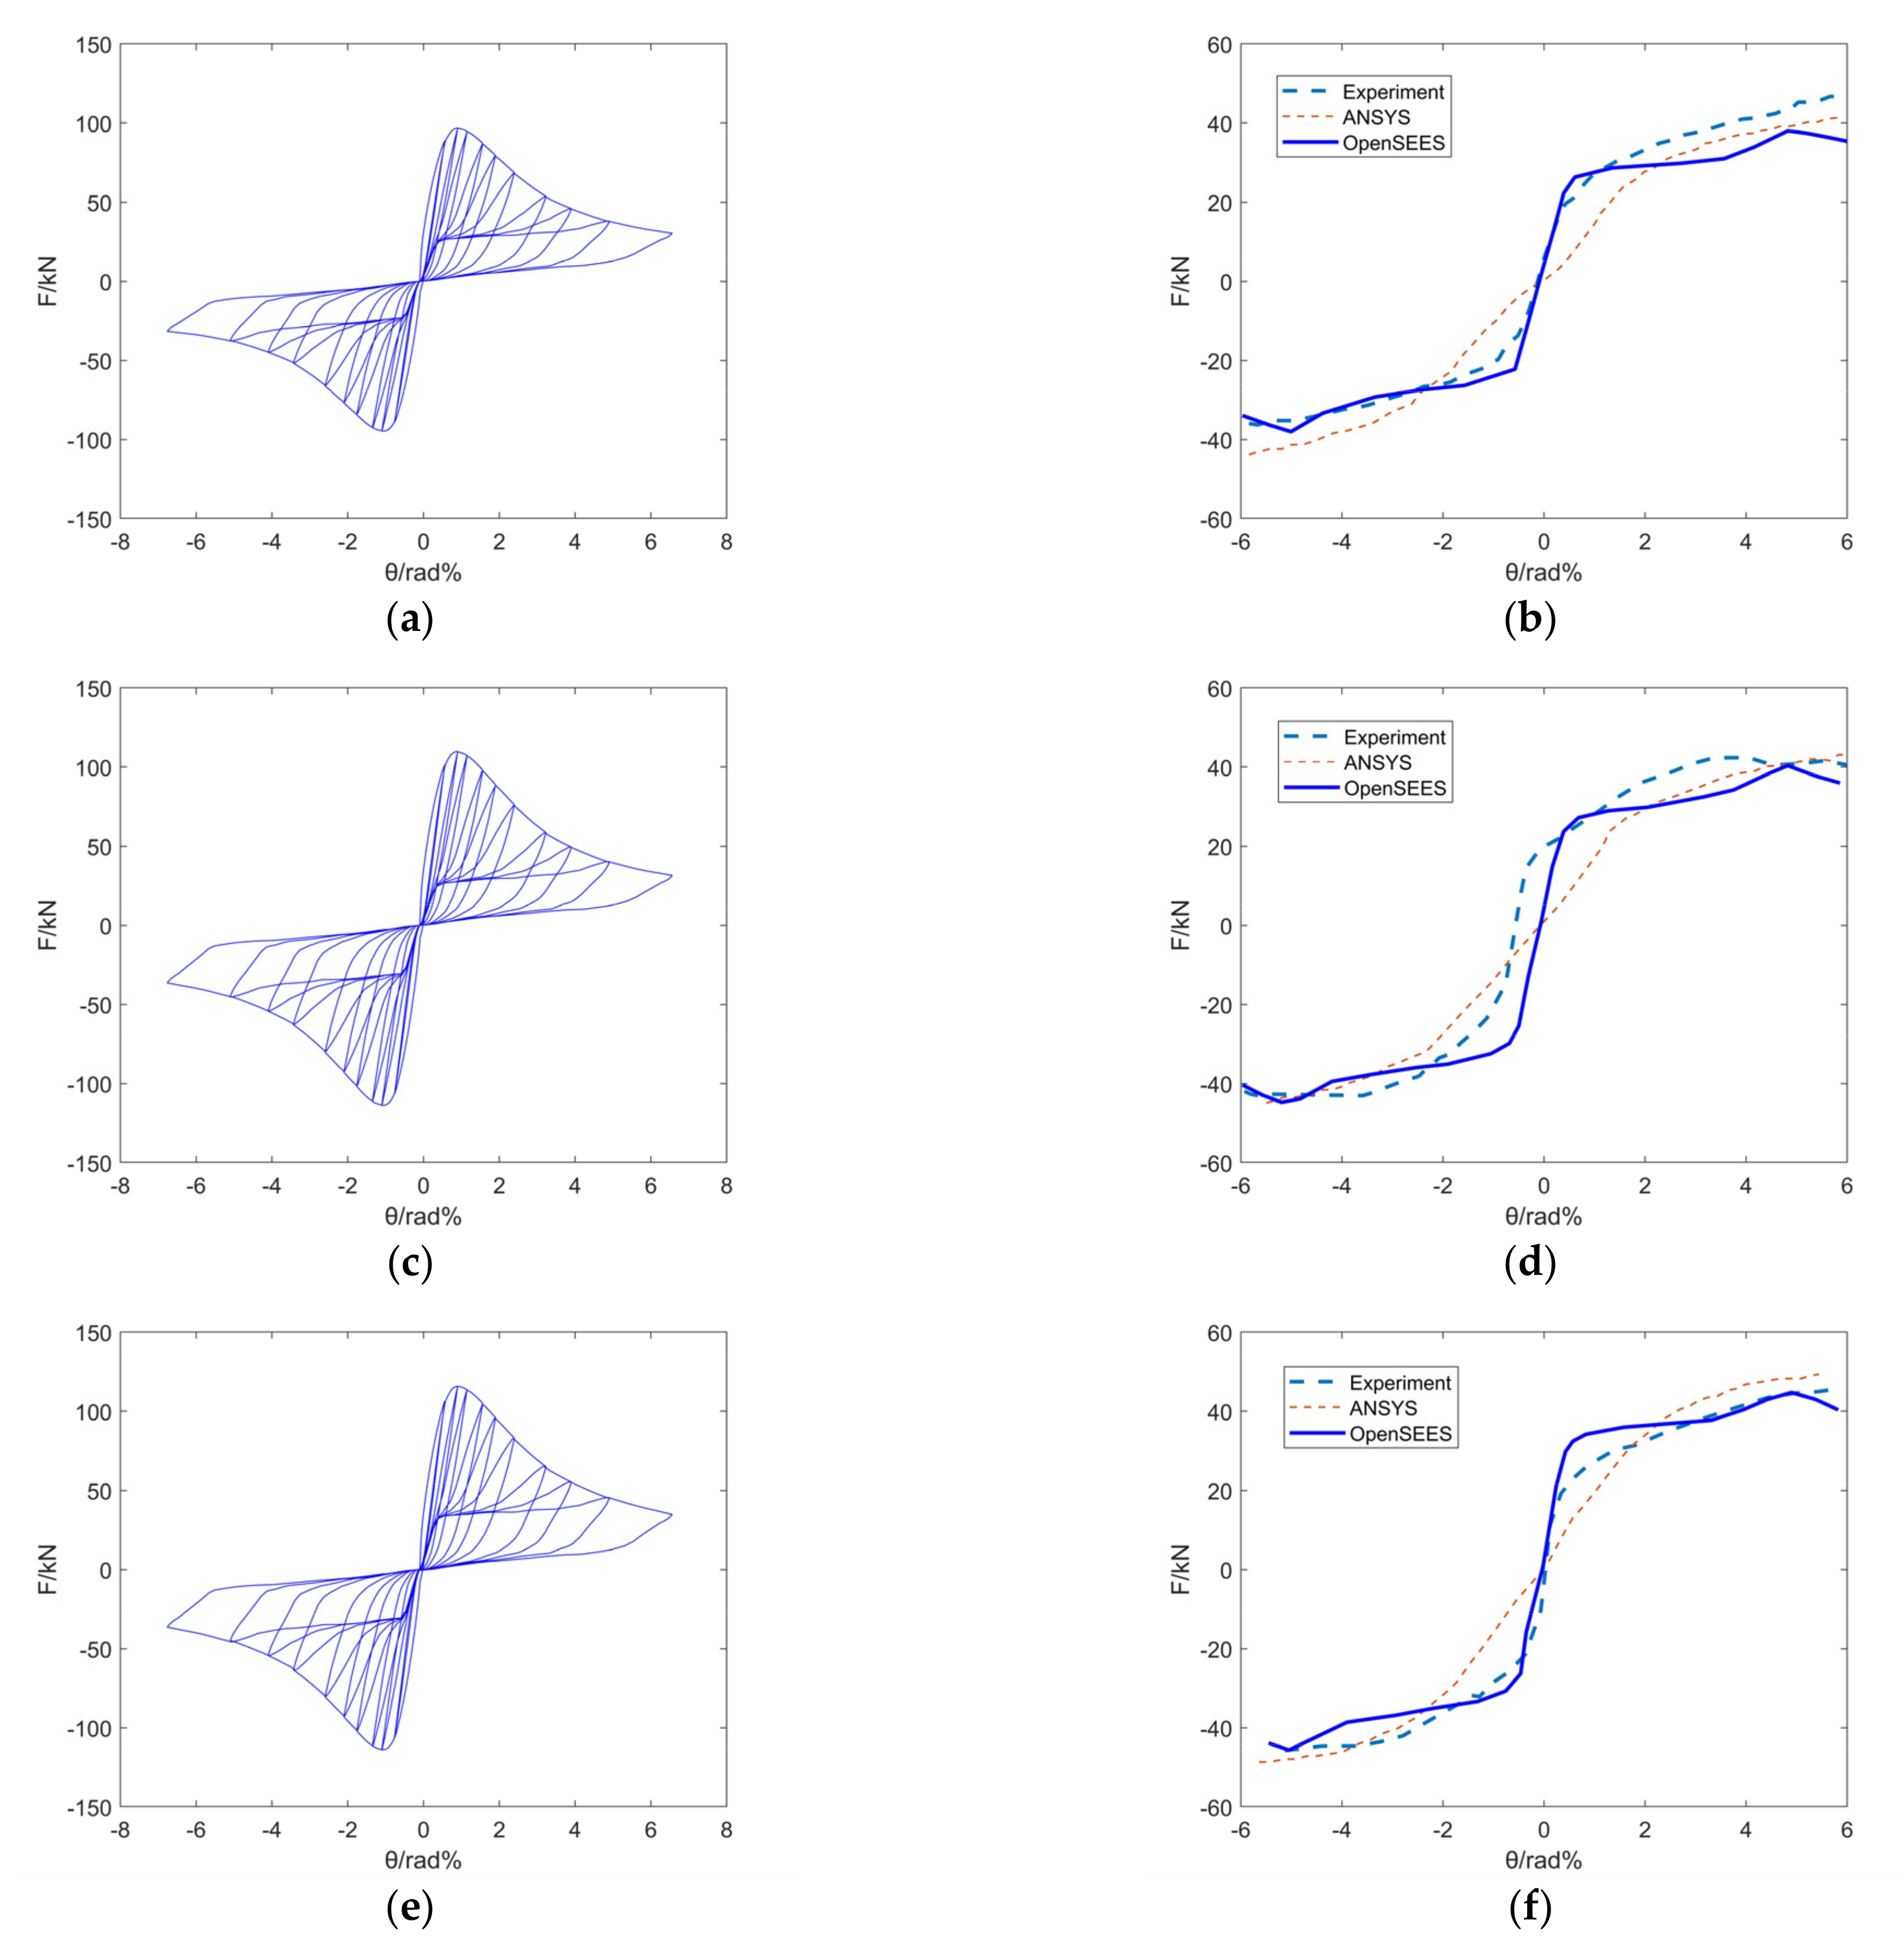
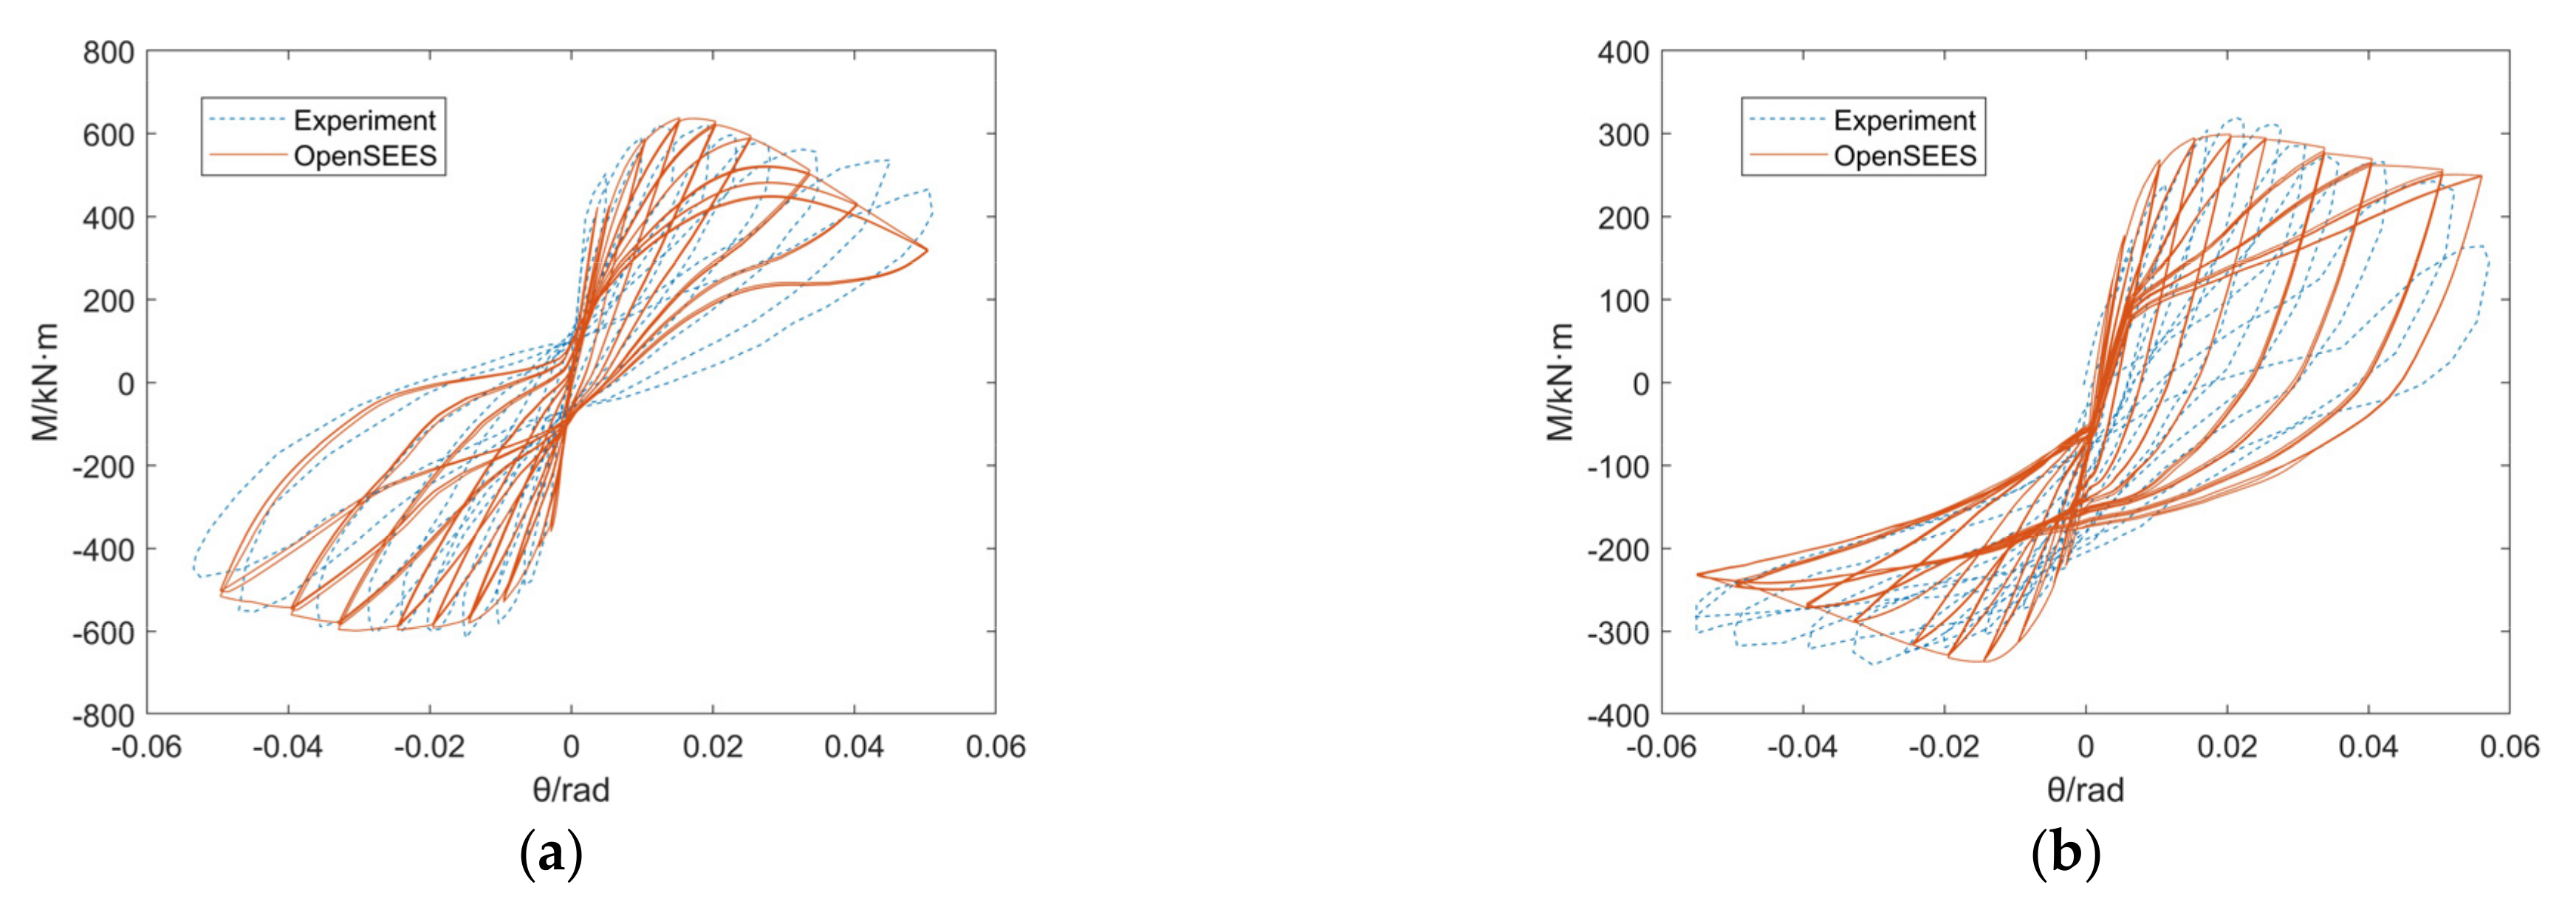
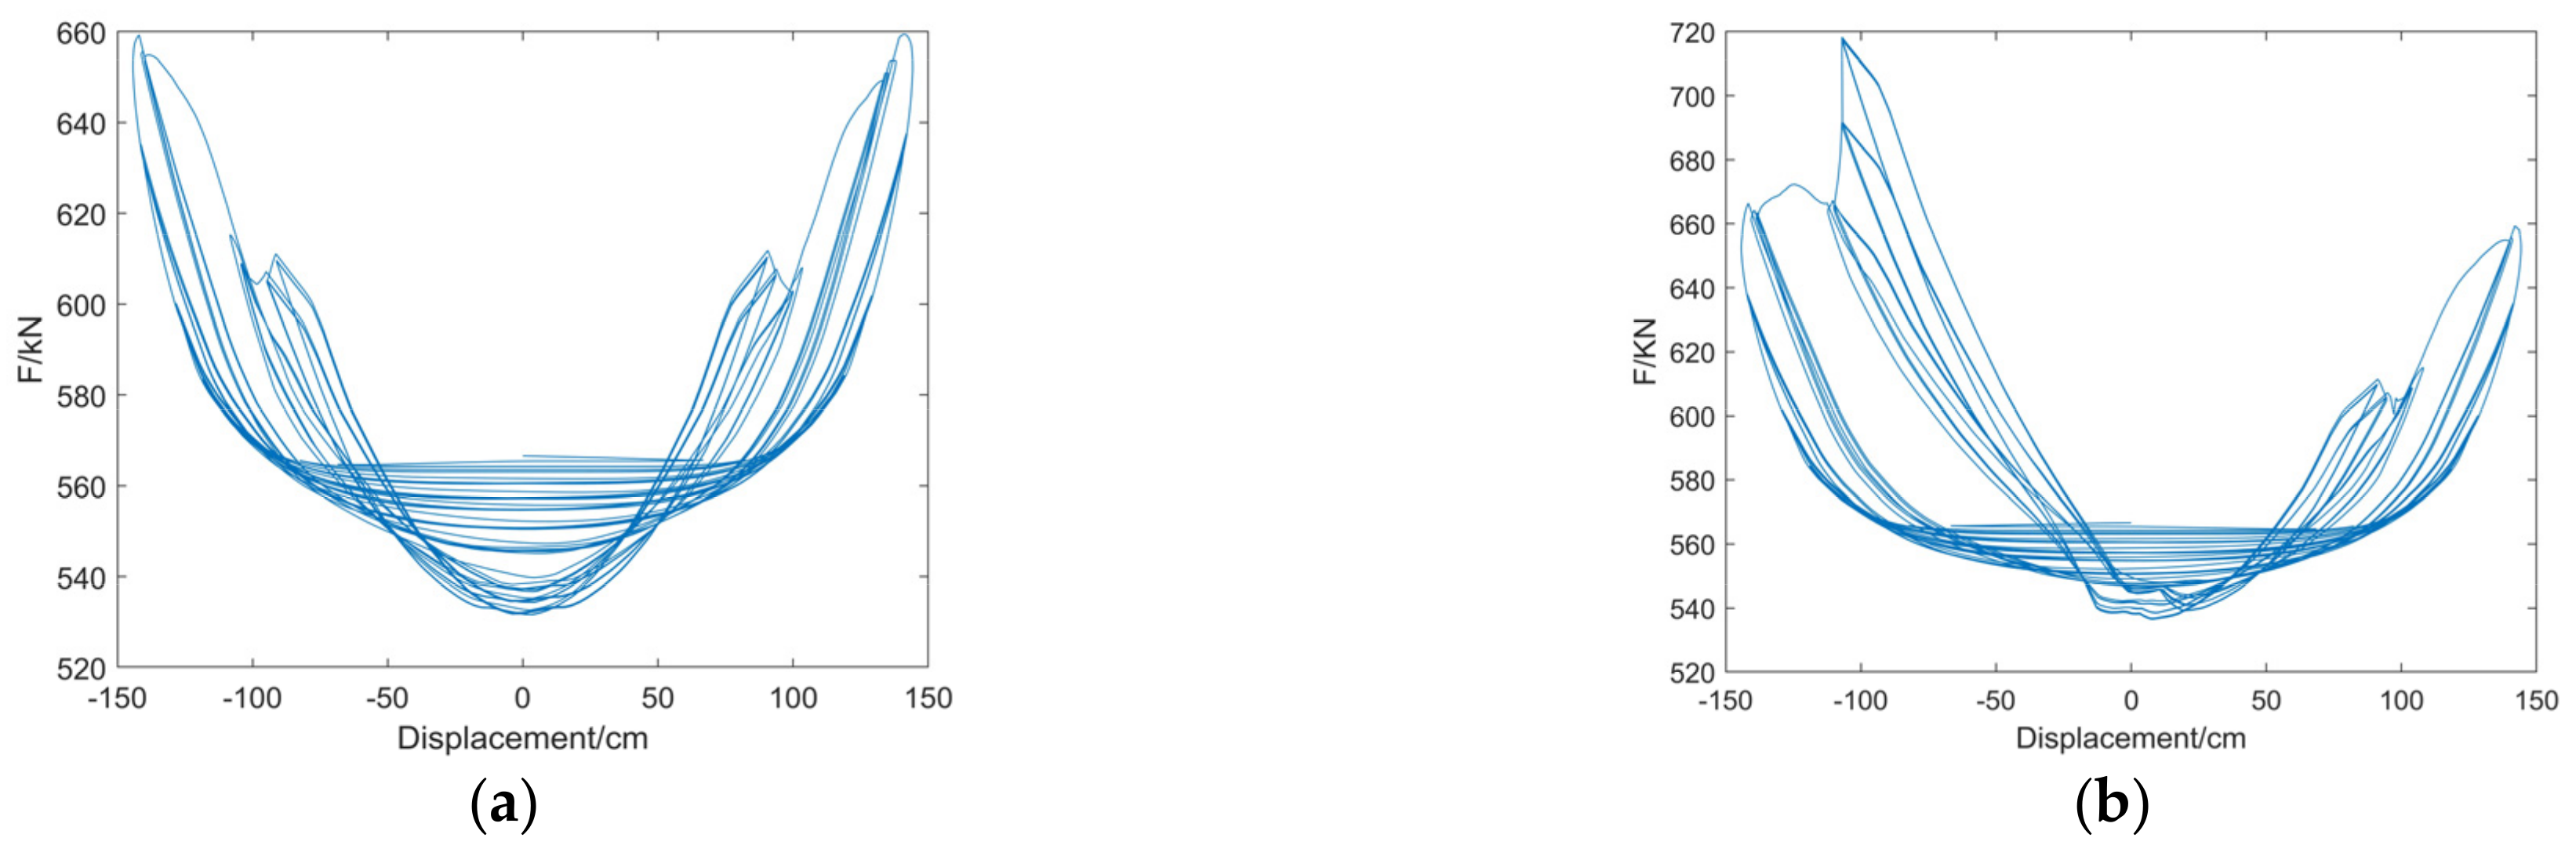
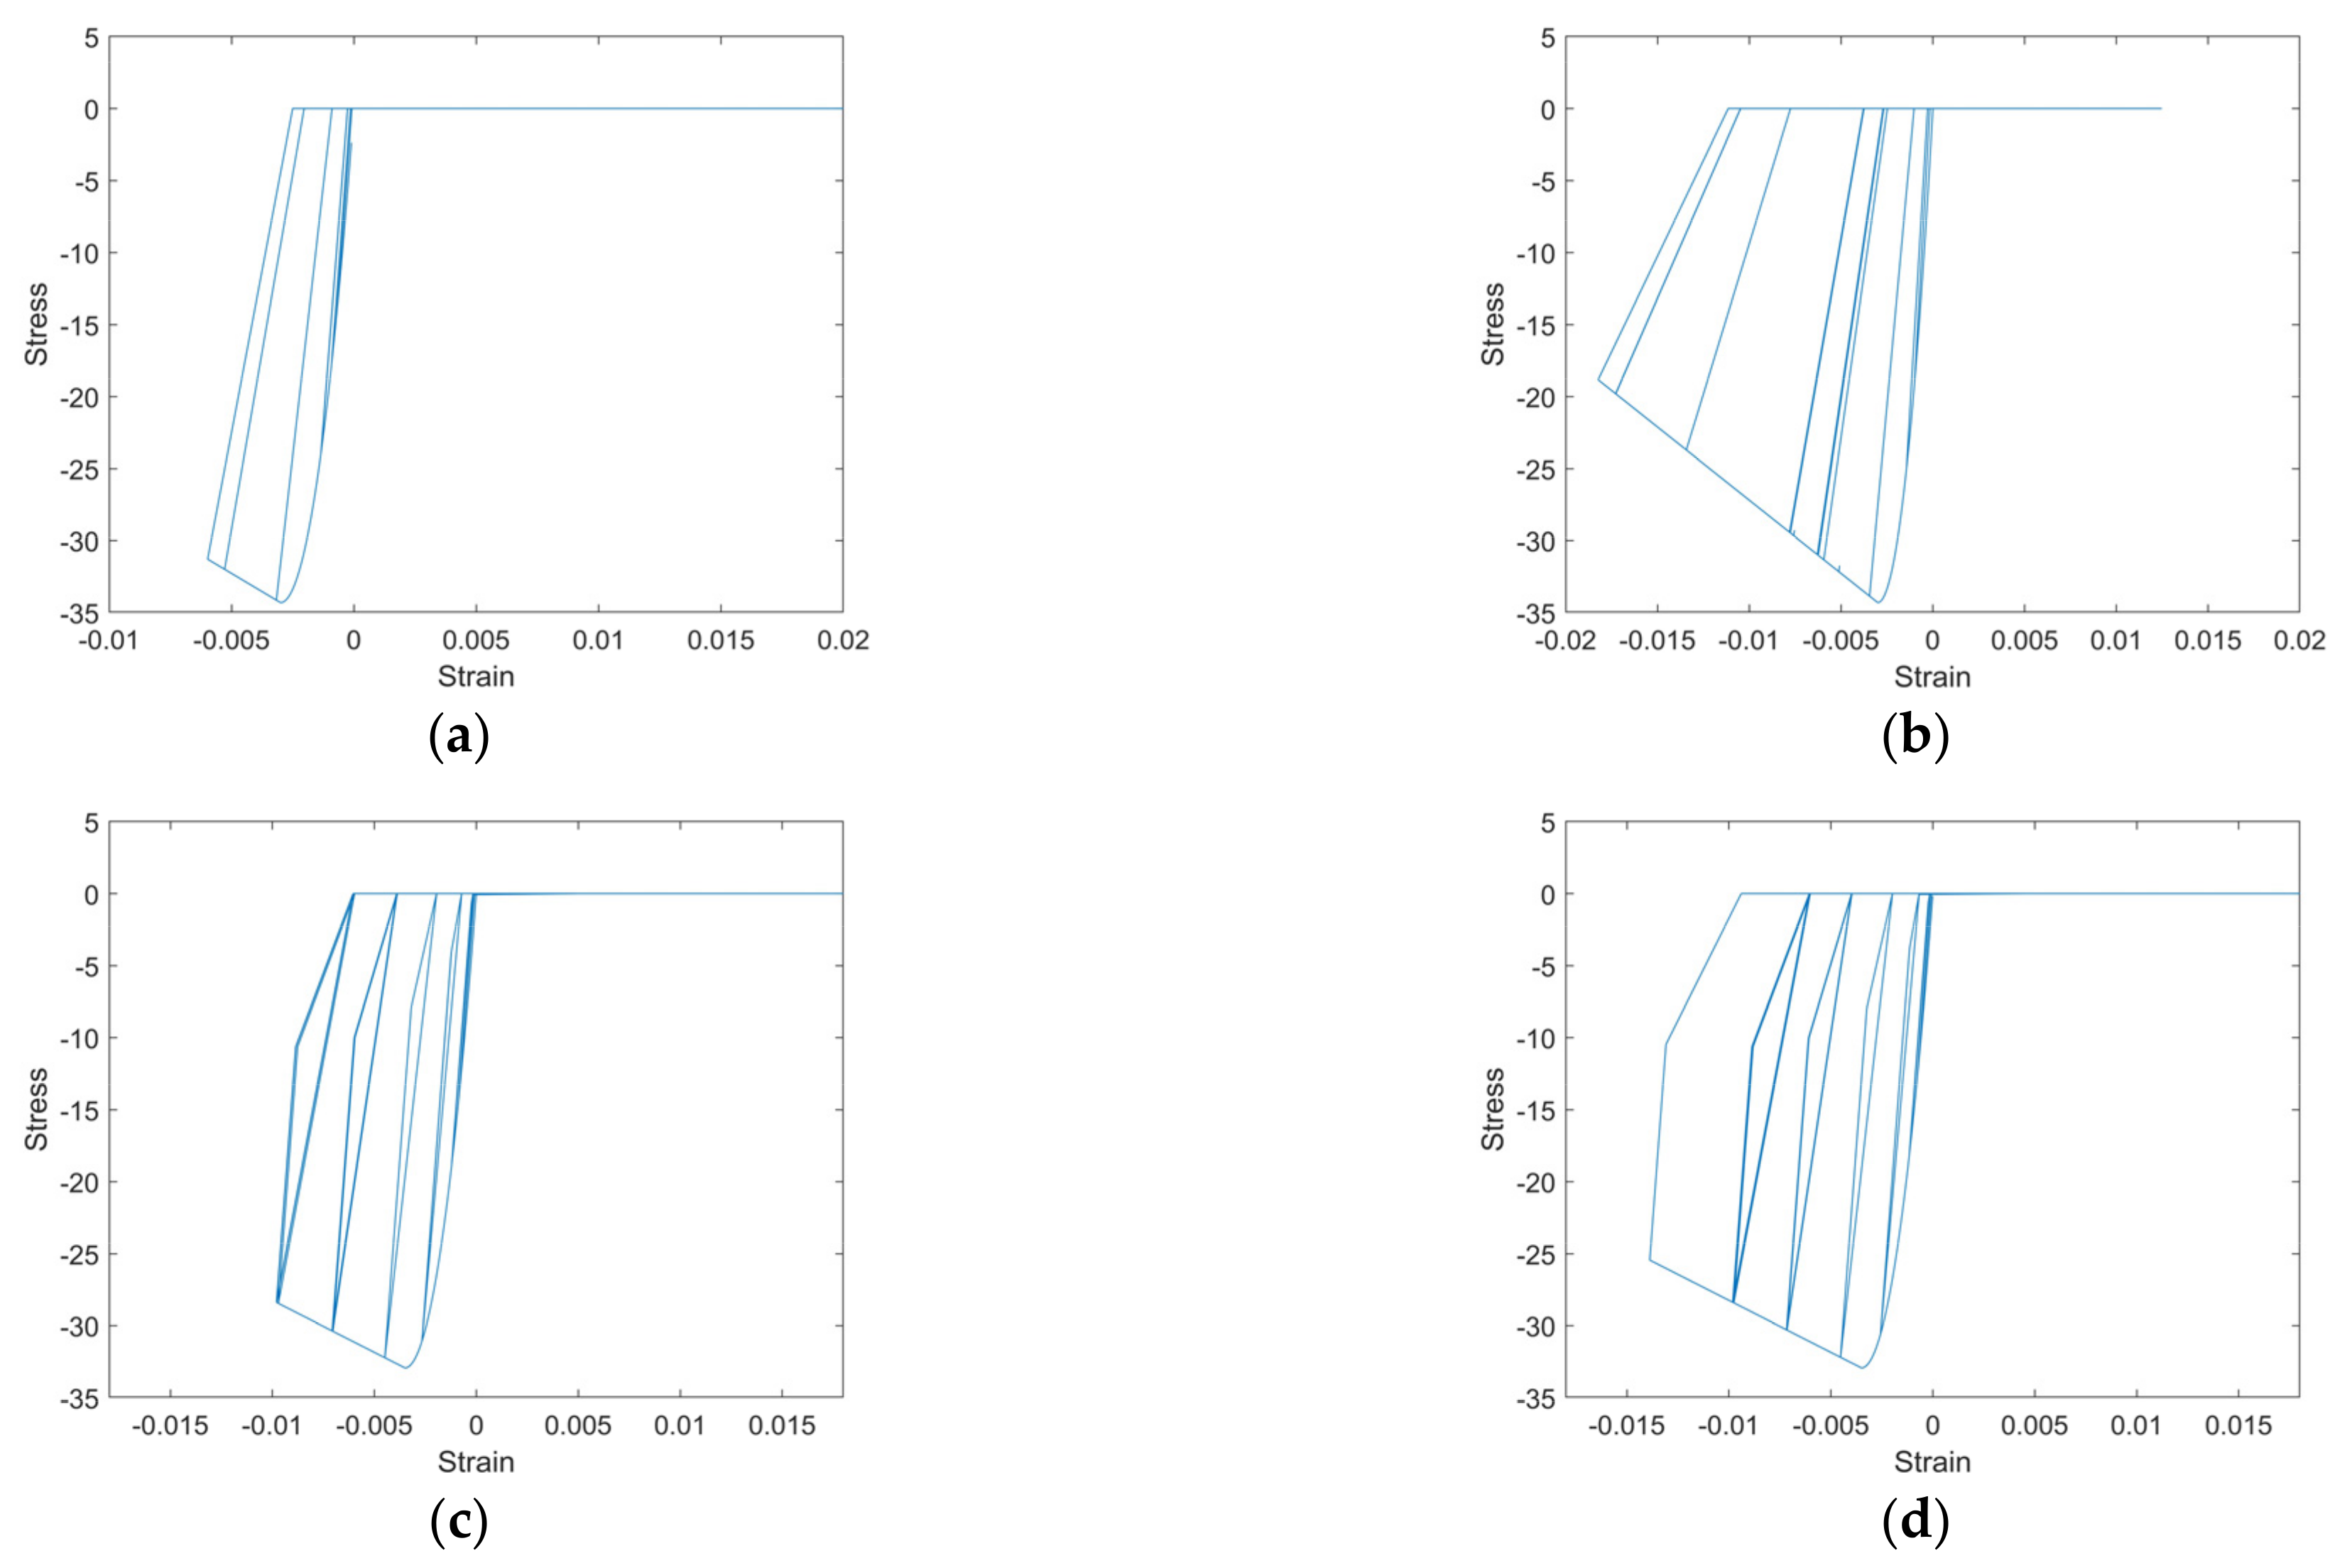
3.2. Numerical Results

The simulation results of the hysteretic curves for the first three specimens, CP1, AP1 and DP1, are shown in Figure 7. The initial loadbearing capacity of the specimens gradually increased with the initial stress of the prestressed steel bar. The self-centering ability was strong for all three specimens, while the energy dissipation capacity was relatively low and the stiffness degradation was obvious. Kaya et al. [27] also adopted ANSYS to simulate the behavior of specimens and to compare the obtained numerical data with the experimental data. However, the comparisons were limited to the monotonic backbone curve, as it was deemed difficult to model the cyclic responses of the connections using ANSYS. Obviously, the proposed OpenSees-based model had better performance and versatility than ANSYS, as shown in Figure 7b,d,f. More specifically, the proposed model in OpenSees matched the backbone curve much better than the one implemented in ANSYS and could also capture the hysteretic behavior.
Figure 8 depicts the comparisons of the experimental and numerical hysteretic curves for specimens A2 and B2, confirming a good agreement. The results show that the initial stiffness and initial loadbearing capacity simulations were basically the same as the original data, with a similar stiffness degradation trend and roughly equal residual deformations. Moreover, a certain extent of energy dissipation of the specimen can be reflected using this simulation method.
The hysteresis curve of the B2 specimen (edge-joint) shows significant asymmetry, which was caused by the asymmetry of the concrete material and the reinforcement material located at the upper and lower ends of the beam, considering the floor slab. This affected the mechanical properties of the prestressed tendons during the cyclic loading process, which made the specimen capable of reflecting not only the asymmetry in energy dissipation capacity but also significant asymmetry in self-centering capability. In this regard, this paper further provides and analyzes both the axial force displacement diagram of the prestressed steel bars for specimens A2 and B2 (Figure 9) and the stress–strain diagram of the upper and lower concrete of the beam end (Figure 10). Figure 9 indicates that the slab caused asymmetric behavior in the prestressed tendons. In addition, it can be observed from Figure 10 that the concrete from the upper and lower parts of the beam end also showed significant asymmetry due to the larger amount of concrete material provided by the floor slab. The concrete from the lower part got damaged faster than that located in the upper part and therefore the lower part was more prone to spall and got crushed.

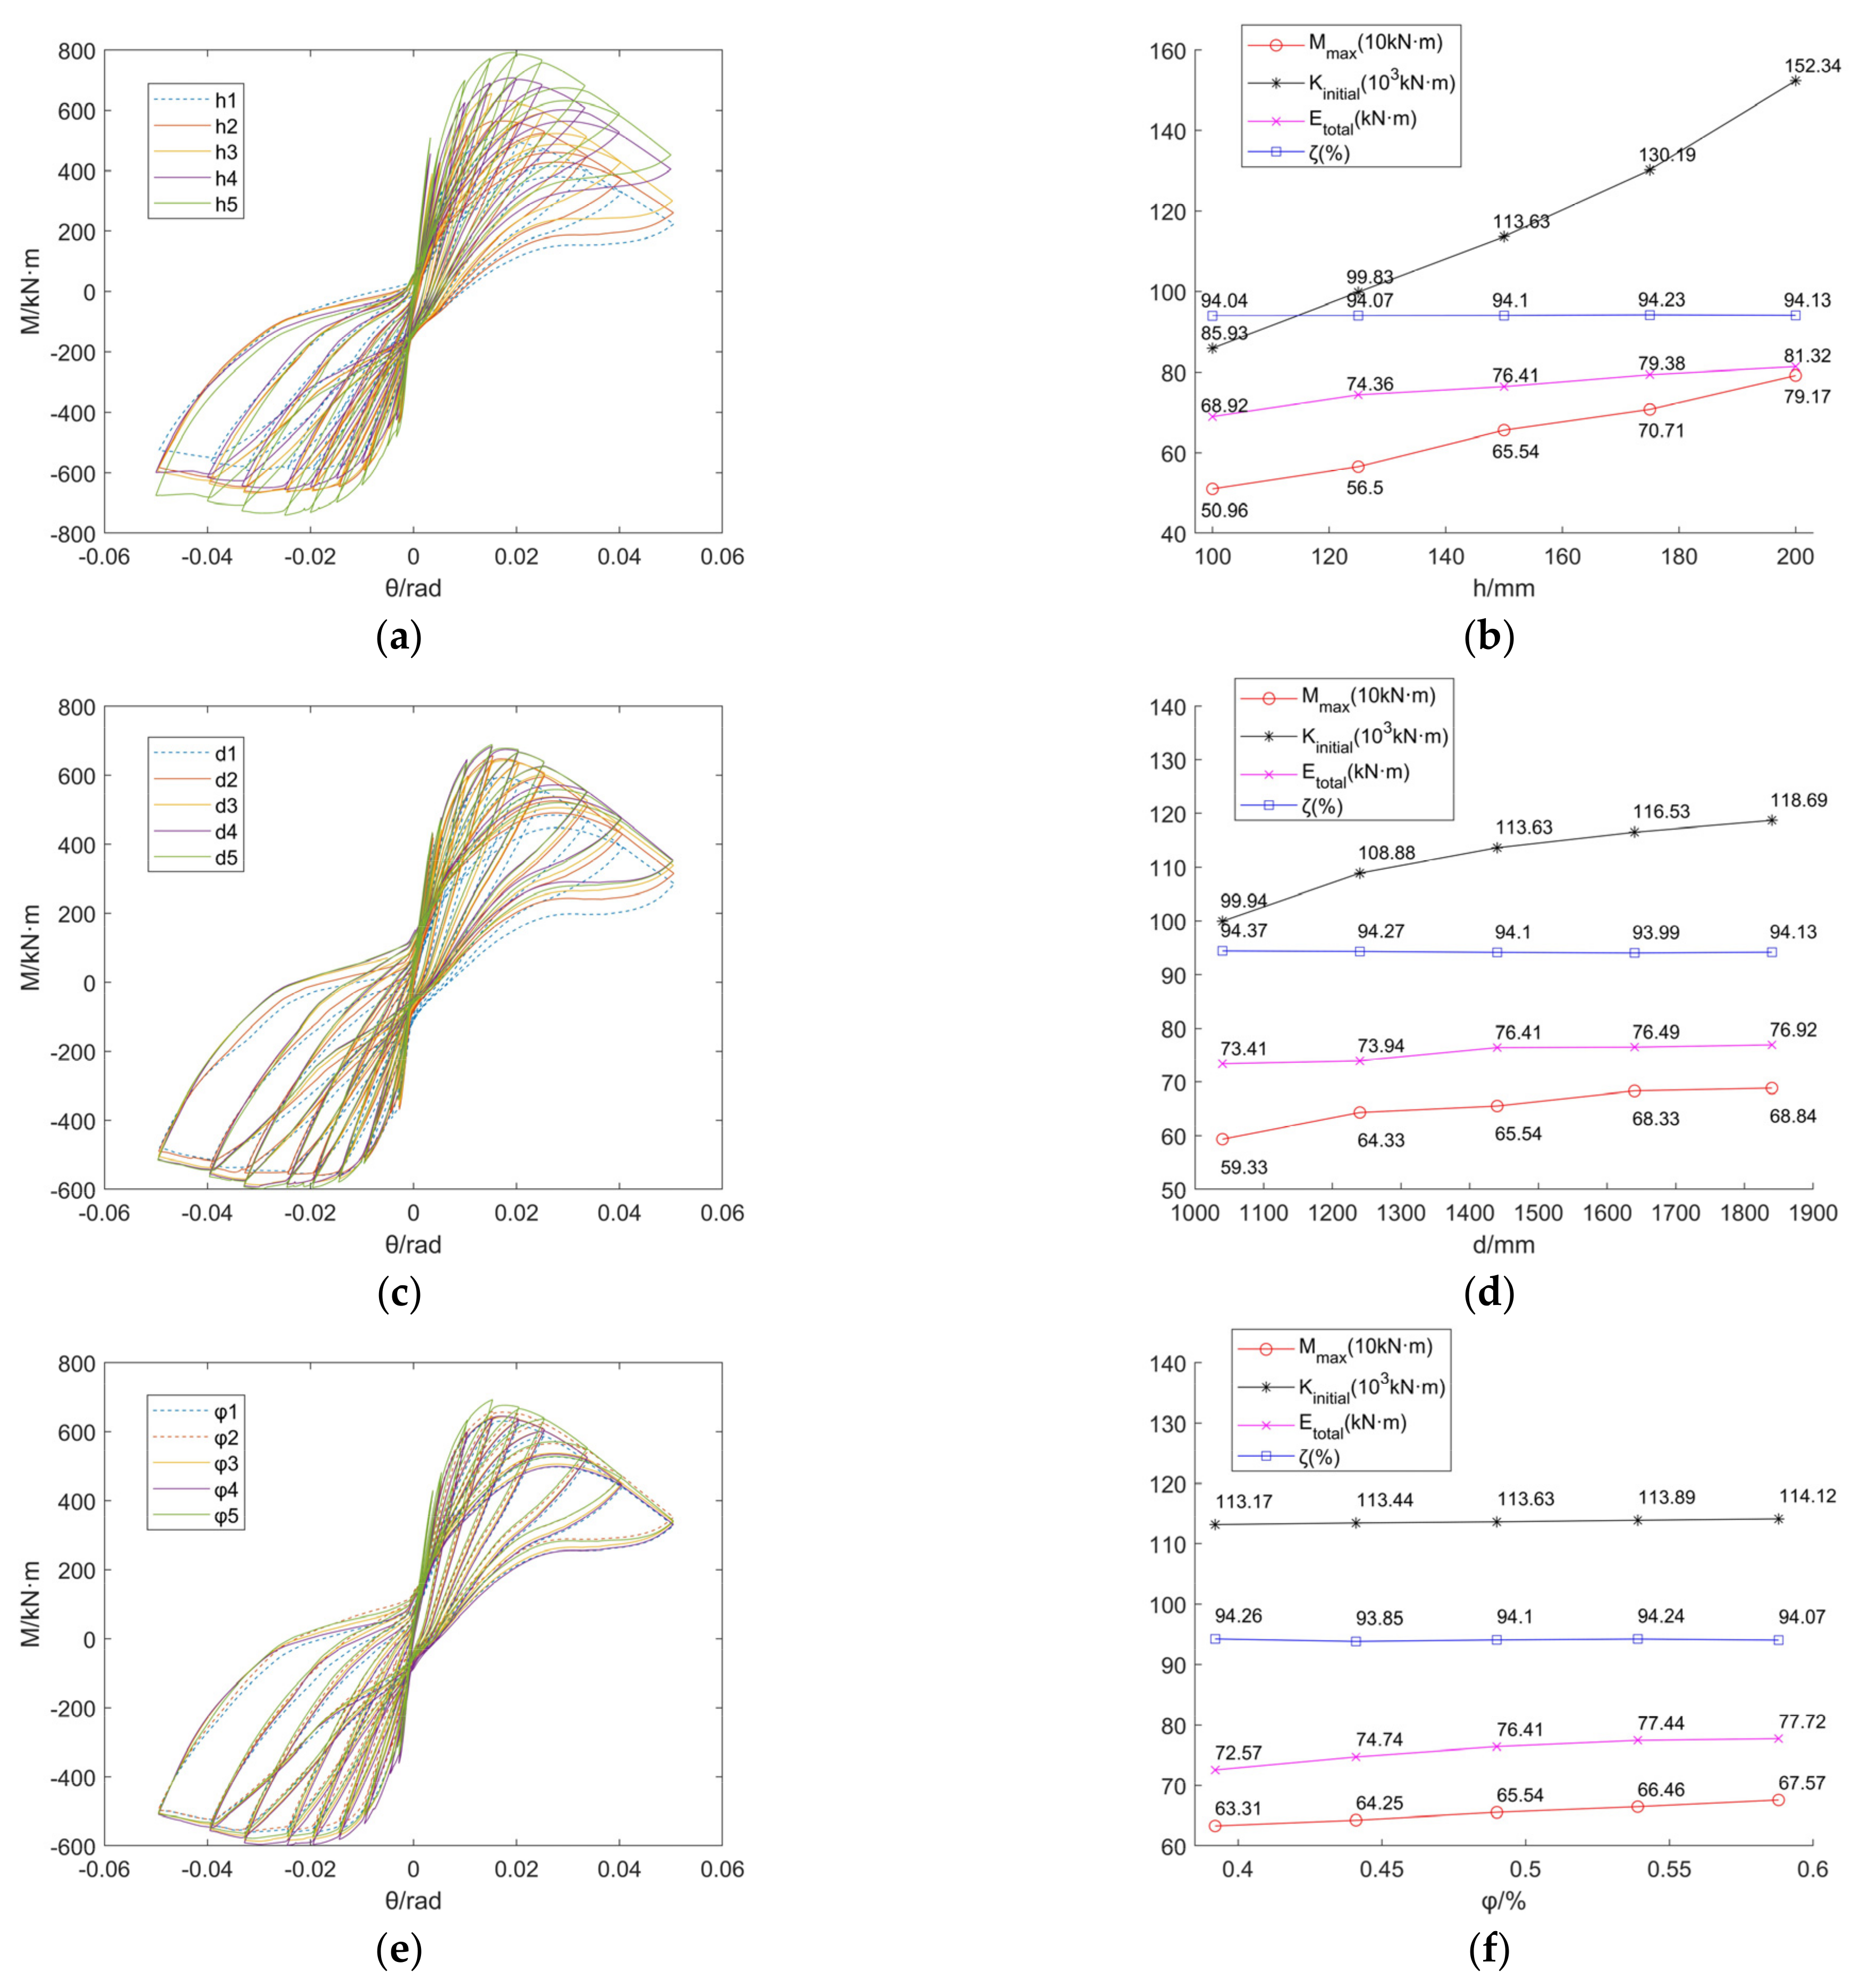
4. Parametric Analysis

In order to study the influence of various parameters of the floor slab on the prestressed dry-connected assembled joints, the A2 specimen in [28] was selected as the reference specimen and the joint was numerically analyzed under three varying parameters, namely, the slab thickness, slab width and slab reinforcement ratio.

4.1. Influence of Slab Thickness

The slab thickness of the A2 specimen (h = 150 mm) was set as the reference value. Four different groups were designed at every 25 mm, h1 = 100 mm, h2 = 125 mm, h3 = 150 mm, h4 = 175 mm and h5 = 200 mm. The loading process of the five specimens was undertaken in the same way as that adopted in [28], with only the first cycle of each drift level simulated. The simulated responses are presented in Figure 11a,b and the key characteristics of the hysteretic curves were also computed for comparative purposes. Four properties were considered, the maximum bending moment Mmax, the initial stiffness Kinitial, the total energy dissipation Etotal and the degradation ratio of secant stiffness ζ. The latter two parameters are expressed as follows:
E t o t a l = S 1 + S 2 + S 3 + + S n
ζ = K 1 K n K 1
where Sn stands for the area of the n-th cycle hysteresis loop.
It can be seen from the results that the maximum loadbearing capacity of this type of joint increased significantly with the slab thickness, a trend that was confirmed for the initial stiffness as well. The trend of the increment in the total energy dissipation decreased with the growth of the slab thickness. This was because the concrete was less likely to enter plasticity when the thickness was larger. The secant stiffness degradation ratio ζ refers to the ratio of the difference between the secant stiffness K1 in the first load cycle and the secant stiffness Kn in the last cycle, which was essentially maintained at 94%.

4.2. Influence of Slab Width

The slab width of the A2 specimen was 1440 mm. In accordance with this value, five groups of numerical models were designed every 200 mm, thus resulting in 1040 mm, 1240 mm, 1440 mm, 1640 mm and 1840 mm. Similarly, this specimen was also subjected to cyclic loading test simulation and the results are shown in Figure 11c,d. The loadbearing capacity and stiffness of the joints increased steadily with the increment of the slab width and increased more slowly when approaching the effective width of the flange that is specified in the Chinese Concrete Code [29]. The increase in energy dissipation capacity was significantly lower than the effect of slab thickness and the stiffness degradation ratio of the specimens did not differ by more than 0.7%.

4.3. Influence of Slab Reinforcement Ratio

The floor reinforcement ratio of the A2 specimen was 0.49% (set as φ3). Control groups were set up with 10% of this value; the five groups were, respectively: φ1 = 0.8 φ3 = 0.392%, φ2 = 0.9 φ3 = 0.441%, φ4 = 1.1 φ3 = 0.539% and φ5 = 1.2 φ3 = 0.588%. Numerical results are shown in Figure 11e,f. The loadbearing capacity of the joint increased slightly along with the variations of the reinforcement ratio of the floor. The initial rotation stiffness increased with the trend, but it was basically maintained at the order of 1.13 × 10⁵ kN∙m and the effect was not comparable to that of either the floor thickness or width. Energy dissipation increased slightly as the reinforcement ratio increased.

5. Conclusions

In this paper, a numerical simulation method for dry-type beam–slab assemblies was proposed based on the layered shell element available in OpenSees. The method was validated by modeling two sets of experiments and the influence of several key factors on the floor slab was analyzed. The main conclusions that can be drawn from this study are as follows:
(1)
This numerical simulation method can better predict the hysteretic performance of the prestressed assembled beam–slab joint. The simulation error of this method is less than 7.3% for the initial bearing capacity and 15.2% for the initial stiffness. Compared with the traditional solid model, the proposed model is computationally more efficient and better simulates the initial stiffness, loadbearing capacity, self-centering capability, energy dissipation capacity and stiffness degradation, as well as other mechanical performance indicators of the case study joints.
(2)
For the traditional two-dimensional modeling method, the influence of the floor is difficult to take into account. However, due to the consideration of the floor in this paper, the edge-joint specimen showed a very significant asymmetry, which affected the energy dissipation capacity, self-centering capability, initial stiffness, the mechanical behavior of the concrete at the beam end and the axial force of the prestressed steel bars. This certainly reflects the necessity of considering the influence of floor slabs in this type of nonlinear joint analysis.
(3)
With the increase of slab thickness from 100 mm to 200 mm, the initial stiffness, loadbearing capacity and energy dissipation capacity increased by 77.3%, 55.4% and 20.0%, respectively. In comparison, the trend was slower with the increase of slab width and when the width was close to the calculated value of the effective flange width; the influence on various indicators was less than 5.0%. However, the reinforcement ratio of the floor had little effect on the loadbearing capacity and stiffness of the joint, while it limitedly improved the energy dissipation capacity (with a maximum growth ratio of 7.1%). These three parameters had barely any effect on the stiffness degradation ratio of the joint.
(4)
Based on the research content and results of this paper, a simulation method that can be applied to “dry” connected structure was developed for reference in the future. In order to further increase the applicability of “dry” connected structures, special attention should be paid to the asymmetric effect of slabs on this kind of structure in future research.

Author Contributions

Conceptualization, D.-C.F. and G.W.; methodology, D.-C.F. and C.-Z.X.; software, C.-Z.X.; validation, D.-C.F. and C.-Z.X.; formal analysis, D.-C.F.; investigation, C.-Z.X. and D.-C.F.; resources, D.-C.F.; data curation, C.-Z.X. and D.-C.F.; writing—original draft preparation, C.-Z.X.; writing—review and editing, E.B. and F.P.; visualization, C.-Z.X., E.B. and F.P.; supervision, G.W.; project administration, G.W.; funding acquisition, D.-C.F. and G.W. All authors have read and agreed to the published version of the manuscript.

Funding

This research was funded by the National Natural Science Foundation of China, grant numbers 52078119 and 51838004.

Data Availability Statement

The authors confirm that the data supporting the findings of this study are available within the article and/or its supplementary materials.

Conflicts of Interest

The authors declare no conflict of interest.

Abbreviations

PCPrecast Concrete
PRESSSPrecast Seismic Structure Systems
UHPCUltra-High Performance Concrete
DOFDegrees-Of-Freedom
OpenSeesOpen System for Earthquake Engineering Simulation
fcʹ peak compressive strength of concrete
ε0 corresponding strain
ε3 ultimate strain
fcu the residual stress
Es Young’s modulus
Eh hardening modulus
θ storey drift ratio
Etotal total energy dissipation
ζthe degradation ratio of secant stiffness
φ reinforcement ratio of floor slab

References

  1. Wu, G.; Feng, D. Research progress on the basic performance of fabricated concrete frame joints. J. Build. Struct. 2018, 39, 1–16. (In Chinese) [Google Scholar]
  2. Cheng, L.; Zhang, Y.; Li, W.; Zhang, P.; Li, H. Research on dry connection method of prefabricated concrete structure. North Archit 2019, 4, 13–16. (In Chinese) [Google Scholar]
  3. Priestley, M.J.N. The PRESSS program Current Status and Proposed Plans for PhaseIII. PCI J. 1996, 41, 22–40. [Google Scholar] [CrossRef]
  4. Geraldine, C.S.; LEW, H.S. Performance of precast concrete beam-to-column connections subject to cyclic loading. PCI J. 1991, 36, 56–67. [Google Scholar]
  5. Cai, J.; Feng, J.; Wang, Z.; Zhu, H. Research on seismic performance of prefabricated prestressed concrete assembled monolithic frame. J. Sun Yat Univ. (Nat. Sci. Ed.) 2009, 48, 136–140. (In Chinese) [Google Scholar]
  6. Guo, T.; Song, L.; Zhang, G.; Gu, Y. Experimental research on web-friction self-centering prestressed concrete frame beam-column joints. J. Civ. Eng. 2012, 45, 23–32. (In Chinese) [Google Scholar]
  7. Alver, N.; Selman, M.E.; Akgun, O.B. The effect of short cantilever beam formation on the structural behavior of precast posttensioned connections. Constr. Build. Mater. 2012, 35, 232–239. [Google Scholar] [CrossRef]
  8. Ercan Yuksel, H.; Faruk Karadogan, I.; Engin, B. Seismic behavior of two exterior beam- column connections made of normal-strength concrete developed for precast construction. Eng. Struct. 2015, 99, 157–172. [Google Scholar] [CrossRef]
  9. Zhang, C.; Zhou, Y.; Cai, X.; Meng, S. Experimental study on seismic performance of post- tensioned non-bonded hybrid assembled frame joints. J. Southeast Univ. 2016, 46, 1063–1069. (In Chinese) [Google Scholar]
  10. Han, C.; Li, Q.; Jiang, W. Experimental study on seismic performance of joints between prefabricated prestressed concrete beams and high-strength reinforced concrete columns. Vib. Shock 2017, 36, 248–253. (In Chinese) [Google Scholar]
  11. Liao, X.; Hu, X.; Ma, R.; Miao, D.; Xue, W. Experimental study on seismic performance of joints in assembled prestressed concrete frames with high axial compression ratio. J. Build. Struct. 2016, 37, 82–89. (In Chinese) [Google Scholar]
  12. Brunesi, E.; Peloso, S.; Pinho, R.; Nascimbene, R. Shake-Table Testing of a Full-Scale Two-Story Precast Wall-Slab-Wall Structure. Earthq. Spectra 2019, 35, 1583–1609. [Google Scholar] [CrossRef]
  13. Brunesi, E.; Peloso, S.; Pinho, R.; Nascimbene, R. Cyclic tensile testing of a three-way panel connection for precast wall-slab-wall structures. Struct. Concr. 2019, 20, 1307–1315. [Google Scholar] [CrossRef]
  14. Brunesi, E.; Peloso, S.; Pinho, R.; Nascimbene, R. Cyclic tensile testing of a full-scale two-storey reinforced precast concrete wall-slab-wall structure. Bull. Earthq. Eng. 2018, 16, 5309–5339. [Google Scholar] [CrossRef]
  15. Brunesi, E.; Nascimbene, R.; Peloso, S. Evaluation of the seismic Response of Precast Wall Connections: Experimental Observations and Numerical Modeling. J. Earthq. Eng. 2020, 24, 1057–1082. [Google Scholar] [CrossRef]
  16. Brunesi, E.; Nascimbene, R. Numerical web-shear strength assessment of precast prestressed hollow core slab units. Eng. Struct. 2015, 102, 13–30. [Google Scholar] [CrossRef]
  17. Valikhani, A.; Jahromi, A.J.; Mantawy, I.M.; Azizinamini, A. Numerical Modelling of concrete-to-UHPC Bond Strength. Materials 2020, 13, 1379. [Google Scholar] [CrossRef] [Green Version]
  18. Sucharda, O. Identification of Fracture Mechanic Properties of Concrete and Analysis of Shear Capacity of Reinforced Concrete Beams without Transverse Reinforcement. Materials 2020, 13, 2788. [Google Scholar] [CrossRef]
  19. Li, J.; Hao, H.; Wu, C. Numerical study of precast segmental column under blast loads. Eng. Struct. 2017, 134, 125–137. [Google Scholar] [CrossRef]
  20. Sousaa, R.; Batalhab, N.; Rodriguesc, H. Numerical simulation of beam-to-column connections in precast reinforced concrete buildings using fibre-based frame models. Eng. Struct. 2020, 203, 109845. [Google Scholar] [CrossRef]
  21. Cao, X.; Feng, D.; Wang, Z.; Wu, G. Research on numerical simulation method of assembled concrete frame joints based on OpenSEES. J. Civ. Eng. 2019, 52, 13–27. (In Chinese) [Google Scholar]
  22. Lu, X.; Xie, L.; Guan, H.; Huang, Y.; Lu, X. A shear wall element for nonlinear seismic analysis of super-tall buildings using OpenSees. Finite Elem. Anal. Des. 2015, 98, 14–25. [Google Scholar] [CrossRef] [Green Version]
  23. Lu, X.; Tian, Y.; Cen, S.; Guan, H.; Xie, L.; Wang, L. A high-performance quadrilateral flat shell element for seismic collapse simulation of tall buildings and its implementation in OpenSees. J. Earthq. Eng. 2018, 22, 1662–1682. [Google Scholar] [CrossRef]
  24. Hisham, M.; Yassin, M. Nonlinear Analysis of Prestressed Concrete Structures under Monotonic and Cycling Loads. Ph.D. Thesis, University of California, Berkeley, CA, USA, 1994. [Google Scholar]
  25. Scott, H.D.; Park, R.; Priestley, M.J.N. Stress-strain behavior of concrete confined by overlapping hoops at low and high strain rates. J. Am. Concr. Inst. 1982, 79, 13–27. [Google Scholar]
  26. Filippou, F.C.; Popov, E.P.; Bertero, V.V. Effects of Bond Deterioration on Hysteretic Behavior of Reinforced Concrete Joints; Report EERC 83-19; Earthquake Engineering Research. Available online: https://nehrpsearch.nist.gov/static/files/NSF/PB84192020.pdf (accessed on 1 December 2020).
  27. Kaya, M.; Arslan, A.S. Analytical modeling of post-tensioned precast beam-to-column connections. Mater. Des. 2009, 30, 3802–3811. [Google Scholar] [CrossRef]
  28. Pan, P.; Wang, H.; Guo, H.; Liu, K.; Wang, D.; Qi, H.; Geng, J. Research on seismic performance of post-tensioned non-bonded pre- stressed dry-connected beam-column joints. J. Build. Struct. 2018, 39, 47–55. (In Chinese) [Google Scholar]
  29. Ministry of Housing and Urban-Rural Development of the People’s Republic of China. Concrete Structure Design Code: GB50010-2010; China Building Industry Press: Beijing, China, 2015. (In Chinese) [Google Scholar]
Figure 1. Four prestressed connection methods recommended by the PERSSS project [3]: (a) pre-tension with damping; (b) post-tension with damping; (c) pre-tension without damping; (d) post-tension without damping.
Buildings 11 00007 g001
Figure 2. Schematic representation of dry-type precast connections: (a) 2D view; (b) 3D view.
Buildings 11 00007 g002
Figure 3. Schematic representation of the layered shell element developed by Lu’s team: (a) Layered shell element; (b) Reinforcement layer distribution.
Buildings 11 00007 g003
Figure 4. Constitutive models of materials: (a) concrete02; (b) steel02; (c) ElasticPPGap; (d) hysteretic.
Buildings 11 00007 g004aBuildings 11 00007 g004b
Figure 5. Size and reinforcement of the specimens from [27] used for model validation.
Buildings 11 00007 g005
Figure 6. Size and reinforcement of the specimens from [28]: (a) side view of the mid-joint; (b) top view of the mid-joint; (c) side view of the edge-joint; (d) sectional reinforcement (dimensions in mm).
Buildings 11 00007 g006
Figure 7. Analysis results of specimens from [27]: (a) simulated hysteresis curve of CP1 specimen; (b) experimental-numerical comparison for curves of CP1 specimen; (c) simulated hysteresis curve of AP1 specimen; (d) experimental-numerical comparison for curves of AP1 specimen; (e) simulated hysteresis curve of DP1 specimen; (f) experimental-numerical comparison for curves of DP1 specimen.
Buildings 11 00007 g007
Figure 8. Simulated hysteresis curves of specimens in [28]: (a) simulated hysteresis curve of A2 specimen; (b) simulated hysteresis curve of B2 specimen.
Buildings 11 00007 g008
Figure 9. Force-displacement diagrams of tendons: (a) A2 specimen; (b) B2 specimen.
Buildings 11 00007 g009
Figure 10. Stress-strain diagrams of concrete: (a) upper part of the beam end of the A2 specimen; (b) lower part of the beam end of the A2 specimen; (c) upper part of the beam end of the B2 specimen; (d) lower part of the beam end of the B2 specimen.
Buildings 11 00007 g010
Figure 11. Results of parametric analysis: (a) hysteresis curves of slab thickness analysis; (b) line chart of slab thickness parameter analysis; (c) hysteresis curves of slab width analysis; (d) line chart of slab width parameter analysis; (e) hysteresis curves of slab reinforcement ratio analysis; (f) line chart of slab reinforcement ratio parameter analysis.
Buildings 11 00007 g011
Table 1. Key parameters adopted in numerical simulation.
ComponentSpecimenInitial Prestress Strength (Mpa) Ultimate Strength (Mpa)
Prestressed reinforcement(Steel02)A2730.61860.0
B2730.61860.0
CP1716.01790.0
AP1895.01790.0
DP11074.01790.0
ComponentSpecimenfcε0fcuε3
Concrete of beam and slab
(Concrete02)
A226.80.0255.40.0035
B226.80.0255.40.0035
CP142.50.048.50.004
AP142.60.048.520.004
DP141.00.048.20.004
Component SpecimenType of reinforcementDiameter/mmYield strengthHardening ratio
Reinforcement
(Steel02/ElasticPPgap)
A2/B2HRB4006/8/12/14/16/22400.00.01
CP1/AP1/DP1S500bs8585.00.005
10505.00.005
12522.00.005
14540.00.005
16485.00.005
Publisher’s Note: MDPI stays neutral with regard to jurisdictional claims in published maps and institutional affiliations.

