
Numerical Analysis of Bearing Capacity of a Ring Footing on Geogrid Reinforced Sand


1
Department of Engineering Sciences, University of Agder, 4879 Grimstad, Norway
2
Department of Civil Engineering, University of Tishreen, SY02 Latakia, Syria
*
Author to whom correspondence should be addressed.
Buildings 2021, 11(2), 68; https://0-doi-org.brum.beds.ac.uk/10.3390/buildings11020068
Submission received: 28 December 2020
/
Revised: 26 January 2021
/
Accepted: 5 February 2021
/
Published: 14 February 2021
(This article belongs to the Section Building Energy, Physics, Environment, and Systems)
Abstract
:A ring footing is found to be of practical importance in supporting symmetrical constructions for example silos, oil storage container etc. In the present paper, numerical analysis was carried out with explicit code FLAC3D 7.0 to investigate bearing capacity of a ring footing on geogrid reinforced sand. Effects of the ratio n of its inner/outer diameter (Di/D) of a ring footing, an optimum depth to lay the geogrid layer were examined. It was found that an intersection zone was developed in soil under inner-side (aisle) of ring footing, contributing to its bearing capacity. Substantial increase of bearing capacities could be realized if ratio n of a ring footing was around 0.6. Numerical results also showed that, bearing capacity of a ring footing could increase significantly if a single-layer geogrid was laid at a proper depth under the footing. Similar contribution was found if a double-layer geogrid was implemented. However, such increases appeared to be rather limited if a triple-layer geogrid or a four-layer geogrid was used. A double-layer geogrid was recommended to increase the bearing capacity of a ring footing; the depth to lay this double-layer geogrid was also discussed.
1. Introduction
It is known that shallow foundations’ bearing capacities depend on the strength of the foundation soil its footing profile. A geogrid soil reinforcement layer laid in soil beneath the foundation contributes to a footing’s bearing capacity. The profile of footing could be in a strip, square or circular footing pattern. A footing in a ring pattern is found to be of practical importance in supporting symmetrical constructions of silos, oil storage containers, etc. The aim of this paper is to investigate the factors which affect the bearing capacity of a ring footing on geogrid reinforcement of sand.
Soil reinforcement was introduced by French engineer Vidal in 1963 [1]. Since then, reinforced soils have been used to strengthen installations such as retaining walls, bridges and foundations. Slopes utilizing reinforced soil elements only were also constructed. The application of reinforced soil leads to a significant safety factor in such installations [2]. Research efforts have been concentrated on studying the behavior of reinforced soil foundations and the influences of the reinforced soil properties on its bearing capacities [3].
Experimental investigations have revealed that the reinforcement of the soil with geogrid results in a clear improvement in the soil bearing capacity [4,5]. Boushehrian and Hataf [6] conducted an experimental study on the bearing capacity of circular and ring footings resting on reinforced sand. Keshavarz and Kumar [7] performed a study on a ring footing using the stress characteristics method, concluding that the bearing capacity reached a maximum level when n = Di/D is 0.1–0.5 (n is the ratio between the internal and outer diameter of the ring), which appears to be rather relaxing. Budania et al. [8] observed that the optimum depth of the first layer of geogrid was 0.5 B (B is the width of the rectangular footing). Sharma and Kumar [9,10,11] investigated the behavior of ring footings resting on fiber-reinforced and unreinforced sand when subjected to eccentric-inclined loading. Fatah et al. [12] conducted an experimental study on a ring and circular footing on reinforced sand soil by geo-cell. The results of those studies show that the optimum value n for a ring footing is 0.4.
Numerical studies have also been carried out to investigate the behavior of ring footing and reinforced sand. Hataf and Razavi [13] suggested that the maximum bearing capacity of a ring footing foundation could be expected when ratio n is 0.2–0.4. Chopbasti et al. [5] conducted a numerical study using Plaxis 2D to investigate the bearing capacity and displacement of the ring footing and found that the behavior of a ring footing was similar to that of a strip foundation when n was less than 0.6. Sharma and Kumar [10] found that the stress-strain response of fiber-reinforced (and unreinforced sand) under ring footing with radius ratio n of 0.4 was greater than that of circular footing in the same testing conditions. John and Asha [14] studied the behavior of ring footing on sand soil reinforced with woven and non-woven geo-textiles. Their results confirm that there would be no further improvement in soil bearing capacity after using three layers. Thomas and Philip [15] conducted studies on ring footing resting on geogrid reinforced sand and concluded that the bearing capacity was improved as the number of reinforcements was increased; however, this capacity would decrease if reinforcements layers were laid deeper. Sharma and Kumar [11] and Erickson and Drescher [16] conducted numerical studies on ring and circular footings resting on unreinforced sand soil as well as on randomly distributed fiber-reinforced sand soil. They observed that the ultimate bearing capacity of a ring footing (at n = 0.4) was higher than that of a circular footing as calculated with the methods as discussed in [17,18].
As outlined above, some parametric studies on bearing capacity of ring footings have been reported. However, it should be acknowledged that resources available for the behavior of ring footings are still limited in comparison with the literature available on strip or circular footings. This paper, using explicit finite difference code FLAC3D 7.0, studies the ultimate bearing capacity of a ring footings on geogrid reinforced sand. The effect of ratio n of a ring footing on its bearing capacity, the optimum depth to lay the geogrid reinforcement layer, and the appropriate spacing between the geogrid reinforcement layers are explored. The bearing capacity of a ring footing on sandy soil without geogrid reinforcement is also examined for comparison.
2. Numerical Modeling of Geogrid Reinforced Sand under a Ring-Footing
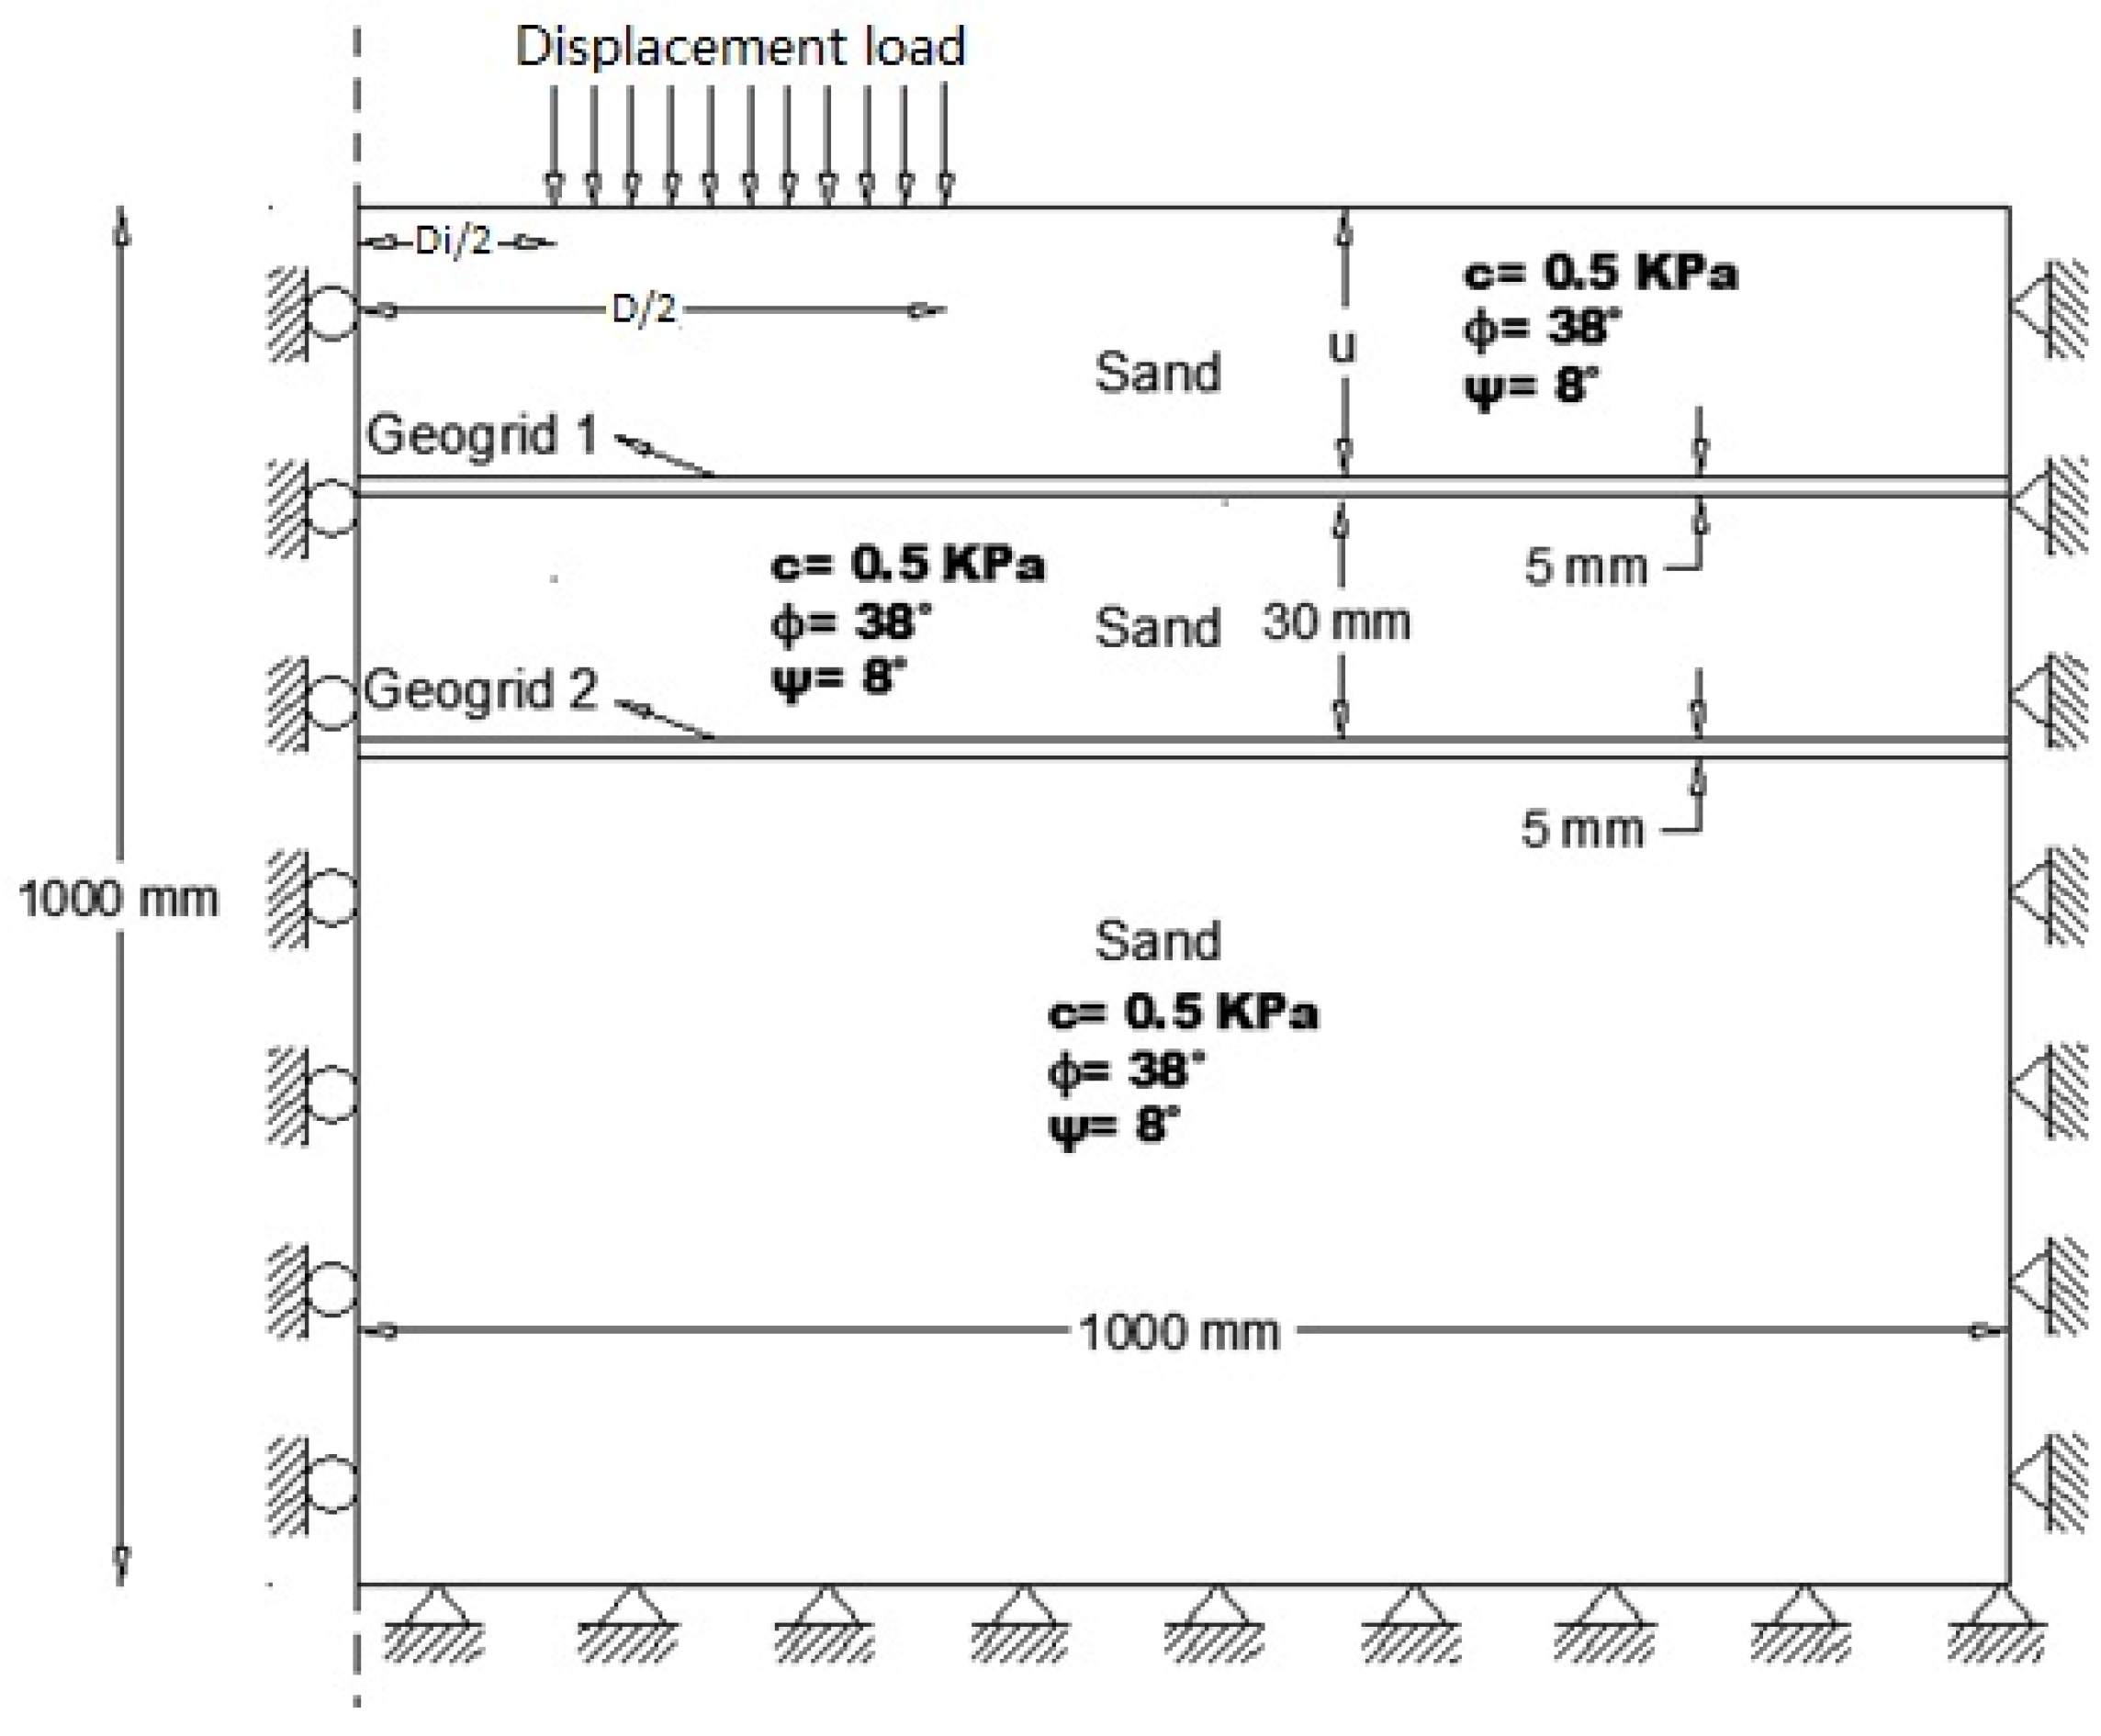
A ring footing resting on geogrid reinforced sand was modeled in the present investigation to study its bearing capacity. The model was created based on the description of a laboratory experiment by Boushehrian and Hataf, as illustrated in Figure 1 [6].
As shown in Figure 1, the ring footing has an internal diameter of 60 mm and an outer diameter of 150 mm without embedment (Df = 0). The load on the ring footing is represented in the model by specified displacement at the sandy soil surface.
To avoid the influence of external borders, the sandy soil is set to a size of 7D in both diameter and depth underneath the footing base. To be consistent with experimental study, two layers of biaxial geogrids made of polyethylene (PE) are implemented as reinforcement to provide additional strength to the sandy soil. The biaxial geogrid in the present study is 5 mm in thickness with 5 mm × 5 mm openings and large apertures to improve interaction with the soil. The depth u to lay the top geogrid reinforcement layer is set to 30 mm. The spacing h between the geogrid layers is 30 mm.
Models were created and modified with FLAC3D to investigate the influence of the geogrid reinforcement layers on load-settlement curves.
The first model was created with two layers of geogrid reinforcement in the arrangement shown in Figure 1; the second model only has one geogrid reinforcement (Geogrid 1); and the third model does not have geogrid reinforcement for comparison.
Due to symmetry, only a quarter of the geometry is considered as the domain in the modeling to reduce the calculation volume and time. The model, as created with FLAC 3D, has 10,200 meshes and 11,445 nodes (grid points).
The sandy soil was measured to have an internal friction angle = 38°, and it could be classified as SW according to the Unified Soil Classification System. Advanced constitutive models are required to characterize its nonlinear behavior or its interaction with the structure [17,18]. For simplicity, however, Mohr-Coulomb failure criteria were adopted to model its stress-strain behavior. MC model is elastic-perfectly plastic constitutive model. The modulus of elasticity E and Poisson’s ratio ν were used to represent its elasticity. Its failure was controlled by internal friction in shear. Dilation of the soil was considered, since it bore a significant effect on the bearing capacity of the soil and the collapse mechanism of the foundation [4,19,20]. A more advanced constitutive model could have been implemented. The property parameters of the sand adopted in the model proposed in this paper are given in Table 1 [6].
Contribution of a geogrid layer is critical to increase the bearing capacity of a footing. Perfect elastic model was used to simulate the behavior of the geogrid. To avoid developing shear strength and sliding between soil and geogrid, a surrounding interface component is placed on both sides of the geogrid layer. The mechanical behavior of each geogrid element can be divided into the structural response of the geogrid material and the way in which the geogrid element interacts with the model grid [21]. To model interaction between geogrid layer and sand, the so-called “structural elements” were implemented to model slip between geogrid layers and sand. The yield limit is determined by shear strength of soil-reinforcement interface. The shear strength between geogrid and soil is controlled with cohesion and friction, and modelled by the spring properties of coupling: angle of friction, strength in cohesion and its normal and shear stiffness (Kn and Ks). The mechanical properties of geogrid and its interaction parameters with sand used in the present study are given in Table 2 [6,21].
The boundary conditions in the model were specified as in the laboratory experiment. Restraints were implemented in all directions along its right vertical edge and the bottom; a vertical displacement was allowed along its left edge with a restriction on its horizontal directions due to symmetry. The ring footing was considered to be fully rough and rigid: the roughness was accomplished by restraining contact nodes in all horizontal direction (see Figure 1).
Specific displacement as loads was fulfilled at a rate of 5 × 10⁻⁶ m/step downward: 9000 steps (an equivalent of 45 mm) were conducted for the models where geogrid reinforcement was included, and 5000 steps (an equivalent of 25 mm) were used for the models without geogrid reinforcement. Computation was run on a computer with an Intel core i5 (Windows 10). It took about 10 min to run one simulation of 5000 steps and around 20 min for one of 9000 steps. It transpired that the step was small enough to eliminate the impact of initial displacement on the results.
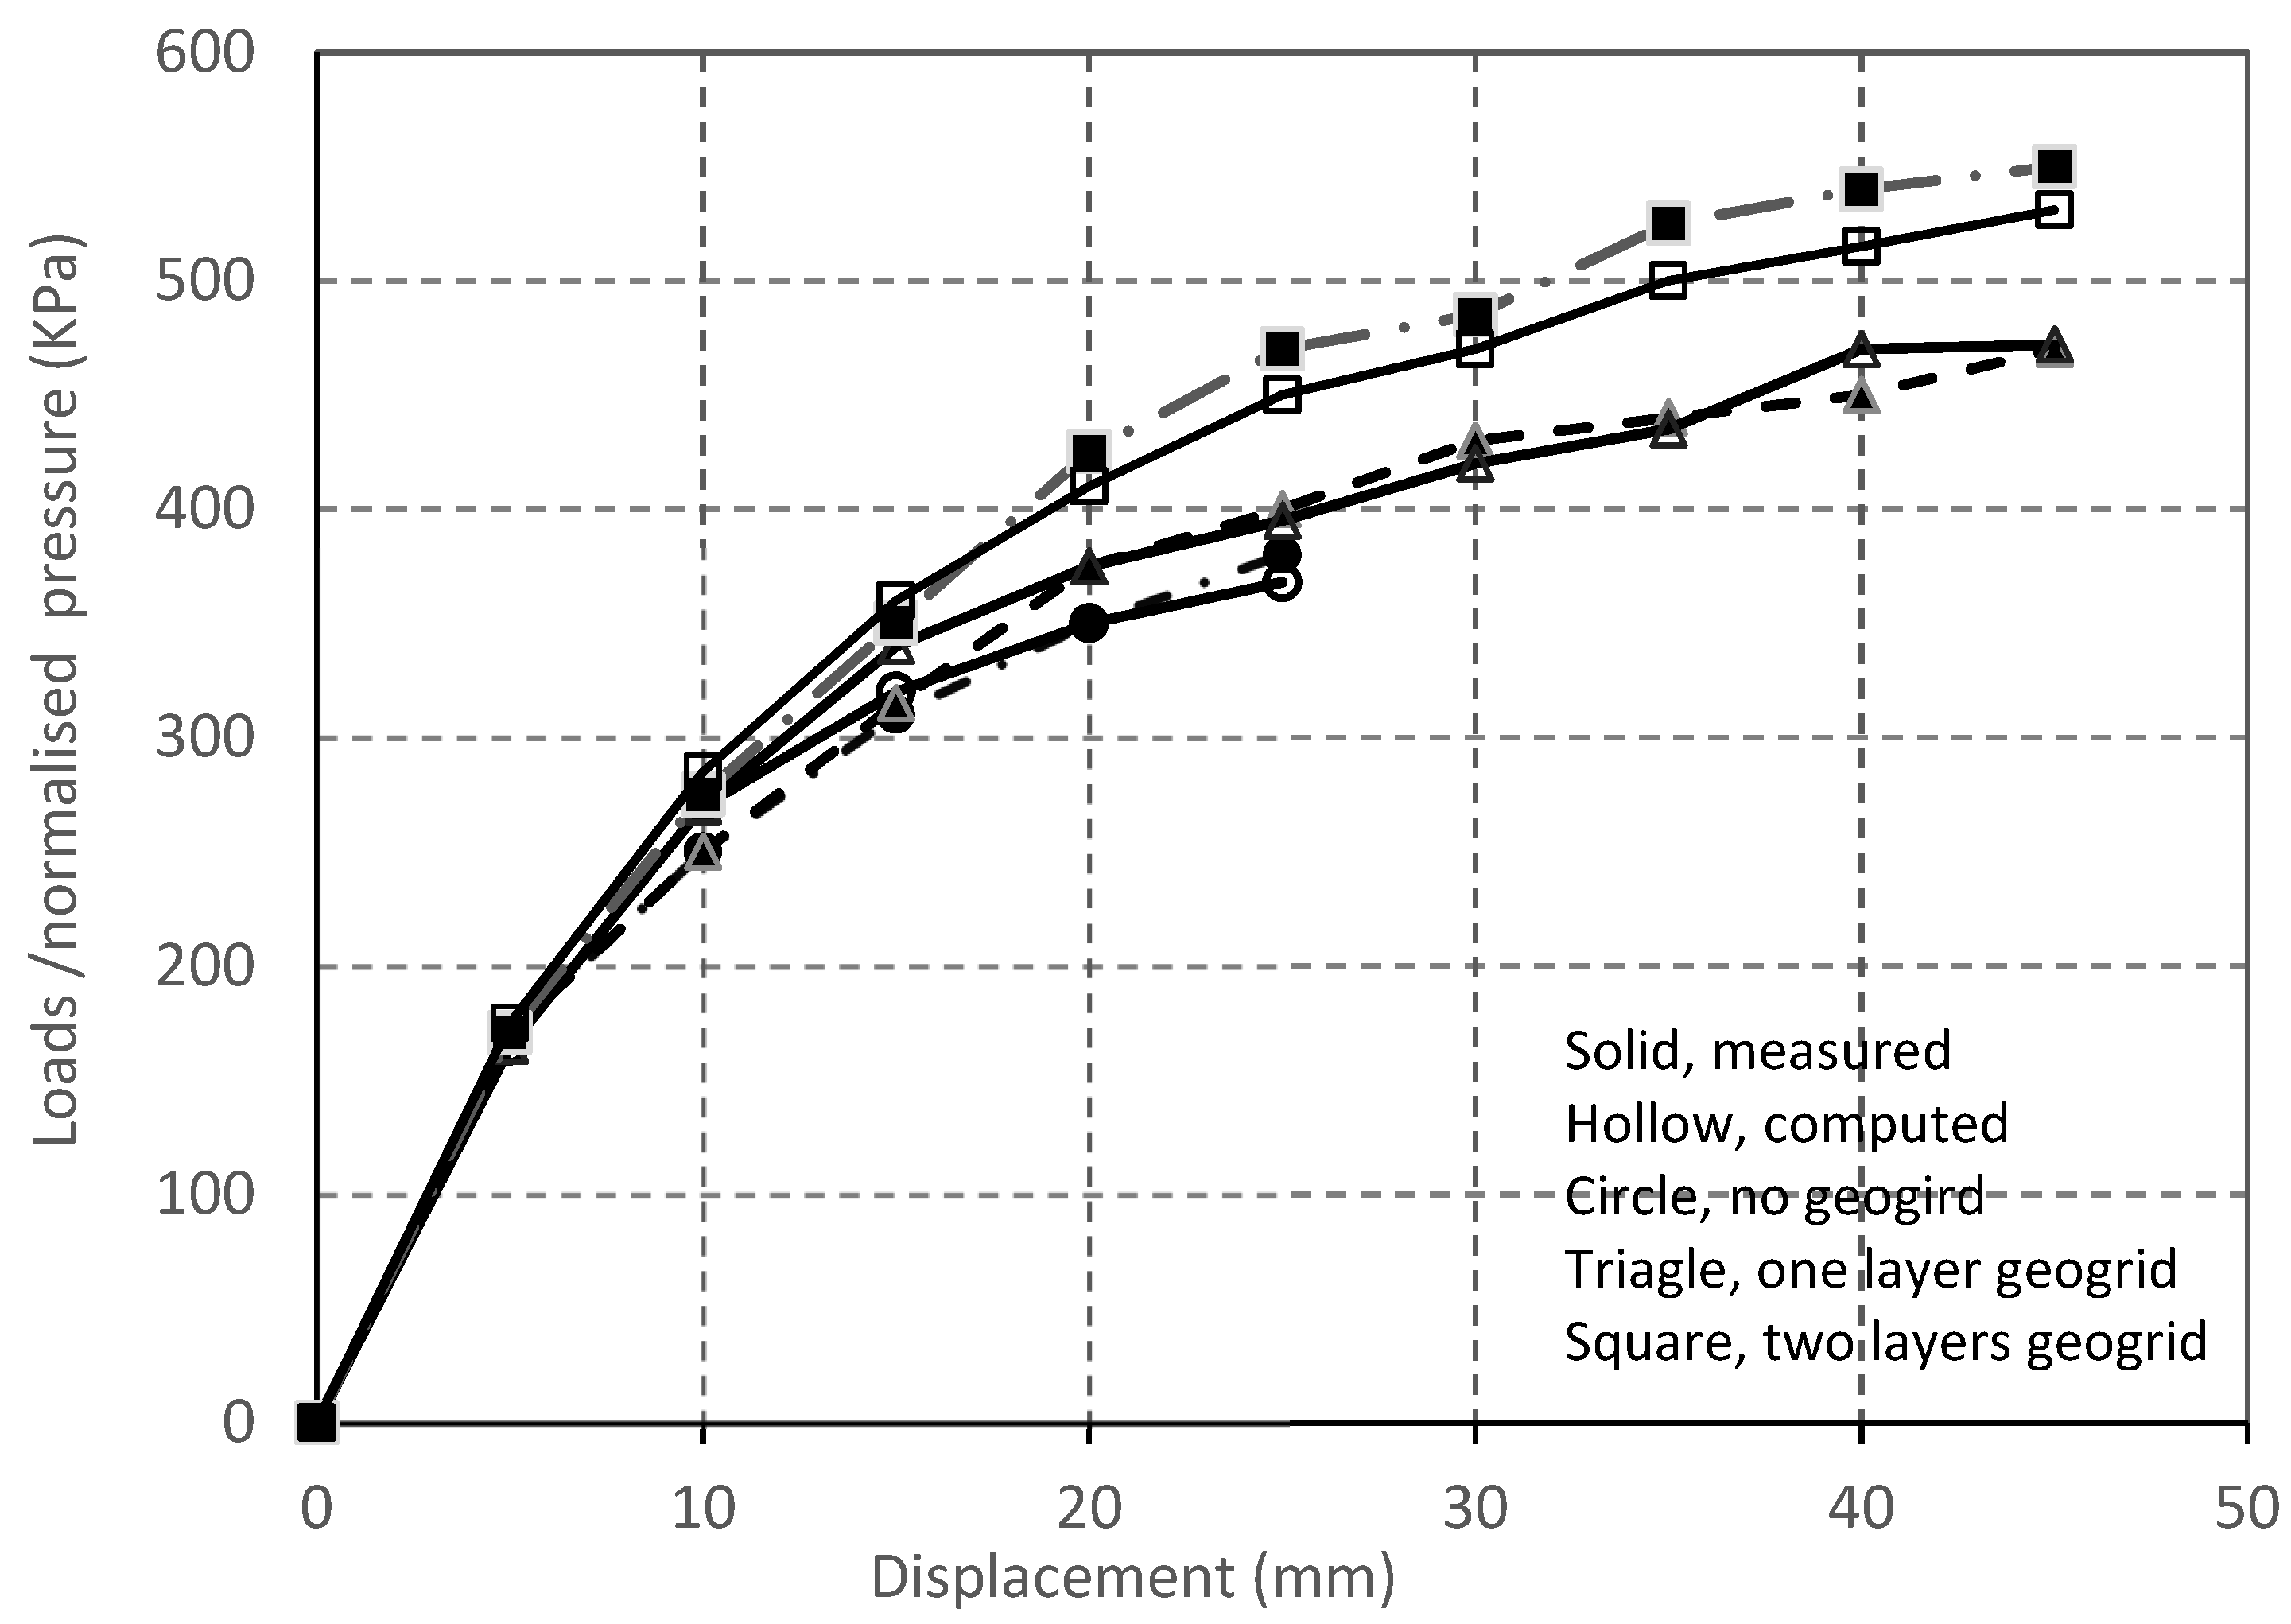
Load-settlement curve results were retrieved from various FLAC3D models and compared with the measurements results available in the literature [6]. The comparisons are shown in Figure 2, where FISH function was used to compute load as normalized average footing pressure [21]. As can be seen, they were in a good agreement. The load-settlement curves as calculated from FLAC3D models were thus validated and could be used to find the factors which most affect soil bearing capacity and settlement.
3. Factors Affecting the Bearing Capacity of Ring Footing on Sandy Sand
3.1. Effect of Ring Footing’s Diameter Ratio (n = Di/D)
To investigate the effect of the ring footing’s diameter ratio (n = Di/D) on its bearing capacity, models with various n values were created in FLAC3. Specifically, the n was taken as 0.1, 0.2, 0.3, 0.4, 0.5, 0.6, 0.7 or 0.8 in sequence. The same boundary conditions (see Figure 1) were adopted in the models, while some changes were made for simplicity: (1) The sand was treated a single sand phase, no geogrid layer was adopted, the load-settlement relationship (the hollow, square one) as shown in Figure 2 was selected to represent its property. (2) Loading was applied as a specific displacement of 25 mm.
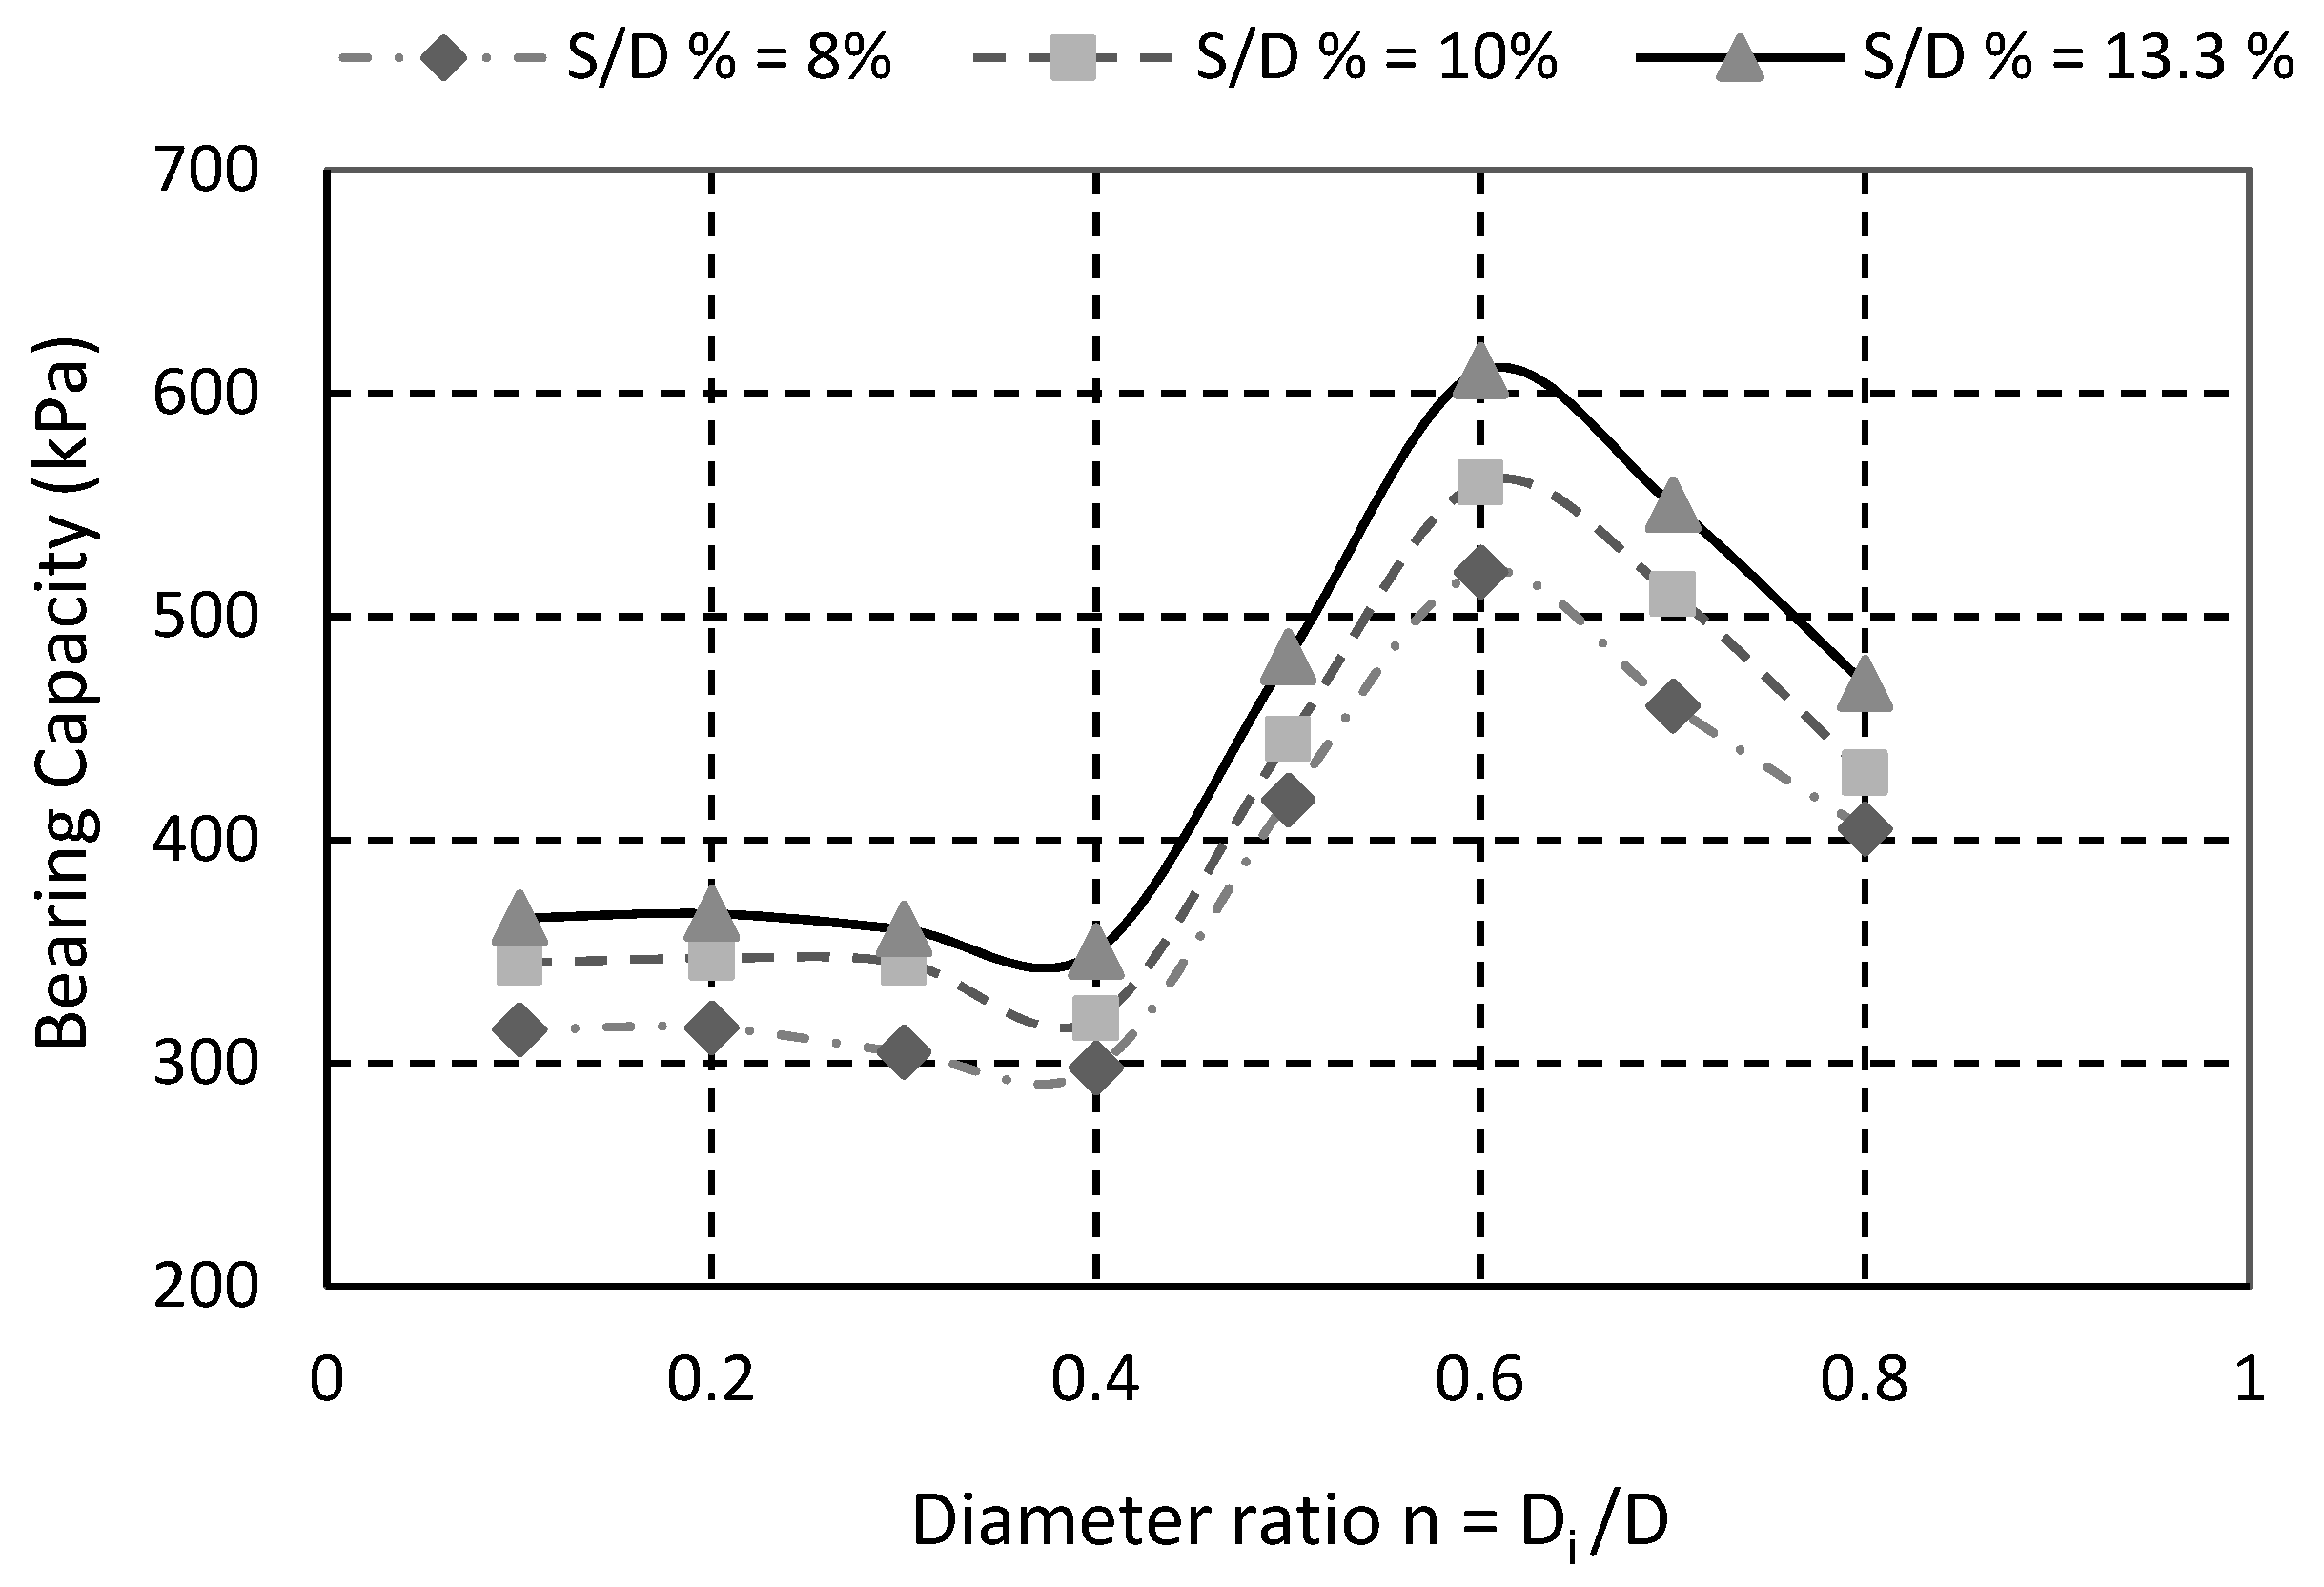
There are several methods available in the literature for determining the ultimate bearing capacity by its load–settlement curves if there is no certain peak, as shown in Figure 2. We used the allowed settlement method [17,18]. The ultimate bearing capacity was found at the points where settlement reaches a specific designated/allowable value (s). The settlements were chosen as 12, 15 and 20 mm in the present study. To eliminate the scale factor effect, a relative settlement (defined as ) was used. The three chosen settlements ratios were 8.0%, 10.0% and 13.3% in term of relative settlement. The ultimate bearing capacity could be identified for various ring footing diameter ratios under the same chosen relative settlements. The results are plotted in Figure 3.
Figure 3 shows that: (1) The three chosen ultimate bearing capacities remained low when the ring footing’s diameter ratio n varied from 0.1 to 0.4. (2) They all increased considerably when n reached 0.5. The maximum value of bearing capacity was found when n = 0.6: the bearing capacities for the three chosen relative settlements increased by 65%, 62% and 67% compared with the corresponding bearing capacities when ring footing’s diameter ratio n = 0.1, respectively. (3) After reaching maximum at n = 0.6, the bearing capacity started to decrease, but it maintained at a high value. The bearing capacities at n = 0.8 remained at the same level as those achieved at n = 0.5.
3.2. Intersection under Ring Footing: “Two Adjacent Footings”
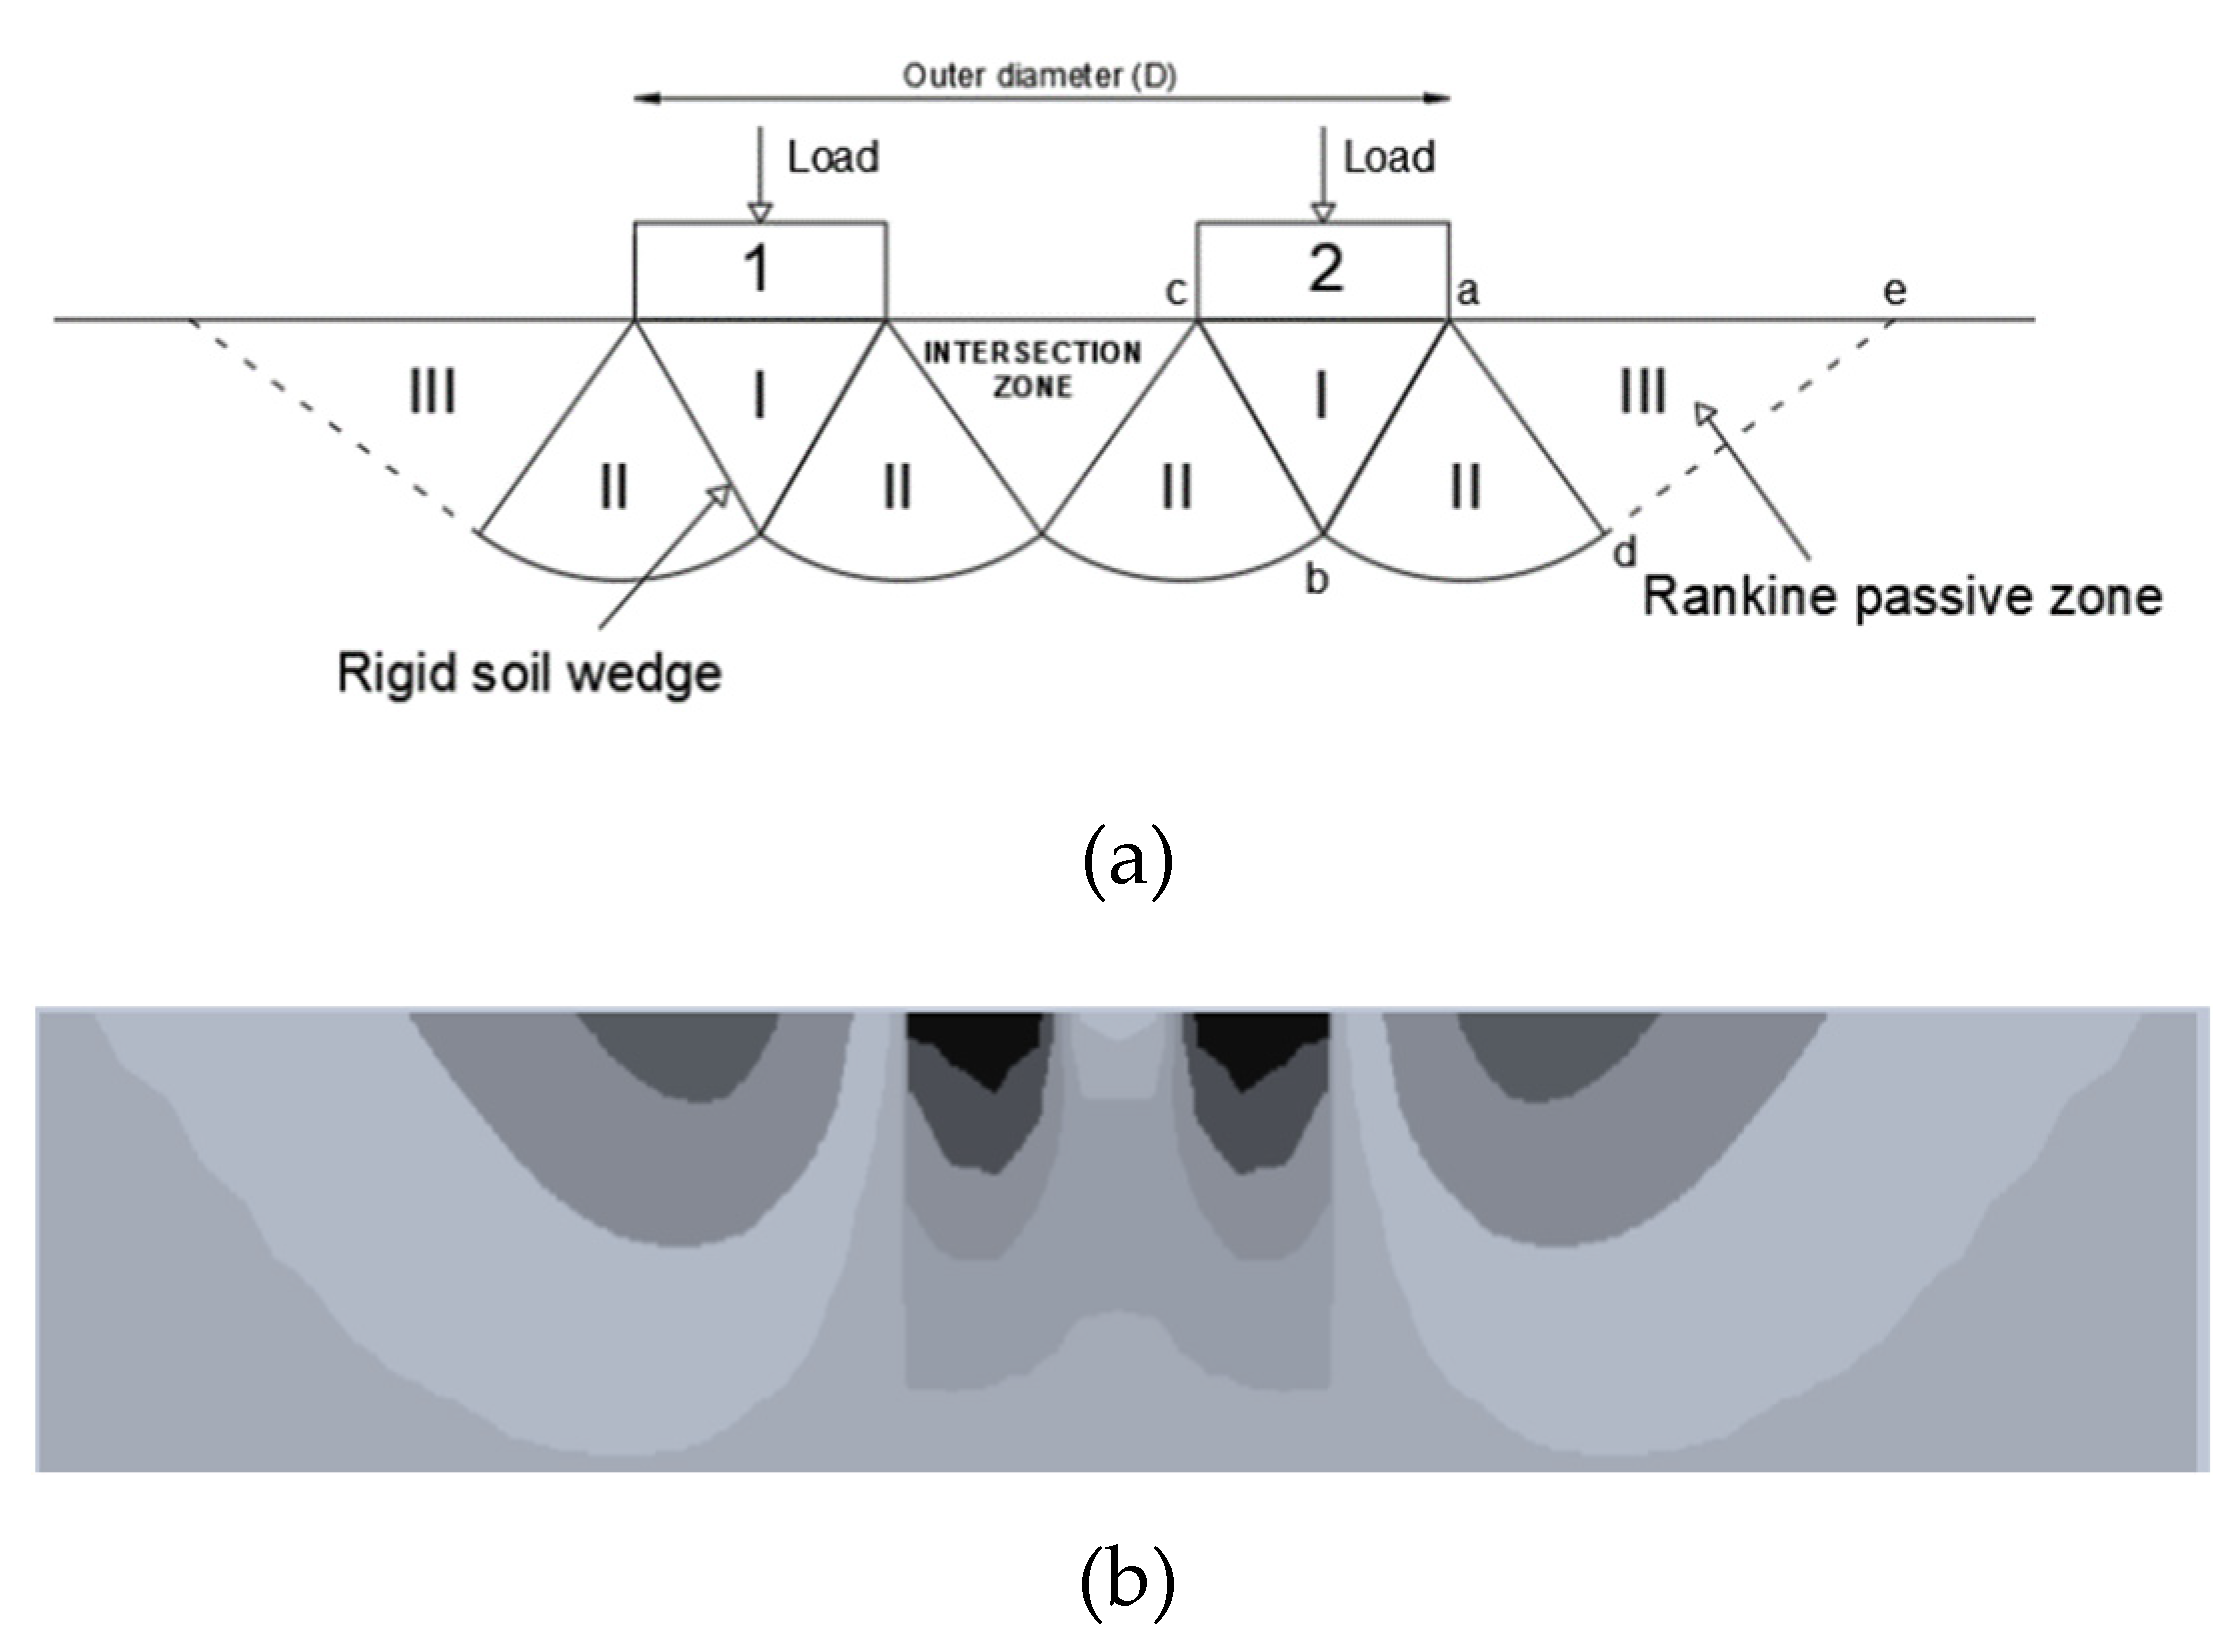
Upon external loading, the deformation of soil under a ring footing is proposed to have the profile as illustrated in Figure 4—similar to the results of two adjacent footings (Footings 1 and 2). As can be seen, soil at the far ends (outer side) of Footings 1 and 2 deformed in a conventional mechanism (i.e., Zones II and III would form but in a reduced size [22]), whereas the soil between inner side of ring would be pushed by soil of Zone I of Footings 1 and 2, forming an intersection zone where the soil would compress each other, causing stronger resistance than that as would be provided by Zones II and III. As a result, the overall bearing capacity of a ring footing is expected to vary with the ring footing’s diameter ratio and the span/distance of Footings 1 and 2.
When the ring footing’s diameter ratio n was low (n = 0.1–0.4), the size of intersection zone might still be limited, as would be its contribution to the bearing capacity, as shown in Figure 4a. When n was increased (n = 0.5–0.8), the intersection zone of soil grew, and its contribution to the bearing capacity became prominent (Figure 4b). One may expect, as n was further increased, the width (a–c) of Footings 1 and 2 became small enough to provoke local shear failure under ring footing (its overall bearing capacity reduces); punching failure would occur when ring footing becomes rather narrow (n closes to 1). This is worth examining further in future studies.
3.3. An Optimum Depth u to Set Geogrid Reinforcement
As shown in Figure 2, the application of geogrid layers increased the sand bearing capacity. The depth u to lay the geogrid reinforcement layer was set as 30 mm. To find the optimum depth of u, models were created to study the effect of the geogrid location u on soil bearing capacity.
First, a single-layer geogrid reinforcement was considered. The depth u was set to 10, 20, 30, 40, 50, 55, 60, 66, 70, 80, 90, 100 or 150 mm in turn.
The following parameters were assumed to be constant and implemented in models throughout: geogrid diameter = 1 m, ring footing n = 0.4, embedment depth Df = 0 and EA (axial stiffness for geogrid) = 28 kN/m.
The geometric parameters of the ring footing, one geogrid layer and the boundary conditions are the same as those shown in Figure 1 (Geogrid 2 was removed). Soil, geogrid and interface elements have the same properties as described in Section 2 (see Table 1 and Table 2). Loading as a specified displacement was set as 45 mm.
To investigate the influence of geogrid reinforcement on ultimate bearing capacity, a non-dimensional factor BCR is introduced. BCR is defined as the bearing capacity ratio between the footing ultimate bearing capacity with reinforcement (qur) and that without reinforcement (qu). BCR = qur/qu.
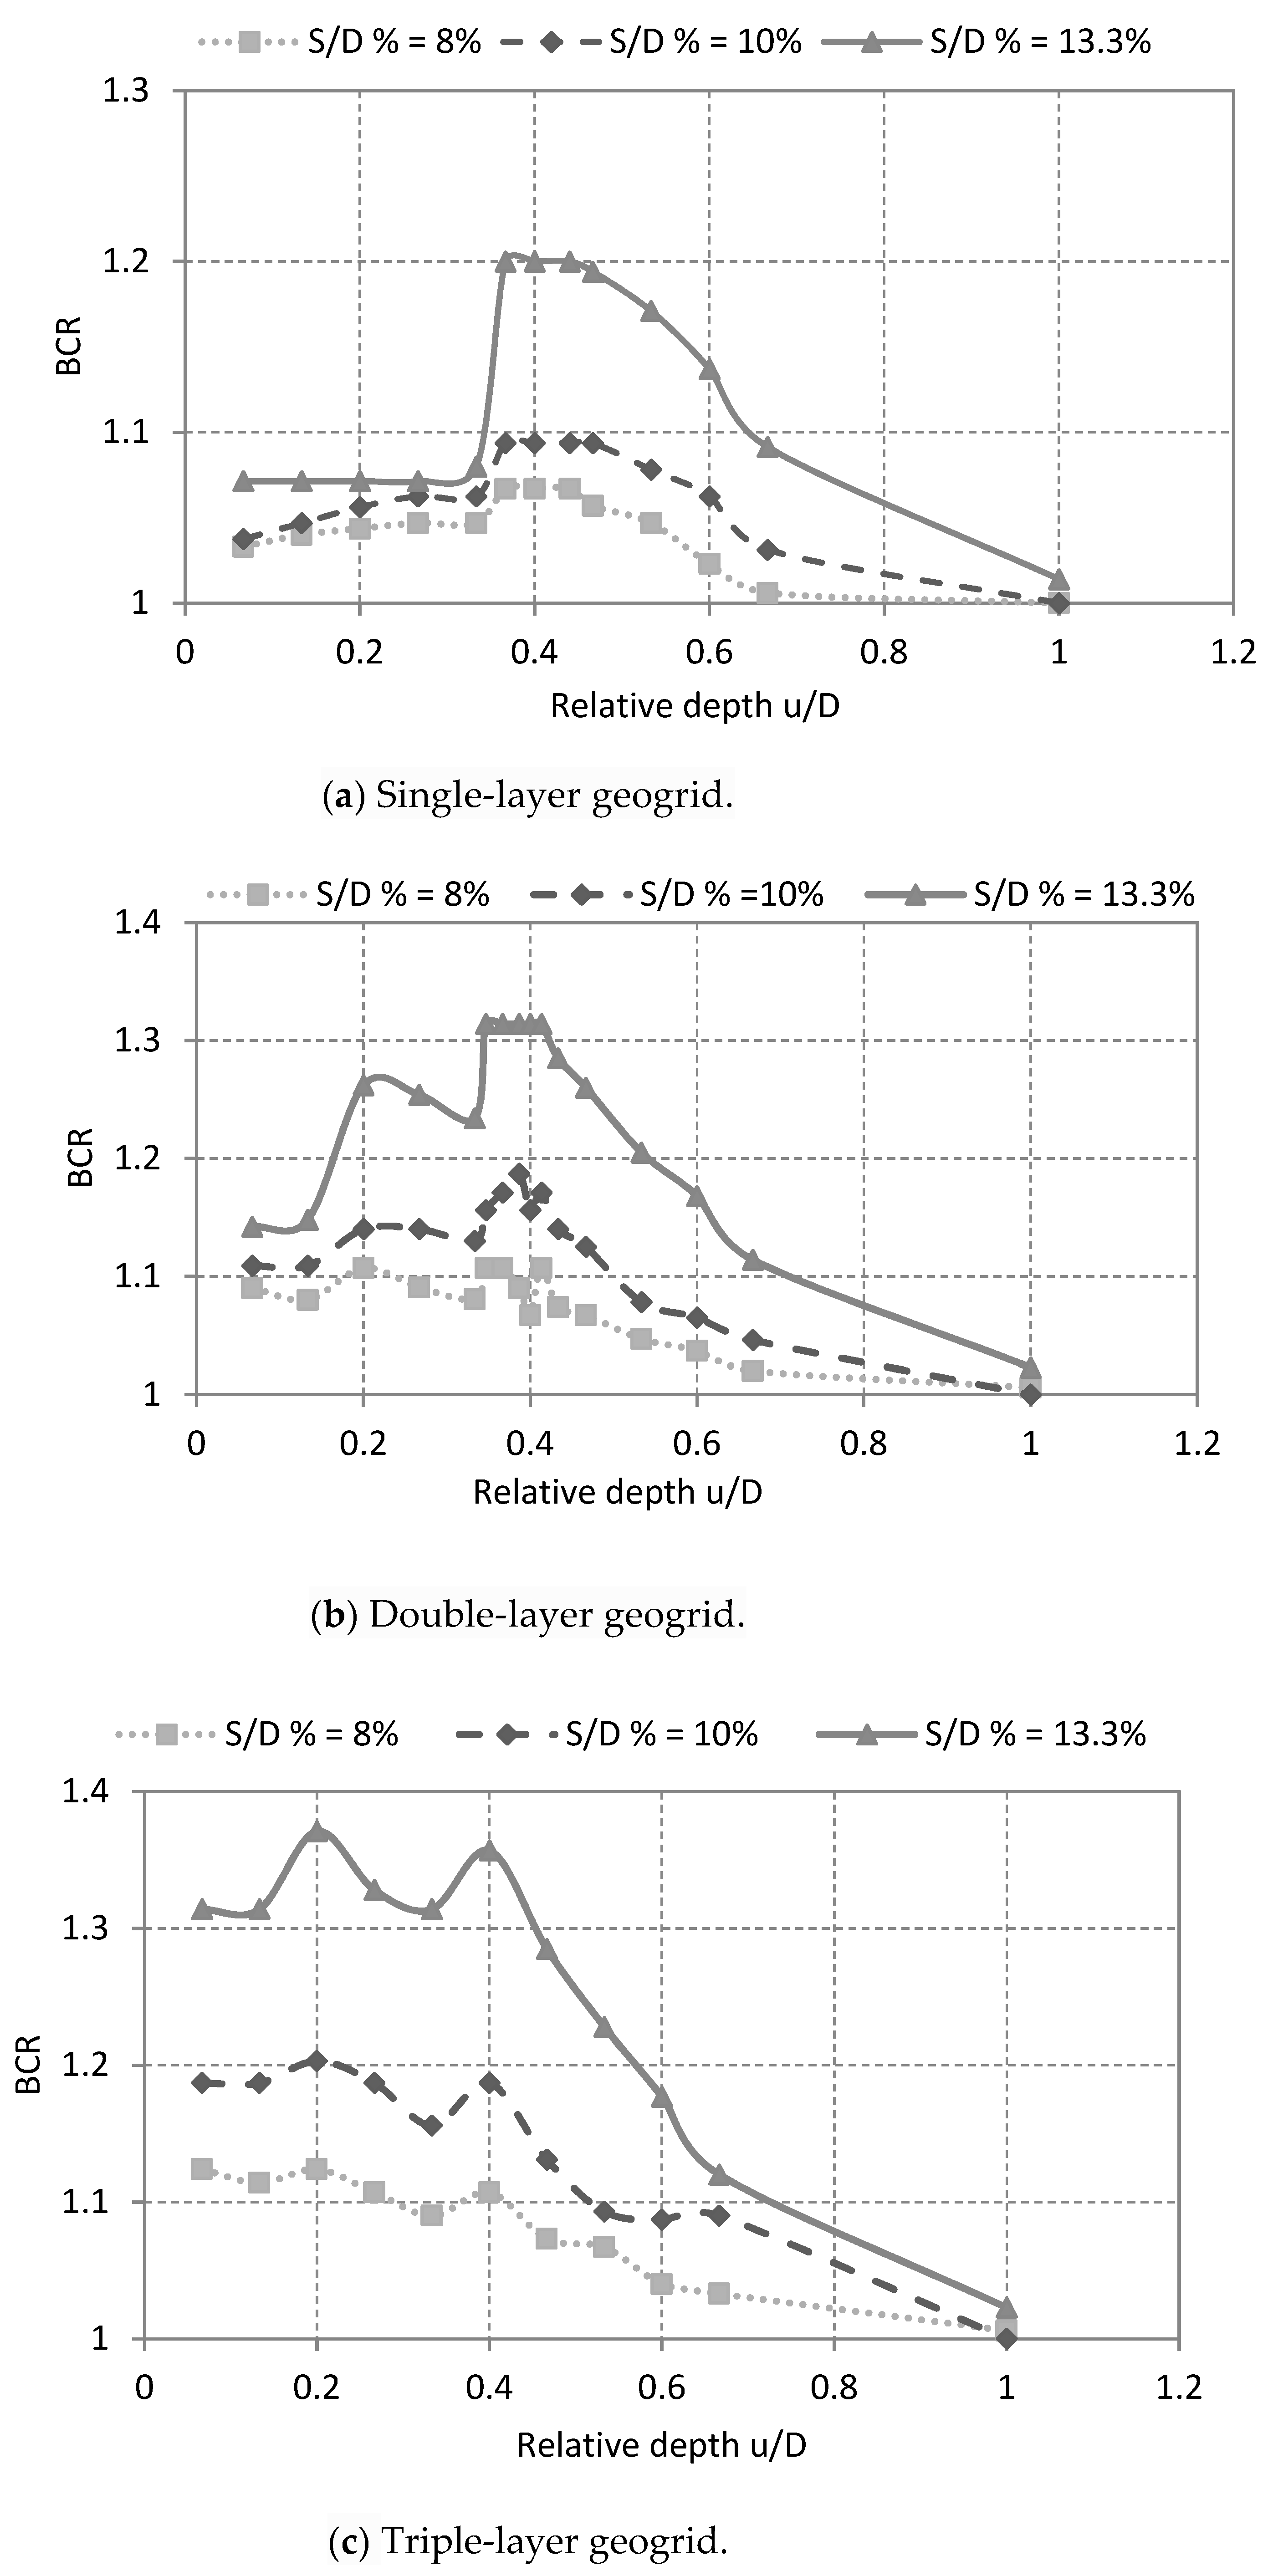
The method to calculate bearing capacity is the same as explained in Section 3.1 and Figure 3. The results are shown in Figure 5a in terms of the relationship between BCR and the relative depth .
Figure 5a shows that the bearing capacity changed as the depth u of geogrid reinforcement varied. As increased, the BCR gradually increased, with steep increases when was between 0.4 and 0.45. When the depth ratio was over 0.6 ( = 0.67), there was little contribution of geogrid reinforcement to BCR for the bearing capacity of a relative settlement s/D = 8%. The highest BCR was found to be near u/D = 0.4 for all three chosen relative settlement: the bearing capacity increased by about 7.5% at a relative settlement s/D = 8%, 9.5% at s/D = 10% and 20% at s/D = 13.3%. One may conclude that the optimal depth was between 0.4 and 0.45 when a single-layer geogrid reinforcement was used.
Various arrangements with double-, triple- and four-layer geogrid reinforcement were then tried. The vertical spacing h between the geogrid layers was set as 30 mm for all three arrangements. Depth u of the top geogrid layer varied in the same way from 10 to 150 mm.
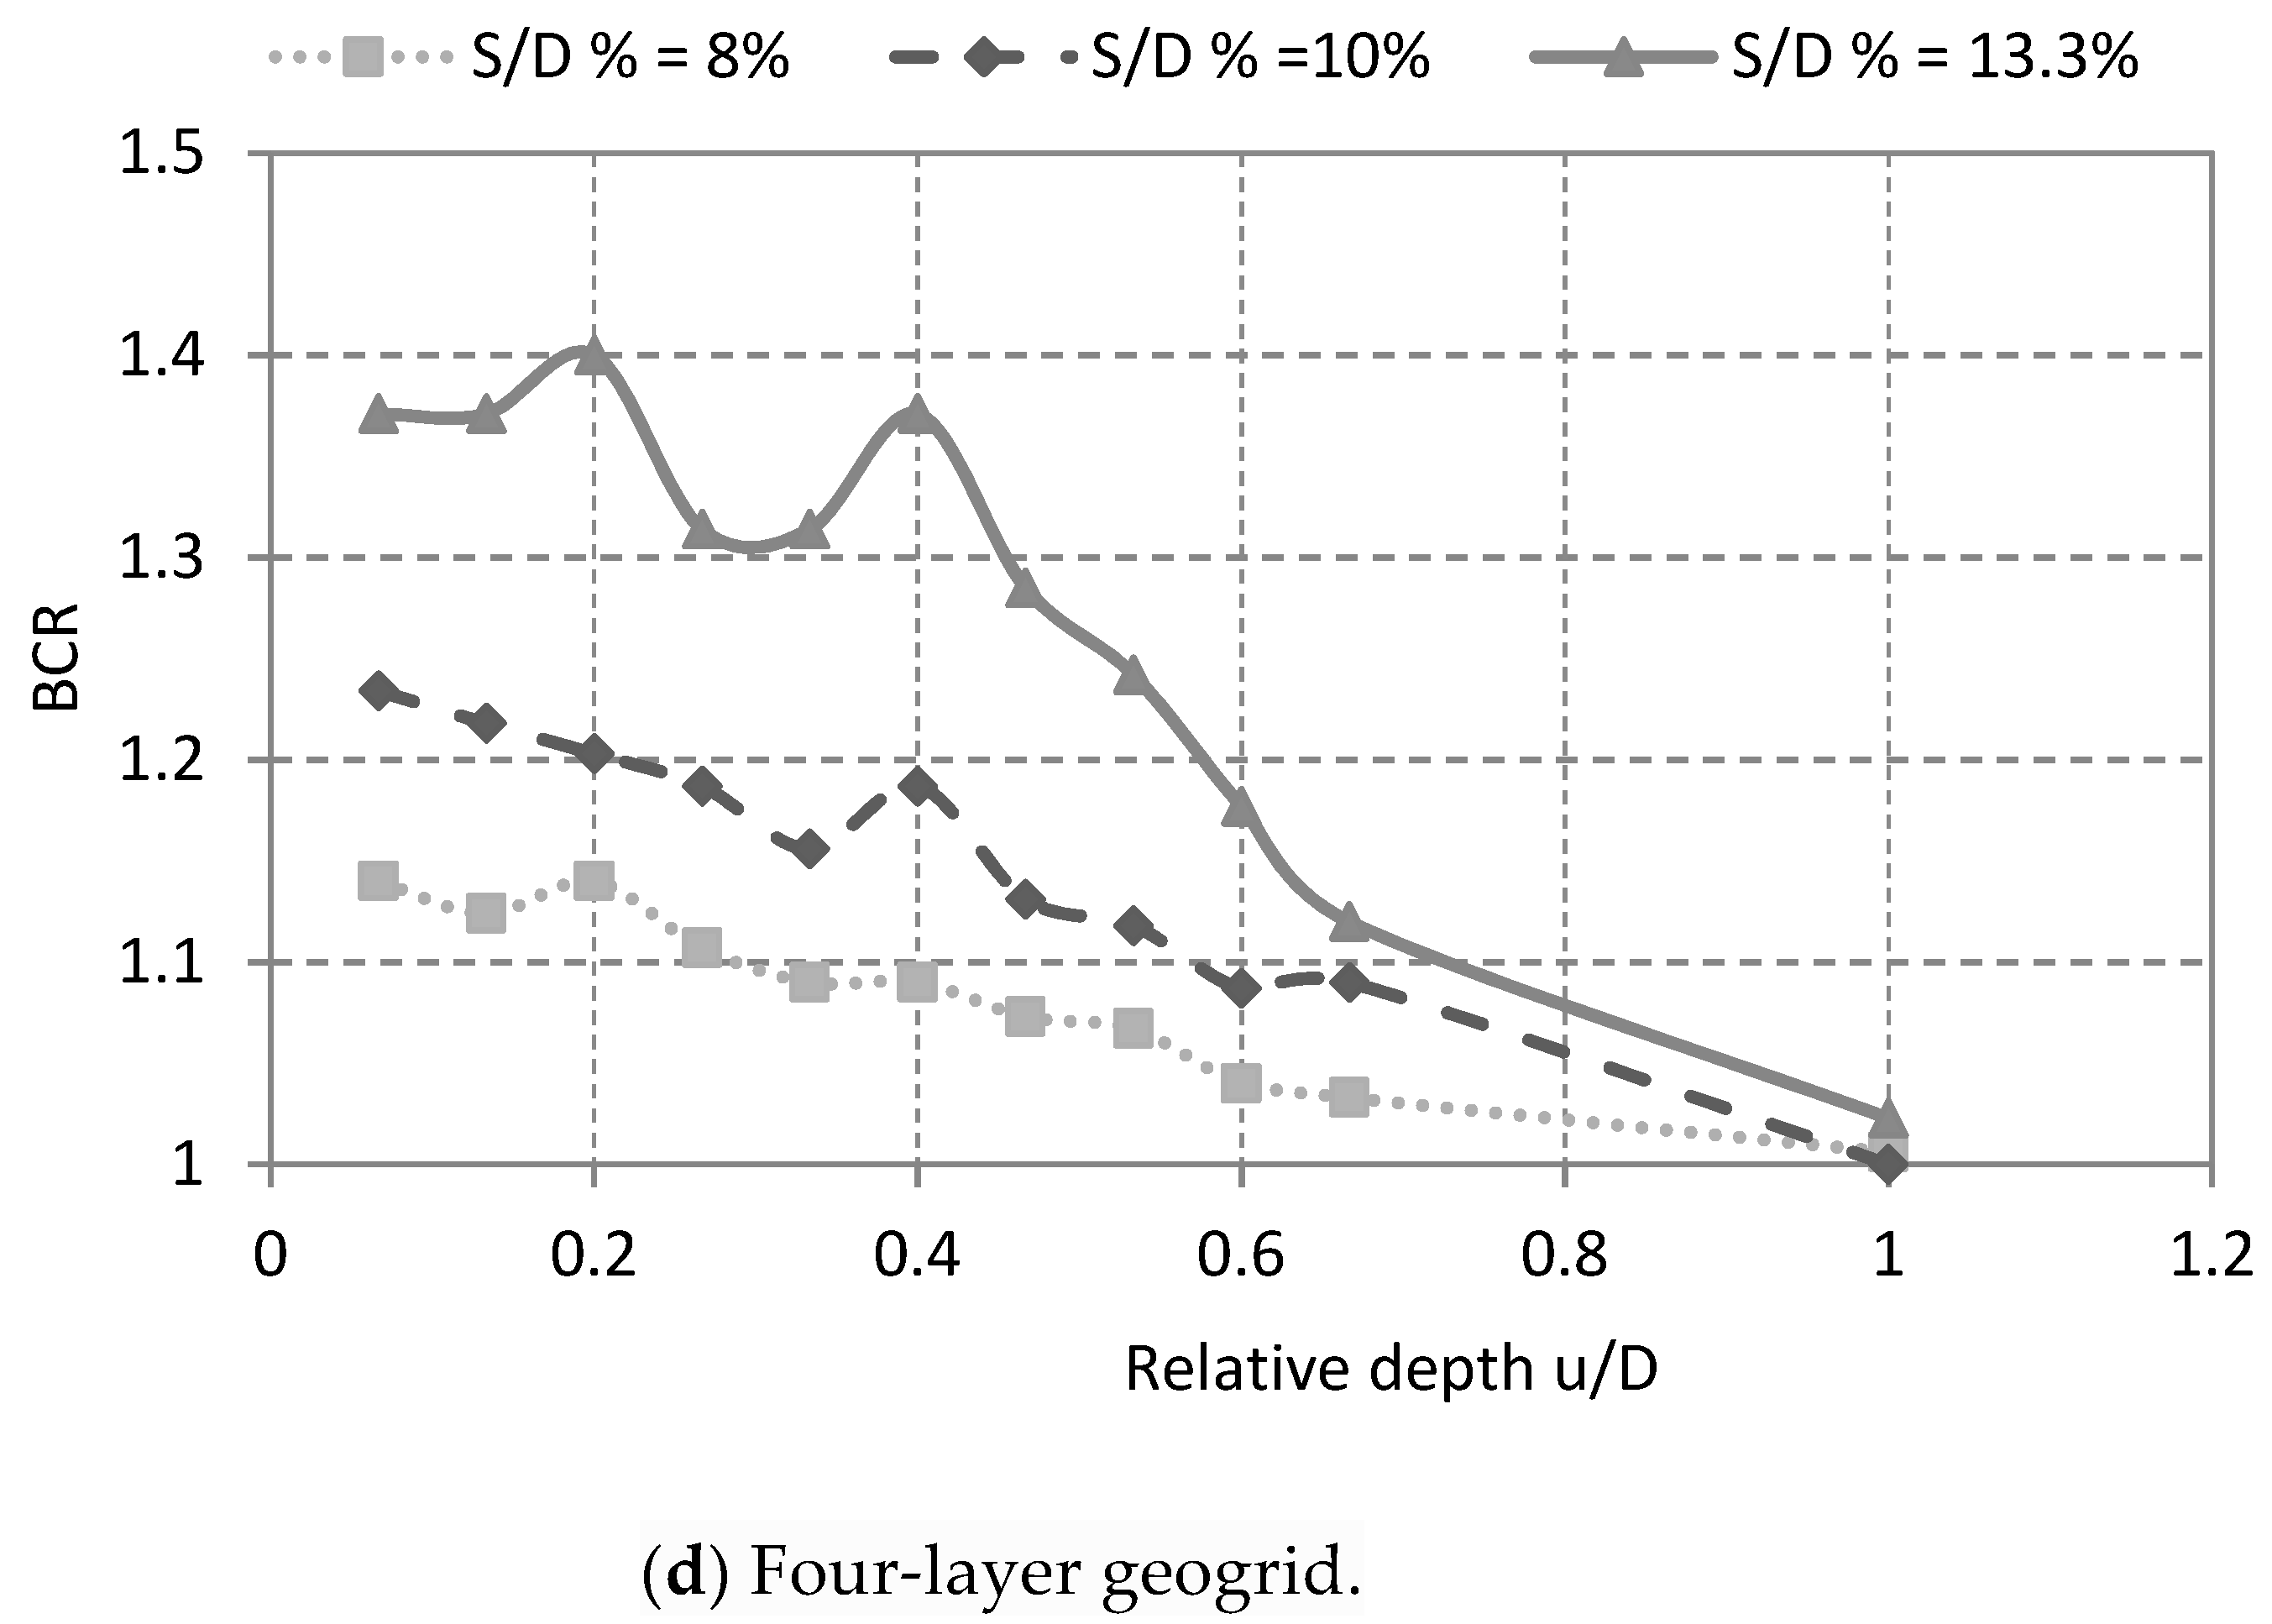
Models were modified to study the effect of the geogrid location u on soil bearing capacity. The results of BCR against are given in Figure 5b–d.
Figure 5b shows that BCR changed as the depth of the double-layer geogrid reinforcement varied: contrasted with results of single-layer geogrid reinforcement (see Figure 5a), the double-layer geogrid reinforcement contributed to an increase of BCR even when it was shallow (u/D = 0.1). The BCR continued to increase when it was moved deeper and reached maximum at u/D = 0.4. A similar trend as in the single-layer geogrid case could be seen thereafter. The highest BCR was found at u/D = 0.4 for all three chosen relative settlements: the bearing capacity increased by about 10% at s/D = 8.0% and about 18% at s/D = 10.0%. The bearing capacity for s/D = 13.3% increased about 26% at a depth u/D = 0.2 and about 32% at u/D = 0.4. One may conclude that the optimal position for this double-layer geogrid reinforcement is at a depth around 0.4. Compared with increases under single-layer geogrid reinforcement, double-layer geogrid reinforcement (settled at a depth u/D = 0.4) might further increase the bearing capacity of soil—for example, the bearing capacity for a relative settlement s/D = 13.3% further increased by 12%.
Figure 5c shows that the bearing capacity changed as the depth of the triple-layer geogrid reinforcement got deeper. As increased, the BCR increased up to . There was then a slight decrease of BCR between . BCR reached a new high value at . When the depth ratio was over = 0.8, there was little contribution of geogrid reinforcement to BCR for the bearing capacity of a relative settlement s/D = 8%. However, the highest BCR was found to be near u/D = 0.2 for all three chosen relative settlements: the bearing capacity increased by about 13.0% for a relative settlement s/D = 8.0%, about 20% for a relative settlement s/D = 10.0% and about 37% for a relative settlement s/D = 13.3%. To obtain the highest BCR, the triple-layer geogrid should be settled at a depth ratio between 0.2 and 0.4. For a relative settlement s/D = 13.3%, the bearing capacity increased by 5% compared with the maximum bearing capacity achieved for the double-layer geogrid.
As shown in Figure 5d, the bearing capacity changed as the depth of the four-layer geogrid reinforcement varied. Regarding the relative settlement s/D = 8%, there was one maximum value at = 0.2, an increase by about 15%. This capacity for a relative settlement s/D = 10% increased by about 22% at = 0.2. The bearing capacity for a relative settlement s/D = 13.3% reached two maximum values at = 0.2 and 0.4, where BCR increased by 40% and 37%, respectively. To obtain the highest BCR, the four-layer geogrid reinforcement should be laid at a depth = 0.2. For a relative settlement s/D = 13.3%, the bearing capacity increased by a further 3% compared with the maximum bearing capacity that was obtained for the triple-layer geogrid reinforcement.
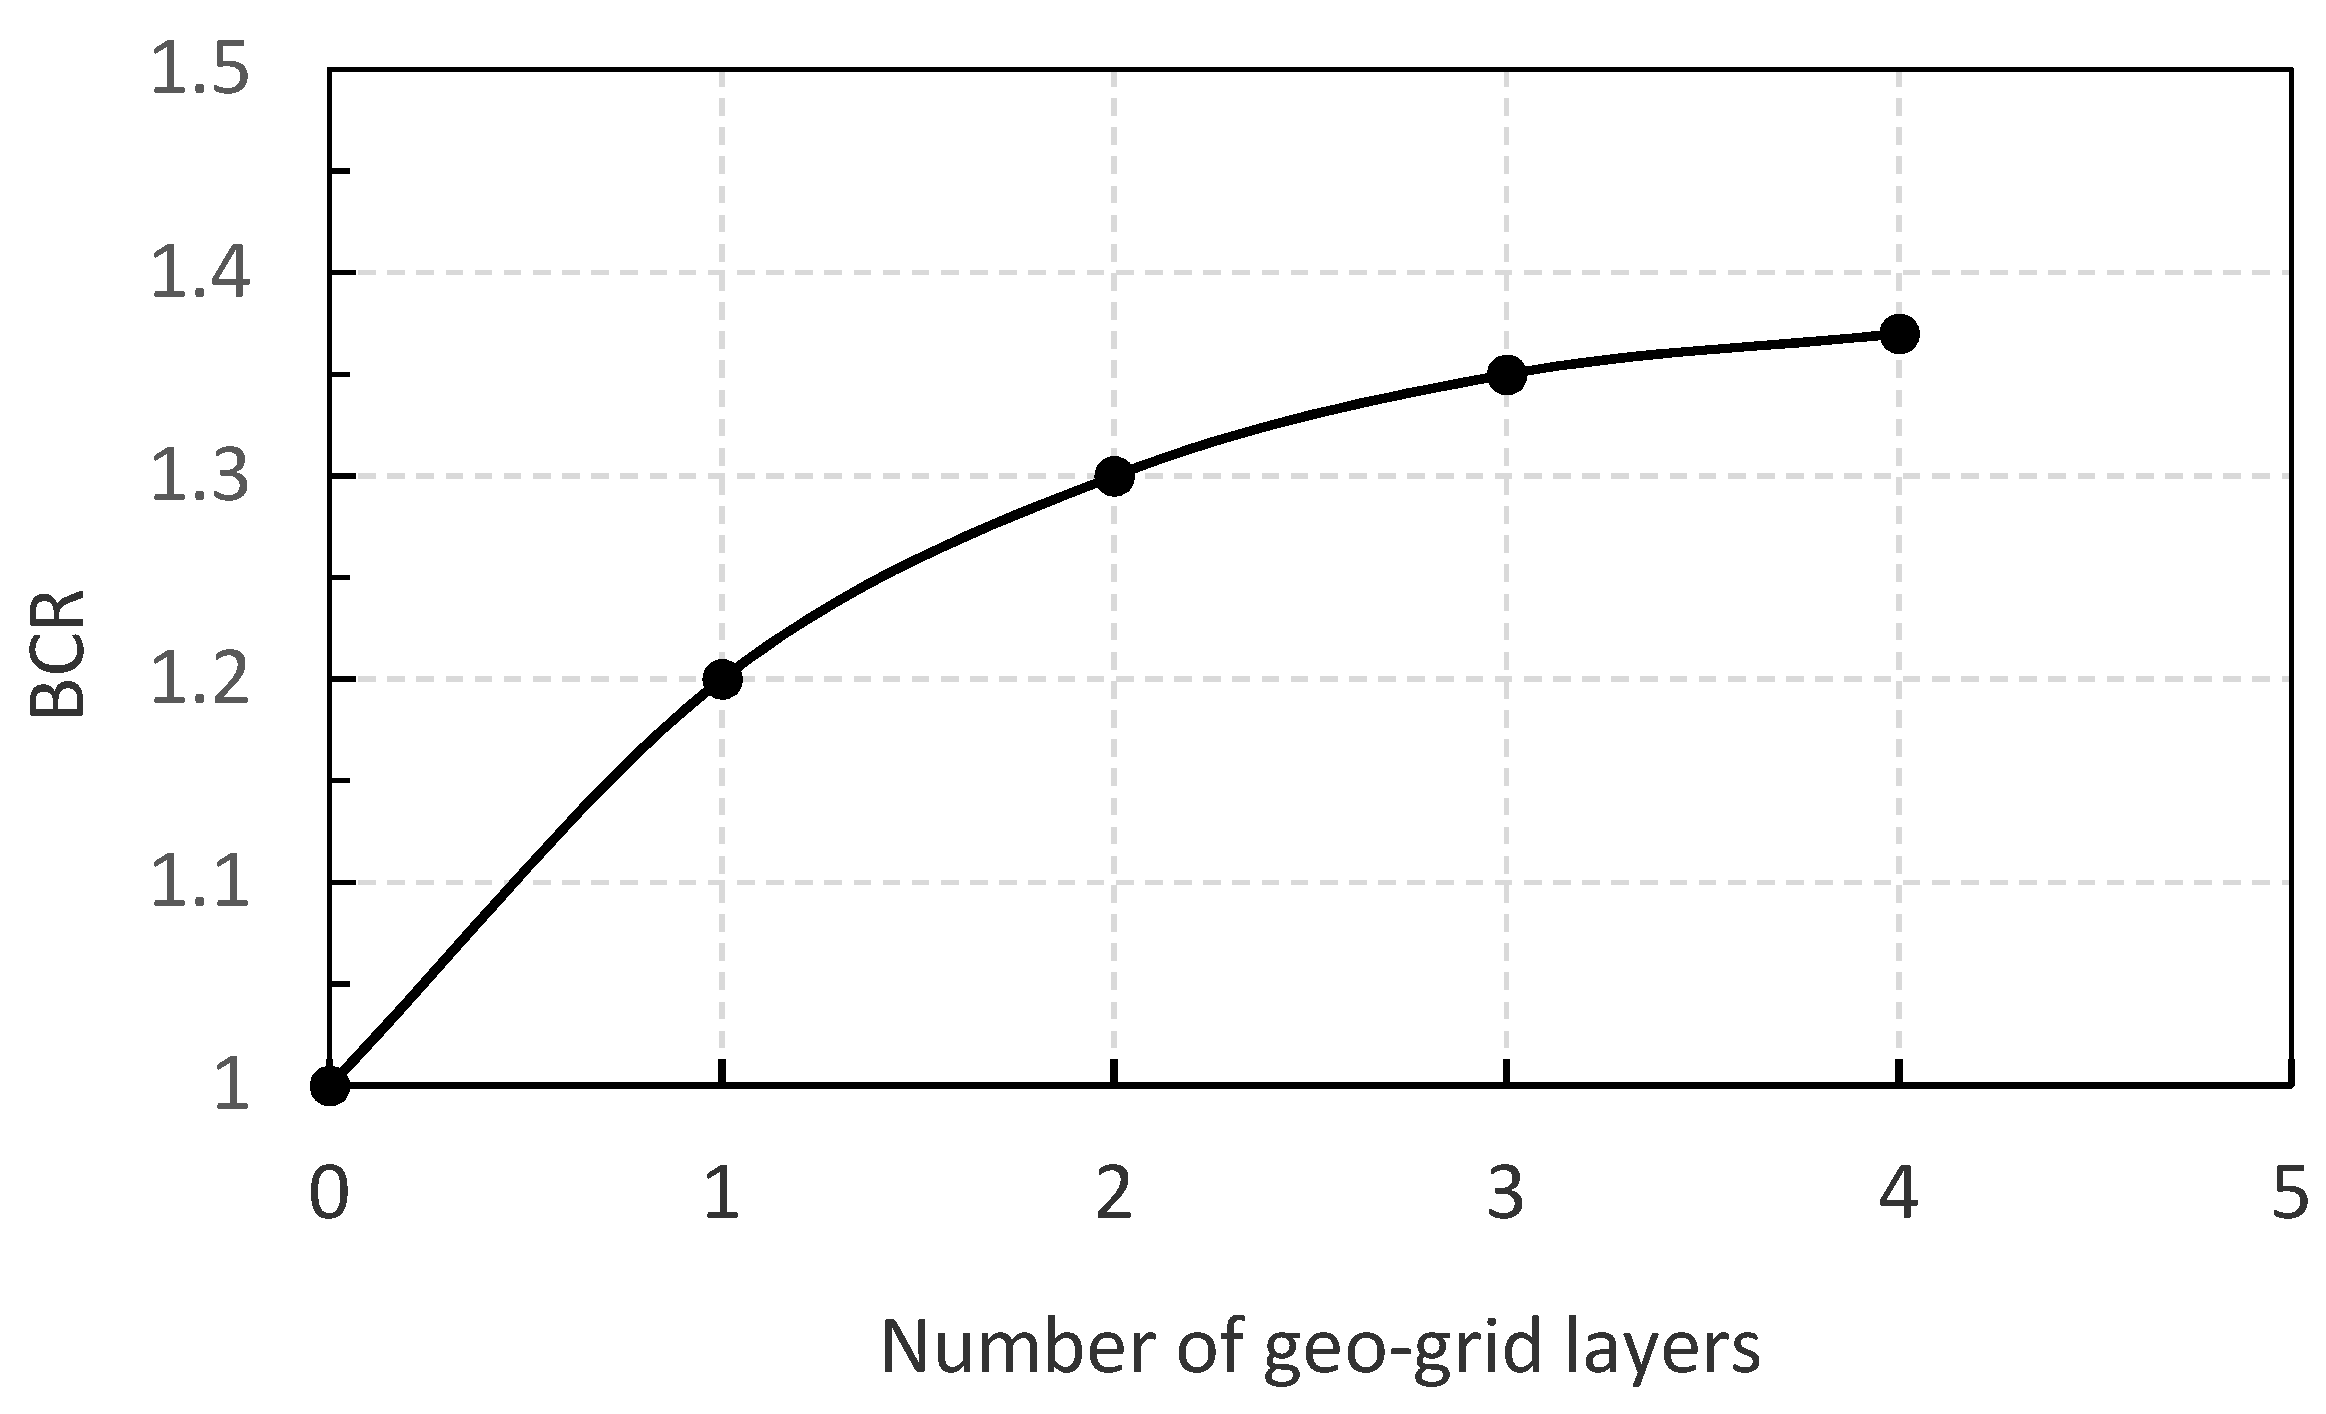
The increase of the BCR (for a relative settlement s/D = 13.3%, n = 0.4) is shown in Figure 6 when the geogrid is increased from one to four layers. One may notice that the increases were rather limited when the triple- or four-layer geogrid reinforcement was implemented. A double-layer geogrid reinforcement is recommended, to be set at a depth u/D between 0.34 and 0.41.
To achieve the optimum BCR, the top layer of the geogrid reinforcement should be set at a depth u/D between 0.36 and 0.44 when a single-layer geogrid is used. The depth u/D should be 0.36–0.44 for a double-layer geogrid, 0.26 for a triple-layer geogrid, and 0.2 for a four-layer geogrid. These results are summarized in Table 3.
3.4. The Vertical Spacing between the Geogrid Layers
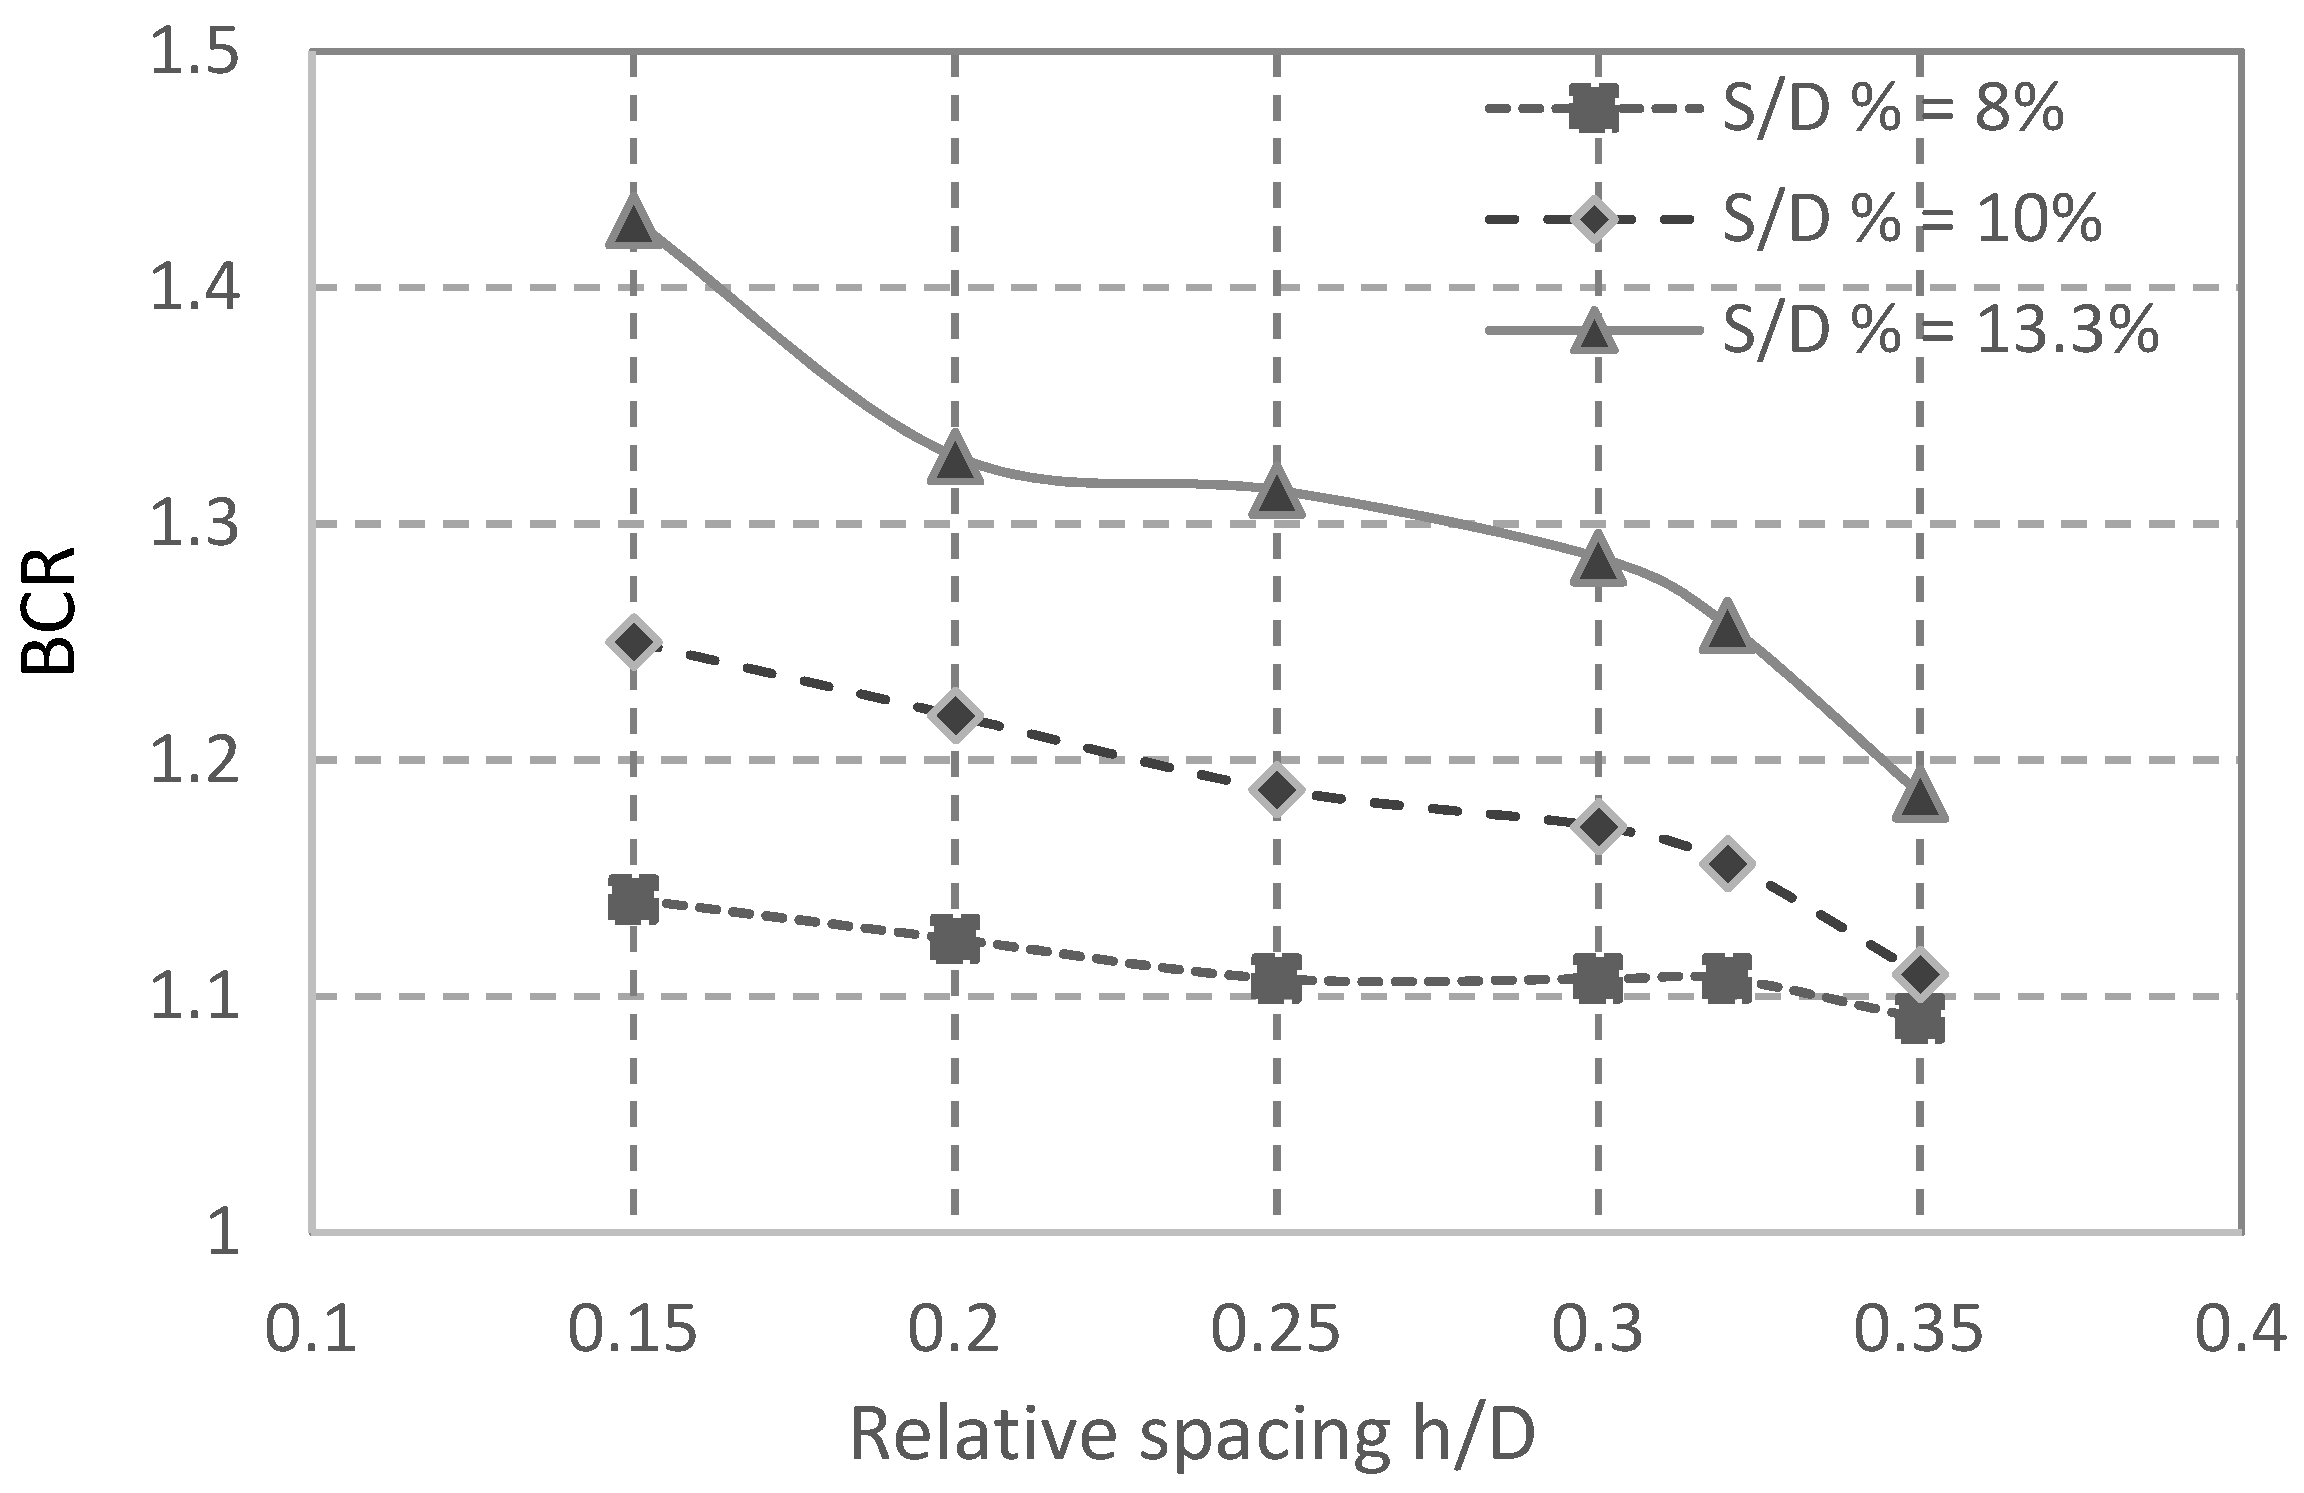
Models were modified to investigate the effect of the spacing between the geogrid layers (h) on the soil bearing capacity. A four-layer geogrid was implemented in those models for such purpose: the top layer was set at a depth of 30 mm from the sand surface, while the spacings between the layers was set to be an equal h, varying in sequence as 22.5, 30, 37.5, 45.0, 48.0, 52.5 or 67.5 mm. The results are shown in Figure 7 in terms of the relationship between BCR and the relative spacing between geogrid layer
Figure 7 shows that BCR decreased as the distance between the reinforcing layers increased. The bearing capacity for a relative settlement s/D = 8% increased by about 15% when the spacing ratio was 0.15 (. The capacity for a relative settlement s/D = 10% increased about 25%. The bearing capacity for a relative settlement s/D = 13.3% increased most, about 43%. However, there were no peaks for all three chosen relative settlement curves, indicating that there is potential to increase BCR by further reducing the spacings between the geogrid layers.
This decrease in BCR as the spacing between layers increased is due to the height of the collapse prism, i.e., an increase in the spacing between the layers leads the layers to be out of the effective zone of footing. As a result, the contribution of the geogrid layers to the bearing capacity is reduced.
4. Conclusions
Models were created with FLAC3D to investigate the bearing capacity of a ring footing resting on geogrid reinforced sand. The investigation of the effect of ring footing’s inner Di/outer diameter D ratio n (n = Di/D) on its bearing capacity found that this ratio should be set between 0.5 and 0.7. With an optimal value n = 0.6, bearing capacities of a ring footing could increase by 65%, 62% and 67% for the three designated relative settlement states compared with those at n = 0.1. It is proposed that the soil on the inner side of the ring forms an intersection compression zone, contributing to greater resistance of the soil.
Models modified to study the optimum position to lay the geogrid reinforcement found that, when a single- layer geogrid was used, it should be set at a depth u between 0.4 and 0.45 relative to ring footing outer diameter D (u/D = 0.4–0.5). The bearing capacity could be expected to increase up to 20% at an allowable relative settlement s (s/D = 13.3%). A similar contribution was also found if a double-layer geogrid was used; the bearing capacity may increase by another 10%. However, such increase was rather limited when a triple- or four-layer geogrid was used. A double-layer geogrid was recommended to increase bearing capacity of a ring footing. An optimum position to lay this double-layer geogrid was in a depth u between 0.34 and 0.41 relative to the ring footing outer diameter D, i.e., u/D = 0.34–0.41.
Using a more advanced constitutive model, further numerical examinations (along with experimental verification) are worthwhile to investigate the intersection’s stress-strain profile under ring footing, to find the optimal spacing h of the double-layer geogrid, to address the interaction mechanism between the geogrid and sand, etc.
Author Contributions
Conceptualization, H.H., I.S. and S.D.; methodology, H.H. and I.S.; software, H.H. and I.S.; analysis, investigation, H.H., S.D.; data curation, H.H. and I.S.; writing—original draft preparation, H.H. and S.D.; writing—review and editing, S.D.; supervision, I.S. and S.D. All authors have read and agreed to the published version of the manuscript.
Funding
This research received no external funding.
Institutional Review Board Statement
Not applicable.
Informed Consent Statement
Not applicable.
Data Availability Statement
The data presented in this study are available on request from the corresponding author.
Conflicts of Interest
The authors declare no conflict of interest.
Abbreviations
| BCR | Bearing capacity ratio, qu/qur |
| C | Soil cohesion (kPa) |
| d | Effective depth of reinforcement (mm) |
| Internal diameter of the ring footing (mm) | |
| D | External diameter of the ring footing (mm) |
| Df | Depth of footing base below the ground surface (mm) |
| u | Vertical distance between the first reinforcement layer and footing base (mm). |
| h | Vertical distance between reinforcement layers (mm) |
| N | Number of reinforcement layers |
| The ultimate bearing capacity with reinforcement (kPa) | |
| The ultimate bearing capacity without reinforcement (kPa) | |
| K | Bulk modulus (kPa) |
| G | Shear modulus (kPa) |
| Friction angle (degrees) | |
| Dilation angle (degrees) | |
| E | Elasticity modulus (kPa) |
| ν | Poisson ratio |
| Kn | Normal stiffness (kN/m) |
| Ks | Shear stiffness (kN/m) |
| n | Ring footings’ inner/outer diameter ratio (Di/D) |
| S | Settlement (mm) |
References
- Vidal, H. Reinforced Earth; Annles Inst. Tech. du Batiment et des Travaux Publiques: Paris, France, 1963; pp. 888–938. (In French) [Google Scholar]
- Vlcek, J. Internal Stability Analyses of Geosynthetic Reinforced Retaining Walls. Procedia Eng. 2014, 91, 346–351. [Google Scholar] [CrossRef] [Green Version]
- Farsakh, M.; Chen, Q.; Sharma, R. An experimental evaluation of the behavior of footings on geosynthetic-reinforced sand. Soils Found. 2013, 53, 335–348. [Google Scholar] [CrossRef] [Green Version]
- Burd, H.J.; Frydman, S. Bearing capacity of plane-strain footings on layered soils. Can. Geotech. J. 1997, 34, 241–253. [Google Scholar] [CrossRef]
- Choobbasti, A.; Najafi, A.; Pirzadeh, S.; Farrokhzad, F.; Zahmatkesh, A. Numerical evaluation of bearing capacity and settlement of ring footing; case study of Kazeroon cooling towers. Int. J. Res. Rev. Appl. Sci. 2010, 4, 263. [Google Scholar]
- Boushehrian, J.H.; Hataf, N. Experimental and numerical investigation of the bearing capacity of model circular and ring footings on reinforced sand. Geotextile Geomembr. 2003, 21, 241–256. [Google Scholar] [CrossRef]
- Keshavarz, A.; Kumar, J. Bearing capacity computation for a ring foundation using the stress characteristics method. Comput. Geotech. 2017, 89, 33–42. [Google Scholar] [CrossRef]
- Budania, R.; Arora, R.P.; Singhvi, B.S.; Veerwal, H.K. Experimental study of rectangular footing resting over geogrid reinforced sand. Int. J. Adv. Eng. Res. 2017, 4, 292–299. [Google Scholar]
- Sharma, V.; Kumar, A. Behavior of Ring Footing Resting on Reinforced Sand Subjected to Eccentric-Inclined Loading. J. Rock Mech. Geotech. Eng. 2018, 10, 347–357. [Google Scholar] [CrossRef]
- Sharma, V.; Kumar, A. Strength and Bearing Capacity of Ring Footings Resting on Fibre-Reinforced Sand. Int. J. Geosynth. Ground Eng. 2017, 3, 9. [Google Scholar] [CrossRef]
- Sharma, V.; Kumar, A. Numerical study of ring and circular foundations resting on fibre-reinforced soil. Int. J. Geotech. Eng. 2019, 1–13. [Google Scholar] [CrossRef]
- Fattah, M.Y.; Al-Neami, M.A.; Mohammed, S.A. Load Carrying Capacity of Ring Footing on Geocell Reinforced Sandy Soil. Glob. J. Eng. Sci. Res. Manag. 2018, 5, 32–42. [Google Scholar]
- Hataf, N.; Razavi, M. Model tests and finite element analysis of bearing capacity of ring footings on loose sand. Iran. J. Sci. Technol. Trans. B-Eng. 2003, V 27. [Google Scholar]
- John, K.N.; Asha, N. Behaviour of small-scale ring footing resting on geotextile reinforced soil. In Proceedings of the International Geotechnical Conference, IIT Roorkee, India, 22–24 December 2013. [Google Scholar]
- Thomas, L.M.; Philip, J.G. Experimental and Numerical Analysis of Load Carrying Capacity of Ring Footing on Sand Reinforced with Geonet. Int. J. Eng. Manag. Res. 2017, 7, 345–350. [Google Scholar]
- Erickson, H.L.; Drescher, A. Bearing Capacity of Circular Footings. J. Geotech. Geoenviron. Eng. 2002, 128, 947276. [Google Scholar] [CrossRef]
- Latha, G.M.; Somwanshi, A. Bearing capacity of square footings on geosynthetic reinforced sand. Geotext. Geomembr. 2009, 27, 281–294. [Google Scholar] [CrossRef]
- Tafreshi, S.M.; Dawson, A. Comparison of bearing capacity of a strip footing on sand with geocell and with planar forms of geotextile reinforcement. Geotext. Geomemb. 2010, 28, 72–84. [Google Scholar] [CrossRef]
- Desai, C.S.; Hashmi, Q. Analysis, evaluation, and implementation of a non-associative model for geologic materials. Int. J. Plast. 1989, 5, 397–420. [Google Scholar] [CrossRef]
- Hashmi, Q.; Desai, C.S. Nonassociative Plasticity Model for Cohesionless Material and its Implementation in Soil-Structure Interaction; Report to Natinal Science Foundation; Department of Civil Engineering Mechanics, University of Arizona: Tucson, AZ, USA, 1987. [Google Scholar]
- Geogrid Structural Elements, FLAC3D 7.0 Documentation. Available online: http://docs.itascacg.com/flac3d700/contents.html (accessed on 3 December 2020).
- Terzaghi, K. Theoretical Soil Mechanics; John Wiley & Sons: New York, NY, USA, 1943. [Google Scholar]
Figure 1.
Illustration of the model domain, load, and boundary condition.

Figure 2.
Comparison of computed load–displacement curves with the measured results in [6].
Figure 2.
Comparison of computed load–displacement curves with the measured results in [6].

Figure 3.
Effects of inner/outer diameter ratio (n) of ring footing on its bearing capacity.

Figure 4.
An equivalent of a two-adjacent footing. (a) An illustration of intersection zone formed in soil under a ring footing. (b) Deformation profiles within soil in response to a load exerted by a ring footing.
Figure 4.
An equivalent of a two-adjacent footing. (a) An illustration of intersection zone formed in soil under a ring footing. (b) Deformation profiles within soil in response to a load exerted by a ring footing.

Figure 5.
BCR as geogrid reinforcement layer moved deeper.


Figure 6.
Increase of BCR is limited when more geogrid layers were used.

Figure 7.
BCR decreased as the spacing between geogrid layer (h/D) increased.


Table 1.
Input parameters for sandy soil.
| Soil Parameters | |
|---|---|
| Bulk Modulus (K) | |
| Modulus of Elasticity (E) | |
| Shear Modulus (G) | |
| Poisson’s Ratio | 0.3 |
| Cohesion (C) | |
| 38° | |
| 8° | |
| Relative Density | 50% |
Table 2.
Input parameters for geogrid.
| Elasticity Modulus (E) | |
| 28° | |
| Cohesion | 0 kPa |
| Normal and Shear Stiffness (Kn and Ks) |
Table 3.
The optimum depth to lay the top geogrid layer.
| Number of Geogrid Reinforcement Layers N | (u/D) Opt |
|---|---|
| 1 | 0.36–0.44 |
| 2 | 0.34–0.41 |
| 3 | 0.266 |
| 4 | 0.2 |
Publisher’s Note: MDPI stays neutral with regard to jurisdictional claims in published maps and institutional affiliations. |
© 2021 by the authors. Licensee MDPI, Basel, Switzerland. This article is an open access article distributed under the terms and conditions of the Creative Commons Attribution (CC BY) license (http://creativecommons.org/licenses/by/4.0/).
Share and Cite
MDPI and ACS Style
Hosamo, H.; Sliteen, I.; Ding, S. Numerical Analysis of Bearing Capacity of a Ring Footing on Geogrid Reinforced Sand. Buildings 2021, 11, 68. https://0-doi-org.brum.beds.ac.uk/10.3390/buildings11020068
AMA Style
Hosamo H, Sliteen I, Ding S. Numerical Analysis of Bearing Capacity of a Ring Footing on Geogrid Reinforced Sand. Buildings. 2021; 11(2):68. https://0-doi-org.brum.beds.ac.uk/10.3390/buildings11020068
Chicago/Turabian StyleHosamo, Haidar, Iyad Sliteen, and Songxiong Ding. 2021. "Numerical Analysis of Bearing Capacity of a Ring Footing on Geogrid Reinforced Sand" Buildings 11, no. 2: 68. https://0-doi-org.brum.beds.ac.uk/10.3390/buildings11020068
Note that from the first issue of 2016, this journal uses article numbers instead of page numbers. See further details here.