
Augmented Reality to Enable Users to Identify Deviations for Model Reconciliation


School of Sustainable Engineering and the Built Environment, Arizona State University, Tempe, AZ 85281, USA
*
Author to whom correspondence should be addressed.
Buildings 2021, 11(2), 77; https://0-doi-org.brum.beds.ac.uk/10.3390/buildings11020077
Submission received: 31 January 2021
/
Revised: 16 February 2021
/
Accepted: 20 February 2021
/
Published: 23 February 2021
(This article belongs to the Collection Virtual Reality and Mixed Reality in Architecture, Engineering, Construction, and Operation and Maintenance (AECOM) Building Sector)
Abstract
:Effective use of Building Information Modeling (BIM) during operation typically requires modeled content to accurately match the built spaces, which necessitates effective field verification techniques to ensure that BIM content matches the actual built conditions. Some contractors leverage laser scanning and other reality-capture technologies to verify modeled content prior to turnover, but these approaches can be time- and resource-intensive. Augmented reality (AR) enables users to view BIM content overlaid on their field of view of the built space. Research suggests potential for using AR for tasks related to field verification, but a study that systematically explores the specific types of deviations that can be detected with this technology is missing from the current literature. This paper tasks participants with using immersive AR to identify deviations from BIM in a ceiling plenum space that includes installed Mechanical, Electrical and Plumbing (MEP) components, which would typically be included in a coordinated BIM. The results suggest that AR can enable users to effectively identify large deviations and missing building elements. However, the results do not indicate that AR effectively enables users to identify small deviations and can potentially lead to identifying false positive observations, where accurately constructed elements are perceived as deviating from BIM. These results suggest that immersive AR can effectively be used to check whether recently built elements conform to the intended BIM in instances where speed of verification is more important than adhering to strict tolerances. For instances where accuracy (less than two inches) is critical, the results of this work suggest that AR can be used to help determine where in the building more accurate, but more resource-intensive, reality-capture technologies should be used.
1. Introduction
Project models and documents are key deliverables to facility managers (FMs) at the end of a construction project and are particularly important for the long-term success of any project. Research suggests that issues with closeout documents can lead to long-term problems for building operators and FMs [1]. Facility owners spend a significant amount of time and money on field verification and associated issue identification. For example, in U.S. capital facility projects alone, an estimated 4.8 billion dollars are spent yearly to ensure that available information matches what was actually built [2]. These trends highlight the need to find better ways of turning over information to owners to ensure that the information accurately represents what was constructed.
During the design and construction phases, Building Information Modeling (BIM) is increasingly being used by architects and constructors [3,4]. While its use is still less common during the operation and facility management phases of a building project, and still presents significant challenges, interest in the subject is growing rapidly [5,6,7]. Some researchers suggest that effective BIM use during operation could provide benefits related to process, workflow, and safety of operations and maintenance [8]. Others developed a tool to enable facility managers to better understand the value of BIM to their work, and proposed using it as a learning mechanism to continuously question the value BIM is providing [9]. Researchers are recognizing the opportunity for effective BIM to coordinate with the internet of things (IoT) to create the opportunity for smart facility management [10]. Currently, several commercial software suites target the use of BIM for FMs [11]. While not all of the information available in a typical BIM is essential to facility managers, accurate geometrical representation is of particular importance [12]. Currently, most field verification processes collect a point cloud of the building using photogrammetry [13] or laser scanning [14], and compare this content to the model, but these methods can be time-consuming and labor-intensive [15].
Augmented reality (AR) is a technology that allows the viewing of both real and virtual content in the same field of view [16]. AR use has been theorized and applied in the construction industry, including during construction [17], pre-construction [18] and project monitoring [19]. A prior review of AR applications revealed interest from the different project stakeholders for non-immersive visualization technologies to enhance progress monitoring and defect detection processes [20], and a more recent review indicated widespread interest in using AR for quality control and defect detection [21]. For example, a study outlined the process of using AR to analyze segment displacement in a constructed tunnel [22]. However, this and other studies outline feasibility of processes but do not dive into the precision limitations of AR. Past researchers have outlined the limitations of using AR for inspection to include site-specific issues [23], mobility issues and accuracy and precision issues [24]. While the mobility component has largely been solved, accuracy and precision, while constantly improving, remain a limiting factor.
Although it is still a developing technology, AR can enable users to visually compare the model to the built environment and determine potential deviations, which may be able to save time for scanning and data processing compared to current photogrammetry and laser scanning practices. Additionally, it has long been recognized that traditional two-dimensional (2D) drawings, which are still commonly used on construction sites today, present difficulties with both accuracy and mental visualization when compared to three-dimensional (3D) alternatives [25,26].
These limitations call for a more intuitive mode of design communication to support field verification tasks, warranting an exploration of augmented reality in contributing a part of the solution.
Furthermore, prior research has shown that novices and experts tend to perform and behave similarly when completing certain construction tasks using AR [27], creating an opportunity to leverage individuals with varied levels of experience in supporting model-verification checks.
This research investigates the performance advantages and disadvantages of using AR to verify deviations between the model and the built environment among Mechanical, Electrical and Plumbing (MEP) systems installed in a ceiling plenum when used by graduate students with varying levels of industry experience. Specifically, the paper answers the following questions: What are the types of deviations that can be detected by users of AR? And what is the frequency of false positive observations when using AR for this type of deviation detection? The findings will enable practitioners to integrate AR technology into field verification processes in ways that directly leverage performance evidence. Furthermore, the findings highlight opportunities for future researchers to target specific performance improvements to AR devices to support field verification (and related) use-cases.
2. Background
2.1. Building Information Modeling
Building Information Modeling (BIM) is the digital representation of the physical and functional properties of a building [28]. BIM provides the modeled content that enables the use of AR, so a background on BIM in the industry is presented here to illustrate its prevalence. BIM is being increasingly used during the different construction phases, enabling contractors to reduce errors and omissions, collaborate with design firms, reduce rework, and reduce overall cost and duration of a project [3]. When a model is turned over at the end of the construction phase, it can enable owners to effectively access design and construction information [6], and also to document changes to the building throughout its lifecycle [29].
For building operation, BIM can help locate and manage building components [30] and facilitate space management [31]. Using Radio Frequency Identification (RFID) in conjunction with BIM enhances accessibility to accumulated lifecycle information [32]. Recognizing its many benefits, owners and facility managers are increasingly asking for accurate models of the project after the construction phase [33]. While these potential benefits to using BIM for FM are becoming increasingly well documented, they are generally dependent on having accurate information turned over to owner teams by construction teams at the conclusion of projects. This process of turning over accurate information can pose practical challenges.
Contractors have been increasingly leveraging BIM during construction for applications such as creating accurate geometric representations of building parts in an information-rich environment [34], managing scheduling concerns [35], managing cost control processes [36] and monitoring environmental data [34]. Currently, most applications are focused on deriving value from BIM during the construction phase of the project. Developing accurate as-built BIM content requires contractors to thoroughly check what was built compared to what was supposed to be built, which traditionally is very resource-intensive. The next section details the different deviation detection and model rectification mechanisms used.
2.2. Field Verification and Deviation
The aim of field verification is to reconcile the model and the built environment. Ideally, these environments should match exactly, but deviations made during construction may introduce discrepancies between the BIM and physical spaces. Typically, one of the various reality-capture technologies is used to record the state of the built environment in order to identify the location of deviations between the BIM and physical building elements. This process involves the generation of a point cloud of the built environment, often using laser scanners [14], photogrammetry [37], videogrammetry [38], or a combination of these technologies [39]. Once point clouds or models that represent the actual built conditions of a project are created, they are compared with the original BIM for construction. This comparison can be supported through the use of technology [40], but the determination of how to reconcile differences between BIM and actual conditions is typically done by a human decision-maker. Depending on the type of deviation and phase of construction, either the model is adjusted, or the built element is reworked. In response to the need for effective field verification technologies to support decision-makers, researchers have explored various strategies to improve the technologies and processes related to this task, which are detailed in the subsequent paragraphs.
Photogrammetry is a technology that compares two overlapping still images to create a stereo-model by calculating light rays [37], enabling a portable sensing of the current surroundings [41]. Essentially, the photos are used to create low-density 3D point clouds of areas of interest. Researchers have used site pictures to recreate 3D models and compare them to the planned models for construction progress monitoring [42]. Others have used images taken from Unmanned Arial Vehicles (UAV) to recreate low-cost 3D as-built models of electrical stations [43]. Furthermore, researchers have used single-frame photos of 3D objects to identify building defects [44]. Videogrammetry is a similar technology that uses a video feed instead of overlapping pictures to recreate 3D models [38]. However, research suggests that photography on-site may not always lead to sufficiently accurate 3D point cloud models [45], and current photogrammetry technology still displays inconsistencies based on software choice and placement of control points [46].
Depth sensing cameras have also been used to evaluate deviation between planned and constructed elements. Researchers have used a two-step depth sensing algorithm to recreate a 3D model from the associated imagery, compare that content with BIM, and do a discrepancy check to identify deviations [47]. This technique has also been used with a moving camera setup with both 2D and depth sensing cameras [48]. In an industrial setting, depth sensing cameras are used to detect and quantify differences between assembled products and a reference 3D model for one model in a fixed area [49].
Another technology used to acquire point clouds is laser scanning, otherwise known as Light Detection and Ranging (LiDAR). Laser scanners are capable of registering millions of points in a short period of time [14] that can be imported into Computer-Aided Drawing (CAD) environments [50]. Numerous software suites have been developed to automatically detect relevant geometries, such as cylinders and beams from point clouds [51,52], but more work is required to optimize the software for the different uses [53]. Laser scanners are usually very accurate [54], subject to environmental parameters and the properties of the materials of the objects being scanned [55]. The main limitations of current laser scanning technologies are the high upfront cost and the time involved with data collection [56]. Furthermore, laser-scanned point clouds can require more time to analyze compared to photogrammetry [57]. Hybrid photogrammetry and laser scanning-based systems have been suggested, but could still require significant time and effort for accurate data capturing [58].
In general, reality-capture technologies rely on digitizing the built environment and comparing the digital representation with the designed BIM. Because of the capital and time resources required for capturing field conditions, one of the significant challenges related to field verification practices is determining which areas are required to be scanned and compared [59]. Since the scanning and data processing can be time-consuming, reducing the areas required for scanning could reduce overall time and cost, especially when one task is being delayed while analyzing the reality-capture models. Augmented reality provides a theoretical benefit by enabling individuals to view as-planned BIM content over their view of as-built physical spaces. In premise, this technology could enable individuals to either verify the accuracy of field conditions without a separate reality-capture model, or it could at least help to define potential discrepancies that warrant subsequent reality-capture approaches for accurate viewing and comparison. This opportunity for more streamlined field verification through augmented reality motivates this work.
2.3. Augmented Reality
Augmented reality (AR) is a technology that allows the viewing of both virtual and real content as if they coexisted in the same field of view [60]. Review articles regarding augmented reality in the construction domain suggest research directions for the technology, including for site monitoring and inspection [61,62,63]. Another review article outlines features of AR that help determine its suitability of use for certain applications, such as the ability of AR to superimpose virtual elements on a real-world scene [64]. Recent research has explored the use of AR for construction planning [65,66] and operation and maintainability by providing relevant information intuitively throughout a project lifecycle [67]. The use of AR for quality control and assurance, and specifically deviation detection, has also been researched, as detailed in the following paragraphs.
In non-construction industries, AR has been utilized to identify discrepancies between as-planned and as-built pipe placement in ship construction [68] and to compare 3D mockups to CAD 3D models in the automotive industry [69]. Several researchers attempted to use AR for defect identification in the built environment. Kwon et al. developed a handheld mobile device-based application that overlays the BIM on top of a reinforced concrete formwork to check for missing steel reinforcement [70]. Dunston used a camera-based AR solution to replace a Total-Station to check the deviation and angle of steel columns [71]. Zhou used AR on-site to rapidly check segment displacement during tunneling construction and noted that it is generally faster to use AR than traditional inspection methods [22]. Abbas et al. studied rebar inspection using mobile augmented reality and its impact on spatial awareness and cognitive load [72]. In these studies, AR was used to detect specific deviations in specialty construction elements, not deviations of overall constructed systems compared to designed models. Others have attempted to use images to recreate a 3D model and compare the as-built to the CAD model in an AR environment [73,74]. Research has also highlighted the need for technical advancement in both tracking and viewing technologies to better enable on-site AR-based inspection [24]. In response to this, new registration mechanisms that do not require markers or a Global Positioning System (GPS) were developed [75]. In addition to registration developments, commercial tools are being developed to streamline and automate the process of importing BIM models into a viewable augmented reality context [76,77].
Prior research suggests that AR can be used to identify some deviations between planned and built elements in experimental, controlled settings, or to identify specific deviations in specialized elements. In this paper, the authors use AR to enable users to identify numerous types of deviations in a common field verification use-case related to the comparison of built MEP systems in a ceiling plenum space and the intended BIM. The experiment utilizes current generation AR devices to display the BIM content in the field. The new knowledge provided by this paper relates to identifying the types of deviations that users can identify with current generation AR for performing field verification use-cases in an actual built environment.
3. Materials and Methods
This research aims to understand the types of deviations that can be detected by an AR user when comparing a BIM to the built MEP systems for field verification. To explore this topic, a fully constructed MEP system was modeled, and several deviations were intentionally introduced to the model to simulate the types of differences that may exist between model and field in practice. The researchers strategically chose a built environment with exposed MEP systems to allow users to see it with the unaided eye, similar to how construction professionals might check MEP systems in a plenum space prior to covering them with finish materials. Using AR, the modified model was then overlaid on the constructed system, and participants were instructed to find the deviations. In order to avoid challenges that can be present with an indoor location, the authors used a printed physical marker placed in a known location to register the modeled content. The types of errors, observations and false positives captured by the practitioners were recorded and analyzed. The following sections detail each step of the experiment methodology.
3.1. Partner Company and Model Development
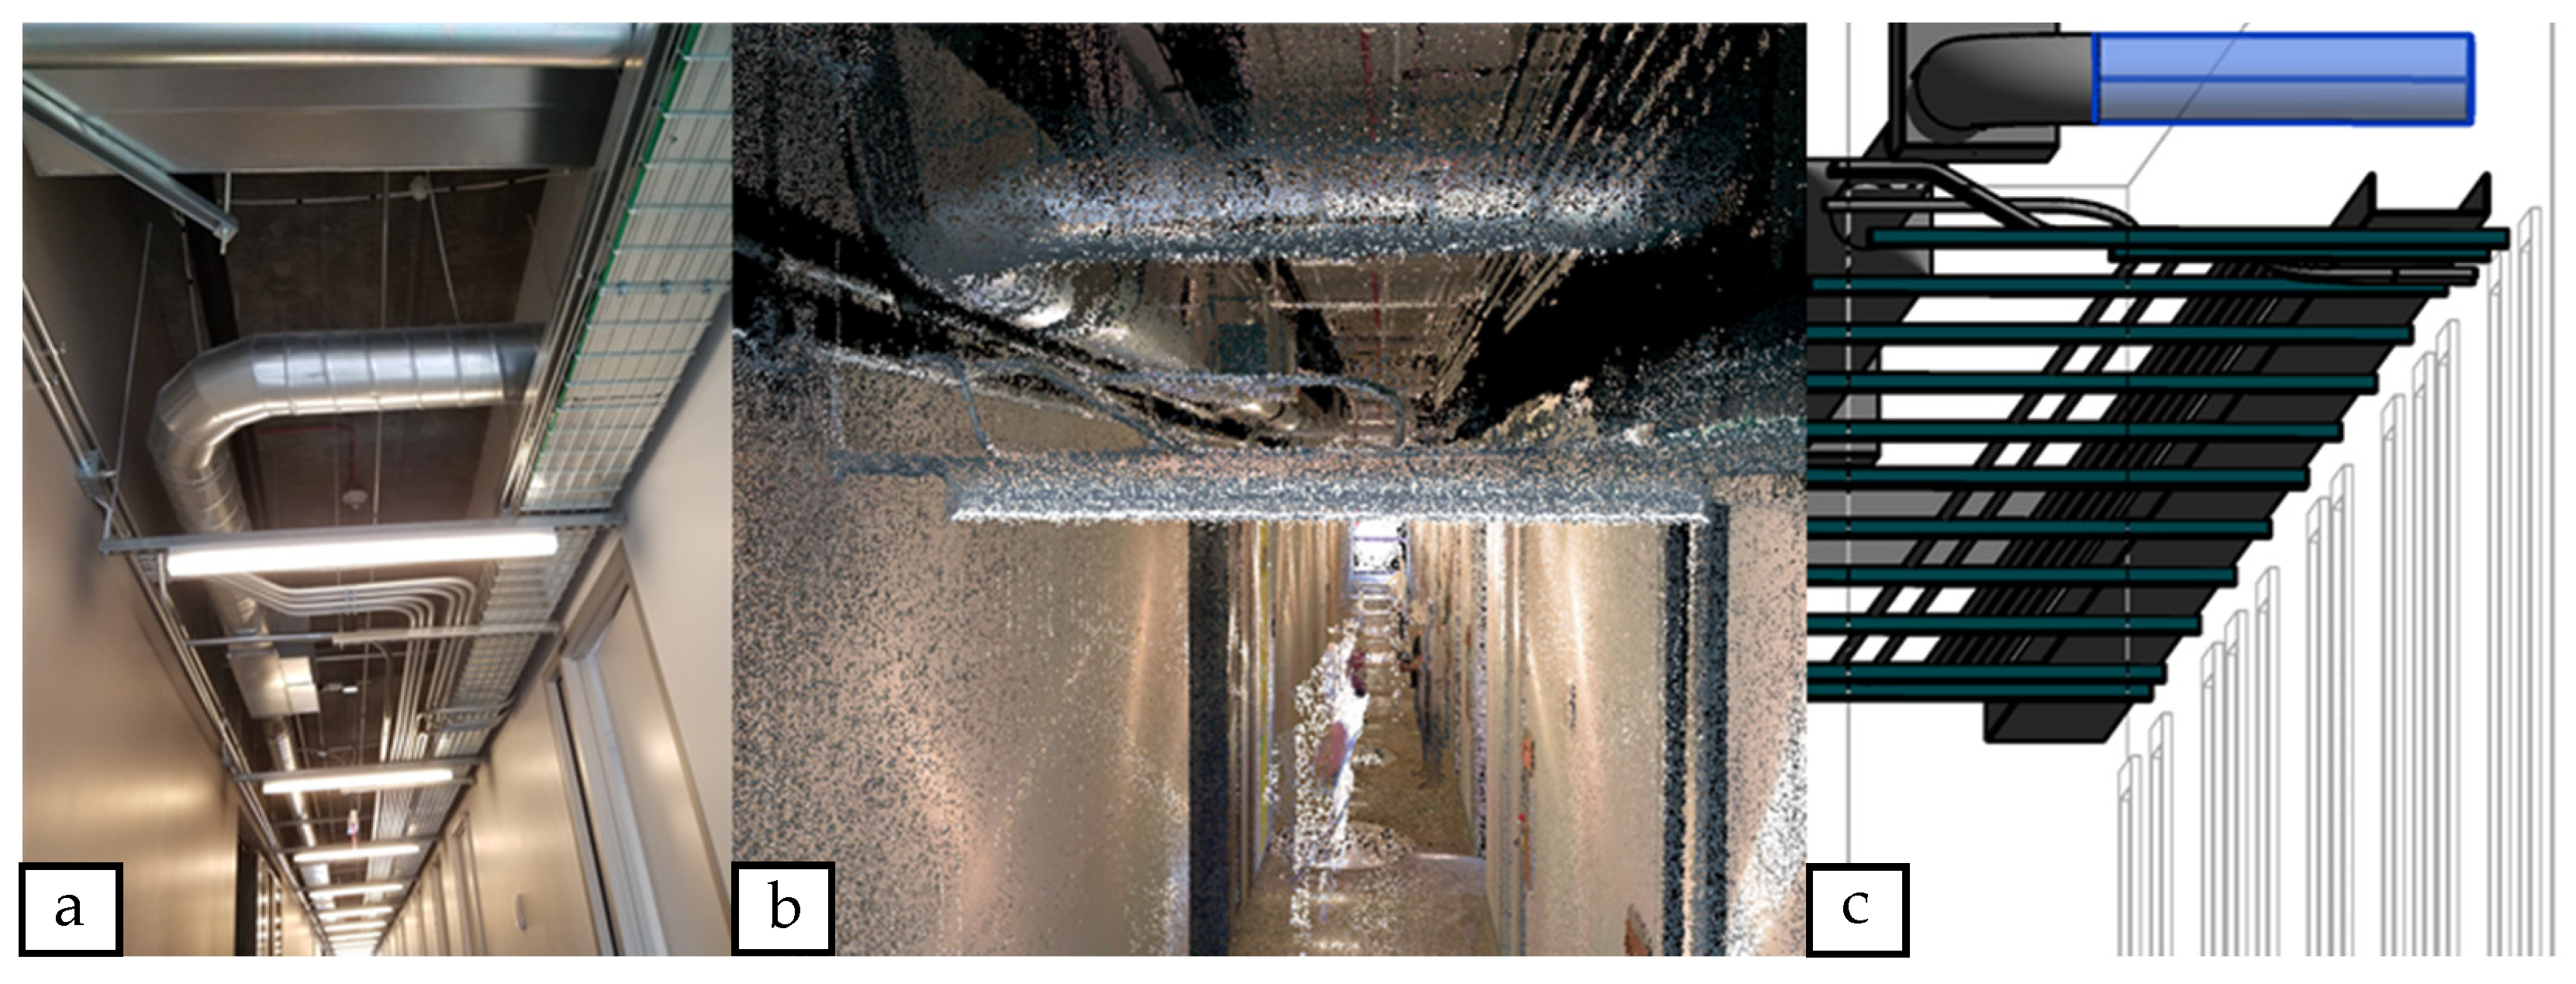
The researchers partnered with a large electrical subcontractor in the southwest region of the United States for developing the materials required for this experiment. The partner company regularly provides as-built BIM content as part of their close-out deliverables. To support this process, the company often uses laser scanning to collect accurate point clouds of as-built conditions to compare to planned BIM content. This partner company provided BIM development and field capture services for this research to create an accurate point cloud, which was used to generate an accurate as-built model for the targeted space for field verification, as shown in Figure 1.
The targeted area for field verification (Figure 1) was located in a finished building on the authors’ institution’s campus. The hallway was strategically chosen because it does not have a ceiling that blocks the view of the various building systems installed. This effectively simulates the type of view that construction professionals would have when field-verifying the locations of systems prior to covering them with typical finish materials. The selected hallway included electrical conduits, telecommunications cable trays, lighting, heating, ventilation and air conditioning (HVAC) ducts, water pipes and fire sprinkler lines. This type of scenario involving similar components could directly benefit from effective field verification.
The authors worked with the partner company to generate an accurate, as-built, BIM according to their typical field verification processes. First, a technician from the partner company used a laser scanner to generate an accurate point cloud of the space, with an accuracy of less than 1/8th of an inch. The point cloud was then imported into a modeling software and used to recreate a model that exactly replicates the built environment. After the accurate as-built model was created, several types of deviations were strategically incorporated into the model for subsequent tasks aimed at determining the extent to which users of AR could identify those types of deviations.
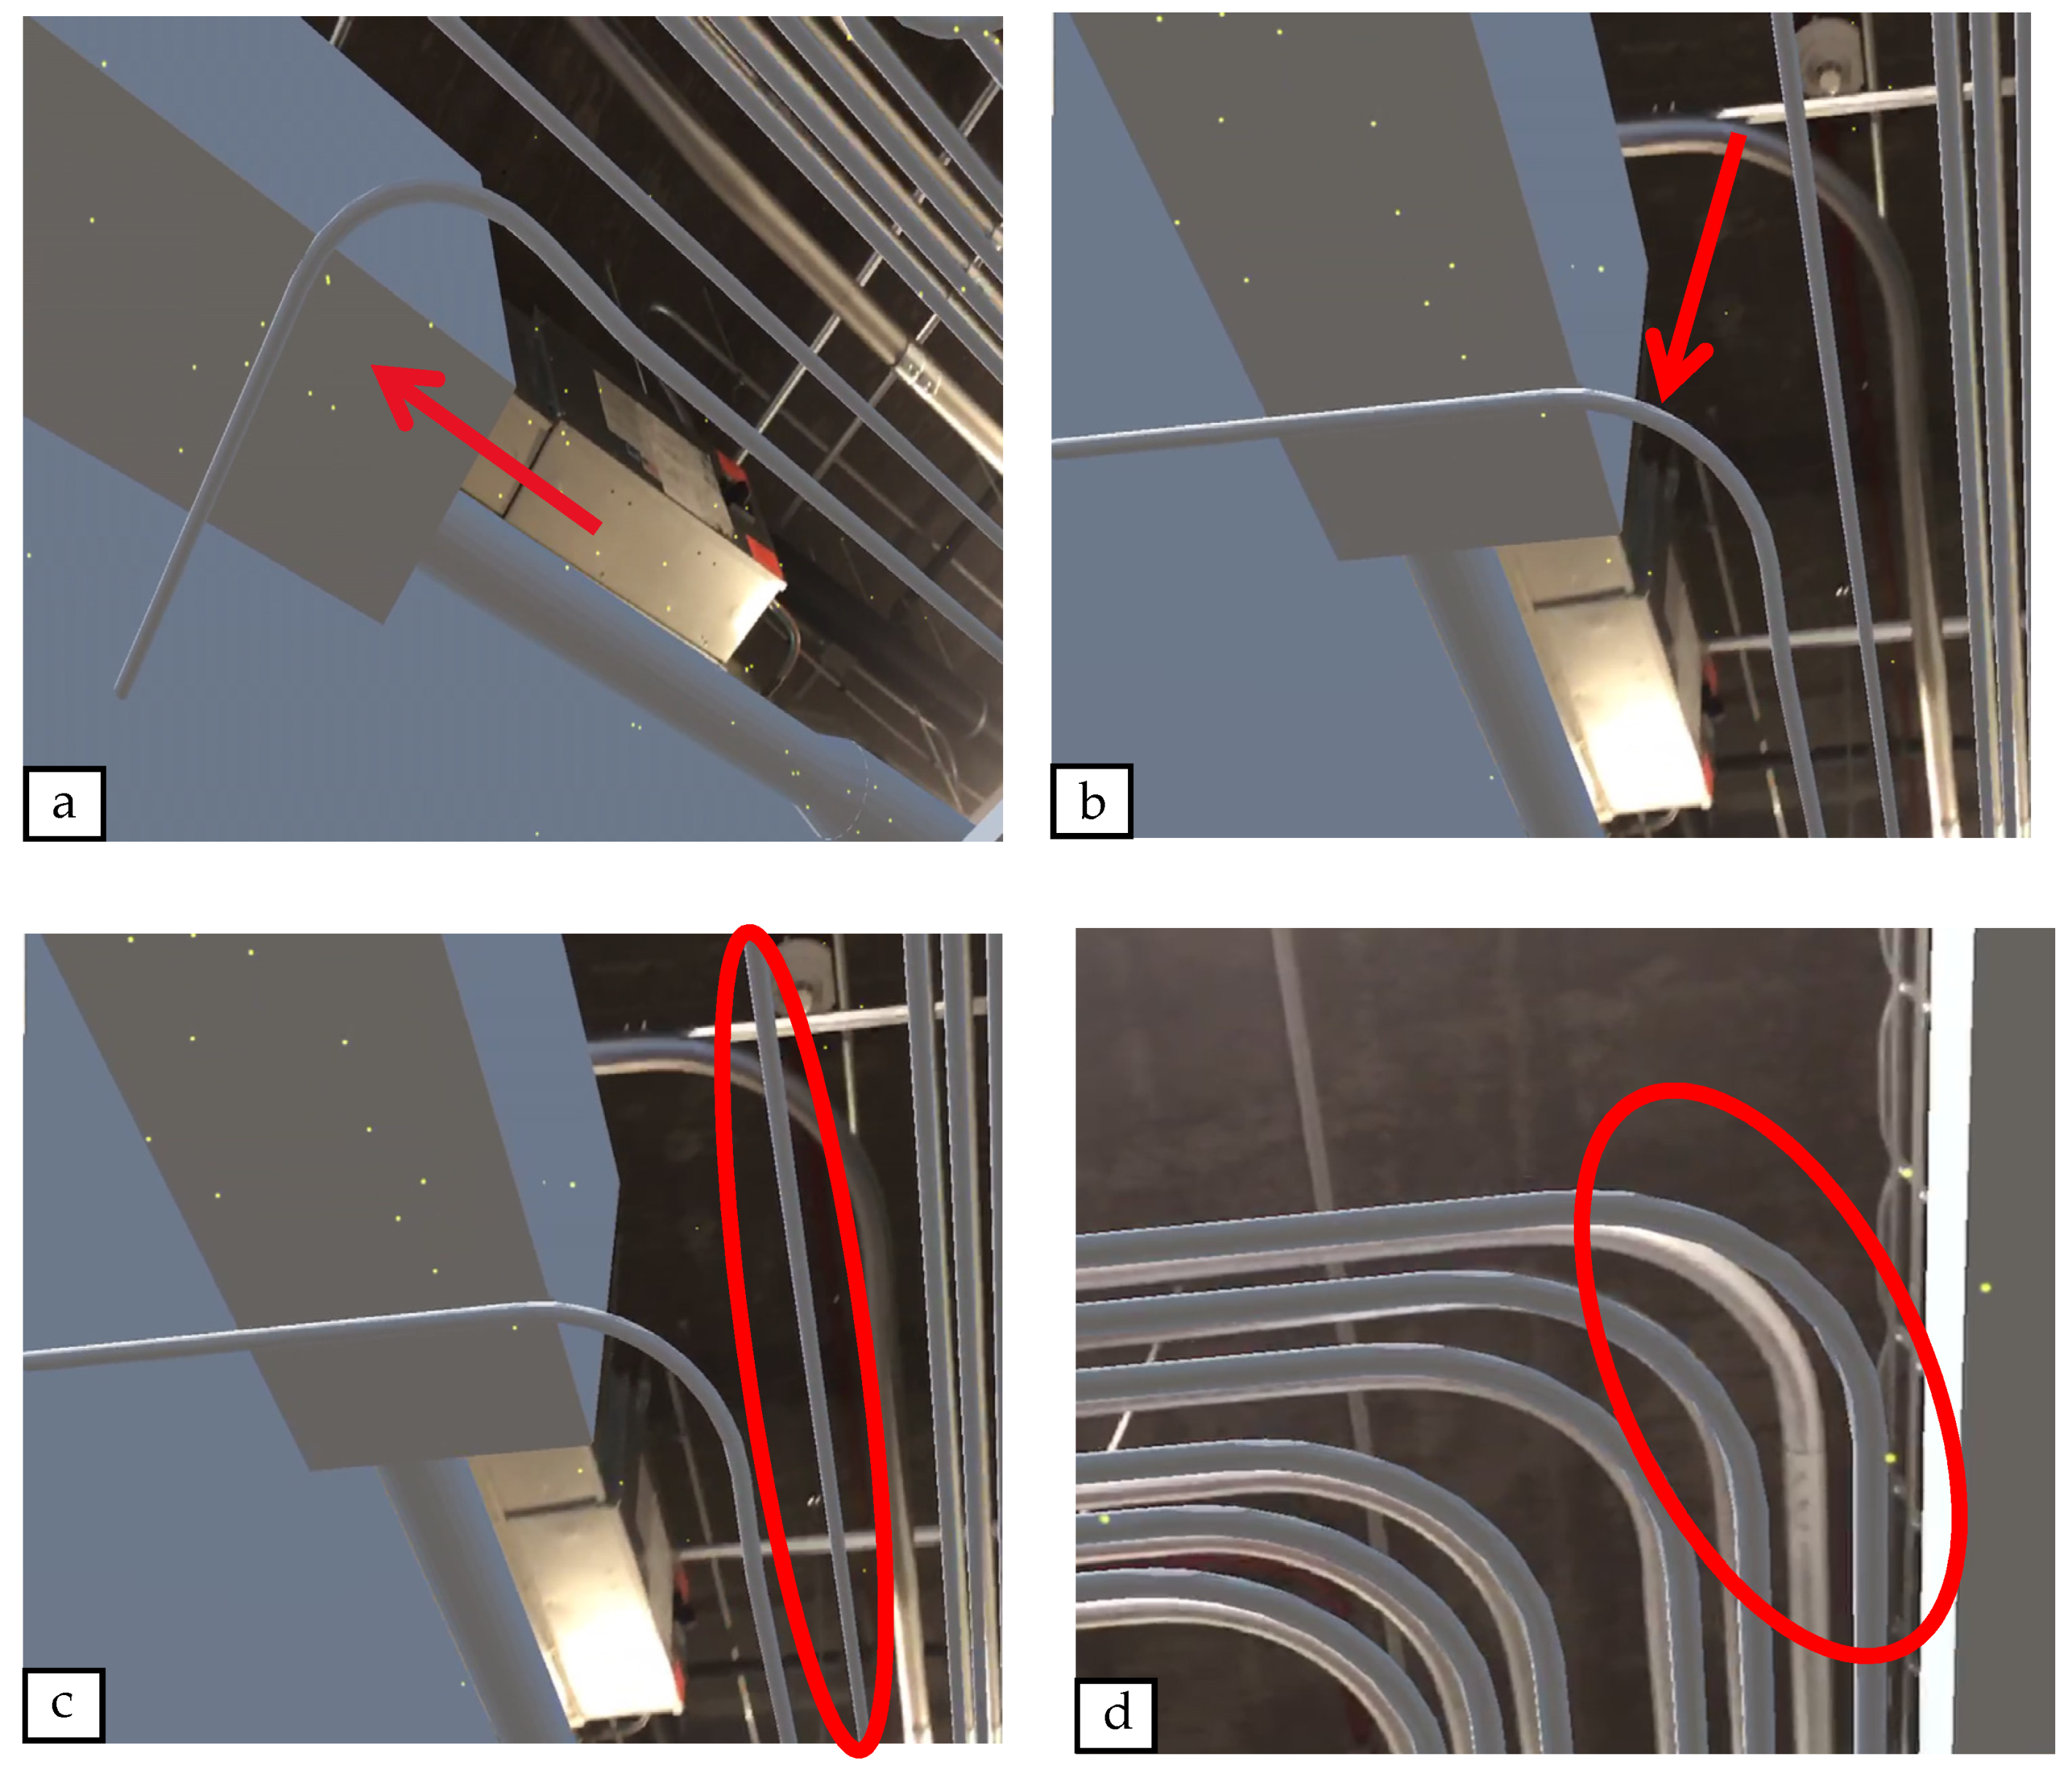
The authors introduced deviations into the model to simulate the types of deviations that may occur in practice. Through discussions with the industry partner, three types of commonly occurring deviations were selected for introduction in the model: (1) small deviations, (2) large deviations and (3) missing elements. In this paper, small deviations were defined as those smaller than two inches, and large deviations were defined as those larger than two inches. Missing elements were defined as elements that were present in the BIM, but not present in the built environment. There were four total deviations in the modified model: two large deviations, one small deviation and one missing element. Figure 2 shows the four deviations compared to the constructed environment. Table 1 summarizes the deviations added to the model.
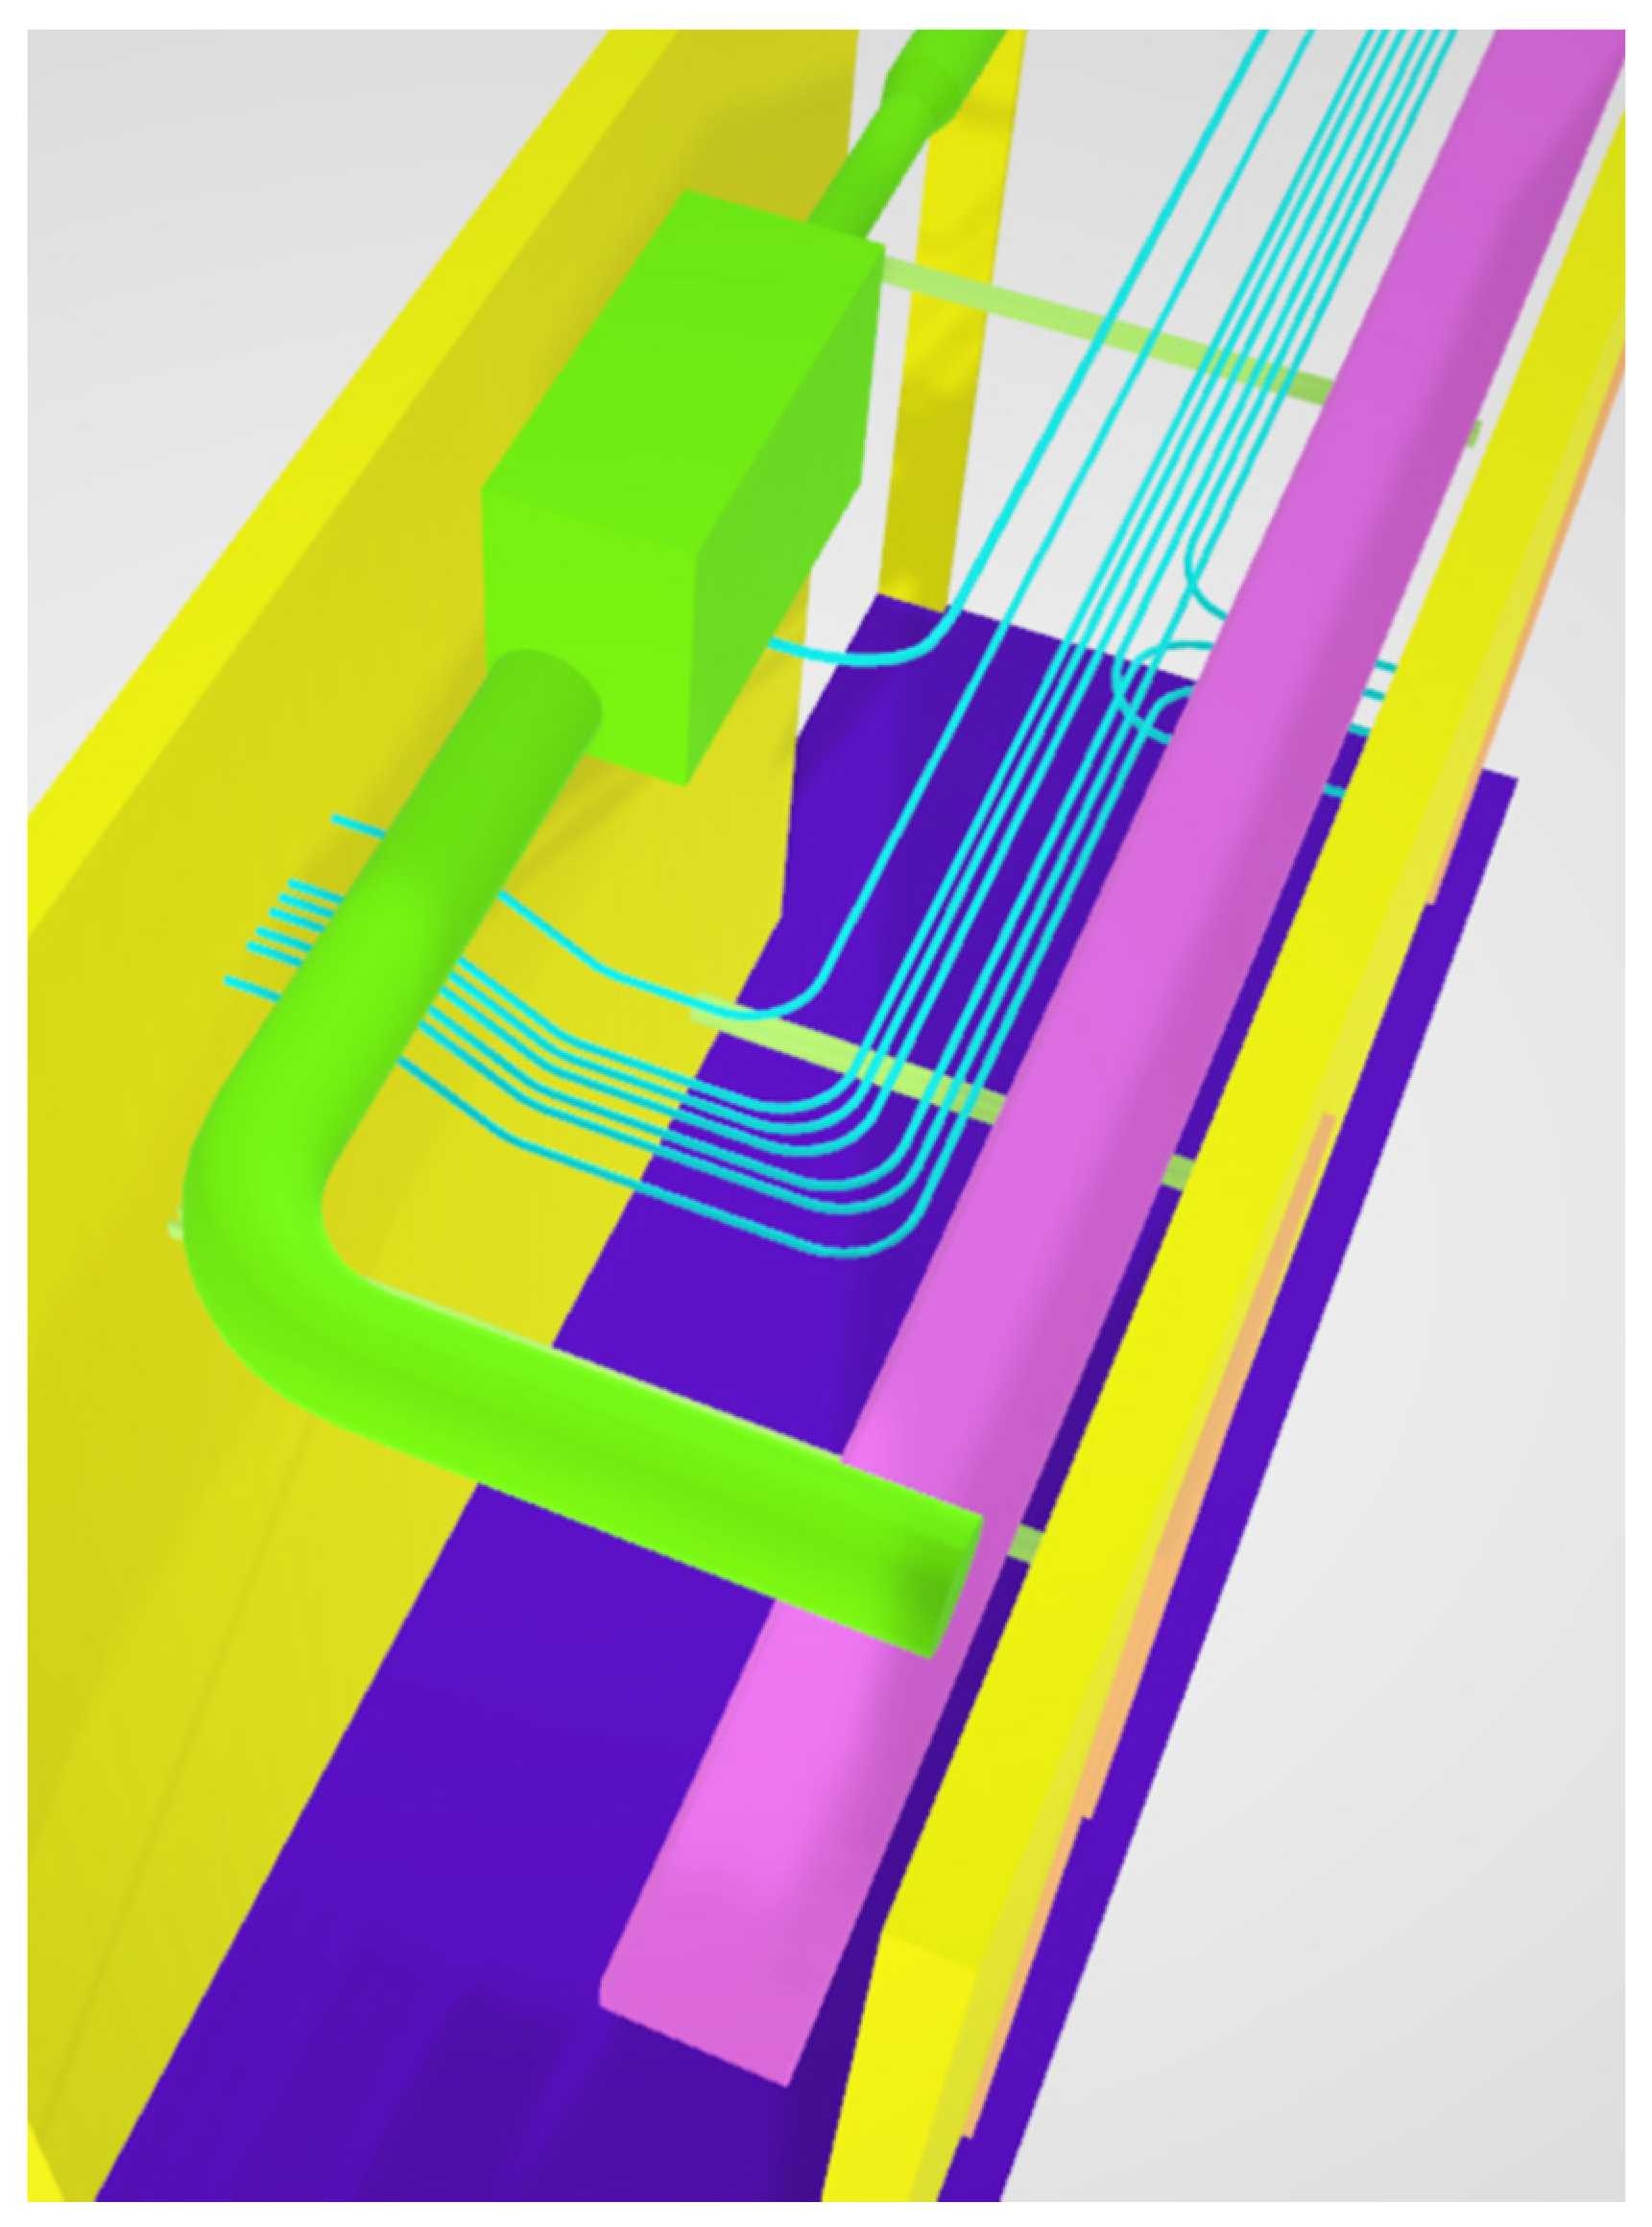
After defining the deviations in the model, the components in the BIM were color-coded, based on the different types of systems, as shown in Figure 3. The HVAC system was colored green, the electrical conduits were colored blue, the cable tray was colored pink and lights were colored in light green. The coloring allowed the users to easily distinguish between the built systems. It also enabled the research participants to easily stipulate which system they were considering when performing the field verification tasks by simply referring to their color. This was done to reduce the chances of misinterpretation of participants’ statements by researchers during data collection and analysis. Other than the deliberate changes made to the model to enable the research, no additional modifications were made to the model in order to replicate the type of modeled content that would typically be delivered in practical settings.
3.2. AR Deployment
The Microsoft HoloLens 1 was chosen as the AR device for this experiment. The HoloLens overlays virtual content directly on top of the user’s unobstructed view instead of relying on a video-pass-through display. This enables a safer and more comfortable alternative to video-pass-through-based AR systems because of the lack of video latency. Furthermore, the HoloLens is a self-contained, untethered Head-Mounted Display (HMD), which allows the users to freely walk around the space to check for model discrepancies and to maintain the use of their hands to perform inspection tasks. There are merits to both immersive and video-based AR, but in this case, the hands-free unobstructed view enabled users to use a measuring tape or other physical device if desired for field-verification. If there is no need for having hands-free navigation, it is possible that non-immersive AR may be an equally good fit in future applications.
All AR development was done in Unity Game Engine. First, the Revit models were extracted to FBX files, a universal 3D file type. The FBX models were then imported into the Unity Game Engine and linked to a printed fiducial marker to enable accurate placement of the model in space. A single marker was developed by the authors and was used to register the modeled content. When a user says the word “model”, the entire model would disappear, and when the user says it again, the model would reappear. This modification leveraged the AR device’s built-in voice command capability and enabled users to have completely unobstructed views of the space if they chose during their field verification task.
3.3. Identifying Participants for Experiment
The researchers were primarily interested in determining the types of deviations that an AR user could identify between field and BIM. To provide a large sample of participants, students from a graduate level construction class were recruited for this experiment. Graduate students typically have a strong foundational understanding of their discipline from the completion of their undergraduate degree. The students represent a group with varying backgrounds and levels of experience, but are not necessarily trained to complete field verification tasks. Using student participants provides an opportunity for tasking comparatively large numbers of participants with field-verifying the same space, which would not realistically be possible to replicate on an active job site. Furthermore, the participants did not have prior experience with the space or prior experience with the specialty contractors involved with its construction. Prior knowledge of the space and working experience with specific subcontractors could create bias for or against specific disciplines, increasing or decreasing the likelihood of detecting errors. While this type of bias would likely be present in practical implementations of AR, introducing the bias in a study on AR could obfuscate results and suggest findings based on information outside of what was presented through AR. The students received a small class credit for participating in the experiment, regardless of their performance.
3.4. Experimental Protocol
Before starting the experiment, the participants were informed that the session would be video and audio recorded, and they signed an informed consent form to allow the researchers to use the data collected for analysis. Each participant then received a pre-session questionnaire. The questionnaire included general background questions, such as age, experience in construction, experience completing Quality Assessment/Quality Control (QA/QC) tasks and experience with AR technology.
After completing the pre-session questionnaire, the participants were briefed on the think-aloud protocol that they would be asked to follow during the experiment. A think-aloud protocol asks participants to verbally describe their thoughts during a given task [73]. For this work, this involved participants stating the deviations that they identified as they navigated the targeted space. They were also informed that the researcher might ask follow-up questions when necessary. During the activity, the researcher only intervened for follow-up information when participants voiced unclear statements. For example, if a participant stated “the tube is shifted to the front” the researcher would ask “what color is the tube? Would you point to the direction it is shifted to?” to clarify the statements made. When a deviation was detected, the researcher asked the participant to estimate the deviation distance and direction. This data collection process enabled the researchers to understand what the participants were thinking during the activity, without influencing them to state a specific type of comment [78].
After participants understood the task required of them in this experiment, they were introduced to the specific AR device involved in this work. Since most of the participants did not have previous experience with AR, they were provided with a brief technical introduction to the headset used. The researcher assisted each participant in wearing the headset and made sure that the participant could view the model. After the participant verbally verified that he or she could see the modeled content and understood the task assigned, the experiment began.
Participants were not told how many deviations they should find in the space to simulate the uncertainty about deviations that could be present during actual field verification processes in practice. Instead, they were told to explore the modeled portion of the hallway and identify all discrepancies that they believed existed between the model and physical space. After participants reached a point where they believed they had found all discrepancies, they simply told the researcher that they were finished with their review of the space. At that point, the experiment stopped, even if the participants had included incorrect statements or missed deviations that they should have theoretically caught through their verification process.
Upon completion of the AR review activity, participants were asked to complete a NASA-TLX (National Aeronautics and Space Administration-Task Load Index) form and a post-session questionnaire. The NASA-TLX is a questionnaire that enables researchers to measure perceived cognitive workload [79], and the questionnaire included questions related to the experiment, including several Likert scale-based questions about the ease of finding deviations and the participant’s confidence in his or her results, and open-ended questions about the ease of using the device itself, comfort during the experiment and future potential uses of this technology in his or her experience and opinion.
3.5. Analysis
The raw data collected included the participants’ completed questionnaires, the videos recorded for each experiment and notes taken by the researcher during the experiment. The questionnaires and the NASA-TLX responses were anonymized and digitized. The questions based on a Likert scale were digitized in a spreadsheet format, while open-ended questions were saved in plain text documents. Descriptive and paired statistics were calculated, where appropriate, to extract relevant findings.
The researchers referenced the video recordings and the notes to assess the performance of the participants during the experiment. In the same spreadsheet, the researchers recorded which deviations were detected, the stated classifications of the deviations (missing items, large deviation, small deviations) and any false positive observations. This data was analyzed using various statistical tests, and the findings are elaborated in the results section.
4. Results and Discussion
Twenty-seven graduate construction management students participated in this experiment. The age of the participants ranged between 22 and 57 years old, and all had at least a bachelor degree in a construction-related field. Table 2 summarizes the years of experience and prior experience completing quality control and assurance tasks among participants. In general, most participants had between 1 and 5 years of experience and 60% of them had some completed some QA/QC-related tasks.
4.1. Deviation Detection
The participants took between two and three minutes to finish the task. In this paper, deviation identification refers to when a participant verbally states that a building element has deviated from the original model. Deviation classification refers to when a participant indicates how or why the building element is different from the original model. For example, if the participant states that there is a difference between the model and built environment related to the Variable Air Volume (VAV) box, it is considered a correct deviation identification because this was one of the deviations intentionally introduced into the model. If the participant states that the VAV box is not constructed, this is still considered to be a correct identification, but it is considered to be an incorrect classification of the deviation because the box is indeed constructed, but its placement is shifted from the BIM.
Table 3 summarizes the correct deviation detection and deviation identification rates of the different building components by the participants: 96% of all participants were able to detect the shift in the VAV box and correctly identified it as shifted, typically estimating the shift between 18 inches and 3 feet, 96% of participants detected the large conduit deviation, 88% of which correctly identified this deviation to be between eight inches and one foot, while the remaining 12% considered the conduit to be missing or not installed. Of the participants, 74% detected the missing conduit, 80% of which correctly identified it as missing while the remaining 20% considered it to be installed elsewhere but shifted by two to four feet. Finally, only 41% of participants detected the small conduit deviation, all of whom correctly identified it as a small, one to two inch deviation.
In general, AR seems to enable high levels of identification of large deviations and missing items, but it is less likely to enable the identification of small deviations. Although all aspects of the AR experience have advanced over the past several years, AR still suffers from significant tracking and parallax effects. AR tracking refers to the placement of the model relative to the real world. Parallax is defined as the effect whereby the position of a virtual objects changes when viewed from different angles. Microsoft HoloLens 1 AR can place virtual models almost perfectly when stationary, but as the user moves around the space, the experience suffers from reduced tracking performance and subsequently the parallax effect. Challenges associated with model drift were not addressed because the authors were interested in seeing the extent to which current technology with all its benefits and drawbacks would impact performance. Some participants understood the visual cues of the parallax effect as overall shifting of the model (incorrect tracking), leading them to miss the small deviation. A smaller percentage of participants correctly understood the difference between slight shifting when moving and “real” deviations and could identify the small deviation.
One counter-intuitive observation regarding the results obtained was the fact that fewer participants detected the missing conduit compared to those who identified large deviations. Prior research theorized that AR can enable practitioners to immediately find missing building elements in a space when comparing the virtual model in an AR environment [70]. However, 26% of participants failed to notice that an extra electrical conduit should have been constructed. One possible explanation is that some participants may not have realized that the parallax effect exists, leading them to think that the virtual conduit was simply perfectly overlaid on a real conduit, and did not think to further check if there was actually an installed model. This further illustrates the importance of testing this technology in a complex building environment, where the user might not be able to focus on and compare single elements. One possible remedy could be to lower the brightness of the virtual model view, which may enable the user to identify mismatches more easily. Additionally, encouraging users to switch the model on and off frequently could enable this kind of identification.
Finally, it is important to understand the difference in the rates of correct identifications between the building components. Although all participants who correctly identified the VAV box as a deviation correctly classified the deviation as a large deviation, 12% of the participants who identified the electrical conduit as deviating considered it missing, when in reality it was a large deviation. The reason for the discrepancy in the correct classification rates may be due to the nature of the element itself. In this specific experiment, two of the three participants that incorrectly classified the largely deviated conduit as missing attempted to count the number of present conduits out loud, miscounted, and then classified the conduit as missing. By contrast, there are comparatively fewer VAV boxes within the space than there are conduits, which may make it easier to quickly define the type of deviation related to the VAV box. This suggests that, in high-density areas where numerous building elements are repetitively used, the usability of AR may be hindered, and the use of a hybrid checking method, where the results presented through AR inspection are subsequently rechecked, may be required.
4.2. False Positives
In this paper, false positives refer to instances where a participant identified an area as being different from the AR model, even though the model was not modified from the original laser scan of the built space. For example, the cable tray modeled is in its correct place, according to the laser scan. If a user identifies it as deviating from the model, this would count as a false positive. Table 4 summarizes the number of false positives identified by the different participants.
Sixteen participants did not identify any false positives, nine found one false positive and two found two false positives, and no participant found any more than two false positives. Nine false positive observations alleged that all electrical conduits have shifted by an inch or less to the right, three considered the HVAC duct to be slightly shifted to a side and one alleged the lights were slightly shifted forward. All false positive observations were described as smaller than two inches, or small deviations. These may also be attributed to the aforementioned parallax effect. In these cases, the participants did not acknowledge the existence of the parallax effect, and identified every small shift as a deviation. While this does illustrate a limitation observed through the technology, the recognition of this effect by participants may be something that could be mitigated through more exposure or training for practical applications.
It is important to remember that AR is used to help human decision-makers not only to determine whether a deviation exists, but also to determine what to do next. In many cases, when small deviations are identified, rectifying the model to perfectly match the built space or reworking the physical space to perfectly match the model are unnecessary, and tracking and rectifying such small deviations may not be critical for FM purposes. In these cases, the decision-maker will likely decide to ignore the small deviation, regardless of whether or not it is a false positive observation or a real deviation. In the cases where high levels of accuracy are required, the decision-maker can spend the time and resources necessary to check the specific areas with more accurate capturing technologies, such as laser scanning.
4.3. Perceptions and Cognitive Workload
Table 5 summarizes the results of the post-session questionnaire. While all participants agree or strongly agree that it is easy to identify large deviations between the model and the built environment using AR, 7% of participants disagree that missing elements are easy to identify using AR, and 33% of participants disagree that small deviations are easy to identify using AR, signifying that the participants were aware of the limitations of the device upon first use. Furthermore, the results reflect the confidence of the participants in their findings. These results further support the observations presented in the prior sections, where all participants detected at least one large deviation, whereas smaller numbers of participants detected the missing elements and smaller deviations.
To measure the cognitive workload required to complete the deviation detection using AR, the researchers employed a NASA-TLX questionnaire. The NASA-TLX ranks the mental demand, physical demand, temporal demand, performance, effort and frustration associated with a task on a −10 to 10 scale. For this task, all categories average between −5 and −8, indicating that the participants found the task to be relatively easy to complete and reported that it does not require high cognitive workload. This further confirms that the participants were fully capable of completing this task with relative ease.
4.4. Potential Implications
Based on the strengths and weaknesses of AR when applied for field verification, the findings of this work suggest two ways for using AR in the QA/QC process: (1) for quick checks throughout the construction process and (2) as a complement to using laser scanners.
4.4.1. AR for Quick Field Checks
In the first scenario, AR can be used as a tool to check that all construction is complete before moving on to another construction task. AR enables individuals to effectively identify missing items and items with large deviations, which makes it well-suited for conducting quick checks throughout construction, especially to check that all systems are installed or that building elements are within previously negotiated spatial constraints. This further leverages the comparatively faster process of checking the built environment to the virtual model through AR, rather than relying on typically slower Scan-to-BIM technologies. For example, a foreman using AR can check that all electrical conduits are correctly placed below grade level before pouring concrete for the slab on grade. When deviations are observed, the foreman will be able to make a judgement as to whether the model needs to be changed using appropriate methods, or the area needs rework to more closely match the model.
4.4.2. AR to Guide Laser Scanning
The second scenario suggested by the results of this paper is using AR as a tool to determine where it may be worthwhile to use laser scanning for deviation detection in the built facility. Instead of laser scanning the entire building to detect deviations, which can be data- and time-intensive [80], the construction team may be able to use AR to quickly identify locations in the building where some deviations may be present by comparing the model to the built environment using AR. As observed in the results of this paper, accurate descriptions of why or how the space deviates from BIM can be prone to errors. Fortunately, in this suggested approach to using AR, accurate descriptions of deviations are inconsequential. Instead, what matters is the fact that users can quickly identify whether something appears to be different in the built space. In this type of instance, subsequent laser scanning can help to resolve the reasons for the discrepancies. This type of use may offer value by reducing the number of spaces that teams elect to laser scan, which may reduce scanning and processing times required for the project. It is worth noting that, depending on the size of the project and the amount of checking that is to be conducted at a given time, this approach could potentially require users to wear the AR device for extended periods of time. It is possible that this could lead to fatigue, but it is also possible that users would simply remove the head-mounted display when discussing areas after assessing them for deviations, which may mitigate this discomfort. Furthermore, if this mode of field verification is adopted by future practitioners, it is very likely that future generations of commercially available AR devices will continue to get lighter and more ergonomic, which may further reduce discomforts from their extended use.
4.5. Limitations
In this paper, the researchers set out to understand the performance and behaviors associated with the use of AR for deviation detection. The findings presented in this paper have several limitations, related to the study sample and technology maturity.
First of all, the participants in this study are graduate construction management students representing a wide range of relevant experience. In this study, no correlation between experience and performance was found, corroborating the findings of other research suggesting that performance using AR is not dependent on industry experience [27]. However, it is plausible that experienced professionals dedicated to QA/QC tasks may perform better when completing the same task. While this does offer a limitation in the extent to which the observed results may match those with practitioner participants, it is likely that the results observed in this work are actually conservative because of the comparatively lower experience possessed by the students.
Next, the approach requires an existing digital model with a level of detail commensurate with the desired level of inspection. Fortunately, content created through 3D coordination will support the workflow the authors used, and this is becoming a common application for BIM [81]. Therefore, as industry BIM efforts continue to expand, this limitation will become less of a hindrance to companies employing the strategies explored in this work.
The AR technology used also suffers from tracking and parallax problems, which have at times significantly increased setup time. For example, depending on the lighting conditions, the paper marker needed to be moved for the model to be accurately overlaid on top of the built environment. In larger sites, multiple markers, or automatic registration, may be needed if a marker-based system were to be used [23]. The authors aimed to determine what types of deviations could be detected through AR rather than the exact productivity of identifying these deviations, so this setup time was not considered in this analysis. However, the authors recognize that setup time could impact overall value provided by the technology if it were to be used on an active construction site with stringent time constraints. Fortunately, some commercially available software suites have been developed that claim to streamline the process of getting models onto AR headsets using plugins to popular BIM software applications (i.e., HoloLive, Fusor), but these were not tested through this work, so the authors do not make any performance claims about them. Additionally, automatic model registration in the augmented reality environment is a developing capability of AR and could potentially streamline the process [82]. For companies that are already beginning to use AR for inspections, the process of transferring model content from BIM environments to AR is likely a workflow that they are already performing, which may further reduce the added time required for setting up the devices for inspection.
5. Conclusions
This research studied the performance and behaviors of graduate student participants when using AR for deviation detection during QA/QC tasks. An open-ceiling hallway with complex MEP systems was modeled, and four deviations were introduced: two large deviations (greater than two inches), one small deviation (less than two inches) and one missing building element. Using an AR headset, each participant compared the modified model to the real environment and attempted to identify the deviations.
In general, when using AR, participants were able to identify all three types of deviations, however, they were significantly more likely to identify larger deviations than smaller ones. In most cases, the participants were also able to correctly identify the cause of the deviation, although some identified the missing component as a large deviation. The participants also identified several false positive observations, in which the participant incorrectly assumed there was a deviation, but in fact, there was not.
To capitalize on the strengths of the AR technology, the findings of this work led the researchers to propose two high-potential use-cases: (1) using AR as a quick construction monitoring and progression tool, to check that all building components are installed before continuing to other activities (i.e., checking that all electrical sleeves are installed before pouring concrete), and (2) using AR as a tool to guide what areas should be laser-scanned, thus reducing the total scanning and data processing times required for the project. The advantage of using head-mounted AR in these situations is in the provision of a clear visual reference that is hands-free and does not require an inspector to juggle paper plans or desktop or handheld technologies when comparing as-built conditions with a model. The findings of this paper contribute to the body of knowledge by providing evidence of how current generation AR may enable (or fail to enable) effective detection of deviations between BIM and as-built conditions. Furthermore, the suggested AR inspection use-cases identified will allow future researchers and practitioners to define inspection strategies based on empirical evidence in order to conduct field verification tasks more effectively.
Author Contributions
Conceptualization, S.K.A. and J.C.; methodology, J.C.; software, J.C.; validation, S.K.A. and J.C.; formal analysis, J.C.; investigation, J.C.; resources, S.K.A.; data curation, J.C.; writing—original draft preparation, J.C.; writing—review and editing, S.K.A. and K.H.M.; visualization, J.C. and K.H.M.; supervision, S.K.A.; project administration, S.K.A.; funding acquisition, S.K.A. All authors have read and agreed to the published version of the manuscript.
Funding
This material is based upon work supported by the National Science Foundation under Grant No. IIS-1566274.
Institutional Review Board Statement
The study was conducted according to the guidelines of the Declaration of Helsinki, and approved by the Institutional Review Board of Arizona State University (STUDY00002890; Approved: 24 August 2015).
Informed Consent Statement
Informed consent was obtained from all subjects involved in the study.
Data Availability Statement
The data presented in this study are available in a non-personally-identifiable format on request from the corresponding author.
Acknowledgments
The researchers would like to thank Rosendin Electric for participating in this research. This work would not have been possible without their support. The researchers would like to thank Fred Meeske, Mark Vyne and Jose Samaniego for their input and support throughout the preparation and testing processes.
Conflicts of Interest
The authors declare no conflict of interest. The funders had no role in the design of the study; in the collection, analyses, or interpretation of data; in the writing of the manuscript, or in the decision to publish the results.
References
- Lin, Y.C.; Lin, C.P.; Hu, H.T.; Su, Y.C. Developing final as-built BIM model management system for owners during project closeout: A case study. Adv. Eng. Inform. 2018, 36, 178–193. [Google Scholar] [CrossRef]
- Gallaher, M.P.; O’Conor, A.C.; Dettbarn, J.L.; Gilday, L.T. Cost Analysis of Inadequate Interoperability in the U.S. Capital Facilities Industry; Grant/Contract Reports 04-867; National Institute of Standards and Technology: Gaithersburg, MD, USA, 2004; pp. 1–210. [Google Scholar] [CrossRef]
- McGraw-Hill Construction. The Business Value of BIM for Construction in Major Global Markets: How Contractors around the World are Driving Innovation with Building Information Modeling. 2014. Available online: http://static-dc.autodesk.net/content/dam/autodesk/www/solutions/building-information-modeling/construction/business-value-of-bim-for-construction-in-global-markets.pdf (accessed on 9 February 2021).
- Moreno, C.; Olbina, S.; Issa, R.R. BIM Use by Architecture, Engineering, and Construction (AEC) Industry in Educational Facility Projects. Adv. Civ. Eng. 2019, 2019, 1–19. [Google Scholar] [CrossRef]
- Jang, R.; Collinge, W. Improving BIM asset and facilities management processes: A Mechanical and Electrical (M&E) contractor perspective. J. Build. Eng. 2020, 32, 101540. [Google Scholar]
- Dixit, M.K.; Venkatraj, V.; Ostadalimakhmalbaf, M.; Pariafsai, F.; Lavy, S. Integration of facility management and building information modeling (BIM). Facilities 2019, 37, 455–483. [Google Scholar] [CrossRef]
- Matarneh, S.T.; Danso-Amoako, M.; Al-Bizri, S.; Gaterell, M.; Matarneh, R. Building information modeling for facilities management: A literature review and future research directions. J. Build. Eng. 2019, 24, 100755. [Google Scholar] [CrossRef] [Green Version]
- Love, P.E.; Simpson, I.; Hill, A.; Standing, C. From justification to evaluation: Building information modeling for asset owners. Autom. Constr. 2013, 35, 208–216. [Google Scholar] [CrossRef]
- Love, P.E.; Matthews, J.; Simpson, I.; Hill, A.; Olatunji, O.A. A benefits realization management building information modeling framework for asset owners. Autom. Constr. 2014, 37, 1–10. [Google Scholar] [CrossRef]
- Evjen, T.Å.; Hosseini Raviz, S.R.; Petersen, S.A.; Krogstie, J. Smart Facility Management: Future Healthcare Organization through Indoor Positioning Systems in the Light of Enterprise BIM. Smart Cities 2020, 3, 40. [Google Scholar] [CrossRef]
- Kang, T.W.; Hong, C.H. A study on software architecture for effective BIM/GIS-based facility management data integration. Autom. Constr. 2015, 54, 25–38. [Google Scholar] [CrossRef]
- Mayo, G.; Issa, R.R. Processes and standards for BIM closeout information deliverables for owners. In Proceedings of the 2014 international Conference on Computing in Civil and Building Engineering, Orlando, FL, USA, 23–25 June 2014; pp. 673–680. [Google Scholar] [CrossRef]
- Klein, L.; Li, N.; Becerik-Gerber, B. Imaged-based verification of as-built documentation of operational buildings. Autom. Constr. 2012, 21, 161–171. [Google Scholar] [CrossRef]
- Boukamp, F.; Akinci, B. Automated processing of construction specifications to support inspection and quality control. Autom. Constr. 2007, 17, 90–106. [Google Scholar] [CrossRef]
- Cho, Y.K.; Haas, C.T.; Liapi, K.; Sreenivasan, S.V. A framework for rapid local area modeling for construction automation. Autom. Constr. 2002, 11, 629–641. [Google Scholar] [CrossRef]
- Azuma, R.T. A survey of augmented reality. Presence Teleoperators Virtual Environ. 1997, 6, 355–385. [Google Scholar] [CrossRef]
- Chalhoub, J.; Ayer, S.K. Using Mixed Reality for electrical construction design communication. Autom. Constr. 2018, 86, 1–10. [Google Scholar] [CrossRef]
- Carozza, L.; Tingdahl, D.; Bosché, F.; Van Gool, L. Markerless vision-based augmented reality for urban planning. Comput. Aided Civ. Infrastruct. Eng. 2014, 29, 2–17. [Google Scholar] [CrossRef]
- Zollmann, S.; Hoppe, C.; Kluckner, S.; Poglitsch, C.; Bischof, H.; Reitmayr, G. Augmented reality for construction site monitoring and documentation. Proc. IEEE 2014, 102, 137–154. [Google Scholar] [CrossRef]
- Rankohi, S.; Waugh, L. Review and analysis of augmented reality literature for construction industry. Vis. Eng. 2013, 1, 1–8. [Google Scholar] [CrossRef] [Green Version]
- Ahmed, S. A review on using opportunities of augmented reality and virtual reality in construction project management. Organ. Technol. Manag. Constr. An Int. J. 2018, 10, 1839–1852. [Google Scholar] [CrossRef] [Green Version]
- Zhou, Y.; Luo, H.; Yang, Y. Implementation of augmented reality for segment displacement inspection during tunneling construction. Autom. Constr. 2017, 82, 112–121. [Google Scholar] [CrossRef]
- Choi, J.; Son, M.G.; Lee, Y.Y.; Lee, K.H.; Park, J.P.; Yeo, C.H.; Park, J.; Choi, S.; Kim, W.D.; Kang, T.W.; et al. Position-based augmented reality platform for aiding construction and inspection of offshore plants. Vis. Comput. 2020, 36, 2039–2049. [Google Scholar] [CrossRef]
- Dunston, P.S. Technology development needs for advancing augmented reality-based inspection. Autom. Constr. 2010, 19, 169–182. [Google Scholar] [CrossRef]
- Cory, C.A. Utilization of 2D, 3D, or 4D CAD in construction communication documentation. In Proceedings of the Fifth International Conference on Information Visualisation, London, UK, 25–27 July 2001; pp. 219–224. [Google Scholar] [CrossRef]
- Carvajal, A. Quantitative comparison between the use of 3D vs 2D visualization tools to present building design proposals to non-spatial skilled end users. In Proceedings of the Ninth International Conference on Information Visualisation (IV’05), London, UK, 6–8 July 2005; pp. 291–294. [Google Scholar] [CrossRef]
- Wu, W.; Hartless, J.; Tesei, A.; Gunji, V.; Ayer, S.; London, J. Design assessment in virtual and mixed reality environments: Comparison of novices and experts. J. Constr. Eng. Manag. 2019, 145, 04019049. [Google Scholar] [CrossRef]
- National Institute of Building Sciences (NIBS). Frequently Asked Questions about the National BIM Standard-United States. 2014. Available online: https://www.nationalbimstandard.org/faqs (accessed on 24 July 2017).
- Vanlande, R.; Nicolle, C.; Cruz, C. IFC and building lifecycle management. Autom. Constr. 2008, 18, 70–78. [Google Scholar] [CrossRef] [Green Version]
- Mallepudi, S.A.; Calix, R.A.; Knapp, G.M. Material classification and automatic content enrichment of images using supervised learning and knowledge bases. In Multimedia on Mobile Devices 2011; and Multimedia Content Access: Algorithms and Systems V; Proceedings of the IS&T/SPIE Electronic Imaging, San Francisco, CA, USA, 11 February 2011; International Society for Optics and Photonics: Bellingham, WA, USA, 2011; Volume 7881, p. 788113. [Google Scholar] [CrossRef]
- Bansal, V.K. Use of GIS and topology in the identification and resolution of space conflicts. J. Comput. Civ. Eng. 2011, 25, 159–171. [Google Scholar] [CrossRef]
- Motamedi, A.; Hammad, A. Lifecycle management of facilities components using radio frequency identification and building information model. J. Inf. Technol. Constr. (ITCON) 2009, 14, 238–262. Available online: http://itcon.org/data/works/att/2009_18.content.01307.pdf (accessed on 22 February 2021).
- Messner, J.; Anumba, C.; Dubler, C.; Goodman, S.; Kasprzak, C.; Kreider, R.; Leicht, R.; Saluja, C.; Zikic, N. BIM Project Execution Planning Guide—Version 2.2; Computer Integrated Construction Research Program, Pennsylvania State University: State College, PA, USA, 2011; pp. 1–135. ISBN 978-1-62307-006-9. [Google Scholar]
- Cooperative Research Centre for Construction Innovation (CRCCI); Icon.Net Pty Ltd. Adopting BIM for Facilities Management: Solutions for Managing the Sydney Opera House; Cooperative Research Centre for Construction Innovation: Brisbane, QLD, Australia, 2007; pp. 1–17. [Google Scholar]
- Viklund Tallgren, M.; Roupé, M.; Johansson, M. BIM-tool development enhancing collaborative scheduling for pre-construction. J. Inf. Technol. Constr. (ITcon) 2020, 25, 374–397. [Google Scholar]
- Tahir, M.M.; Haron, N.A.; Alias, A.H.; Harun, A.N.; Muhammad, I.B.; Baba, D.L. Improving Cost and Time Control in Construction Using Building Information Model (BIM): A Review. Pertanika J. Sci. Technol. 2018, 26, 21–36. [Google Scholar]
- Lato, M.; Kemeny, J.; Harrap, R.M.; Bevan, G. Rock bench: Establishing a common repository and standards for assessing rockmass characteristics using LiDAR and photogrammetry. Comput. Geosci. 2013, 50, 106–114. [Google Scholar] [CrossRef]
- Brilakis, I.; Fathi, H.; Rashidi, A. Progressive 3D reconstruction of infrastructure with videogrammetry. Autom. Constr. 2011, 20, 884–895. [Google Scholar] [CrossRef]
- Moon, D.; Chung, S.; Kwon, S.; Seo, J.; Shin, J. Comparison and utilization of point cloud generated from photogrammetry and laser scanning: 3D world model for smart heavy equipment planning. Autom. Constr. 2019, 98, 322–331. [Google Scholar] [CrossRef]
- Bosché, F.; Ahmed, M.; Turkan, Y.; Haas, C.T.; Haas, R. The value of integrating Scan-to-BIM and Scan-vs-BIM techniques for construction monitoring using laser scanning and BIM: The case of cylindrical MEP components. Autom. Constr. 2015, 49, 201–213. [Google Scholar] [CrossRef]
- Zhu, Z.; Brilakis, I. Comparison of optical sensor-based spatial data collection techniques for civil infrastructure modeling. J. Comput. Civ. Eng. 2009, 23, 170–177. [Google Scholar] [CrossRef]
- Memon, Z.A.; Majid, M.Z.; Mustaffar, M. An automatic project progress monitoring model by integrating auto CAD and digital photos. In Proceedings of the 2005 ASCE International Conference on Computing in Civil Engineering, Cancun, Mexico, 12–15 July 2005; pp. 1–13. [Google Scholar] [CrossRef]
- Rodriguez-Gonzalvez, P.; Gonzalez-Aguilera, D.; Lopez-Jimenez, G.; Picon-Cabrera, I. Image-based modeling of built environment from an unmanned aerial system. Autom. Constr. 2014, 48, 44–52. [Google Scholar] [CrossRef]
- Lee, J.Y.; Kwon, O.S.; Choi, J.S.; Park, C.S. A study on construction defect management using augmented reality technology. In Proceedings of the 2012 International Conference on Information Science and Applications, Suwon, Korea, 23–25 May 2012; pp. 1–6. Available online: http://0-ieeexplore-ieee-org.brum.beds.ac.uk/abstract/document/6220933/ (accessed on 4 August 2017).
- Jadidi, H.; Ravanshadnia, M.; Hosseinalipour, M.; Rahmani, F. A step-by-step construction site photography procedure to enhance the efficiency of as-built data visualization: A case study. Vis. Eng. 2015, 3, 1–2. [Google Scholar] [CrossRef] [Green Version]
- Oats, R.C.; Escobar-Wolf, R.; Oommen, T. Evaluation of photogrammetry and inclusion of control points: Significance for infrastructure monitoring. Data 2019, 4, 42. [Google Scholar] [CrossRef] [Green Version]
- Wasenmüller, O.; Meyer, M.; Stricker, D. Augmented reality 3d discrepancy check in industrial applications. In Proceedings of the 2016 IEEE International Symposium on Mixed and Augmented Reality (ISMAR), Merida, Mexico, 19–23 September 2016; pp. 125–134. [Google Scholar] [CrossRef]
- Kahn, S.; Wuest, H.; Stricker, D.; Fellner, D.W. 3d discrepancy check via augmented reality. In Proceedings of the 2010 IEEE International Symposium on Mixed and Augmented Reality, Seoul, Korea, 13–16 October 2010; pp. 241–242. [Google Scholar] [CrossRef]
- Kahn, S.; Bockholt, U.; Kuijper, A.; Fellner, D.W. Towards precise real-time 3D difference detection for industrial applications. Comput. Ind. 2013, 64, 1115–1128. [Google Scholar] [CrossRef]
- Jaselskis, E.J.; Gao, Z.; Walters, R.C. Improving transportation projects using laser scanning. J. Constr. Eng. Manag. 2005, 131, 377–384. [Google Scholar] [CrossRef]
- Wang, C.; Cho, Y.K.; Kim, C. Automatic BIM component extraction from point clouds of existing buildings for sustainability applications. Autom. Constr. 2015, 56, 1–3. [Google Scholar] [CrossRef]
- Ahmed, M.F.; Haas, C.T.; Haas, R. Automatic detection of cylindrical objects in built facilities. J. Comput. Civ. Eng. 2014, 28, 04014009. [Google Scholar] [CrossRef]
- Pătrăucean, V.; Armeni, I.; Nahangi, M.; Yeung, J.; Brilakis, I.; Haas, C. State of research in automatic as-built modelling. Adv. Eng. Inform. 2015, 29, 162–171. [Google Scholar] [CrossRef] [Green Version]
- Tang, P.; Akinci, B. Extracting surveying goals from point clouds to support construction and infrastructure inspection. In Proceedings of the Construction Research Congress 2009: Building a Sustainable Future, Seattle, WA, USA, 5–7 April 2009; pp. 1164–1173. [Google Scholar] [CrossRef]
- Becerik-Gerber, B.; Jazizadeh, F.; Kavulya, G.; Calis, G. Assessment of target types and layouts in 3D laser scanning for registration accuracy. Autom. Constr. 2011, 20, 649–658. [Google Scholar] [CrossRef]
- Guo, J.; Yuan, L.; Wang, Q. Time and cost analysis of geometric quality assessment of structural columns based on 3D terrestrial laser scanning. Autom. Constr. 2020, 110, 103014. [Google Scholar] [CrossRef]
- Golparvar-Fard, M.; Bohn, J.; Teizer, J.; Savarese, S.; Peña-Mora, F. Evaluation of image-based modeling and laser scanning accuracy for emerging automated performance monitoring techniques. Autom. Constr. 2011, 20, 1143–1155. [Google Scholar] [CrossRef]
- Son, H.; Bosché, F.; Kim, C. As-built data acquisition and its use in production monitoring and automated layout of civil infrastructure: A survey. Adv. Eng. Inform. 2015, 29, 172–183. [Google Scholar] [CrossRef]
- Bosché, F.; Guillemet, A.; Turkan, Y.; Haas, C.T.; Haas, R. Tracking the built status of MEP works: Assessing the value of a Scan-vs-BIM system. J. Comput. Civ. Eng. 2014, 28, 05014004. [Google Scholar] [CrossRef] [Green Version]
- Milgram, P.; Kishino, F. A Taxonomy of Mixed Reality Visual Displays. IEICE Trans. Inf. Syst. 1994, E77-D, 1321–1329. Available online: https://search.ieice.org/bin/summary.php?id=e77-d_12_1321 (accessed on 26 June 2017).
- Delgado JM, D.; Oyedele, L.; Demian, P.; Beach, T. A research agenda for augmented and virtual reality in architecture, engineering and construction. Adv. Eng. Inform. 2020, 45, 101122. [Google Scholar] [CrossRef]
- Delgado JM, D.; Oyedele, L.; Beach, T.; Demian, P. Augmented and virtual reality in construction: Drivers and limitations for industry adoption. J. Constr. Eng. Manag. 2020, 146, 04020079. [Google Scholar] [CrossRef]
- Chi, H.L.; Kang, S.C.; Wang, X. Research trends and opportunities of augmented reality applications in architecture, engineering, and construction. Autom. Constr. 2013, 33, 116–122. [Google Scholar] [CrossRef]
- Shin, D.H.; Dunston, P.S. Identification of application areas for Augmented Reality in industrial construction based on technology suitability. Autom. Constr. 2008, 17, 882–894. [Google Scholar] [CrossRef]
- Yabuki, N.; Miyashita, K.; Fukuda, T. An invisible height evaluation system for building height regulation to preserve good landscapes using augmented reality. Autom. Constr. 2011, 20, 228–235. [Google Scholar] [CrossRef]
- Zhang, L.; Chen, S.; Dong, H.; El Saddik, A. Visualizing Toronto City Data with HoloLens: Using Augmented Reality for a City Model. IEEE Consum. Electron. Mag. 2018, 7, 73–80. [Google Scholar] [CrossRef]
- Lee, S.; Akin, Ö. Augmented reality-based computational fieldwork support for equipment operations and maintenance. Autom. Constr. 2011, 20, 338–352. Available online: http://0-www-sciencedirect-com.brum.beds.ac.uk/science/article/pii/S0926580510001834 (accessed on 24 July 2017). [CrossRef]
- Olbrich, M.; Wuest, H.; Riess, P.; Bockholt, U. Augmented reality pipe layout planning in the shipbuilding industry. In Proceedings of the 2011 10th IEEE International Symposium on Mixed and Augmented Reality, Basel, Switzerland, 26–29 October 2011; pp. 269–270. [Google Scholar] [CrossRef]
- Webel, S.; Becker, M.; Stricker, D.; Wuest, H. Identifying differences between cad and physical mock-ups using ar. In Proceedings of the 6th IEEE and ACM International Symposium on Mixed and Augmented Reality, Nara, Japan, 13–16 November 2007; pp. 281–282. [Google Scholar] [CrossRef]
- Kwon, O.; Park, C.; Lim, C. A defect management system for reinforced concrete work utilizing BIM, image-matching and augmented reality. Autom. Constr. 2014, 46, 74–81. Available online: http://0-www-sciencedirect-com.brum.beds.ac.uk/science/article/pii/S0926580514001162 (accessed on 8 August 2017). [CrossRef]
- Dunston, P. Evaluation of augmented reality in steel column inspection. Autom. Constr. 2009, 18, 118–129. Available online: http://0-www-sciencedirect-com.brum.beds.ac.uk/science/article/pii/S092658050800085X (accessed on 4 August 2017).
- Abbas, A.; Seo, J.; Kim, M. Impact of Mobile Augmented Reality System on Cognitive Behavior and Performance during Rebar Inspection Tasks. J. Comput. Civ. Eng. 2020, 34, 04020050. [Google Scholar] [CrossRef]
- Georgel, P.; Schroeder, P.; Benhimane, S.; Hinterstoisser, S.; Appel, M.; Navab, N. An industrial augmented reality solution for discrepancy check. In Proceedings of the 6th IEEE and ACM International Symposium on Mixed and Augmented Reality, Nara, Japan, 13–16 November 2007. [Google Scholar] [CrossRef]
- Langer, M.; Benhimane, S. An Interactive Vision-based 3D Reconstruction Workflow for Industrial AR Applications. In Proceedings of the International Symposium on Mixed and Augmented Reality, Seoul, Korea, 13–16 October 2010; pp. 1–4. Available online: http://citeseerx.ist.psu.edu/viewdoc/download?doi=10.1.1.464.6099&rep=rep1&type=pdf (accessed on 17 May 2018).
- Kopsida, M.; Brilakis, I. BIM registration methods for mobile augmented reality-based inspection. In Proceedings of the EWork Ebus Archit Eng Constr—Proc 11th Eur Conf Prod Process Model ECPPM 2016, Limassol, Cyprus, 7–9 September 2016; pp. 201–208. Available online: https://0-www-scopus-com.brum.beds.ac.uk/inward/record.uri?eid=2-s2.0-85016585286&partnerID=40&md5=b0b0940b3127226a6e14250c1edb7b12 (accessed on 22 February 2021).
- Arvizio, L.D.A.R. Photogrammetry, BIM and CAD Model Streaming from Edge and Cloud. 2020. Available online: https://www.arvizio.io/2020/07/14/arvizio-launches-augmented-reality-hybrid-rendering-for-iphone-ipad-and-android-lidar-photogrammetry-bim-and-cad-model-streaming-from-edge-and-cloud/ (accessed on 9 February 2021).
- VisualLive. Augmented Reality for Construction: How It Works—Step by Step. 2020. Available online: https://visuallive.com/ (accessed on 9 February 2021).
- Joe, J.; Chaudhuri, S.; Le, T.; Thompson, H.; Demiris, G. The use of think-aloud and instant data analysis in evaluation research: Exemplar and lessons learned. J. Biomed. Inform. 2015, 56, 284–291. [Google Scholar] [CrossRef] [Green Version]
- Hart, S.G.; Staveland, L.E. Development of NASA-TLX (Task Load Index): Results of Empirical and Theoretical Research. Adv. Psychol. 1988, 52, 139–183. [Google Scholar] [CrossRef]
- Remondino, F.; Guarnieri, A.; Vettore, A. 3D modeling of close-range objects: Photogrammetry or laser scanning? In Proceedings of the Electronic Imaging 2005, San Jose, CA, USA, 17 January 2005; Volume 216. [CrossRef] [Green Version]
- McGraw Hill, C. The Business Value of BIM in North America: Multi-Year Trend Analysis and User Ratings (2007–2012). SmartMarket Rep. 2012. Available online: https://damassets.autodesk.net/content/dam/autodesk/www/solutions/building-information-modeling/bim-value/mhc-business-value-of-bim-in-north-america.pdf (accessed on 22 February 2021).
- Lepetit, V.; Vacchetti, L.; Thalmann, D.; Fua, P. Fully automated and stable registration for augmented reality applications. In Proceedings of the Second IEEE and ACM International Symposium on Mixed and Augmented Reality, Tokyo, Japan, 10 October 2003; pp. 93–102. [Google Scholar] [CrossRef] [Green Version]
Figure 1.
(a) Photograph of the built environment, (b) laser scan, and (c) resultant model. Approximate test area physical dimensions are 5 ft. wide by 25 ft. long.
Figure 1.
(a) Photograph of the built environment, (b) laser scan, and (c) resultant model. Approximate test area physical dimensions are 5 ft. wide by 25 ft. long.

Figure 2.
(a) Large Deviation 1, (b) Large Deviation 2, (c) Missing Element, and (d) Small Deviation.
Figure 2.
(a) Large Deviation 1, (b) Large Deviation 2, (c) Missing Element, and (d) Small Deviation.

Figure 3.
Colored model used for the augmented reality (AR) environment.


Table 1.
The model deviations and descriptions.
| Deviation Name | Description |
|---|---|
| Large Deviation 1 | Variable Air Valve (VAV) box shifted by eighteen inches, overlapping with built box. |
| Large Deviation 2 | Electrical conduit shifted by a foot to the South, not overlapping with built conduit. |
| Missing Element | Electrical conduit added to the model, not built. |
| Small Deviation | Electrical conduit has been shifted to the East by two inches. |
Table 2.
Cross-tabulation of participants’ years of construction experience and quality control experience.
Table 2.
Cross-tabulation of participants’ years of construction experience and quality control experience.
| Years of Construction | Has QA/QC Experience | Has No QA/QC Experience | Total |
|---|---|---|---|
| No Experience | 15% (n = 4) | 0% | 15% (n = 4) |
| Less than 1 year | 0% | 4% (n = 1) | 4% (n = 1) |
| Between 1 and 5 years | 41% (n = 11) | 22% (n = 6) | 63% (n = 17) |
| Between 5 and 10 years | 0% | 7% (n = 2) | 7% (n = 2) |
| More than 10 years | 4% (n = 1) | 7% (n = 2) | 11% (n = 3) |
| Total | 60% (n = 16) | 40% (n = 11) | 100% (n = 27) |
Table 3.
Detection and identification rates of deviations.
| Deviation | % Correct Identification | % Correct Classification |
|---|---|---|
| Small Deviation | 41% | 41% |
| Large Deviation 1 | 96% | 96% |
| Large Deviation 2 | 96% | 84% |
| Missing Element | 74% | 59% |
Table 4.
Frequency of false positive identifications.
| Number of False Positive(s) Identified | Percentage of Participants |
|---|---|
| 0 | 60% (n = 16) |
| 1 | 33% (n = 9) |
| 2 | 7% (n = 2) |
Table 5.
Participant perceptions of ease of deviation identification by deviation type.
| Question | Strongly Disagree | Disagree | Agree | Strongly Agree | Total |
|---|---|---|---|---|---|
| Small Deviations (less than 3 inches) are easy to identify using augmented reality. | 7% (n = 2) | 26% (n = 7) | 33% (n = 9) | 33% (n = 9) | 27 |
| Large Deviations (larger than 3 inches) are easy to identify using augmented reality. | 0% (n = 0) | 0% (n = 0) | 22% (n = 6) | 78% (n = 21) | 27 |
| Missing elements are easy to identify using augmented reality. | 0% (n = 0) | 7% (n = 2) | 33% (n = 9) | 59% (n = 16) | 27 |
Publisher’s Note: MDPI stays neutral with regard to jurisdictional claims in published maps and institutional affiliations. |
© 2021 by the authors. Licensee MDPI, Basel, Switzerland. This article is an open access article distributed under the terms and conditions of the Creative Commons Attribution (CC BY) license (http://creativecommons.org/licenses/by/4.0/).
Share and Cite
MDPI and ACS Style
Chalhoub, J.; Ayer, S.K.; McCord, K.H. Augmented Reality to Enable Users to Identify Deviations for Model Reconciliation. Buildings 2021, 11, 77. https://0-doi-org.brum.beds.ac.uk/10.3390/buildings11020077
AMA Style
Chalhoub J, Ayer SK, McCord KH. Augmented Reality to Enable Users to Identify Deviations for Model Reconciliation. Buildings. 2021; 11(2):77. https://0-doi-org.brum.beds.ac.uk/10.3390/buildings11020077
Chicago/Turabian StyleChalhoub, Jad, Steven K. Ayer, and Kieren H. McCord. 2021. "Augmented Reality to Enable Users to Identify Deviations for Model Reconciliation" Buildings 11, no. 2: 77. https://0-doi-org.brum.beds.ac.uk/10.3390/buildings11020077
Note that from the first issue of 2016, this journal uses article numbers instead of page numbers. See further details here.