
Study on the Corroded Hollow Section RC Columns Strengthened by ICCP-SS System


1
Department of Civil Engineering, Zhejiang University, Hangzhou 310058, China
2
Guangdong Province Key Laboratory of Durability for Marine Civil Engineering, School of Civil Engineering, Shenzhen University, Shenzhen 518060, China
*
Authors to whom correspondence should be addressed.
Buildings 2021, 11(5), 197; https://0-doi-org.brum.beds.ac.uk/10.3390/buildings11050197
Submission received: 27 March 2021
/
Revised: 26 April 2021
/
Accepted: 6 May 2021
/
Published: 8 May 2021
Abstract
:In this paper, the behavior of corroded hollow section RC (reinforced concrete) columns strengthened by an Impressed Current Cathodic Protection and Structural Strengthening (ICCP-SS) system was investigated. The Carbon Fabric-Reinforced Cementitious Matrix (C-FRCM) composite serves dual functions in the intervention method. The axial compression behavior of strengthened columns was firstly investigated through axial compression tests. The influence of corrosion ratio and C-FRCM strengthening on the test results, such as failure mode, load–displacement curve, ultimate load, and ultimate strain, were analyzed. Test results showed that the ultimate load of the corroded specimens could be enhanced significantly by C-FRCM, and the ductility of the strengthened specimens was larger than the specimens without strengthening, especially for the specimens with higher corrosion ratios. Secondly, the effects of the ICCP-SS system on the migration and distribution laws of chloride ions (Cl−) in hollow section RC columns were analyzed by the potentiometric titration method. The main parameters include charging time, current density, and salt addition. Results showed that the rebar would have a certain blocking effect on the migration of Cl−, which resulted in that the content of Cl− in the inner side of the rebar was always larger than that of the outer side; and research results also showed that the increase of impressed current density and charge time would reduce the Cl− content on both sides of the rebar, while the impressed current would cause the Cl− near the rebars to constantly move toward the vicinity of CFRP.
1. Introduction
The hollow section reinforced concrete (RC) columns have the advantages of better seismic performance, larger moment of inertia, lighter weight, and higher material efficiency compared with compact section RC columns. Both their structural and economic benefits have led them to be widely used in electric transmission poles, bridge piers, and other structures [1,2]. When hollow section RC columns are used in coastal areas, the corrosion of rebars caused by chloride ingression is inevitable, and a protective solution must be chosen [3]. For durability problems in RC structures, Impressed Current Cathodic Protection (ICCP) and Structural Strengthening (SS) are commonly used methods for protection. However, both methods have their own disadvantages: ICCP technology is unable to make up for the bearing capacity loss caused by corrosion; while for SS, the corrosion of rebars is left uncontrolled and can lead to additional problems in the future. To solve both of these issues, a dual-functional intervention method, namely the ICCP-SS method, which combines the two technologies, has been proposed in previous research [4,5,6,7,8].
However, to achieve the goal of combining ICCP and SS, a suitable material must first be found that can be used both as the ICCP anode and structural reinforcement [4,5]. Research results provided by Zhu et al. [8] showed that CFRP can be used as a dual functional material for RC structures, serving as not only a strengthening material but also as an ICCP anode. Furthermore, the research results of Wei et al. [9] indicated that the CFRP could be bonded using an inorganic cementing material, instead of an organic adhesive material such as epoxy resin. This not only fulfilled the electric conductivity requirements of the ICCP method but also ensured good mechanical properties, as discussed by Wei et al. [9]. The resulting composite material that combines inorganic cementitious materials (cement paste, mortar, or concrete) and fiber-reinforced plastics (FRP) is called a Fabric-Reinforced Cementitious Matrix (FRCM) or Textile RC/Mortar (TRC/TRM) [9]. This FRCM can be utilized both as an auxiliary anode in ICCP and as a strengthening material in the SS technique to form the ICCP-SS system [4,5,6,7,8,9]. In engineering practice, the FRCM are bonded with the external surfaces of columns or the tensile regions of beams, and the CFRP in FRCM are connected with the positive pole while the rebars are connected with the negative pole of the external power supply; by doing this, the ICCP-SS system can be constructed in actual engineering [10]. Nowadays, the ICCP-SS system has been applied in the existing structures; for example, the ICCP-SS system was installed on one of the docks of China Merchants Port and the Guangzhou–Shenzhen highway in Guangdong province, China [10].
In recent years, some scholars [11,12,13,14,15,16] have studied and confirmed the effectiveness of FRCM in strengthening RC columns without the use of ICCP. Zhu and Su [4,5] studied the protective effect of an ICCP-SS system on solid section RC beams and RC columns under the corrosion of chlorine salt. Research results showed that the ICCP-SS system can not only delay the further corrosion of rebars but also improve the bearing capacity of the corroded members.
However, research on the axial compression properties of corroded hollow section RC columns, as mentioned above, strengthened by the ICCP-SS method has yet to be reported. Furthermore, unlike solid sections, hollow section RC columns have the additional risk of chloride ingression from the inner side of the concrete column wall. Therefore, the distribution of Cl− near the rebars under ICCP cathodic protection for hollow section RC columns must be investigated to determine the effectiveness of the protective system and its effect on structural performance. It should be noted that the technique of ICCP in this manuscript served as the cathodic protection (CP) rather than the electrochemical chloride extraction (ECE), because the current densities used in this paper were relatively small and the protection time of ICCP used in engineering practice was throughout the service life [17]. Hence, the primary purpose of the ICCP technique was to retain the potential of rebar in concrete more negative so as to prevent further corrosion, and the influence of electric field formed between the anode and cathode on the migration and distribution mechanism of Cl− were also investigated in this paper.
2. Experimental Section
For the FRCM confined corroded RC hollow columns, a total of 12 columns subjected to axial compression were tested in the structural laboratory of Shenzhen University. The tested columns had a hollow ratio ρ (ρ = d/D, where d and D are the inner and outer diameters of the hollow columns, respectively) of 0.53 and a height L of 1000 mm. The main purpose was to investigate the degree of protection that FRCM could provide for the corroded RC hollow columns when subject to varying corrosion ratios.
To investigate the migration and distribution laws of Cl− in the RC hollow columns under the protection of the ICCP-SS system, a further 12 RC hollow columns were tested. The tested columns had a hollow ratio ρ of 0.53 and a height L of 500 mm.
It should be noted that the longitudinal rabars and stirrups were deformed rebars and round rebars, respectively. The longitudinal rabars and stirrups were tied together, and the mill scale was scraped before casting concrete.
2.1. The FRCM Confined Corroded RC Hollow Columns under Axial Compression
2.1.1. Axial Compression Test Specimens
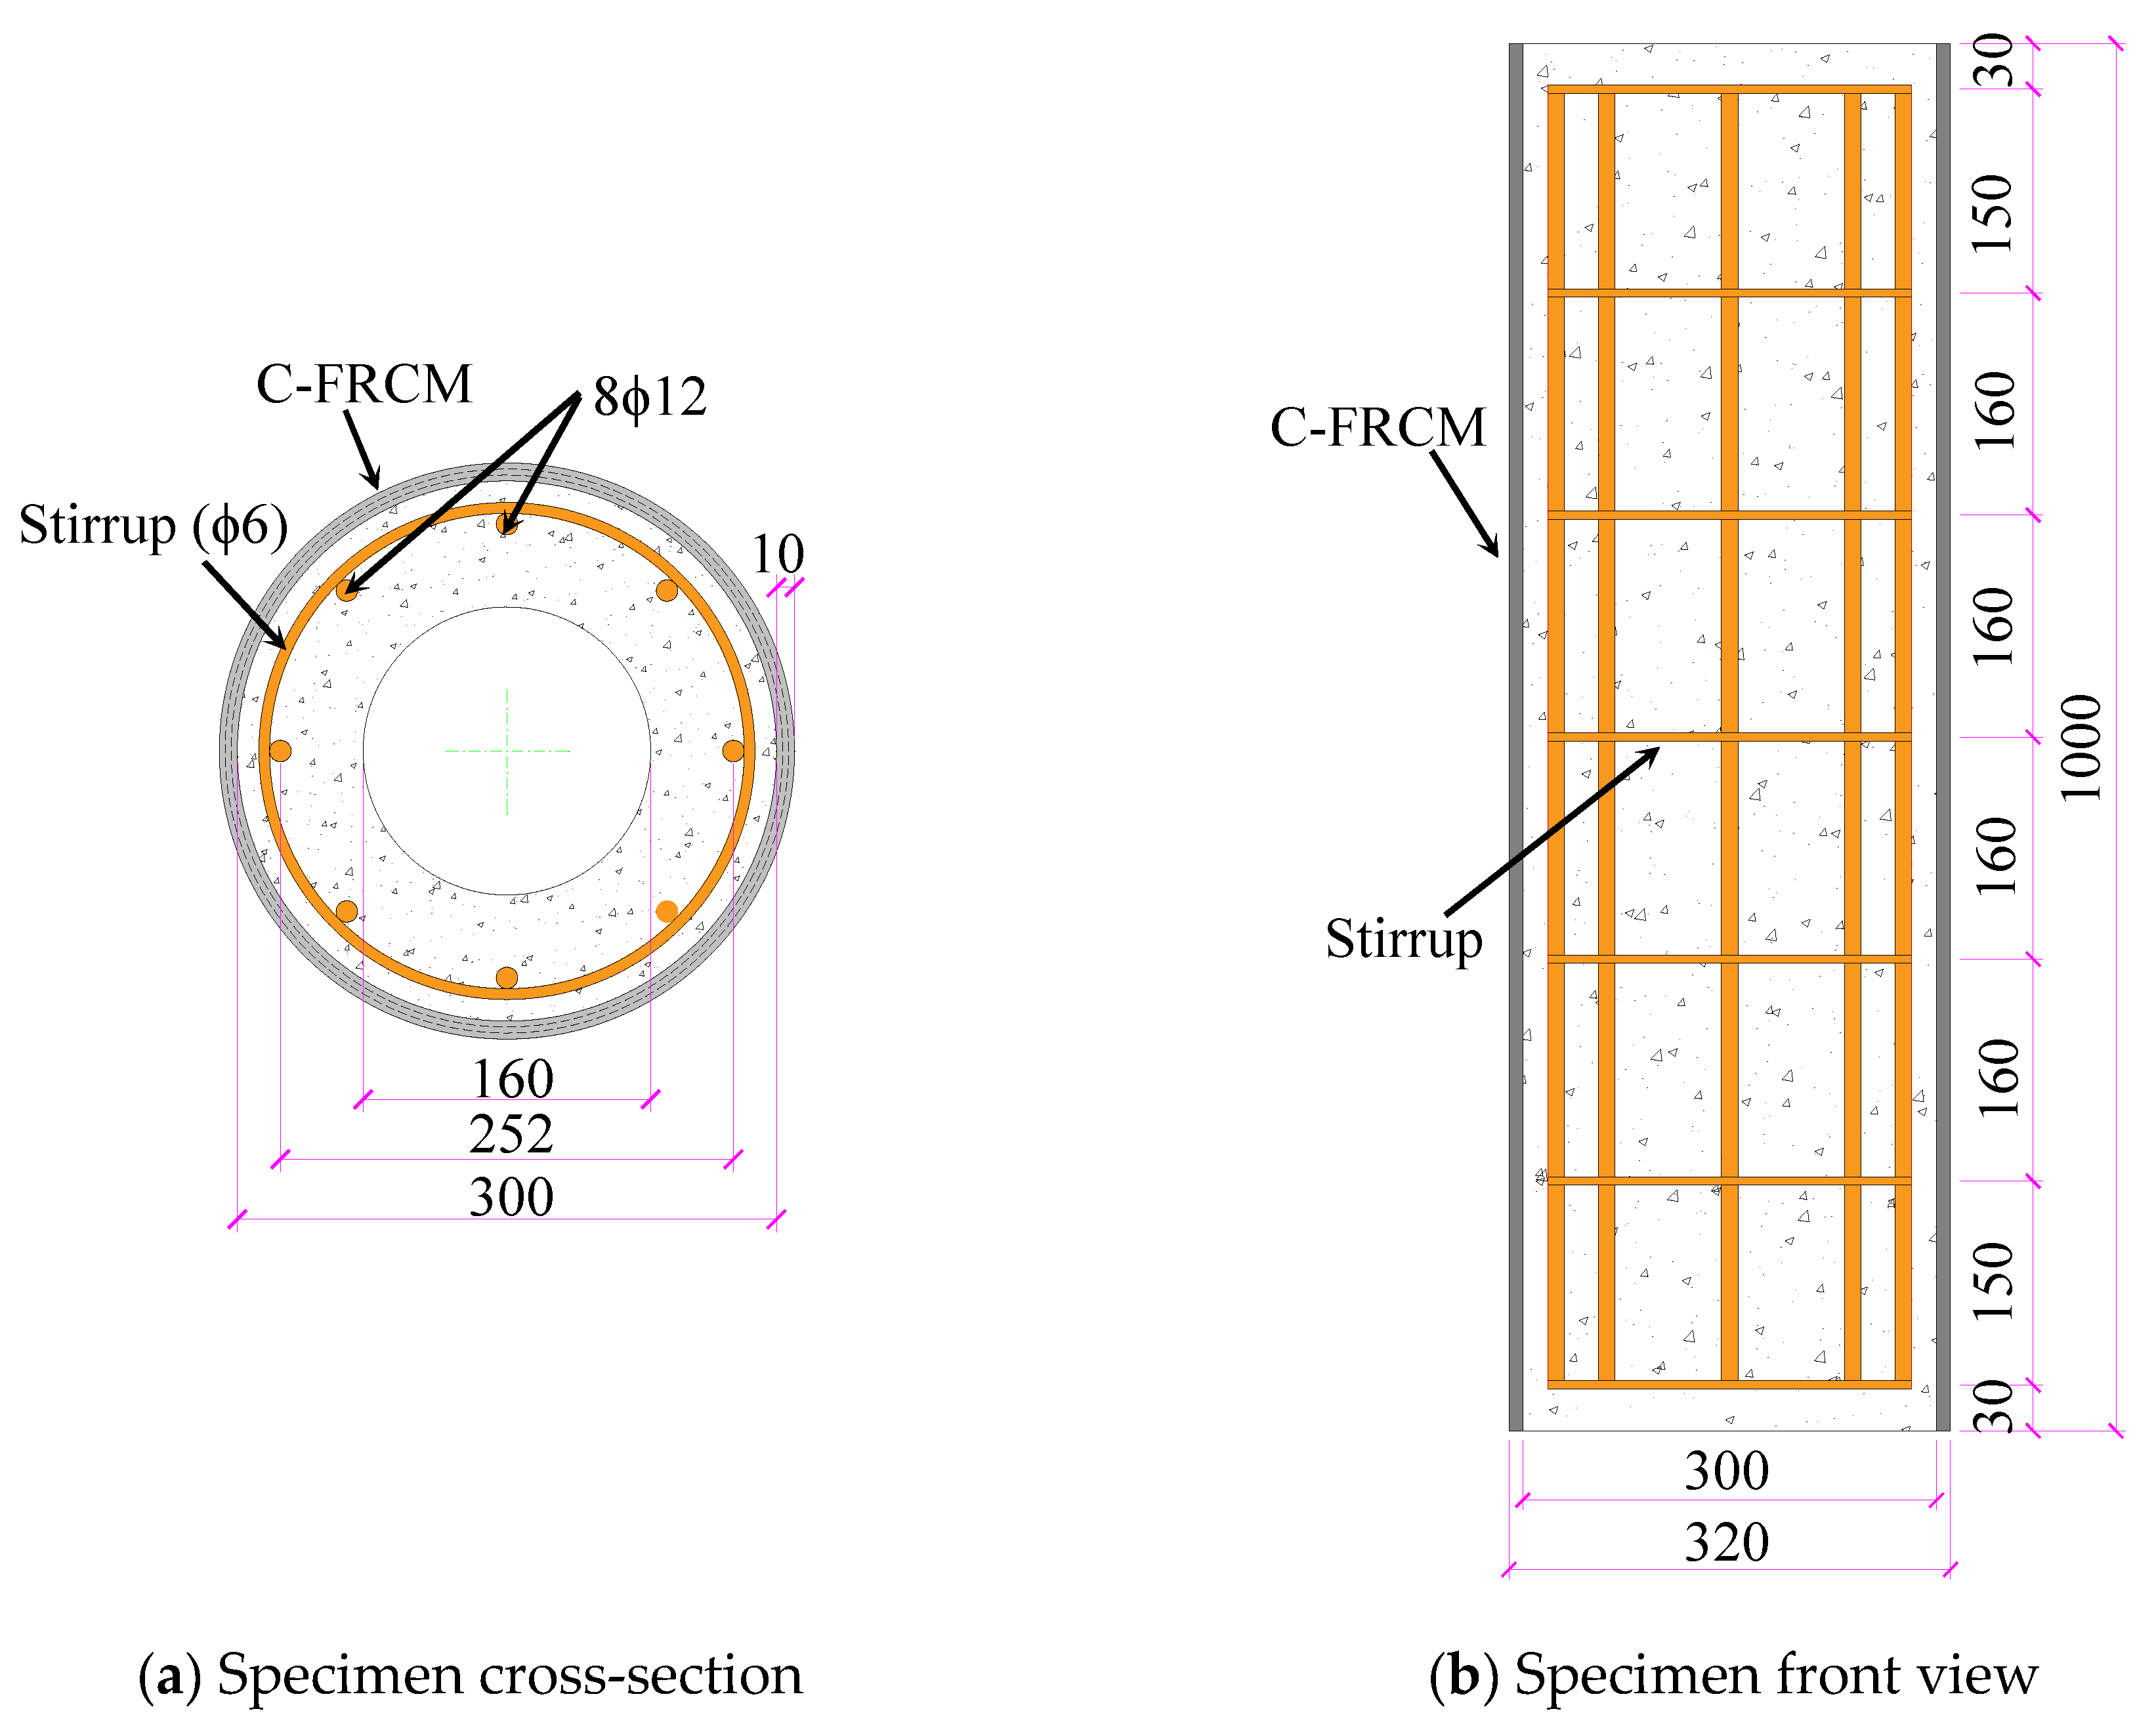
A total of 12 specimens were designed in the axial compression test, the height of all specimens was 1000 mm, and the outer diameter (excluding FRCM) and inner diameter of all specimens were 300 mm and 160 mm (hollow ratio ρ = 0.53). The 12 specimens were divided into two groups of 6, namely group 1 and 2. Test specimens in group 1 were strengthened using FRCM, while those in group 2 were not. Both groups of specimens were subjected to electrified accelerated corrosion with a current density of 0.5 mA/cm2 for different time spans to achieve different corrosion ratios (the corrosion ratio was defined as the ratio of mass loss after corrosion to the mass before corrosion, and the corrosion ratios designed in this paper were 0%, 5%, 10%, 15%, 20%, and 25%). The electrifying time required to reach a certain corrosion ratio can be calculated according to reference [18]. Details of the test specimens are shown in Table 1.
2.1.2. Corrosion and Strengthening of Specimens
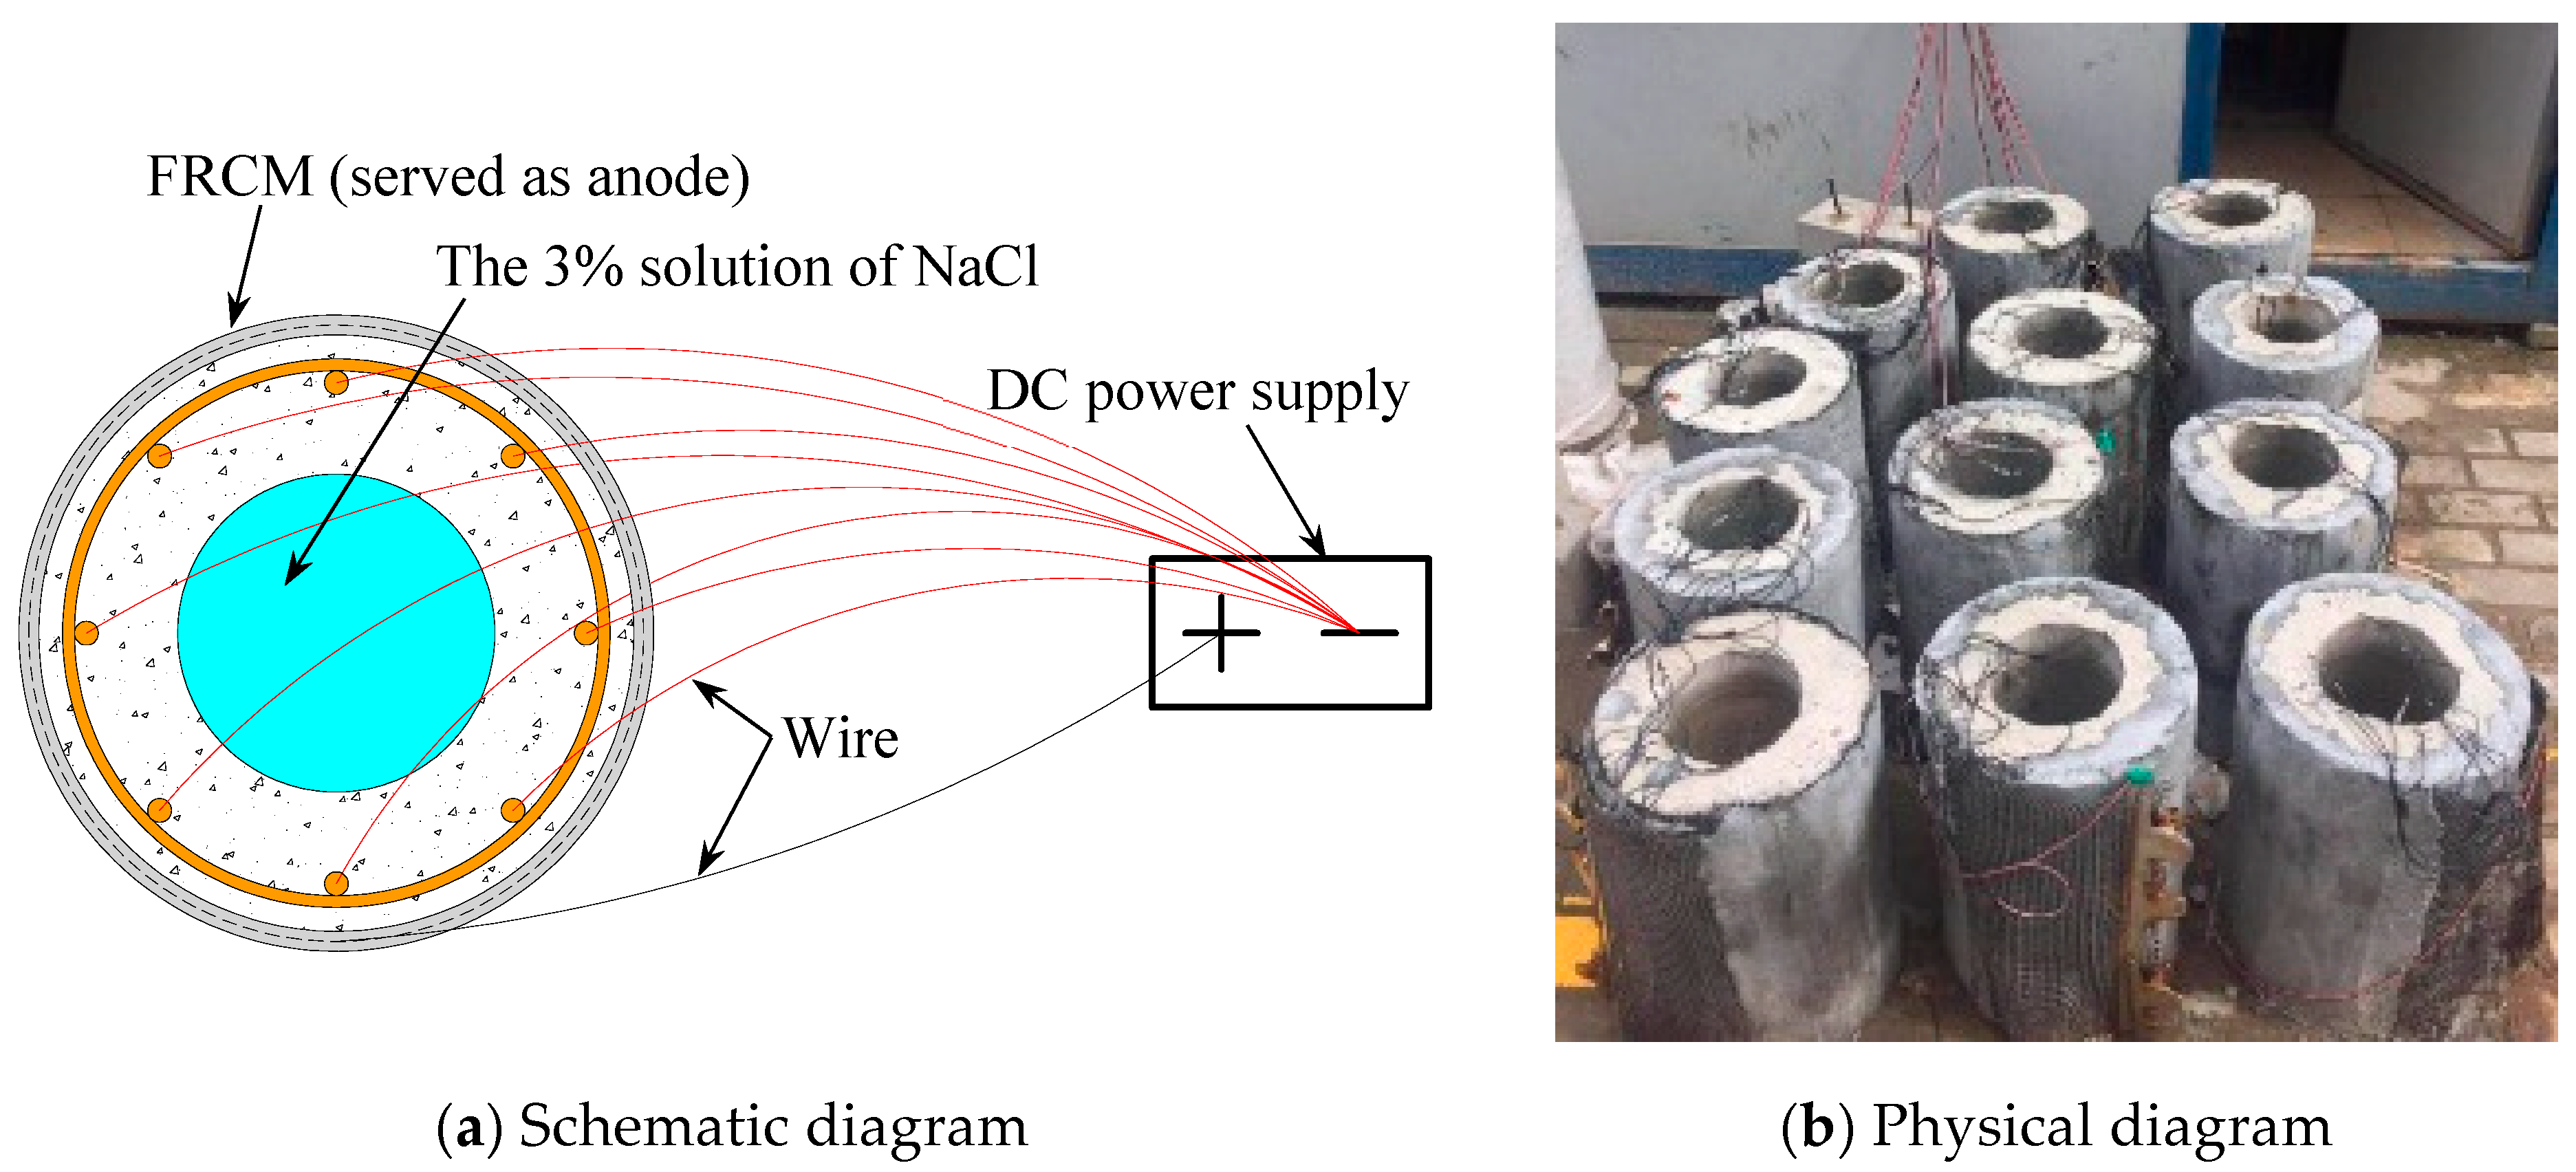
In this paper, the process of corroding each specimen to a specified ratio was accelerated through the use of a DC stabilized power supply. Firstly, the specimen was wrapped with a stainless steel mesh, then submerged in a 3% (mass percent) solution of NaCl, it should be noted that the solution of NaCl was replaced every three days to maintain a stable solution concentration. Finally, the 8 longitudinal rebars and the stainless steel mesh were connected to the positive and negative electrodes of the DC power supply, respectively. The configuration of the specimens subjected to accelerated corrosion is shown in Figure 2.
2.2. Test Specimens for Chloride Migration Investigation with ICCP-SS System
2.2.1. Details of Test Specimens
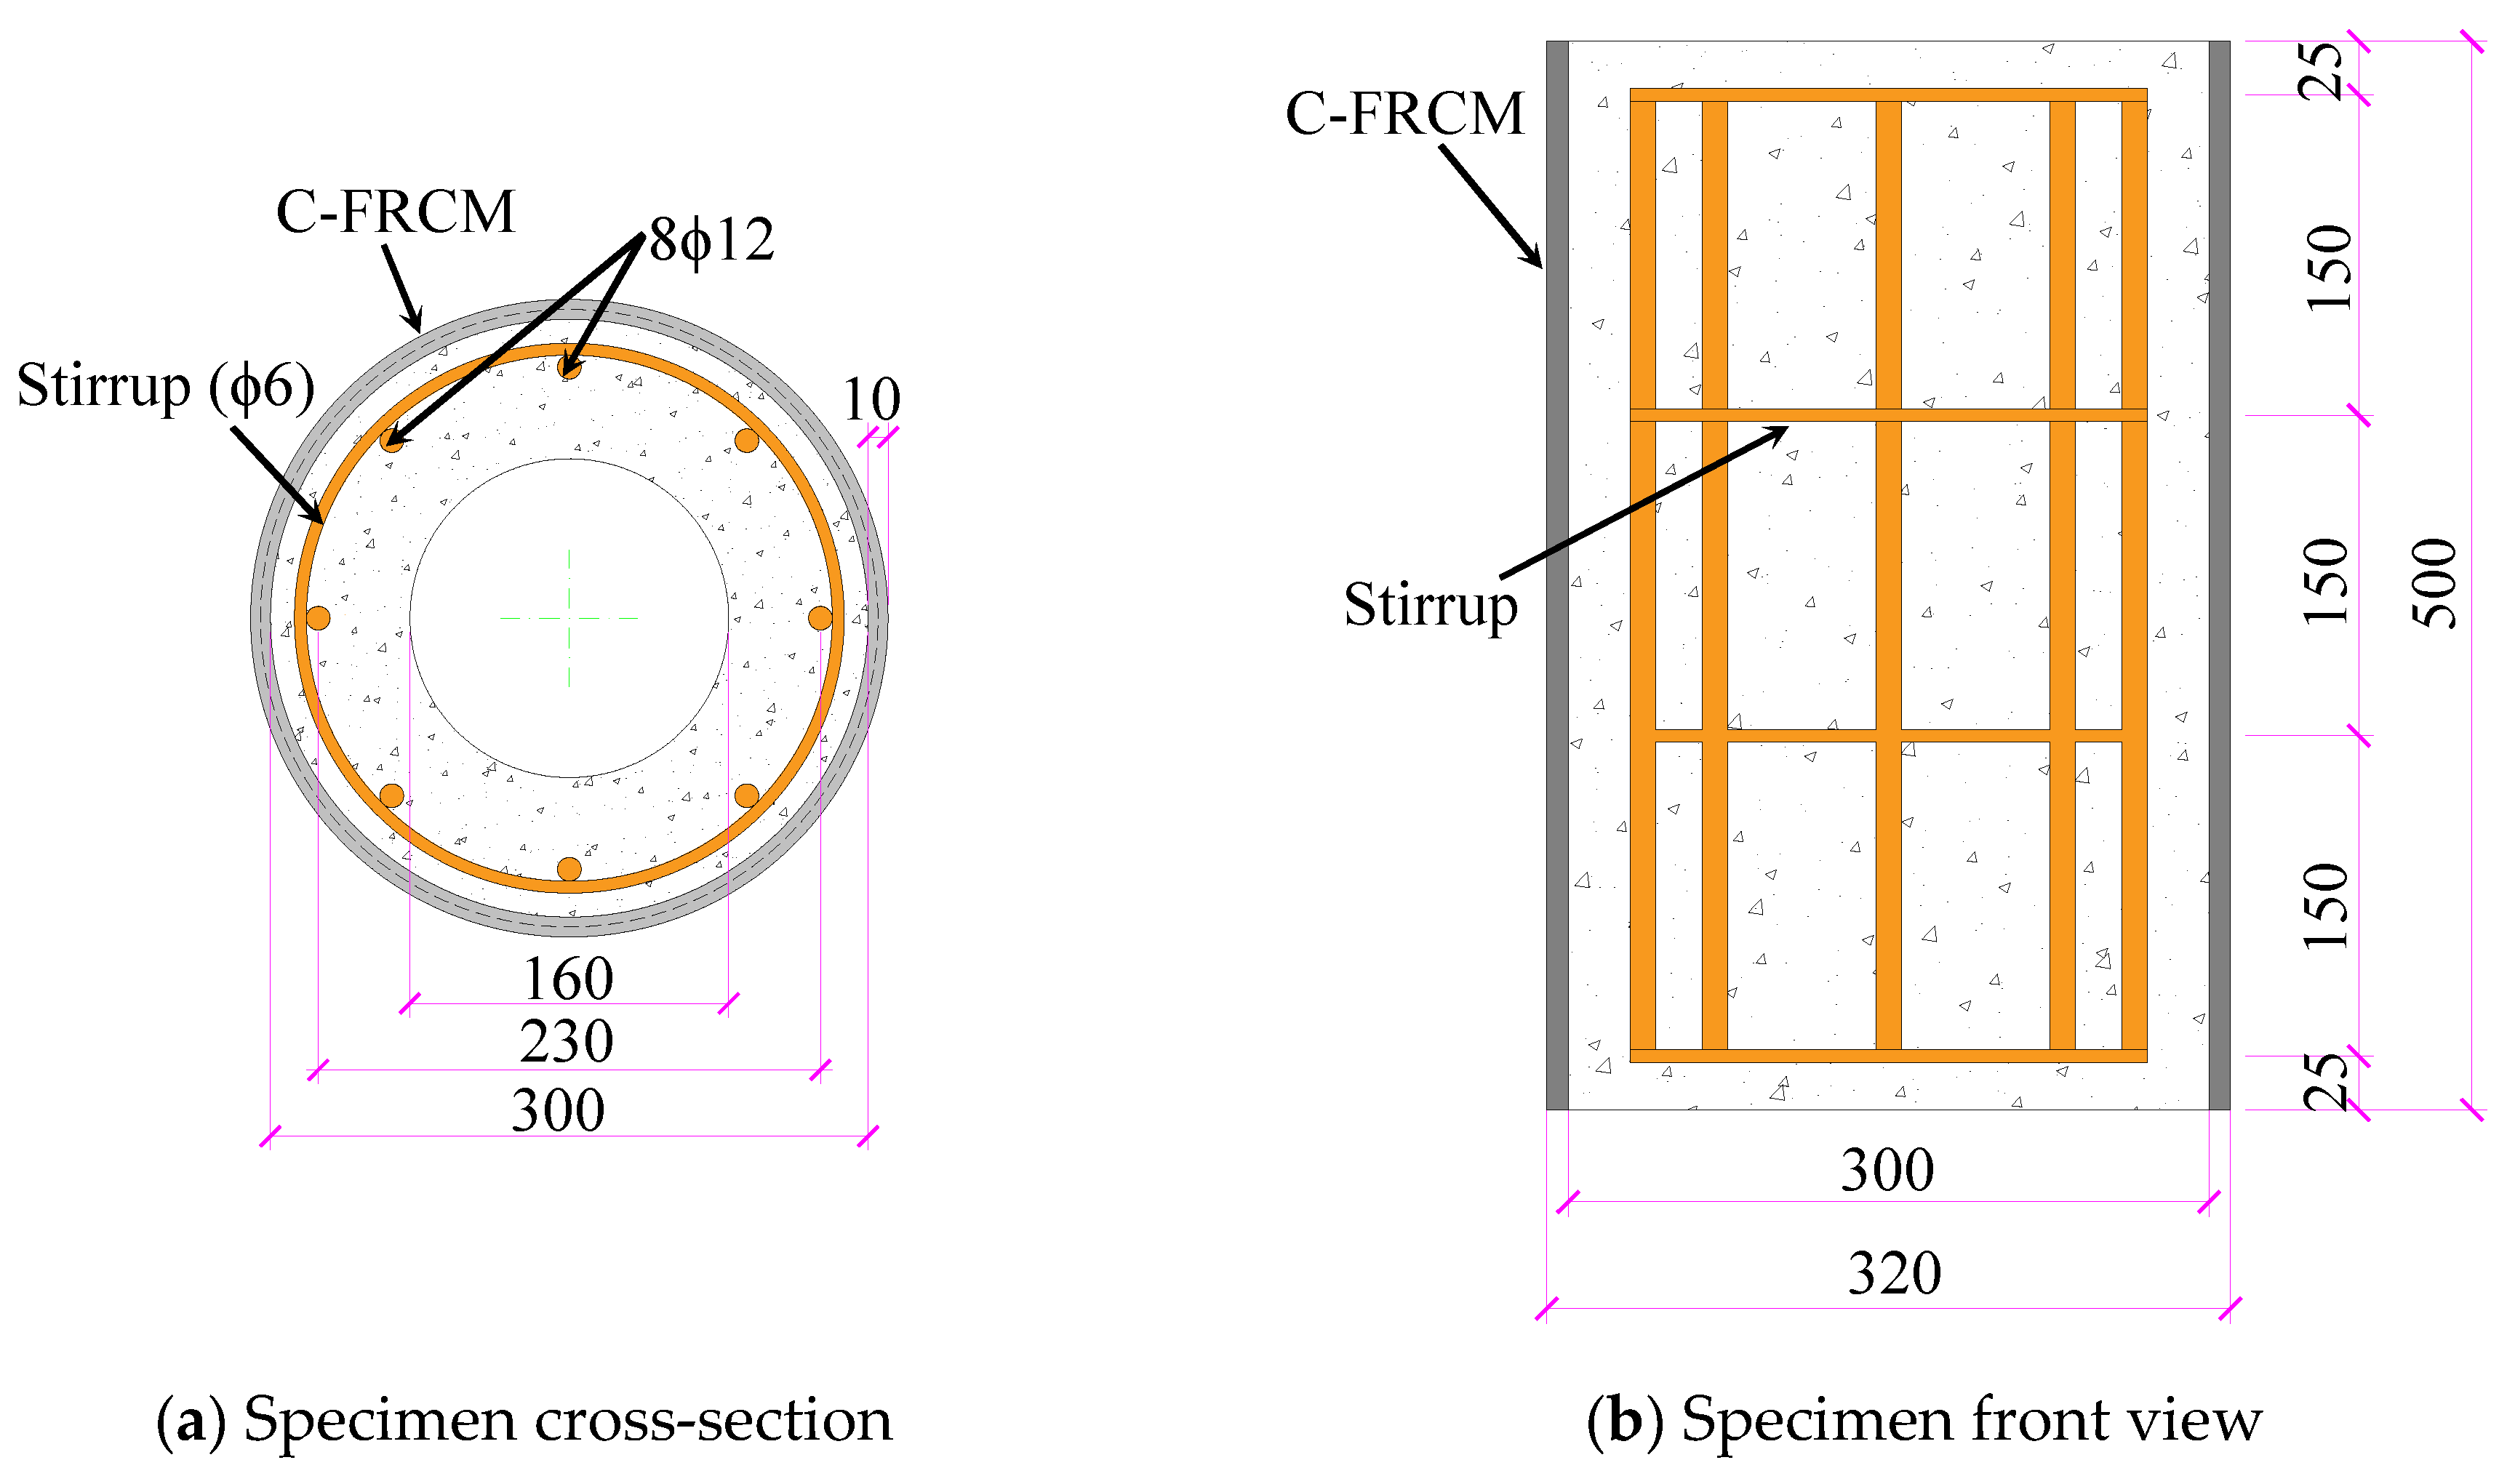
For the investigation of Cl− migration, a total of 12 additional specimens were designed. The designed specimens were evenly divided into 2 groups, namely group 1 and 2. Salt was added into the concrete for specimens in group 1, and none was added for specimens in group 2. The height of all specimens was 500 mm, the outer diameter (excluding FRCM) and inner diameter of all specimens were 300 mm and 160 mm, respectively (hollow ratio ρ = 0.53). Test specimens were protected by ICCP for 4, 7, and 10 months with current densities of 20 mA/m2 and 60 mA/m2, as shown in Table 2.
2.2.2. ICCP-SS System
For the structural strengthening aspect of the ICCP-SS method, specimens had one layer of CFRP located in the middle of the cementitious material surrounding the column. The total thickness of the FRCM was 10 mm, and the overlapping length of the CFRP along the circumferential direction was 150 mm.
Before ICCP-SS protection, a solution of NaCl (3% by mass) was added into the cavity of the specimens to simulate the corrosion phenomena of a marine environment, it should be noted that the solution of NaCl was replaced every three days to maintain a stable solution concentration. During the ICCP-SS protection, the CFRP was used as an anode and connected with the positive electrode of the power supply; the longitudinal rebars were used as a cathode and connected with the negative electrode of the power supply. The details of the setup of the ICCP-SS system for the specimens protected against a seawater environment are shown in Figure 4.
2.3. Material Properties
2.3.1. Mechanical Properties of Concrete, Rebars, Cementitious Material, and CFRP
The rebars and concrete of all test specimens in Table 1 and Table 2 belonged to the same batch of materials. The measured yield strength, ultimate strength, and elastic modulus of the longitudinal rebar with a diameter of 12 mm were 377.8 MPa, 468.5 MPa, and 180.9 GPa, respectively.
The concrete was mixed according to the ingredients showed in Table 3. The compressive strength of 150 mm cube of the concrete was 33.5 MPa.
The FRCM composite used as structural strengthening consisted of a cementitious material binder and one or more layers of CFRP. The cementitious material used included cement, silica sand, water, 3 mm shortcut carbon fiber filament, water-reducing agent, etc. The compressive strengths of the cementitious matrix were obtained by a cylinder compressive test in accordance with ASTM C39 [19], the average compressive strength and flexural strength of a prism specimen with the dimensions 40 × 40 × 160 mm were 28.3 MPa and 8.4 MPa, respectively.
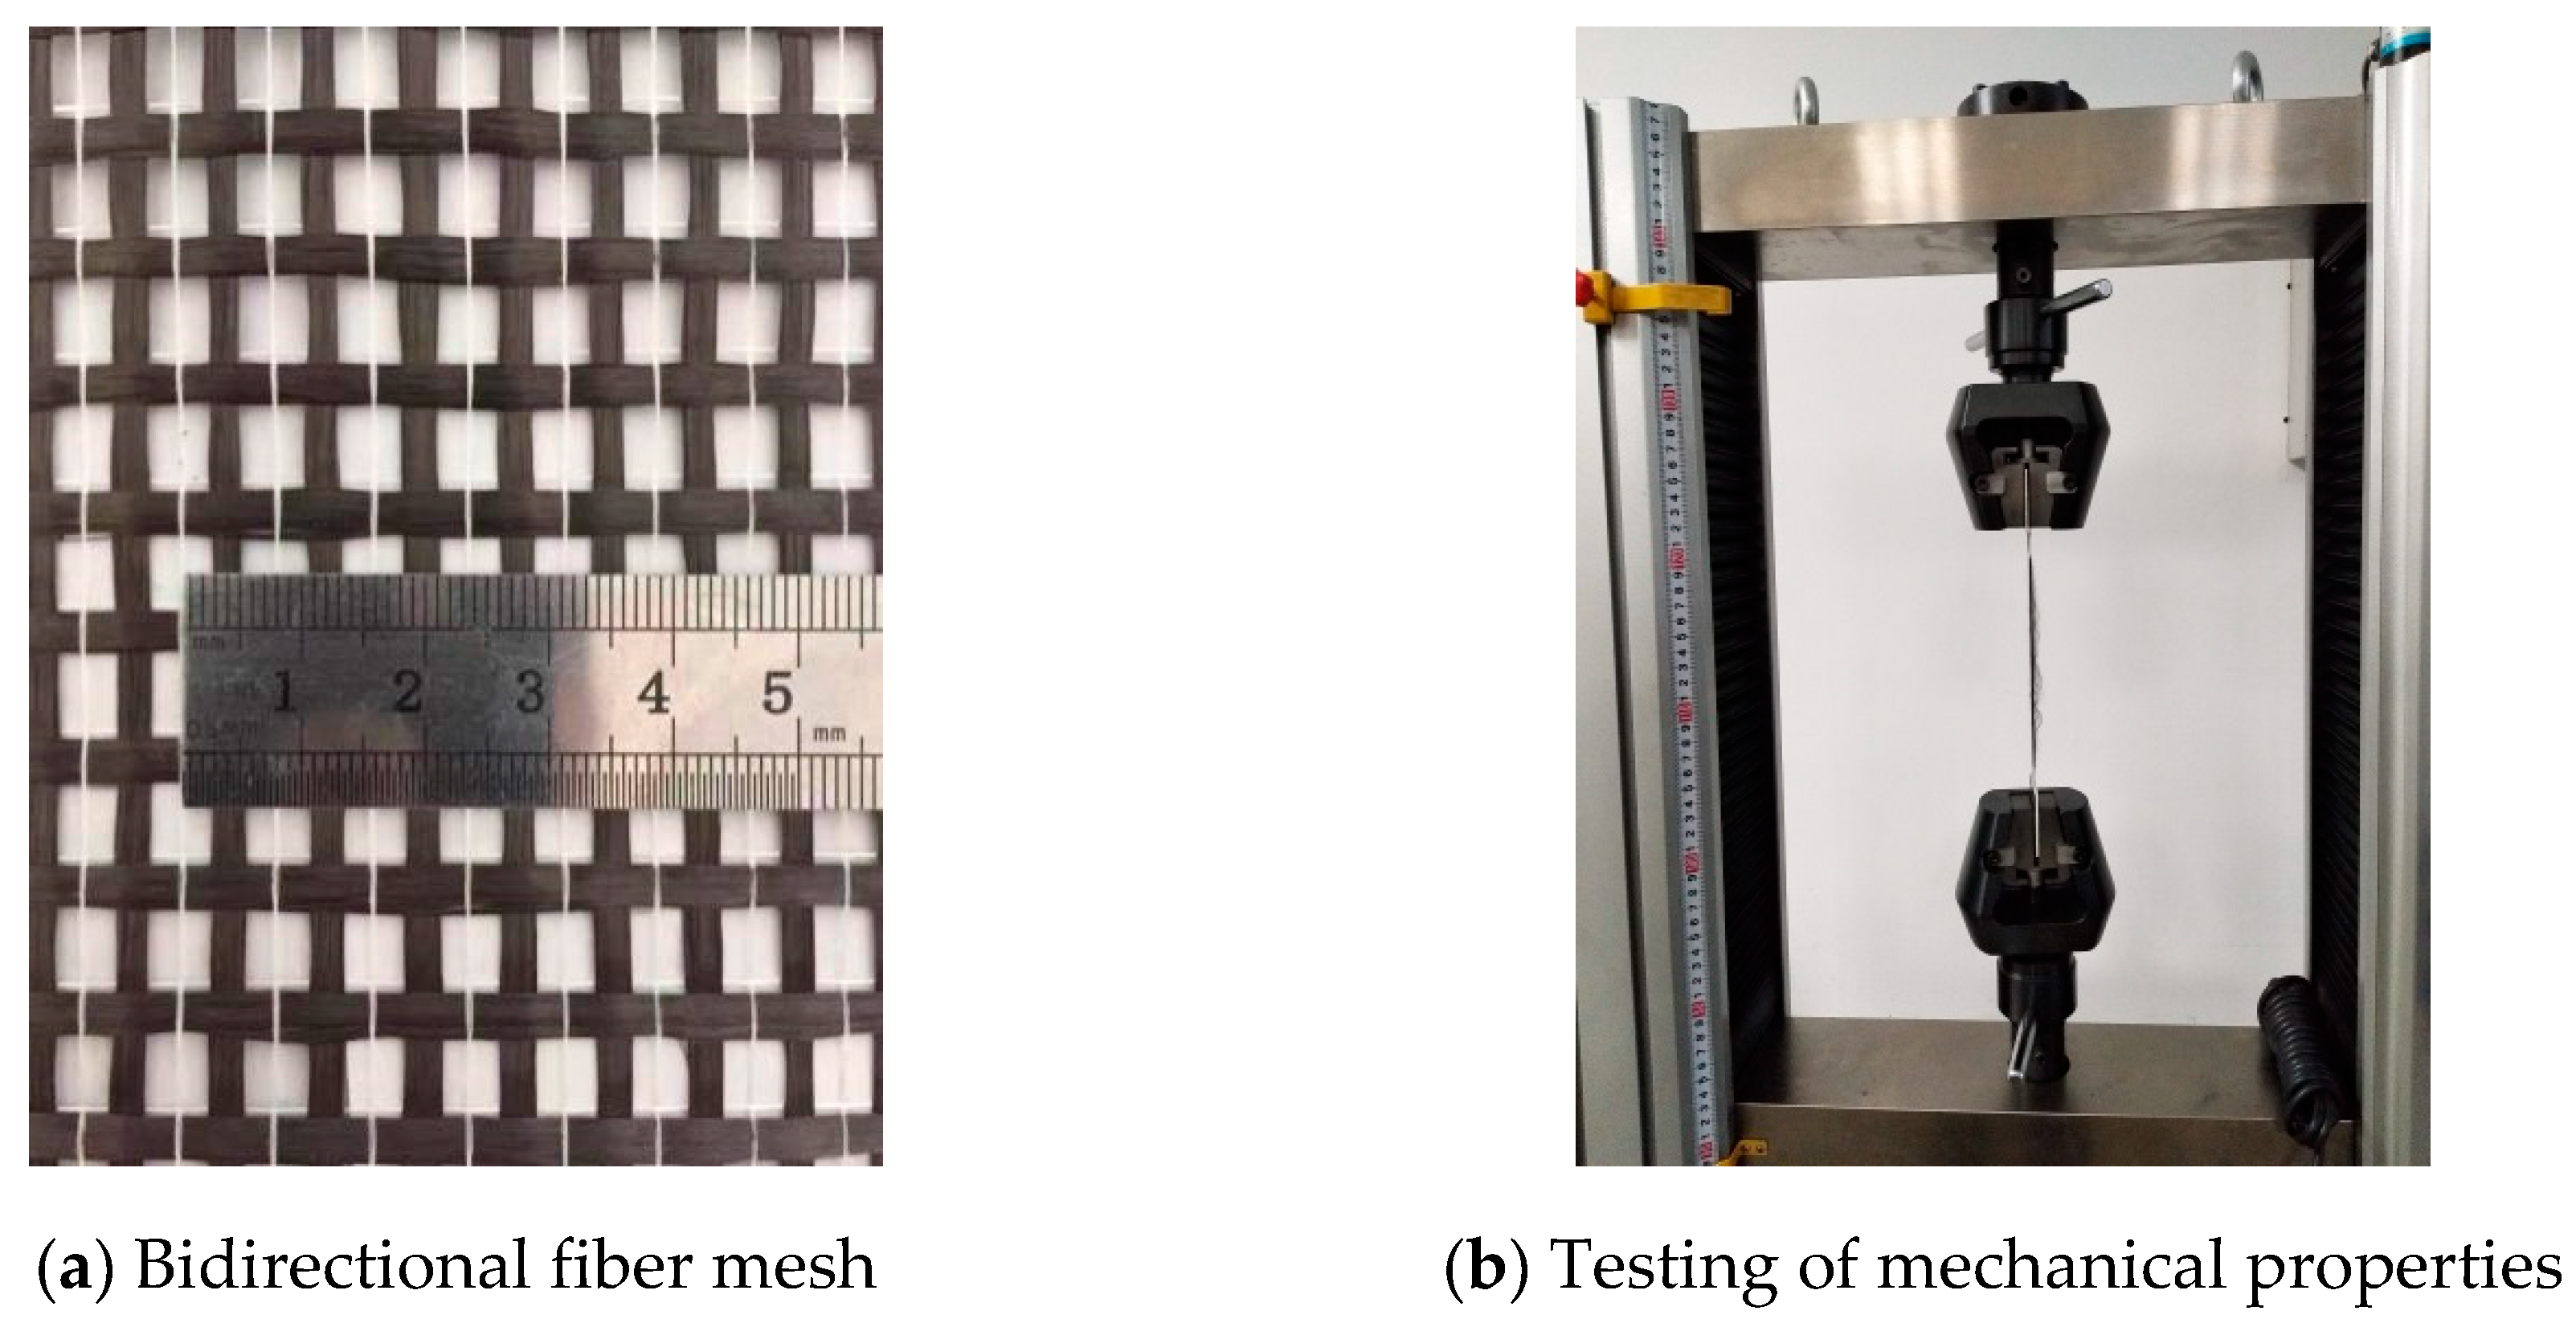
For the specimens subjected to axial compression, two layers of CFRP were used, while for those subjected to the protection of ICCP-SS, one layer was used. The CFRP consisted of carbon fiber bundles arranged in a bidirectional mesh, as shown in Figure 5a. The tensile strengths of the carbon fiber tows were tested in accordance with ASTM D4018 [20]. The test schematic diagram is shown in Figure 5b.
The material property test results of the CFRP material are shown in Table 4.
2.3.2. Tensile Properties of FRCM
The size of test plates used for the tensile test of the FRCM is 550 × 200 × 10 mm. CFRP is arranged with single/double layers in the cementitious material, and the test plate contained 5 bundles of tensile fibers within the width range. Three identical FRCM test plates were tested, the tensile behavior of the FRCM composite plates was obtained by tensile coupon tests in accordance with AC434 [21], and the average values of the measured tensile mechanical properties of FRCM plates are shown in Table 5.
2.3.3. Loading of Axial Compression Test
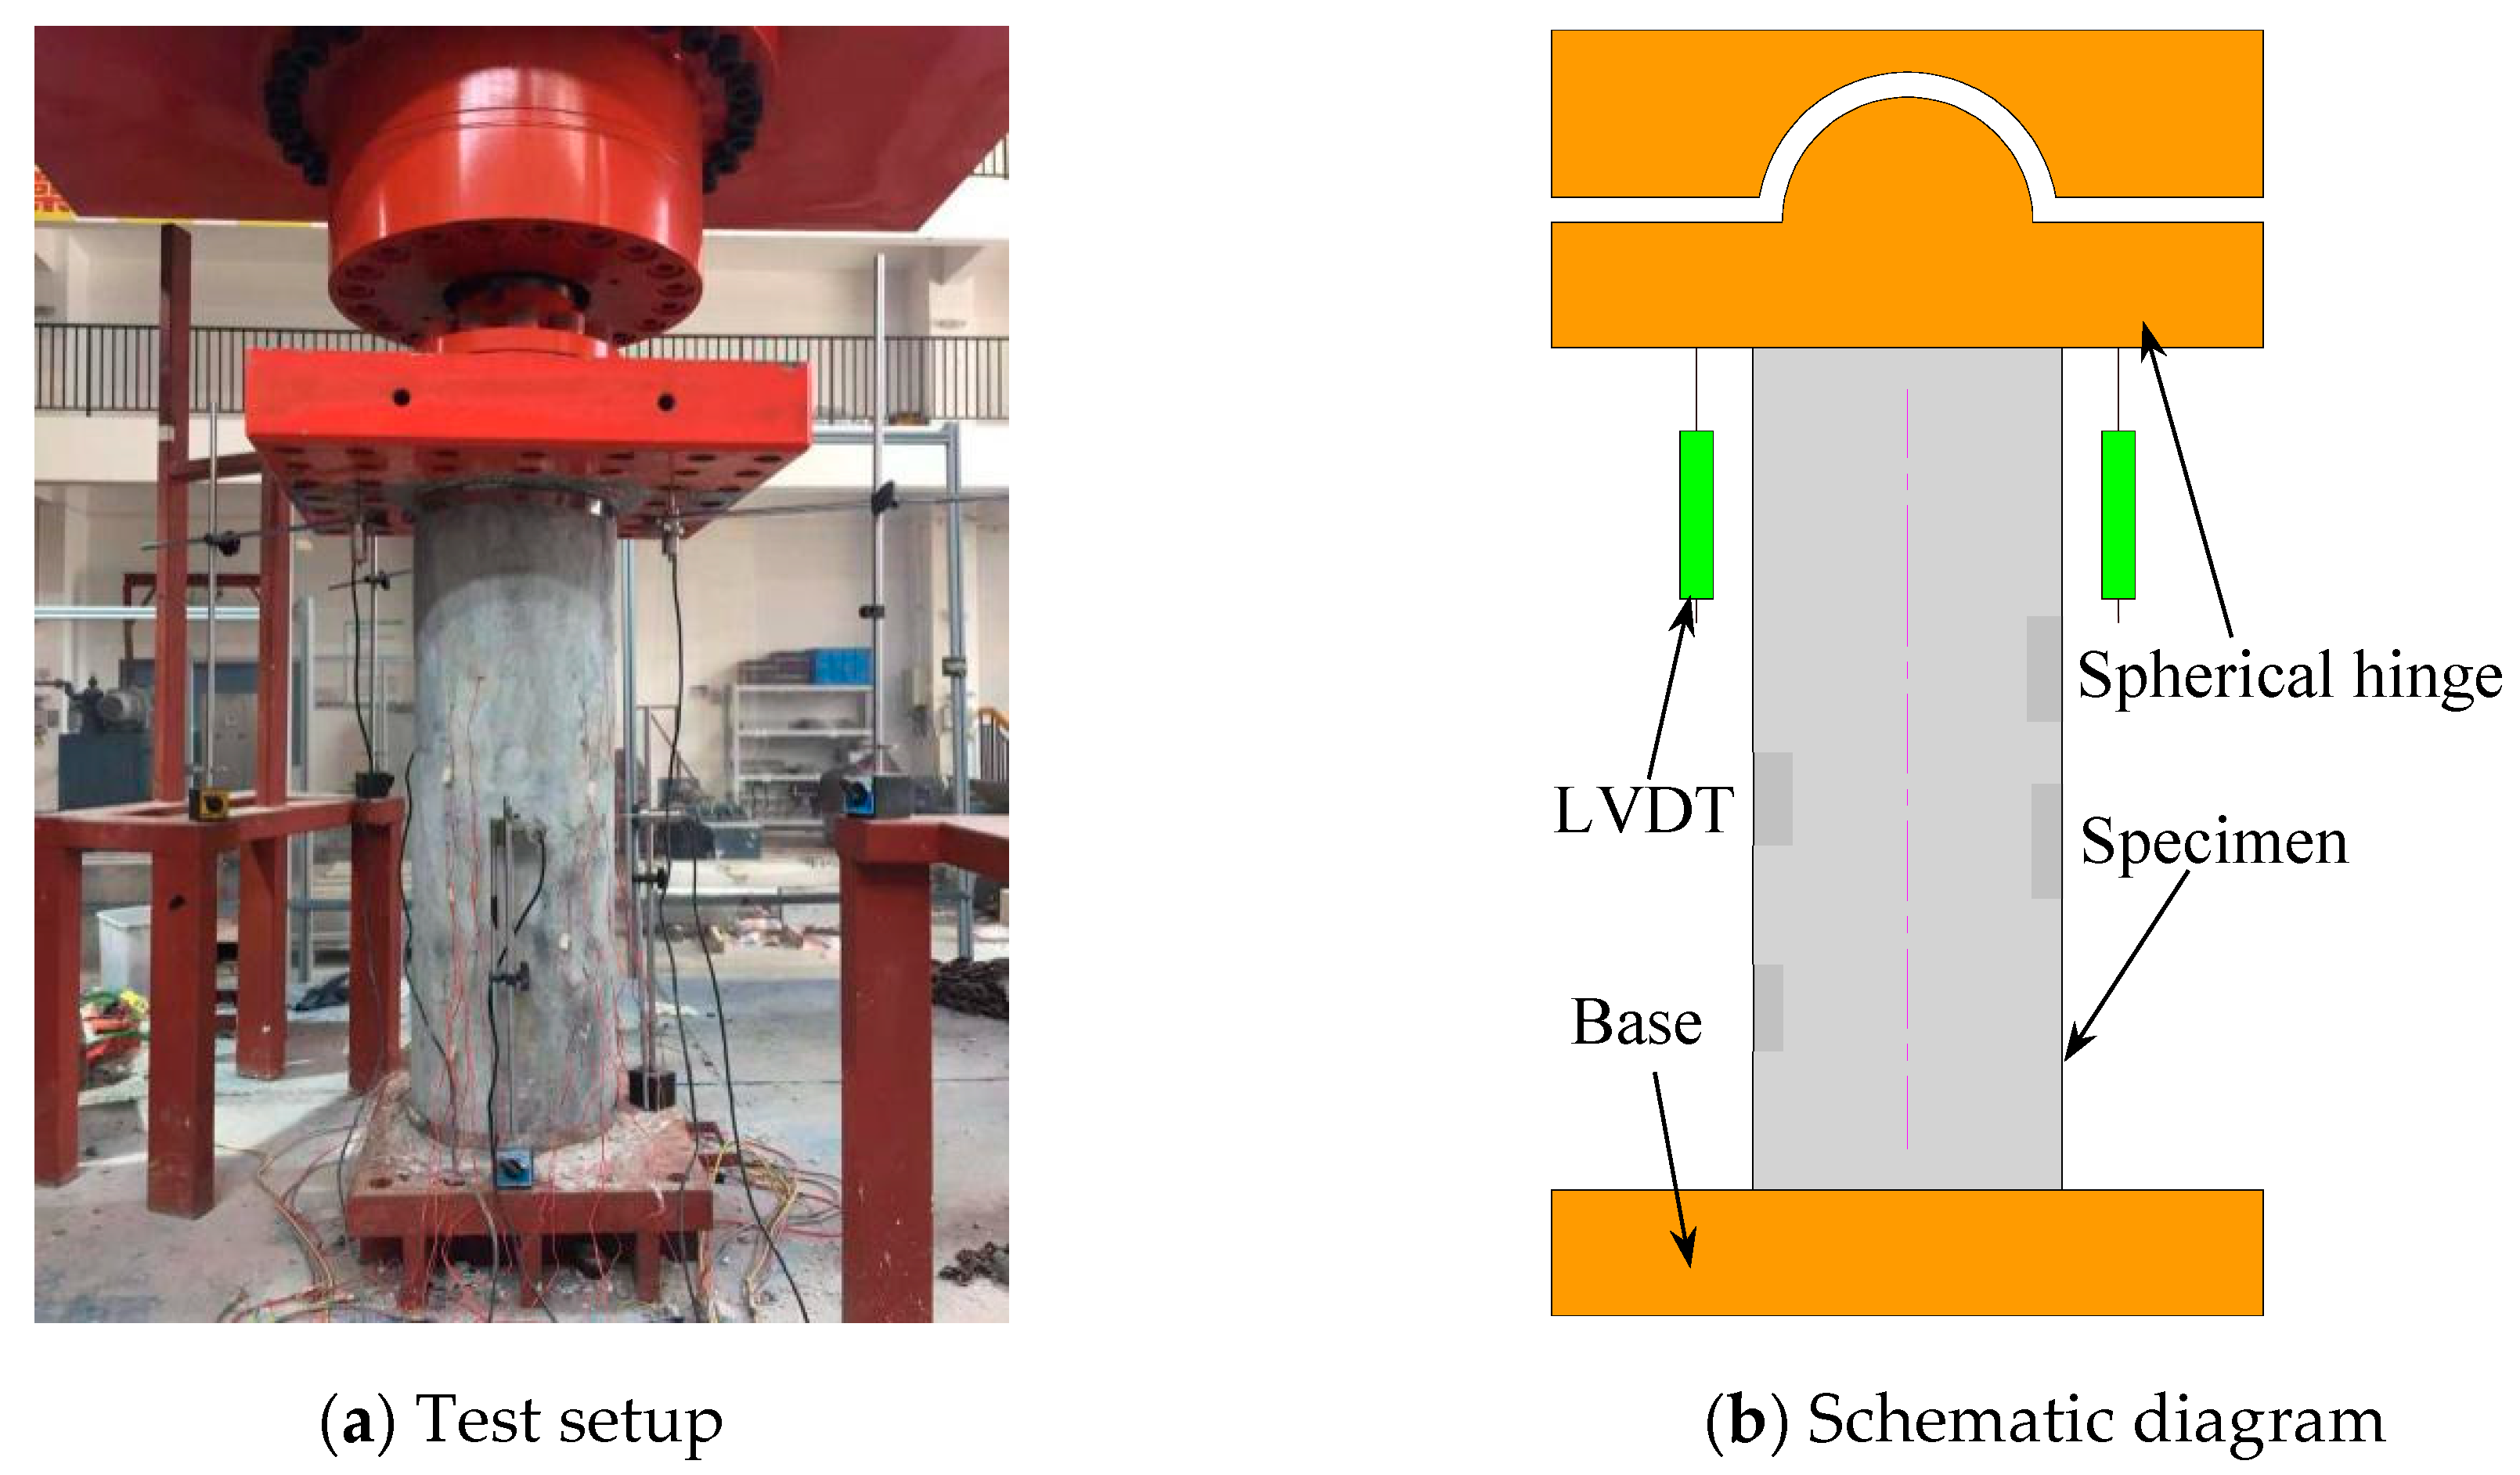
The axial compression test was carried out by displacement control with a speed of 0.3 mm/min. The test setup and schematic diagram of the axial compression test are shown in Figure 6.
3. Test Results of Axial Compression Test
3.1. Failure Modes
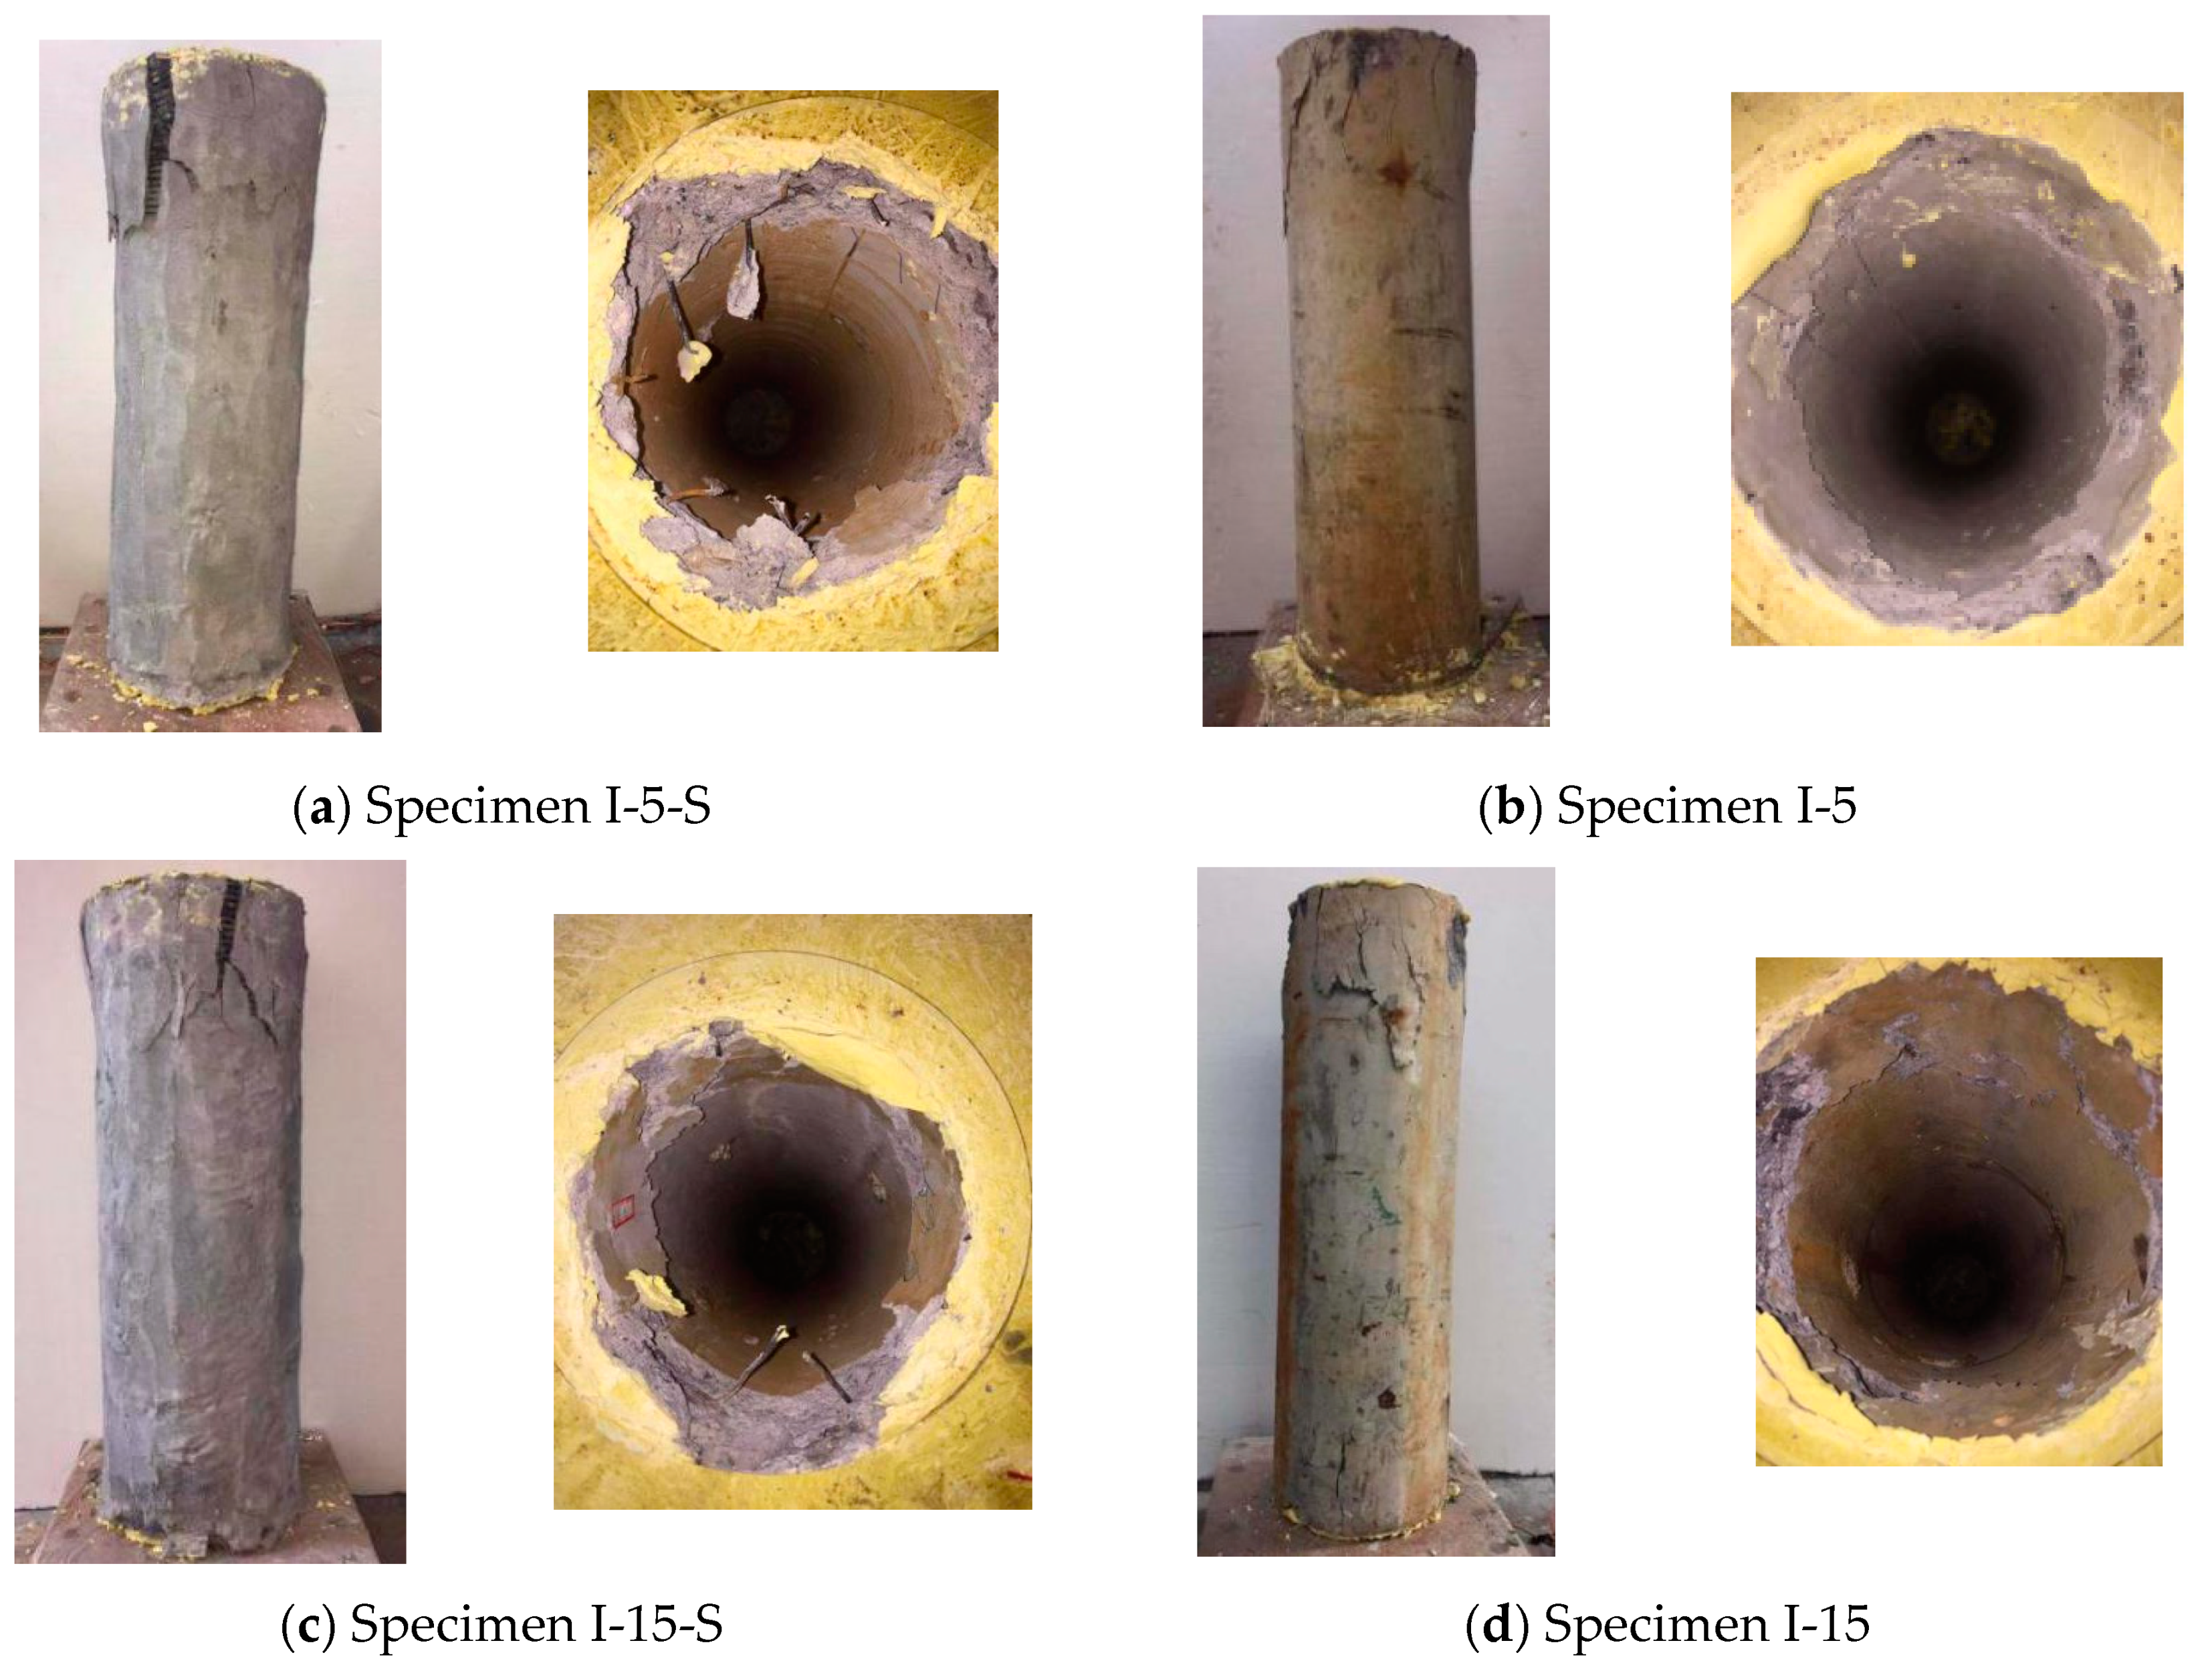
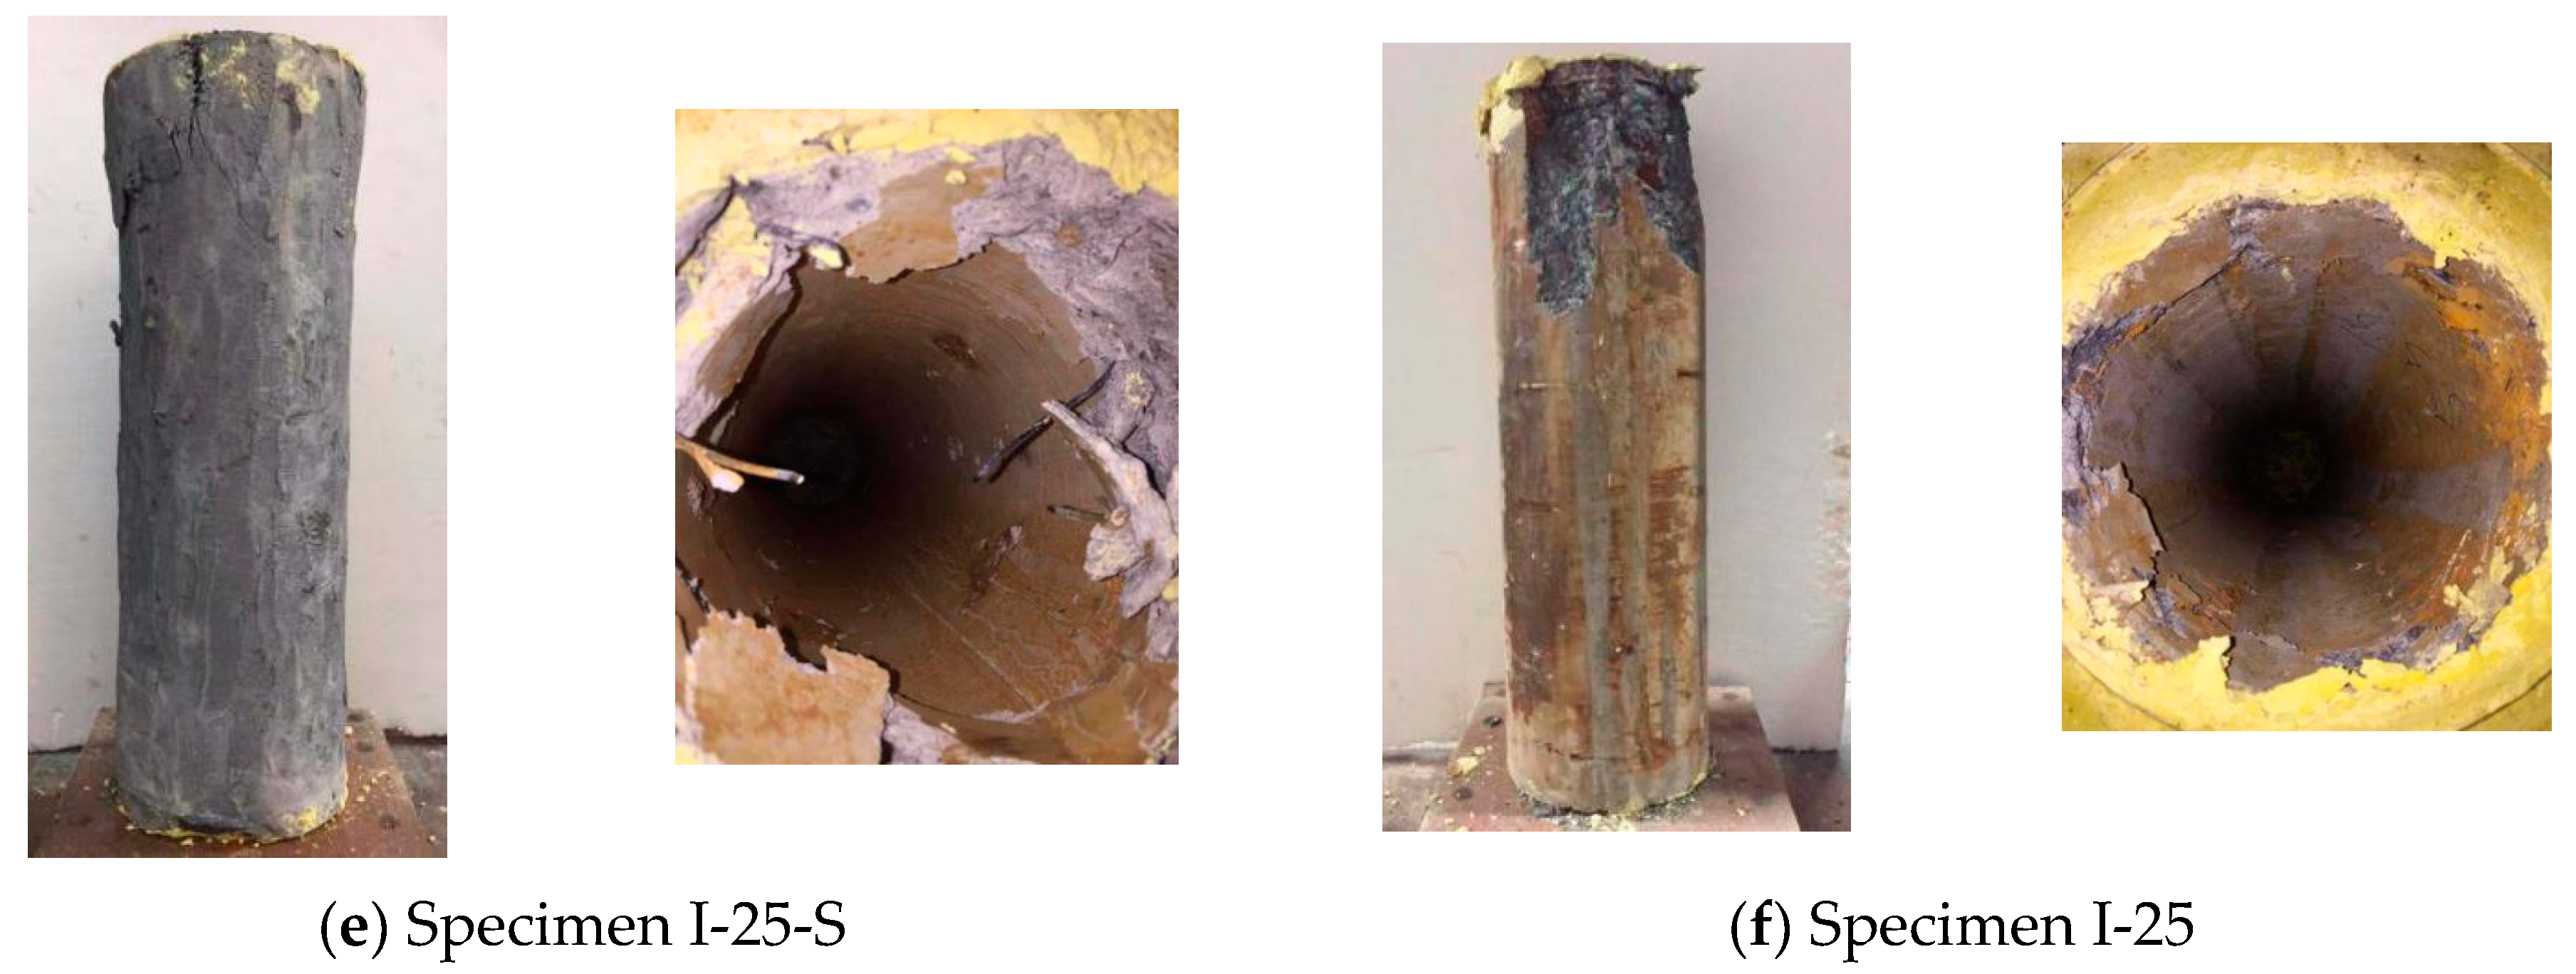
The failure modes of specimens subjected to axial compression are shown in Figure 7.
As can be seen in Figure 7, when the corrosion ratio of the specimens was lower than 5%, for the specimens strengthened by FRCM (I-0-S and I-5-S), the outer appearance had no significant changes at the initial stage of loading; however, when the axial force reached 70% of the ultimate load, concrete cracks began to propagate from the end region; with the increase of axial load, these cracks gradually expanded to the middle section of the specimens, and part of the CFRP grid inside the FRCM began to rupture; when the ultimate load was reached, a large area of CFRP fracture was found in the end region of the specimens, as shown in Figure 7a. For the specimens with corrosion ratios lower than 5% and without FRCM strengthening (specimens I-0 and I-5), when the axial force reached 70% of the ultimate load, numerous concrete cracks could be seen clearly in the end zones; when the ultimate load was reached, the concrete at the end of the specimens began to peel off, as shown in Figure 7b, following this, the specimens gradually lost their bearing capacity.
For specimens with corrosion ratios higher than 5%, the failure process of the strengthened specimens was similar to that for specimens with low corrosion ratios. In the specimens without FRCM strengthening, concrete cracks had already occurred at the end region when the axial force reached 30% of the ultimate load; this was mainly because the corrosion of the rebars caused expansion cracks inside the specimens before the test. These inner cracks extended rapidly to the surface upon being subjected to an axial load. When the ultimate load was reached, most of the concrete at the end region of the specimens had peeled off, as shown in Figure 7d,f; following this, the specimens rapidly lost their bearing capacity.
3.2. Load–Displacement Curves
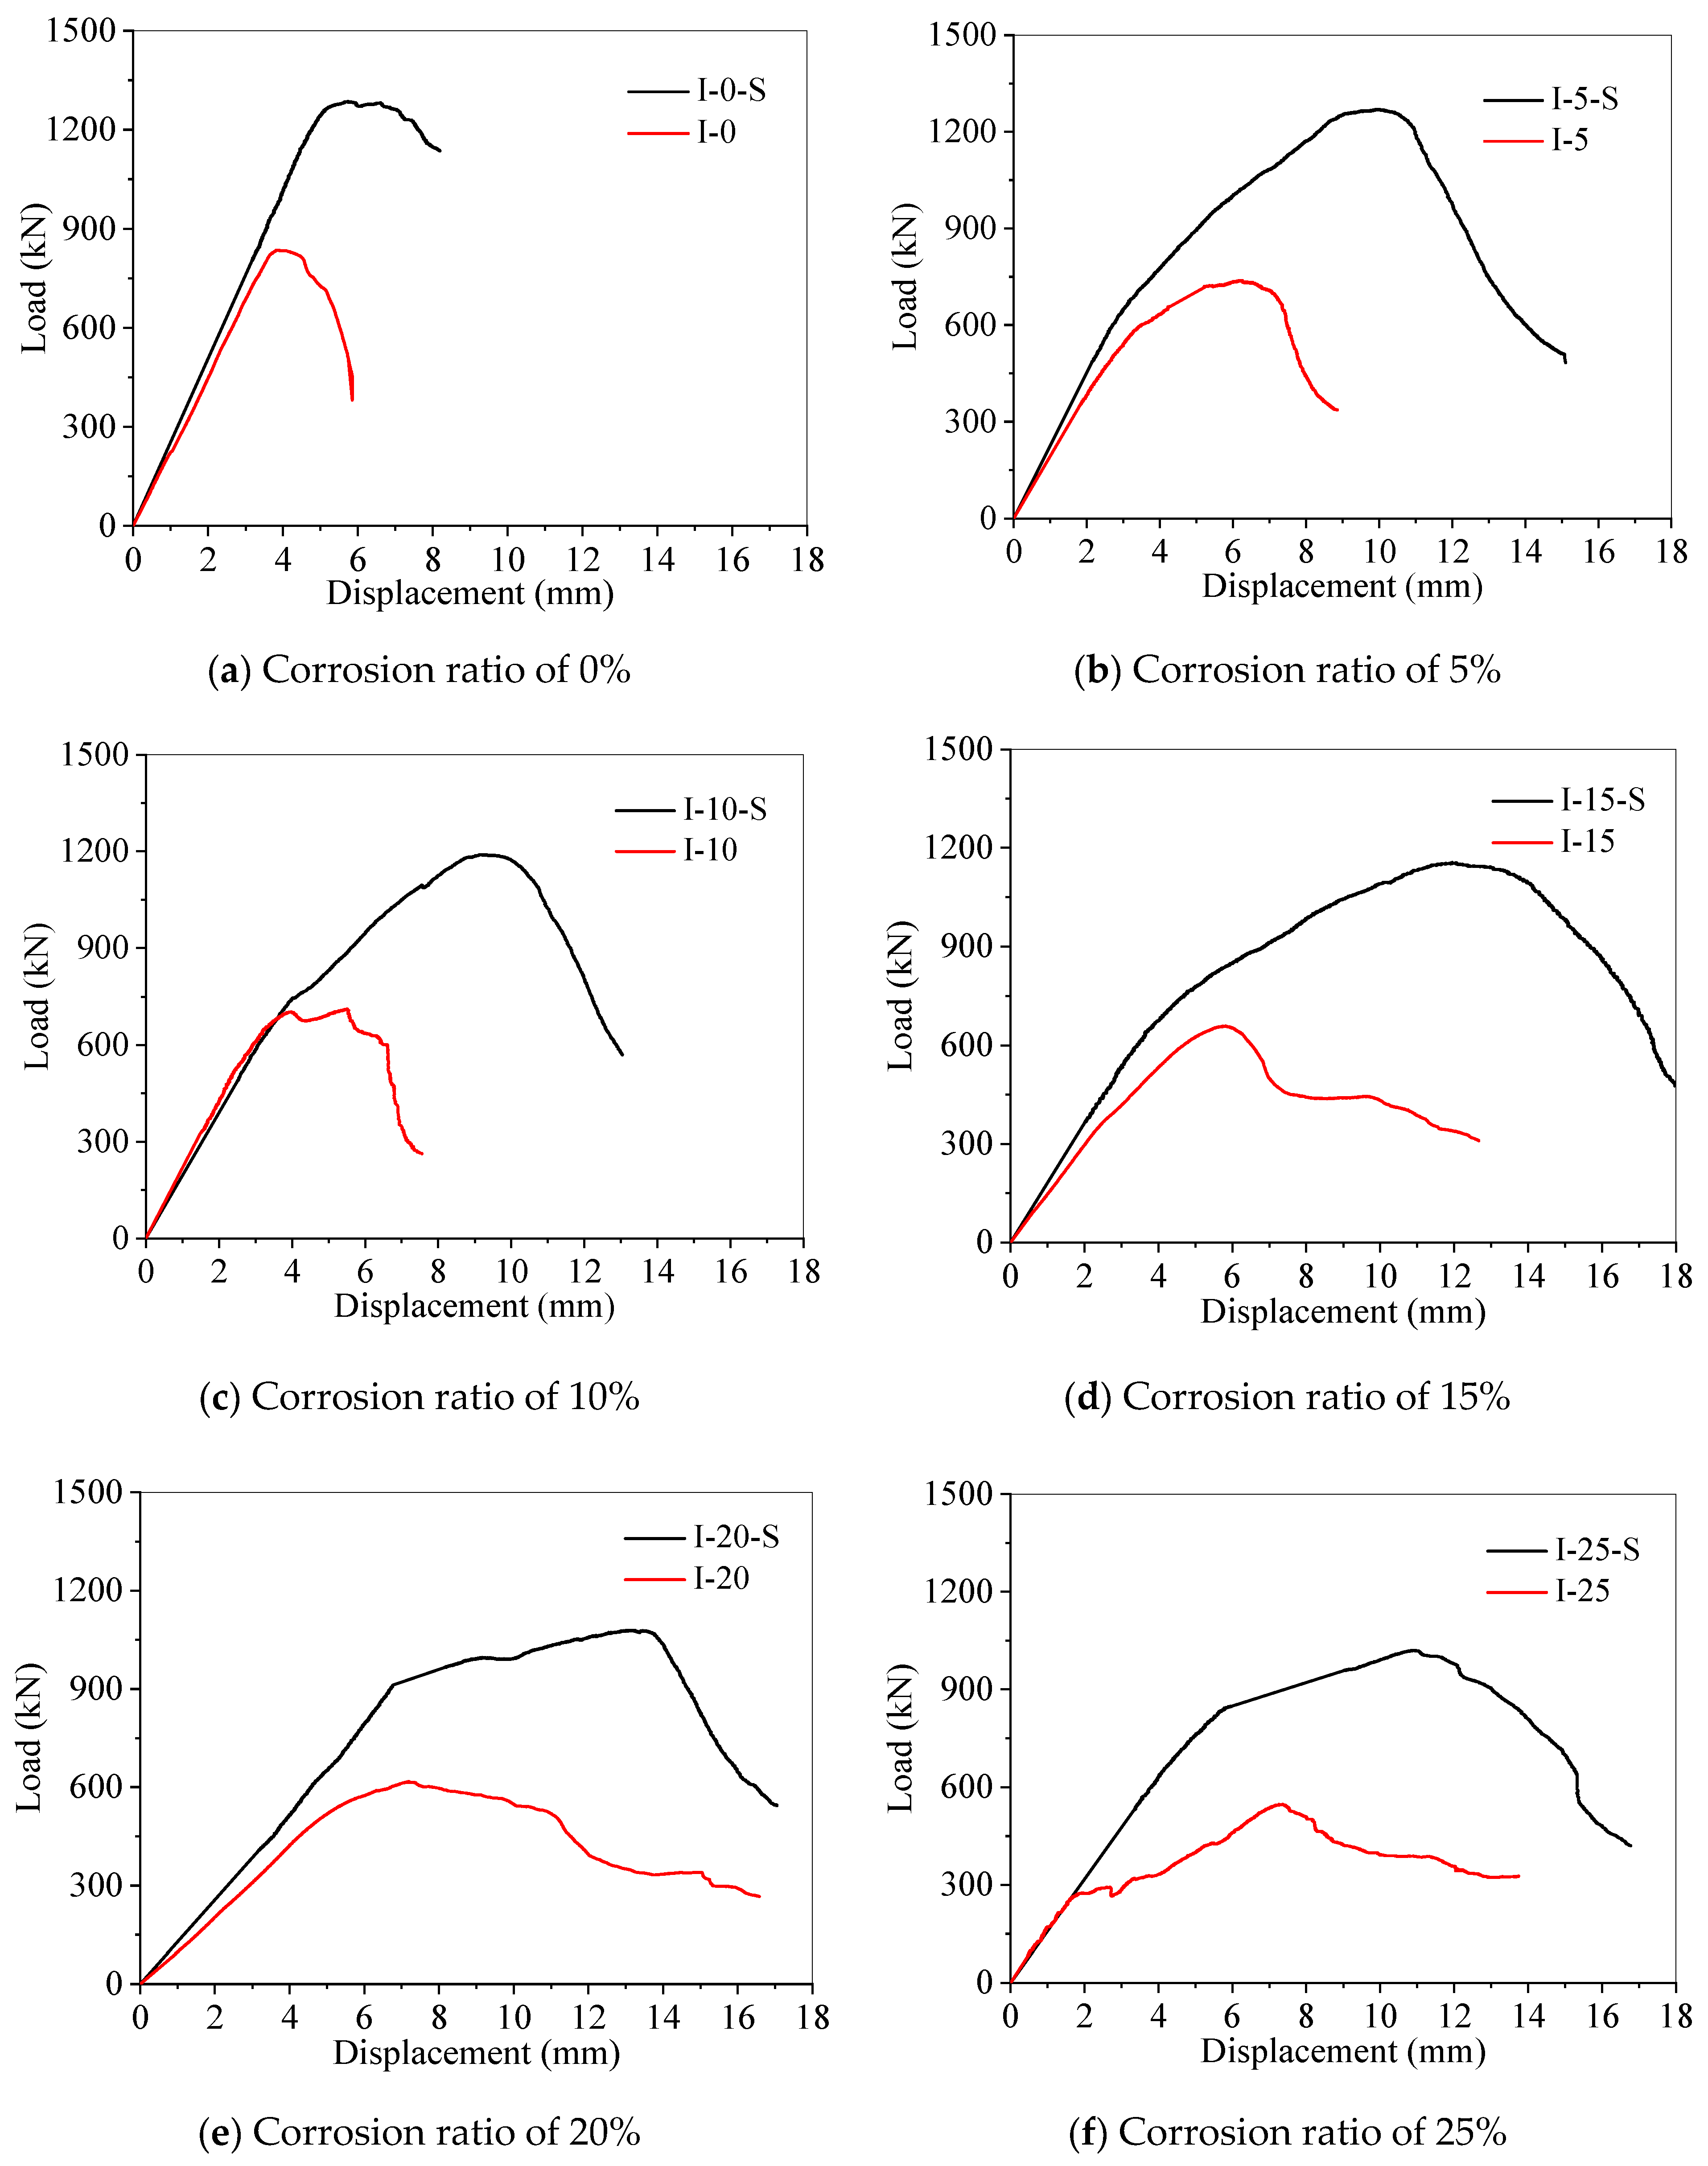
The comparisons of load–displacement curves for strengthened and unstrengthened specimens with different corrosion ratios are shown in Figure 8.
As can be seen from Figure 8, the ultimate load of corroded specimens can be significantly increased by FRCM. Moreover, the axial displacement corresponding to the ultimate load of the strengthened specimens was larger than that of the unstrengthened specimens, especially for the specimens with higher corrosion ratios (corrosion ratio larger than 5%). This is mainly because the FRCM could restrain the spalling of concrete, thus enabling the corroded specimens to bear load and deformation continuously. Additionally, the expansion of the concrete caused by the corrosion of rebars made the hoop effect of the confining FRCM more obvious; hence, the ductility of strengthened specimens with higher corrosion ratios was more obvious than in those with lower corrosion ratios.
3.3. Ultimate Load
Table 6 summarizes the ultimate load Nu, ultimate compressive strength σu, and ultimate strain εu0 of the axial compression specimens. The ultimate compressive strength σu, is Nu/A, where A is the cross-sectional area of the specimen (for the strengthened specimen, A includes the area of concrete, rebars, and cementitious material). The ultimate strain εu0 is the ratio between the axial displacement corresponding to the ultimate load and the height L of the specimen.
It can be seen from Table 6 that the ultimate load (or ultimate stress) of the tested specimens decreases with the increase of corrosion ratio, whether the specimens were strengthened or not. The main reason for this is that the corrosion products produced by rebars will cause expansion cracks within the concrete, and a higher corrosion ratio will lead to increased damage of the internal structure of the concrete. Hence, the ultimate load (or ultimate stress) of the specimens will decrease with the increase of corrosion ratio. For specimens with corrosion ratios of 0%, 5%, 10%, 15%, 20%, and 25%, the ultimate loads of the strengthened specimens are 53.8%, 71.9%, 62.5%, 72.2%, 76.3%, and 86.4% higher than that of the unstrengthened specimens, respectively, which indicates that the enhancement effect of FRCM on ultimate load is more pronounced for specimens with higher corrosion ratios. This decrease of ultimate load with respect to an increasing corrosion ratio occurred at a different rate in the strengthened and unstrengthened specimens. Those strengthened by FRCM experienced a slower rate of bearing capacity reduction caused by the rebar corrosion.
It can be seen from Table 6 that the ultimate strain increases with the increase of corrosion ratio, whether the specimens are strengthened or not. This is largely because the expansion cracks in the concrete, caused by the corroding rebars, results in a decrease in rigidity. Consequently, specimens with higher corrosion ratios experienced a greater deformation when loaded.
3.4. Calculation of Ultimate Load
When RC columns strengthened by FRCM are subjected to axial compression, the axial loads are borne by the concrete, longitudinal rebars and cementitious material of FRCM. For the RC columns whose rebars are corroded, the strength of the longitudinal rebars will be weakened [22]. According to research results proposed by Sun et al. [23], the relationship between the ratio of fy* (yield strength of corroded rebars) to fy (yield strength of non-corroded rebars) and the corrosion ratio η can be expressed as follows:
fy*/fy = 1 − 1.1η
According to the analysis above, the ultimate load of corroded RC columns strengthened by FRCM can be expressed as follows:
N = fccAc + fy*As + fmAm
In Equation (2), fcc is the compressive strength of the core concrete in the strengthened columns, and Ac is the cross-sectional area of the core concrete; As is the cross-sectional area of the rebars before corrosion; fm is the compressive strength of the cementitious material in the FRCM, and Am is the cross-sectional area of the cementitious material.
According to the test results and Equation (2), the calculated core concrete compressive strengths of the strengthened specimens, fcc, and of the unstrengthened specimens, fco, are shown in Table 7.
According to the test results showed in Table 7, linear regression was used to fit Kη-Test values to different corrosion ratios η. It should be noted that the fitted results have excluded the specimen I-5-S, because the results indicated that a higher corrosion ratio accompanied a lower concrete compressive strength fcc, which is inconsistent with the overall trend of test results. Therefore, the test results of specimen I-5-S cannot be used to accurately reflect real-life situations, so it is eliminated. In addition, the fitting curve of Kη-Test was ensured to pass through the point (0, 1), because for the specimen with corrosion ratio η equal to 0, the core concrete compressive strength remains unchanged. The relationship between Kη-Design and corrosion ratio η obtained by the fitting result is expressed as follows (corresponding R2 = 0.936):
Kη-Design = 1 + 0.8407η
The calculated values of Kη-Design, according to the fitted equation are shown in Table 7.
4. Effect of ICCP-SS on the Distribution Laws of Cl− in RC Hollow Columns
In this paper, 12 RC hollow columns were protected via ICCP-SS. After the charging process, a core was taken from each specimen and then milled, the diameter of the cored concrete was 90 mm. Additionally, it was ensured that the rebars were located in the middle of the specimen when drilling. The Cl− content at numerous points in the core sample was measured by potentiometric titration. The drilling process and the core sample taken from the tested columns are shown in Figure 9.
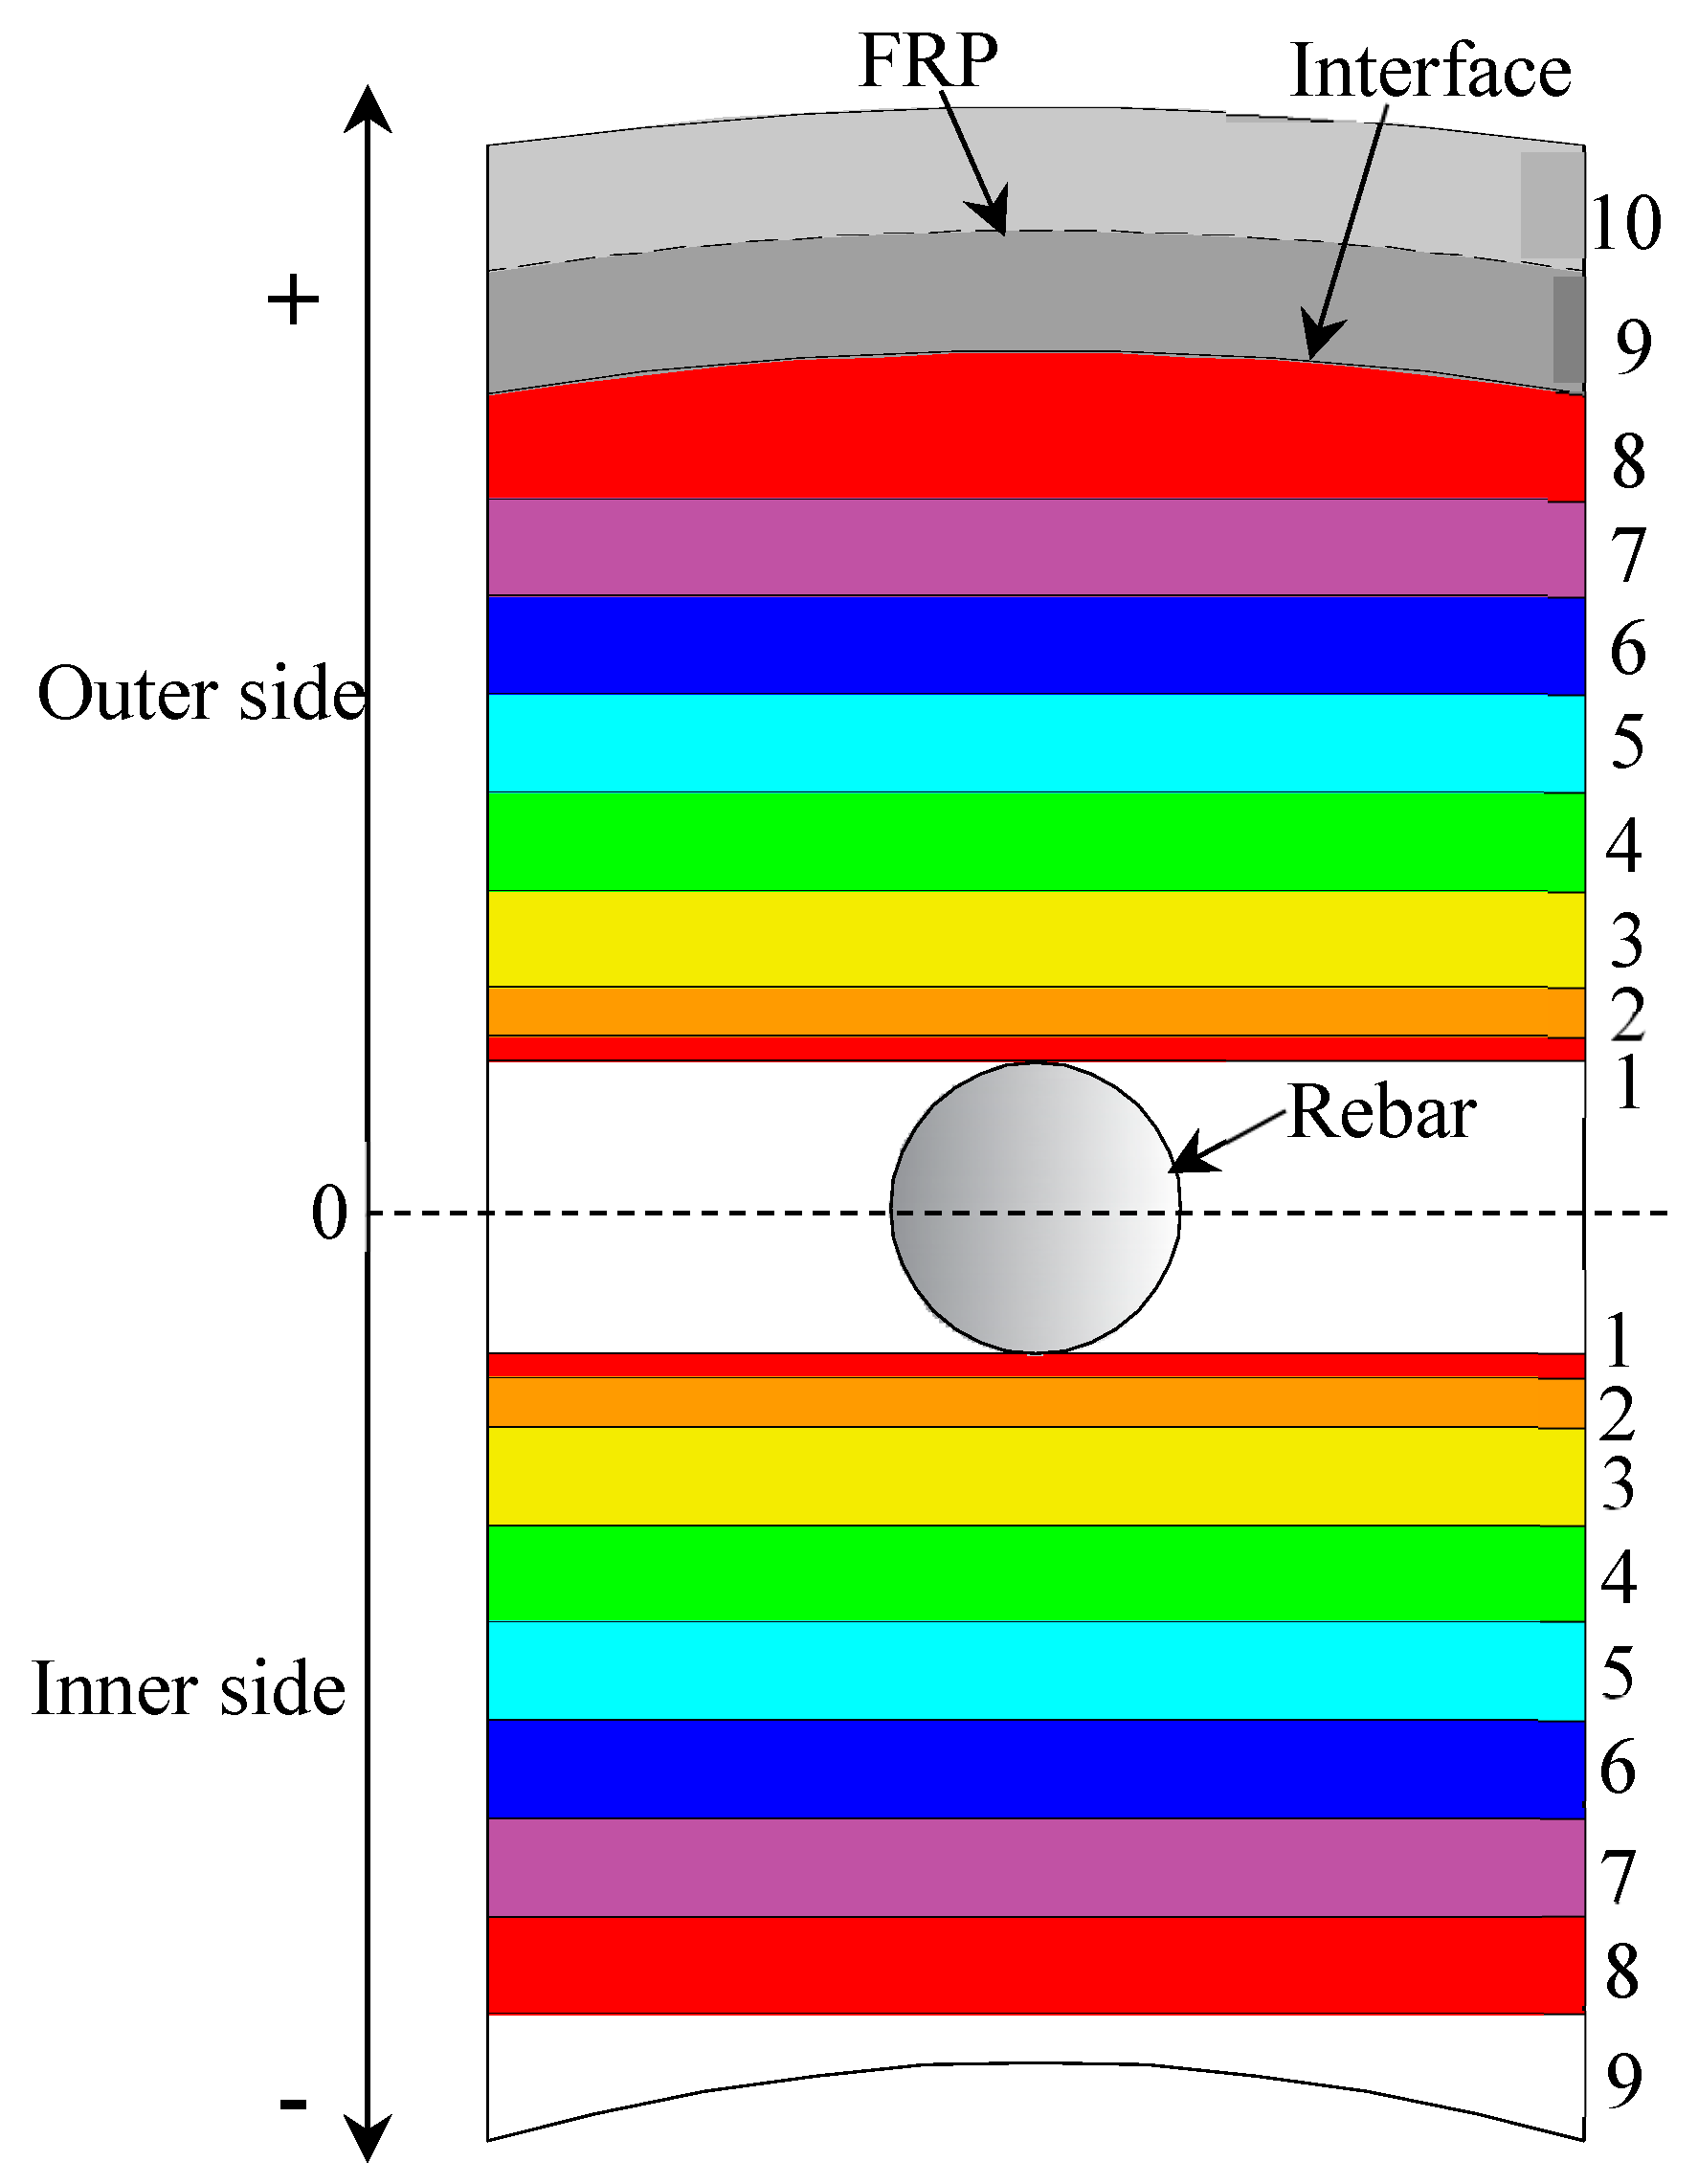
The grinding operation was carried out according to the positions marked with different color bands and shown in Figure 10. The specific sampling process was as follows: (1) Along the positive direction (i.e., the outer side), the concrete located in areas 1, 2, 3, 4, 5, 6, 7, and 8, showed in Figure 10, was sampled, and the center of these areas were 7, 9, 13, 17, 21, 25, 29, and 33 mm from the center of the rebar, respectively; (2) samples were taken from either side of the CFRP, areas 9 and 10, to obtain the distribution of Cl− across the FRCM layer; (3) Along the negative direction (i.e., the inner side), the concrete located in areas 1, 2, 3, 4, 5, 6, 7, 8, and 9, shown in Figure 10, was sampled, and the center of these areas were −7, −9, −11, −14, −18, −22, −26, −29, and -32 mm from the center of the rebar, respectively.
4.1. Influence of Conduction Time
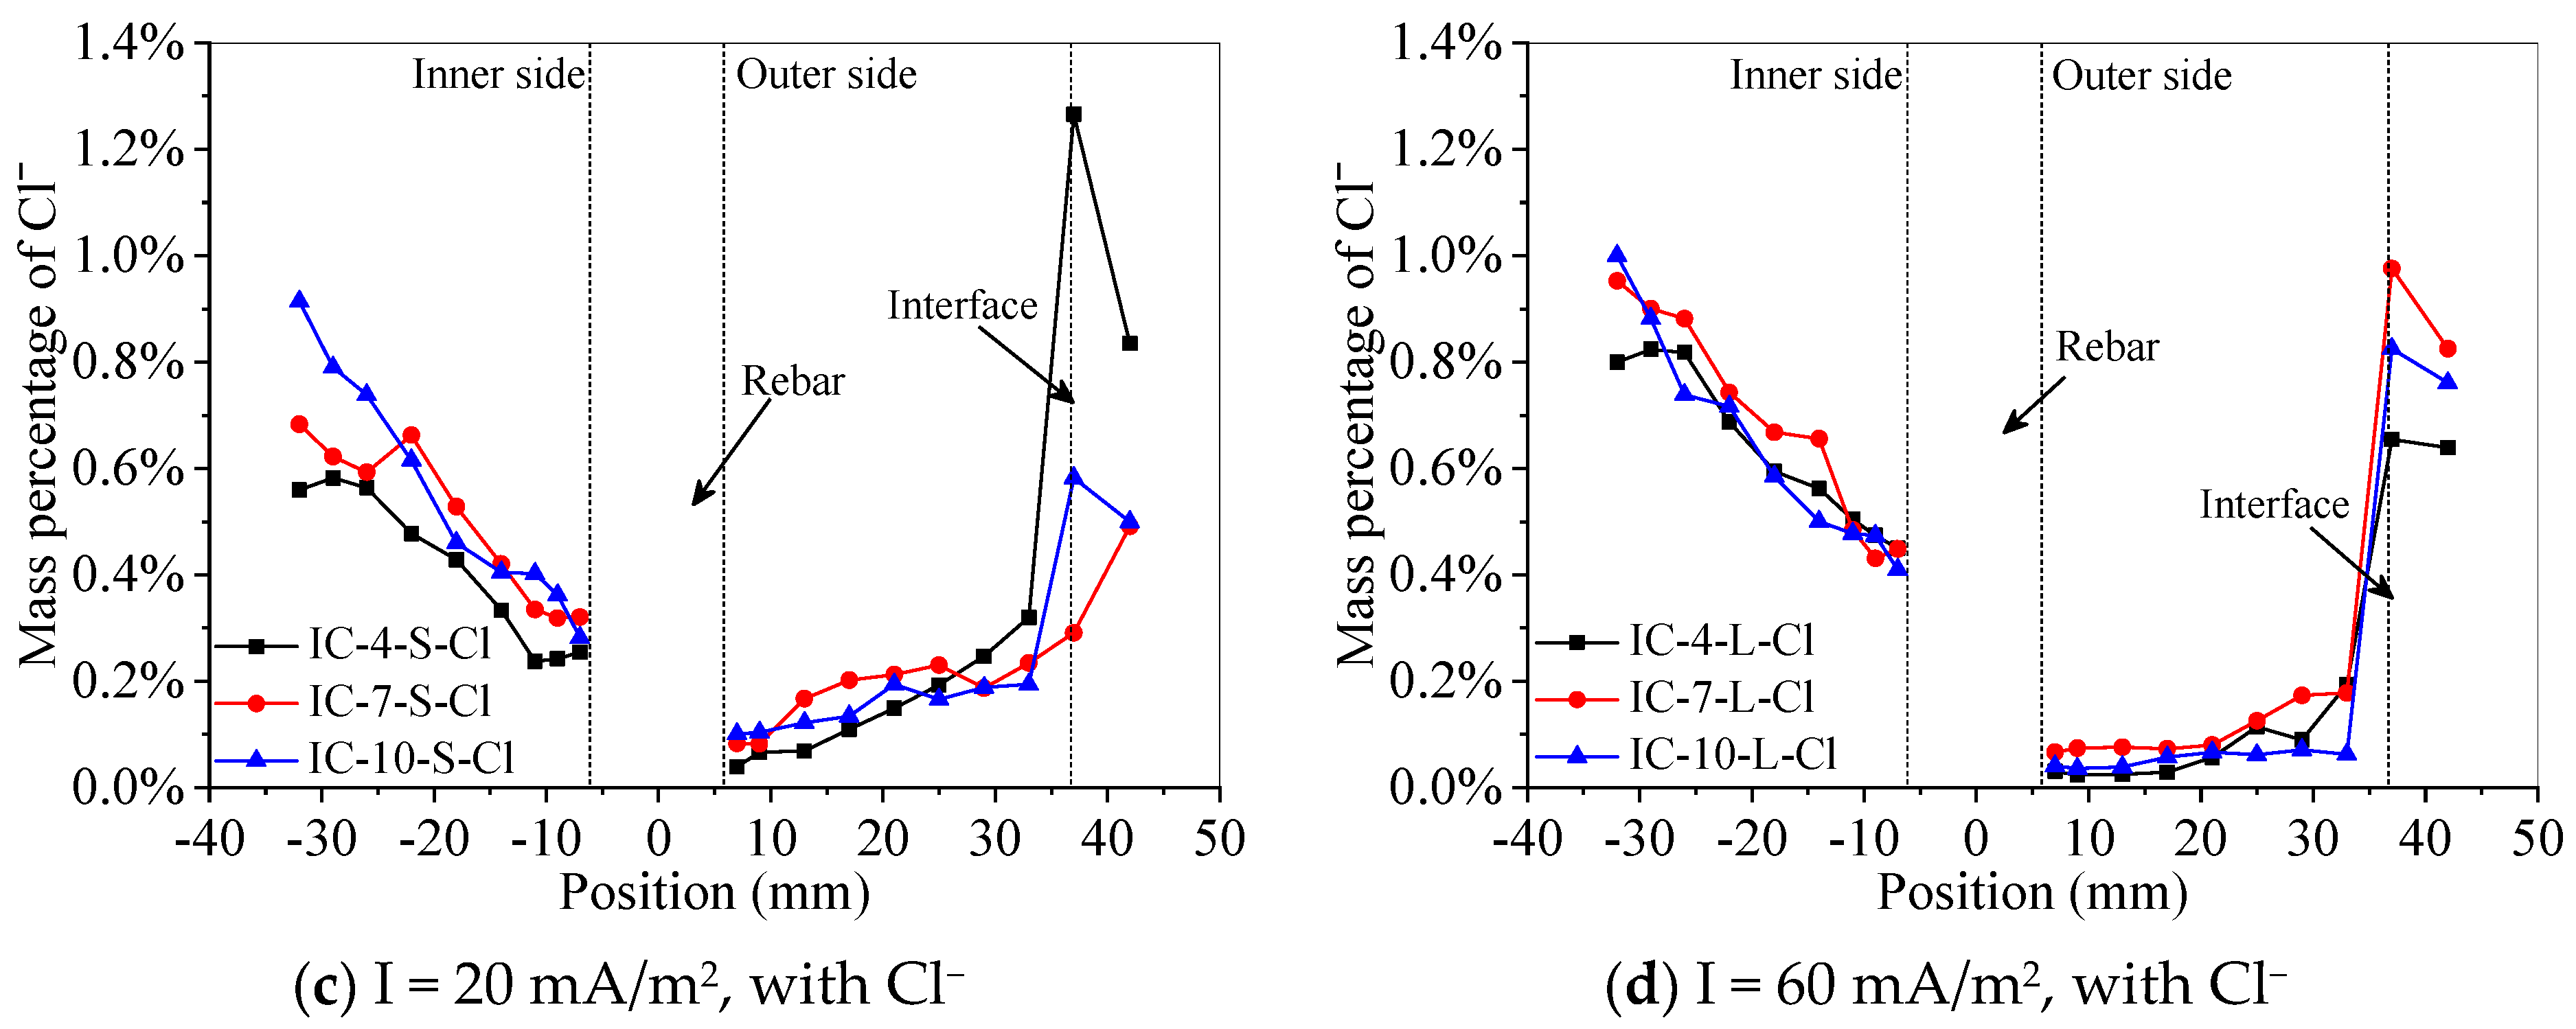
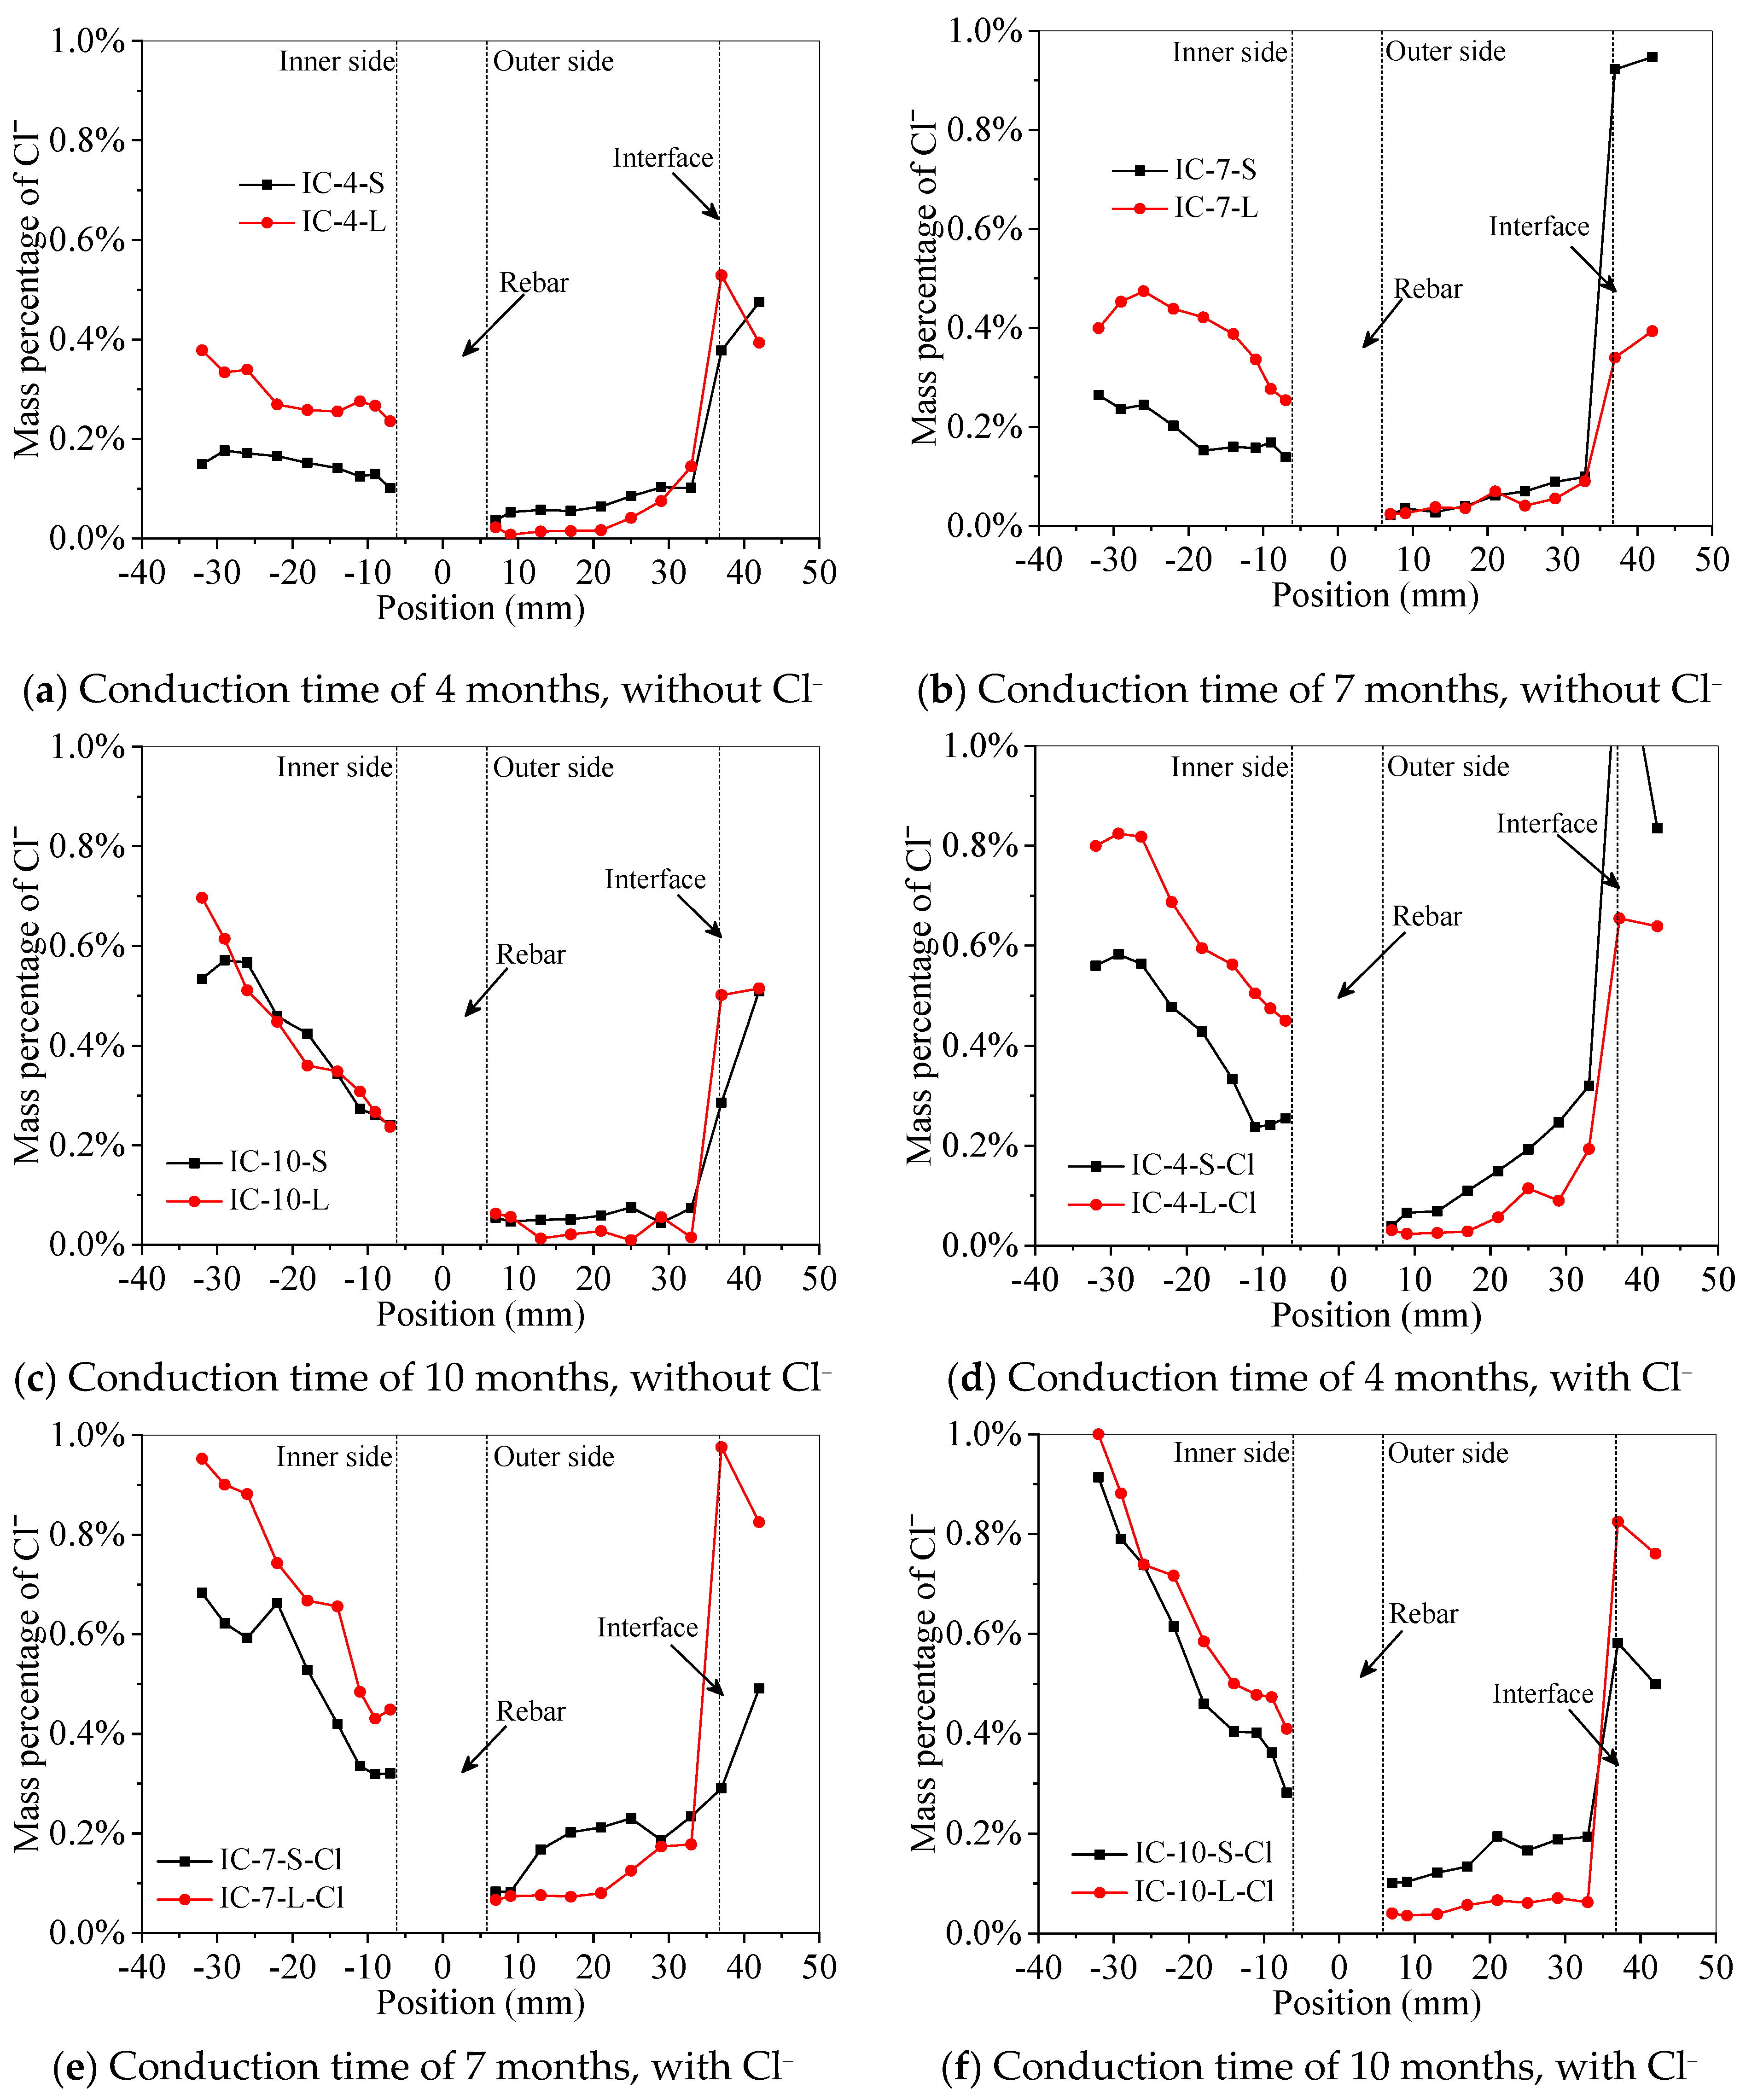
According to Section 2.2, the groups of specimens shown in Table 2 were protected by ICCP for 4, 7, and 10 months with current densities of 20 and 60 mA/m2. Through the potentiometric titration method, the influence of different conduction times, as well as the inclusion of additional salt, on the distribution of Cl− through the depth of the concrete is shown in Figure 11. The location of the rebar and the interface between the concrete and the FRCM layer are also indicated for comparison.
As can be seen from Figure 11, for specimens without salt addition and with protection current densities of 20 mA/m2 (Figure 11a) and 60 mA/m2 (Figure 11b), the following patterns can be found. (1) The Cl− content located toward the inner side of the rebar (x < 0 mm) is generally higher than that of the outer side (x > 0 mm). This is due to the fact that the chlorine salt mainly accumulated in the surface material near the cavity, where the salt was added, and the concentration (i.e., the concentration of the acid-soluble chloride, and the same as the following) of Cl− gradually decreases as it diffused further into the concrete; hence, the Cl− content near the inner surface of the core is higher. (2) The Cl− content gradually decreases from the cavity surface to the surface of the rebars, and this trend is more obvious when the conduction time is longer. (3) The Cl− content of each specimen decreases continuously when getting closer to the rebars, and the discrepancy of Cl− content between each specimen also decreases continuously, especially for the region near the outer surface of the rebar. In addition, the Cl− content near the outer side of the rebar is always larger than that of the inner side. (4) Around the interface between the FRCM and the concrete, the Cl− content increases significantly when comparing a low current density (I = 20 mA/m2) to a high current density (I = 20 mA/m2). This shows that the impressed current causes the Cl− near the rebars to move toward the anode; i.e., the Cl− moves to the vicinity of the CFRP.
For specimens with salt addition and with protection current densities of 20 mA/m2 (Figure 11c) and 60 mA/m2 (Figure 11d), the development of the Cl− content is consistent with conclusion (1) of the specimens without salt addition. However, compared with the above conclusion (2), for the specimens with additional salt, the influence of conduction time on the development trend of the Cl− content from the cavity surface to the vicinity of rebars is not as obvious. The Cl− content close to the rebar is also lower than in the other regions for the salt-added specimens, and the difference between the inner and outer sides of the rebar is also obvious, which is consistent with conclusion (3). Similarly, the Cl− content in the vicinity of the CFRP also increased significantly for the salt-added specimens, which is consistent with the above conclusion (4).
Furthermore, it can be found from Figure 11 that the difference in Cl− content between the inner and outer sides of the rebar is more obvious for specimens with higher current densities, regardless of whether the conduction time was long or short, and irrespective of whether the specimens had salt added or not. This phenomenon is due firstly to the absorption effect the electric field has on Cl− in the cavity, and secondly the barrier the rebar formed to retard the migration process of the Cl−, thus causing a clear difference in Cl− content either side of the rebar. Around the vicinity of the rebar, the Cl− content was at a minimum, less than in other regions in the corresponding direction, even if the rebar blocks the migration of Cl− to a certain extent. This demonstrates that the impressed current can reduce the Cl− content near the rebar, and it proves that ICCP can play a protective role for the reinforcement.
4.2. Influence of Current Density
Based on the potentiometric titration measurements, the influence of different current densities on the distribution of Cl− content, with and without the addition of salt, and for conduction times of 4, 7, and 10 months, is shown in Figure 12.
As can be seen from Figure 12, for specimens without salt addition and with a conduction time of 4 months (Figure 12a) and 7 months (Figure 12b): On the inner side of the rebar (x < 0 mm), a larger current density induces a higher Cl− content, but this effect is less notable with an increase of conduction time. For example, in the specimen with a conduction time of 10 months, shown in Figure 12c, the current densities have little influence on the Cl− content on the inner side of the rebar. For the outer side of the rebar (x > 0 mm), the Cl− content remained at a lower level than the inner side for specimens with different conduction times, and there was no obvious change of the Cl− content even when a larger current density was applied. This is mainly because the Cl− content is relatively low for specimens without salt addition, and the electric field formed by any current can successfully migrate most of the Cl− to the anode. Around the interface between the FRCM and the concrete, the Cl− content increases significantly, showing that the impressed current causes the Cl− to move toward the anode.
For the salt-added specimens (Figure 12d–f), the influence of current density on the Cl− content on the inner side of rebars (x < 0 mm) is similar, except that the overall Cl− content of the salt-added specimens is higher relative to the specimens without salt addition. Thus, the Cl− content on either side of the rebar is higher than that of the specimens without salt addition. It is worth noting that on the outer side of the rebar (x > 0 mm), a relatively lower Cl− content is obtained by applying a larger current density, which is different from the distribution seen on the inner side. This is mainly because the Cl− content of the salt-added specimens is relatively higher than the specimens without, and the electric field formed by a smaller current density is not sufficient to migrate most of the Cl− to the anode. In addition, for the surrounding cementitious material, the Cl− content in the FRCM also increased significantly whether the specimens had salt added or not, and this phenomenon also reinforces that the effect of impressed current causes the Cl− near the rebar to move to the anode.
Overall, in the regions on the inner side of the rebar (x < 0 mm), a larger current density usually lead to higher Cl− content, which may have a negative impact on rebars; however, this negative impact gradually diminished with the increase of conduction time. In the regions on the outer side of the rebar (x > 0 mm), a larger current density usually lead to a better migration effect on Cl−; that is, a larger current density plays a positive role for the protection of rebars.
4.3. Influence of Salt Addition
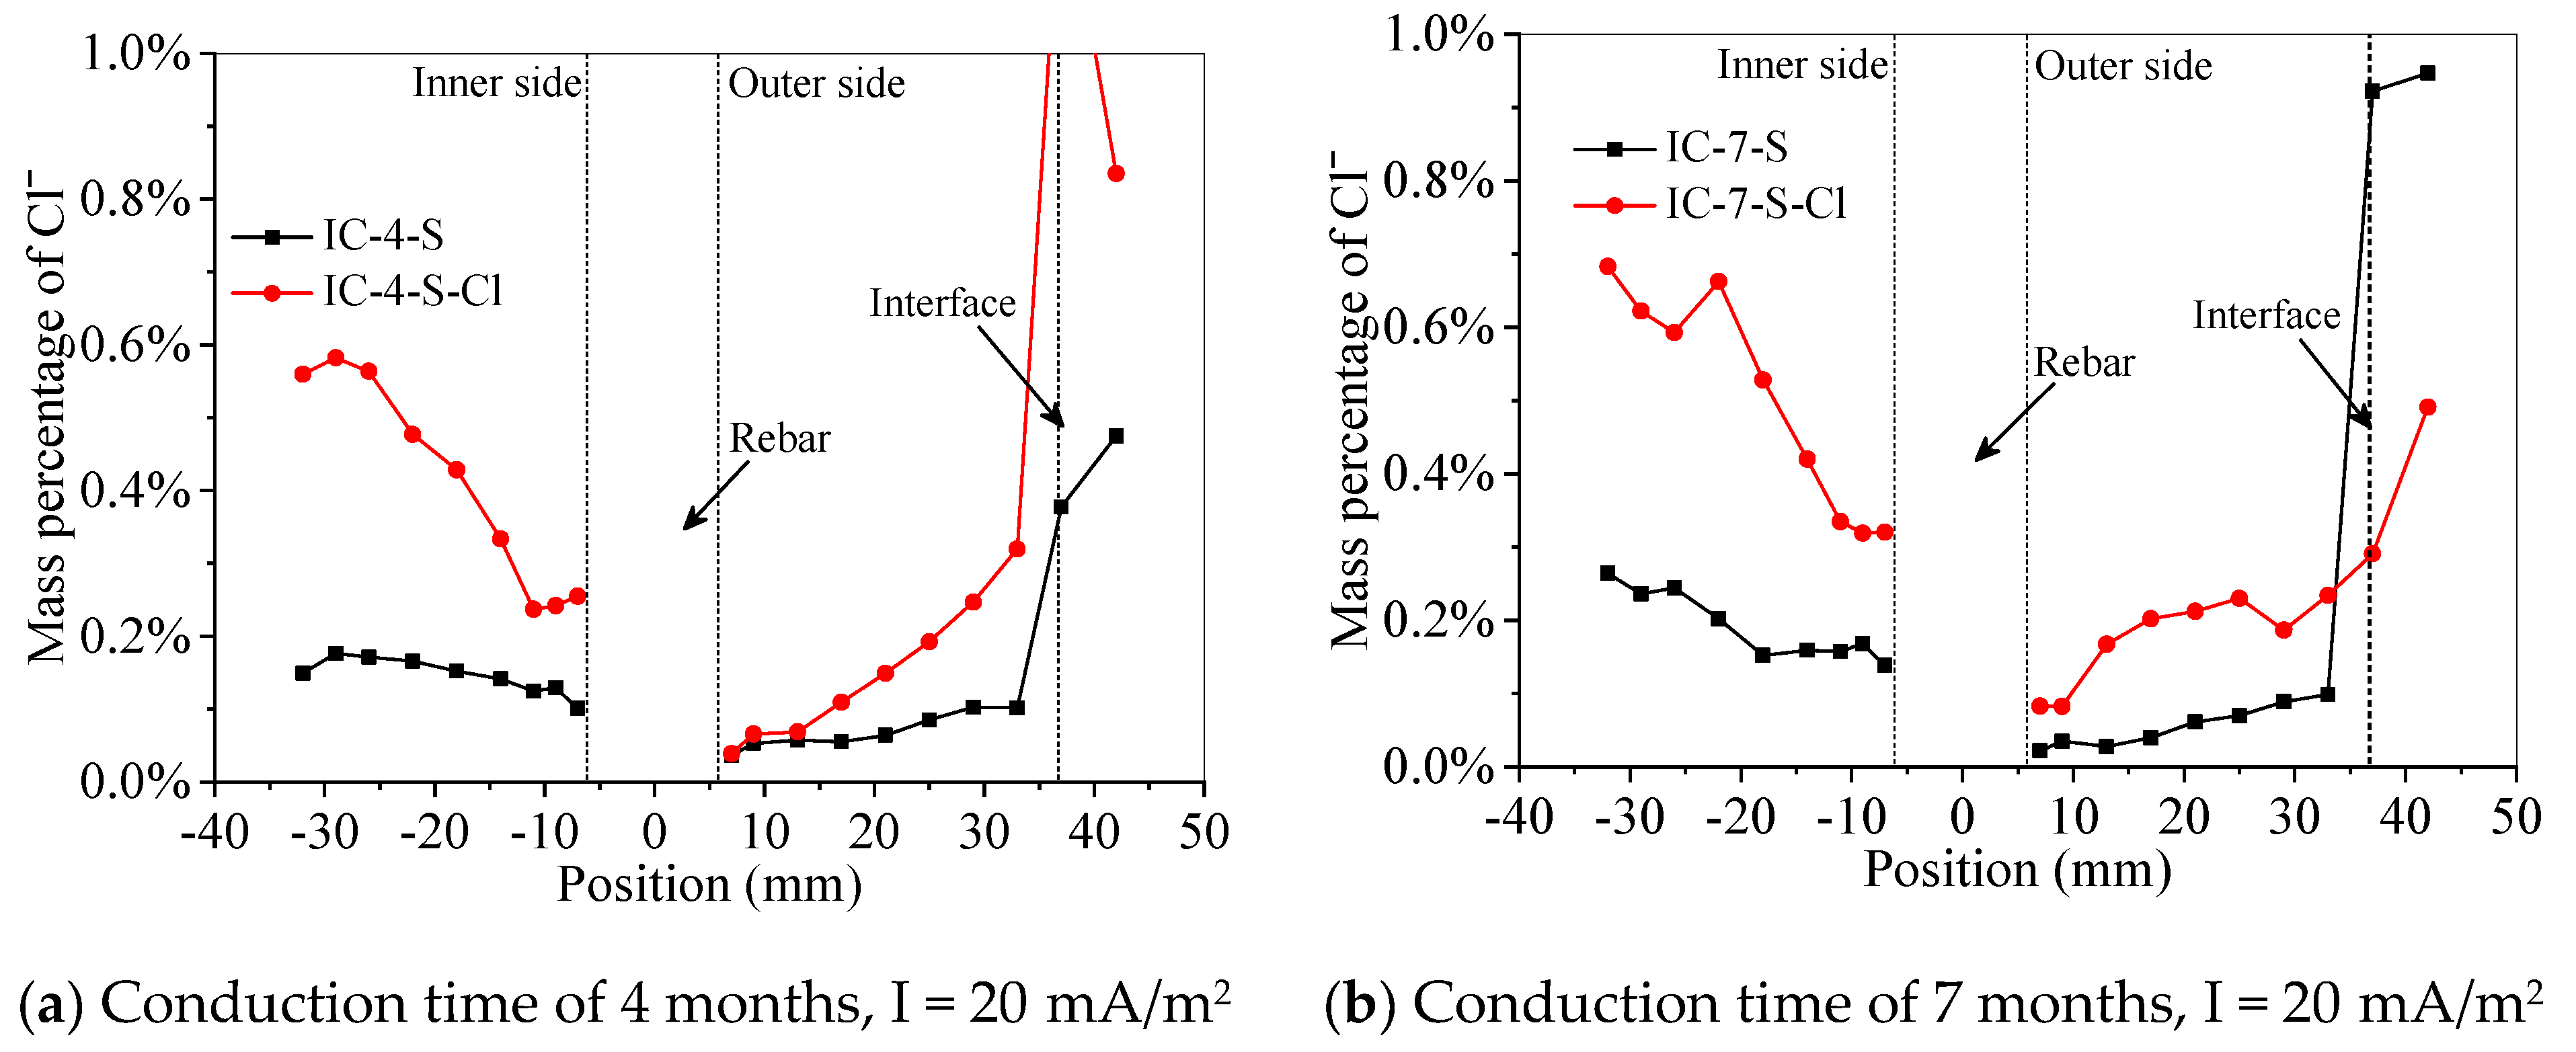
The influence of salt addition on the distribution of Cl− content in both sides of rebars is shown in Figure 13, for specimens protected by ICCP for 4, 7, and 10 months and with current densities of 20 and 60 mA/m2.
As can be seen from Figure 13, for specimens conducted with a current density of 20 mA/m2 (Figure 13a–c), the overall Cl− content of the specimens with salt addition is higher than that of the specimens without salt addition, whether on the inner (x < 0 mm) or outer (x > 0 mm) side of the rebar (except for the CFRM), and the difference is more obvious on the inner side. In addition, from Figure 13, the increase of conduction time has a positive effect on the Cl− content of the specimens with or without salt addition. In Figure 13c, for example, the differences between the Cl− content on the inner side of the rebar, with or without salt addition, are already small compared to specimens with shorter conduction times (Figure 13a,b).
For the specimens conducted with current densities of 60 mA/m2 (Figure 13d–f), the effect of salt addition on the Cl− content in the left and right sides of rebars is similar to that of the 20 mA/m2 specimens; i.e., the Cl− content either side of the rebar is higher in the specimens with salt addition than in those without salt addition, and the difference is more obvious on the inner side of the rebars. We also found the effect that the salt addition has on the Cl− content on the outer side of the rebar; that is, additional salt leads to an increased Cl− content, which is less notable in specimens conducted with current density 60 mA/m2 compared to those conducted with current density of 20 mA/m2. This shows that a larger current density imposes a better migration effect on the Cl− near the rebar. Furthermore, it can be seen from Figure 13 that the Cl− content in the FRCM layer is higher when salt is added than without salt addition. In addition, the Cl− content in the FRCM is much higher than in the concrete on the outer side of the rebar. This shows that the effect of impressed current on the migration of Cl− near the rebars is more obvious, and the protective effect of the impressed current is clearer for specimens with salt addition.
Overall, for the specimens with salt addition (i.e., the simulated pre-corrosion specimens), the Cl− content on either side of the rebar increased compared to the specimens without salt addition. However, the effect of impressed current can help reduce this rise of Cl− content near the rebar, and increasing the density of impressed current as well as increasing the conduction time further reduced the rise of Cl− content on both sides of the rebars.
By analyzing Figure 10, Figure 11, Figure 12 and Figure 13, it could be found that the Cl− content near the inner side of rebars was always larger than the outer side, and it is more obvious for specimens with a relatively higher current density. The reasons were mainly due to the absorption effect of the electric field and the barrier effect of rebars that influence the migration process of Cl−. In summary, the impressed current have reduced most of the Cl− near the inner side of rebars even if part of the Cl− gathered in this region; hence, the ICCP technique can play a positive and protective role for the rebars. The optimal ways to maximize the advantages of ICCP are avoiding using larger current densities and extending the conduction time.
5. Conclusions
In this paper, the axial compression properties of corroded RC hollow columns strengthened by FRCM and the influence of an ICCP-SS system on the migration and distribution laws of Cl− in RC hollow columns were studied through experiments. The following conclusions can be drawn:
(1) FRCM strengthening could increase the ultimate load of the corroded specimens considerably, and the axial displacement corresponding to the ultimate load of the strengthened specimens was larger than that of the unstrengthened specimens. This was especially notable in specimens with higher corrosion ratios;
(2) The ultimate strain of both the strengthened and unstrengthened specimens increased with the increase of corrosion ratio;
(3) During the migration process of Cl− from cathode to anode, the rebar would have a blocking effect, thus causing the Cl− content on the inner side of the rebar to always be larger than the on the outer side;
(4) For the specimens with salt addition, the Cl− content in both sides of rebars would increase compared to the specimens without salt addition. However, this increase was affected by the impressed current. A higher current density or longer conduction time reduces the increase of Cl− seen after the addition of salt;
(5) The content of Cl− in the FRCM increased whether the specimens had salt addition or not when the impressed current was applied, which indicates that the Cl− content near the rebars had moved to the anode (i.e., the CFRP) due to the influence of the impressed current.
Author Contributions
Conceptualization, J.C. and J.-H.Z.; methodology, J.C., J.W. and J.-H.Z.; software, J.C., J.W. and J.-H.Z.; validation, J.C. and J.-H.Z.; formal analysis, J.C., J.W. and Y.F.; investigation, J.W. and Y.F.; resources, J.C. and J.-H.Z.; data curation, J.C., J.W. and Y.F.; writing—original draft preparation, J.C. and J.W.; writing—review and editing, J.C., J.W. and J.-H.Z.; visualization, J.C., J.-H.Z. and C.-B.L.; supervision, J.C., J.-H.Z. and C.-B.L.; project administration, J.C. and J.-H.Z. All authors have read and agreed to the published version of the manuscript.
Funding
The research described in this paper was supported by the Key-Area Research and Development Program of Guangdong Province (2019B111107002), the National Key Research and Development Program of China (2018YFE0124900), the National Natural Science Foundation of China (51538007/51778370/51908016/51861165204), the Natural Science Foundation of Guangdong (2017B030311004), and the Shenzhen Science and Technology Project (GJHZ20180928155819738).
Data Availability Statement
The data presented in this study are available on request from the corresponding author.
Acknowledgments
The authors would like to thank the technicians in Zhejiang University and Shenzhen University for fabricating and testing work on the topics related to this work.
Conflicts of Interest
We declare that we have no financial and personal relationships with other people or organizations that can inappropriately influence our work, there is no professional or other personal interest of any nature or kind in any product, service and/or company that could be construed as influencing the position presented in, or the review of, the manuscript entitled “Study on the Corroded Hollow Section RC Columns Strengthened by ICCP-SS System”.
References
- Kusumawardaningsih, Y.; Hadi, M.N.S. Comparative behaviour of hollow columns confined with FRP composites. Compos. Struct. 2010, 93, 198–205. [Google Scholar] [CrossRef]
- Shin, M.; Choi, Y.Y.; Sun, C.H.; Kim, I.H. Shear strength model for reinforced concrete rectangular hollow columns. Eng. Struct. 2013, 56, 958–969. [Google Scholar] [CrossRef]
- Xu, J.; Li, F.; Zhao, J.; Huang, L. Model of time-dependent and stress-dependent chloride penetration of concrete under sustained axial pressure in the marine environment. Constr. Build. Mater. 2018, 170, 207–216. [Google Scholar] [CrossRef]
- Su, M.-N.; Wei, L.-L.; Zeng, Z.-W.; Ueda, T.; Xing, F.; Zhu, J.-H. A solution for sea-sand reinforced concrete beams. Constr. Build. Mater. 2019, 204, 586–596. [Google Scholar] [CrossRef]
- Zhu, J.-H.; Su, M.-N.; Huang, J.-Y.; Ueda, T.; Xing, F. The ICCP-SS technique for retrofitting reinforced concrete compressive members subjected to corrosion. Constr. Build. Mater. 2018, 167, 669–679. [Google Scholar] [CrossRef] [Green Version]
- Azam, R.; Soudki, K.; West, J.S.; Noël, M. Strengthening of shear-critical RC beams: Alternatives to externally bonded CFRP sheets. Constr. Build. Mater. 2017, 151, 494–503. [Google Scholar] [CrossRef]
- Colajanni, P.; Fossetti, M.; Macaluso, G. Effects of confinement level, cross-section shape and corner radius on the cyclic behavior of CFRCM confined concrete columns. Constr. Build. Mater. 2014, 55, 379–389. [Google Scholar] [CrossRef]
- Zhu, J.-H.; Wei, L.; Moahmoud, H.; Redaelli, E.; Xing, F.; Bertolini, L. Investigation on CFRP as dual-functional material in chloride-contaminated solutions. Constr. Build. Mater. 2017, 151, 127–137. [Google Scholar] [CrossRef]
- Wei, L.-L.; Zhu, J.-H.; Ueda, T.; Su, M.-N.; Liu, J.; Liu, W.; Tang, L.P.; Xing, F. Tensile behaviour of carbon fabric reinforced cementitious matrix composites as both strengthening and anode materials. Compos. Struct. 2020, 234, 111675. [Google Scholar] [CrossRef]
- Walraven, J. Synthesized intervention method to prolong service life of reinforced concrete structures: ICCP-SS. Struct. Concr. 2021, 22, 590–592. [Google Scholar] [CrossRef]
- Peled, A. Confinement of Damaged and Nondamaged Structural Concrete with FRP and TRC Sleeves. J. Compos. Constr. 2007, 11, 514–522. [Google Scholar] [CrossRef]
- Bournas, D.A.; Lontou, P.V.; Papanicolaou, C.G.; Triantafillou, T.C. Textile-reinforced mortar versus fiber-reinforced polymer confinement in reinforced concrete columns. ACI Struct. J. 2007, 104, 740. [Google Scholar]
- Gopinath, S.; Iyer, N.R.; Gettu, R.; Palani, G.S.; Murthy, A.R. Confinement effect of glass fabrics bonded with cementitious and organic binders. Procedia. Eng. 2011, 14, 535–542. [Google Scholar] [CrossRef] [Green Version]
- Di Ludovico, M.; Prota, A.; Manfredi, G. Structural upgrade using basalt fibers for concrete confinement. J. Compos. Constr. 2010, 14, 541–552. [Google Scholar] [CrossRef]
- Ombres, L. Concrete confinement with a cement based high strength composite material. Compos. Struct. 2014, 109, 294–304. [Google Scholar] [CrossRef]
- Colajanni, P.; De Domenico, F.; Recupero, A.; Spinella, N. Concrete columns confined with fibre reinforced cementitious mortars: Experimentation and modelling. Constr. Build. Mater. 2014, 52, 375–384. [Google Scholar] [CrossRef]
- Hu, J.-Y.; Li, S.; Lu, Y.-Y.; Zhang, H.-Y.; Zhang, M.-Z. Efficiency of electrochemical extraction of chlorides in fly ash concrete using carbon fibre mesh anode. Constr. Build. Mater. 2020, 249, 118717. [Google Scholar] [CrossRef]
- El Maaddawy, T.A.; Soudki, K.A. Effectiveness of impressed current technique to simulate corrosion of steel reinforcement in concrete. J. Mater. Civ. Eng. 2003, 15, 41–47. [Google Scholar] [CrossRef]
- Standard Test Method for Compressive Strength of Cylindrical Concrete Specimens; ASTM C39; ASTM: West Conshohocken, PA, USA, 2012.
- Standard Test Methods for Properties of Continuous Filament Carbon and Graphite Fiber Tows; ASTM D4018; ASTM: West Conshohocken, PA, USA, 2017.
- Acceptance Criteria for Masonry and Concrete Strengthening Using Fabric-Reinforced Cementitious Matrix (Frcm) and Steel Reinforced Grout (Srg) Composite Systems; AC434; ICC-Evaluation Service: Whittier, CA, USA, 2016.
- Campione, G.; Cannella, F.; Minafo, G. A simple model for the calculation of the axial load-carrying capacity of corroded RC columns. Mater. Struct. 2016, 49, 1935–1945. [Google Scholar] [CrossRef]
- Sun, X.-Y.; Kong, H.-T.; Wang, H.-L.; Zhang, Z.-C. Evaluation of corrosion characteristics and corrosion effects on the mechanical properties of reinforcing steel bars based on three-dimensional scanning. Corros. Sci. 2018, 142, 284–294. [Google Scholar] [CrossRef]
Figure 1.
Details of the axial compression specimens (unit: mm).

Figure 2.
Configuration of specimens subjected to accelerated corrosion.

Figure 3.
Details of specimens under the protection of ICCP-SS (unit: mm).

Figure 4.
Schematic and physical diagrams of specimens protected by the ICCP-SS system.

Figure 5.
Bidirectional fiber mesh and mechanical properties test of carbon fiber bundles.

Figure 6.
Test setup and schematic diagram of the axial compression test.

Figure 7.
Failure modes of the axial compression specimens.


Figure 8.
Comparison of load–displacement curves of strengthened and unstrengthened specimens with different corrosion ratios.
Figure 8.
Comparison of load–displacement curves of strengthened and unstrengthened specimens with different corrosion ratios.

Figure 9.
Drilling process and the core sample.

Figure 10.
Sampling positions of grinding powders.

Figure 11.
Influence of different conduction times and salt addition on the distribution of Cl− content on both sides of rebars.
Figure 11.
Influence of different conduction times and salt addition on the distribution of Cl− content on both sides of rebars.


Figure 12.
Influence of different current densities on the Cl− content at both sides of rebars.

Figure 13.
Influence of salt addition or not on distribution of Cl− content in both sides of rebars.
Figure 13.
Influence of salt addition or not on distribution of Cl− content in both sides of rebars.


Table 1.
Details of axial compression specimens.
| Group | Specimen | FRCM | D/mm | d/mm | ρ | Ia/mA/cm2 | Ta/Hour | Corrosion Ratio |
|---|---|---|---|---|---|---|---|---|
| 1 | I-0-S | Yes | 300 | 160 | 0.53 | 0.5 | 0 | 0% |
| I-5-S | Yes | 300 | 160 | 0.53 | 0.5 | 225.0 | 5% | |
| I-10-S | Yes | 300 | 160 | 0.53 | 0.5 | 450.0 | 10% | |
| I-15-S | Yes | 300 | 160 | 0.53 | 0.5 | 675.0 | 15% | |
| I-20-S | Yes | 300 | 160 | 0.53 | 0.5 | 899.9 | 20% | |
| I-25-S | Yes | 300 | 160 | 0.53 | 0.5 | 1124.9 | 25% | |
| 2 | I-0 | No | 300 | 160 | 0.53 | 0.5 | 0 | 0% |
| I-5 | No | 300 | 160 | 0.53 | 0.5 | 225.0 | 5% | |
| I-10 | No | 300 | 160 | 0.53 | 0.5 | 450.0 | 10% | |
| I-15 | No | 300 | 160 | 0.53 | 0.5 | 675.0 | 15% | |
| I-20 | No | 300 | 160 | 0.53 | 0.5 | 899.9 | 20% | |
| I-25 | No | 300 | 160 | 0.53 | 0.5 | 1124.9 | 25% |
Note: In Table 1, ρ is the hollow ratio of the specimens, and ρ = d/D; Ia is the current density used to accelerate corrosion, and Ta is the electrifying time for accelerated corrosion. In the name of a specimen, I means that the specimen is charged with direct current; the following number represents the corrosion ratio of the specimen, while S indicates that the specimen is strengthened by FRCM. For example, the specimen named I-15-S means the specimen is subjected to direct current, the corrosion ratio of rebar is 15%, and it is strengthened by FRCM.
Table 2.
Details of specimens under the protection of ICCP-SS system.
| Group | Specimen | ICCP | Adding Cl− | D/mm | d/mm | ρ | Ip/mA/m2 | Tp/Month |
|---|---|---|---|---|---|---|---|---|
| 1 | IC-4-S-Cl | Yes | Yes | 300 | 160 | 0.53 | 20 | 4 |
| IC-7-S-Cl | Yes | Yes | 300 | 160 | 0.53 | 20 | 7 | |
| IC-10-S-Cl | Yes | Yes | 300 | 160 | 0.53 | 20 | 10 | |
| IC-4-L-Cl | Yes | Yes | 300 | 160 | 0.53 | 60 | 4 | |
| IC-7-L-Cl | Yes | Yes | 300 | 160 | 0.53 | 60 | 7 | |
| IC-10-L-Cl | Yes | Yes | 300 | 160 | 0.53 | 60 | 10 | |
| 2 | IC-4-S | Yes | No | 300 | 160 | 0.53 | 20 | 4 |
| IC-7-S | Yes | No | 300 | 160 | 0.53 | 20 | 7 | |
| IC-10-S | Yes | No | 300 | 160 | 0.53 | 20 | 10 | |
| IC-4-L | Yes | No | 300 | 160 | 0.53 | 60 | 4 | |
| IC-7-L | Yes | No | 300 | 160 | 0.53 | 60 | 7 | |
| IC-10-L | Yes | No | 300 | 160 | 0.53 | 60 | 10 |
Note: In Table 2, Ip is the current density used for ICCP protection. In the name of specimens, IC means that the ICCP protection was applied; 4, 7, and 10 indicate that the ICCP protection lasted for 4, 7, or 10 months; S and L represent that the current density used for ICCP protection was small (20 mA/m2) or large (60 mA/m2), respectively; Cl means that 3% (mass percent) of NaCl was pre-added into the concrete. For example, the specimen named IC-7-L-Cl means that 3% of NaCl was pre-added into the concrete, and the specimen was protected by ICCP for 7 months with a current density of 60 mA/m2.
Table 3.
Mix design of concrete.
| Composition | Cement/kg/m3 | Coarse Aggregate/kg/m3 | Sand/kg/m3 | Water/kg/m3 |
|---|---|---|---|---|
| Amount | 386.1 | 1194.5 | 643.6 | 197.6 |
Table 4.
Mechanical properties of the CFRP.
| t/mm | EC/MPa | fu-C/MPa | εu-C |
|---|---|---|---|
| 0.046 | 181 | 2077 | 1.17% |
Note: In Table 4, t is the calculated thickness (ratio of the area to the width of a single strand CFRP) of carbon fiber material; E is the modulus of elasticity; fu-C is the ultimate tensile strength; εu-C is the ultimate tensile strain.
Table 5.
Average values of the tensile mechanical properties of FRCM plates.
| Layers of CFRP | E*F/GPa | EF/GPa | εt | εu-F | fu-F/MPa |
|---|---|---|---|---|---|
| 1 | 6862.1 | 150.8 | 0.018% | 0.38% | 1539 |
| 2 | 5656.0 | 77.3 | 0.012% | 1.29% | 1630 |
Note: In Table 5, E*F is the stiffness of FRCM before the cracking of cementitious material; EF is the stiffness of FRCM after cracking of cementitious material; εt is the strain of FRCM corresponding to cracking of cementitious material; εu-F is the ultimate strain of FRCM; fu-F is the ultimate strength of FRCM.
Table 6.
Test results of the axial compression specimens.
| Specimen | Corrosion Ratio η | Nu/kN | σu/MPa | εu0/% |
|---|---|---|---|---|
| I1-0-S | 0% | 1285.8 | 21.3 | 0.58 |
| I1-5-S | 5% | 1270.0 | 21.1 | 0.96 |
| I1-10-S | 10% | 1156.9 | 19.2 | 0.99 |
| I1-15-S | 15% | 1134.5 | 18.8 | 1.21 |
| I1-20-S | 20% | 1079.2 | 17.9 | 1.35 |
| I1-25-S | 25% | 1020.6 | 16.9 | 1.13 |
| I1-0 | 0% | 835.9 | 16.5 | 0.38 |
| I1-5 | 5% | 738.6 | 14.6 | 0.54 |
| I1-10 | 10% | 711.8 | 14.1 | 0.49 |
| I1-15 | 15% | 659.0 | 13.0 | 0.60 |
| I1-20 | 20% | 612.1 | 12.1 | 0.74 |
| I1-25 | 25% | 547.6 | 10.8 | 0.76 |
Table 7.
Compressive strength of core concrete of tested specimens.
| Specimen | η | fcc/MPa | fco/MPa | βρ | Kη-Test | Kη-Design |
|---|---|---|---|---|---|---|
| I-0-S | 0% | 13.45 | 1.35 | 1.00 | 1.00 | |
| I-5-S | 5% | 13.51 | 1.61 | 1.19 | 1.04 | |
| I-10-S | 10% | 11.62 | 1.42 | 1.05 | 1.08 | |
| I-15-S | 15% | 11.54 | 1.53 | 1.14 | 1.13 | |
| I-20-S | 20% | 10.81 | 1.56 | 1.15 | 1.17 | |
| I-25-S | 25% | 10.01 | 1.66 | 1.23 | 1.21 | |
| I-0 | 0% | 9.95 | ||||
| I-5 | 5% | 8.37 | ||||
| I-10 | 10% | 8.21 | ||||
| I-15 | 15% | 7.52 | ||||
| I-20 | 20% | 6.95 | ||||
| I-25 | 25% | 6.03 |
Note: In Table 7, βρ is the ratio of fcc and fco, i.e., βρ = fcc/fco; Kη-Test is the ratio of βρ (with different corrosion ratios) and βρ0 (with the corrosion ratio of 0%), i.e., Kη-Test = βρ/βρ0; Kη-Design is calculated based on the fitting equation of Equation (3).
Publisher’s Note: MDPI stays neutral with regard to jurisdictional claims in published maps and institutional affiliations. |
© 2021 by the authors. Licensee MDPI, Basel, Switzerland. This article is an open access article distributed under the terms and conditions of the Creative Commons Attribution (CC BY) license (https://creativecommons.org/licenses/by/4.0/).
Share and Cite
MDPI and ACS Style
Chen, J.; Wang, J.; Zhu, J.-H.; Feng, Y.; Liu, C.-B. Study on the Corroded Hollow Section RC Columns Strengthened by ICCP-SS System. Buildings 2021, 11, 197. https://0-doi-org.brum.beds.ac.uk/10.3390/buildings11050197
AMA Style
Chen J, Wang J, Zhu J-H, Feng Y, Liu C-B. Study on the Corroded Hollow Section RC Columns Strengthened by ICCP-SS System. Buildings. 2021; 11(5):197. https://0-doi-org.brum.beds.ac.uk/10.3390/buildings11050197
Chicago/Turabian StyleChen, Ju, Jun Wang, Ji-Hua Zhu, Yuan Feng, and Cheng-Bin Liu. 2021. "Study on the Corroded Hollow Section RC Columns Strengthened by ICCP-SS System" Buildings 11, no. 5: 197. https://0-doi-org.brum.beds.ac.uk/10.3390/buildings11050197
Note that from the first issue of 2016, this journal uses article numbers instead of page numbers. See further details here.