Article

Digital Modelling and Accuracy Verification of a Complex Architectural Object Based on Photogrammetric Reconstruction

1
Faculty of Architecture, Cracow University of Technology, Warszawska 24, 31-155 Kraków, Poland
2
Faculty of Computer Science and Telecommunications, Cracow University of Technology, Warszawska 24, 31-155 Kraków, Poland
*
Author to whom correspondence should be addressed.
Submission received: 31 March 2021 / Revised: 11 May 2021 / Accepted: 13 May 2021 / Published: 15 May 2021
(This article belongs to the Special Issue Computer Aided Architectural Design)

Abstract

:
Data concerning heritage buildings are necessary for all kinds of building surveying and design. This paper presents a method for creating a precise model of a historical architectural and landscape object with complex geometry. Photogrammetric techniques were used, combining terrestrial imaging and photographs taken using UAVs. In large-scale objects, it is necessary to divide the reconstruction into smaller parts and adopt an iterative approach based on the gradual completion of missing fragments, especially those resulting from occlusions. The model developed via the reconstruction was compared with geometrically reliable data (LAS point clouds) available in the public domain. The degree of accuracy it achieved can be used in conservation, for example, in construction cost estimates. Despite extensive research on photogrammetric techniques and their applicability in reconstructing cultural heritage sites, the results obtained have not yet been compared by other researchers with LAS point clouds from the information system for land cover (ISOK).

1. Introduction

Historic buildings are usually characterised by complex geometry. Due to both the technology of their construction and history, which can span several centuries, significant deviations from primary solids can be observed in their shape. Therefore, the existence of right angles is not to be expected, nor are plumb walls [1]. Such buildings and their fragments were often subjected to redevelopment, and have suffered varying degrees of damage caused by land subsidence on the one hand, and hostilities on the other [2]. Renovation and conservation may have entailed changes to their form, occurring at different scales, so the precise reproduction of their currently existing three-dimensional building shells in a digital model is a very complex task [3].
The direct measurement of a building is a cost- and time-consuming task; moreover, in the case of a structure of considerable size, access to some building fragments, especially those located higher up, is difficult. Remote sensing and photogrammetric methods may be used for this purpose.
In Poland, by virtue of the law [4], numerical terrain model and land cover data are currently available free of charge. They can be downloaded from the governmental servers of Geoportal Krajowy [5] as a grid of points with x, y, z coordinates, deployed at 1 m intervals. There are also LAS standard point cloud data available [6], acquired as a part of the ISOK project (National Land Cover IT System) [7]. These data are reliable in terms of geolocation, but insufficient, especially in the case of building walls, which, as elements with near-vertical geometry, are very poorly filled out with points since they are recorded on the basis of LiDAR measurement [8]. The fixed mensuration interval does not provide coordinates for a building’s distinctive points (corners, ridges, the tops of towers). For the above reasons, these data need to be acquired to generate a 3D model of a historic building or architectural complex [9].
Photogrammetric reconstruction consists of retrieving the position and spatial relations among 3D points of observed surfaces based on 2D photographs [10]. Two premises are required for photogrammetric reconstruction: (1) a set of photographs, and (2) reconstruction routines. The reconstruction routines consist of: (1) the detection of key-points in photographs, (2) the determination of spatial relations between them, (3) the approximation of the position of key-points in 3D with a dense cloud of points, and (4) adapting a triangular topology to it. This approach is known in the literature as structure from motion (SfM) [11]. One of photogrammetry’s most significant problems is sufficient feature detection in images [12]. Furthermore, the photogrammetric reconstruction can be followed by the meshing of surface structures [13,14], as well as manual or automatic data fusion [15].
Over the past few years, these new technologies have become essential tools for cultural heritage professionals to analyse, reconstruct, and interpret data. The application of photogrammetric reconstruction ranges from the reconstruction of museum collections [16,17], the documentation of buildings and complexes of buildings [2,18] to the reconstruction of fragments of the historical landscape [19]. Photogrammetric reconstructions are also used in a wide range of architectural modelling work. One example is generating a physical model prototype for feasibility studies, construction planning, and safety analysis [20]. Properly parameterised and reconstructed, spatial data can be used for defect detection and deformation measurement [21,22]. The resulting 3D models can also be used in heritage building information modelling (HBIM) applications [23,24,25,26] and to evaluate distinctive properties of existing buildings [27]. SFM and MVS reconstructions made using VisualSFM software can monitor construction progress via comparison with BIM models [28]. The model can be presented as a video game environment [29], a virtual reality element, or be recreated in 3D printing as a mock-up, which guarantees the accessibility of knowledge for blind and visually impaired people [30].
A 3D building reconstruction can be derived from different types of data—satellite data [31], stereoscopic data [32] and LiDAR data [33,34,35,36] are used for this purpose. Due to the widespread use of unmanned aerial vehicles (UAV) technology, there is an increasing number of studies demonstrating the potential for reconstruction both based on data acquired only with UAVs and their combination with terrestrial data [15,37,38,39,40,41]. Increasingly sophisticated IT tools are being used [26,32,42,43] in the process of reconstructing buildings and improving the accuracy of this process. However, this precision cannot always be verified. A process for validating the accuracy of photogrammetric reconstructions for architectural and archaeological heritage using terrestrial laser scanning was proposed in [44] and another for improving this accuracy in [15].
In our paper, we have proposed simple and relatively easily accessible methods of combining terrestrial and UAV photography. We have shown the faults resulting from the automatic process of combining data from different sources and how to correct them. We have presented examples of how insufficient data can be supplemented with data from other sources. Finally, we have presented a verification of the resulting reconstruction of a monument with a complex geometrical form by comparing it with a model obtained using a LiDAR point cloud from the ISOK project.

2. Materials and Methods

Nowy Wiśnicz Castle was used as an example of a digital model created using the photogrammetric reconstruction method. The town of Nowy Wiśnicz is located in southern Poland (Figure 1), and its history dates back to the 14th century. It was a magnate estate which enjoyed its greatest development under the Kmita family of the coat of arms of Szreniawa, namely in the 16th century. The town formed an urban complex with a local discalced carmelite monastery and the previously mentioned castle, located on the hills rising to the east of the town. In the following centuries, the estate passed into the hands of the Lubomirski family. In 1616, Wiśnicz was granted town rights, and at the end of the 16th century, the castle was extended as a palazzo in fortezza in an early Baroque style, according to the design of the Italian architect Maciej Trapola. In the 17th century, a Baroque entrance gate was built. The castle itself was abandoned in the first half of the 19th century, and fell into ruin in the subsequent decades. At the start of the 20th century, it was bought by the heirs of the Lubomirski family, and after the Second World War it was taken over by the State Treasury [45,46,47,48]. As a result, it was possible to carry out a general renovation and reconstruction of this highly significant historical building. The urban layout of Nowy Wiśnicz, the castle and the monastery were declared a monument to history in 2020, which confirmed their cultural value [49].
At present, the property comprises the castle’s main body, built on a quadrilateral plan with an inner courtyard surrounded by a two-storey loggia, topped with five towers. On the western side, there is a formal gallery, on the eastern side—a chapel from 1621; and on the south-eastern side—a lower building, the so-called Kmitówka. The castle is surrounded by an external courtyard and bastion fortifications with a pentagonal outline [50,51].
In order to build a model of an object of such considerable size and substantial complexity of architectural detail, many photographs must first be taken from various angles. These represent projections of the three-dimensional object onto the photographic planes and generate a significant amount of data. Since the program Agisoft Metashape, which was used in the phase of generating the point cloud corresponding to the geometry of the architectural object, is characterised by performance limitations, the input data had to be spread over several stages, depending on the location of the building element to be reconstructed. This required the reconstruction to be divided into fragments, which were then combined using appropriate software—Cloud Compare.

2.1. Input Data

Digital photographs were used as input data for the photogrammetric reconstruction, among which three main sets can be distinguished: photographs taken from eye-level (terrestrial), photographs taken with a UAV, complementary photographs taken from various locations (e.g., from the gallery located on the first floor of the castle in the western facade). Each of the sets was used to make one or more fragments of the photogrammetric reconstruction.

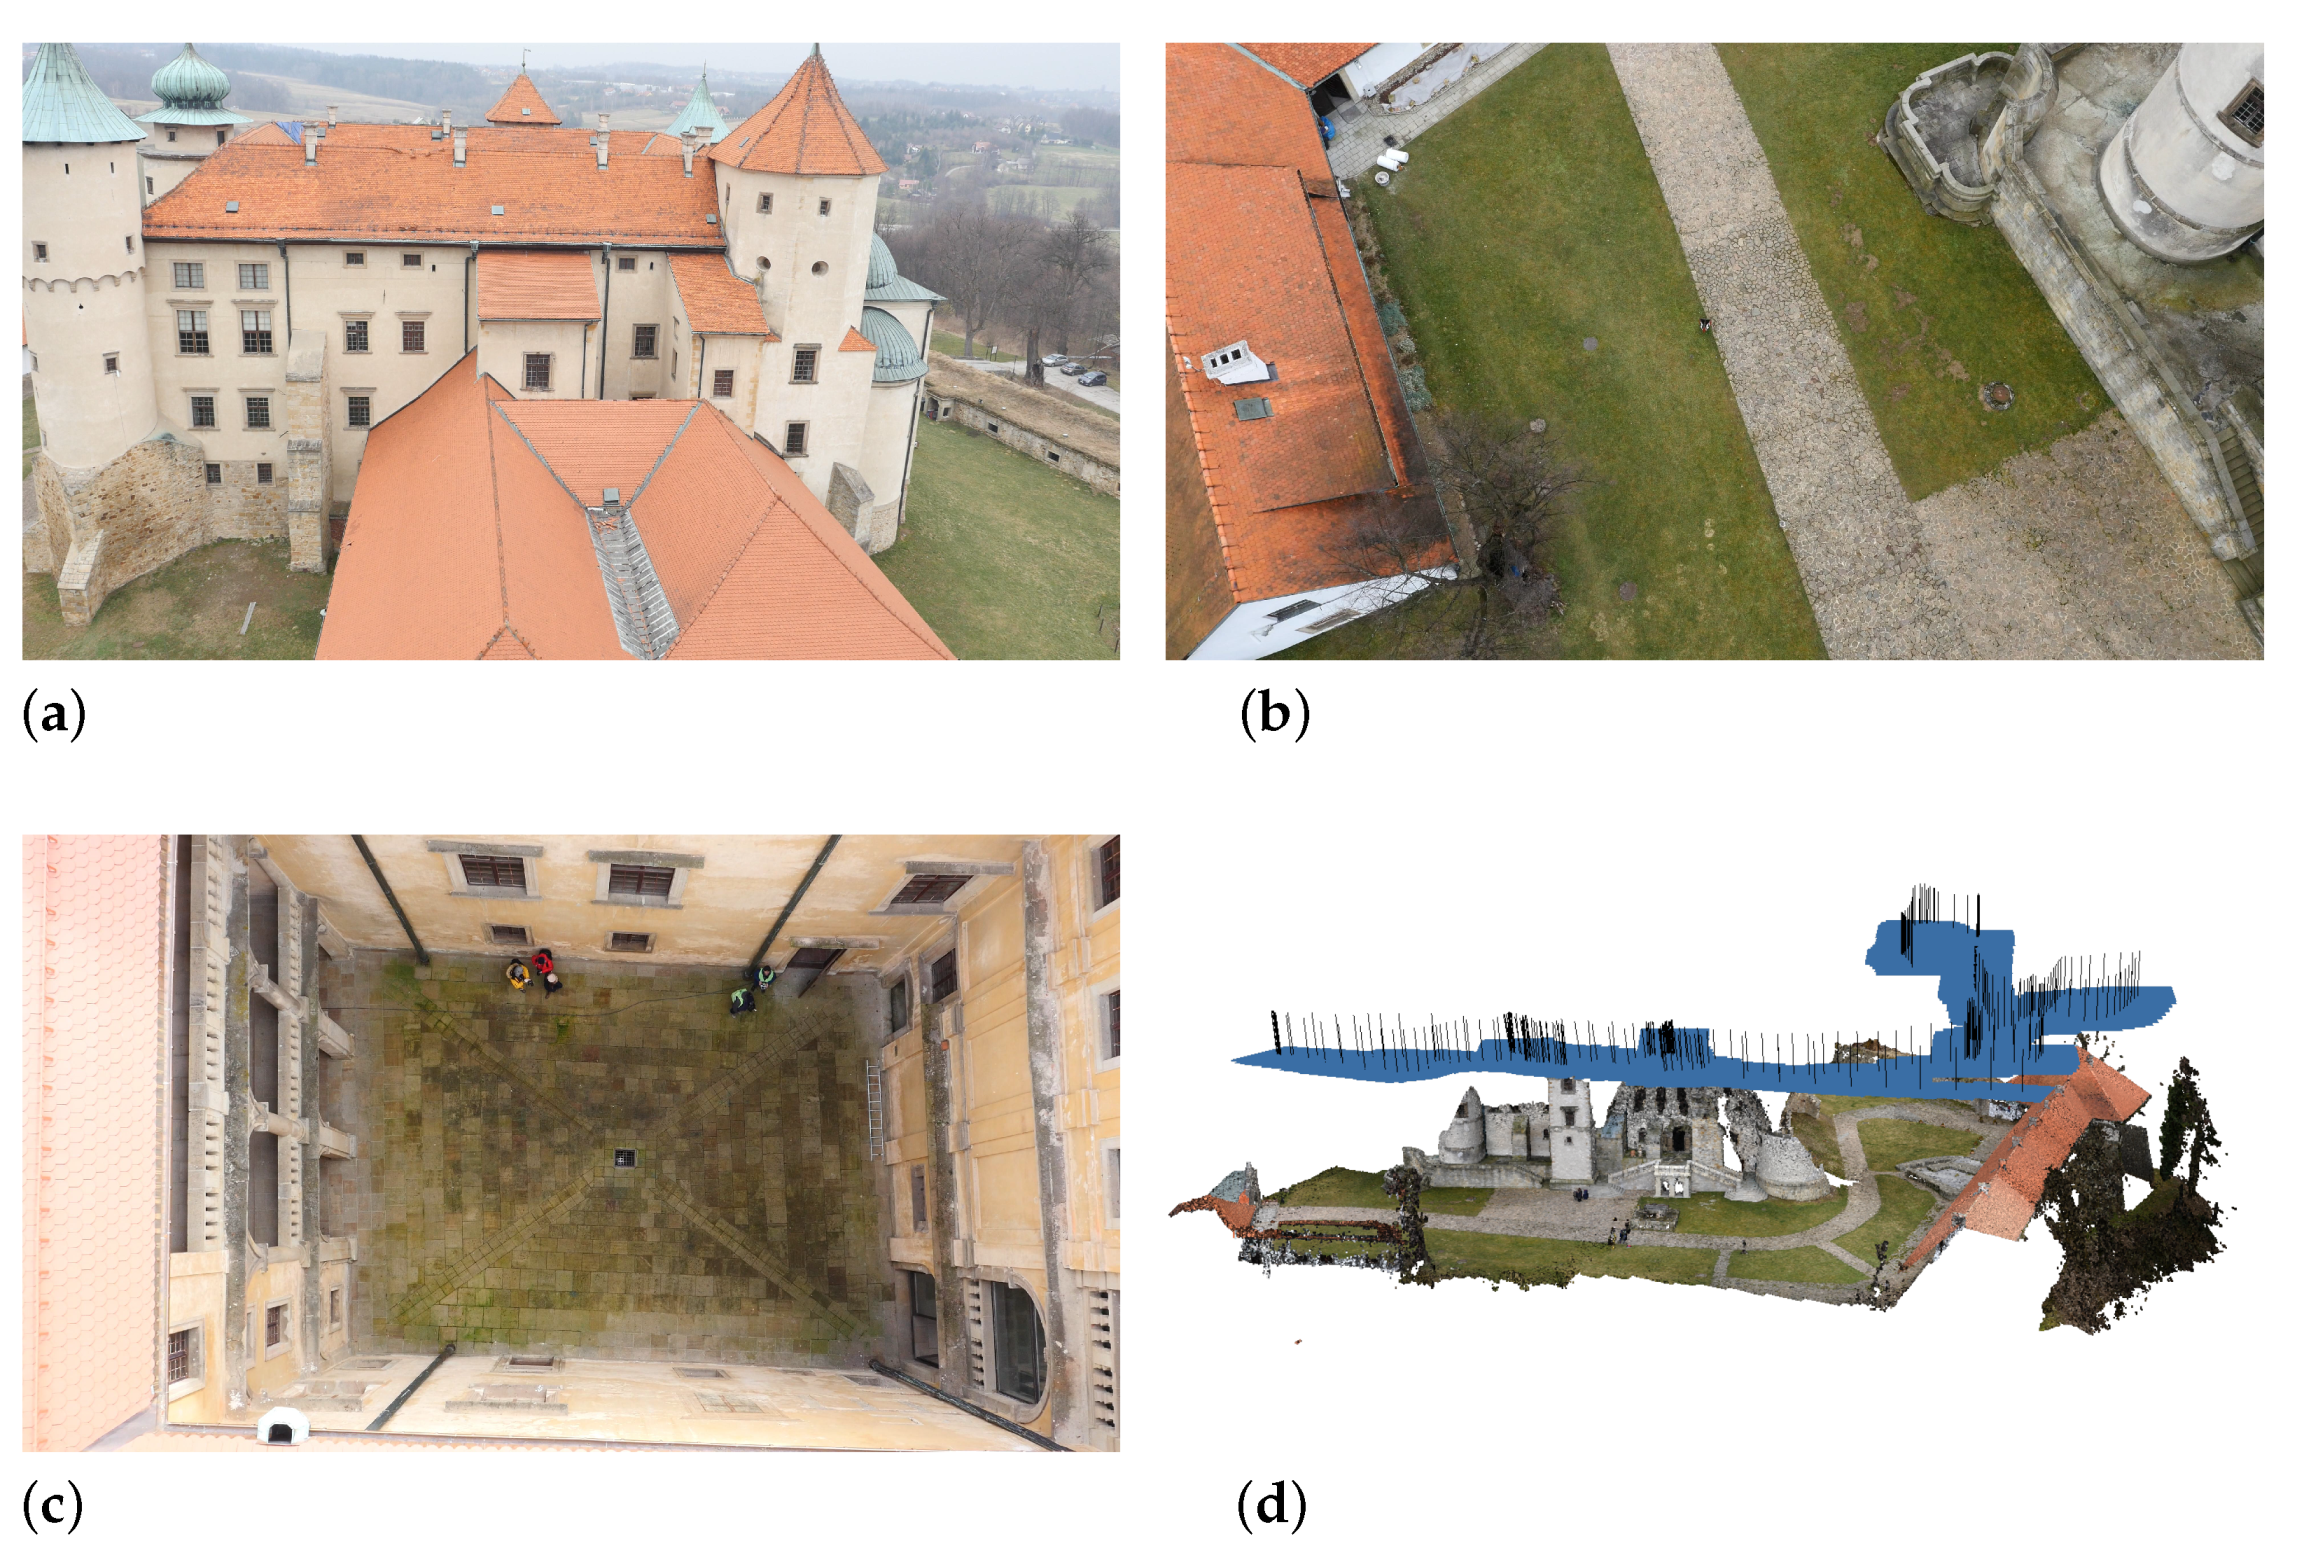
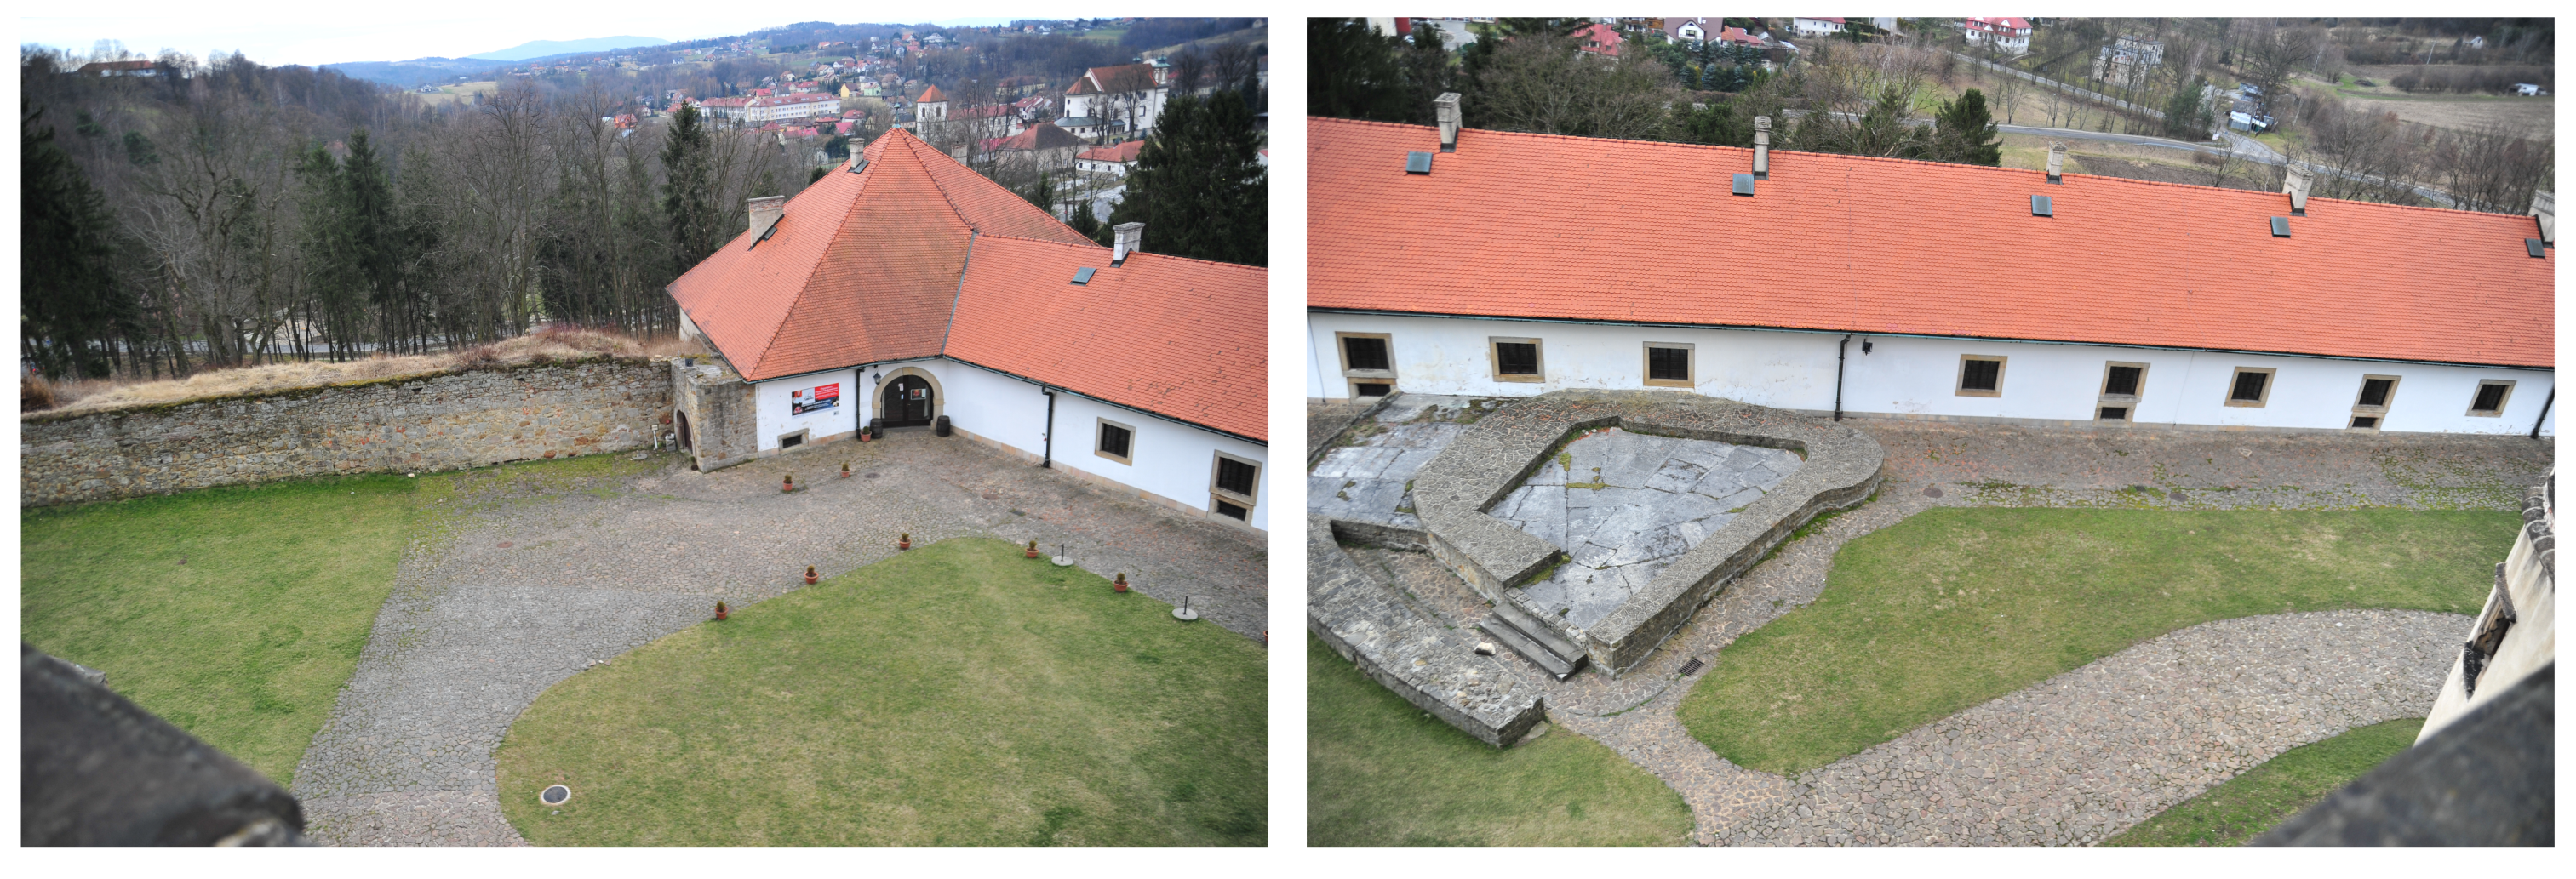
2.1.1. Terrestrial Photography

The photographs were taken in accordance with correctness rules required for photogrammetric reconstruction [52]. A large number of high-resolution photographs are required for this type of acquisition. Care should be taken to ensure regularity in selecting observation points and providing an overlap in the form of repeated photo coverage for a minimum of 60% of the area of adjacent frames. Depending on the type of scene, an appropriate acquisition strategy should be adopted: parallel observation (Figure 2a), interior observation (Figure 2b), object-focused observation (Figure 2c). When cropping the images, it is advisable to maximise the area occupied by the reconstructed object. Observations have shown that the optimal angle of displacement between successive frames of the sequence when perceiving the object from a circular trajectory surrounding it is about 10–15° [53].
Eye-level photography was carried out in several stages. Sequences of photographs covering the following areas were selected:
  • the main body of the castle building—366 photographs (Figure 3a);
  • the outer courtyard (between the embankments)—194 photographs (Figure 3b);
  • the outer part of the bastion—315 photographs (Figure 3c).
The photographic equipment used for the terrestrial acquisition included two different cameras: a Nikon D700 DSLR with a 28 mm lens (pictures of the main body of the castle building and additional images), and a Panasonic Lumix GH4 DSLM with a 12 mm lens (pictures of the outer courtyard and the outer part of the bastion).

2.1.2. Aerial Photography

Due to the castle’s size, it is impossible to recreate all the construction details based solely on eye-level photography. This applies, in particular, to such elements as roofs, galleries, and corner towers. In this case, aerial photography can be of aid. In the presented example, the aerial recording was performed using a DJI S900 hexacopter with the previously mentioned DSLM camera mounted on a three-axis gimbal. Two approaches were used in image acquisition. Orthogonal projection allowed for the capture of the entire building, especially the courtyards and roofs (Figure 4a). Data acquisition involved flight at the altitude of 100 m AGL (above ground level)—the maximum available altitude in the given area. The camera lens of the aerial vehicle was directed vertically downwards. This acquisition method enabled registration of both the details of the terrain and its coverage, but the accuracy of registration of the cover depends on how it is arranged. The outer courtyard was covered only with low grassy vegetation; therefore, it was photographed in an orthogonal projection. This projection was also used for photographing the fortifications. Additionally, this method was used over the roofs and the inner courtyard of the castle. Unfortunately, orthogonal projection does not sufficiently represent walls and other vertical elements of architecture. Therefore, oblique projection was used to complete the registration (Figure 4b).
Because of the limited flight time of the UAV, no individual photographs were taken, as it would require stopping in a suitable place each time, which would significantly extend the recording time. Instead, video footage was acquired while flying over individual building elements. The footage was then divided into single frames. Every 25th frame was then selected, which corresponds to 1 s of UAV flight. This method does not give optimal results, but it is fast and does not require significant hardware resources. Currently, research is being conducted into an alternative way of extracting the most representative frames from video footage, suitable for photogrammetric reconstruction.
Aerial photographs were also acquired in several stages, that included:
  • details of the upper stretches of the castle and the helmets of the towers—302 photographs (Figure 5a);
  • the outer courtyard (between the dikes) and elements of the bastion—649 images (Figure 5b);
  • the inner courtyard—539 images (Figure 5c).
Particular attention should be paid here to the use of the UAV in taking photographs of the inner courtyard. It has a rectangular plan measuring 16.5 m by 9.2 m. The height of the surrounding walls is 17 m. The eaves of the roofs, which are 2 m wide, extend above it. Because of this construction, it was not possible to use eye-level photography. Taking such shots would have caused considerable perspective distortion, which would have resulted in errors in the photogrammetric reconstruction. However, flight in such a confined space is significantly hampered by, among other things, inadequate satellite positioning signal, thus requiring special care from the UAV operator.

2.1.3. Additional Images

The sets of photographs described in previous sections were the basic sets used to create the castle model through photogrammetric reconstruction. The models obtained using them were supplemented with additional details based on photographs taken in various places. A telling example of this is the set of photographs from the gallery on the south-west wall of the castle, 12.5 m above the level of the outer courtyard (Figure 6), which were used to improve the reconstruction of the southern curtain wall and the bastion at the western end. The body outline of this building complex was created based on aerial and eye-level photography, but its quality was unsatisfactory. It was not until additional photographs were taken that this element could be correctly reconstructed.

2.2. Photogrammetric Reconstruction

Photogrammetric reconstruction software allows the restoration of spatial relationships between scene elements. There are many implementations of photogrammetric methods, both of research and typically commercial character. Due to the flexibility of solutions, the efficiency of operation, and the ability to process large collections of photographs, the authors’ attention was drawn to the following software: Agisoft Metashape, VisualSFM, Meshroom, 3DF Zephyr, Autodesk ReCap, Bentley ContextCapture. The decision to use Agisoft Metashape software for reconstruction was determined by the following features: fast and reliable processing of large sets of images, scalability of calculations depending on the power of the processor and graphics card, flexibility and additivity of determining viewpoints, reconstruction of a dense point cloud with a preset level of confidence. Some inconveniences related to the use of Agisoft Metashape were also noted: limitations in reconstruction from images with variable focus and errors in integrating multiple reconstructions.
Each reconstruction included several steps:
  • Alignment of the photographs;
  • Creating a sparse point cloud based on the aligned photos;
  • Creating a depth map for each of the aligned photos;
  • Creating a dense point cloud.
Each set of photos was processed according to the scheme described. In the first step, the photos were calibrated. Exif metadata is an important parameter here. It is used by the software to read, among others, the focal length setting when a given photo was taken. It is recommended to use fixed focal length lenses because changing the focal length while taking one series of photos may lead to erroneous results. A distinctive problem arises in the case of selecting frames from video footage. Such frames do not have Exif data, as they are not saved at the moment of recording. In the case of a lack of such data, the software assumes that the photos were taken at the focal length equivalent to 50 mm, but it is possible to modify this value manually. It is also reasonable to estimate lens distortion based on a previously entered reference photo [54]. However, none of these procedures were used in our reconstruction process because we intended to test model creation conditions that were far from ideal while also being easily reproducible.
Once the photographs have been uploaded to the software, the quality assessment stage can take place. Each photo is rated on a scale from 0 to 1 for its suitability for further processing. This assessment is based mainly on the sharpness parameter of the image. The alignment process can then be carried out on the photographs. At this stage, Agisoft Metashape finds the camera position and orientation for each photo and builds a sparse point cloud model. Each photo is analysed for keypoint features, and if found, descriptors are generated, which are then used to detect correspondences across the photos. This process is similar to the well-known scale-invariant feature transform approach (SIFT [55]) but uses different algorithms. The camera position and orientation in space are estimated from the results. Tie point positions are estimated based on feature spots found on the source images [54]. As a final result of this stage, a sparse point cloud is obtained, consisting of tens to hundreds of thousands of points (Figure 7a).
Agisoft Metashape enables the generation and visualisation of a dense point cloud model. At the stage of dense point cloud generation reconstruction, it calculates depth maps for every image (Figure 8). The program calculates depth information for each camera, to be combined into a single dense point cloud based on the estimated camera positions. At this step several processing algorithms are available. Exact, Smooth and Height-field methods are based on pair-wise depth map computation.
Agisoft Metashape software tends to produce highly dense point clouds, which can be even denser than LiDAR point clouds [56]. Unfortunately, the resultant cloud is usually irregular, redundant, and noisy. It may incorporate as many as even several million points (Figure 7b), but not every point has a stable representation on the observed surface. Therefore, point confidence is considered (Figure 9a). The confidence parameter counts how many depth maps have been used to generate each point of the dense cloud [54]. Point confidence values range from 1 to 255, and most of them are less than 10. Points with the smallest confidence do not provide meaningful information for reconstruction and may be rejected as noise in the filtration process (Figure 9b). In our approach, we removed points with a confidence less than 3 and this value was chosen experimentally.
In addition to the filtration based on the confidence index, other methods of removing noise in the point cloud were also used, such as: elimination of close multiple neighbours, removing isolated points, and removing statistical outliers (SOR).

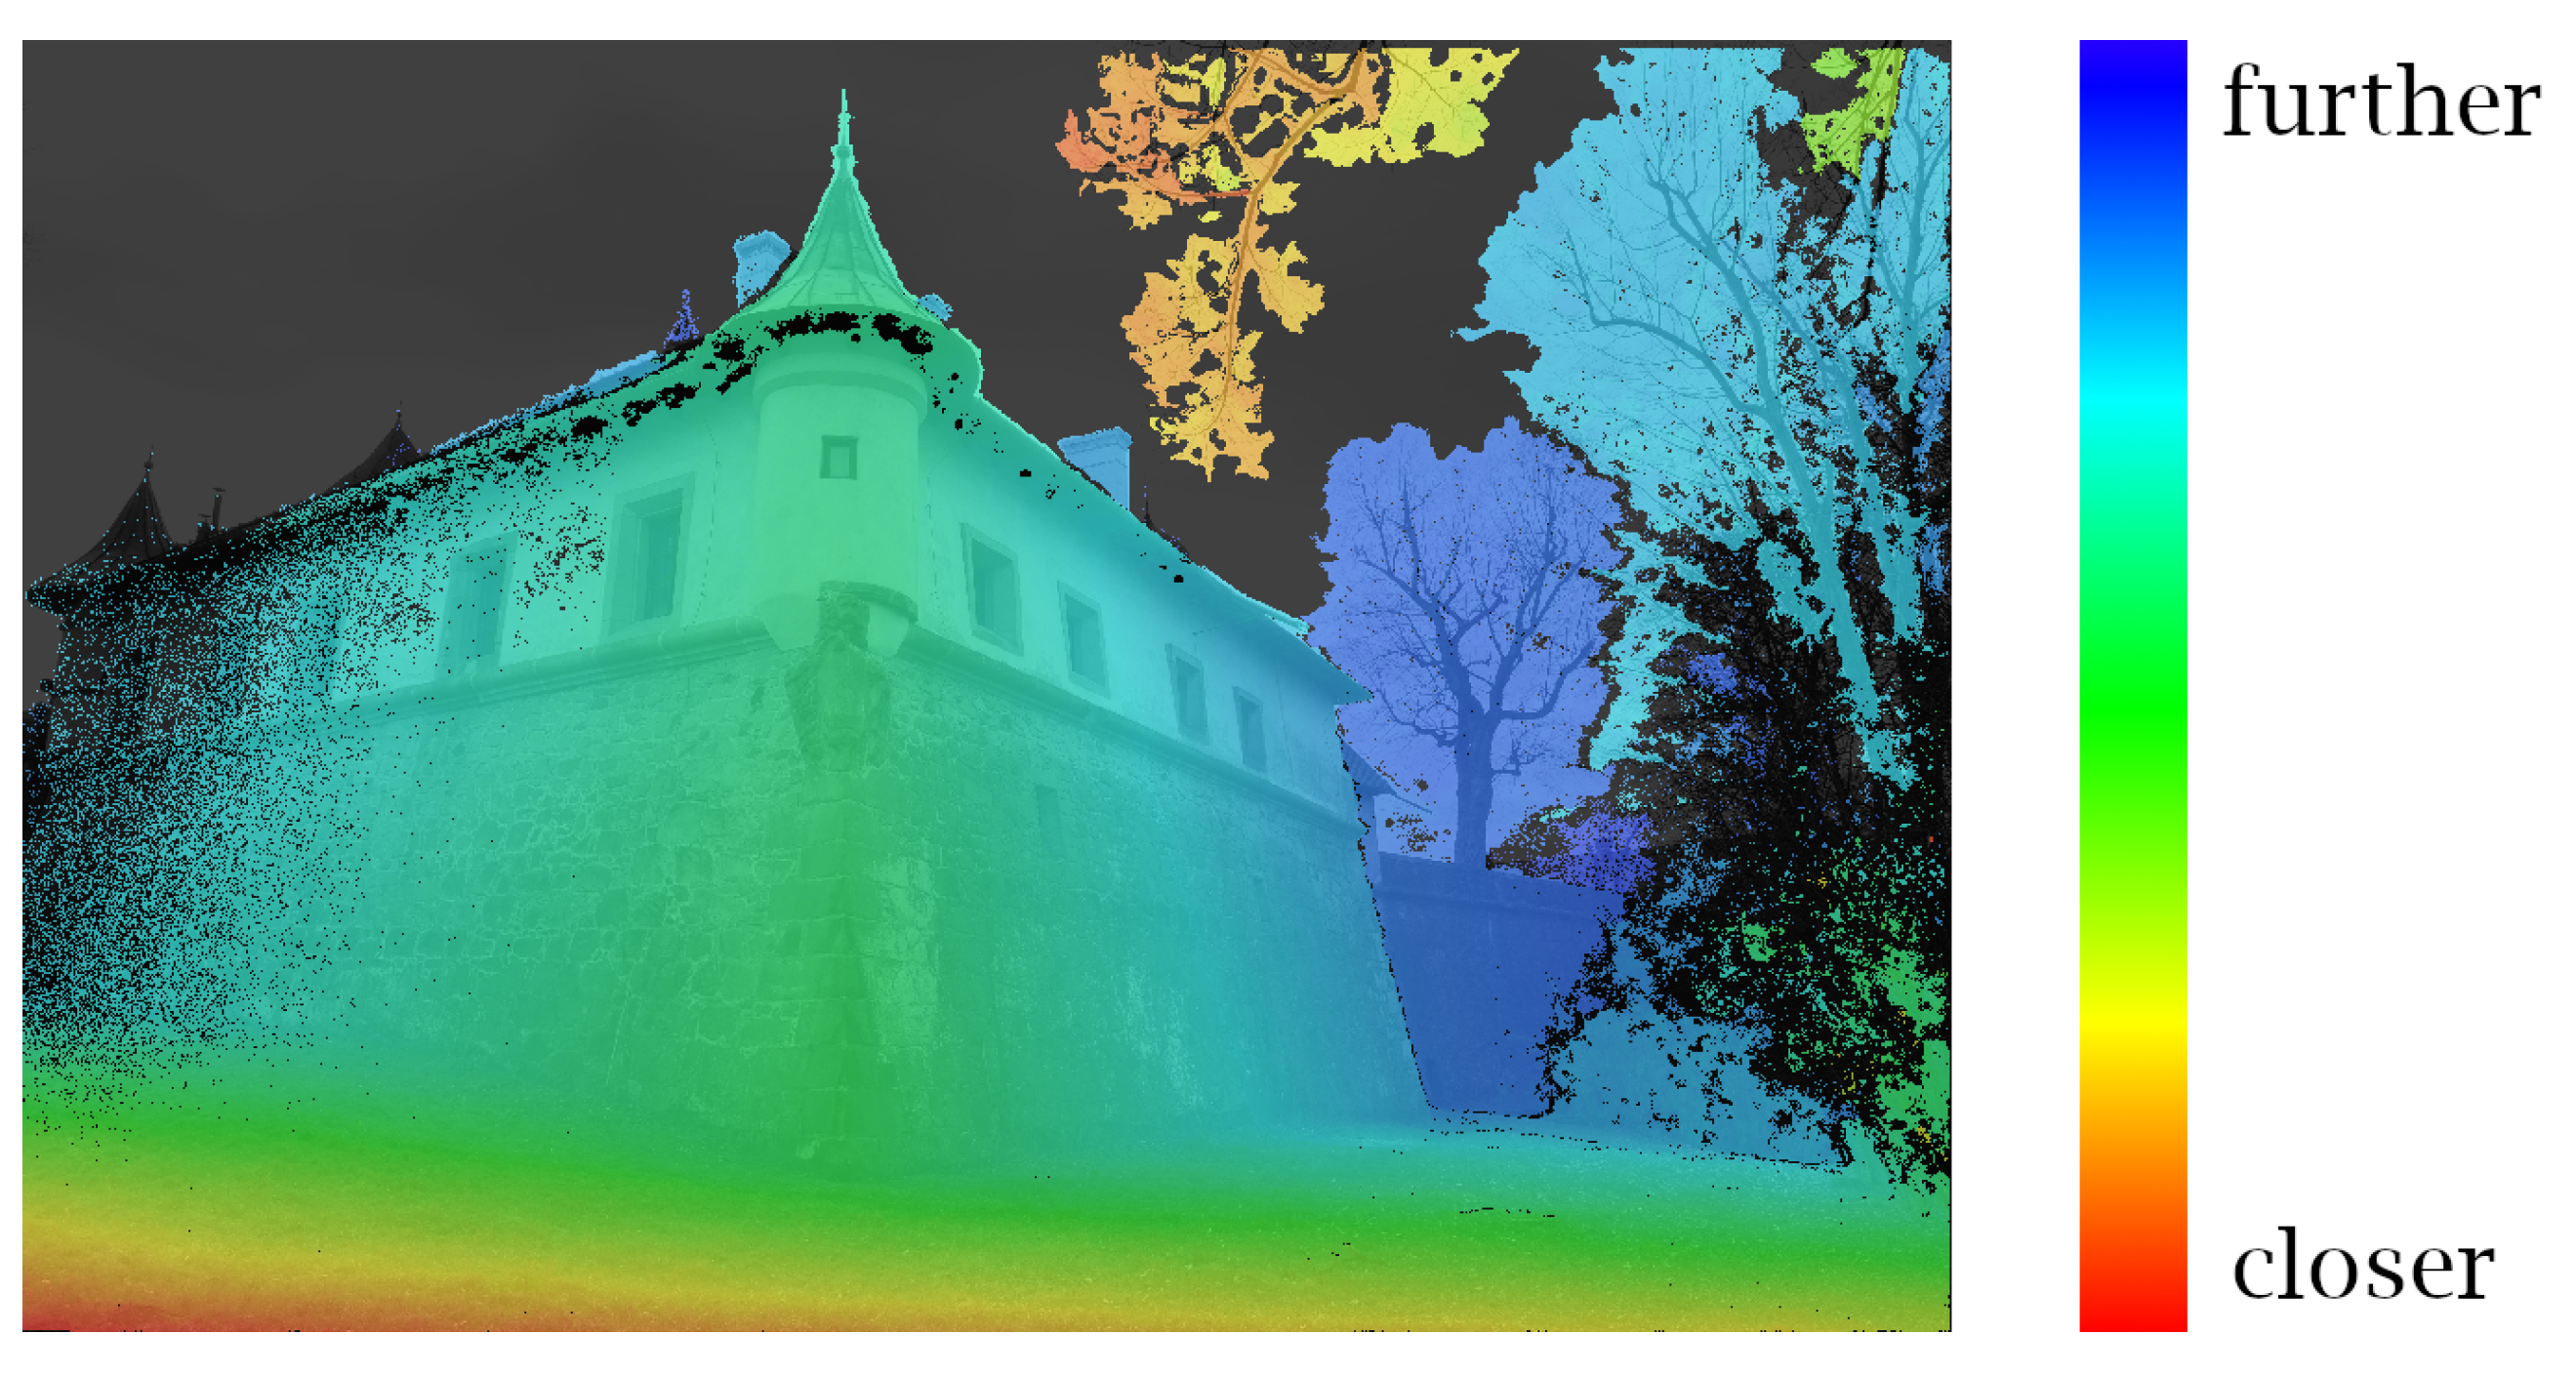
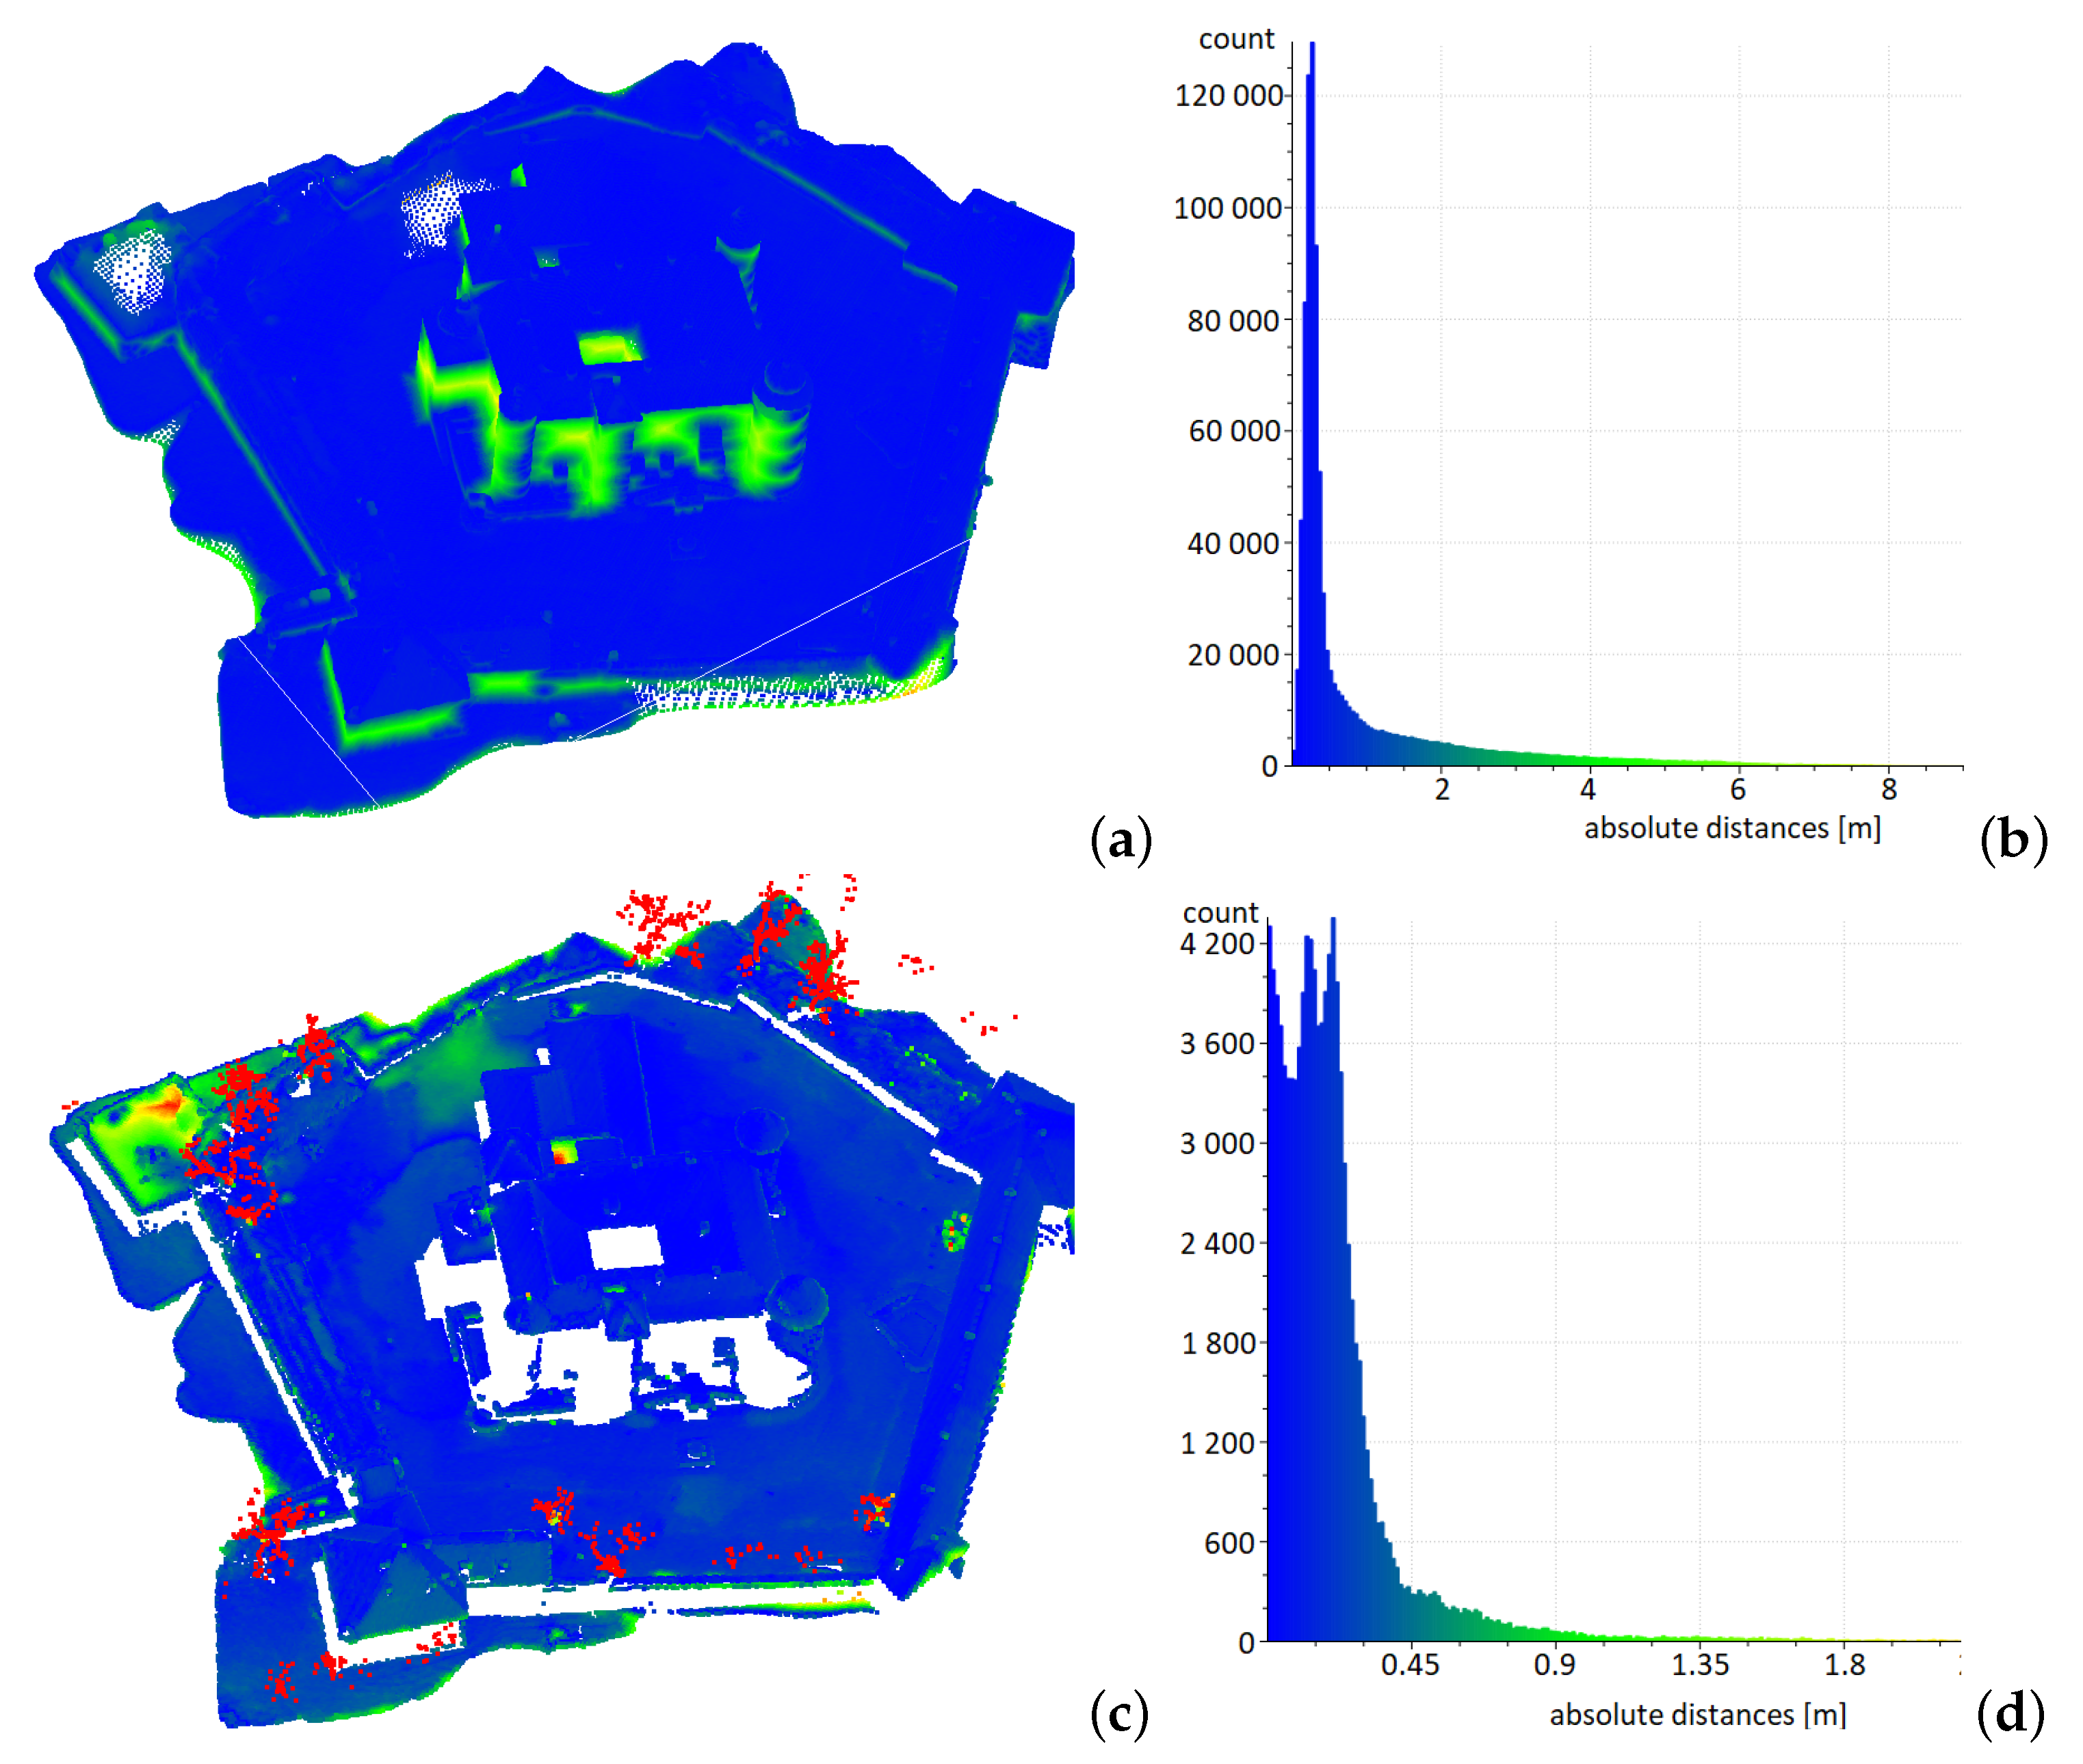
2.3. Comparative Data

Data for spatial coordination, geolocation, and verification of basic dimensions are provided by point clouds created via a LIDAR scan—these are sets of points in three-dimensional space. Each point is defined by x, y, z coordinates in a given coordinate system. The location information is supplemented with additional information such as RGB colour and class. The LAS specification distinguishes between four main classes: ground—which includes points on the ground; building—points that represent buildings; water—which represents the water surface; and vegetation—points that represent tall greenery (Figure 10a). The LAS point cloud used in the study presented in this paper was obtained as a part of the ISOK project in Standard II, which requires 4–12 points/m2 of real-world space. It is made available on the principles defined by the INSPIRE Directive [57] through the National Geoportal [5]. These are highly accurate spatial data for geographic applications. They form the basis for spatial analyses for landscape protection, protection against disasters such as floods. However, as already mentioned, they are not sufficient for engineering, conservation or costing applications. Therefore, methods are sought to supplement and integrate them with other models.

3. Results

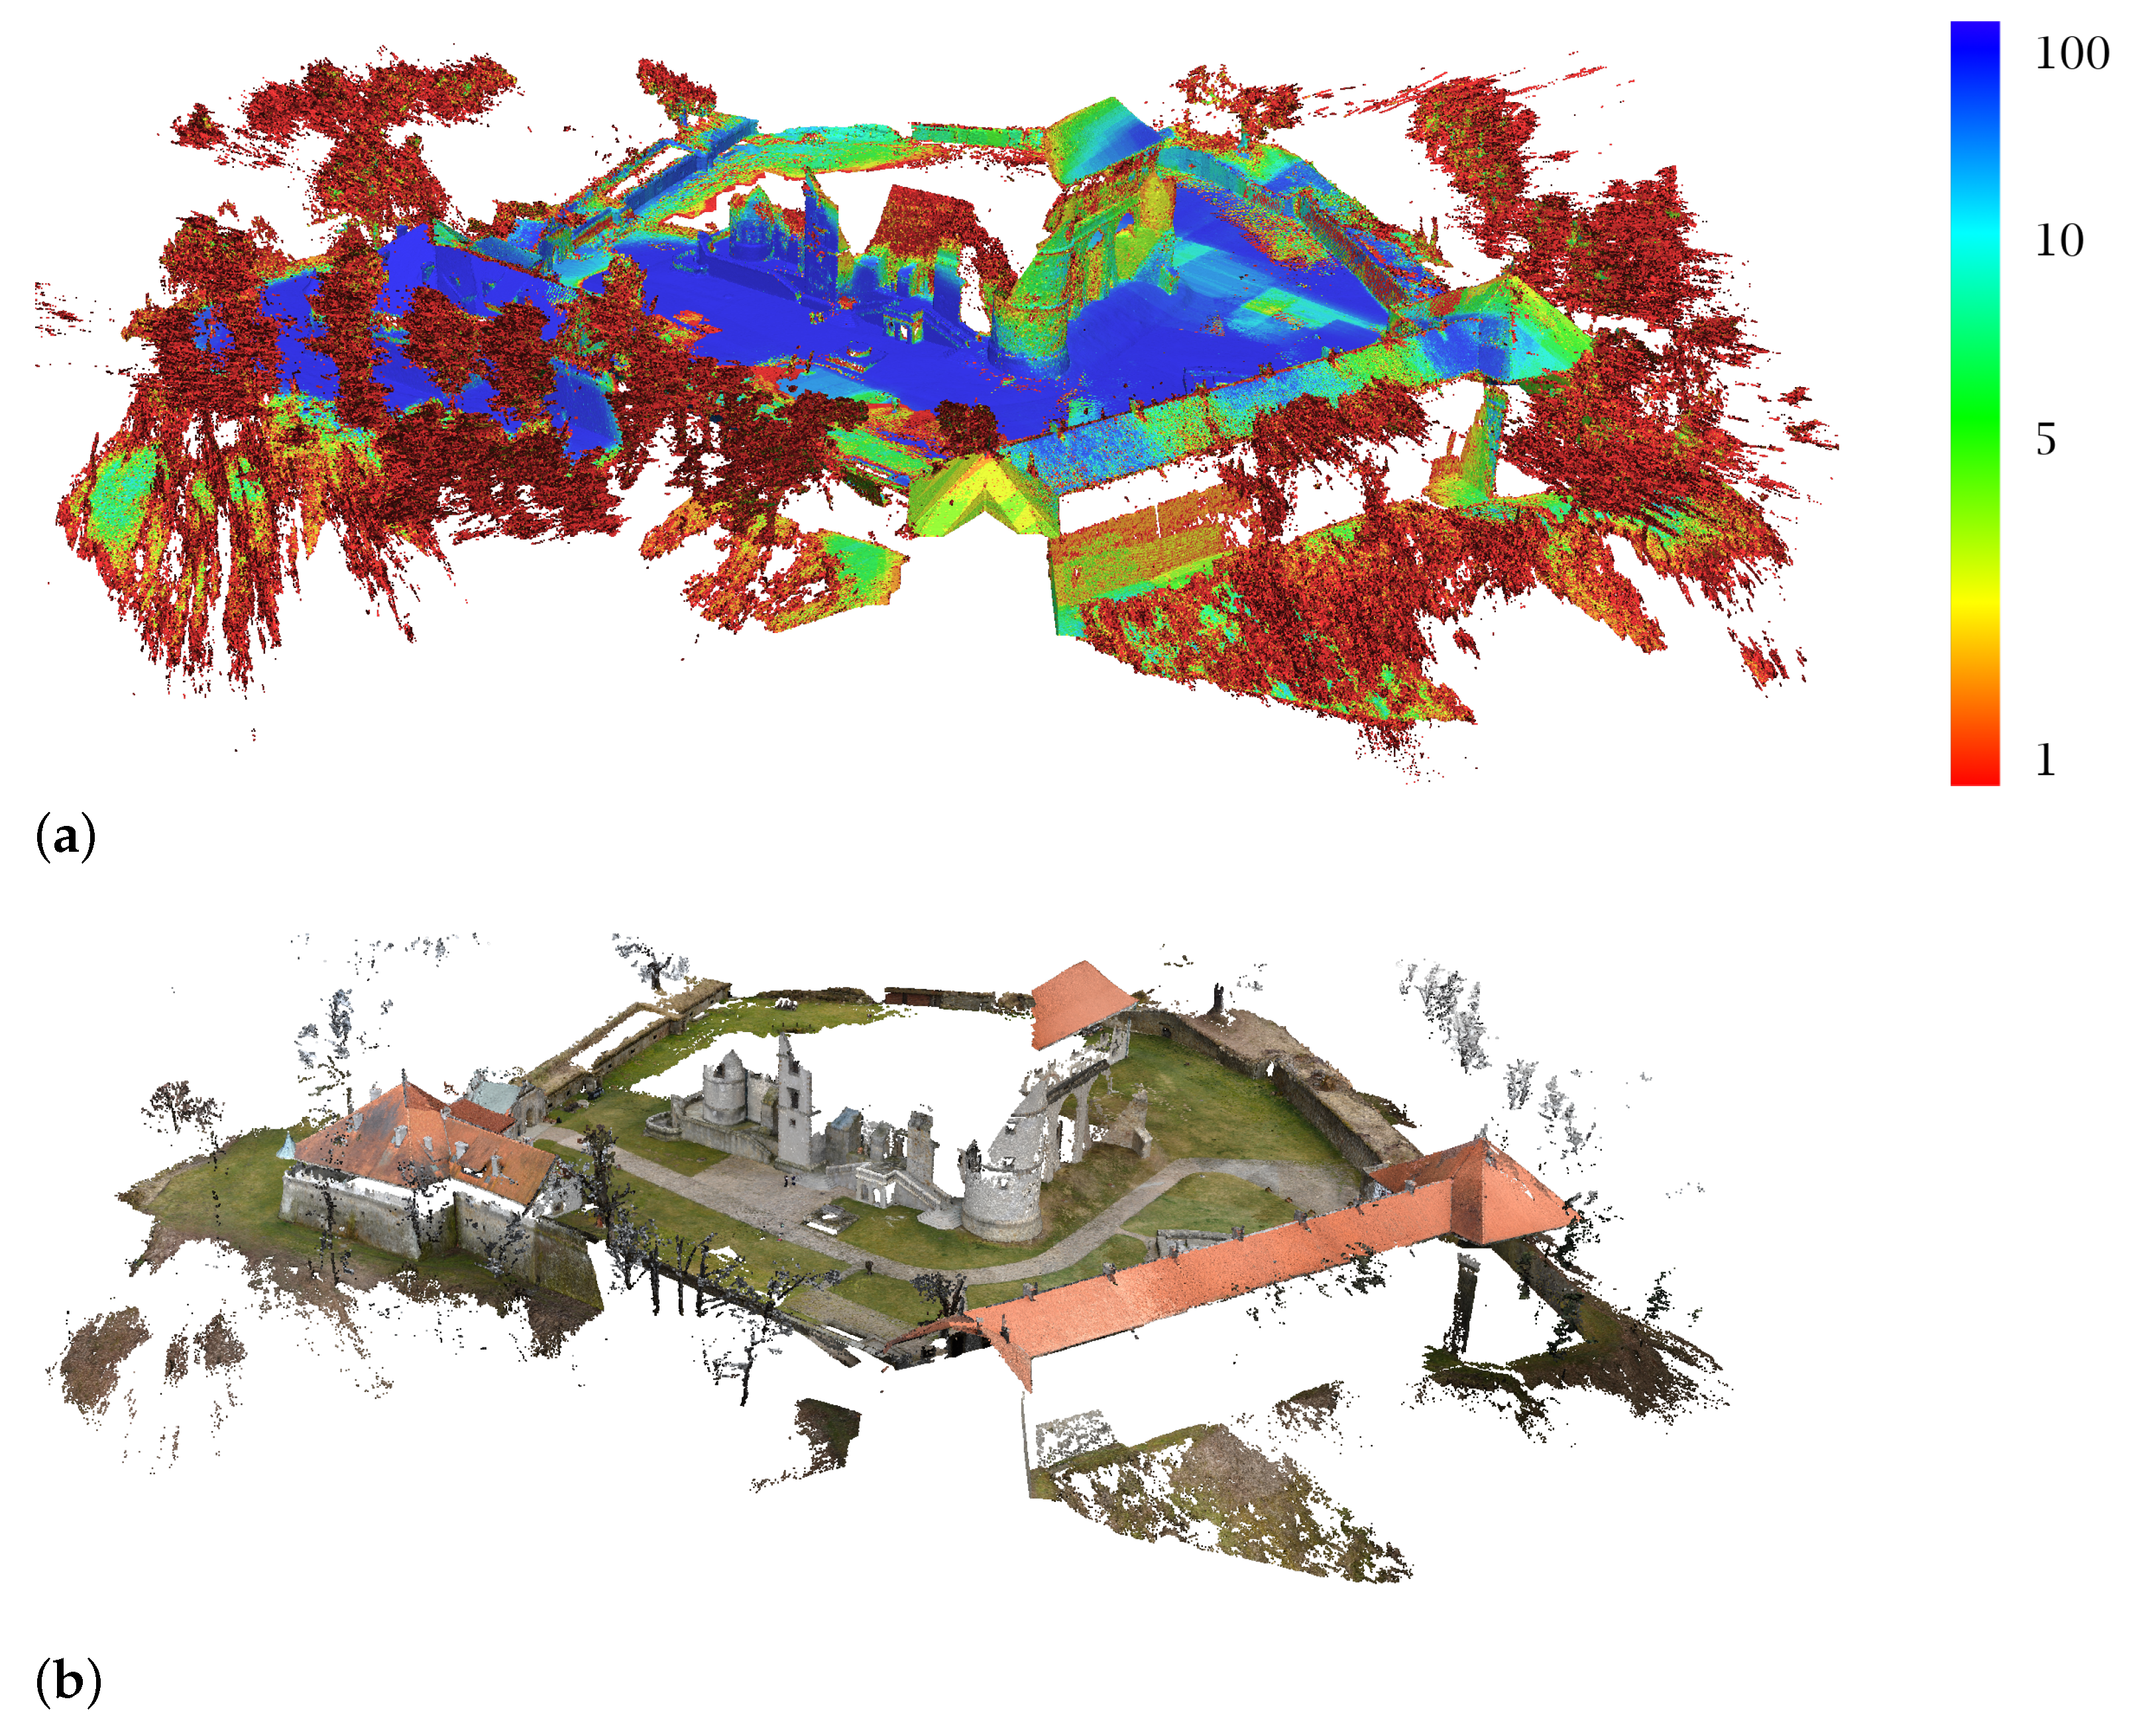
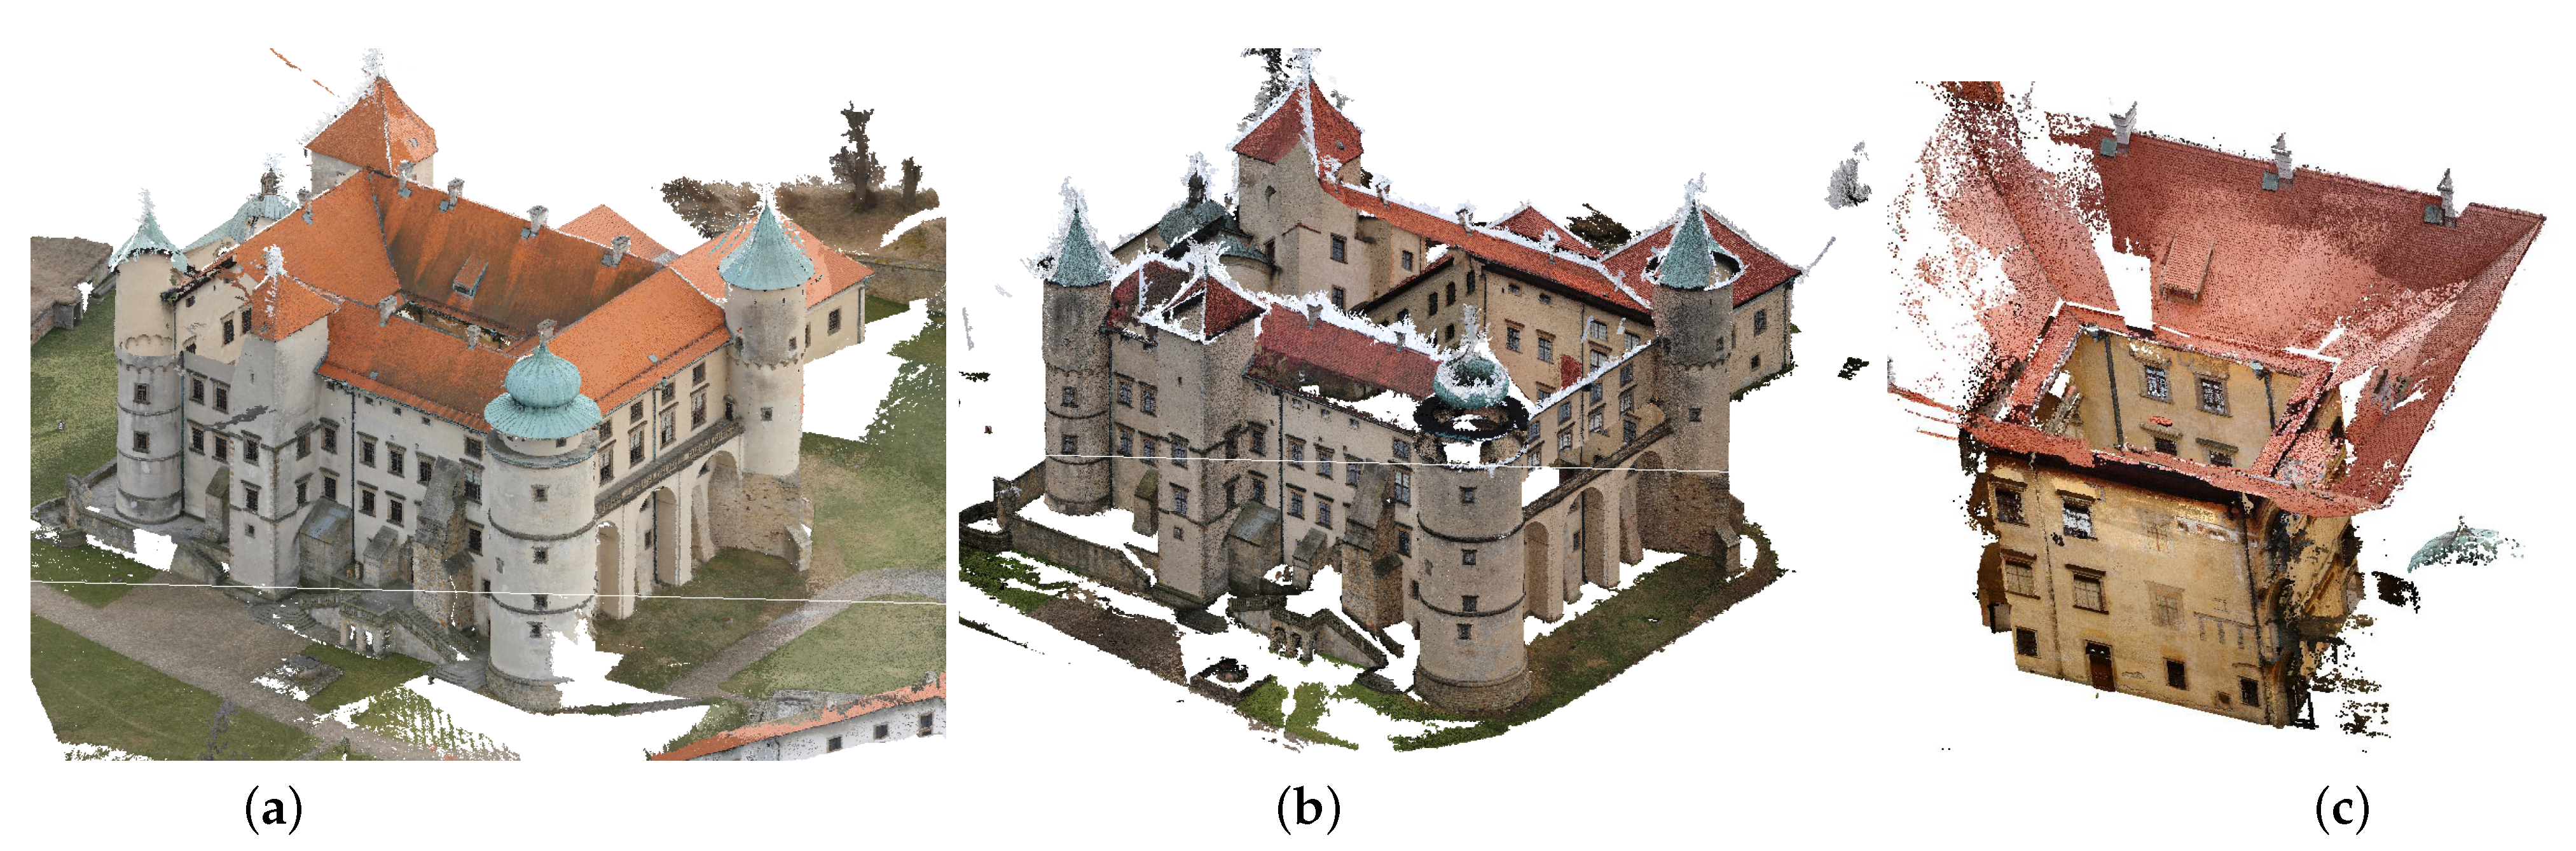
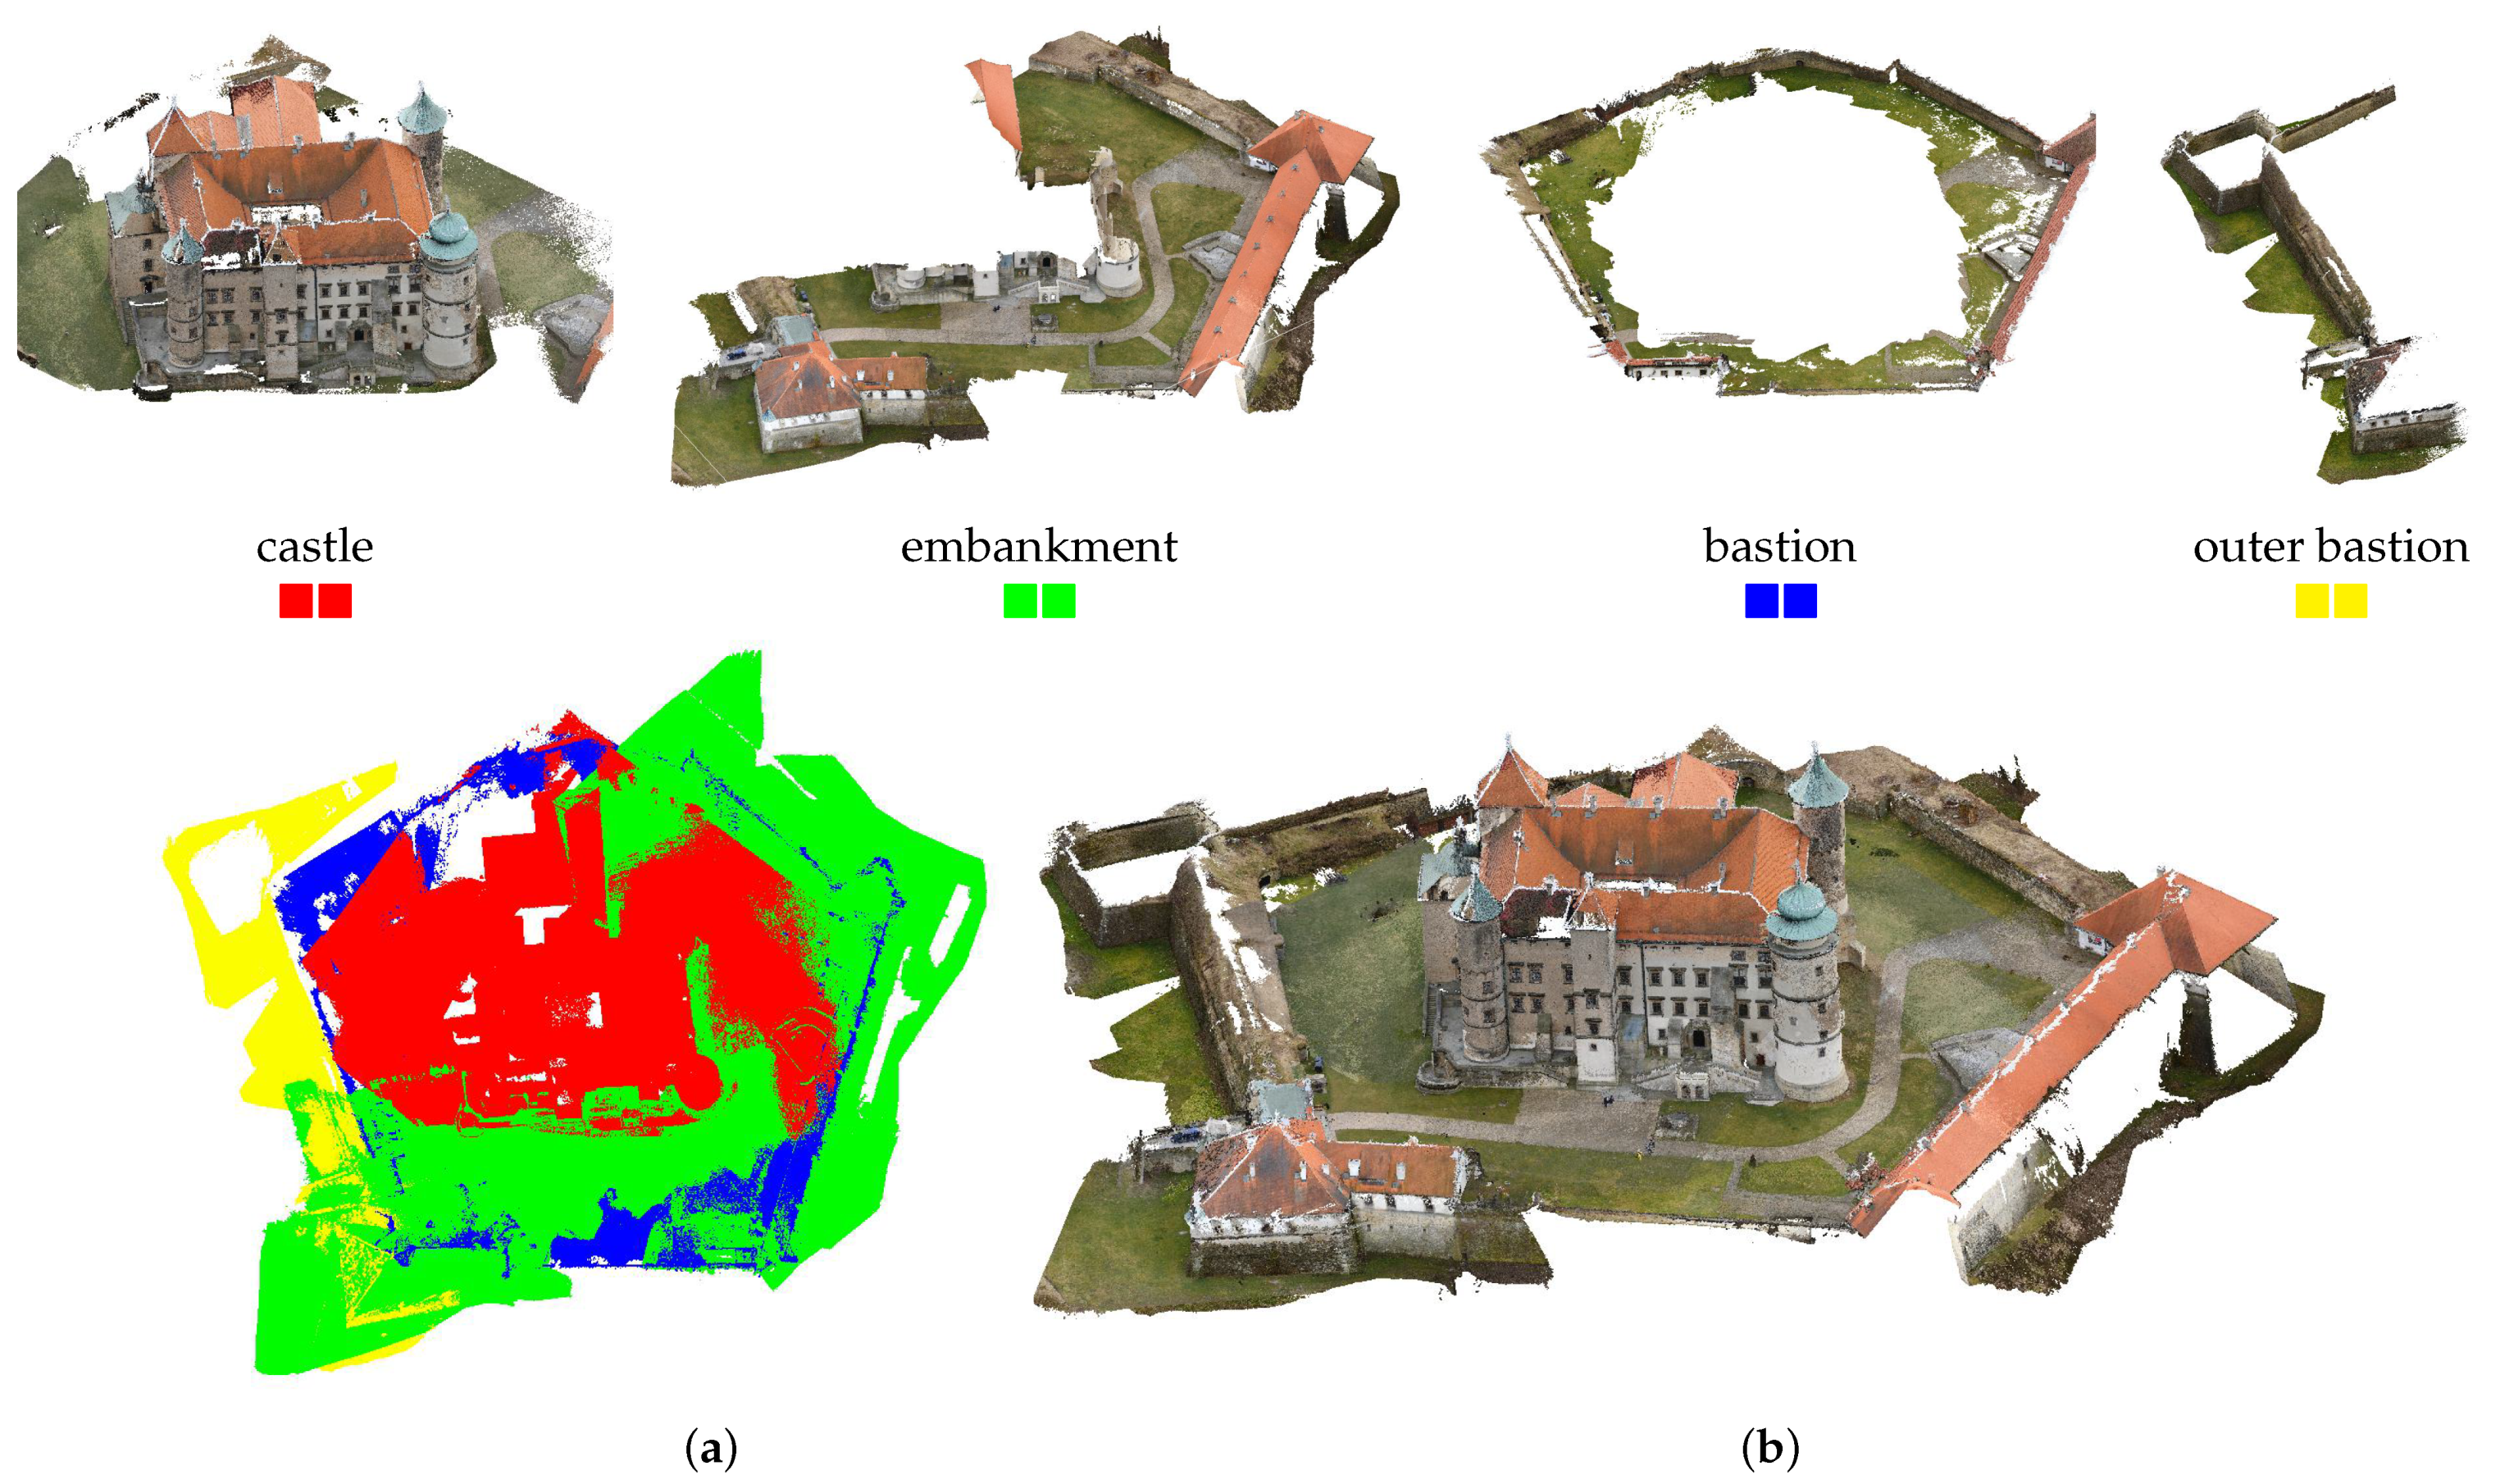
3.1. Integration of Reconstructions

A natural way to integrate 3D data from photogrammetry is to embed selected images from the performed acquisitions into a single project. However, such juxtapositions in diverse acquisition forms and conditions usually lead to unexpected and falsified reconstructions (Figure 11a). In such situations, it is advantageous to decompose the project into homogeneous and coherent image sequences, perform partial photogrammetric reconstructions based on them, and then combine them into a single resulting model.
The photogrammetric reconstructions resulted in partial point clouds, representing different areas of the castle and its surroundings. A summary of these reconstructions has been provided in Table 1. The characteristics of the reconstructions include: the number of photographs used, the key points of the reconstruction, the dense set of points and the points filtered, taking into account point confidence (points obtained on less than 3 depth maps were rejected).
It is noteworthy that a significant number of points were rejected at the confidence filtering stage, with the most being discarded when reconstructing the outer bastion from terrestrial photographs (84%). This fact is due to the significant representation of vegetation in these photographs, subject to constant movements, making it challenging to determine stable tie points. It can also be noted that the number of photographs involved in the reconstruction does not directly translate into the density of the obtained point cloud, which especially applies to photos obtained with the use of UAVs in Stage 2. The reason for this phenomenon lies in the previously described method of selecting frames from video footage from UAVs. During the retrieval of terrestrial images, the operator can better crop the vital part and cut off irrelevant surroundings. This approach is not possible during the UAV data collection method used, the reasons for which are described in Section 2.1.2. Moreover, the number of tie points does not directly translate to the number of points in the dense cloud. More points in the dense cloud are often found in the reconstruction of relatively small areas, as exemplified by the courtyard reconstruction. This is caused by the higher density of photographs, which implies overlapping between adjacent frames much more than the recommended 60%.
Integrating partial photogrammetric reconstructions involves matching point clouds that have overlapping areas in their representation. Automatic methods for such matching are available, e.g., ICP [58]. In point cloud matching, these algorithms use octree as optimisation structures for the [59]. One additional complication when matching structures from photogrammetry is modifying the offset and rotation and the scale. Furthermore, the complexity, variety, and noisiness of the point clouds being matched means that automatic methods only work within a very narrow range of deviation from the optimal position (Figure 11b). In practice, this requires the use of manual matching methods operating based on marking correlating points or areas on the collated surfaces. In the vicinity of the indicated correspondence points, the alignment algorithm searches for optimal translation (T), rotation (R), and scale (s) matching parameters by minimising the root mean square distance (RMS) between overlapping structures.
The merging of partial reconstructions was carried out in two stages: (I) fusion of the castle model and (II) extension of the castle model to include the embankment and bastions. These stages reflect the two-stage scope of the actual field acquisitions.

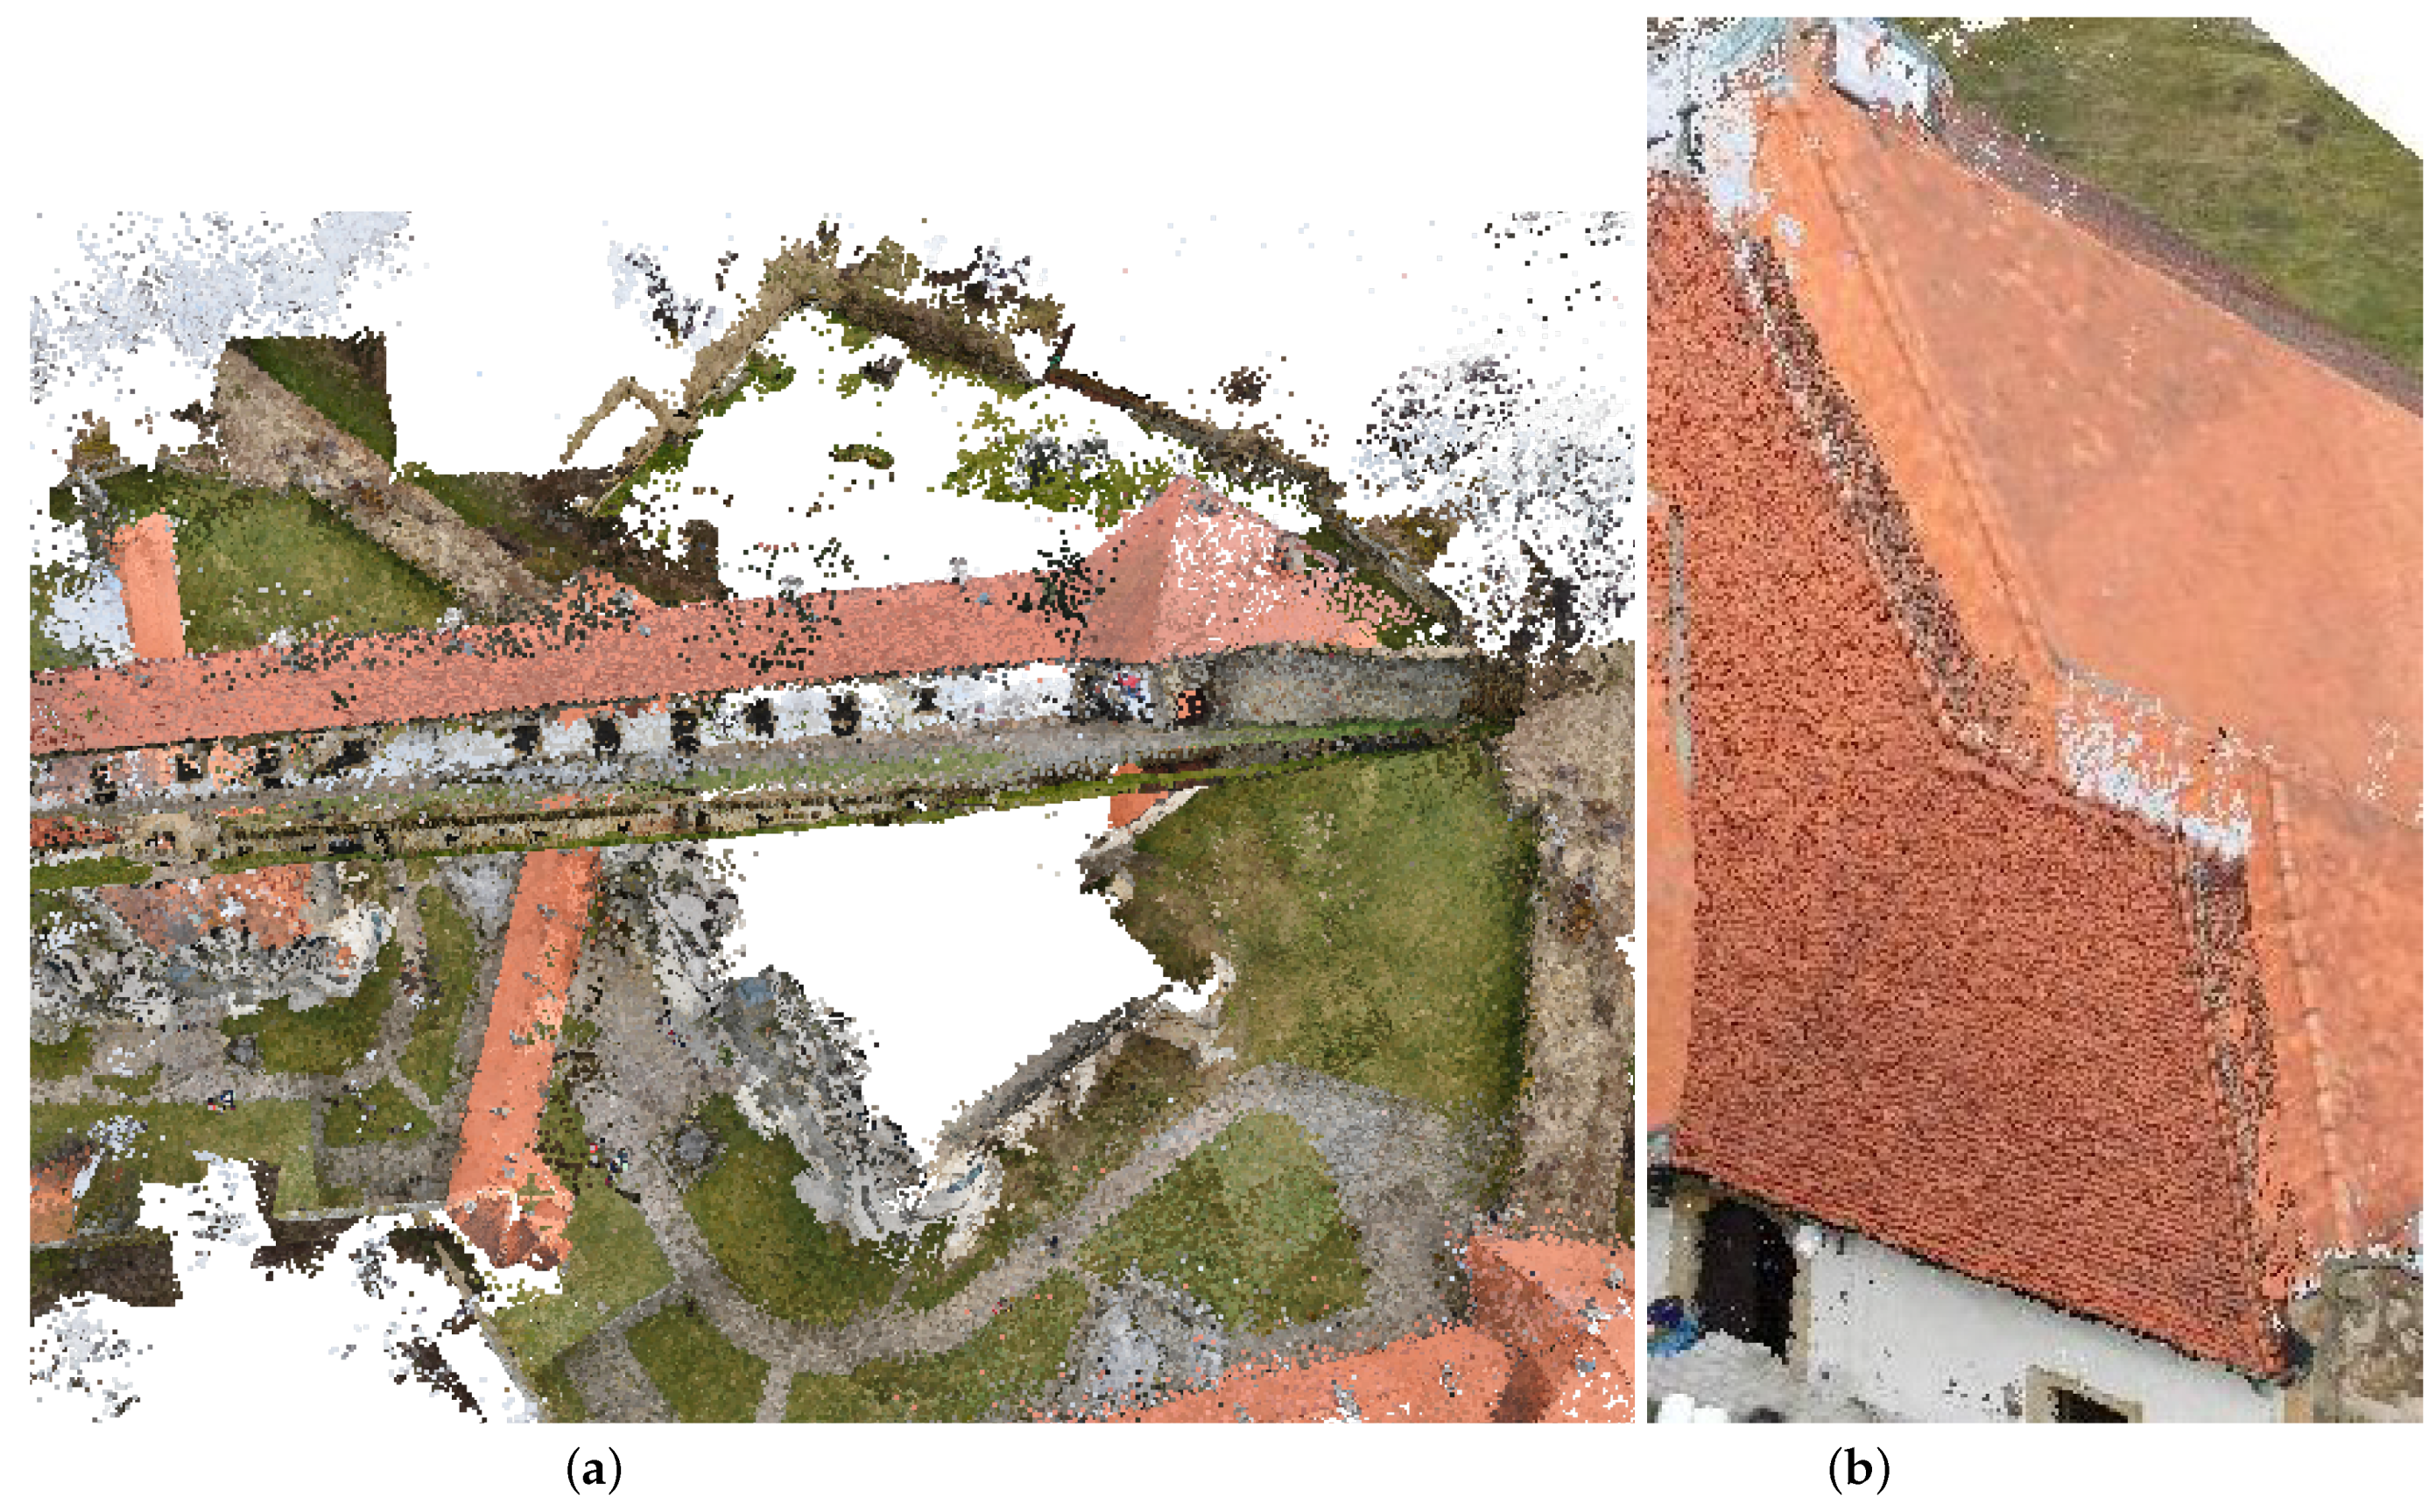
3.1.1. The Castle and Inner Courtyard

The first stage of reconstruction consisted of acquisitions made within the main body of the castle. Photographs were taken simultaneously from a UAV and terrestrial photographs from the area around the castle. This resulted in two photogrammetric reconstructions: from a UAV’s aerial perspective (Figure 12a) and from the ground (Figure 12b). The castle’s body was also complemented by reconstructing the inner courtyard acquired from drone photography (Figure 12b). Acquisition parameters have been described in Table 1. An unsuccessful attempt was made to capture all photographs in a single Agisoft Metashape software project. Finally, the resulting point cloud for the castle solid was created by overlaying and merging the partial representations (Figure 12a–c) using CloudCompare software. After removing redundant vertices, the resulting point cloud counted 25,527,922 points (Table 1).

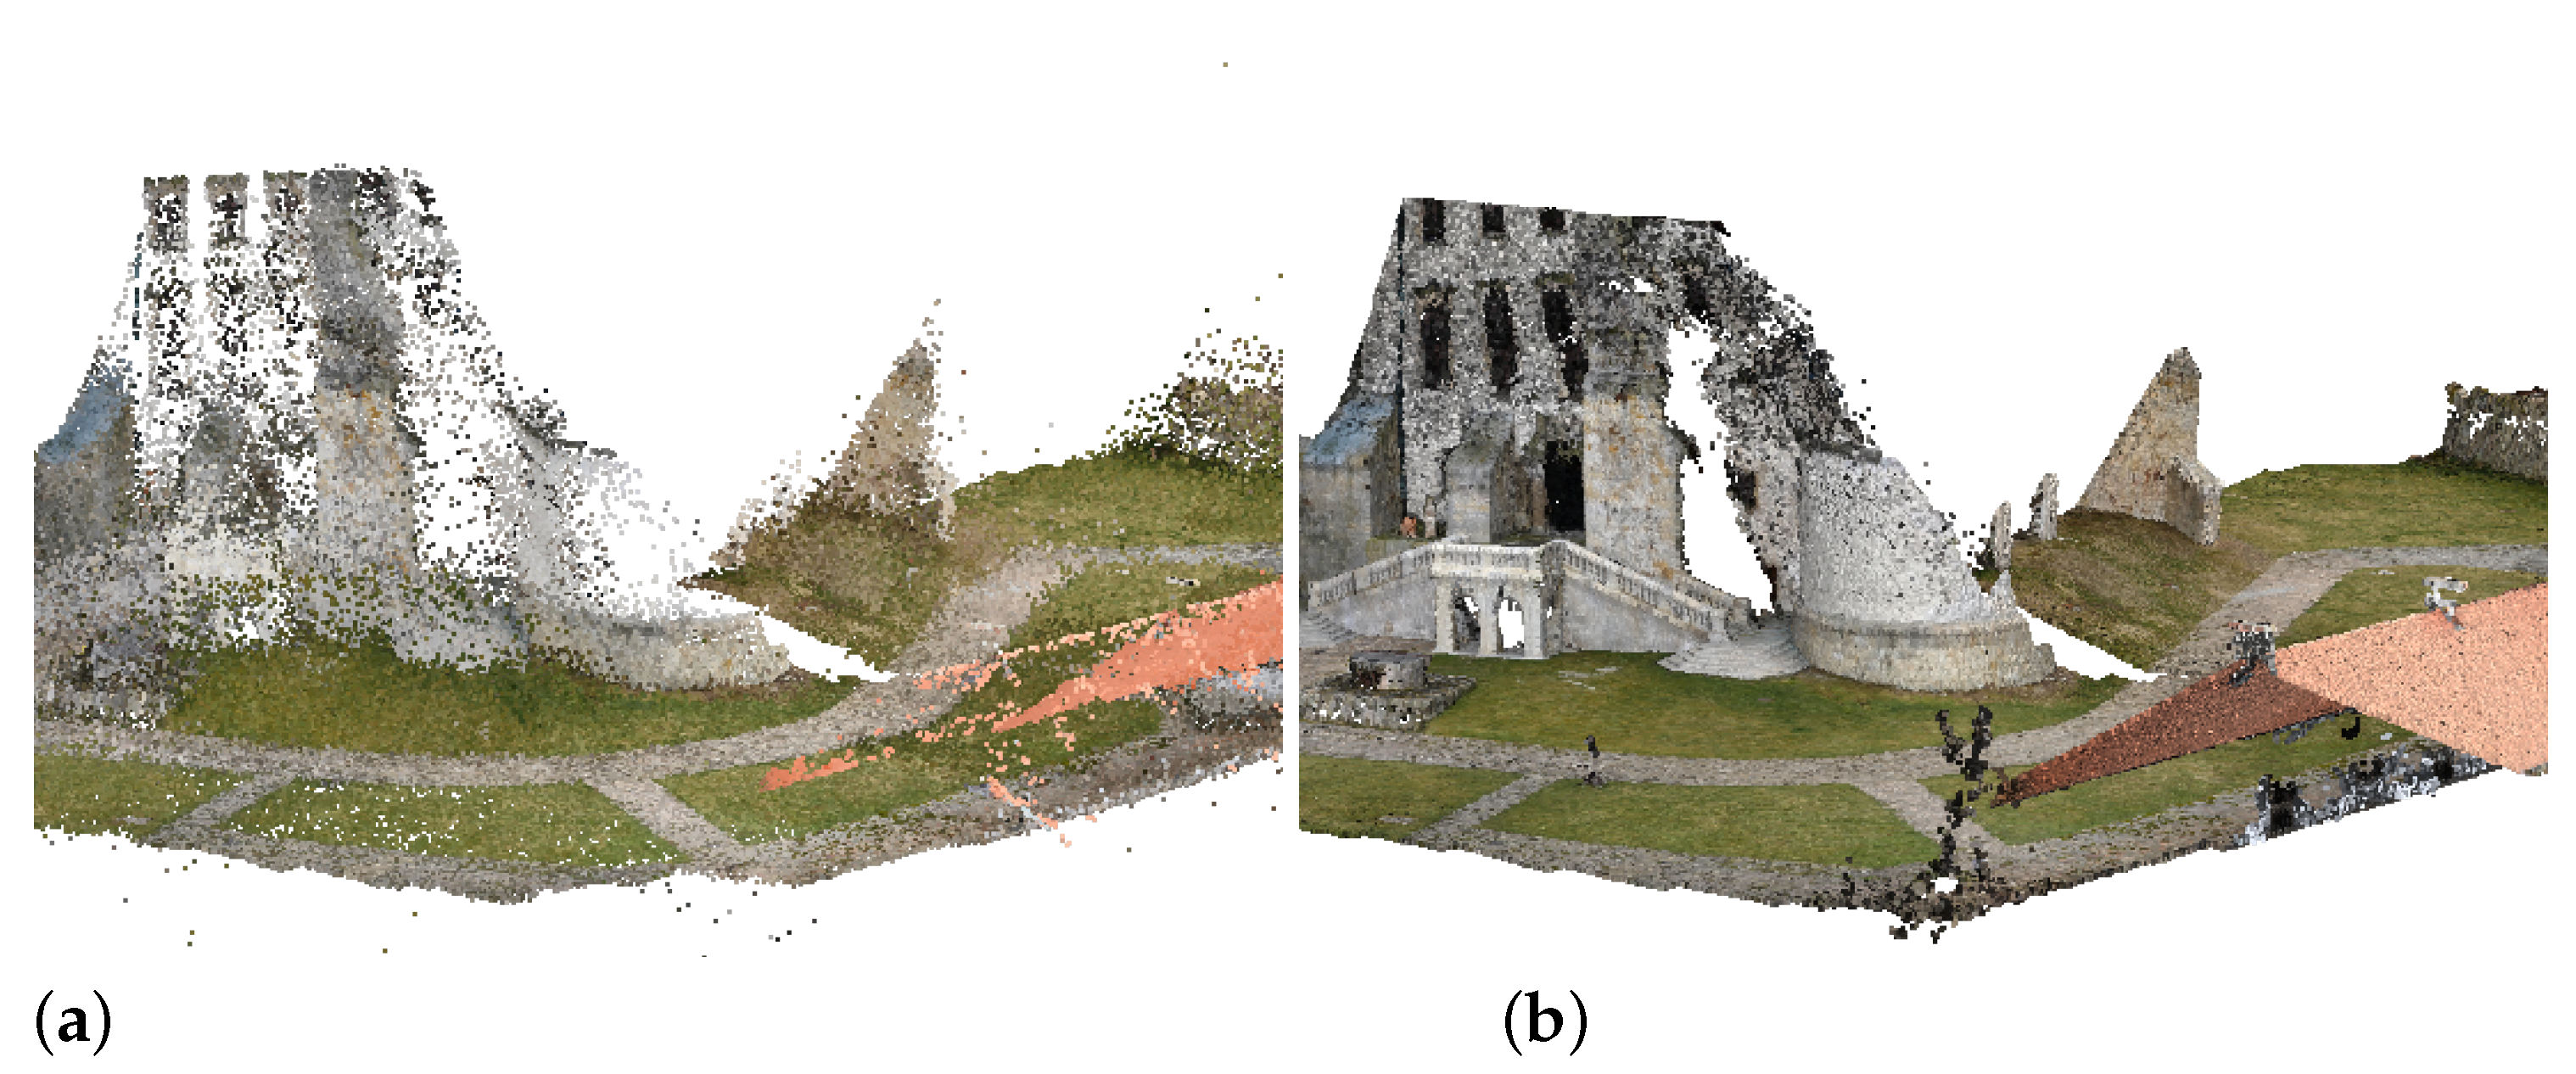
3.1.2. Bastions and Embankment

The second stage of reconstruction was an extension of the first, to include bastions and embankment acquisitions. Figure 13 shows the extended integration components, which consisted of the following reconstructions: the castle’s body (created in the first stage), the bastions, and the interior part of the bastion visible from the access road. Figure 13a) shows a schematic of the superimposition of the different parts, while Figure 13b) contains the resulting point cloud composed of 48,969,119 points. A quantitative summary of point cloud components obtained from photogrammetric reconstructions has been given in the second part of the Table 1.

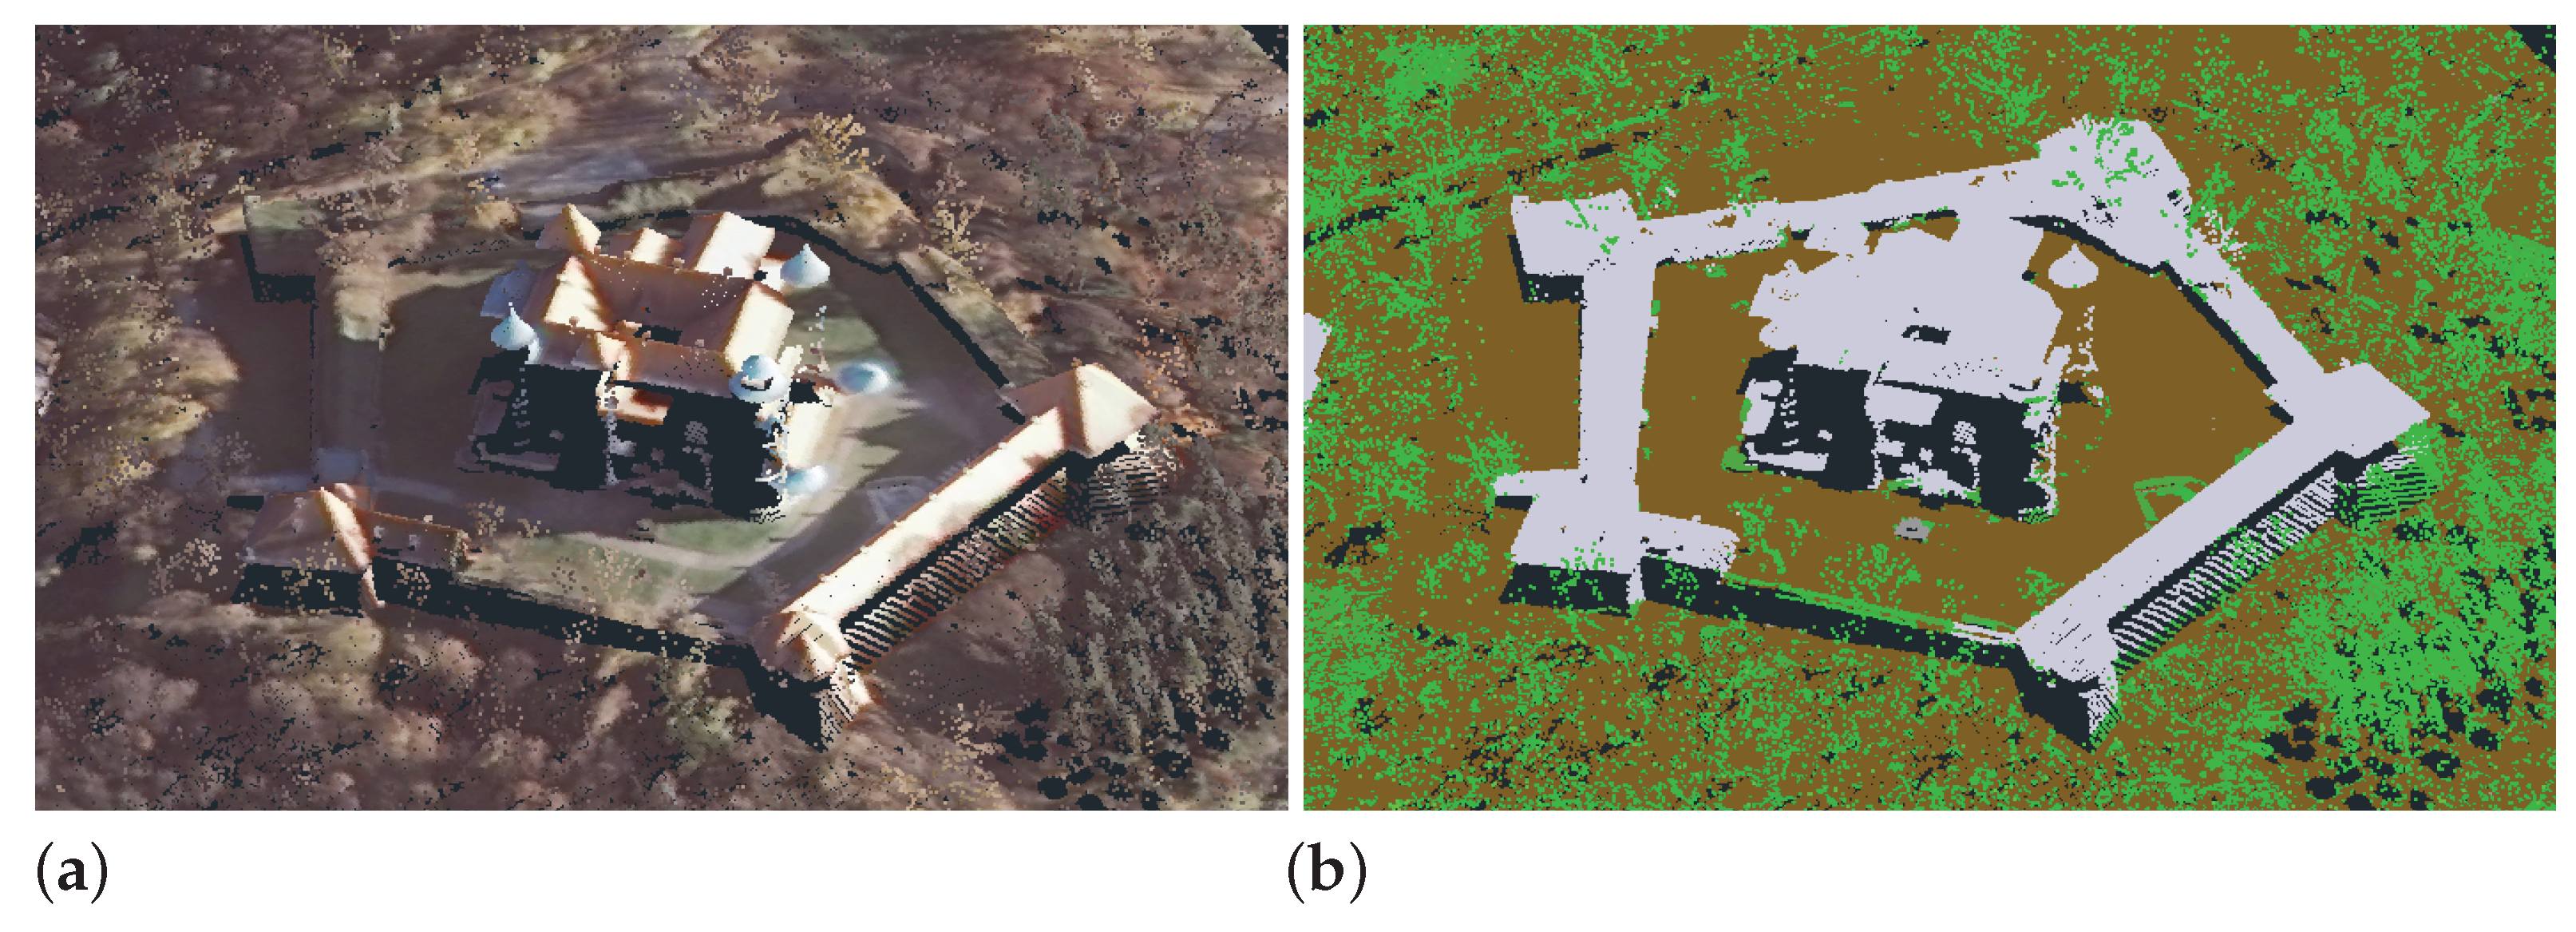
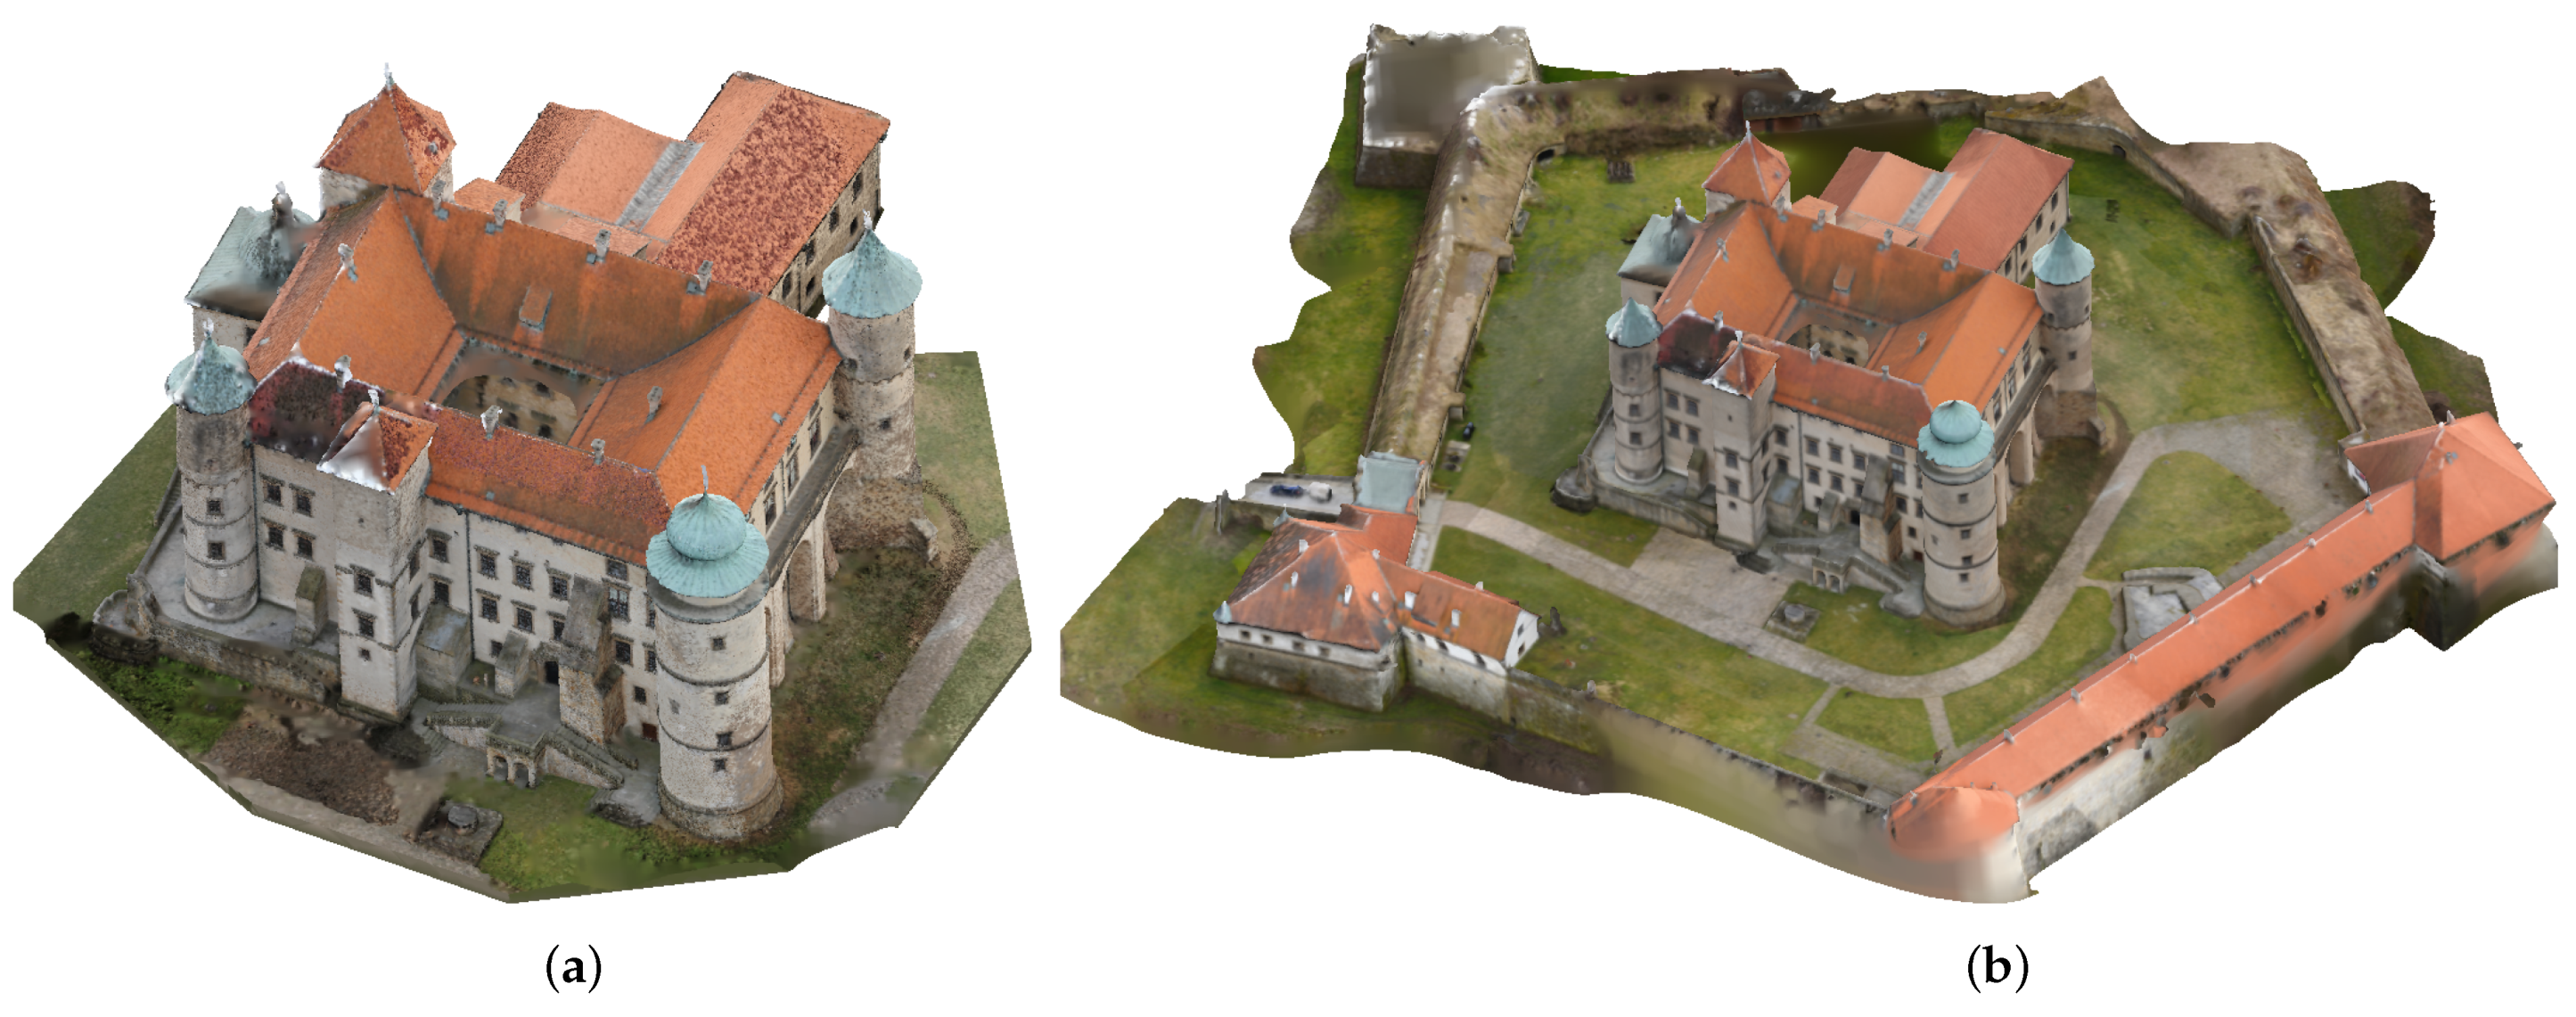
3.2. Surface Model Creation

Based on the resulting point clouds, surface models represented as triangular grids were created for: the castle body itself (Figure 14a) and the castle with its surroundings (Figure 14b).
For the triangulation of the point clouds, the Poisson algorithm [13] implemented in the software package CloudCompare was used. The method reconstructs smooth 3D surface from point samples and recovers fine details even from noisy data. The approach is based on a hierarchy of locally supported basis functions and its performance is proportional to the size of reconstructed data.
Surface models allow architectural objects to be treated as continuous and smooth structures. Unlike point clouds, this representation makes it possible to determine surface direction, reflections, obscurations and provides for more precise point-to-mesh distance measurements.
Evidently, the surface model’s determination based on sampled measurements or photogrammetric reconstruction requires approximating the set of surface points, which is an ambiguous issue, especially for point clouds with the non-uniform distribution. This is the case in our considerations, so the main issue was to reconstruct and integrate point clouds with the highest possible coverage and to ensure continuity of the surface representation.

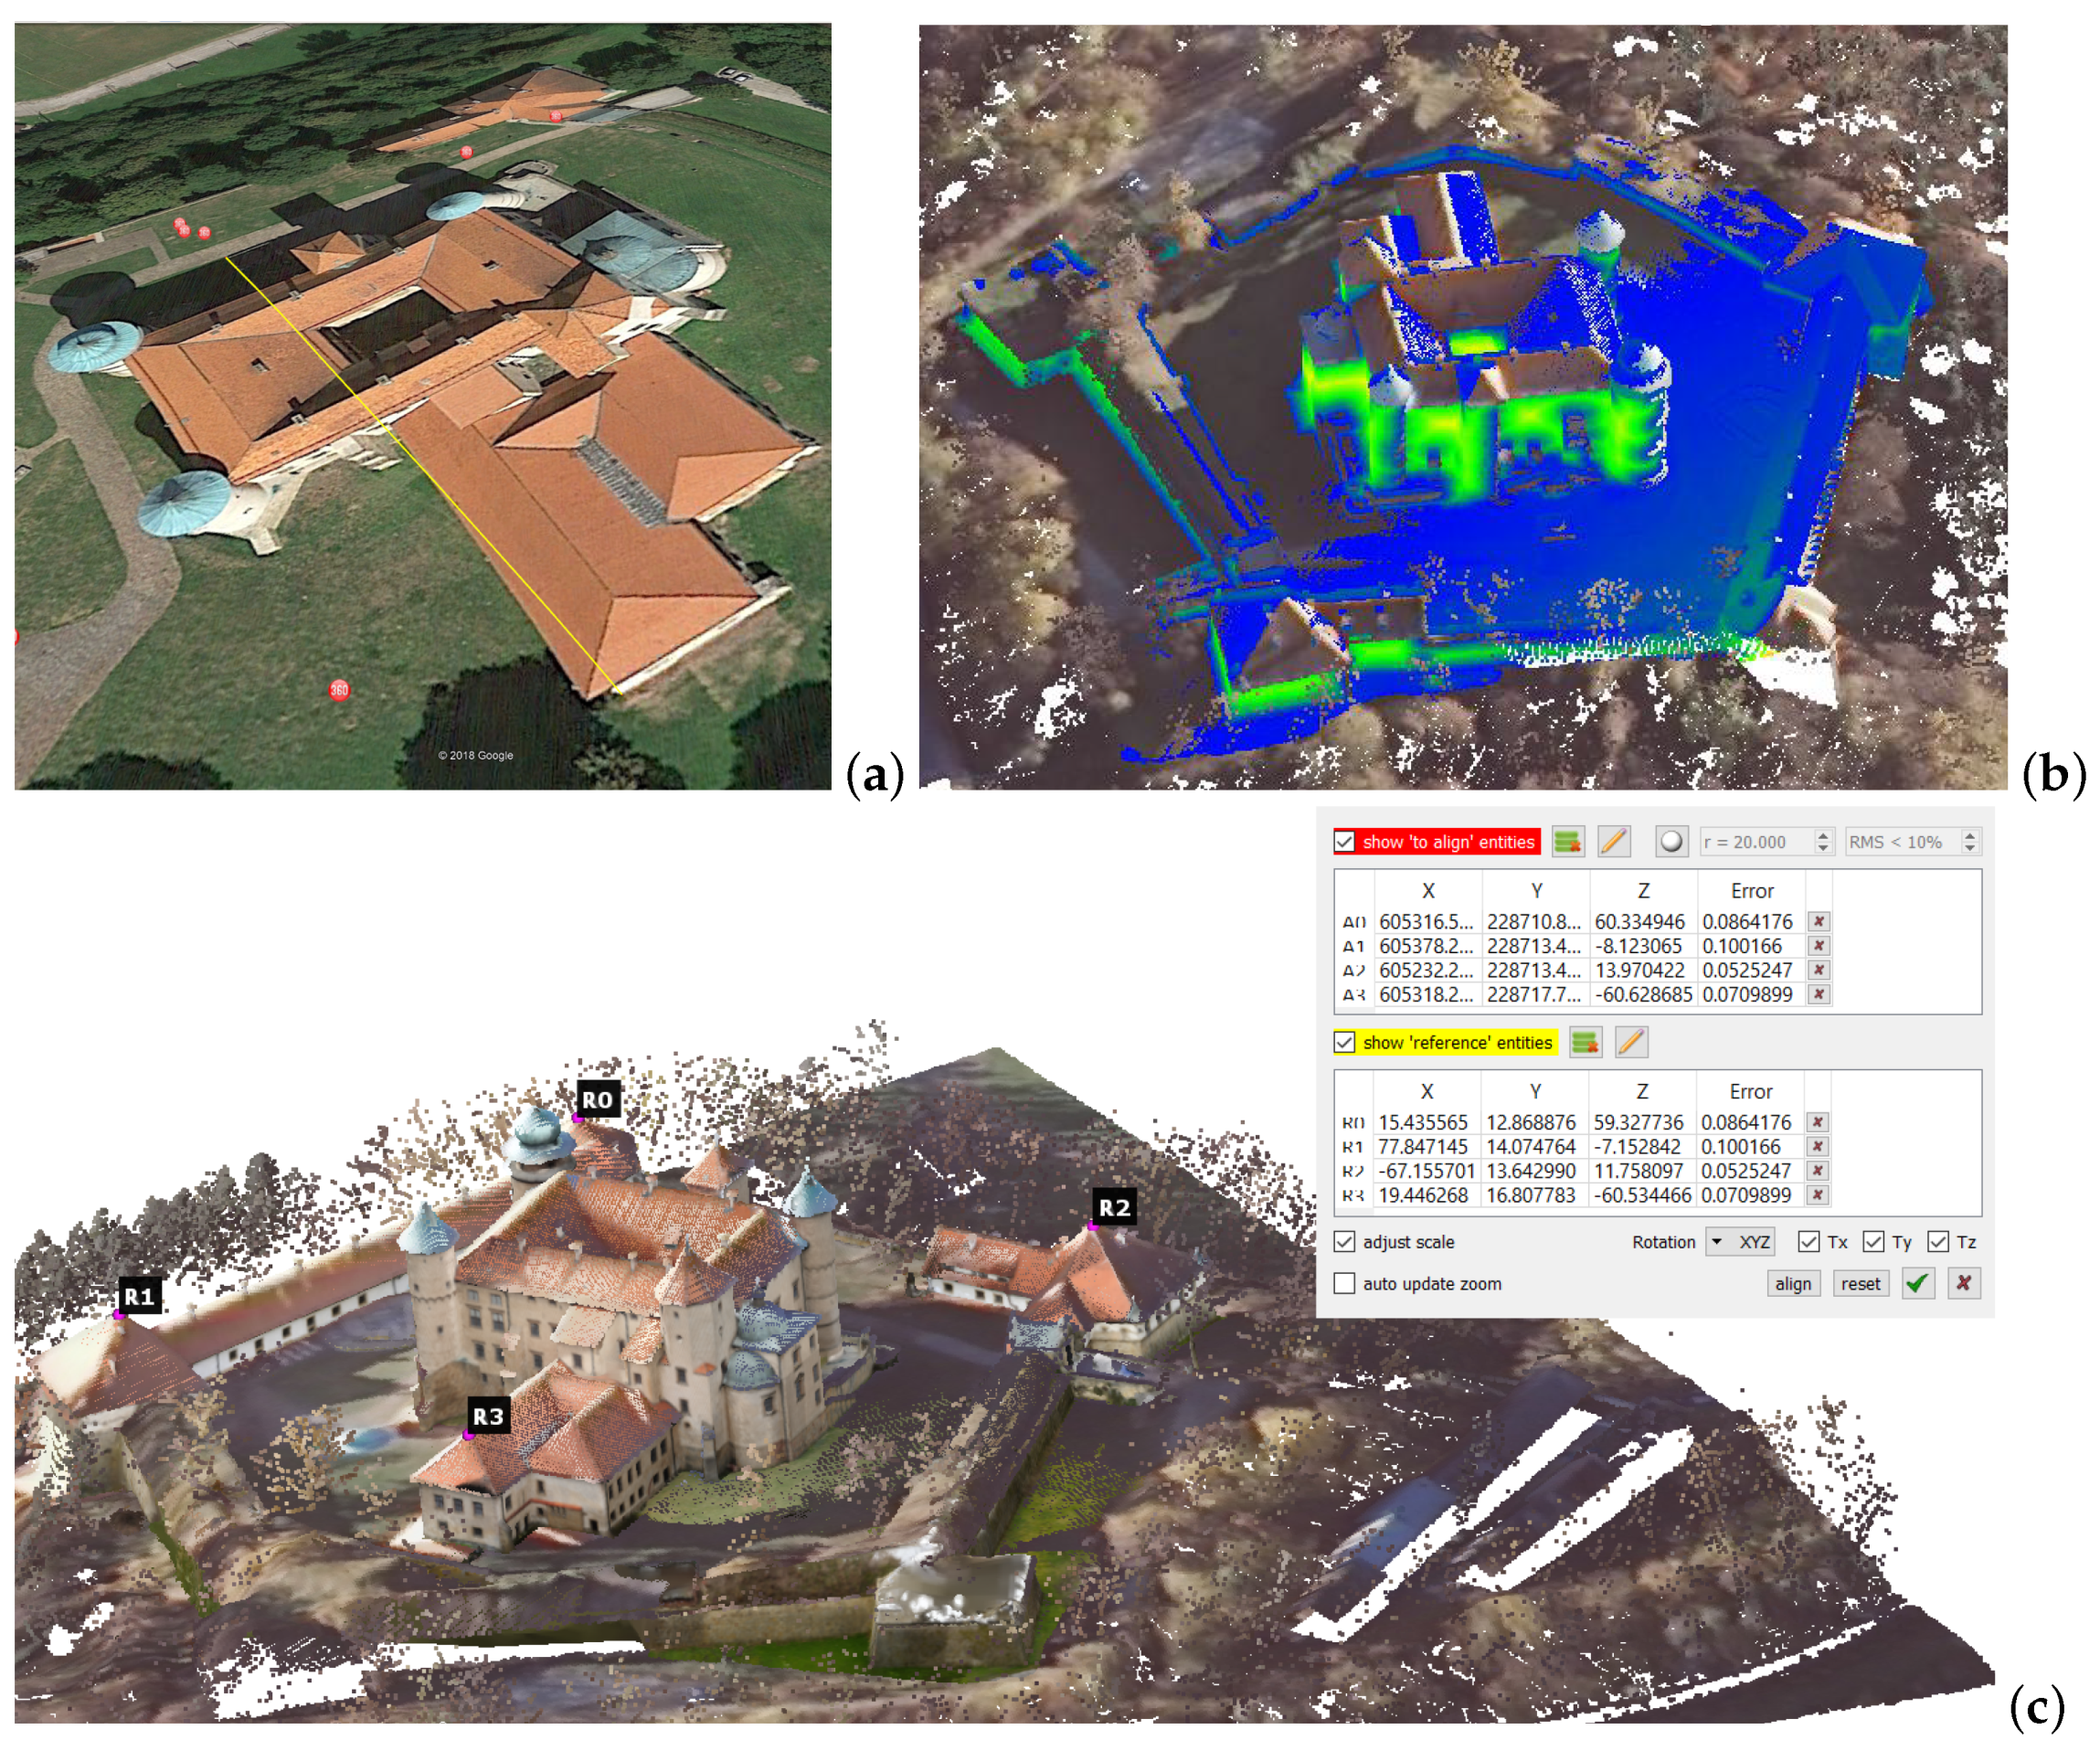
3.3. Scaling Up the Model

After combining all parts of the reconstruction and fitting them together, the model did not represent the actual size of the objects it depicted. This was caused by using the markerless method when creating the individual parts of the reconstruction. In addition, up to this point, no reference to the actual size was indicated. In order to give the model accurate dimensions, it was initially scaled proportionally to the orthophoto obtained from the National Geoportal (Figure 15a). The map is geolocated, so the reconstruction could also obtain a position consistent with the location. However, fitting the model to the 2D map does not allow the model to match the space it should occupy completely. The model’s skewing could be observed in the fitting graphs of (Figure 15b). Therefore, a LAS ISOK point cloud was adopted as a reference. It had properly fixed points in space representing roofs, outer courtyard, and other non-vertical surfaces. The model was fitted to the point cloud by matrix vertex multiplication. The reference point pairs were selected as in Figure 15c. Due to the precise selection of appropriate point pairs, the model occupied the appropriate space, and in particular, the vertical axis was corrected.
Error estimation in fitting the reconstituted model points to the LAS ISOK point cloud using the RMS-error method gave unreliable results. In the LAS ISOK model, almost no points represent vertical walls, which relates to how these points are acquired from altitude. The matching of the points on the roofs and the ground was correct, as indicated by the blue colour. However, the LAS ISOK model’s closest points were found at large distances on the roofs and the ground for the walls’ points. These points are marked in green, and these long distances distorted the RMS-error estimation statistics (Table 2). However, after comparing the sparse LAS ISOK point cloud to the reconstruction model, the method gave correct results. There were no significant differences in positions to indicate a model mismatch. All points of the LAS ISOK model were found close to the recruited model; therefore, the points representing the castle surfaces were blue (Figure 16b).
The data included in Table 2 show a considerable statistical discrepancy in the error estimation (RMS) between the reconstructed model and the LAS ISOK data and between the LAS ISOK cloud and the reconstructed model. In the first case, as many as 25% of the points are more than 1.14 m (quartile 3) from the comparison data. Overall, 27.5% of points are at a distance of more than 1 m, i.e., above the urban scale’s accuracy. These errors are due to the aforementioned inaccuracy related to the representation of vertical surfaces. Nevertheless, the median is quite low at 30.6 cm. On the other hand, the RMS error estimation results for the ISOK LAS fit to the reconstructed model show its very high accuracy. Additionally, 50% of the points (median) are closer than 16.4 cm, and 75% of them (quartile 3) are closer than 24.6 cm. Besides, only 3.2% of the points are at a distance above 1 m, i.e., above the urban scale’s accuracy. These large deviations are related to places where there was insufficient data in the reconstructed model, as shown in Figure 16a,b. Such places can be located as white spots on the horizontal surfaces, visible in Figure 13 and Figure 16a. In Figure 16b such places are visible as patches of light green. These sites are overgrown with medium to tall vegetation that has present only 1.5%, so they do not significantly impact the statistical data.

4. Discussion and Conclusions

Our paper describes the process of consolidating data obtained for photogrammetric reconstruction, taken from different sources, and their verification based on publicly available spatial data. Data collection methods from both terrestrial photography and UAVs are used and described in the literature increasingly frequently. New and sophisticated software tools are being developed to streamline the data merging and refinement process. However, these tools may not be sufficiently accessible for the average user. In the presented approach, we applied widely used and well-known tools. However, the commerciality of the software Agisoft Metashape, may prove an unavoidable obstacle, which is why we explore its replacement with open source software, e.g., VisualSFM [60].
As shown in Section 3.1, the process of automatically combining reconstructions using SFM software is often unreliable. Photogrammetric reconstructions are sensitive to changes in illumination and scaling of photographs, and require scenes with wide brightness ranges. Moreover, the software offered has limited capabilities when it comes to merging partial reconstructions and unifying the model scale. Therefore, we used the capabilities of CloudCompare, an open-source point cloud processing software. In our approach, we abandoned the introduction of reference markers, which can be helpful in merging reconstructions; however, they are difficult to apply on such an extensive object. Instead, we used software methods to correct the matching of the indicated point correspondences by minimising the local matching error (RMS).
The verification process of the model we obtained was based on publicly available data in LAS point clouds, originating from the ISOK project, and made available on the National Geoportal [5]. The much sparser LAS ISOK point cloud constitutes the verification matrix of the reconstructed model’s dense point cloud. The verification consists of a systematic sampling of the reconstructed model at the LAS ISOK model’s point distribution frequency. The RMS error estimation method used here allows the determination of the fitting error’s statistical values, which are expressed in the spatial distance, well understood by engineers potentially using such models. In contrast to the approach that uses verification of photogrammetric reconstruction accuracy for architectural and archaeological heritage using TLS [44] our method does not require expensive and specialised equipment. Our results show that such a method is accurate and can be successfully applied.
Unfortunately, there are no satisfactory solutions yet for areas covered with dense vegetation. Obtaining a reconstruction of an area covered with medium and high vegetation is to be solved in further research. It may not be possible to achieve this only with photogrammetric methods.
Even a sparse LAS ISOK point clouds can provide verification data for models obtained with this method, making this method appropriate for ISOK data densification. LAS ISOK point clouds have their advantages for spatial analysis, but their density of 6 points/m2, obtained for areas outside large cities, does not provide enough information for different types of measurements needed in engineering design. Therefore, the model obtained with our method is a natural way of densifying selected fragments of space for specific needs of urban planning, architectural, construction, or conservation projects. The accuracy obtained in this case allows for conceptual performance designs, cost estimation of roof or facade renovations by developers, the installation of illumination, or innovative augmented reality games.
Due to the cooperation between members of our research team and the local authorities of the city and commune of Nowy Wiśnicz, as well as the castle management, which has been ongoing for several years, this particular model will complement the knowledge base on the valuable historical object, contributing to its popularisation. The castle has been stripped of its furnishings due to various historical events, which creates an opportunity to recreate the exhibition in augmented reality (AR). It is planned to use the digital model for the installation of AR games, consistent with historical realities, and design 3D mapping multimedia shows.

Author Contributions

Conceptualization, P.Ł., P.O. and K.S.; methodology, P.Ł., P.O. and K.S.; validation, P.Ł., P.O. and K.S.; formal analysis, P.Ł., A.O., P.O. and K.S.; investigation, P.Ł., P.O. and K.S.; resources, P.Ł., A.O., P.O. and K.S.; writing—original draft preparation, P.Ł., A.O., P.O. and K.S.; writing—review and editing, P.Ł., A.O., P.O. and K.S.; visualization, P.Ł., P.O. and K.S. All authors have read and agreed to the published version of the manuscript.

Funding

This research received no external funding.

Institutional Review Board Statement

Not applicable.

Informed Consent Statement

Not applicable.

Data Availability Statement

The study used data in LAS format, which is freely available at https://mapy.geoportal.gov.pl/imap/Imgp_2.html (accessed on 25 March 2021).

Acknowledgments

We would like to thank the management of the castle in Nowy Wiśnicz for allowing us to access the building for scientific research.

Conflicts of Interest

The authors declare no conflict of interest.

Abbreviations

The following abbreviations are used in this manuscript:
SFMStructure from motion
MVSMulti-view stereo
UAVUnmanned aerial vehicle
SIFTScale-invariant feature transform
DSMDigital surface model
BIMBuilding information model
DSLMDigital single lens mirrorless
DSLRDigital single lens reflex
LiDARLight detection and ranging
ISOKIT system of the country protection
ExifExchangeable image file format
TLSTerrestrial laser scanning
RMSRoot-mean-square
ICPIterative closest point

References

  1. Gosztyła, M.; Pásztor, P. Konserwacja i ochrona Zabytków Architektury, 1st ed.; Oficyna Wydawnicza Politechniki Rzeszowskiej: Rzeszów, Poland, 2014; pp. 93–100. [Google Scholar]
  2. Reinoso-Gordo, J.F.; Gámiz-Gordo, A.; Barrero-Ortega, P. Digital Graphic Documentation and Architectural Heritage: Deformations in a 16th-Century Ceiling of the Pinelo Palace in Seville (Spain). ISPRS Int. J. Geo-Inf. 2021, 10, 85. [Google Scholar] [CrossRef]
  3. Dettloff, P. Odbudowa i Restauracja Zabytków Architektury w Polsce w Latach 1918–1939 Teoria i Praktyka, 1st ed.; Universitas: Kraków, Poland, 2008. [Google Scholar]
  4. Prawo geodezyjne i kartograficzne z dnia 17 maja 1989 r., Dz. U. 1989 Nr 30 poz. 163, art. 40a ust. 2 pkt.1. Available online: https://isap.sejm.gov.pl/isap.nsf/DocDetails.xsp?id=WDU19890300163 (accessed on 25 March 2021).
  5. Geoportal Krajowy. Available online: https://mapy.geoportal.gov.pl/imap/Imgp_2.html (accessed on 25 March 2021).
  6. LAS Specification 1.4-R14. The American Society for Photogrammetry & Remote Sensing. Available online: http://www.asprs.org/wp-content/uploads/2019/03/LAS_1_4_r14.pdf (accessed on 26 March 2021).
  7. Informatyczny System Osłony Kraju. Available online: https://isok.gov.pl/index.html (accessed on 26 March 2021).
  8. Chen, J.; Yi, J.S.K.; Kahoush, M.; Cho, E.S.; Cho, Y.K. Point Cloud Scene Completion of Obstructed Building Facades with Generative Adversarial Inpainting. Sensors 2020, 20, 5029. [Google Scholar] [CrossRef] [PubMed]
  9. Ramos, M.M.; Remondino, F. Data Fusion in Cultural Heritage—A Review. Int. Arch. Photogramm. Remote Sens. Spat. Inf. Sci. 2015, XL-5/W7, 359–363. [Google Scholar] [CrossRef] [Green Version]
  10. Klein, N.; Li, N.; Becerik-Gerber, B. Imaged-based verification of as-built documentation of operational buildings. Autom. Constr. 2012, 21, 161–171. [Google Scholar] [CrossRef]
  11. Jebara, T.; Azarbayenjani, A.; Pentl, A. 3D structure from 2D motion. IEEE Signal Process. Mag. 1999, 16, 66–84. [Google Scholar] [CrossRef]
  12. Skabek, K.; Łabędź, P.; Ozimek, P. Improvement and unification of input images for photogrammetric reconstruction. Comput. Assist. Methods Eng. Sci. 2020, 26, 153–162. [Google Scholar]
  13. Kazhdan, M.; Matthew, B.; Hoppe, H. Poisson surface reconstruction. In Proceedings of the Fourth Eurographics Symposium on Geometry Processing, Cagliari, Sardinia, 26–28 June 2006. [Google Scholar]
  14. Risse, B.; Mangan, M.; Sturzl, W.; Webb, B. Software to convert terrestrial LiDAR scans of natural environments into photorealistic meshes. Environ. Model. Softw. 2018, 99, 88–100. [Google Scholar] [CrossRef] [Green Version]
  15. Farella, E.M.; Torresani, A.; Remondino, F. Refining the Joint 3D Processing of Terrestrial and UAV Images Using Quality Measures. Remote Sens. 2020, 12, 2873. [Google Scholar] [CrossRef]
  16. Di Angelo, L.; Di Stefano, P.; Guardiani, E.; Morabito, A.E. A 3D Informational Database for Automatic Archiving of Archaeological Pottery Finds. Sensors 2021, 21, 978. [Google Scholar] [CrossRef] [PubMed]
  17. Apollonio, F.I.; Fantini, F.; Garagnani, S.; Gaiani, M. A Photogrammetry-Based Workflow for the Accurate 3D Construction and Visualization of Museums Assets. Remote Sens. 2021, 13, 486. [Google Scholar] [CrossRef]
  18. Donato, E.; Giuffrida, D. Combined Methodologies for the Survey and Documentation of Historical Buildings: The Castle of Scalea (CS, Italy). Heritage 2019, 2, 2384–2397. [Google Scholar] [CrossRef] [Green Version]
  19. Brůha, L.; Laštovička, J.; Palatý, T.; Štefanová, E.; Štych, P. Reconstruction of Lost Cultural Heritage Sites and Landscapes: Context of Ancient Objects in Time and Space. ISPRS Int. J. Geo-Inf. 2020, 9, 604. [Google Scholar] [CrossRef]
  20. Goedert, J.; Bonsell, J.; Samura, F. Integrating Laser Scanning and Rapid Prototyping to enhance Construction Modeling. J. Archit. Eng. 2005, 11, 71–74. [Google Scholar] [CrossRef]
  21. Xiao, Z.; Liang, J.; Yu, D.; Asundi, A. Large field-of-view deformation measurement for transmission tower based on close-range photogrammetry. Measurement 2011, 44, 1705–1712. [Google Scholar] [CrossRef]
  22. Maas, H.G.; Hampel, U. Photogrammetric Techniques in Civil Engineering Material Testing and Structure Monitoring. Photogramm. Eng. Remote Sens. 2006, 72, 39–45. [Google Scholar] [CrossRef]
  23. Osello, A.; Lucibello, G.; Morgagni, F. HBIM and Virtual Tools: A New Chance to Preserve Architectural Heritage. Buildings 2018, 8, 12. [Google Scholar] [CrossRef] [Green Version]
  24. Attenni, M. Informative Models for Architectural Heritage. Heritage 2019, 2, 2067–2089. [Google Scholar] [CrossRef] [Green Version]
  25. Carnevali, L.; Lanfranchi, F.; Russo, M. Built Information Modeling for the 3D Reconstruction of Modern Railway Stations. Heritage 2019, 2, 2298–2310. [Google Scholar] [CrossRef] [Green Version]
  26. Croce, V.; Caroti, G.; De Luca, L.; Jacquot, K.; Piemonte, A.; Véron, P. From the Semantic Point Cloud to Heritage-Building Information Modeling: A Semiautomatic Approach Exploiting Machine Learning. Remote Sens. 2021, 13, 461. [Google Scholar] [CrossRef]
  27. Chan, T.O.; Xia, L.; Chen, Y.; Lang, W.; Chen, T.; Sun, Y.; Wang, J.; Li, Q.; Du, R. Symmetry Analysis of Oriental Polygonal Pagodas Using 3D Point Clouds for Cultural Heritage. Sensors 2021, 21, 1228. [Google Scholar] [CrossRef]
  28. Mahami, H.; Nasirzadeh, F.; Hosseininaveh Ahmadabadian, A.; Nahavandi, S. Automated Progress Controlling and Monitoring Using Daily Site Images and Building Information Modelling. Buildings 2019, 9, 70. [Google Scholar] [CrossRef] [Green Version]
  29. Ma, Y.-P. Extending 3D-GIS District Models and BIM-Based Building Models into Computer Gaming Environment for Better Workflow of Cultural Heritage Conservation. Appl. Sci. 2021, 11, 2101. [Google Scholar] [CrossRef]
  30. Kłopotowska, A.; Kłopotowski, M. Dotykowe Modele Architektoniczne w Przestrzeniach Polskich Miast, 1st ed.; Oficyna Wydawnicza Politechniki Białostockiej: Białystok, Poland, 2018; Volume 1, pp. 27–82. [Google Scholar]
  31. Partovi, T.; Fraundorfer, F.; Bahmanyar, R.; Huang, H.; Reinartz, P. Automatic 3-D Building Model Reconstruction from Very High Resolution Stereo Satellite Imagery. Remote Sens. 2019, 11, 1660. [Google Scholar] [CrossRef] [Green Version]
  32. Bacharidis, K.; Sarri, F.; Paravolidakis, V.; Ragia, L.; Zervakis, M. Fusing Georeferenced and Stereoscopic Image Data for 3D Building Façade Reconstruction. ISPRS Int. J. Geo-Inf. 2018, 7, 151. [Google Scholar] [CrossRef] [Green Version]
  33. Hu, P.; Yang, B.; Dong, Z.; Yuan, P.; Huang, R.; Fan, H.; Sun, X. Towards Reconstructing 3D Buildings from ALS Data Based on Gestalt Laws. Remote Sens. 2018, 10, 1127. [Google Scholar] [CrossRef] [Green Version]
  34. Zheng, Y.; Weng, Q.; Zheng, Y. A Hybrid Approach for Three-Dimensional Building Reconstruction in Indianapolis from LiDAR Data. Remote Sens. 2017, 9, 310. [Google Scholar] [CrossRef] [Green Version]
  35. Jung, J.; Jwa, Y.; Sohn, G. Implicit Regularization for Reconstructing 3D Building Rooftop Models Using Airborne LiDAR Data. Sensors 2017, 17, 621. [Google Scholar] [CrossRef]
  36. Yang, B.; Huang, R.; Li, J.; Tian, M.; Dai, W.; Zhong, R. Automated Reconstruction of Building LoDs from Airborne LiDAR Point Clouds Using an Improved Morphological Scale Space. Remote Sens. 2017, 9, 14. [Google Scholar] [CrossRef] [Green Version]
  37. Cali, M.; Ambu, R. Advanced 3D Photogrammetric Surface Reconstruction of Extensive Objects by UAV Camera Image Acquisition. Sensors 2018, 18, 2815. [Google Scholar] [CrossRef] [Green Version]
  38. Gonçalves, G.; Gonçalves, D.; Gómez-Gutiérrez, Á.; Andriolo, U.; Pérez-Alvárez, J.A. 3D Reconstruction of Coastal Cliffs from Fixed-Wing and Multi-Rotor UAS: Impact of SfM-MVS Processing Parameters, Image Redundancy and Acquisition Geometry. Remote Sens. 2021, 13, 1222. [Google Scholar] [CrossRef]
  39. Sestras, P.; Roșca, S.; Bilașco, Ș.; Naș, S.; Buru, S.M.; Kovacs, L.; Spalević, V.; Sestras, A.F. Feasibility Assessments Using Unmanned Aerial Vehicle Technology in Heritage Buildings: Rehabilitation-Restoration, Spatial Analysis and Tourism Potential Analysis. Sensors 2020, 20, 2054. [Google Scholar] [CrossRef] [PubMed] [Green Version]
  40. Colomina, I.; Molina, P. Unmanned aerial systems for photogrammetry and remote sensing: A review. ISPRS J. Photogramm. Remote Sens. 2014, 92, 79–97. [Google Scholar] [CrossRef] [Green Version]
  41. Nex, F.; Remondino, F. UAV for 3D mapping applications: A review. Appl. Geomatics 2013, 6, 1–15. [Google Scholar] [CrossRef]
  42. Li, Y.; Wu, B. Relation-Constrained 3D Reconstruction of Buildings in Metropolitan Areas from Photogrammetric Point Clouds. Remote Sens. 2021, 13, 129. [Google Scholar] [CrossRef]
  43. Alidoost, F.; Arefi, H.; Tombari, F. 2D Image-To-3D Model: Knowledge-Based 3D Building Reconstruction (3DBR) Using Single Aerial Images and Convolutional Neural Networks (CNNs). Remote Sens. 2019, 11, 2219. [Google Scholar] [CrossRef] [Green Version]
  44. Moyano, J.; Nieto-Julián, J.E.; Bienvenido-Huertas, D.; Marín-García, D. Validation of Close-Range Photogrammetry for Architectural and Archaeological Heritage: Analysis of Point Density and 3D Mesh Geometry. Remote Sens. 2020, 12, 3571. [Google Scholar] [CrossRef]
  45. Książek, M. Miasta prywatne Wiśnicz Nowy i Kolbuszowa, 1st ed.; Wydawnictwo PK: Kraków, Poland, 1990; pp. 29–99. [Google Scholar]
  46. Marcinek, R. Nowy Wiśnicz: Niezwykły świat Polskiego Baroku, 1st ed.; Muzeum Ziemi Wiśnickiej: Nowy Wiśnicz, Poland, 2018. [Google Scholar]
  47. Szlezynger, P. Nowy Wiśnicz: Historia, Architektura, Konserwacja, 1st ed.; Akademia Wychowania Fizycznego im. Bronisława Czecha: Kraków, Poland, 2013. [Google Scholar]
  48. Majewski, A. The Castle in Wiśnicz: The History of the Castle and Its Reconstruction, 1st ed.; Muzeum Historyczne m. Tarnobrzega: Tarnobrzeg, Poland, 1998. [Google Scholar]
  49. Rozporządzenie Prezydenta Rzeczypospolitej Polskiej z dnia 20 Kwietnia 2020 r. w Sprawie Uznania za Pomnik Historii “Nowy Wiśnicz—Zespół Architektoniczno-Krajobrazowy”. Available online: https://www.prawo.pl/akty/dz-u-2020-841,18988724.html (accessed on 25 March 2021).
  50. Bogdanowski, J. Architektura Obronna w Krajobrazie Polski, 1st ed.; Wydawnictwo Naukowe PWN: Kraków, Poland, 1996; pp. 123–159. [Google Scholar]
  51. Forczek-Brataniec, U. The cultural landscape of Nowy Wiśnicz—A study of visual exposure as a basis for the development and management of the surroundings of the castle hill. Tech. Trans. 2019, 11, 23–40. [Google Scholar] [CrossRef] [Green Version]
  52. Luhmann, T.; Robson, S.; Kyle, S.; Boehm, J. Close Range Photogrammetry and 3D Imaging, 2nd ed.; Walter de Gruyter: London, UK, 2013. [Google Scholar]
  53. Skabek, K.; Tomaka, A. Comparison of photogrammetric techniques for surface reconstruction from images to reconstruction from laser scanning. Theor. Appl. Informat. 2014, 26, 161–178. [Google Scholar]
  54. Agisoft LLC. Agisoft Metashape (Version 1.6.3); Agisoft LLC: Saint Petersburg, Russia, 2020. [Google Scholar]
  55. Lowe, D. Object recognition from local scale-invariant features. In Proceedings of the International Conference on Computer Vision, Corfu, Greece, 20–25 September 1999; Volume 2, pp. 1150–1157. [Google Scholar]
  56. Shan, J.; Toth, C.K. Topographic Laser Ranging and Scanning: Principles and Processing, 2nd ed.; CRC Press: Boca Raton, FL, USA, 2018. [Google Scholar]
  57. Directive 2007/2/EC of the European Parliament and of the Council of 14 March 2007 establishing an Infrastructure for Spatial Information in the European Community (INSPIRE). Available online: https://eur-lex.europa.eu/legal-content/EN/ALL/?uri=CELEX%3A32007L0002 (accessed on 25 March 2021).
  58. Besl, P.J.; McKay, N.D. A method for registration of 3-d shapes. IEEE Trans. Pattern Anal. Mach. Intell. 1992, 14, 239–256. [Google Scholar] [CrossRef]
  59. Eggert, D.; Dalyot, S. Octree-Based SIMD Strategy for ICP Registration and Alignment of 3d Point Clouds. ISPRS Annals of the Photogrammetry. Remote Sens. Spat. Inf. Sci. 2012, I-3, 105–110. [Google Scholar]
  60. Wu, C. VisualSFM: A Visual Structure from Motion System. Available online: http://ccwu.me/vsfm/ (accessed on 25 March 2021).
Figure 1. Location of Nowy Wiśnicz.
Buildings 11 00206 g001
Figure 2. Photo acquisition strategy for photogrammetry: parallel (a); interior (b); object-focused (c).
Buildings 11 00206 g002
Figure 3. Examples of photographs for individual sets of terrestrial photography (ac); estimation of photo locations for a sample set of terrestrial photography (d).
Buildings 11 00206 g003
Figure 4. Principles of UAV image acquisition. Orthogonal projection (a); oblique projection (b).
Buildings 11 00206 g004
Figure 5. Examples of photographs for individual aerial photography collections (ac); estimation of image locations for a sample set of aerial photography in orthogonal projection (d).
Buildings 11 00206 g005
Figure 6. Examples of additional images.
Buildings 11 00206 g006
Figure 7. Point cloud density: sparse cloud (a), dense cloud (b).
Buildings 11 00206 g007
Figure 8. Example of a depth map.
Buildings 11 00206 g008
Figure 9. Point cloud confidence (a); point cloud after confidence filtration—levels 1–3 removed (b).
Buildings 11 00206 g009
Figure 10. ISOK point cloud: scanning colours (a); class colours (b).
Buildings 11 00206 g010
Figure 11. Matching errors: rough matching errors (a); precise adjustments (b).
Buildings 11 00206 g011
Figure 12. Combining reconstructions of the castle: from a UAV (a); from terrestrial photographs (b); the inner courtyard (c).
Buildings 11 00206 g012
Figure 13. Linking the castle shell to the bastions: mapping the segments (a), the resultant point cloud (b).
Buildings 11 00206 g013
Figure 14. Polygon models of the castle in Nowy Wiśnicz: only the building (4,133,352 faces) (a); the building with fortifications (1,966,487 faces) (b).
Buildings 11 00206 g014
Figure 15. Scaling up the model (a); estimation of the error of fitting the reconstructed model to the LAS ISOK point cloud using the RMS-error method (b); fitting the reconstructed model to the LAS ISOK point cloud using the vertex matrix multiplication method. The numbers indicate where pairs of points are indicated (c).
Buildings 11 00206 g015
Figure 16. Distance error (RMS) for reconstructed model and reference LAS ISOK: reconstructed model to LAS ISOK – point-to-point mapping (a) and histogram (b); LAS ISOK to reconstructed model – point-to-mesh mapping (c) and histogram (d). On the vertical axis the number of points is marked, on the horizontal axis – the distance in metres.
Buildings 11 00206 g016
Table 1. Summary of partial reconstructions.
AcquisitionNumberTieDenseFiltered
StageAreaMethodof PhotosPointsCloudCloud
1castle 1terrestrial3661,045,02044,776,43927,337,467
1castle 2UAV302890,75652,896,35833,150,202
1courtyardUAV4741,048,415157,778,99351,763,053
castleintegrated 68,817,32525,527,922
2bastionterrestrial194506,08722,114,73513,990,196
2embankmentUAV6491,830,95585,862,28850,966,297
2outer bastionterrestrial3151,545,45783,823,06713,425,129
castle&bastionintegrated 80,033,67548,969,119
Table 2. Comparison of the fit of the reconstructed model to the LAS ISOK point cloud and the LAS ISOK point cloud to the reconstructed model.
Model to LAS ISOKLAS ISOK to Model
Quartile 10.21680.0822
Median0.30650.1641
Quartile 31.13510.2461
Publisher’s Note: MDPI stays neutral with regard to jurisdictional claims in published maps and institutional affiliations.

