Review

Characterizing Positive Energy District (PED) through a Preliminary Review of 60 Existing Projects in Europe

1
School of Technology and Business Studies, Dalarna University, SE-79131 Falun, Sweden
2
Department of Energy and Community Building, Dalarna University, SE-79188 Falun, Sweden
3
Center for Energy, Environmental and Technological Research (CIEMAT), Department of Energy, 28040 Madrid, Spain
4
IREC—Catalonia Institute for Energy Research, 08930 Sant Adrià de Besòs, Barcelona, Spain
5
Faculty of Architecture and Design, Norwegian University of Science and Technology, NO-7491 Trondheim, Norway
6
VITO—Flemish Institute for Technological Research, BE-2400 Mol, Belgium
*
Author to whom correspondence should be addressed.
Submission received: 24 May 2021 / Revised: 19 July 2021 / Accepted: 20 July 2021 / Published: 24 July 2021
(This article belongs to the Special Issue Net-Zero/Positive Energy Buildings and Districts)

Abstract

:
Positive Energy District (PED) is recently proposed to be an integral part of a district/urban energy system with a corresponding positive influence. Thus, the PED concept could become the key solution to energy system transition towards carbon neutrality. This paper intends to report and visualize the initial analytical results of 60 existing PED projects in Europe about their main characteristics, including geographical information, spatial-temporal scale, energy concepts, building archetypes, finance source, keywords, finance model and challenges/barriers. As a result, a dedicated date base is developed and it could be further expanded/interoperated through an interactive dashboard. It is found that Norway and Italy have the most PED projects so far. Many PED projects state a ‘yearly’ time scale while nearly 1/3 projects have less than 0.2 km2 area in terms of spatial scale. The private investment together with regional/national grants is commonly observed. A mixture of residential, commercial and office/social buildings are found. The most common renewable energy systems include solar energy, district heating/cooling, wind and geothermal energy. Challenges and barriers for PED related projects vary from the planning stage to the implementation stage. Furthermore, the text mining approach is applied to examine the keywords or concentrations of PED-related projects at different stages. These preliminary results are expected to give useful guidance for future PED definitions and proposals of ‘reference PED’.

1. Introduction

Recently, the Positive Energy District (PED) concept has been discussed substantially as it could become the key solution to energy systems in transition towards carbon neutrality. According to European Strategic Energy Technology (SET) Plan Action 3.2 [1], PED could be defined as an energy-efficient and energy-flexible urban area with surplus renewable energy production and net-zero greenhouse gas emission in a certain time frame. Some PED initiatives aim to create a knowledge base and a roadmap to achieve the energy transition of cities according to established time horizons [2].
Most of the studies and practical experiences about PEDs are based on newly built districts or planning of future districts. Monti et al. [3] described the process of adaption and the challenges/barriers faced by the PED decision makers. They also proposed how simulation, optimization, ICT approaches and business models are combined in a holistic and pragmatic way. Lindholm et al. [4] defined three types of PEDs (i.e., PED autonomous, PED dynamic, and PED virtual), depending on the system boundary and energy import/export conditions. They also pointed out that PED is highly dependent on local context with many impacting factors, such as the available renewable energy sources, energy storage potential, population, energy consumption behavior, costs and regulations, which affect the design and operation of PEDs in different regions. A series of technical solutions, such as the integration of batteries, electric vehicles (EV), and grid-responsive control, were discussed to promote the development of PEDs [5]. Samadzadegan et al. [6] developed a framework to design energy systems for PED or zero-carbon districts, by focusing on estimating heating and cooling demand and sizing related renewable energy systems, e.g., solar photovoltaic (PV) and heat pumps. Shnapp et al. [7] proposed handling the energy performance targets by transferring to the district level the minimum energy requirements imposed by the energy performance of buildings directives to individual buildings. Gabaldón Moreno et al. [8] proposed a methodology for calculating the energy balance at the district level and energy performance of those districts with the potentials to become PEDs. A “double density” simulation scenario was studied further by Bambara et al. [9] to test residential densification potential for PED, where each existing detached house in a community is replaced with two energy-efficient houses of equal living area on the same land lot. From economical and technical points of view, Laitinen et al. [10] concluded that it is more feasible to achieve PED or net-zero energy district, rather than full energy self-sufficiency after they studied a series of technologies (e.g., local centralized wind power, solar PV, battery, heat storage and heat pump), using Helsinki as a case study. Moreover, Soutullo et al. [11] suggested that urban living labs could be a driver to achieve PED. Fatima et al. [12] studied PED’s implementation potential from a citizen engagement aspect. Uspenskaia et al. [13] recommended planning and modeling the replication of PED at the very early stage because it is important to find tailor-made solutions to fit spatial, legislative, socio-economic conditions and historical growth of the cities.
Apart from the newly built districts, an explanatory study was carried out as the first step to support the complex planning urban refurbishment, in order to achieve PED [14]. In their study, the key information on the different district types (e.g., energy consumption) was simulated to identify the districts with the highest potential for energy refurbishment. Civiero et al. [15] provide a view of a district simulation model able to analyze a reliable prediction of potential business scenarios on large scale retrofitting actions and to evaluate a set of parameters and co-benefits resulting from the renovation process of a cluster of buildings. Gouveia et al. [16] also argued that the transformation of the existing districts is essential, including historic districts, which present common challenges across EU cities, such as degraded dwellings, low-income families, and gentrification processes due to massive tourism flows. In their report, they discussed how the PED model can be an opportunity for historic districts to reduce their emissions and mitigate energy poverty. Moreover, a methodology for the evaluation of positive energy buildings and neighbourhoods is proposed in the report [17], where a set of Key Performance Indicators (KPIs) are defined with details on the calculation procedure for categories of Energy and Environmental, Economic, Indoor Environmental Quality (IEQ), Social, Smartness and Energy flexibility.
A research gap is thus observed that there are many studies starting to address technical, economic, social aspects of PED, but very limited studies are found in characterizing PED. The Joint Programme Initiative Urban Europe (JPI UE) [18] plays an important role in coordinating PED projects across Europe, it actively engages the interests of different stakeholders, particularly, cities in PEDs. To accomplish its objectives, only Bossi et al. [19] summarized part of PED’s characteristics in aspects of geographic distribution, implementation status, building structure, land use, energy typology, success factors/challenges, and barriers. While Brozovsky et al. [20] identified different terminologies of PED, and related focused aspects (i.e., energy, social, climate). JPI UE needs more comprehensive scientific advice on the knowledge and methods for guiding the design, monitoring the operation and evaluating the performance of PED projects. Therefore, many other PED characteristics need to be abstracted and categorized for further development of PED, such as district size, finance source, energy concepts, building archetypes, spatial/temporal scale and keywords. Moreover, as PED projects are expanding all the time, it is necessary to use a common tool/database to increase the semantic interoperability among different stakeholders, for an updated summary of PED’s main characteristics.
In the framework of both International Energy Agency—Energy in Buildings and Communities (IEA EBC) Programme Annex 83 [21] and EU Cost action CA19126 [22], the working groups are now collecting data of PEDs and characterizing them for potential proposal of reference and replication of PEDs in different contexts. This paper, therefore, reviews the existing 60 projects within the European area from the JPI Urban Europe PED booklet, establishes the database, and further analyze/visualizes them for the main characteristics. The paper aims to illustrate the basic characteristics of existing PED projects in the EU, and then deliver the information to the targeted stakeholders, such as municipality, urban planner, real estate developer, utility company, policy/regulation maker, renewable energy provider, energy engineer etc., for them to further define, design, promote and implement potential PED projects. As the PED concept is new to most of the stakeholders, this paper intends to transfer the knowledge to the targeted groups through the review/analysis and the development of a database. The result will be also used for the iterative definition of PED in the two initiatives of IEA and EU Cost action.

2. Data Source and Research Methods

2.1. Data Source

The data of PED related projects is collected from the PED booklet [23] by JPI UE updated latest on 2019. JPI Urban Europe is conducting a programme on ‘Positive Energy Districts and Neighbourhoods [24] for Sustainable Urban Development’ with an implementation plan, SET (Strategic Energy Technology) Plan Action 3.2 [1], participated by about 20 European member states, in the context of Europe commitment towards clean energy transition and carbon neutrality. The total databank consists of 60 projects’ data that have similar goals to PED projects in Europe. These projects have been identified and updated by the participated cities of workshops conducted by JPI Urban Europe. The database is divided into several key parameters shown in Table 1.
However, it has been challenging to understand the energy typology and detailed strategies due to unclear/insufficient information for many projects from the JPI Urban Europe booklet. The data for the temporal scale of the projects are only available for very few projects. Due to this insufficient information, external sources, such as the website/publication of the specific project, have been studied and reviewed in order to collect more detailed information [25,26,27,28,29,30,31,32,33,34,35,36,37,38,39,40,41,42].

2.2. Research Methods

2.2.1. Development of Database

A comprehensive critical review was conducted based on the JPI Urban Europe booklet and the related academic literature. The essential data of literature was broken down into thematic categories as shown in Table 1. The important characteristics for PED were either discussed by experts in IEA EBC Annex 83 and EU Cost action CA19126 or extracted from the literature. All the information was observed, recorded and summarized in the excel sheet, which forms up the basic database for this review.
The key thematic parameters for the database are described in detail as below:
  • Project characteristics include the location of the project, initiation year, the status of the project in 2019, which is further divided into stages ‘in planning’, ‘in implementation’, ‘implemented/in operation’. Such categorization refers to the projects where construction of the energy systems is completed and yet to be commissioned or integrate into the existing energy networks. The amount of area is being consumed by the cumulative of all energy systems installed with this project implementation. The appropriate financing source of each project is also checked.
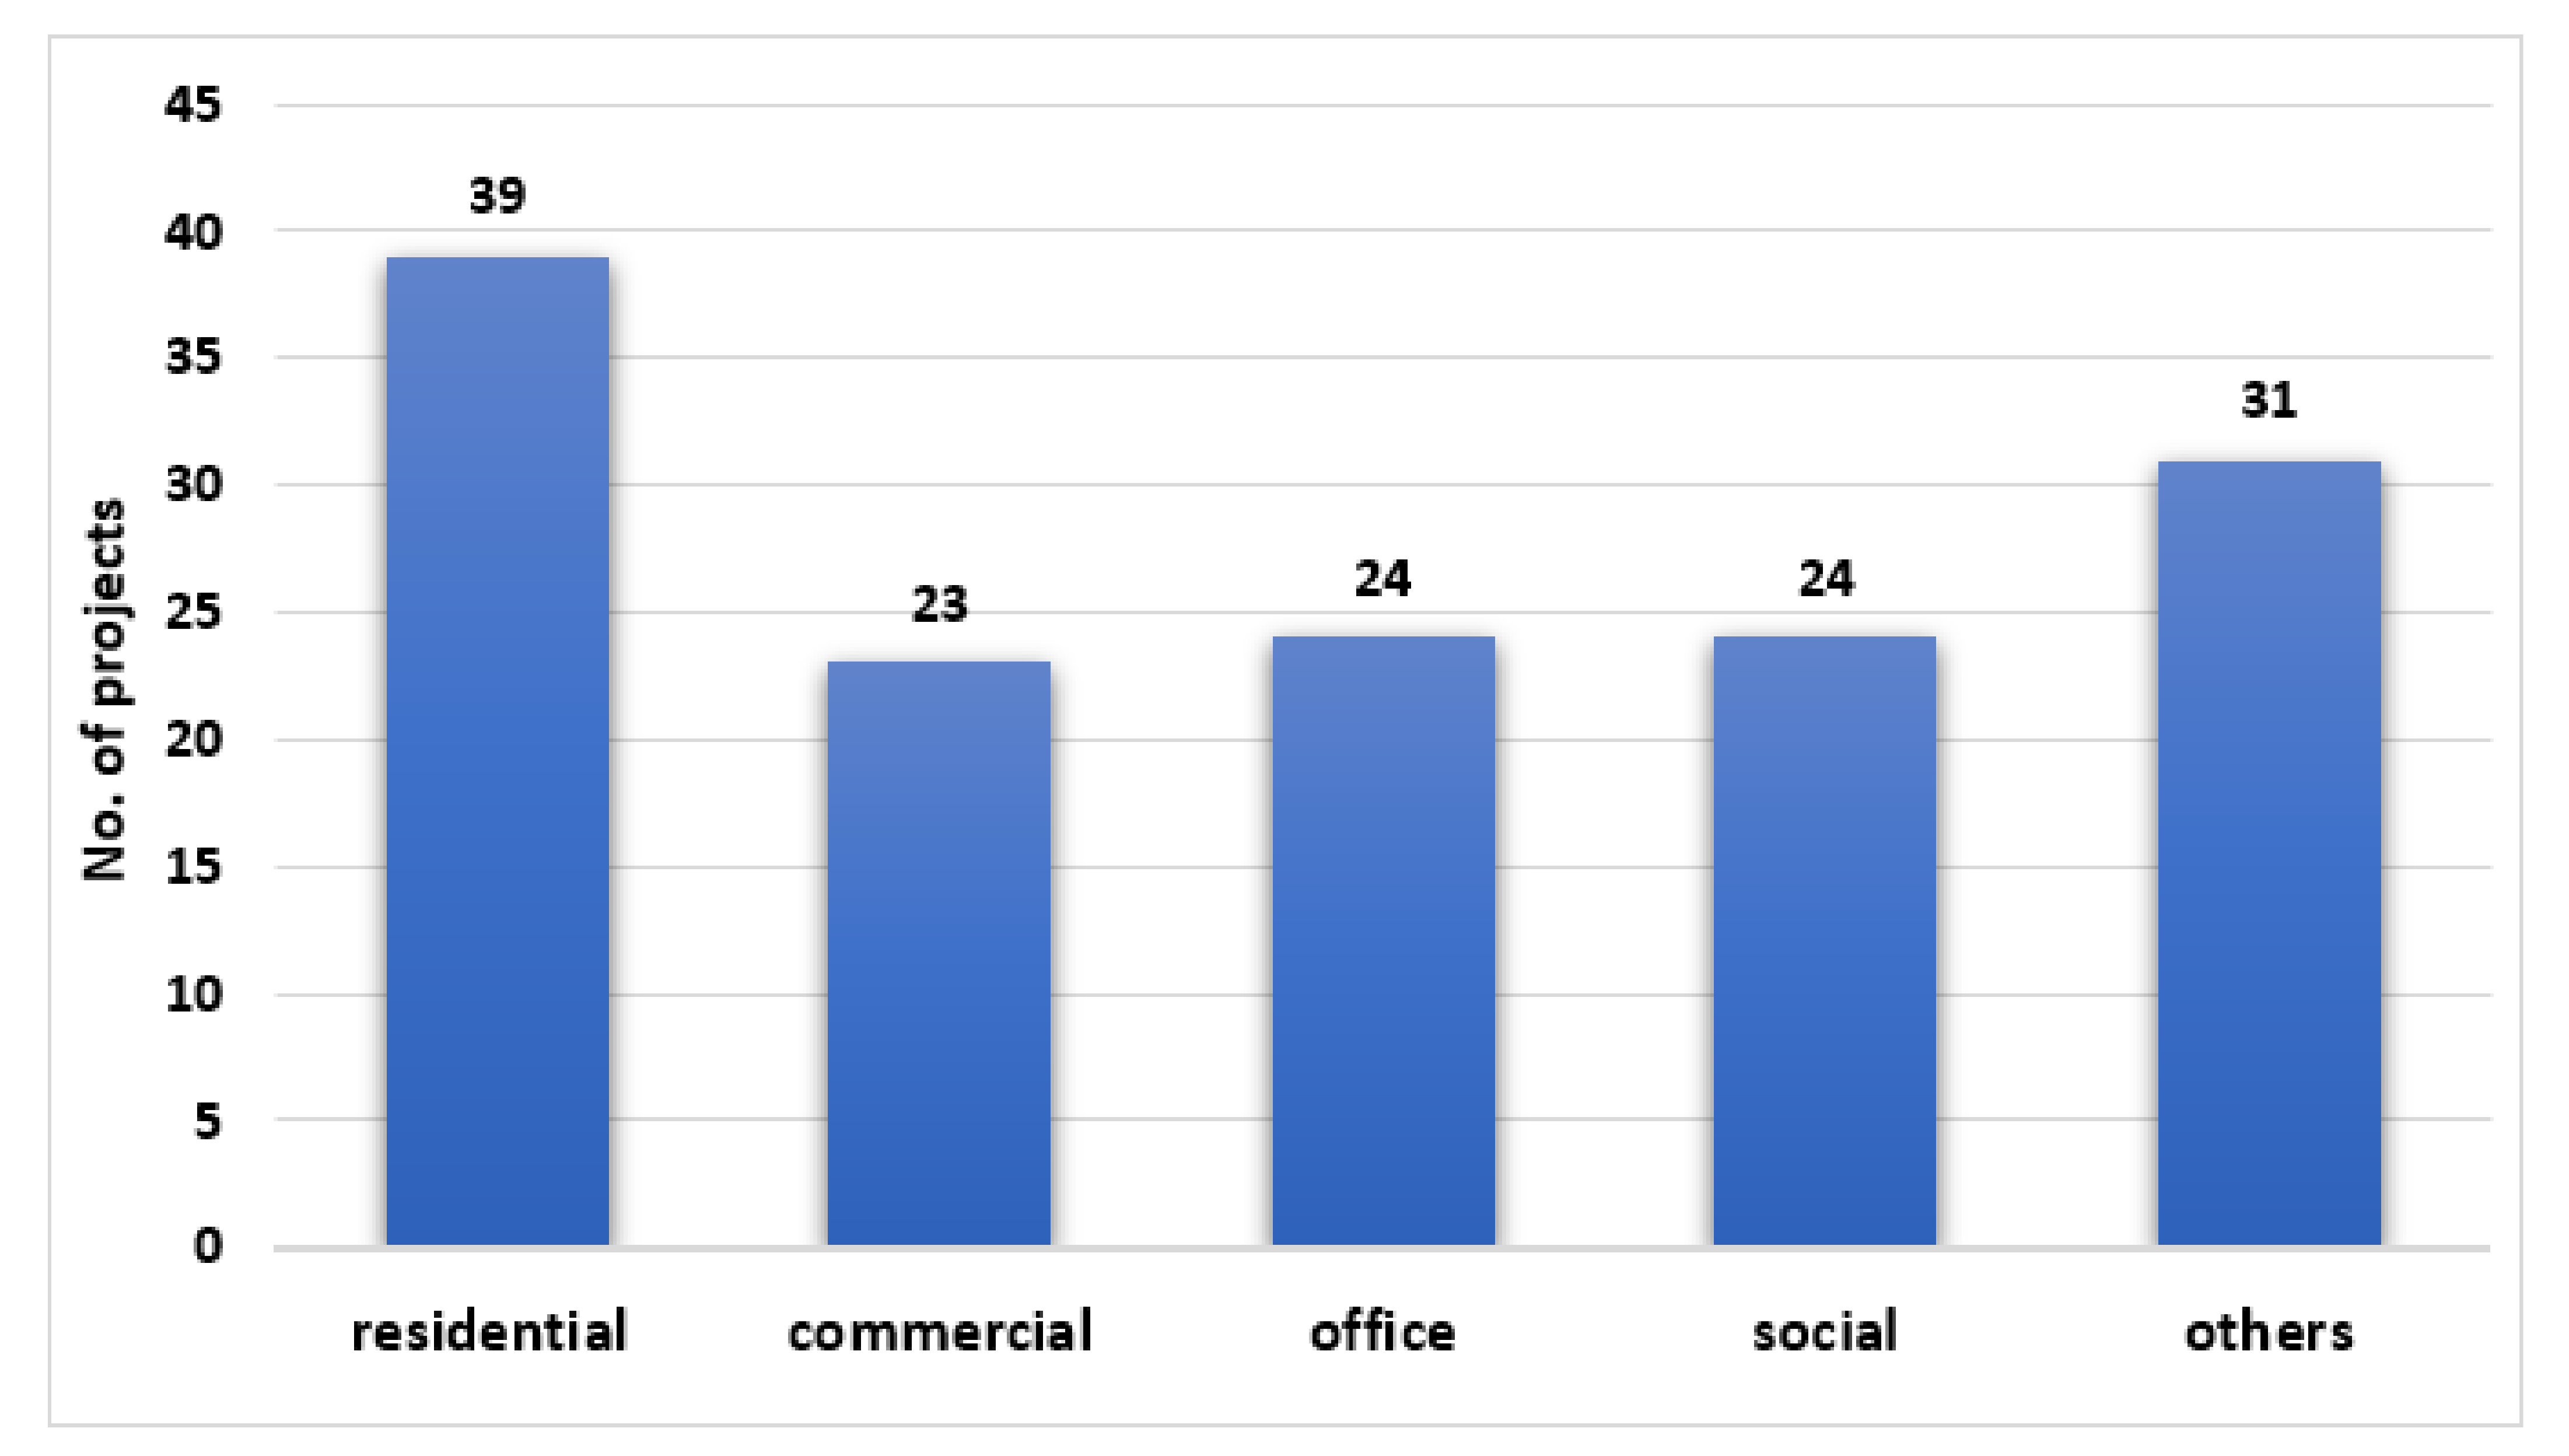
  • The type of buildings involved in the PEDs consist of residential, commercial and industrial, etc. In most cases, renewable energy systems are installed on building components (e.g., roofs, envelopes) to reduce local energy demands and further supply excess energy generation to the neighbourhoods.
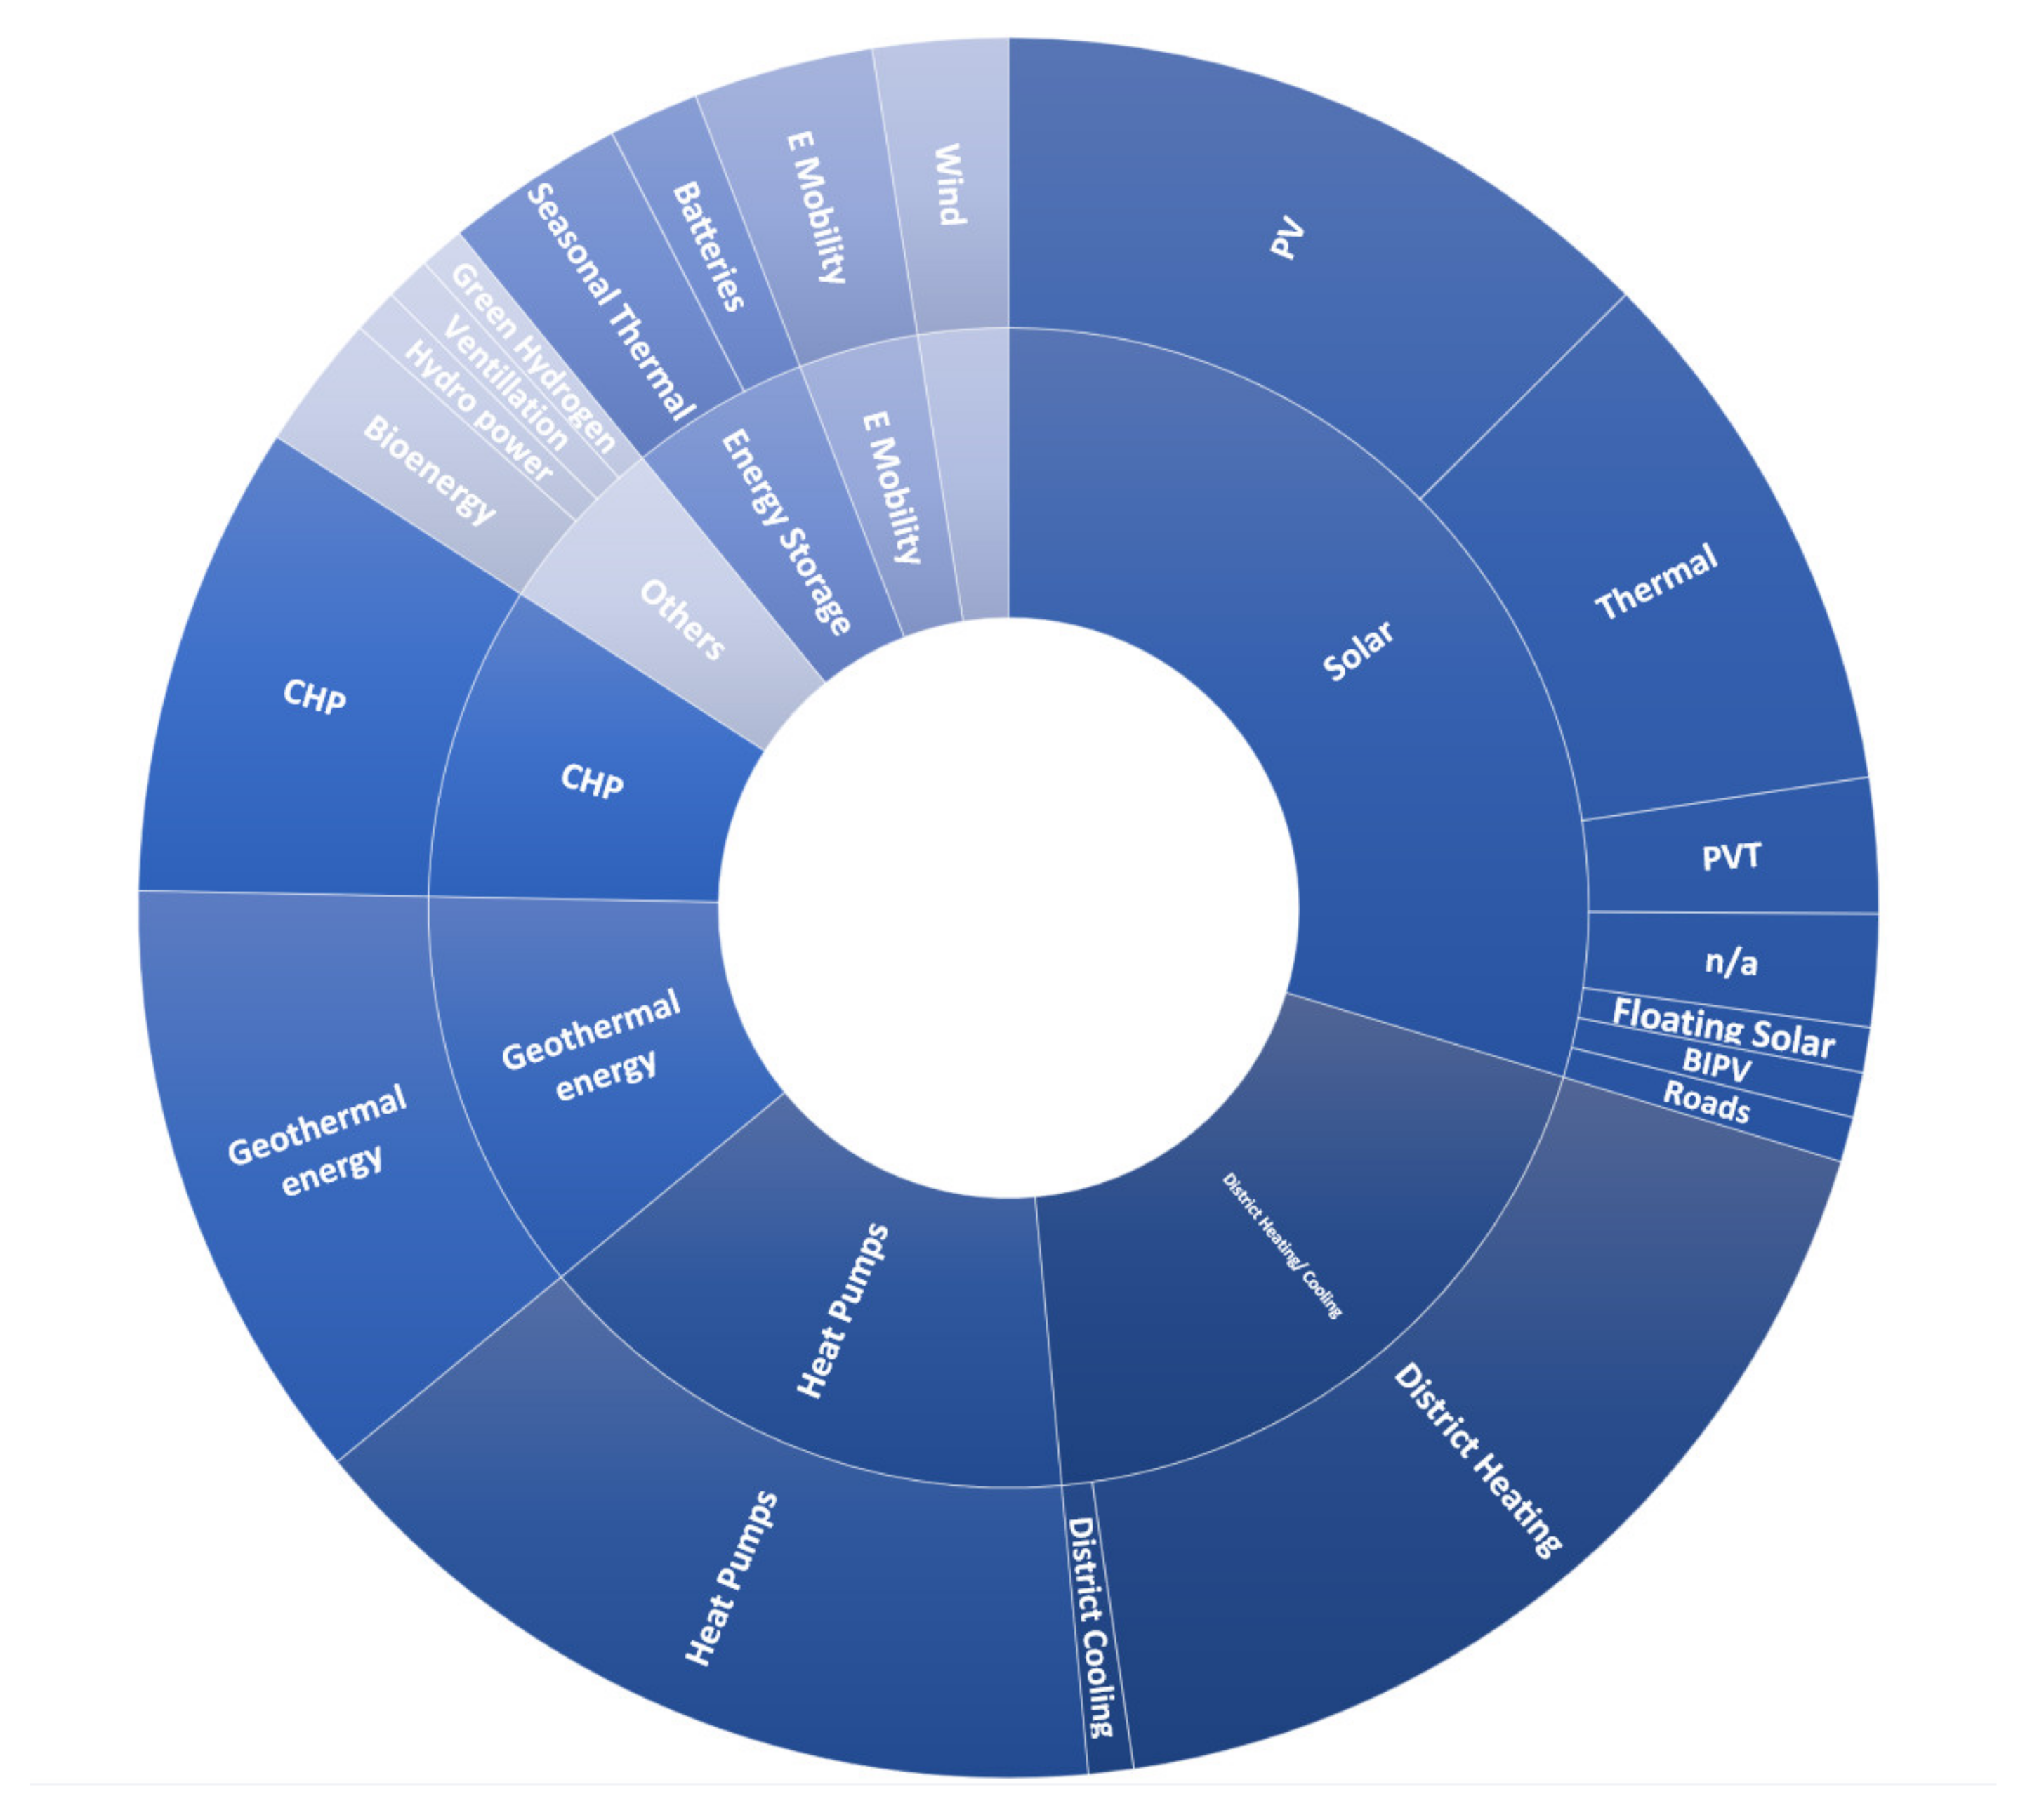
  • The common energy technologies used in PED are reviewed, including energy supply and storage.
  • Key energy concepts are examined with strategies and detailed planning to reach the project goals. The selection of energy system combinations with different technologies is crucial, which needs intensive investigation and planning.
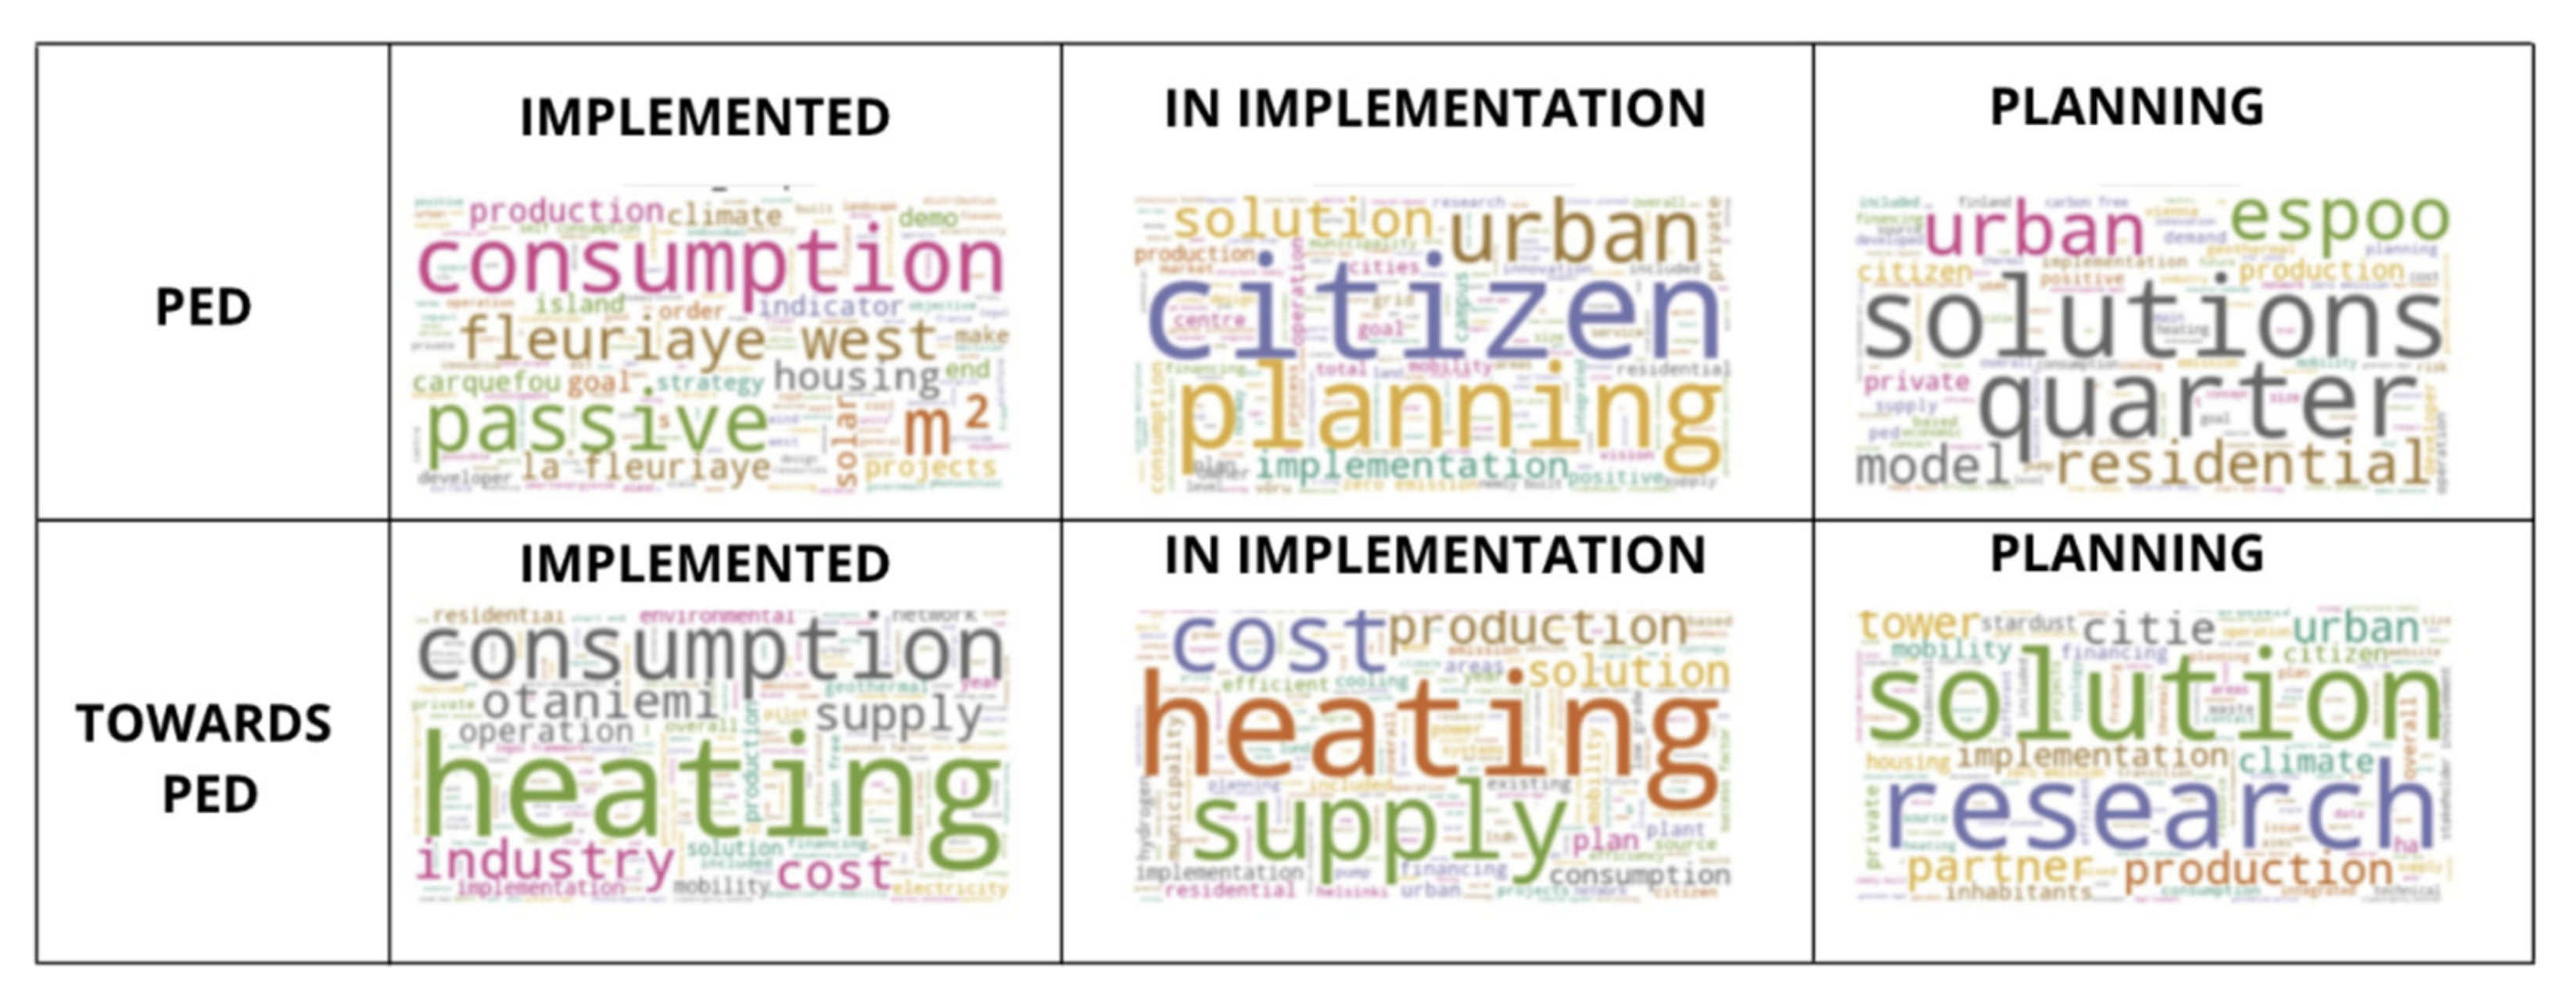
  • The keywords used in the projects are identified and the most common keywords are abstracted. These keywords vary between the projects with different names, comparing to PED, such as smart city, positive energy blocks, zero energy building, smart grid, zero energy district, urban energy transition, etc.
  • Inclusive strategies of EV/e-mobility are identified and included in the data collection. The strategies aim to encourage clean transport solutions within PED scope and integrate with energy systems to provide energy flexibility.
  • The temporal scale of the project refers to achieving the project goals, relative to the time period in a day/month/year scale. Since most of the projects are still under planning and implementation stages and due to insufficient information from the sources, the data for temporal scale is only available for less than 50% of the identified projects.
  • Stakeholders in each project are summarized, such as a regional municipality, citizens, real-estate developers etc. They are involved in a different stage of project development. The key drivers vary between every project and have analyzed the common driving stakeholders to understand the trends.
  • The key success factors with supporting regulations along with challenges are collected. Every project would come across challenges/barriers or have key success factors while planning and implementing the project.

2.2.2. Text Extraction and Mining Method for Keywords Abstraction

The data used for extracting word clouds and sentiments are collected from the JPI Urban Europe booklet available in .pdf (portable document format) format. The projects are grouped according to the PED ambition and the development phase they are in, as shown in Table 2.
Step 1: Text extraction and mining methods were firstly applied in Python with the aid of Pandas library (version 1.2.4, GitHub, Inc., San Francisco, CA, USA) [43] to transform this data from an unstructured mix of tables and text into clean and structured data frames. These cleaning methods involved extracting the data from ‘.pdf’ format into ‘.txt’ (Text) format (since it is more friendly for running analysis), setting up of the text as structured data frames, removal of extra spaces, special characters, line breaks, website protocols, formatting the cases, stemming [44] and removal of stop words. Hence, the resultant is a data frame consisting of 6 cleaned records (belonging to the 6 groups of projects mentioned in Table 2), each record containing consolidated transcripts of all the project descriptions belonging to the respective groups.
Step 2: Natural Language Processing (NLP) method using text mining in Python with the aid of the Natural Language Toolkit (NLTK) libraries (Version 3.5, O’Reilly Media Inc., Sebastopol, CA, USA) [45] was subsequently used to extract the most used words from the 60 projects. Each word from each of the 6 records of the cleaned data frame is tokenized into its own variable, and the number of times the word repeats itself is the count value of that token. A new data frame is created to capture the tokenized word and its count value. This is repeated for each of the 6 groups and the top 50 words from each group are extracted along with their count value and plotted on a word cloud. A word cloud is a method of visualizing the most used words in transcripts of text data by using the count value of the tokenized words for the sorting. The words in a word cloud are displayed in a specific spatial format: the font size of the words indicate relevance to the magnitude of their use and colours vary for aesthetic reasons.
Step 3: TextBlob library (Version 0.16.0, Steven Loria, New York, NY, USA) [46] was then used to carry out a sentiment analysis study [45] on the dataset in order to determine the polarity and subjectivity of the groups of projects. The polarity value is used to indicate the positive or negative sentiments of a sentence, for example, “happy”, “nice”, “sad”, “bad” and such. Each word has a certain polarity value (positive or negative) and aggregated results of the values of words in an entire transcript are used as the key indicator of the opinion of that transcript [47]. Subjectivity and objectivity are the next measures determined wherein subjectivity is the expression of opinion in a text, and objectivity is the expression of facts.

2.2.3. Data Visualization

Given that the dataset contains several projects across different cities in Europe, a spatial visualization of the location of these projects was deemed vital. QGIS software (Version 3.10, Open Source Geospatial Foundation, Beaverton, OR, USA) [48] is a Geographic Information System (GIS) based open-source software used here to display the cities on a map. Each project is appended with the latitude and longitude of the city it lies in, and these latitudes and longitudes are wrapped over a European base map.
Another visualization technique used to plot the dataset in this project is an interactive dashboard (for non-spatial variables only) developed using the open-source Konstanz Information Miner Analytics Platform (Knime) (Version 4.3.2, KNIME AG, Zurich, Switzerland) [49]. Variables across the dataset are plotted against each other using interactive graphs and charts, for example, for visualizing the type of financing against the year of initiation of the project, and other such co-relations. Interactive means that a user can click on a project in one plot to highlight characteristics about that specific project in other plots across the dashboard as well.

3. Results

3.1. Characteristics of Existing PED Projects

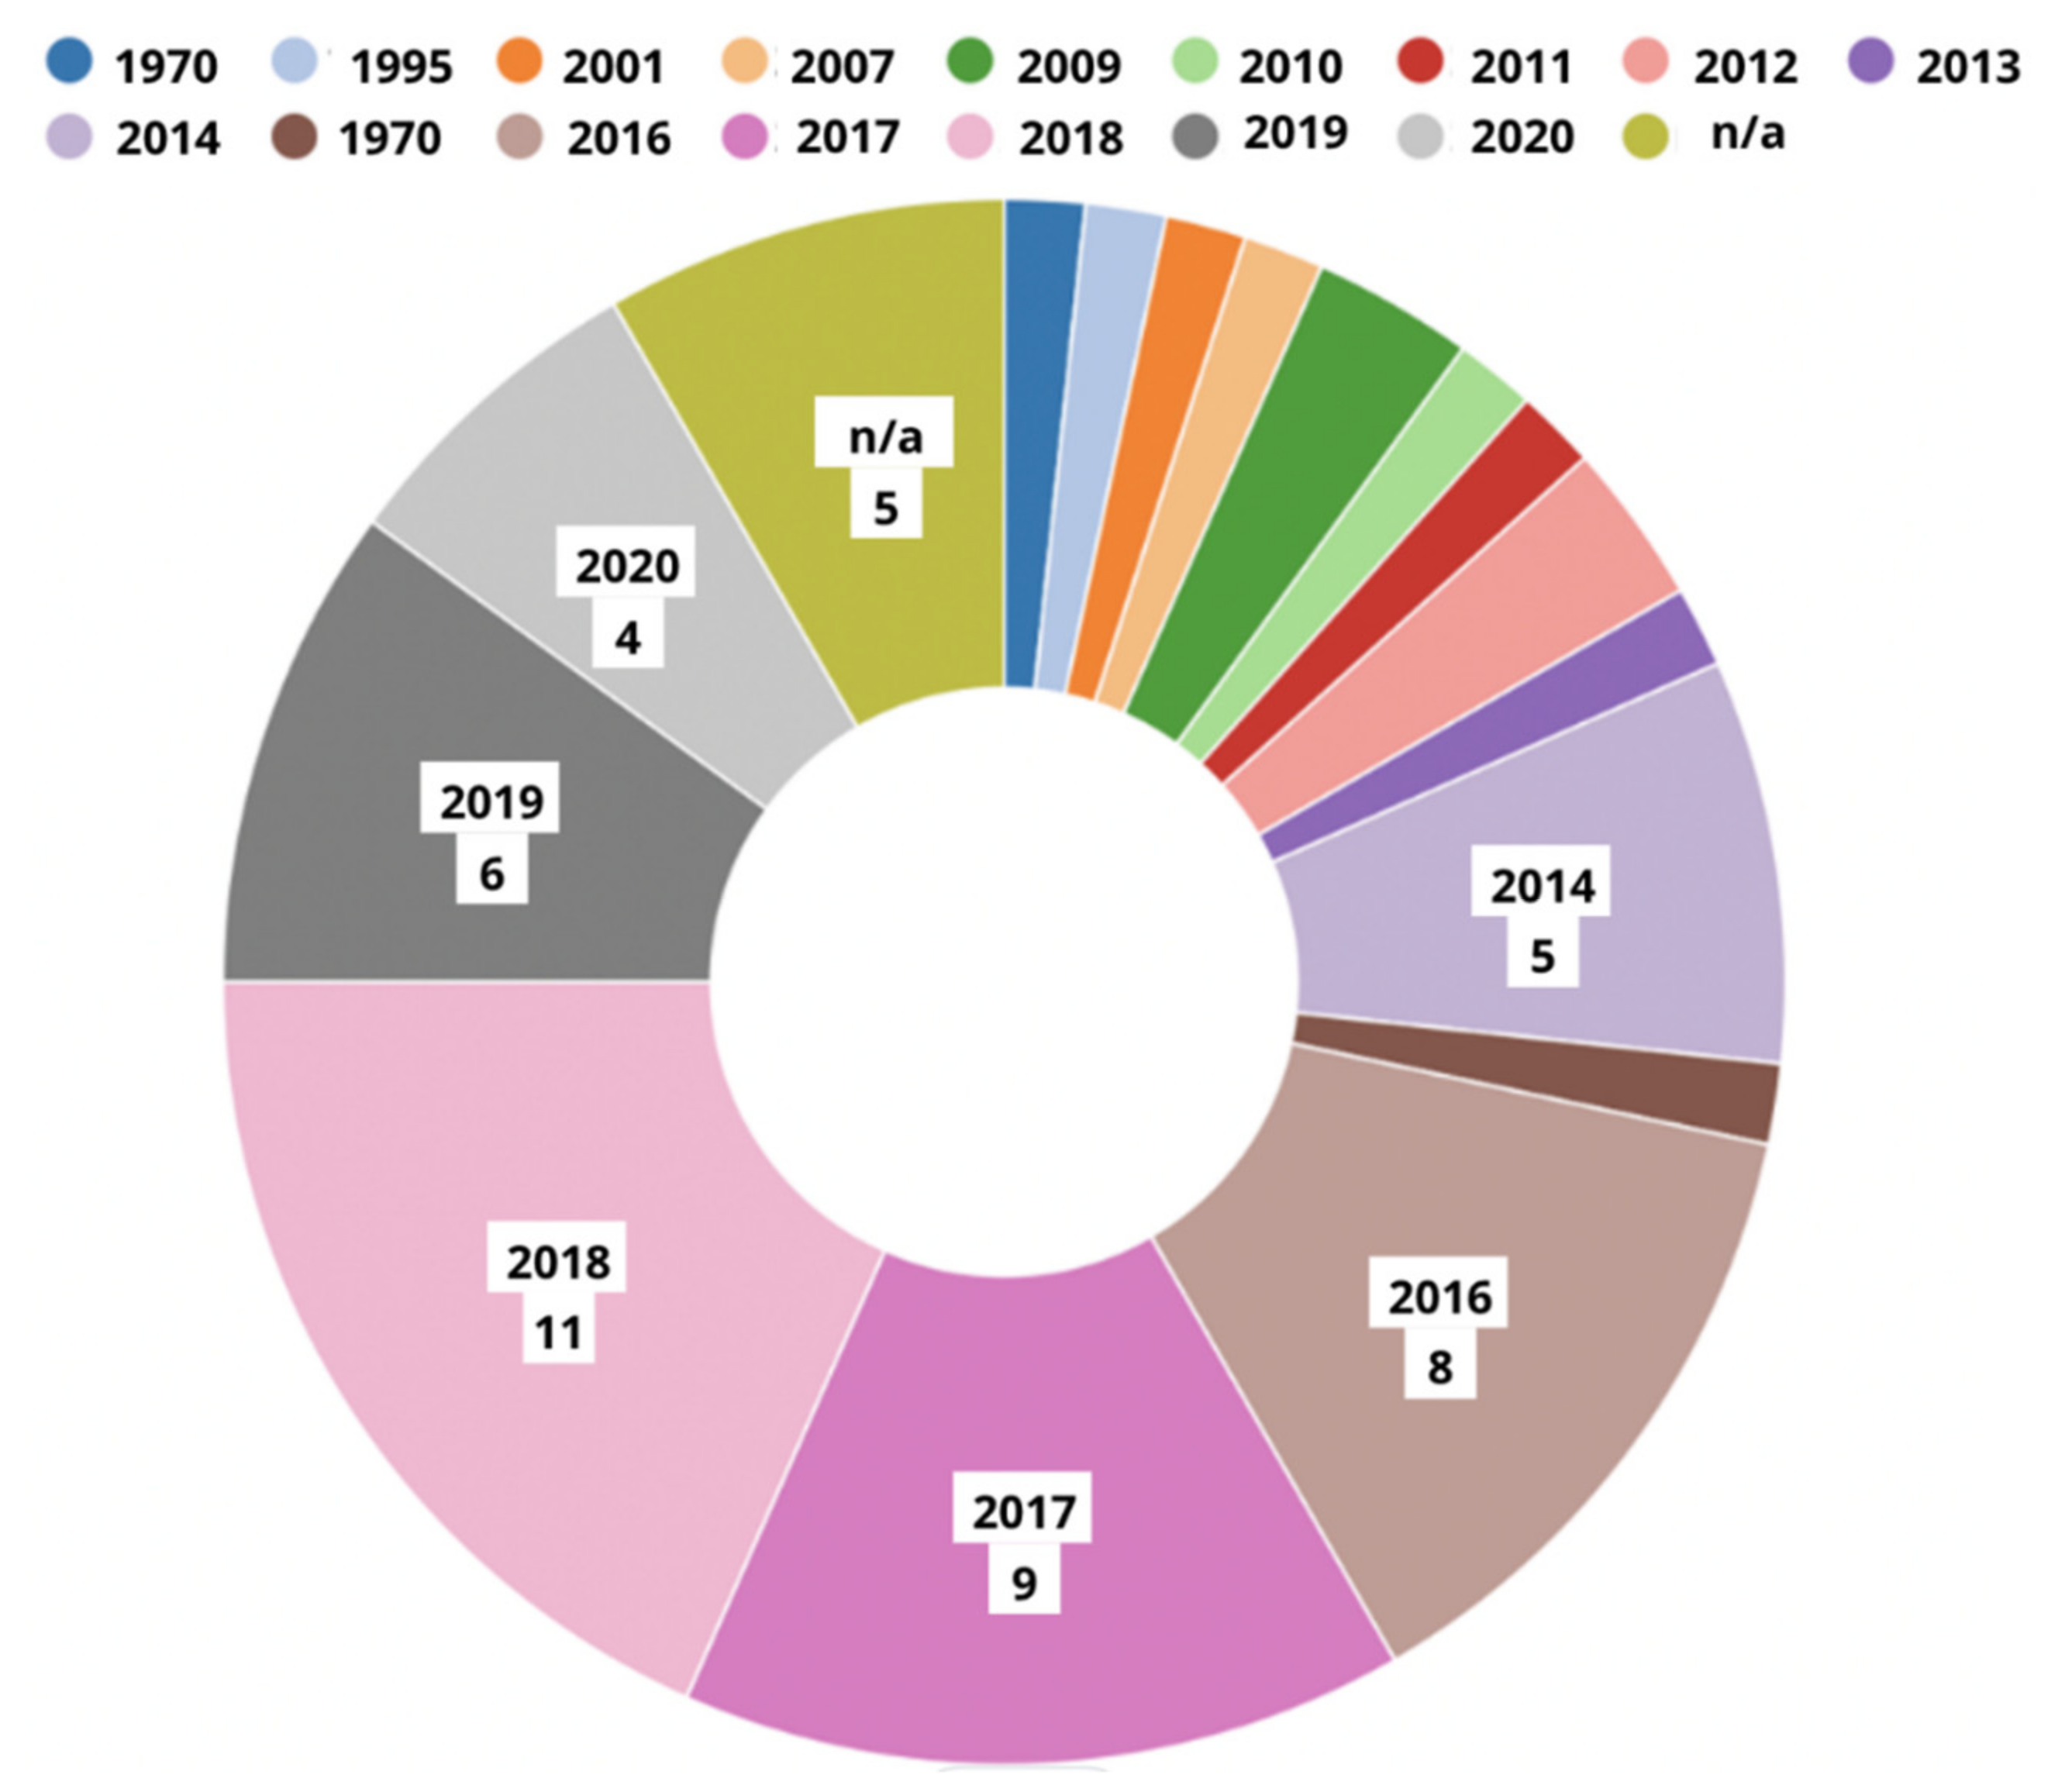
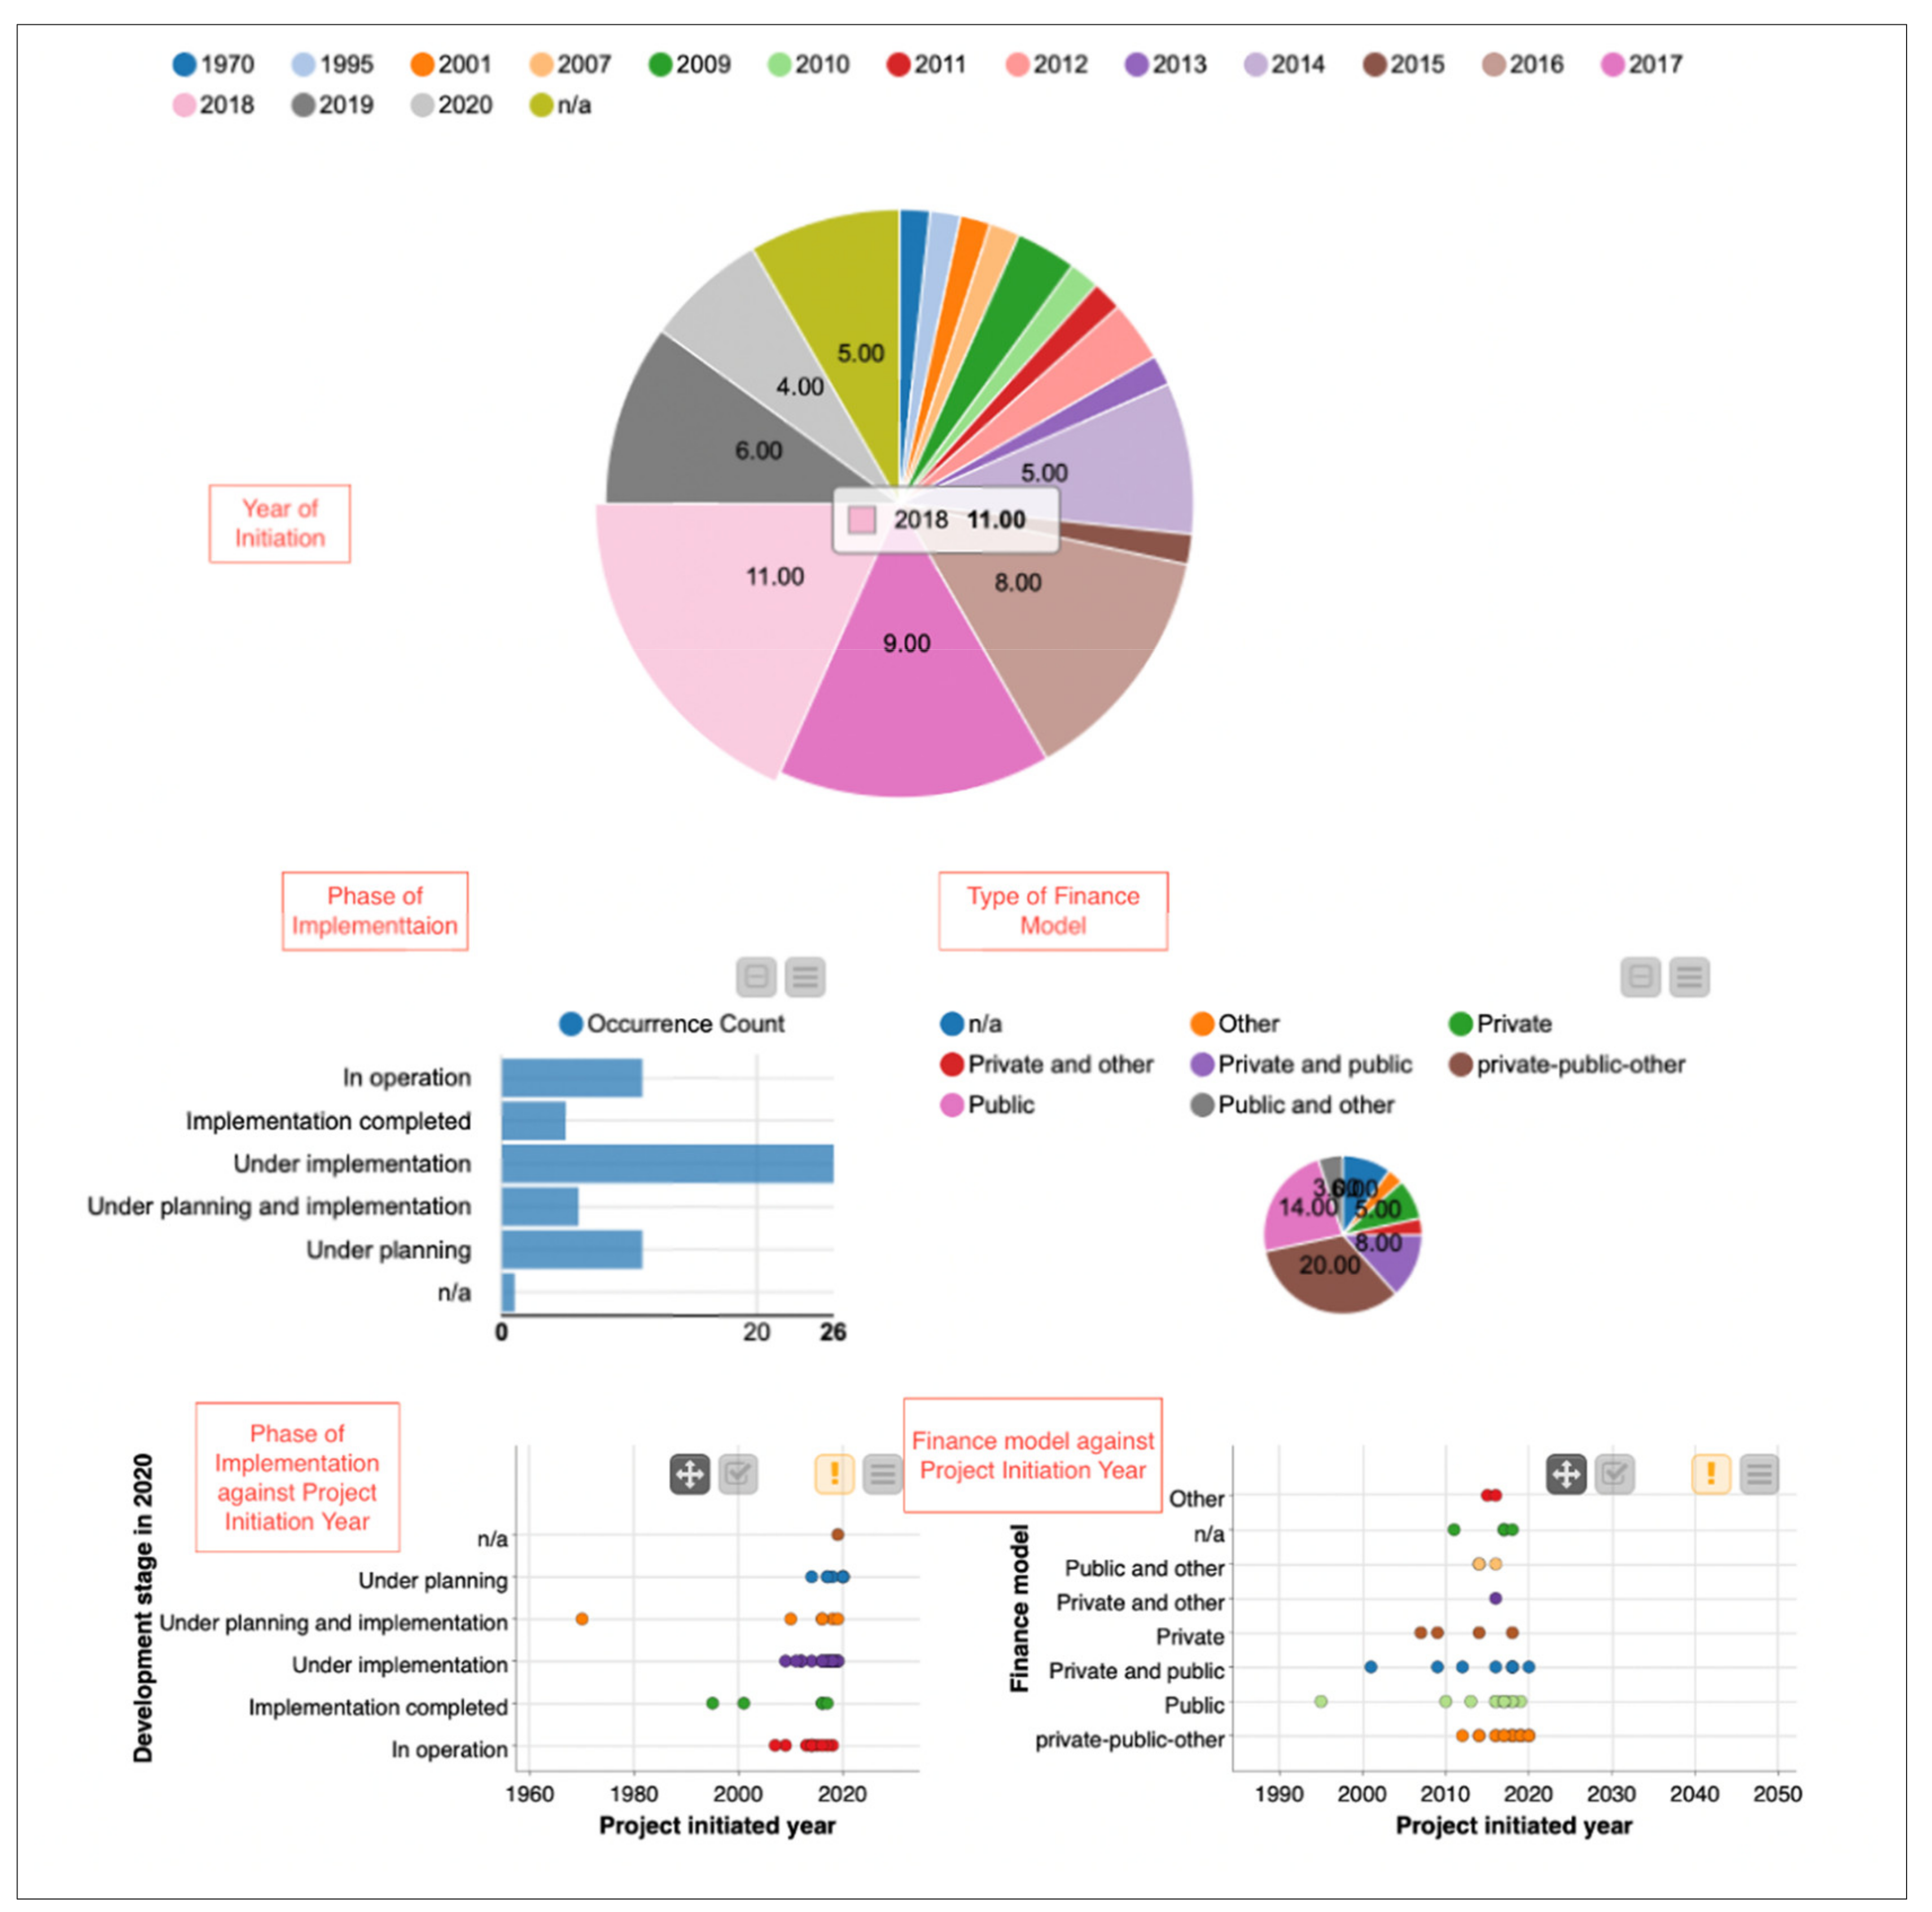
3.1.1. Initiation Year

The section shows the year of initiation of the first phase of all the 60 collected PED related projects in Europe. From Figure 1, the first project was initiated in 1970 and the second project in 1995, both in France. There have been very few projects, less than one project each year until before 2014, where 5 projects took place in that year. The momentum has increased from then with 8 projects in 2016, 9 projects in 2017, 11 projects in 2018, 6 projects in 2019, 4 projects in 2020, and no data for 5 projects.

3.1.2. Location of Identified 60 PED Related Projects

This location of the identified 60 PED related projects is displayed in Figure 2. The most amount of projects are located in Norway, i.e., 9 projects, followed by 8 projects, 7 projects, 6 projects, 5 projects in Italy, Finland, Sweden and The Netherlands, respectively. There are 4 projects in Spain, Germany and Austria, 2 projects in both France and Denmark. There is one project in each of the remaining countries, Portugal, Turkey, Ireland, Belgium, Hungary, Switzerland, Greece, Estonia and Romania.

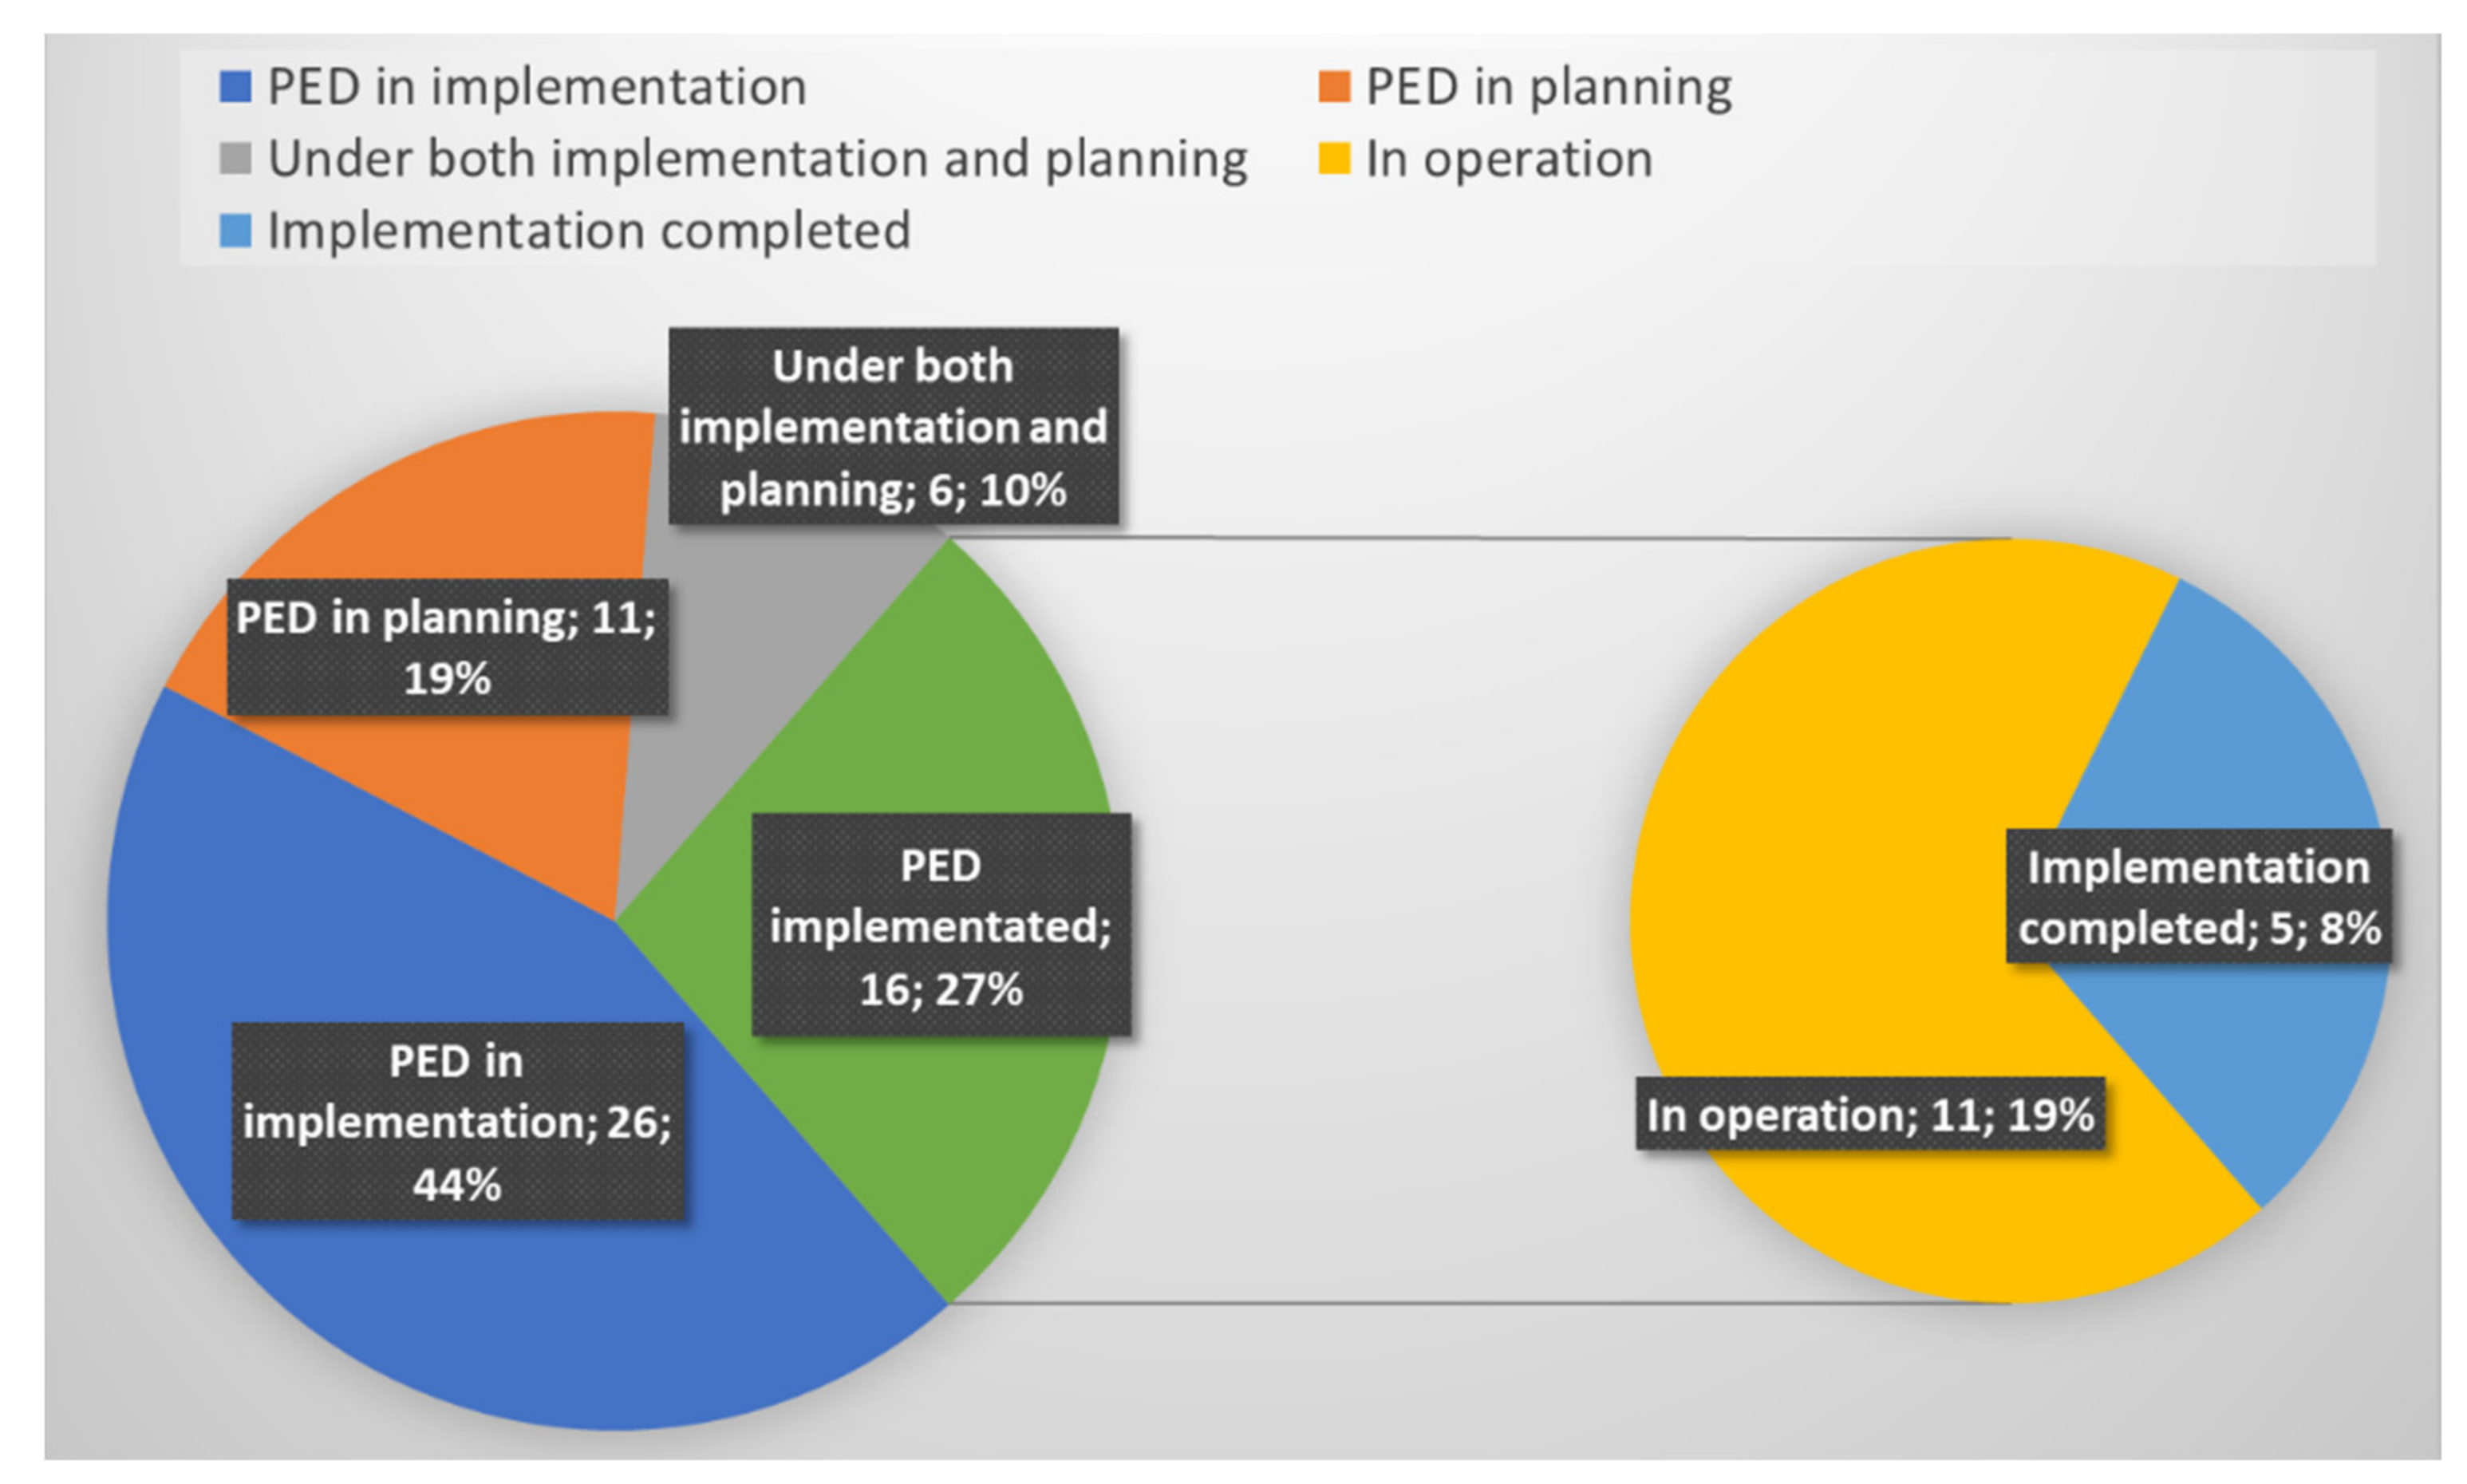
3.1.3. Status of the Identified Projects

This section reports the current development stage of 60 PED projects divided into categories mentioned in the development of the database. From Figure 3, the results clearly indicate that majority of the projects are under the implementation stage i.e., 26 projects. There are 11 projects under the planning stage, and 6 projects under both the planning and implementation stages. In total, 16 PED related projects are already implemented or in operation, among which 5 projects have completed implementation but have yet to integrate the energy systems into the existing local energy networks of the specific projects, while 11 projects are finally in operation stage. Information is not available for one project.

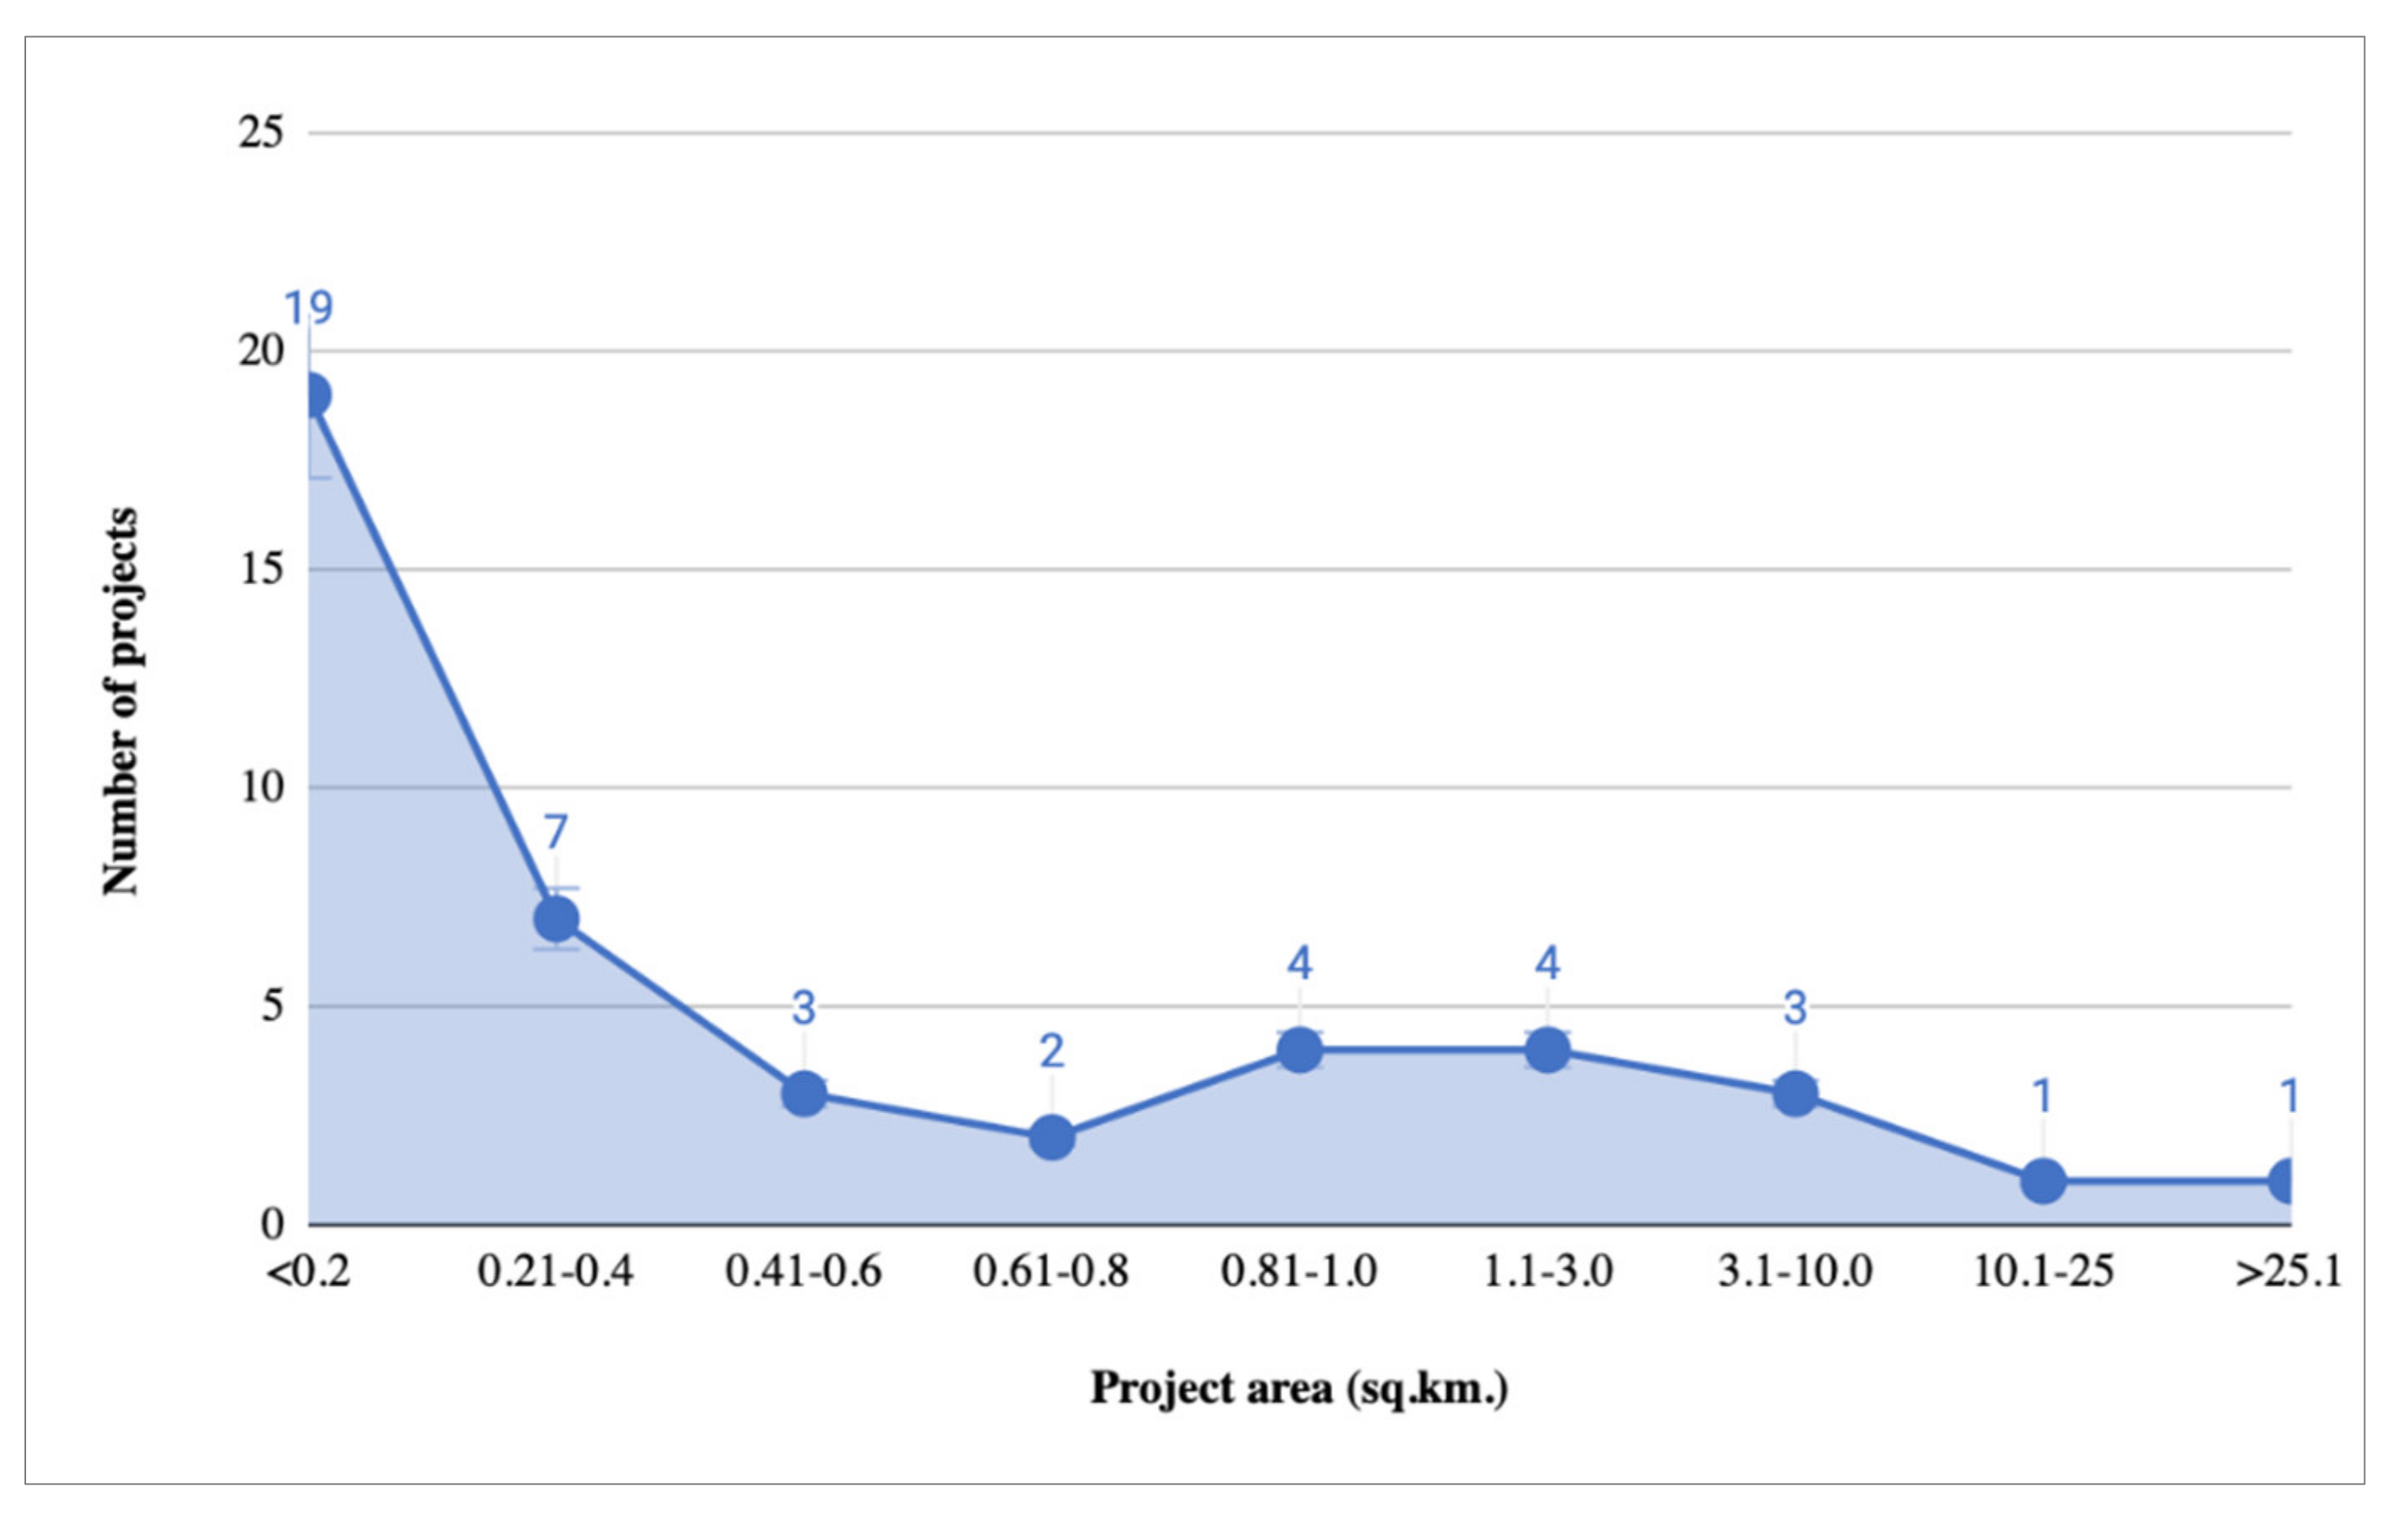
3.1.4. Project Area (Spatial Scale)

The amount of project area (spatial scale) is counted by considering the installation of the planned energy systems in their locality. These energy systems might be installed on the residential, commercial or industrial roofs, or flat ground-mounted in open fields, or even through the virtual presence of an energy system. From Figure 4, most of the projects, i.e., 19 projects are claimed to be using less than 0.2 km2 area, 7 projects between 0.21 and 0.4 km2 area, 8 projects consuming area between 0.81 and 3.0 km2, and there is one project claim to be consuming more than 25 km2 area.

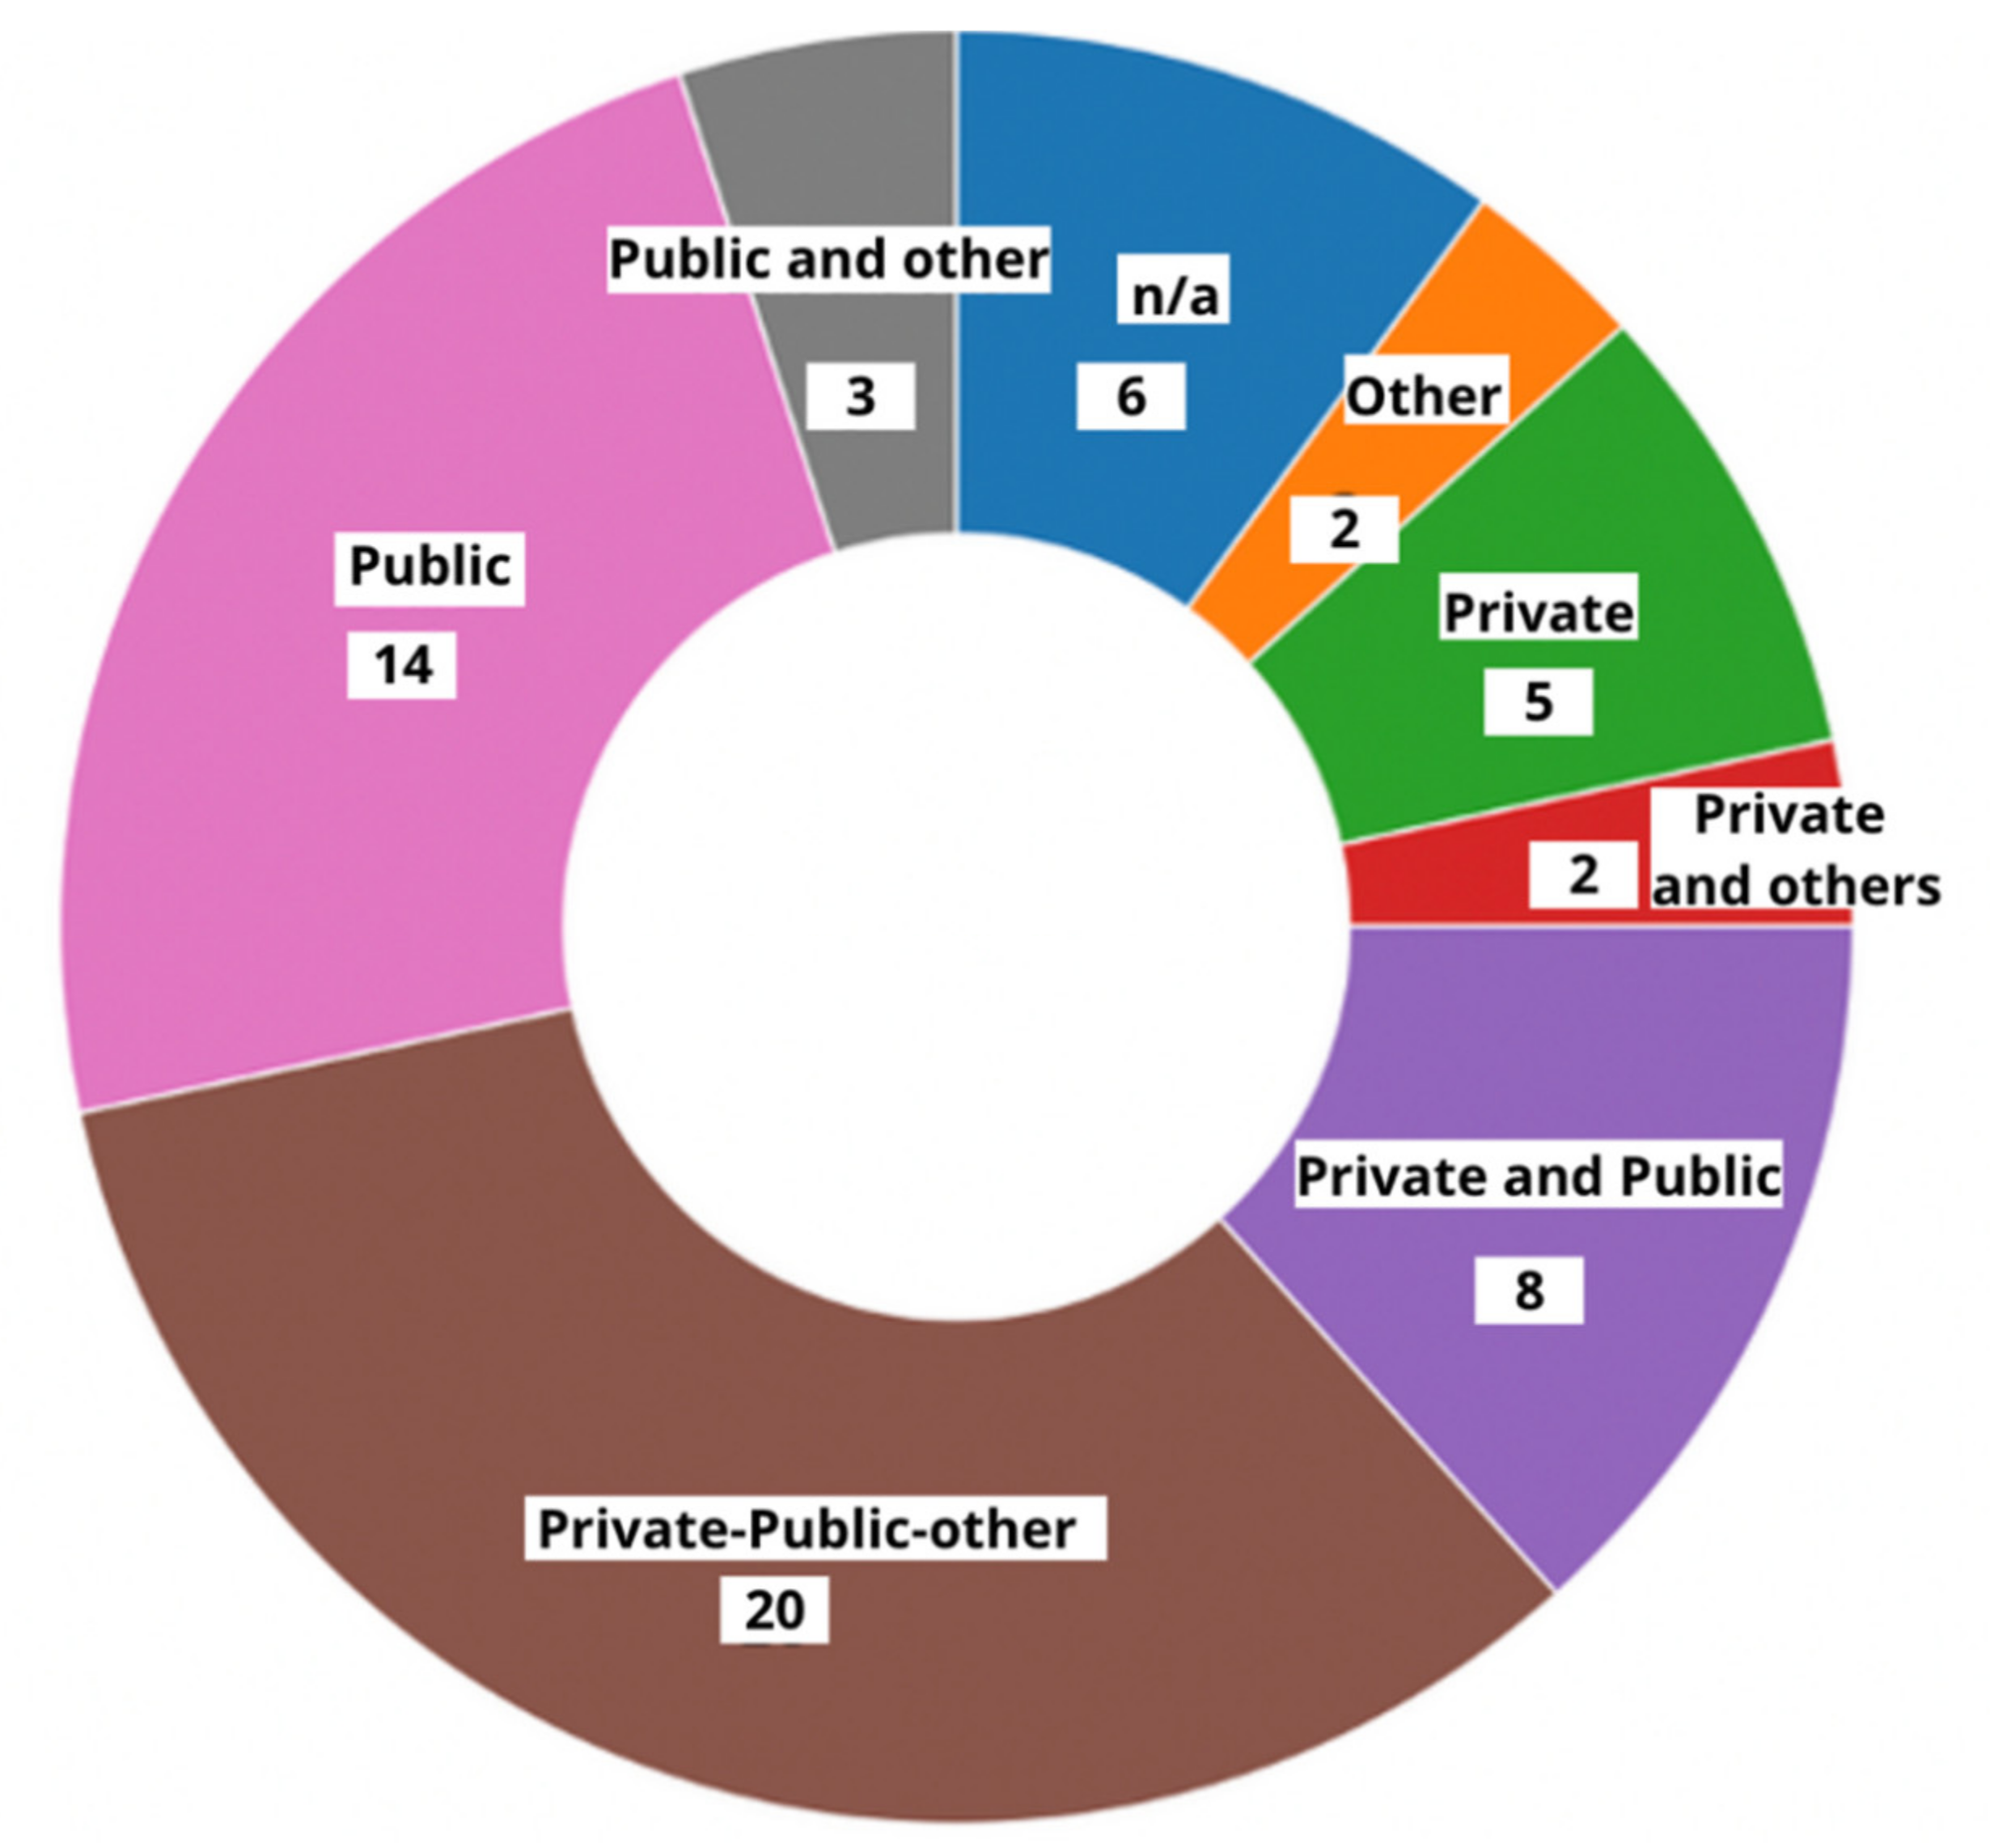
3.1.5. Finance Models Used in PED Projects

In order to meet the project goals and bring clean energy transition, the finance model plays a vital role. Whereas this section demonstrates the common trends being deployed in 60 PED related projects shown in Figure 5. The combination of public, private and others, such as national or regional grants, has been the most common strategy in 20 projects. Only public financing in terms of EU grants or municipality funding is observed in 14 projects out of 60 projects in Europe, 5 projects which solely depend on private financing strategy, and there are 8 projects forwarding with private and public finance combination. However, there are more than 6 projects which do not have proper information about the financial model in the PED booklet by JPI Urban Europe.

3.1.6. Type of Buildings Involved

This section presents the commonly involved building types for installation of energy systems to supply local energy demand and also to generate excess energy to increase energy flexibility according to the specific project goals. Figure 6 illustrates that the residential sector appears to be predominantly used in the majority of the projects to install energy systems on available roof areas as it is being the primary focus for 39 projects. Office and social buildings are identified to be the main focus in around 24 projects and also followed by commercial buildings spaces for more than 20 projects. Other types of buildings such as institutional, cultural etc., are utilized as secondary spaces for implementing the energy systems.
It is also observed that almost all the projects have considered a mixture of different building types, depending on the major type of buildings existing in the locality. However, the overall trend focuses on involving the citizens as key drivers with the right motivating strategies which eventually address the spatial challenges to install energy systems required for local energy demand.

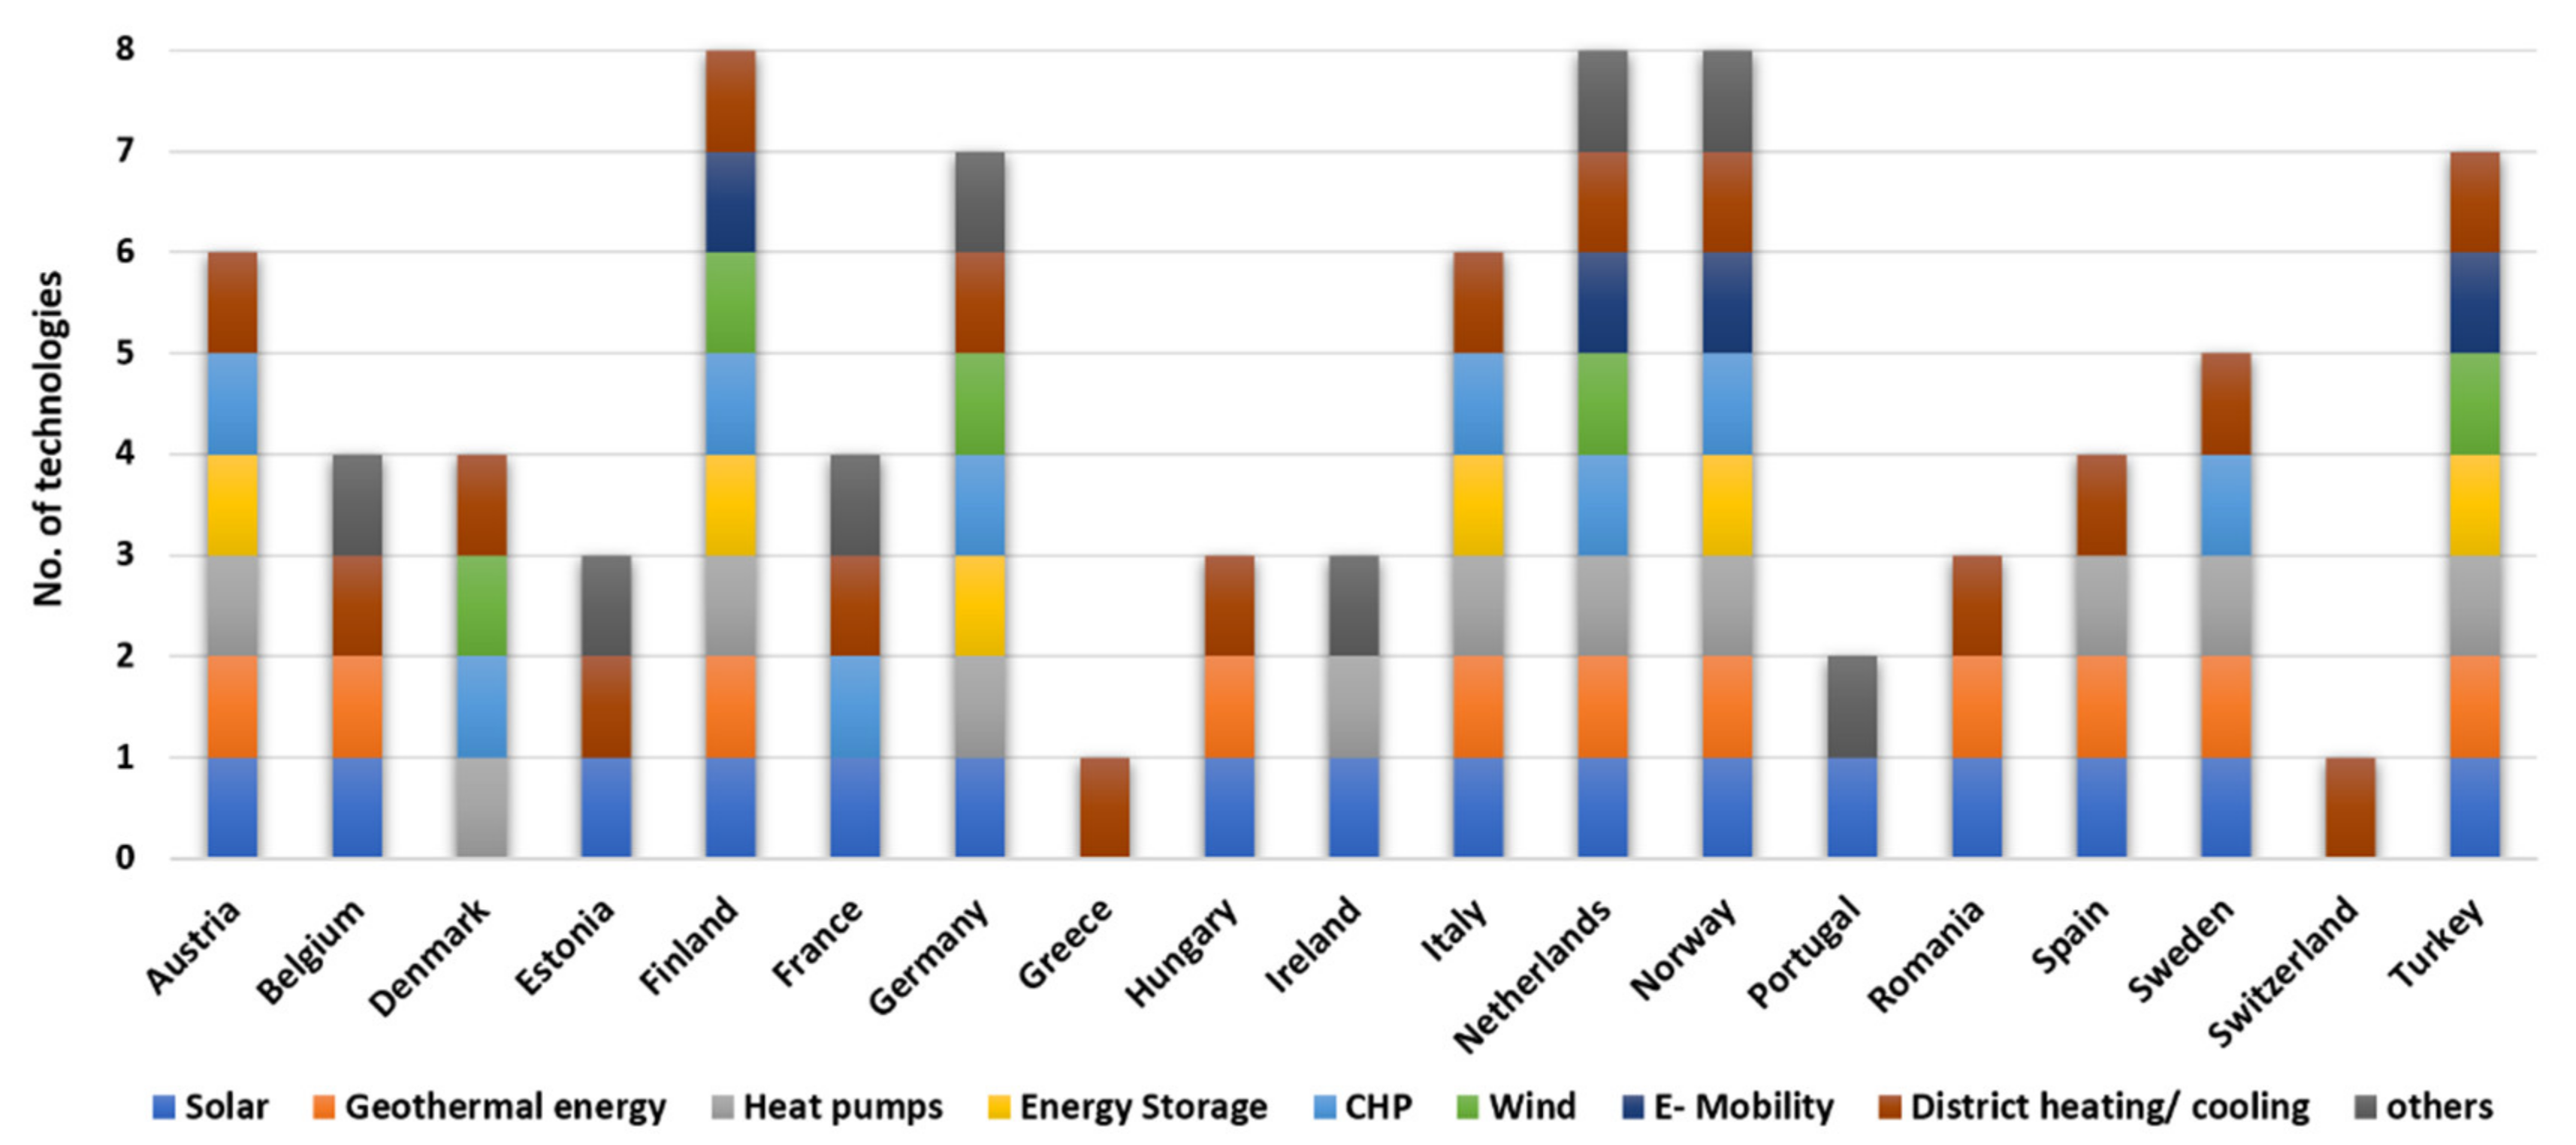
3.1.7. Major Energy Technologies

The commonly used energy technologies in these PED projects are examined and referred to as the three pillars of Energy Generation Energy Flexibility Energy Efficiency.
These energy technologies are divided into categories as solar, district heating/cooling, heat pumps, geothermal energy, combined heat and power (CHP), energy storage, wind, e-mobility and others present in the inner circle of the pie chart shown in Figure 7. Solar energy technology is identified to be the primary source of energy supply in almost all projects, specifically photovoltaics (PV) and thermal are the main contributors for producing electricity and heating applications respectively. There are five situations where projects claimed to use solar technology but have not been specific about the type of solar energy. Other new/innovative forms of solar such as hybrid photovoltaic/thermal (PVT), building integrated photovoltaics (BIPV), floating solar and solar roads technologies also have been considered in few projects.
District heating/cooling has been founded in 45 projects, in which heating is used in 43 projects and cooling in 2 projects. Heat pumps, geothermal energy and CHP plant used in 37 projects, 27 projects and 21 projects respectively. Electro-chemical energy battery technology storage for electricity application and seasonal thermal energy storage technology for heating/cooling application are explored as under the energy storage category. Wind energy and E-mobility technologies are identified using in 6 projects and 8 projects respectively. Other technologies, such as bioenergy, green hydrogen, hydropower and natural/mechanical ventilation etc., have also been integrated partly in few PED related projects in Europe.
Figure 8 represent the diversity of energy technologies in each country. Solar energy, district heating/cooling and heat pumps technologies are commonly considered in almost of the countries, geothermal energy and CHP plant are being used in nearly half of the countries as represented in Figure 8. Wind energy is integrated in a smaller number of countries such as Denmark, Finland, Germany, The Netherlands and Turkey, and energy storage is only seen in few countries such as Austria, Finland, Germany, Italy, Norway and Turkey.
Furthermore, the results indicate that Finland, The Netherlands and Norway have high diversity of using more types of energy technologies, followed by Germany, Austria, Italy and Turkey.

3.1.8. Challenges under Different Implementation Stage

The data collection focuses on challenges/barriers that are categorized into ‘under planning’, ‘under implementation stage’ and ‘implemented/in operation’ stages shown in Table 3. The gathered information on challenges/barriers reveals the following main topics: Administrative and policy (A&P), Legal and Regulatory (L&R), Technical. Environmental, Social and Cultural, Information and Awareness, Economical and Financial, and Stakeholders interest perspective [50].
Challenges associated with stakeholders’ involvement, administrative, and technical issues had great relevance in all PED stages. The economic and financial feasibility was crucial in both planning and implementation stages as well as supporting studies or knowledge. However, legal and regulatory barriers were important in the implementation and operation stages. Finally, only in the operation stage environmental and social and cultural aspects were considered possible barriers.

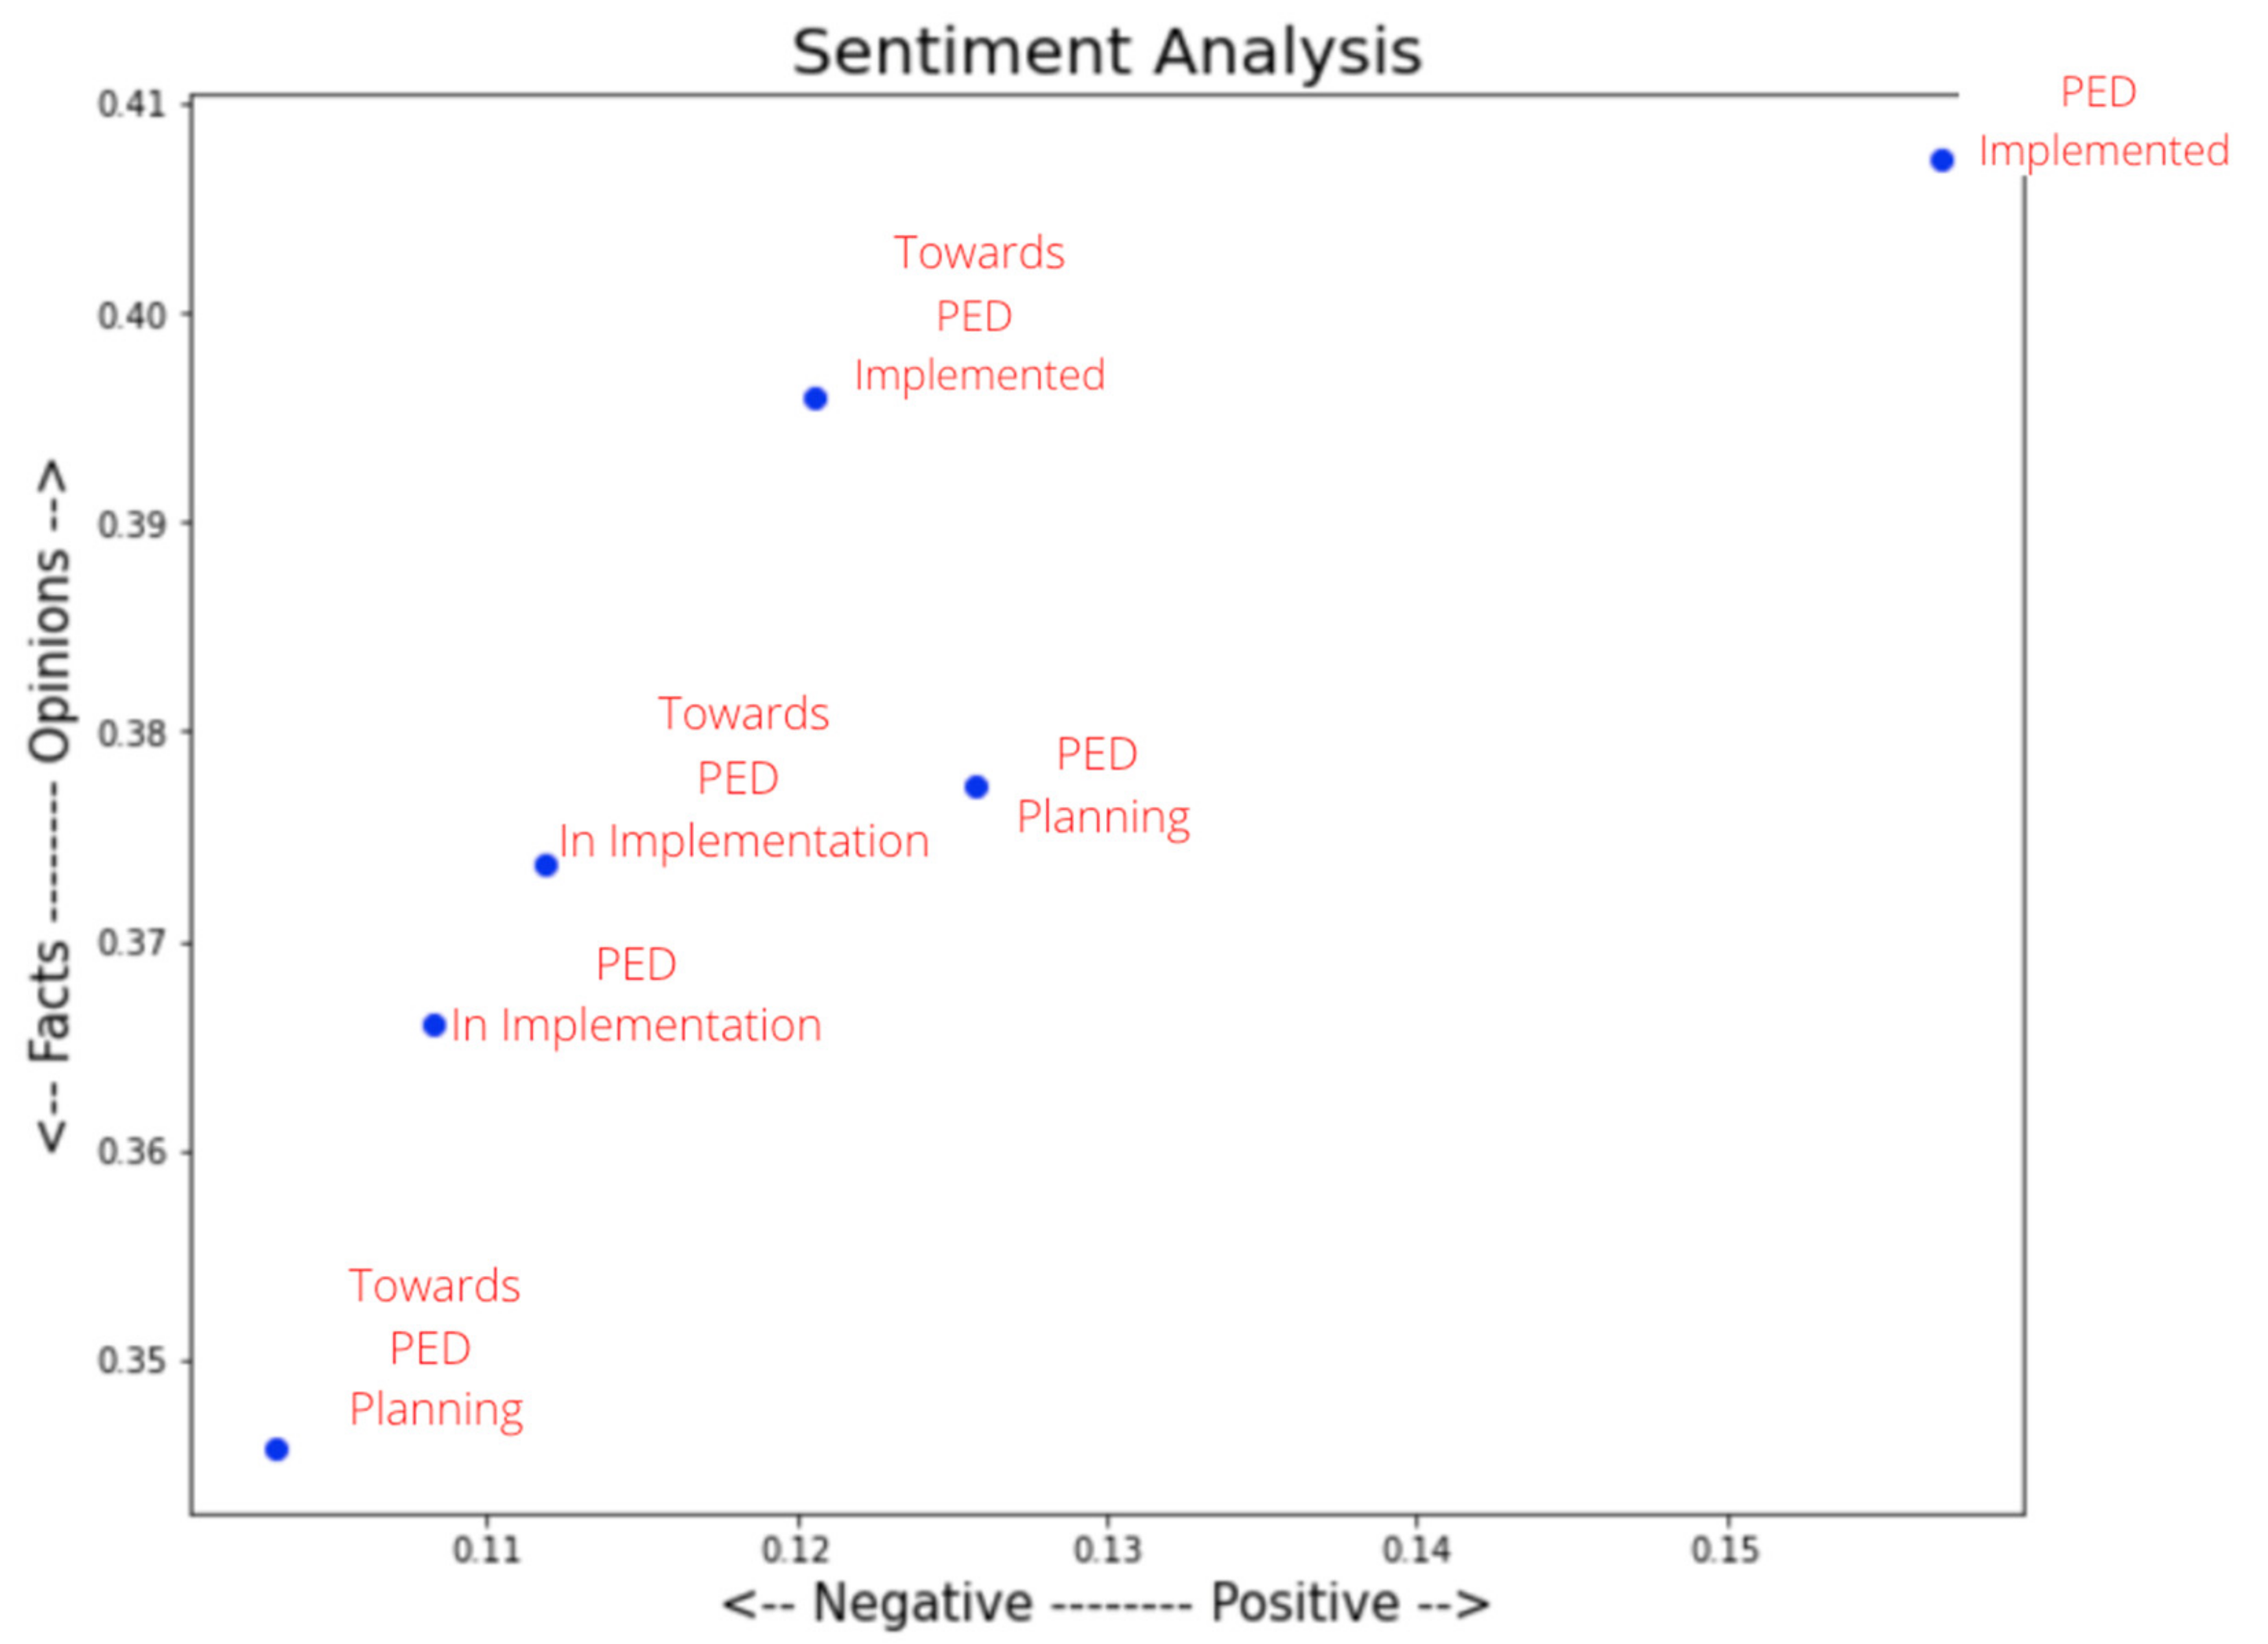
3.2. Most Commonly Used Words and Sentiment Analysis

Figure 9 shows the most commonly used words in the project description transcripts according to their classification from Table 2. As seen from the figure, projects that are already implemented (both PED and towards PED) show high use of words like ‘consumption’, ‘passive’, ‘heating’, and ‘industry’. On the other hand, projects that are yet planning (both PED and towards PED) use words such as ‘urban’, ‘solutions’, ‘quarter’, ‘research’, and ‘residential’. Projects that are in implementation (both PED and towards PED) mostly repeat words like ’citizen’, ‘planning’, ‘urban’, heating’, ‘supply’, and ‘cost’. Finally, both implemented and in implementation towards PED projects use heating, cost and supply words.
Figure 10 displays the sentiments portrayed by the 6 groups of projects in the context of polarity (positivity and negativity) and subjectivity-objectivity (opinions-facts). In general, PED implemented projects have very positive feedback, reflecting by the text. We see both PED and towards PED implemented projects have higher subjectivity than objectivity, compared to their planning phase counterparts. This could be interpreted as the implemented projects are mostly influenced by diverse factors, such as dynamic data, citizens and other stakeholders, while those projects in planning stages emphasize more on objective learning experience from literature, simulation data and the related estimations.

3.3. Interactive Dashboard

The interactive dashboard consists of five visualization charts in total (as shown in Figure 11). The display begins with a pie chart that visualizes the proportions of projects initiated across the years. The respective colour scheme index displays the corresponding year in which the project was initiated. The displayed values across the pie chart can be toggled between the number of projects and proportions in the form of a percentage. Below the yearly distribution chart, on the left is a horizontal bar chart that shows the proportions of the projects based on their grouping from Table 2 (i.e., PED ambition and phase of implementation). On the right, a second pie chart visualizes the types of investments received by the projects and their respective proportions. Finally, two scatter plot charts are displayed at the bottom of the dashboard. The left chart shows the co-relation between the initiation year of the projects and the phase it is in today, and the right chart displays the co-relation between the initiation year of the projects and the financial model it observes. Multiple colours for the data points across the y-axis on these two charts are for ease of visualization for the viewer. Selecting any segment or data point from any of the plots highlights all the characteristics covered by those selected projects in the remaining 4 plots.
Such a dashboard is built upon the database developed in Section 3.1 and can be further extended and updated automatically once there is new project information in the database. It is also possible to upload the dashboard online, to increase the ease of sharing the knowledge, data and experience in PED related projects, as well as to enable interoperable interaction with different stakeholders when they plan or implement PED projects.

4. Discussion

In this study, the projects have been taken from the PED book by JPI Urban Europe, which invited voluntary input data over the project experience and knowledge. It should also be noted that this is not an overview of the PEDs in Europe, as countries have contributed unequally to the development of the book. Since most of the projects are still under planning and implementation stages, it has been challenging to understand the updated information/data of many projects. In addition, due to the insufficient information, there are little data, such as energy technologies for PED, which is unclear during data collection. These bring certain uncertainty to the analysis result.
However, it is interesting to examine the main characteristics of the collected 60 PED related projects, and the results shall have certain guidelines for the final PED definition and the proposal of ‘reference PED’. The non-existence of a standard and consolidated definition of the PED concept is in fact one of the main limitations to its development and deployment in European cities, so as to boost the energy transition within a common reference framework [51] for sustainable urban development. So, different approaches and aspects related to the realization of PEDs will be aligned taking into account European cities diversity.
According to results, the identified 60 projects are constituted in Europe with a large number of projects in Norway (9 projects) and Italy (8 projects) respectively. Although the first project took place in 1970, the momentum for such climate neutral goals has started in 2014.
According to the database, most PED related projects choose ‘yearly’ as the time scale. However, it is not possible to identify the temporal scale for many projects since they are still under the planning stage. Regarding the project area (spatial scale), the general trend is to include residential, commercial and industrial buildings for installation of renewable energy systems in a city or district, which is to avoid the deployment of large energy systems in open fields. This might need supporting policies that support direct consumers to involve in adapting implementation on their premises. However, this strategy would need to consider providing economic feasibility or encouraging policies that attract private investments. The analysis observes that public, private with regional/national grants is a commonly used financial model which reflects active involvement from the private sector. In addition, there are some projects that do not have many local renewable energy sources, but they purchase energy from outside of the district boundary (so-called ‘virtual PED’).
Based on the results, residential, commercial and office/social buildings are highly involved in the installation of energy systems, which depends on citizens commitment towards project goals (but the goals might deviate from the designed timeframe of the project). Meanwhile, the stakeholders, such as the municipality, would need to address overcoming the policy restrictions to further ease the process of adapting the energy system, and also need to conduct necessary activities to bring awareness in consumers and motivate for participation.
The energy mix for project goals includes solar energy, district heating/cooling, wind and geothermal energy are primary technologies, where solar technologies show dominance because of its potential. However, due to the unavailability of solar energy during most half of the day and during winter seasons, exploration towards other forms of renewable energy sources, such as geothermal energy, wind, etc., yet may not be totally reliably options during peak demands. In this context, energy storage might be the alternative way. Apparently, energy storage has not been part of the major energy strategies, which might be due to the unavailability of enough planning, economic feasibility, high maintenance etc. This also might be part of the reason for PED related projects choosing a yearly temporal scale rather than daily/monthly or seasonally.
In terms of the most used words in the project descriptions, it is observed that projects that are already ‘implemented’ (both PED and towards PED) tend to concentrate highly on ‘consumption’, ‘production’, ‘heating’- characteristics that are generally repeatedly showed interest in when the project is implemented and running. On the other hand, projects that are yet ‘planning’ (both PED and towards PED) tend to concentrate on ‘solutions’, ‘research’- characteristics that are generally repeatedly discussed when a project is being planned. Projects that are in the middle, i.e., ‘In Implementation’ (both PED and towards PED) mostly repeat words like ‘planning’ and ’solution’, like the ‘planning’ stage projects, but given they are closer to ‘implementation’ they also display interest in ‘heating’ and ‘supply’. In the sentiment analysis plot, we deduce that while the X-axis does not reflect a particular pattern, it is observed that projects that are still in the planning phase are more akin to depend on established facts for their documentation, whereas the implemented projects lean towards expressing more opinions (that hint their documentation is developed through experience) and do not have to depend solely on facts. The lessons learned from the preliminary analysis of these PED projects provide a starting point for achieving the objective of reducing the existing research gap in the characterization of PEDs. A key aspect is facing the complexity of the urban system and the resulting interrelationships between social inclusion, energy systems, infrastructure, circular economy and mobility for sustainable urbanization. This calls up building or PED-related simulation tools or platforms to tackle such challenges [52,53].
Moreover, a short summary of a few PED projects with a good level of detailed data has been further analyzed in terms of their energy balance/flows. Table 4 provides the main energy concept/flows and some of them in the implementation/operation stage have clear energy flows, such as Åland Island in Finland, Stor-Elvdal and Drammen in Norway. The annual energy flows in the year 2030 for two scenarios (2030—100% sustainable mobility: (1) 2030 SM Syn scenario—Domestic production of sustainable fuels 2030, (2) 2030 SM EI scenario—High Electrification 2030) at Åland Island are illustrated in Figure 12 [54,55].
It is observed the major energy contributions varies from district to district. For instance, Åland Island replies on biomass and wind power a lot, while Stor-Elvdal municipality prefers CHP plant, and in Drammen municipalities, a heat pump is used mostly. However, these districts are not fully self-sufficient, and they have to import energy to cover peaks. For instance, as shown in Figure 12, Åland Island has to import 4 or 7 GWh of electricity in 2030. It is not easy to judge whether they are PEDs or not at this stage since there is no standard and KPIs available now. According to the mentioned work from EERA JPSC and JPI UE, four categories of PEDs have been established based on two main aspects: the boundaries and limits of the PED in order to reach a net positive yearly energy balance and the energy exchanges (import/export) in order to compensate for energy surpluses and shortages between the buildings or the external grid. All the four described categories of PEDs (PED autonomous, PED dynamic, and PED virtual, Candidate-PED) are based on the accomplishment of a yearly positive energy balance, measured in greenhouse gas emissions, with use of renewables within the defined boundaries, and considering both building energy use and non-building energy use in a neighbourhood. Auto-and Dynamic-PEDs are the only categories where a net positive energy balance is achieved and Candidate-PED should compensate the energy difference with imported certified energy from outside the boundary. According to the boundaries descriptions aligned to the draft definition of PEDs from EERA JPSC working group and JPI Urban Europe, the net positive yearly energy balance is assessed within the functional or virtual boundaries. Thus, PEDs will achieve a net positive energy balance and dynamic exchanges within the functional/virtual boundaries, but in addition, it may provide a connection between buildings within the virtual boundaries of the neighbourhood.
It is necessary to pay specific attention to the differences between cities across different regions when promoting the development of PEDs. This is because cities differ from each other at the local, national and international levels from the perspectives of geography, resources, social, economy, culture, infrastructure, and progress for the carbon-neutral target. This would bring a difference in planning, technology selection/implementation, investment portfolio, stakeholders involvement, regulations, keywords etc., during the PED development. However, it is important to have a commonly recognized definition of PED, and its related KPI framework for evaluation. By learning the main characteristics from those existing PED projects in the EU, it is helpful to define PED or propose ‘reference PED’ in other cultural and geographical contexts, which will bring significant common values in terms of replicability and potential generalization of PED across the globe.

5. Future Work

This paper focuses on preliminary analysis of identified PED projects, including projects with insufficient information. In order to understand the detailed analysis, the number of projects might be filtered based on projects with sufficient information to conduct the detailed analysis. Given that only 11 of the evaluated projects are at an advanced (operational) stage, a continuous evaluation of the progress of the PEDs currently in the planning and implementation phase is foreseen in order to update the initial database in subsequent stages. Collecting this additional information will extend and improve the PED characterization especially in aspects such as energy technologies and boundaries definition. Besides, more PED related projects have to be identified with sufficient data to support more comprehensive analysis. Such a task is ongoing in both IEA EBC Annex 83 and EU Cost action CA19126. This preliminary study of PED characteristics based on key parameters will be deepening and widening with a particular focus on key energy concepts, EV mobility, driving stakeholders and temporal scale. Furthermore, it is necessary to identify the potential projects with daily or monthly temporal scales, in order to discover the energy combinations to achieve a net positive energy balance and dynamic exchanges within the functional/virtual boundaries. In addition, a PED may provide a connection between buildings within the virtual boundaries of the neighbourhood.
In the context of text mining, the current analysis is developed using the cleaned dataset for the transcripts. However, when it comes to data cleaning, there are several more layers of refining and cleaning that can be carried out on the current transcripts to gain results that are even more accurate and finely assessed. To narrow down the uncertainty of the overall word cloud results, a deeper and multi-layered approach to designing the most used word cloud along with other clouds, such frequency and unique words used, can provide deeper insights. It is also planned to expand the scale of text mining, from the current PED booklet to comprehensive literature, project websites/reports, and so on. Furthermore, the Knime dashboard can include multi-variate plots across more than two variables (as is currently), allowing more significant insights on patterns of co-relation between the variables. An online version of such a dashboard will further enhance the interoperable interaction with different stakeholders when they plan or implement PED projects.
Additionally, within the same framework of developing a PED, different areas across the globe must not only take into account specificities at the local level but also have a common definition of PED for standardized assessment. Ongoing works in the EU Cost action CA19126 also consider the integration of PED-Labs characteristics in mapping PEDs projects and initiatives framework. The PED mapping activities are also related to providing a very practical tool needed to guide PEDs implementation as well as to exchange knowledge and information. Potential integration of such a GIS data driven platform with the Knime dashboard could greatly support the involvement of cities stakeholders, and show the feasibility and impact of certain strategies that can pave the way to PED and climate-neutral cities. The alignment of these pilot initiatives could enhance the knowledge not only in the planning and deployment of PEDs in all aspects such as social, technical, financial, regulatory, etc., but also in the PED characterization/definition/KPIs, as well as showing ground for new methodologies, technical solutions and services to be developed in the future implementation of PEDs. These databases thus constitute an integrated approach to deploy an optimal integration in the technical, evaluation and management infrastructures of the city in different contexts.

6. Conclusions

This paper conducts a preliminary analysis of the main characteristics for 60 identified PED projects in Europe. A dedicated database is developed by considering a series of key parameters. It is found that a large number of PED projects locates in Norway and Italy. Although the first PED project took place in 1970, the momentum for such climate-neutral goals started in 2014. Most PED related projects choose ‘yearly’ as the time scale. Nearly 1/3 of projects have less than 0.2 km2 area as their spatial scale. In this case, the definition of the project area and the information regarding its boundaries calculation are both very relevant to evaluate the PEDs features of the projects and the business model adopted. Different financing mechanisms and innovative procurement solutions are required to support different large scale actions. The private investment together with regional/national grants is a commonly used financial model which reflects active involvement from the private sector. Residential, commercial and office/social buildings are mostly involved in the installation of renewable energy systems, which includes solar energy, district heating/cooling, wind and geothermal energy are primary technologies, where solar technologies show dominance. Substantial challenges and barriers for PED related projects vary from planning stage to implementation stage.
The non-technological PED solutions (e.g., solution for Governance, Economic, Social, Environmental, Spatial, Legal/Regulatory) are not clearly considered in the Booklet analysis. This is why the next interactive PEDs mapping tools will take into account those aspects that could help to share information and boost the PEDs replication within the main target groups, and according to a local broader perspective.
In addition to the development of the database, the text mining approach is applied to further examine the keywords of PED-related projects. It is observed that projects that are already ‘implemented’ (both PED and towards PED) concentrate highly on ‘consumption’, ‘production’, ‘heating’. While the projects that are yet ‘planning’ (both PED and towards PED) focus on ‘solutions’, ‘research’. Projects that are ‘In Implementation’ (both PED and towards PED), mostly repeat words of ‘planning’ and ’solution’, but given they are closer to ‘implementation’ they also display interest in ‘heating’ and ‘supply’. We also deduce that the projects that are still in the planning phase are more akin to depend on established facts for their documentation, whereas the implemented projects lean towards expressing more opinions by high involvement of stakeholders.
Although there is uncertainty due to limited data at the initial stage, the results are expected to give useful guidance for the final PED definition and proposal of ‘reference PED’. It is confident that the alignment among ongoing initiatives will represent the best way and very practical solution to step forward and facilitate the PEDs implementation in the next years, with more useful guidance and tools.

Author Contributions

Conceptualization, X.Z.; methodology, S.R.P. and S.G.; formal analysis, S.R.P. and S.G.; investigation, X.Z., S.R.P., S.G., M.N.S., P.C. and H.V.; writing—original draft preparation, X.Z., S.R.P., and S.G.; writing—review and editing, X.Z., M.N.S., P.C. and H.V. All authors have read and agreed to the published version of the manuscript.

Funding

This research was funded by Swedish Energy Agency with grant number 8569501 and by the Spanish Ministry of Science and Innovation and co-financed by FEDER funds, under TOGETHER (RTC-2017-5926-3) project. Paolo Civiero acknowledges the funding received from the European Union’s Horizon 2020 re-search and innovation programme under the Marie Skłodowska-Curie grant agreement No 712949 (TECNIOspring PLUS) and the Agency for Business Competitiveness of the Government of Catalonia.

Acknowledgments

The authors would like to acknowledge discussions and comments given by experts from subtask A in IEA EBC Annex 83, and working group 1 in EU Cost action CA19126.

Conflicts of Interest

The authors declare no conflict of interest.

References

  1. SET-Plan ACTION n°3.2 Implementation Plan. Europe to Become a Global Role Model in Integrated, Innovative Solutions for the Planning, Deployment, and Replication of Positive Energy Districts. Available online: https://setis.ec.europa.eu/system/files/2021-04/setplan_smartcities_implementationplan.pdf (accessed on 26 April 2021).
  2. Civiero, P.; Sanmartí, M.; García, R.; Gabaldón, A.; Chicote, M.A.; Ferrer, J.A.; Ricart, J.E.; Franca, P.; Escobar, G.J.; PTE-ee ITP—Iniciativa Tecnológica Prioritaria. Positive Energy Districts (PEDs). 2019. Available online: https://static.pte-ee.org/media/files/documentacion/itp-01-2019-distritos-de-energia-positiva-peds-tZU.pdf (accessed on 26 April 2021).
  3. Energy Positive Neighborhoods and Smart Energy Districts. Methods, Tools, and Experiences from the Field. ScienceDirect. Available online: https://0-www-sciencedirect-com.brum.beds.ac.uk/book/9780128099513/energy-positive-neighborhoods-and-smart-energy-districts#book-description (accessed on 26 April 2021).
  4. Lindholm, O.; ur Rehman, H.; Reda, F. Positioning Positive Energy Districts in European Cities. Buildings 2021, 11, 19. [Google Scholar] [CrossRef]
  5. Zhou, Y.; Cao, S.; Hensen, J.L.M. An energy paradigm transition framework from negative towards positive district energy sharing networks—Battery cycling aging, advanced battery management strategies, flexible vehicles-to-buildings interactions, uncertainty and sensitivity analysis. Appl. Energy 2021, 288, 116606. [Google Scholar] [CrossRef]
  6. Samadzadegan, B.; Abolhassani, S.S.; Dabirian, S.; Ranjbar, S.; Rasoulian, H.; Sanei, A.; Eicker, U. Novel energy system design workflow for zero-carbon energy district development. Front. Sustain. Cities 2021, 3, 23. [Google Scholar] [CrossRef]
  7. Shnapp, S.; Paci, D.; Bertoldi, P. Enabling Positive Energy Districts across Europe: Energy Efficiency Couples Renewable Energy. Available online: https://publications.jrc.ec.europa.eu/repository/handle/JRC121405 (accessed on 12 June 2021).
  8. Gabaldón Moreno, A.; Vélez, F.; Alpagut, B.; Hernández, P.; Sanz Montalvillo, C. How to Achieve Positive Energy Districts for Sustainable Cities: A Proposed Calculation Methodology. Sustainability 2021, 13, 710. [Google Scholar] [CrossRef]
  9. Bambara, J.; Athienitis, A.K.; Eicker, U. Residential Densification for Positive Energy Districts. Front. Sustain. Cities 2021, 3, 3. [Google Scholar] [CrossRef]
  10. Laitinen, A.; Lindholm, O.; Hasan, A.; Reda, F.; Hedman, Å. A techno-economic analysis of an optimal self-sufficient district. Energy Convers. Manag. 2021, 236, 114041. [Google Scholar] [CrossRef]
  11. Soutullo, S.; Aelenei, L.; Nielsen, P.S.; Ferrer, J.A.; Gonçalves, H. Testing Platforms as Drivers for Positive-Energy Living Laboratories. Energies 2020, 13, 5621. [Google Scholar] [CrossRef]
  12. Fatima, Z.; Pollmer, U.; Santala, S.S.; Kontu, K.; Ticklen, M. Citizens and Positive Energy Districts: Are Espoo and Leipzig Ready for PEDs? Buildings 2021, 11, 102. [Google Scholar] [CrossRef]
  13. Uspenskaia, D.; Specht, K.; Kondziella, H.; Bruckner, T. Challenges and Barriers for Net-Zero/Positive Energy Buildings and Districts—Empirical Evidence from the Smart City Project SPARCS. Buildings 2021, 11, 78. [Google Scholar] [CrossRef]
  14. Nzengue, Y.; du Boishamon, A.; Laffont-Eloire, K.; Partenay, V.; Abdeloua, Y. Planning city refurbishment: An exploratory study at district scale how to move towards positive energy districts—approach of the SINFONIA project. In Proceedings of the 2017 International Conference on Engineering, Technology and Innovation (ICE/ITMC), Madeira Island, Portugal, 27–29 June 2017; pp. 1394–1400. [Google Scholar] [CrossRef]
  15. Civiero, P.; Pascual, J.; Arcas Abella, J.; Bilbao Figuero, A.; Salom, J. PEDRERA. Positive Energy District Renovation Model for Large Scale Actions. Energies 2021, 14, 2883. [Google Scholar] [CrossRef]
  16. Gouveia, J.P.; Seixas, J.; Palma, P.; Duarte, H.; Luz, H.; Cavadini, G.B. Positive Energy District: A Model for Historic Districts to Address Energy Poverty. Front. Sustain. Cities 2021, 3, 16. [Google Scholar] [CrossRef]
  17. Salom, J.; Tamm, M.; Andresen, I.; Cali, D.; Magyari, Á.; Bukovszki, V.; Balázs, R.; Dorizas, P.V.; Toth, Z.; Mafé, C.; et al. An Evaluation Framework for Sustainable Plus Energy Neighbourhoods: Moving Beyond the Traditional Building Energy Assessment. Energies 2021, 14, 4314. [Google Scholar] [CrossRef]
  18. JPI Urban Europe—ERA-LEARN. Available online: https://www.era-learn.eu/network-information/networks/urban-europe (accessed on 20 May 2021).
  19. Bossi, S.; Gollner, C.; Theierling, S. Towards 100 Positive Energy Districts in Europe: Preliminary Data Analysis of 61 European Cases. Energies 2020, 13, 6083. [Google Scholar] [CrossRef]
  20. Brozovsky, J.; Gustavsen, A.; Gaitani, N. Zero Emission Neighbourhoods and Positive Energy Districts—A State-of-the-Art Review. Sustain. Cities Soc. 2021, 72, 103013. [Google Scholar] [CrossRef]
  21. Hedman, Å.; Rehman, H.U.; Gabaldón, A.; Bisello, A.; Albert-Seifried, V.; Zhang, X.; Guarino, F.; Grynning, S.; Eicker, U.; Neumann, H.-M.; et al. IEA EBC Annex83 Positive Energy Districts. Buildings 2021, 11, 130. [Google Scholar] [CrossRef]
  22. COST Action CA19126 Positive Energy European Network. Available online: https://www.cost.eu/actions/CA19126/#tabs|Name:overview (accessed on 26 April 2021).
  23. Gollner, C.; Hinterberger, R.; Noll, M.; Meyer, S.; Schwarz, H.G. Booklet of Positive Energy Districts in Europe; JPI Urban Europe and Austrian Research Promotion Agency FFG, Sensengasse 1, 1090 Vienna. Available online: https://nws.eurocities.eu/MediaShell/media/Booklet_of_PEDs_JPI_UE_v6_NO_ADD.pdf (accessed on 26 April 2021).
  24. Positive Energy Districts (PED). JPI Urban Europe. Available online: https://jpi-urbaneurope.eu/ped/ (accessed on 26 April 2021).
  25. Évora, POCITYF. Available online: https://pocityf.eu/city/evora/ (accessed on 5 May 2021).
  26. La Fleuriaye, Nature D’avance—Carquefou (44). Available online: http://www.quartierlafleuriaye.fr/ (accessed on 5 May 2021).
  27. Medicon Village, E. ON Ectogrid. Available online: https://ectogrid.com/use-cases/medicon-village/ (accessed on 5 May 2021).
  28. Municipal District Heating Company of Amindeo (D.H.C.A.)—ΔΕΤΕΠA. Available online: http://detepa.gr/dhca/ (accessed on 5 May 2021).
  29. “Om Smart Energy Åland”, Smart Energy Åland. Available online: https://smartenergy.ax/om-smart-energy-aland/ (accessed on 5 May 2021).
  30. “Oulu Northern Lights”, Oulu Northern Lights. Available online: https://www.northernlights.fi/ (accessed on 5 May 2021).
  31. Red de Calor Urbana (Mieres-Asturias). Aula Hunosa de la Geoetermia y la Biomasa. Available online: http://www.aulahunosa.es/red-de-calor-mieres/ (accessed on 5 May 2021).
  32. RHC—2050 Vision for 100% Renewable Heating and Cooling in Europe. Available online: https://www.rhc-platform:content/uploads/2019/10/RHC-VISION-2050-WEB.pdf (accessed on 5 May 2021).
  33. Samen Werken Aan Minder CO2: Sustainable Energy and Environment. Available online: https://www.han.nl/over-de-han/onze-focus/sustainable-energy-and-environment/ (accessed on 5 May 2021).
  34. Sinfonia Project. Available online: http://www.sinfonia-smartcities.eu/ (accessed on 5 May 2021).
  35. Stadtteil Dietenbach. Available online: https://www.freiburg.de/pb/495838.html (accessed on 5 May 2021).
  36. Stadtwerke Hennigsdorf—Forschungsprojekte. Available online: https://www.swh-online.de/aktuell/forschungsprojekte (accessed on 5 May 2021).
  37. Stardust. Available online: https://stardustproject.eu/ (accessed on 5 May 2021).
  38. Giourka, P.; Apostolopoulos, V.; Angelakoglou, K.; Kourtzanidis, K.; Nikolopoulos, N.; Sougkakis, V.; Fuligni, F.; Barberis, S.; Verbeek, K.; Costa, J.M.; et al. An Empirical Evidence of Two European Union (EU) Smart Cities, Evora and Alkmaar. Smart Cities 2020, 3, 32. [Google Scholar] [CrossRef]
  39. Olivadese, R.; Alpagut, B.; Revilla, B.P.; Brouwer, J.; Georgiadou, V.; Woestenburg, A.; van Wees, M. Towards Energy Citizenship for a Just and Inclusive Transition: Lessons Learned on Collaborative Approach of Positive Energy Districts from the EU Horizon2020 Smart Cities and Communities Projects. Proceedings 2020, 65, 20. [Google Scholar] [CrossRef]
  40. Urban Innovation Lab—Competence and Network Regarding Sustainable Societal Development. Available online: https://urbaninnovationlab.se/ (accessed on 5 May 2021).
  41. Werksviertel—Werksviertel München. Available online: https://werksviertel.de/?page_id=410&lang=en (accessed on 5 May 2021).
  42. ZEN-Report-no-7. Zero Emission Neighbourhoods in SmartCities. Available online: https://fmezen.no/wp-content/uploads/2018/11/ZEN-Report-no-7-Bilingual.pdf (accessed on 5 May 2021).
  43. Reback, J.; Jbrockmendel; McKinney, W.; Van Den Bossche, J.; Augspurger, T.; Cloud, P.; Hawkins, S.; Gfyoung; Sinhrks; Roeschke, M.; et al. pandas-dev/pandas: Pandas 1.2.4. Zenodo 2021. [Google Scholar] [CrossRef]
  44. Jivani, A.G. A Comparative Study of Stemming Algorithms. Int. J. Comp. Tech. Appl. 2011, 2, 1930–1938. [Google Scholar]
  45. Loper, E.; Bird, S. NLTK: The Natural Language Toolkit. May 2002. Available online: http://arxiv.org/abs/cs/0205028 (accessed on 5 May 2021).
  46. Loria, S. Textblob Documentation; p. 73. Available online: https://buildmedia.readthedocs.org/media/pdf/textblob/latest/textblob.pdf (accessed on 5 May 2021).
  47. Agarwal, B.; Mittal, N.; Bansal, P.; Garg, S. Sentiment Analysis Using Common-Sense and Context Information. Comput. Intell. Neurosci. 2015, 2015, 715730. [Google Scholar] [CrossRef] [PubMed] [Green Version]
  48. References—Citing QGIS in Formal Publications? Geographic Information Systems Stack Exchange. Available online: https://gis.stackexchange.com/questions/23622/citing-qgis-in-formal-publications (accessed on 5 May 2021).
  49. FAQ KNIME. Available online: https://www.knime.com/faq#q1_1 (accessed on 5 May 2021).
  50. Civiero, P.; Sanmartí, M.; García, R.; Gabaldón, A.; Chicote, M.A.; Ferrer, J.A.; Ricart, J.E.; Franca, P.; Escobar, G.J. Distritos de Energía Positiva (PEDs) en España, Una propuesta de Iniciativa Tecnológica Prioritaria de la PTE-EE. In Proceedings of the VII Congreso Edificios Energía Casi Nula, Madrid, Spain, 5 November 2020; pp. 109–114, ISBN 9798554378225. [Google Scholar]
  51. Reference Framework for Positive Energy Districts and Neighbourhoods Key Lessons from National Consultations. Available online: https://jpi-urbaneurope.eu/wp-content/uploads/2020/04/White-Paper-PED-Framework-Definition-2020323-final.pdf (accessed on 5 May 2021).
  52. Harkouss, F.; Fardoun, F.; Biwole, P.H. Optimization approaches and climates investigations in NZEB—A review. Build. Simul. 2018, 11, 923–952. [Google Scholar] [CrossRef]
  53. Hong, T.; Langevin, J.; Sun, K. Building simulation: Ten challenges. Build. Simul. 2018, 11, 871–898. [Google Scholar] [CrossRef] [Green Version]
  54. Child, M.; Nordling, A.; Breyer, C. Scenarios for a sustainable energy system in the Åland Islands in 2030. Energy Convers. Manag. 2017, 137, 49–60. [Google Scholar] [CrossRef]
  55. Child, M.; Nordling, A.; Breyer, C. Scenarios for a Sustainable Energy System in the Åland Islands in 2030, First Results for Åland Smart Energy Platform Stakeholders, 5 September 2016. Available online: https://flexens.com/wp-content/uploads/2021/04/Aland_Scenarios.pdf (accessed on 14 July 2021).
Figure 1. Initiated year of PED related projects.
Buildings 11 00318 g001
Figure 2. Locations of 60 PED related projects.
Buildings 11 00318 g002
Figure 3. Development stage of collected 60 PED related projects.
Buildings 11 00318 g003
Figure 4. Project area of the 60 PED related projects.
Buildings 11 00318 g004
Figure 5. Commonly used type of finance models.
Buildings 11 00318 g005
Figure 6. Type of buildings involved for space utilized by energy systems.
Buildings 11 00318 g006
Figure 7. Commonly used energy technologies.
Buildings 11 00318 g007
Figure 8. Country-wise approach of energy typology.
Buildings 11 00318 g008
Figure 9. Most commonly used words for PED.
Buildings 11 00318 g009
Figure 10. Sentiment Analysis.
Buildings 11 00318 g010
Figure 11. Interactive Knime Dashboard.
Buildings 11 00318 g011
Figure 12. The annual energy flows in the year 2030 at Åland Island towards 2030 target—100% sustainable mobility for two scenarios: (a) SM Syn scenario—domestic production of sustainable fuels and (b) SM EI scenario—high electrification. Reprinted from [55].
Buildings 11 00318 g012
Table 1. Table parameters for data collection.
Key ParametersType of Data
Project characteristicsLocation, initiated year, development stage, project area, finance model, etc.
Type of buildings involvedResidential, commercial, social, industry, etc.
Common energy technologiesSolar Thermal, geothermal, PV, heat pumps, etc.
Key energy conceptsEnergy combinations and strategies to meet the goals
KeywordsPositive energy district, smart city, etc.
EV/E-mobilityIncluded/Excluded in energy strategies
Temporal scaleHourly/monthly/yearly, etc.
Driving stakeholdersMunicipality, citizens, real estate developers, etc.
OthersSupporting regulations, barriers, key success factors, etc.
Table 2. Project groups according to PED ambitions and their development phase.
Project PhaseDescription
PED ImplementedIndicate PED ambition and are implemented
PED in ImplementationIndicate PED ambition and are amidst implementation
PED PlanningIndicate PED ambition and are still being planned
Towards-PED ImplementedDid not declare a PED ambition but present interesting features for the PED Program and are implemented
Towards-PED in ImplementationDid not declare a PED ambition but presents interesting features for the PED Program and are amidst implementations
Towards-PED PlanningDid not declare a PED ambition but presents interesting features for the PED Program and are still being planned
Table 3. Challenges and barriers in different stages of PED projects according to the main topics.
TopicPED in PlanningPED in ImplementationPED Implemented/in Operation
Administrative & PolicyConflicts between different authorities involved in the projectPolitical managementApprovals and permits from municipality and other entities might lead to project timeline extension
Legal & Regulatory Regulatory framework which governs involved actors throughout EuropeRegulatory barriers for piloting/testing
TechnicalSystem boundary conditions definedIdentification and deployment of local feasible clean energy systemsAnalysis required for hybrid energy system operations
Coping with rapid growth of new technologies Analysis required for underground seasonal energy storage
Energy generation system is far away from the consumers
Thermal mining challenges in the urban areas to reduce the distance from energy generation system far away
The electricity supply examined properly above 90 degrees
Environmental Disallowing inefficient and high polluting energy generation systems
Social & Cultural Cultural differences between different cities involved in the partnership
Information & Awareness Local citizen acceptance towards new things in rural areas
Economical & FinancialEconomic feasibilityFinance dependence on private investors
Finance availing according to the project timelineLocal finance
Overlapping implementation with local ongoing constructions
Stakeholders
interest
Encouragement of project drivers like real estate developersStakeholders and involved actor’s commitment towards project goalsConflicts due to lack of common interest between different landowners
Uncertainty in stakeholder’s commitmentCreating interest in project drivers like building owners and landlordsStrong collaborations needed between energy companies and real estate developers for fast implementation
OthersActive consideration of local knowledgeLack of supporting studies/knowledge for implementation
Lack of supporting studies/knowledge for planning
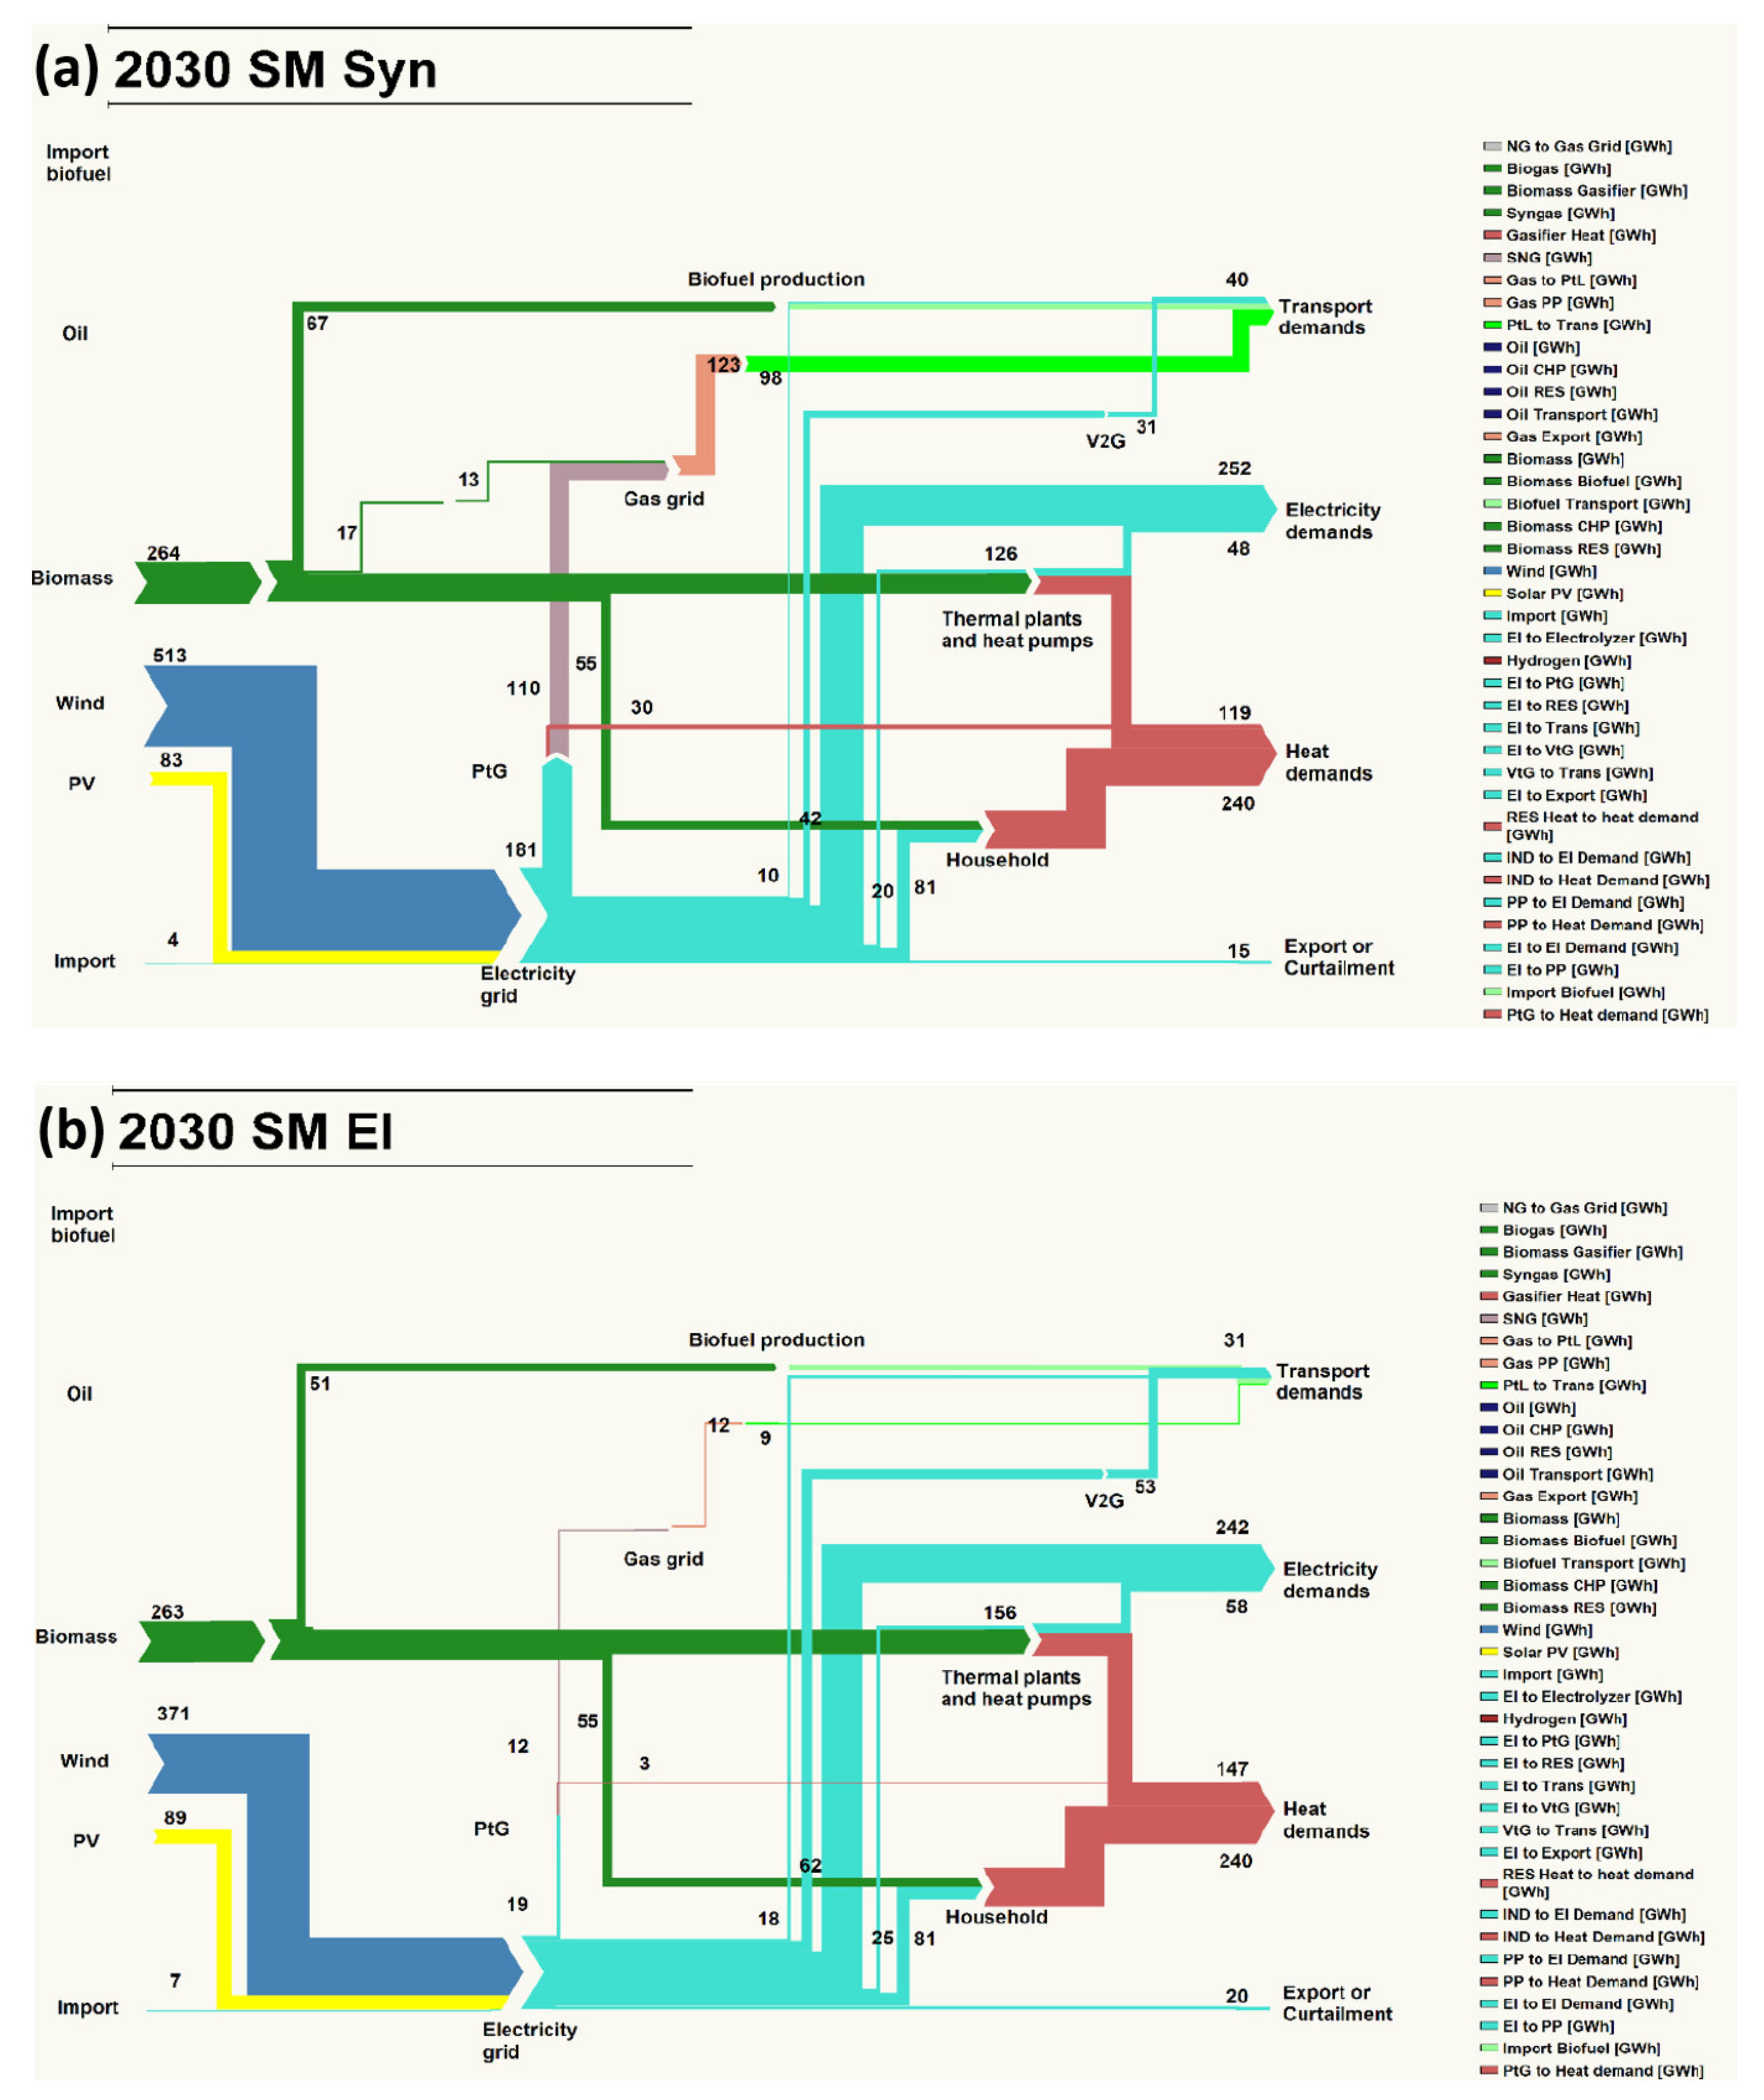
Table 4. Summary of major energy concepts and flows of a few PED projects.
City/DistrictCountryDevelopment Stage in 2020Temporal ScaleMajor Energy Flows
Åland IslandFinlandUnder implementationYearly
  • Target: 100% self-sufficient and 100% fossil-free.
  • Solar PV now: 1.7% to 0.7% of power demand.
  • Wind now: about 20% of total power demand.
  • Other sources, such as waste heat and CHP, bioenergy, wave power are still under implementation
Stor-Elvdal MunicipalityNorwayIn operationn/a
  • The demand for heat on the campus is covered by on-site heat production through the CHP plant.
  • One-third of the electricity demand is covered.
  • The rest is supplied by solar PV with batteries.
DrammenNorwayIn operationYearly
  • 85% of the heating needs are met by the large-scale fjord source heat pump (13 MW). The rest of the 15% heating needs are met by gas fired boiler.
  • The average annual energy supply is 67 GWh.
  • The heat pump is significantly cheaper than a gas heating system, saving the city around €2.7 m a year.
  • 1.5 million tonnes of CO2 have already been saved by switching from gas to the ammonia heat pump.
OuluFinlandUnder implementationYearly
  • District heating system supplemented with solar PV and geothermal energy technologies.
  • PV installations on the roof and geothermal heat pump and thermal borehole storage underneath the shopping mall.
  • Surplus heat shall be used for refrigeration and seasonal energy storage tanks increasing self-reliance during peak loads.
TurkuFinlandUnder planningn/a
  • Aim to become carbon neutral by 2029
  • 515 solar PV panels installed on new residential buildings will supply energy more than consumption in summer.
  • Utilizing the ground source heat with waste heat recovery extracted from 30 other buildings nearby.
  • 1 MW solar park is installed in the district by energy company, where the company rents out solar panels and reduces consumer electricity bills.
  • Solar thermal collectors are used to produce heat and store underground to use for winter needs.
  • Further two-way heat trading facility is provided.
TampereFinlandUnder implementationn/a
  • Solar PV farm installed outside the city will be used for energy needs inside the city along with geothermal local district heating and heat pumps.
BodøNorwayUnder planningYearly
  • Although this municipality has excess power production capacity, distribution networks is the main drawback in several places. Therefore, smart city goals are focused on achieving energy efficiency, creation of stable and sustainable energy systems, and reducing of peak demands.
  • This energy system uses local renewable energy productions, supply and optimization with regional, national, Nordic and EU electricity networks
ElverumNorwayUnder planning and implementationn/a
  • Firstly, reducing the energy demand in buildings and depending energy production on local renewable energy sources.
  • Energy storage in the form of batteries or thermal energy storage
TrondheimNorwayUnder implementationn/a
  • Conventional electricity is being provided by largely hydropower with 21 g CO2eq/kWh, and district heating through burning local waste.
  • Installation of solar PV arrays, heat pumps integration.
  • Large 1500 kWh battery storage would attribute to reaching the energy peak demands and surplus energy supply.
BergenNorwayUnder planningn/a
  • Primarily improving energy efficiency to reduce energy demand.
  • Individual energy systems based on renewable energy sources such as PV, thermal technologies are developed.
  • Further surplus power will be supplied to EV mobility solutions
OdenseDenmarkUnder implementationYearly
  • To eliminate fossil fuels by 2025 and reach to top 3 cheapest district heating prices in Denmark.
  • District heating supply with waste heat, energy power production from renewables such as wind power.
  • Further strategically investing in smaller energy units which include 10–20 MW heat pumps, 30–50 MW biomass boilers and +50 MW electric boilers etc.
OsterbyDenmarkUnder implementationYearly
  • The project aims to reduce the heating costs from district heating with other networks.
  • Connecting and sharing energy with the large district heating facilities with neighbourhoods reflecting energy flexibility.
  • 2.07 MWp PV roof mounted installation that will operate the cooling machines in the mall.
LundSwedenUnder implementationn/a
  • Producing heat through local waste is enough to provide heating for the whole area.
  • Large scale district heating is installed to provide low temperature applications with renewable energy systems integration.
Lund (Brunnshög)SwedenUnder implementationYearly
  • Existing district heating used by biomass will be replaced by large scale biofuel CHP plant along with geothermal energy unit, waste heat combustion and district cooling heat pumps etc.
Lund (Medicon Village)SwedenImplementation completedYearly
  • Primarily trying to reduce the energy needs yearly by improving energy efficiency.
  • Installing solar power on rooftop of buildings for more sustainability.
Publisher’s Note: MDPI stays neutral with regard to jurisdictional claims in published maps and institutional affiliations.

