Author Contributions
Conceptualization, T.Y. and S.L.; methodology, T.Y.; software, T.Y.; validation, Y.L., S.X. and S.-L.L.; formal analysis, S.L.; investigation, S.X.; data curation, B.L.; writing—original draft preparation, T.Y.; writing—review and editing, S.L.; visualization, S.X.; supervision, B.L. All authors have read and agreed to the published version of the manuscript.
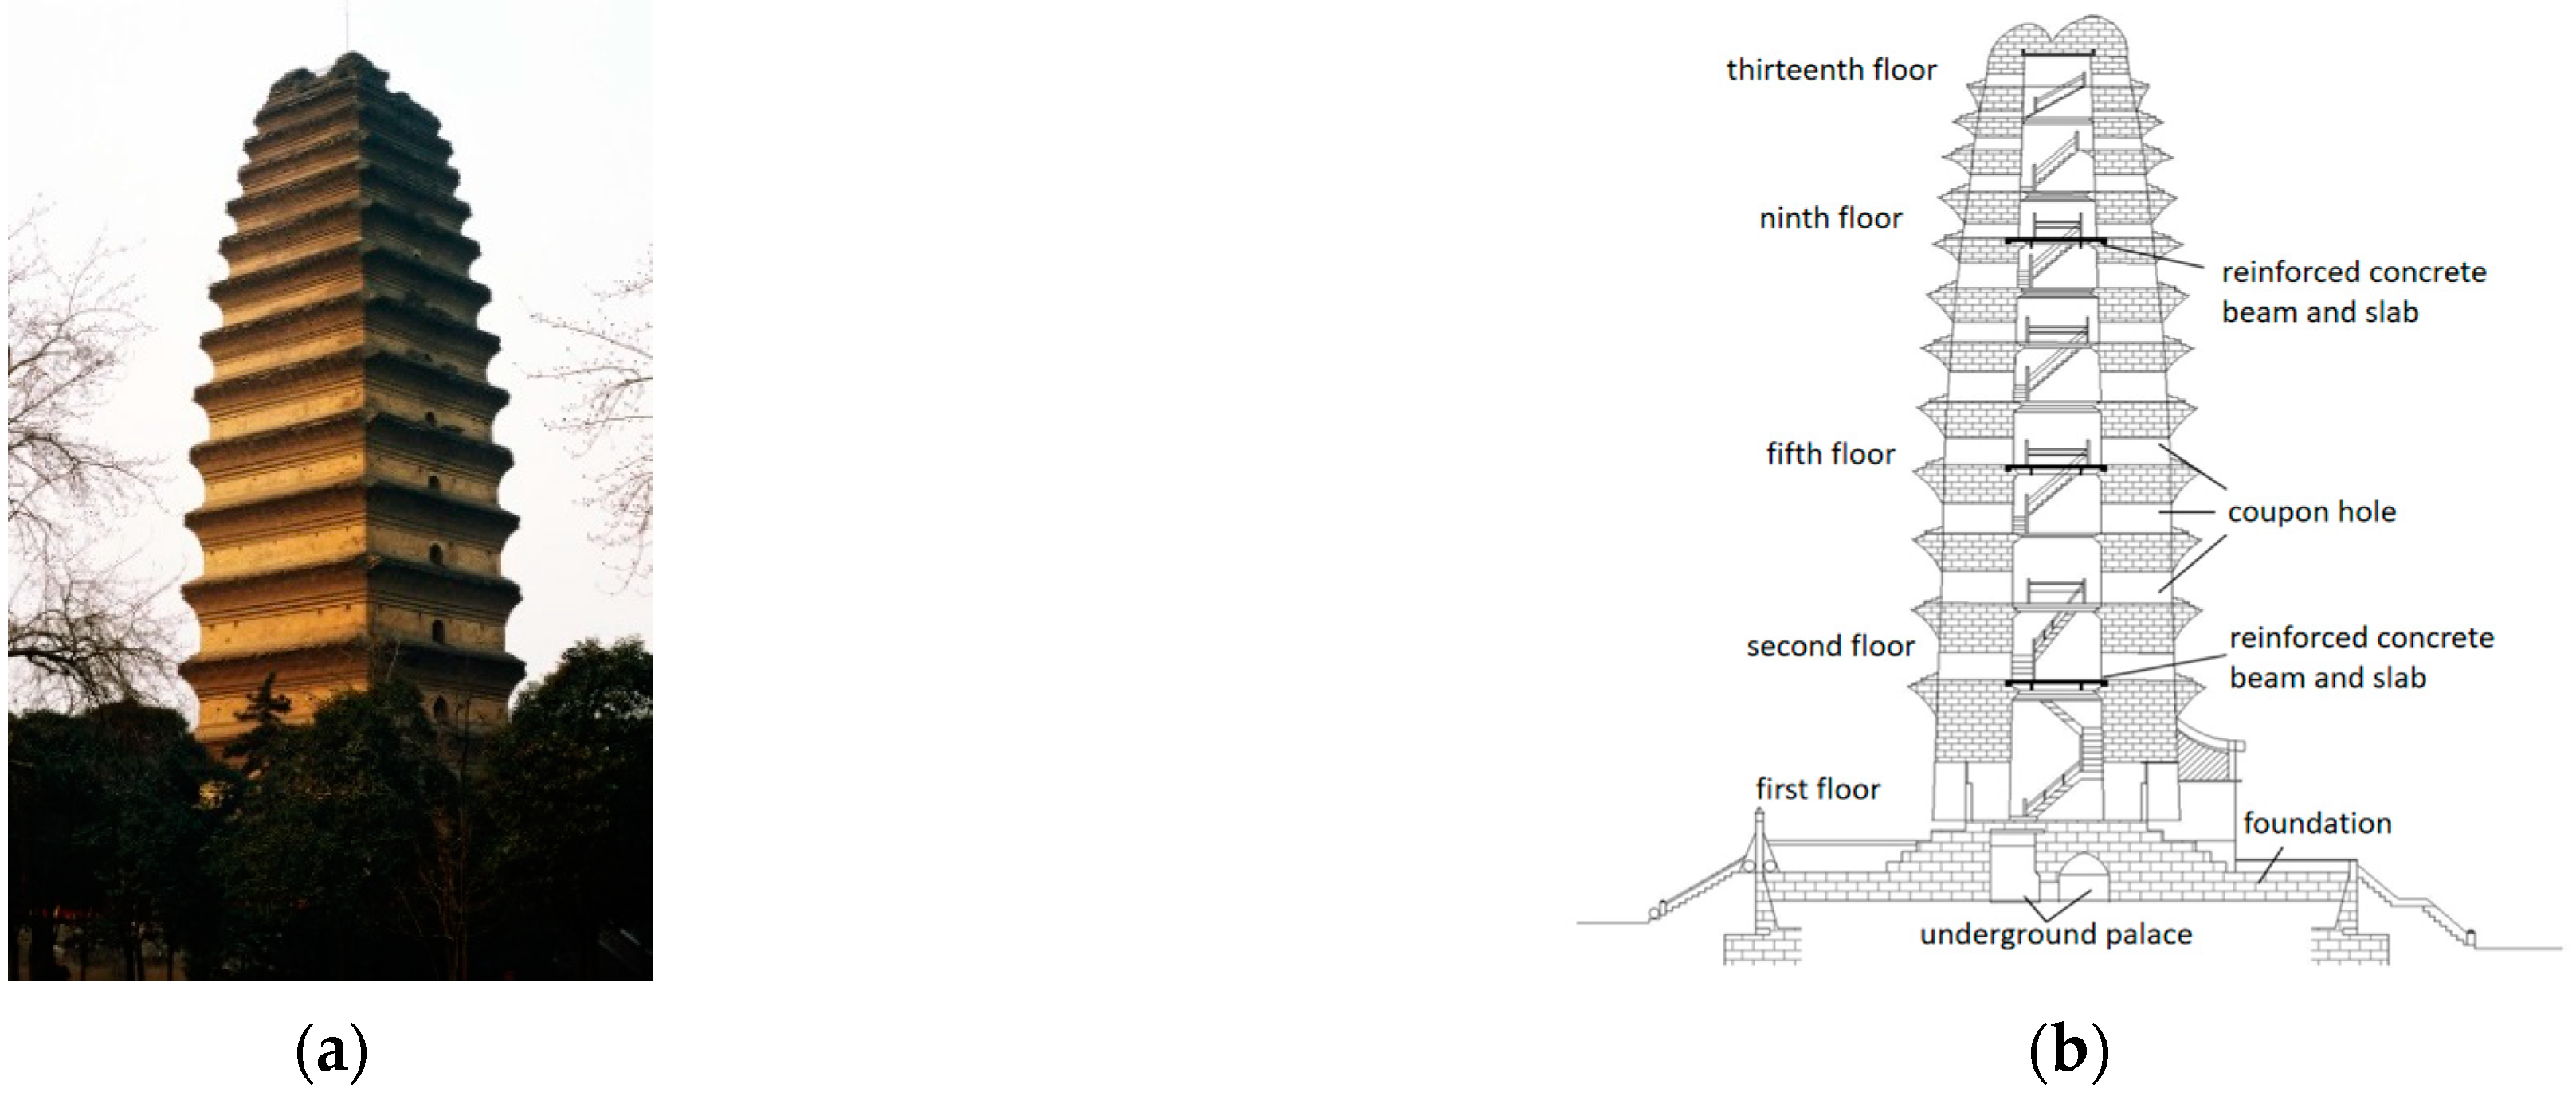
Figure 1.
The extant Small Wild Goose Pagoda. (a) Live-action. (b) Section drawing.
Figure 1.
The extant Small Wild Goose Pagoda. (a) Live-action. (b) Section drawing.
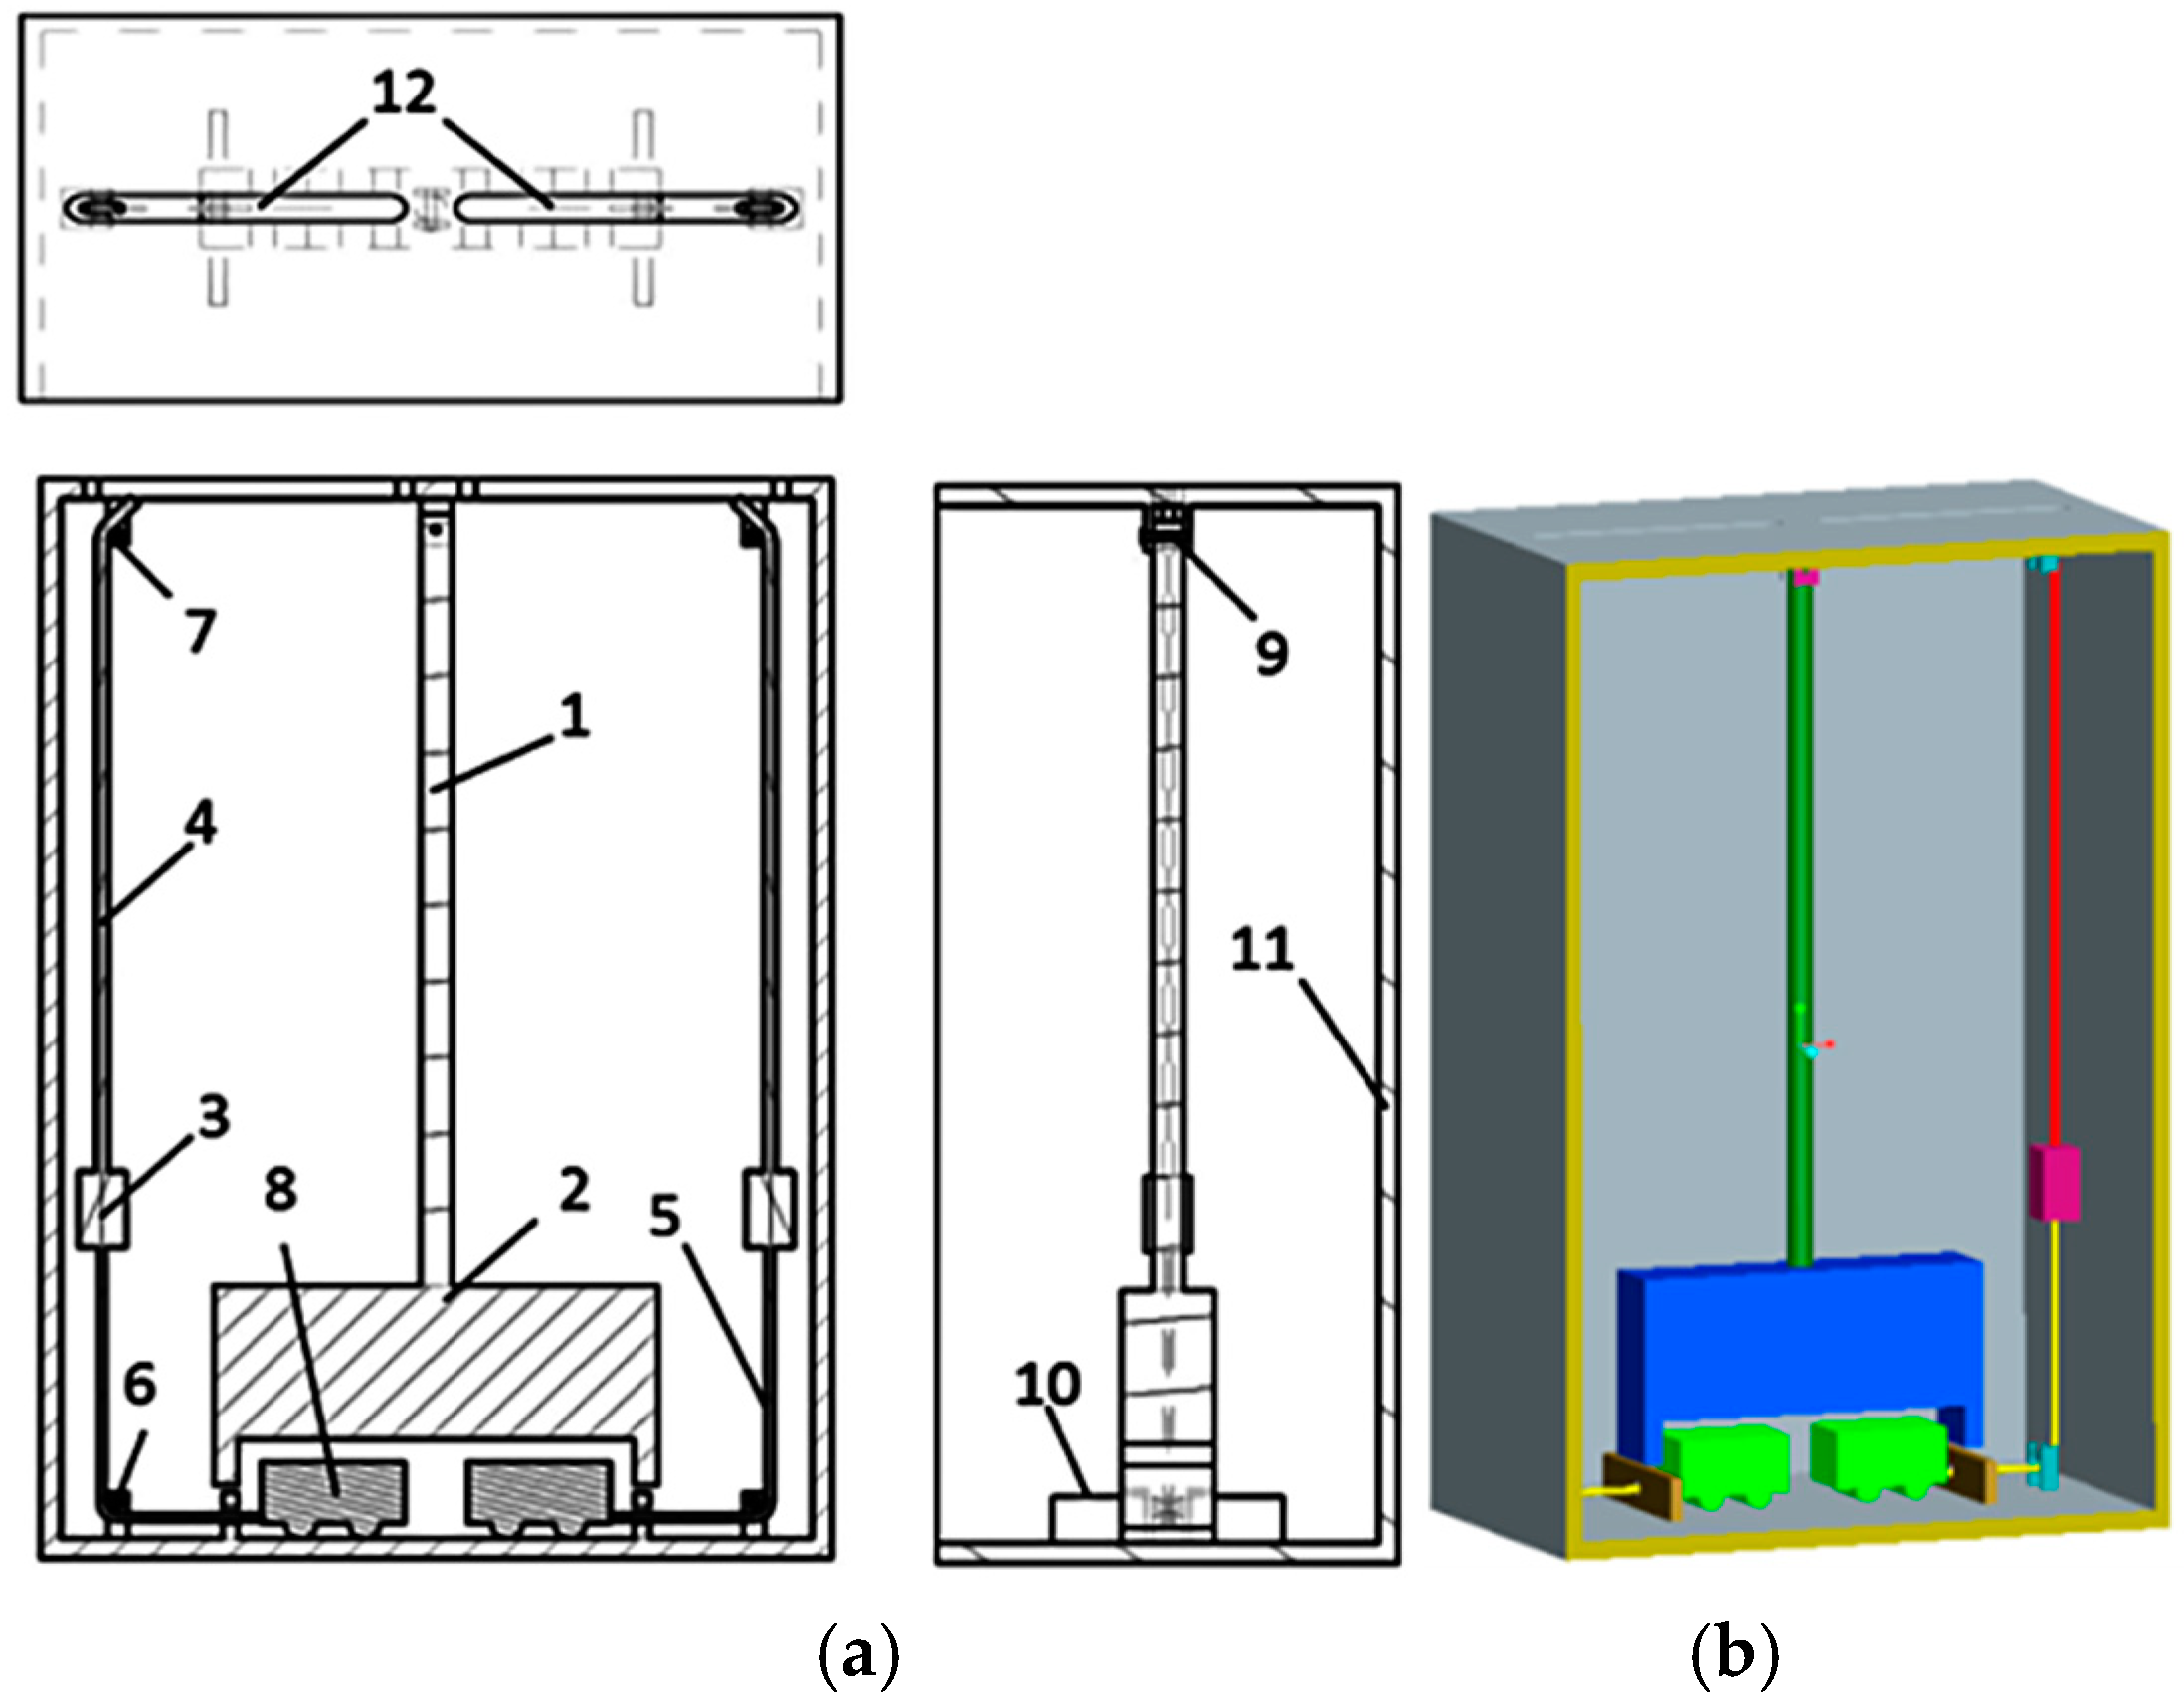
Figure 2.
SMA-SPDS structure diagram. (a) Construction details. (b) Three-dimensional structure. 1—Pendulum rod; 2—Mass vibrator; 3—Wire conversion joint; 4—Steel cable; 5—SMA; 6—Bottom steering pulley; 7—Upper steering pulley; 8—The small car; 9—One-way hinge; 10—Baffle; 11—The shell; 12—Steel cable channel.
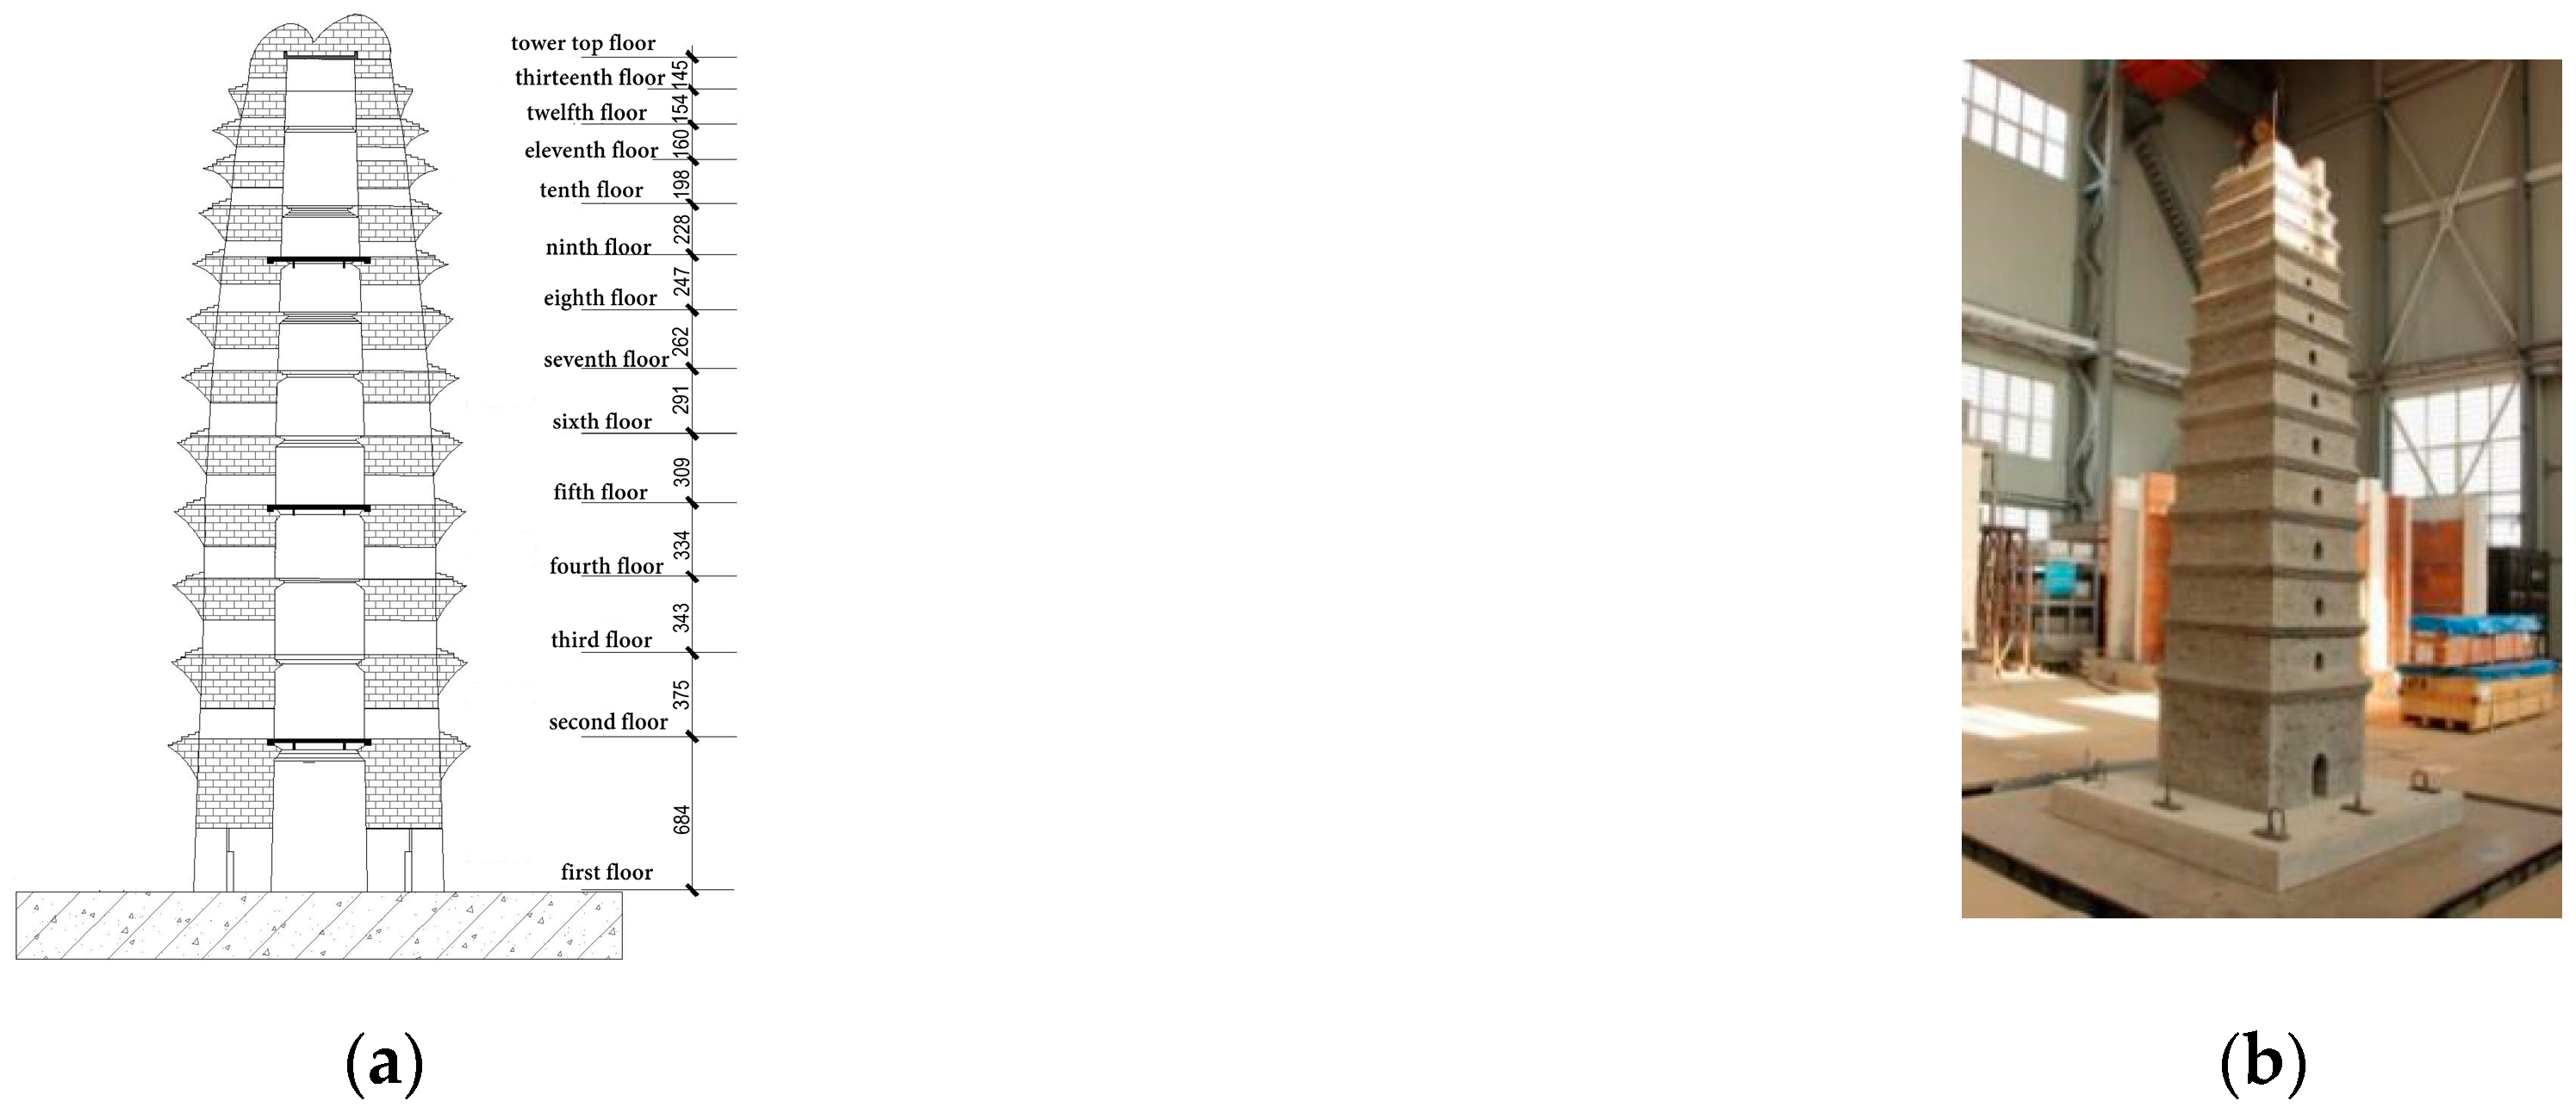
Figure 3.
Tower dimensions and overall model. (a) Tower size; (b) Overall model.
Figure 3.
Tower dimensions and overall model. (a) Tower size; (b) Overall model.
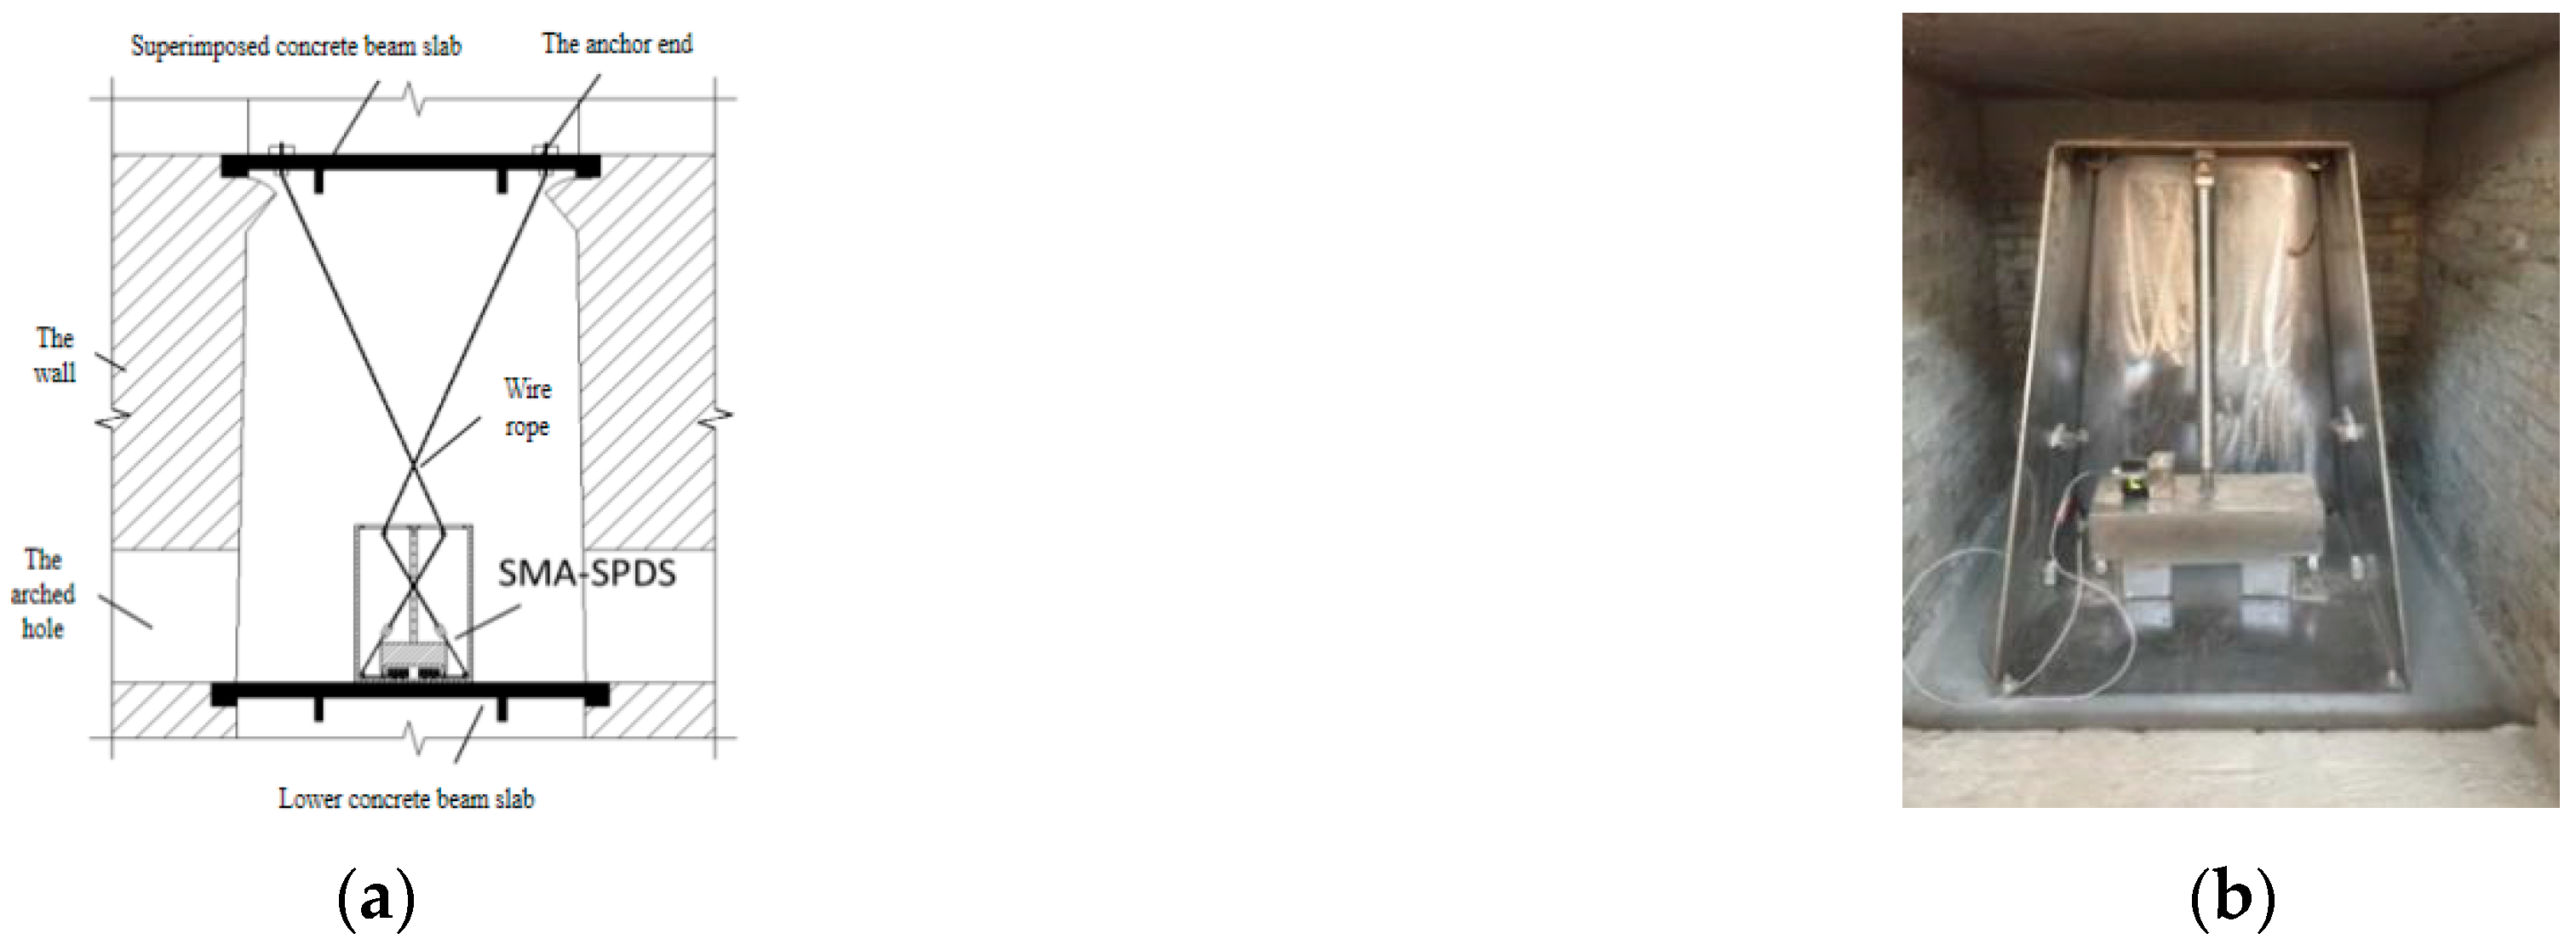
Figure 4.
SMA-SPDS installation setup diagram. (a) SMA-SPDS connection; (b) SMA-SPDS installation.
Figure 4.
SMA-SPDS installation setup diagram. (a) SMA-SPDS connection; (b) SMA-SPDS installation.
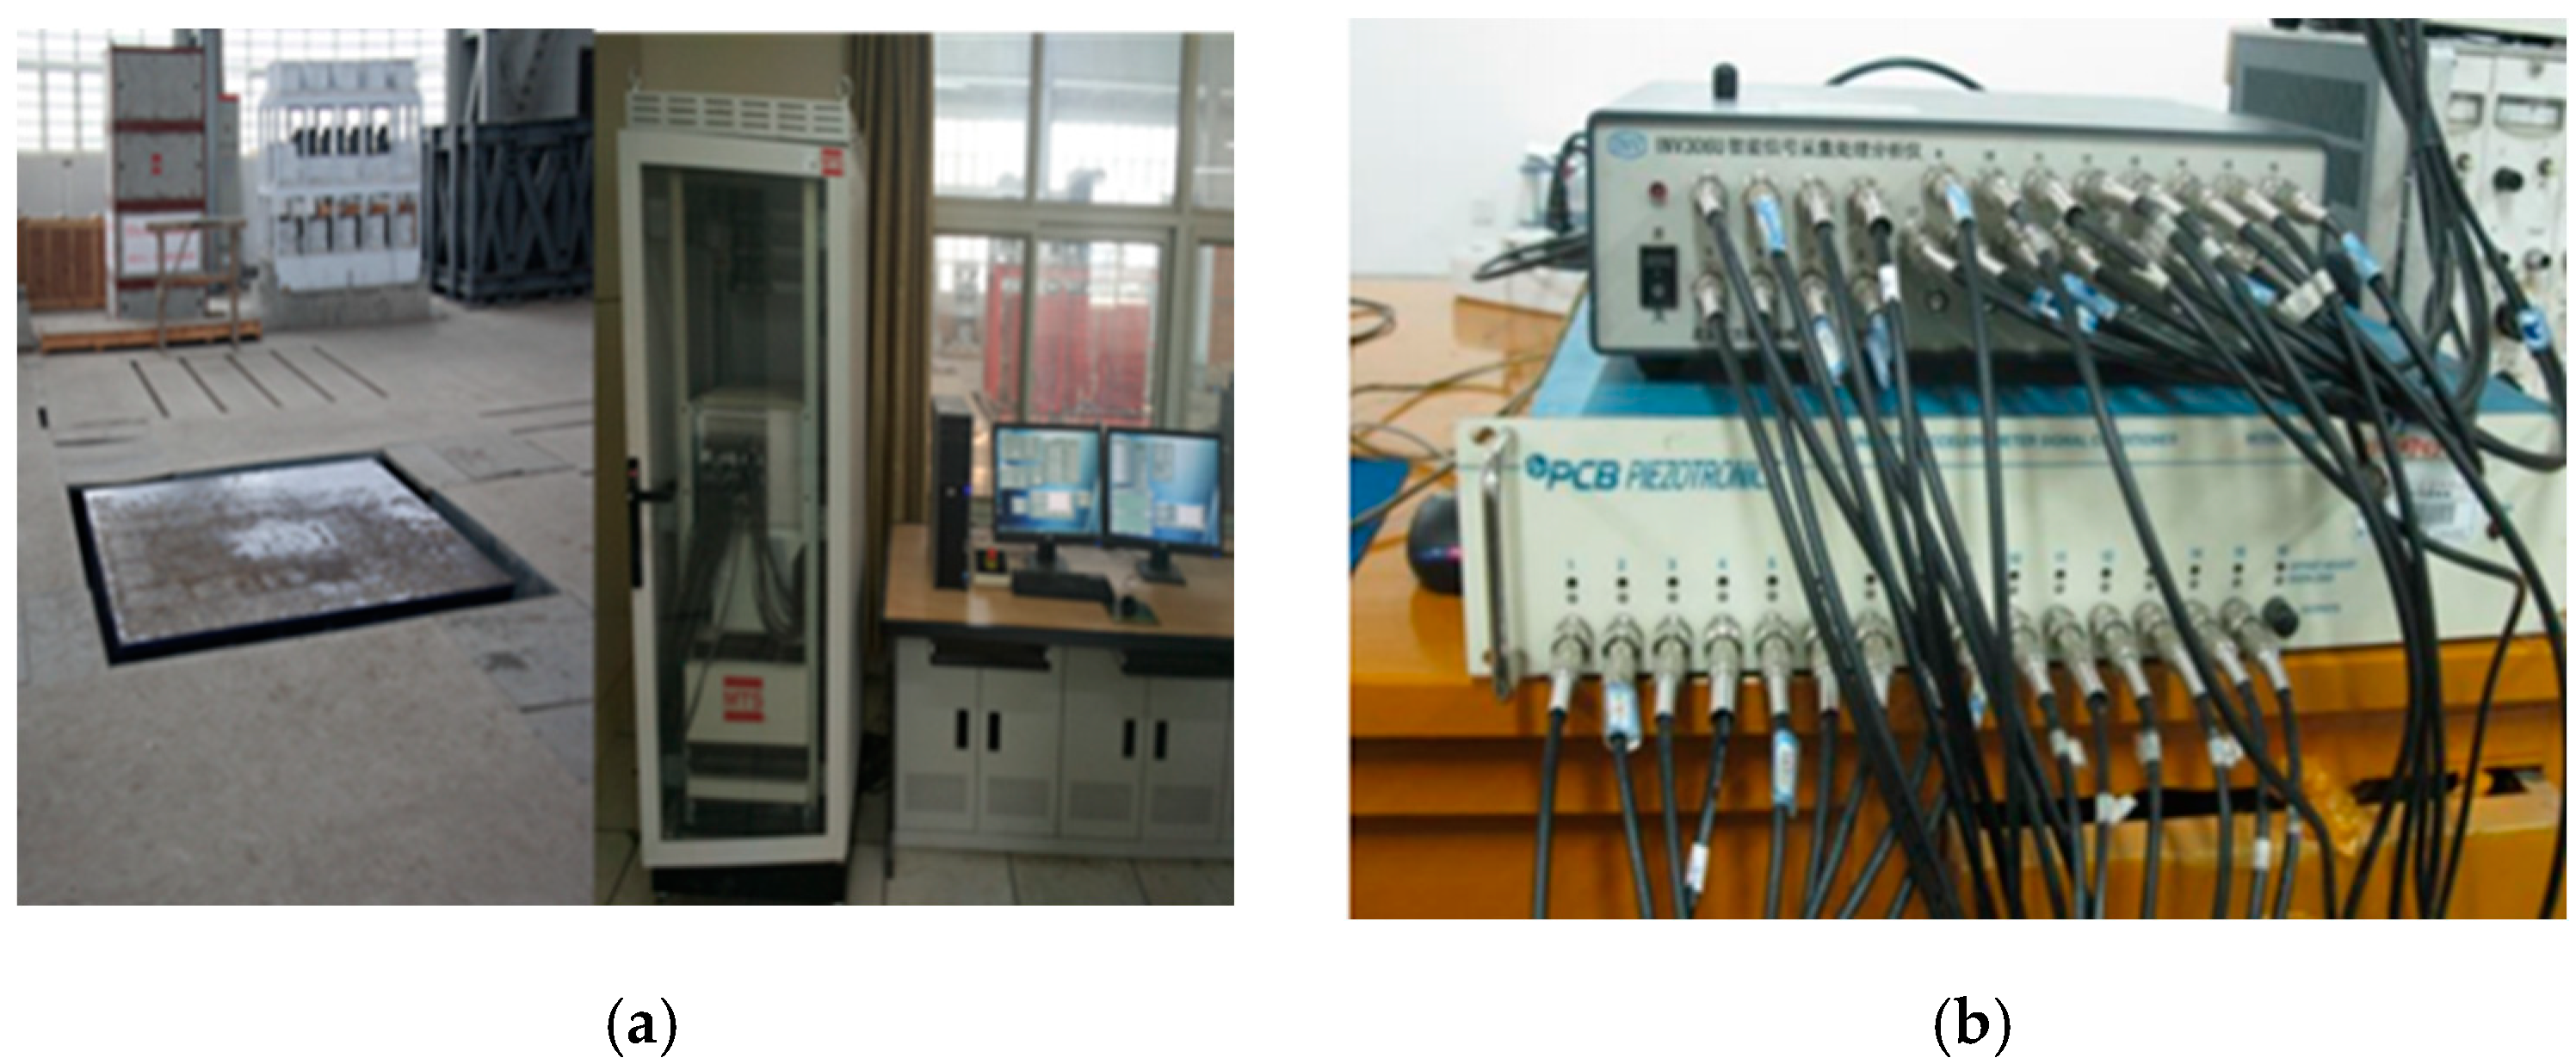
Figure 5.
Testing equipment. (a) Field of shaking table and control system; (b) LMS data acquisition instrument (under test).
Figure 5.
Testing equipment. (a) Field of shaking table and control system; (b) LMS data acquisition instrument (under test).
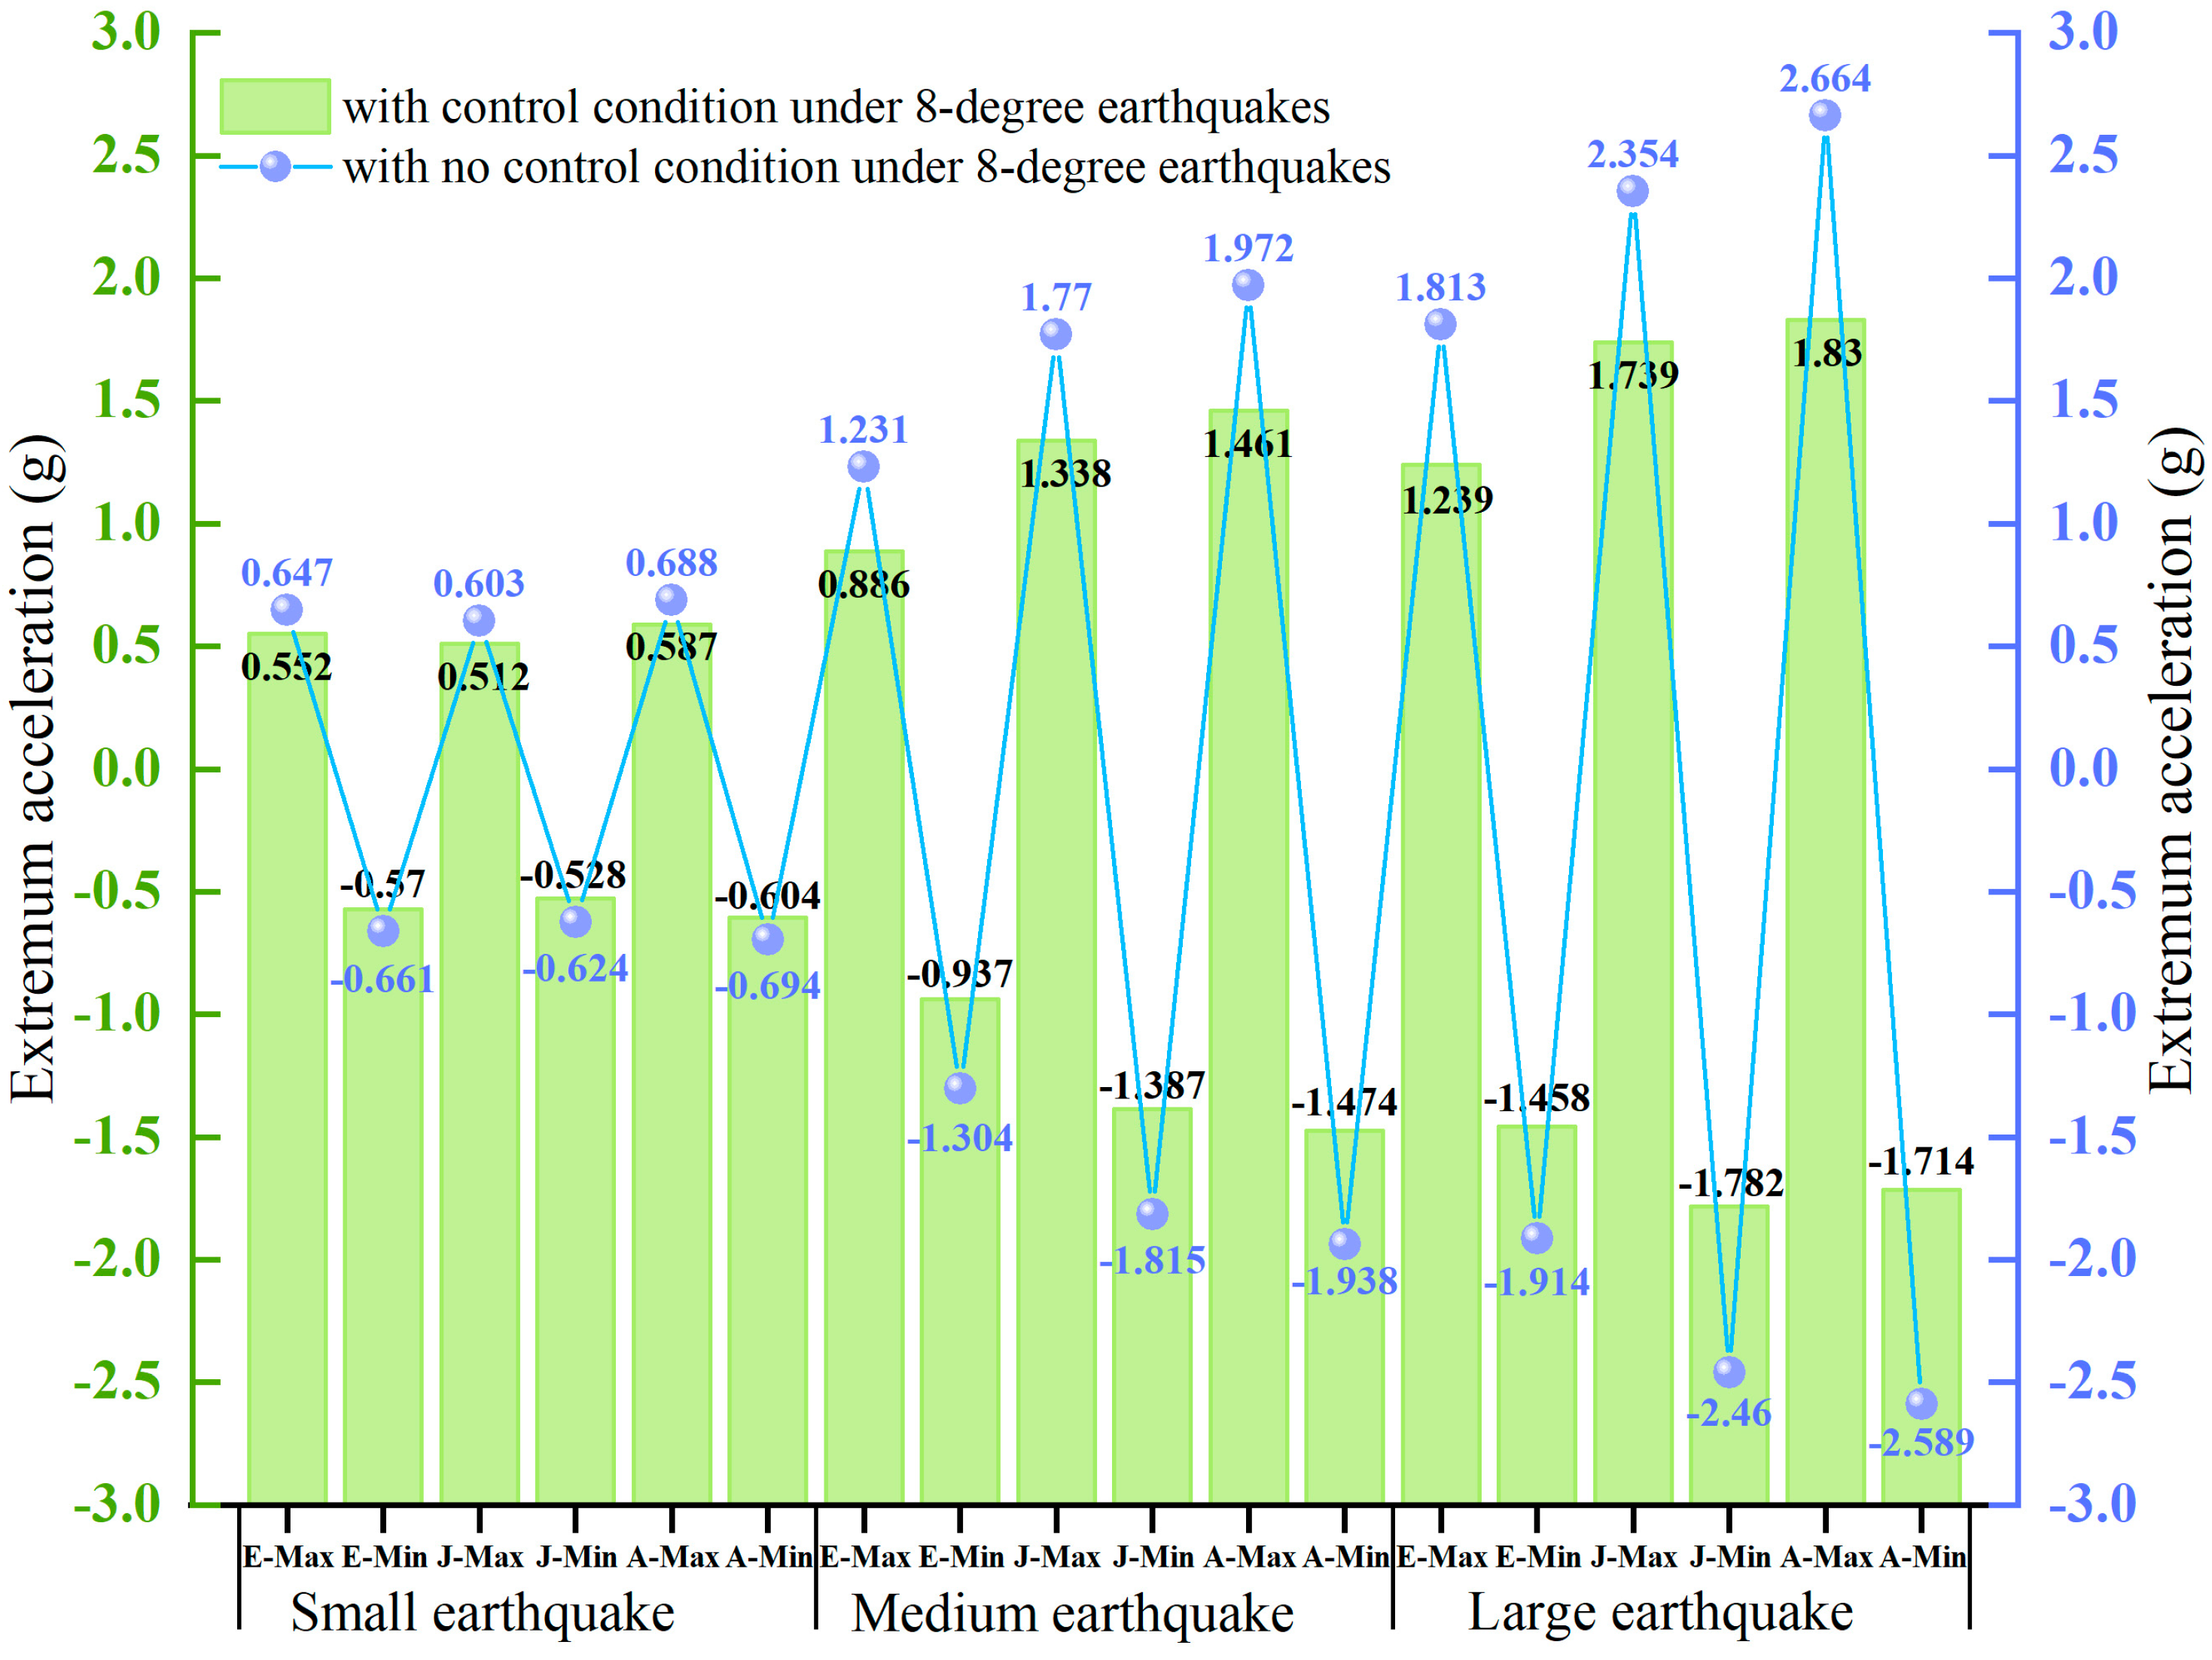
Figure 6.
The peak responses of the acceleration of the Small Wild Goose Pagoda. (Note: in the x-coordinate, the letter E stands for “El-Centro Wave”; the letter J refers to Jiangyou Wave; the letter A stands for Artificial Wave).
Figure 6.
The peak responses of the acceleration of the Small Wild Goose Pagoda. (Note: in the x-coordinate, the letter E stands for “El-Centro Wave”; the letter J refers to Jiangyou Wave; the letter A stands for Artificial Wave).
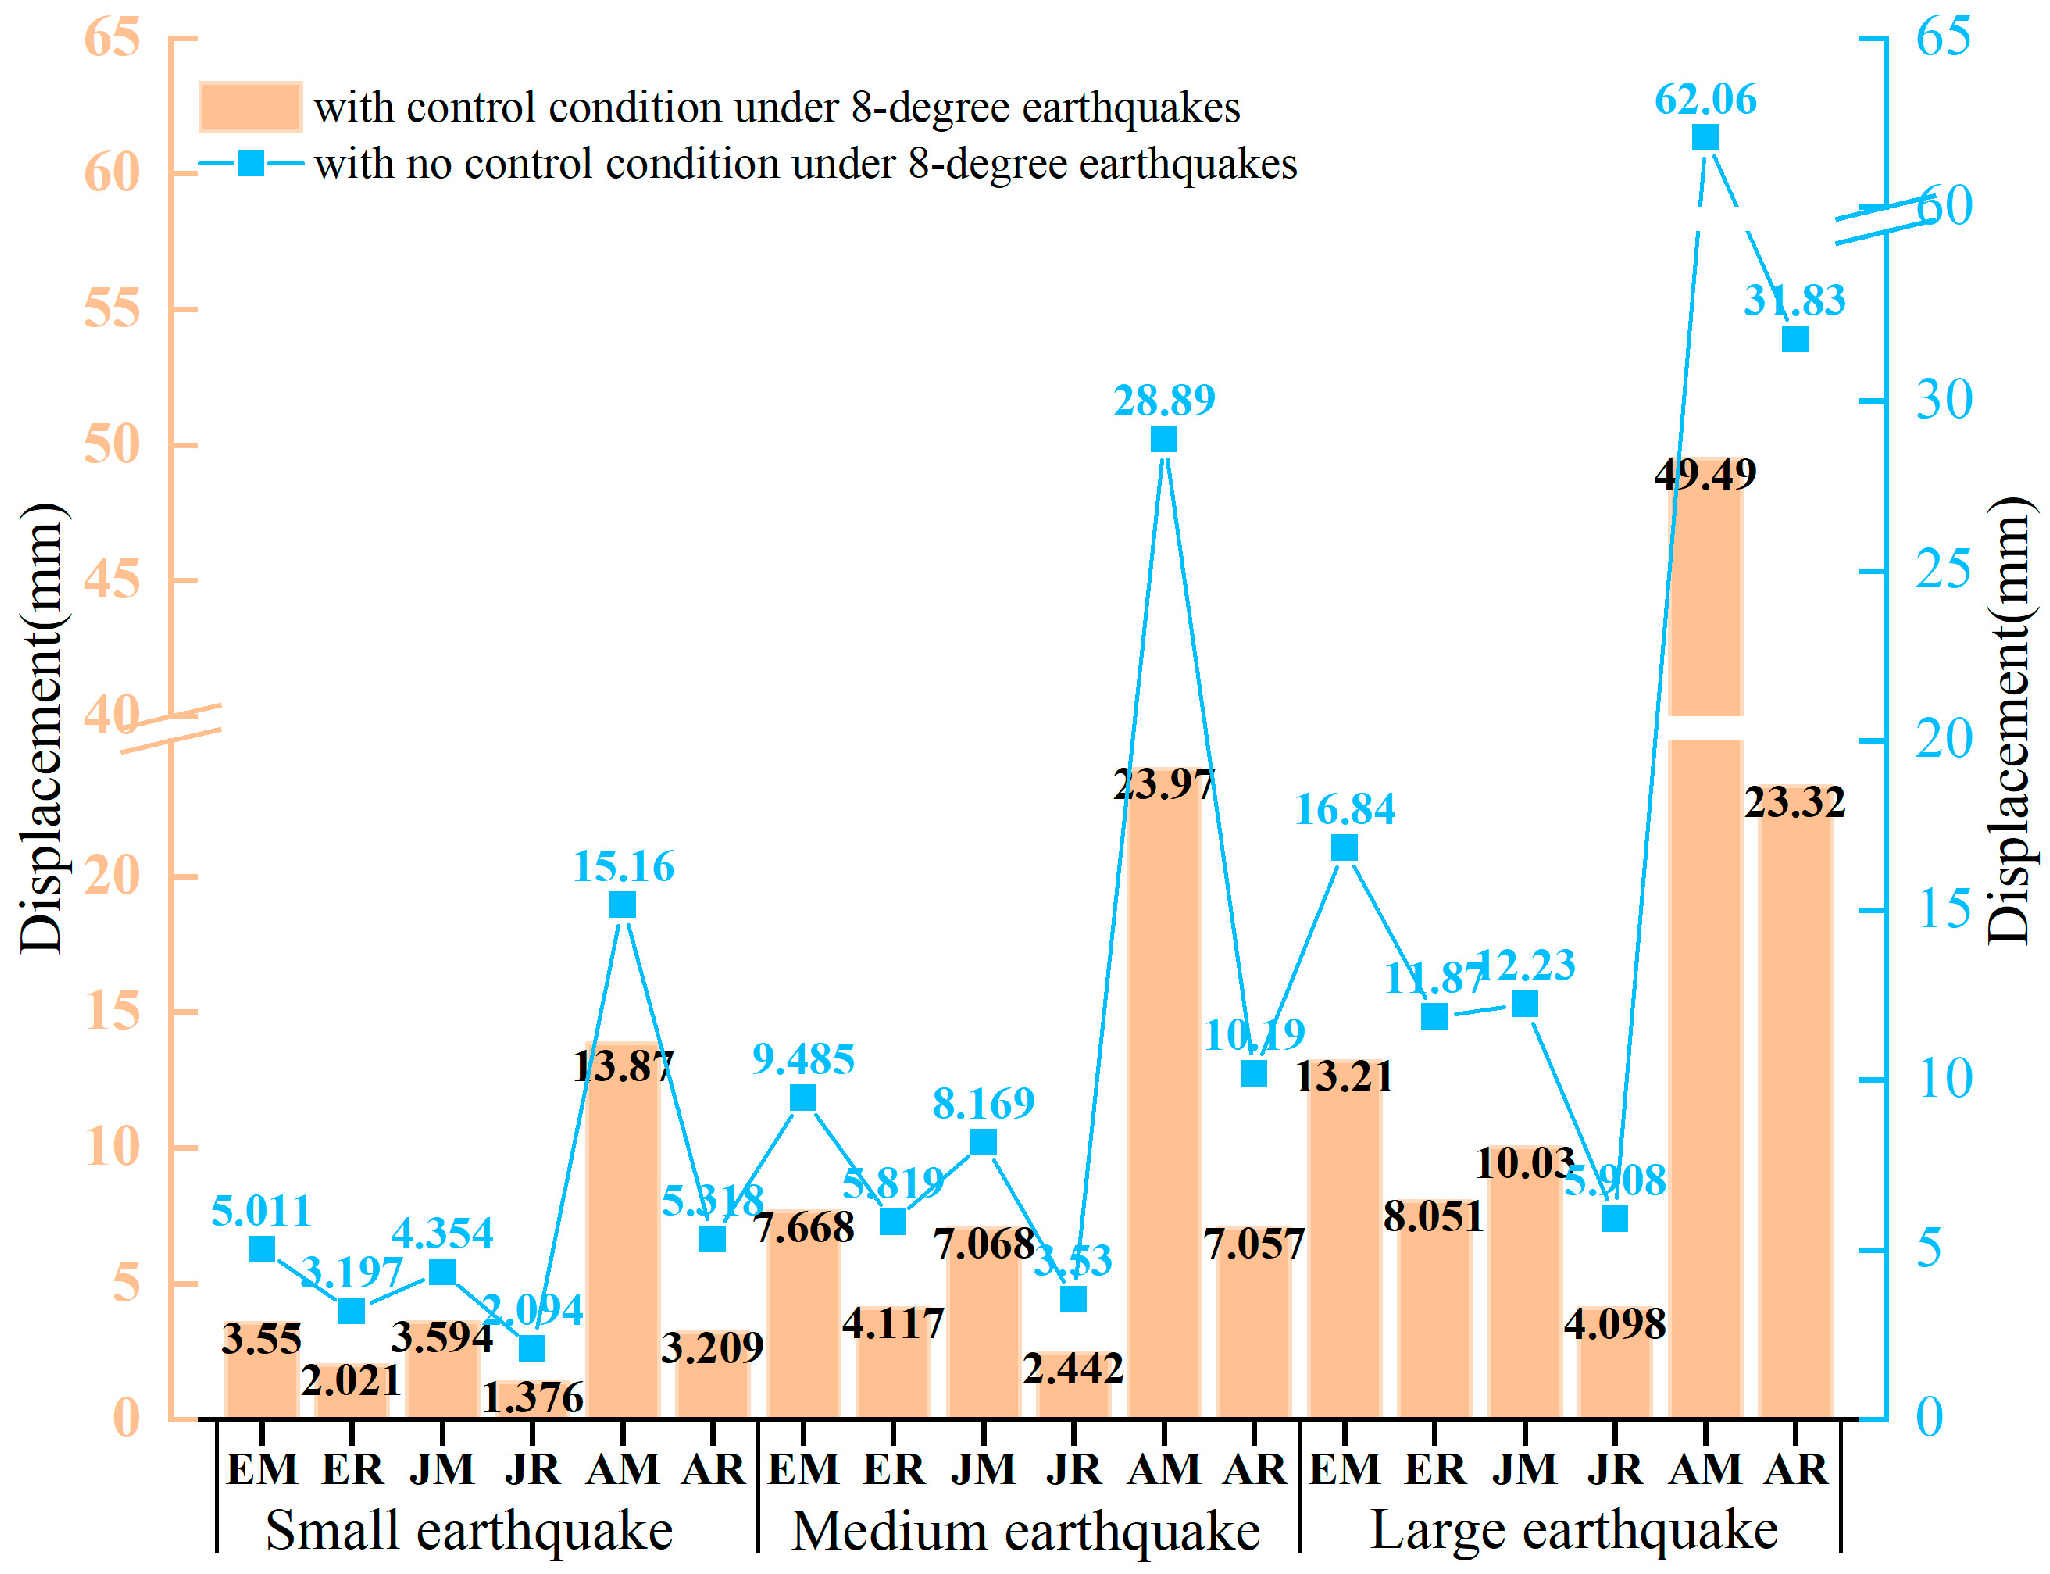
Figure 7.
The relative displacements of multiple floors of the Small Wild Goose Pagoda. (Note: in the x-coordinate, the letter E stands for “El-Centro Wave”; the letter J refers to Jiangyou Wave; the letter A stands for “Artificial Wave”; the letter M stands for “Measured displacement”; the letter R stands for “Relative Displacement”).
Figure 8.
Simulation model of the main structure of the Small Wild Goose Pagoda.
Figure 8.
Simulation model of the main structure of the Small Wild Goose Pagoda.
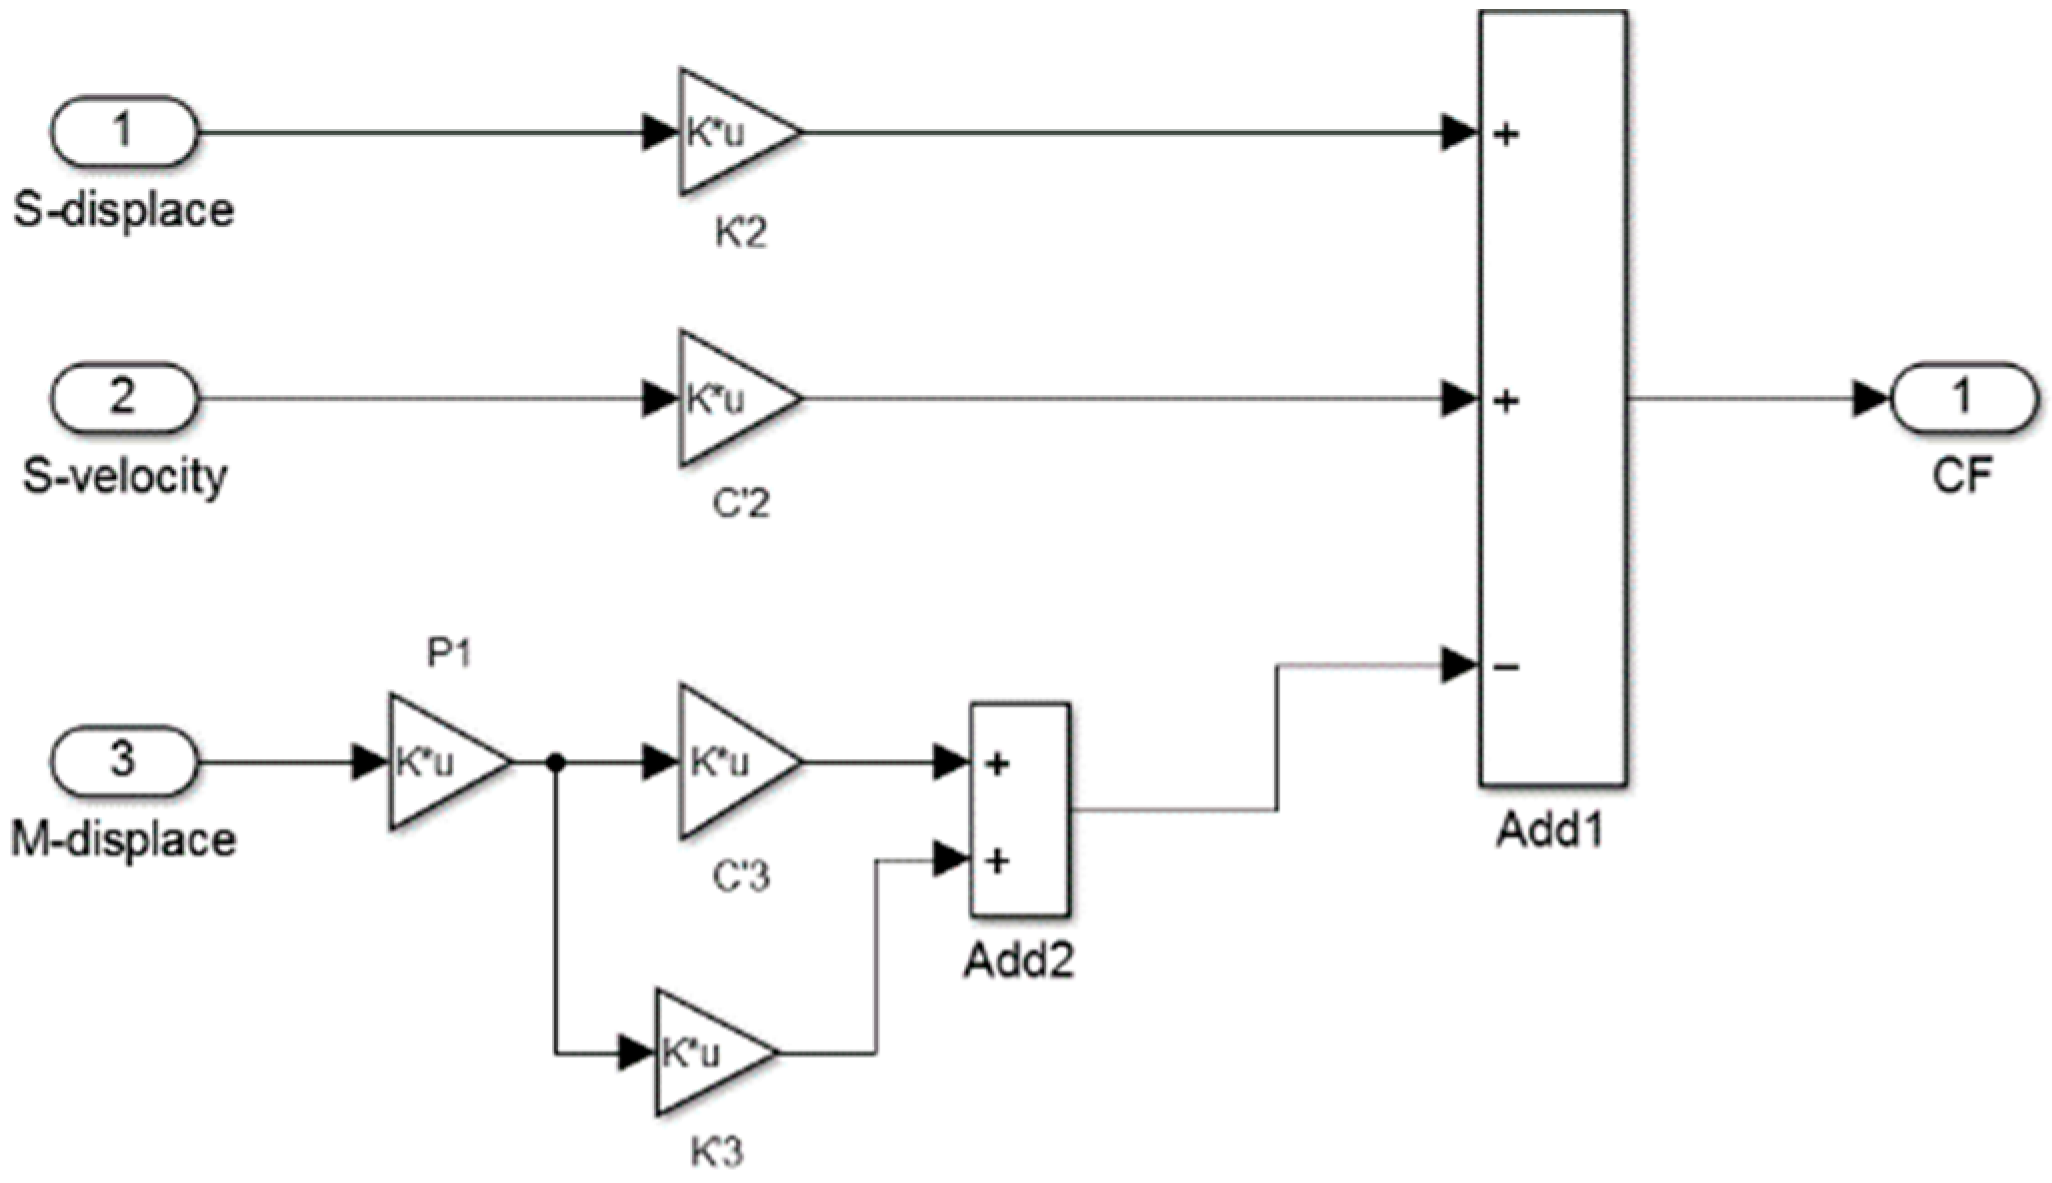
Figure 9.
Passive control force simulation model.
Figure 9.
Passive control force simulation model.
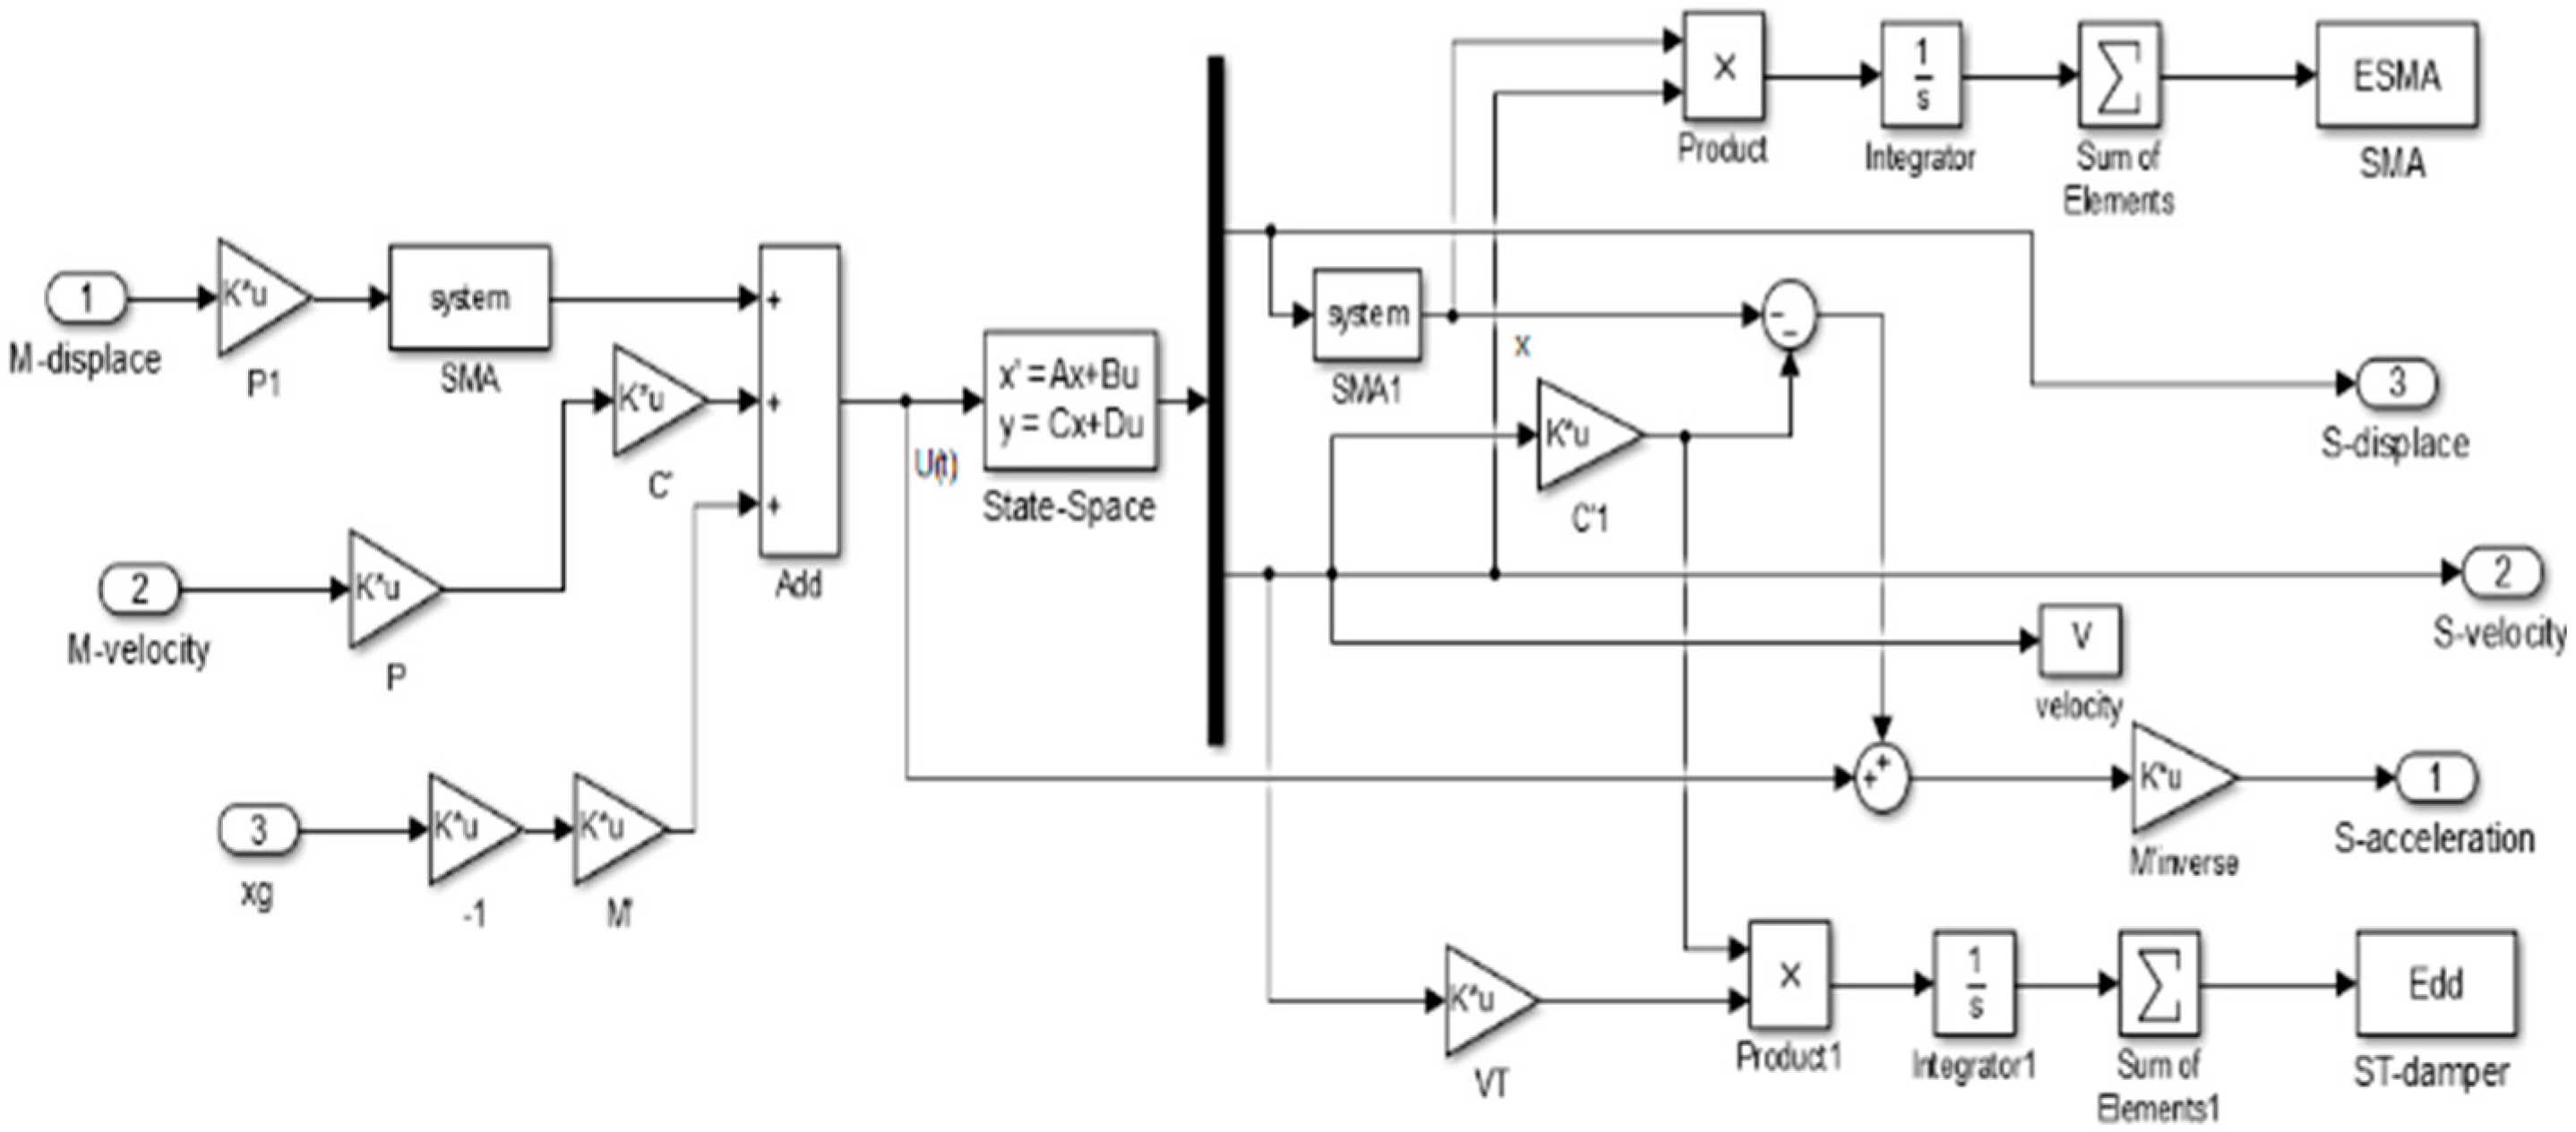
Figure 10.
SMA-SPDS simulation model.
Figure 10.
SMA-SPDS simulation model.
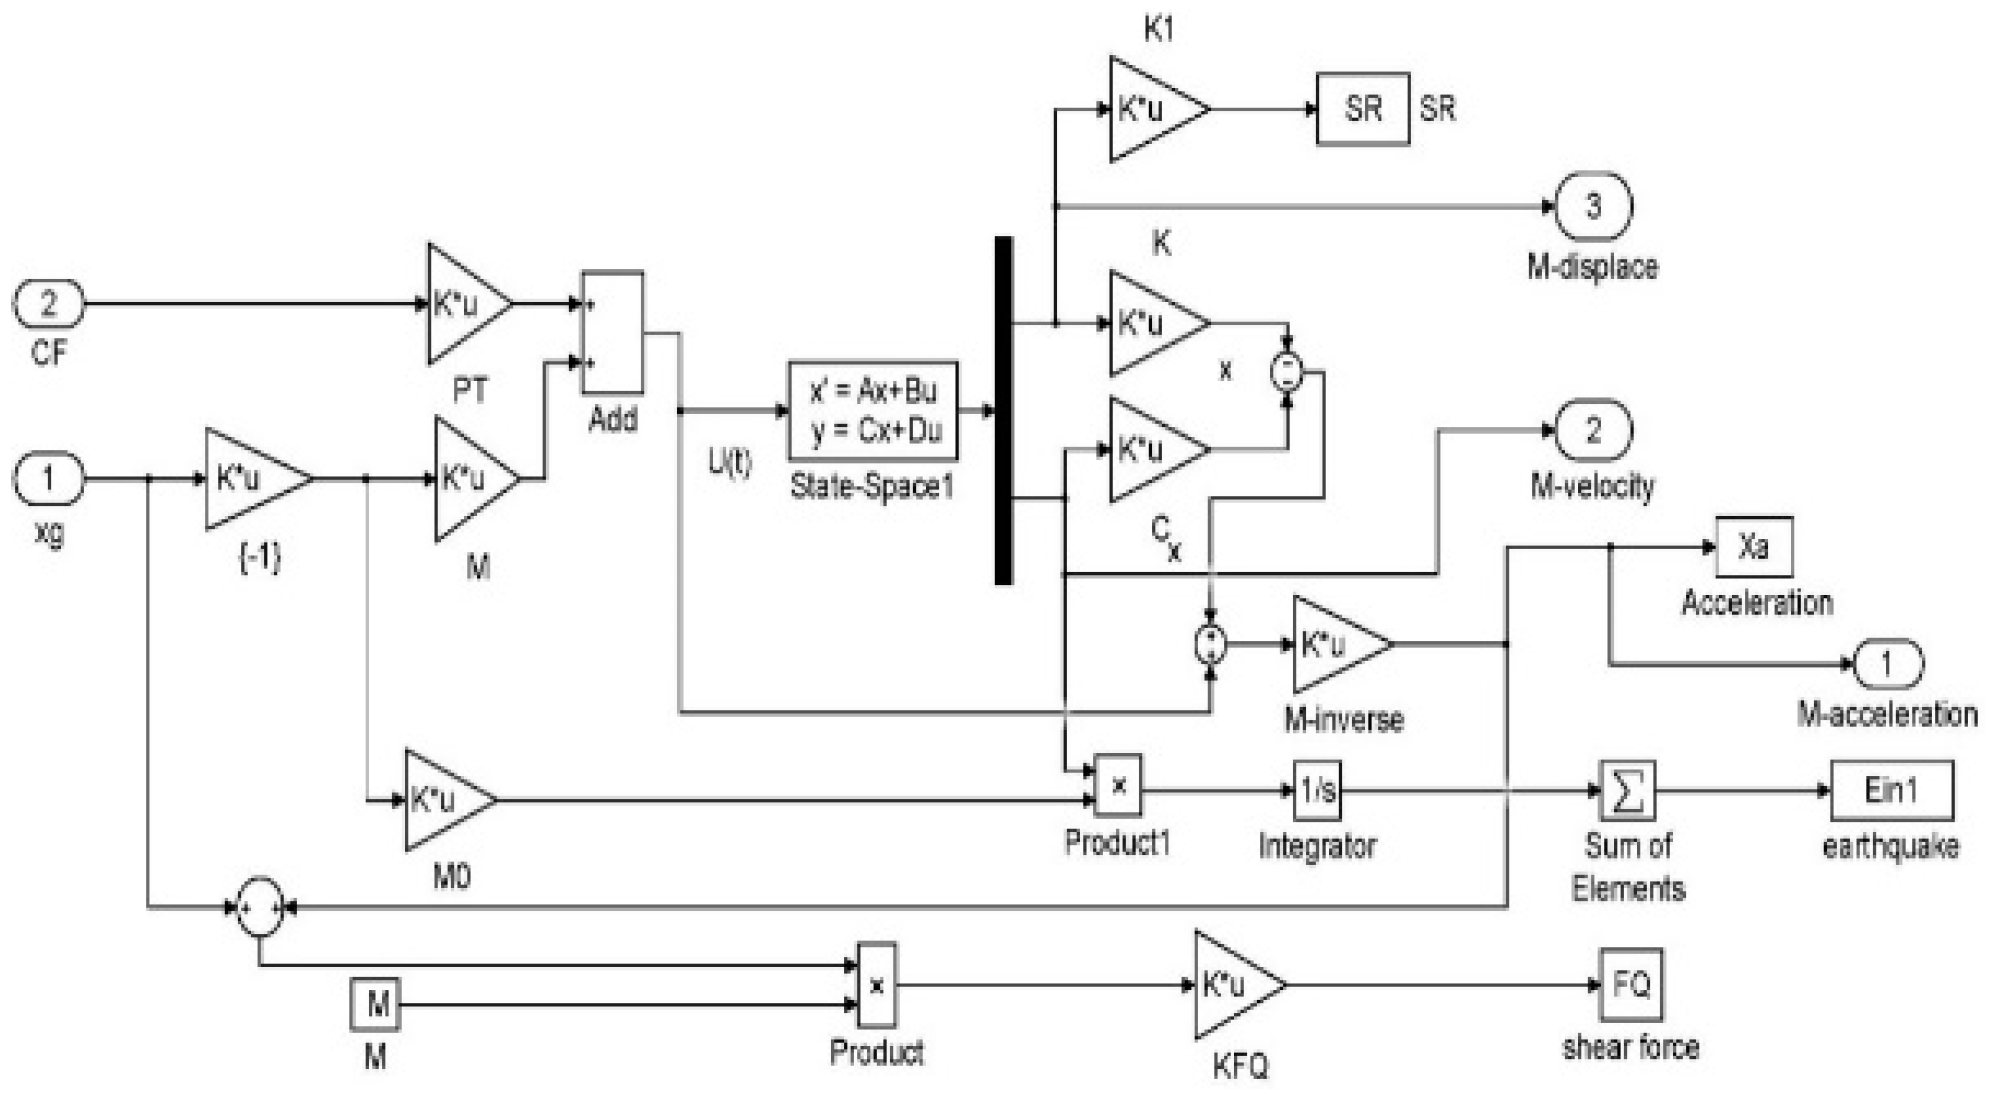
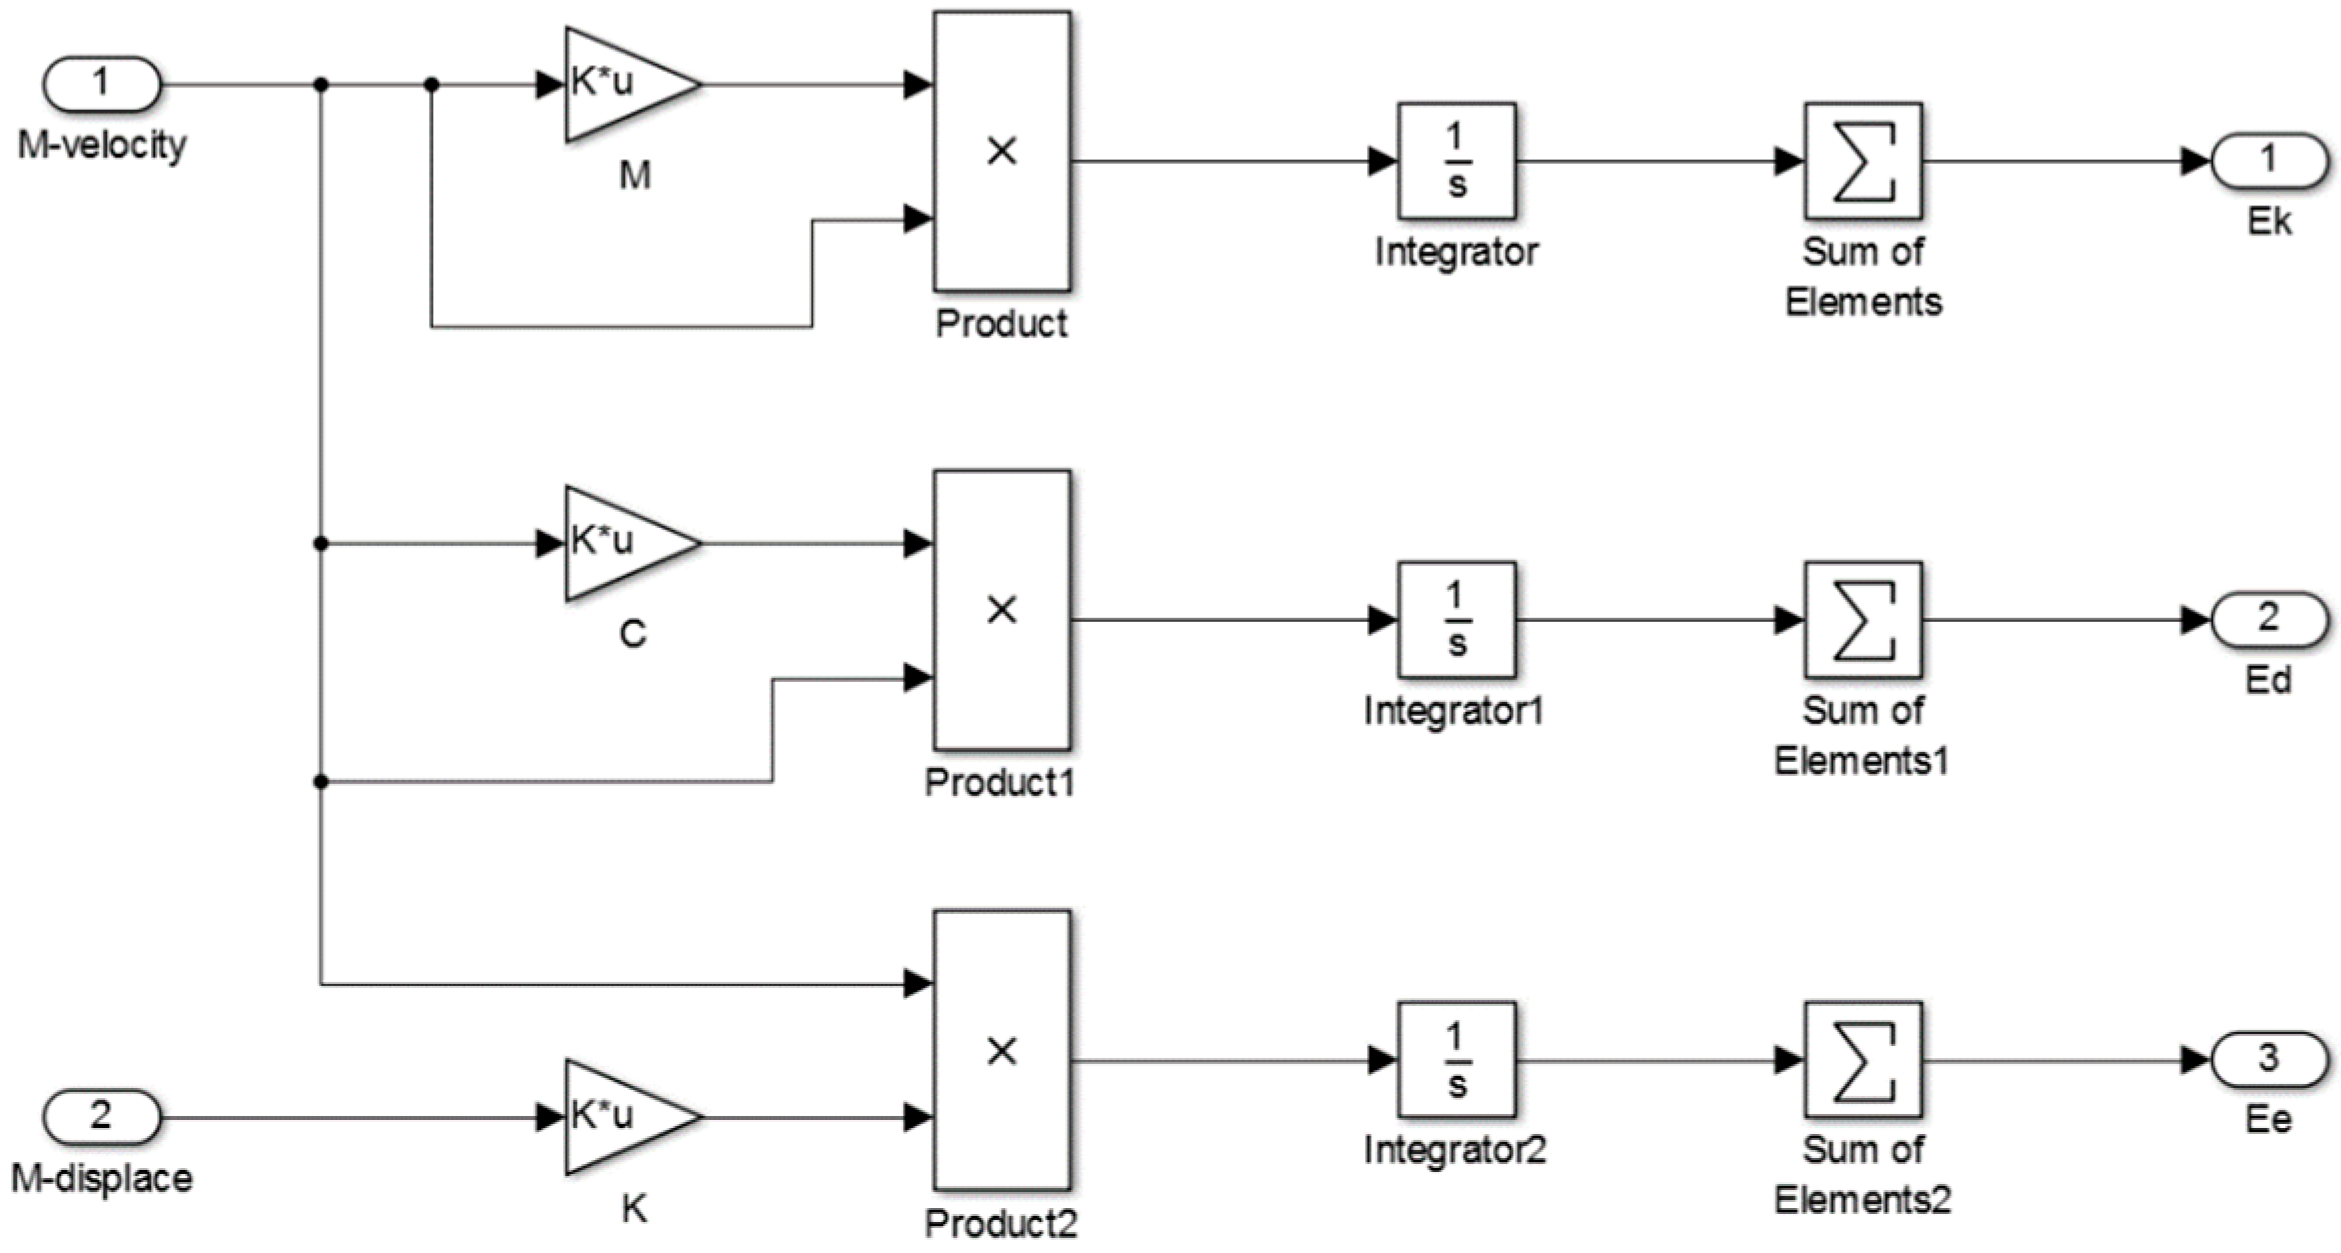
Figure 11.
Simulation model of the main structure energy response of the Small Wild Goose Pagoda.
Figure 11.
Simulation model of the main structure energy response of the Small Wild Goose Pagoda.
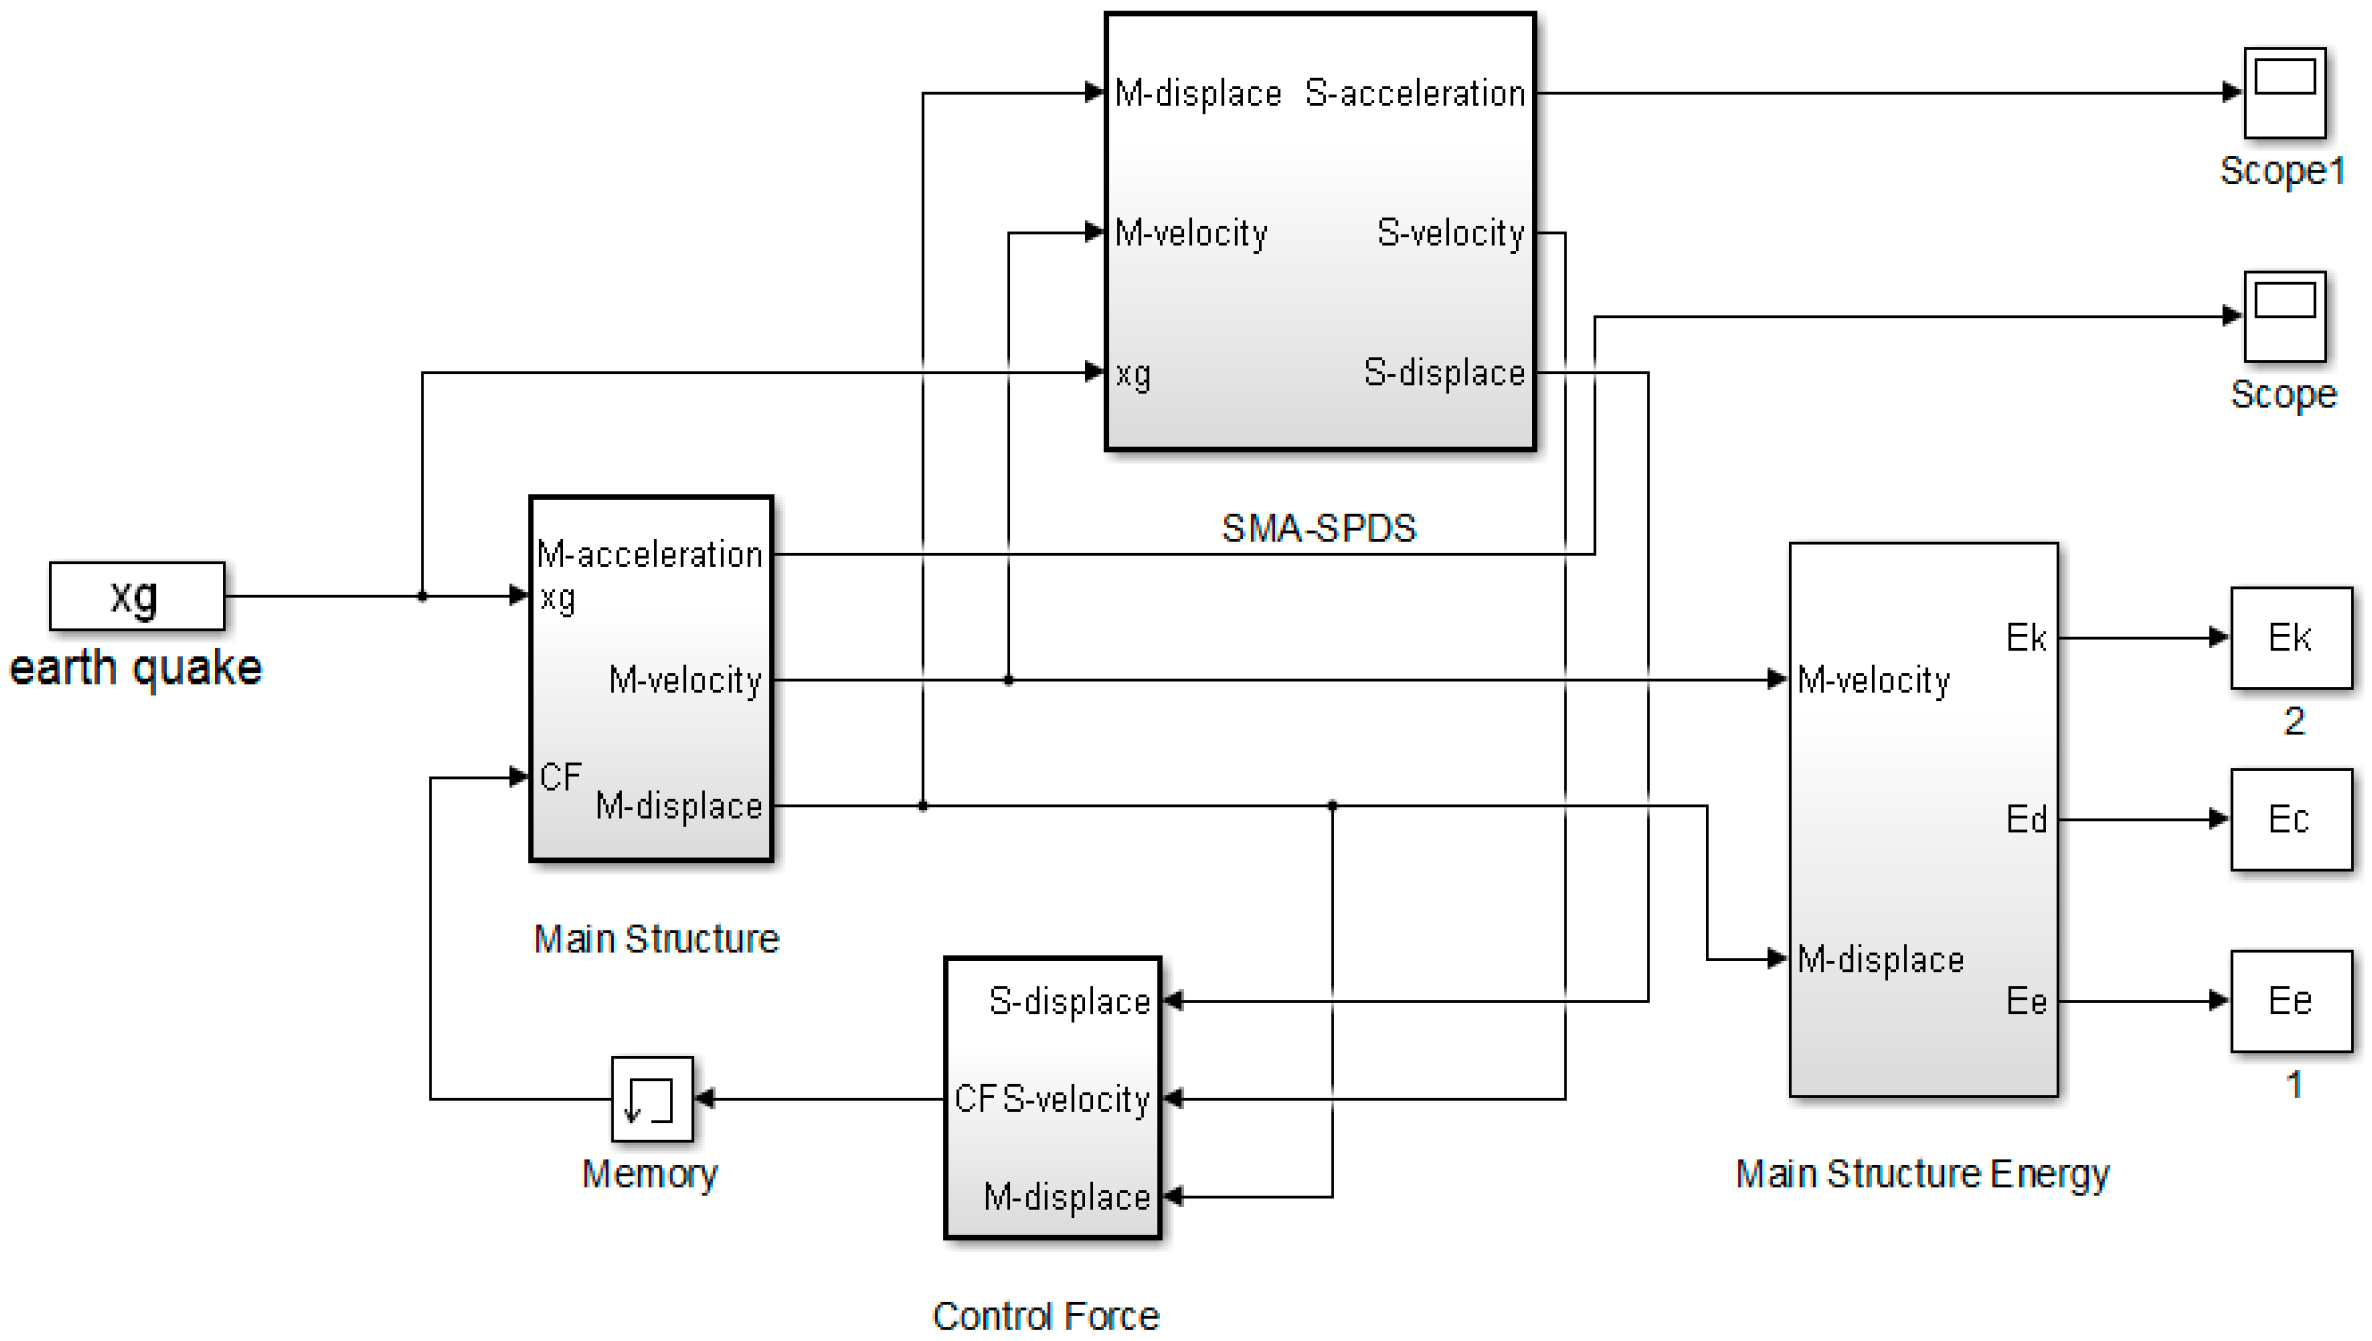
Figure 12.
Main model of the Small Wild Goose Pagoda shock absorption structure.
Figure 12.
Main model of the Small Wild Goose Pagoda shock absorption structure.
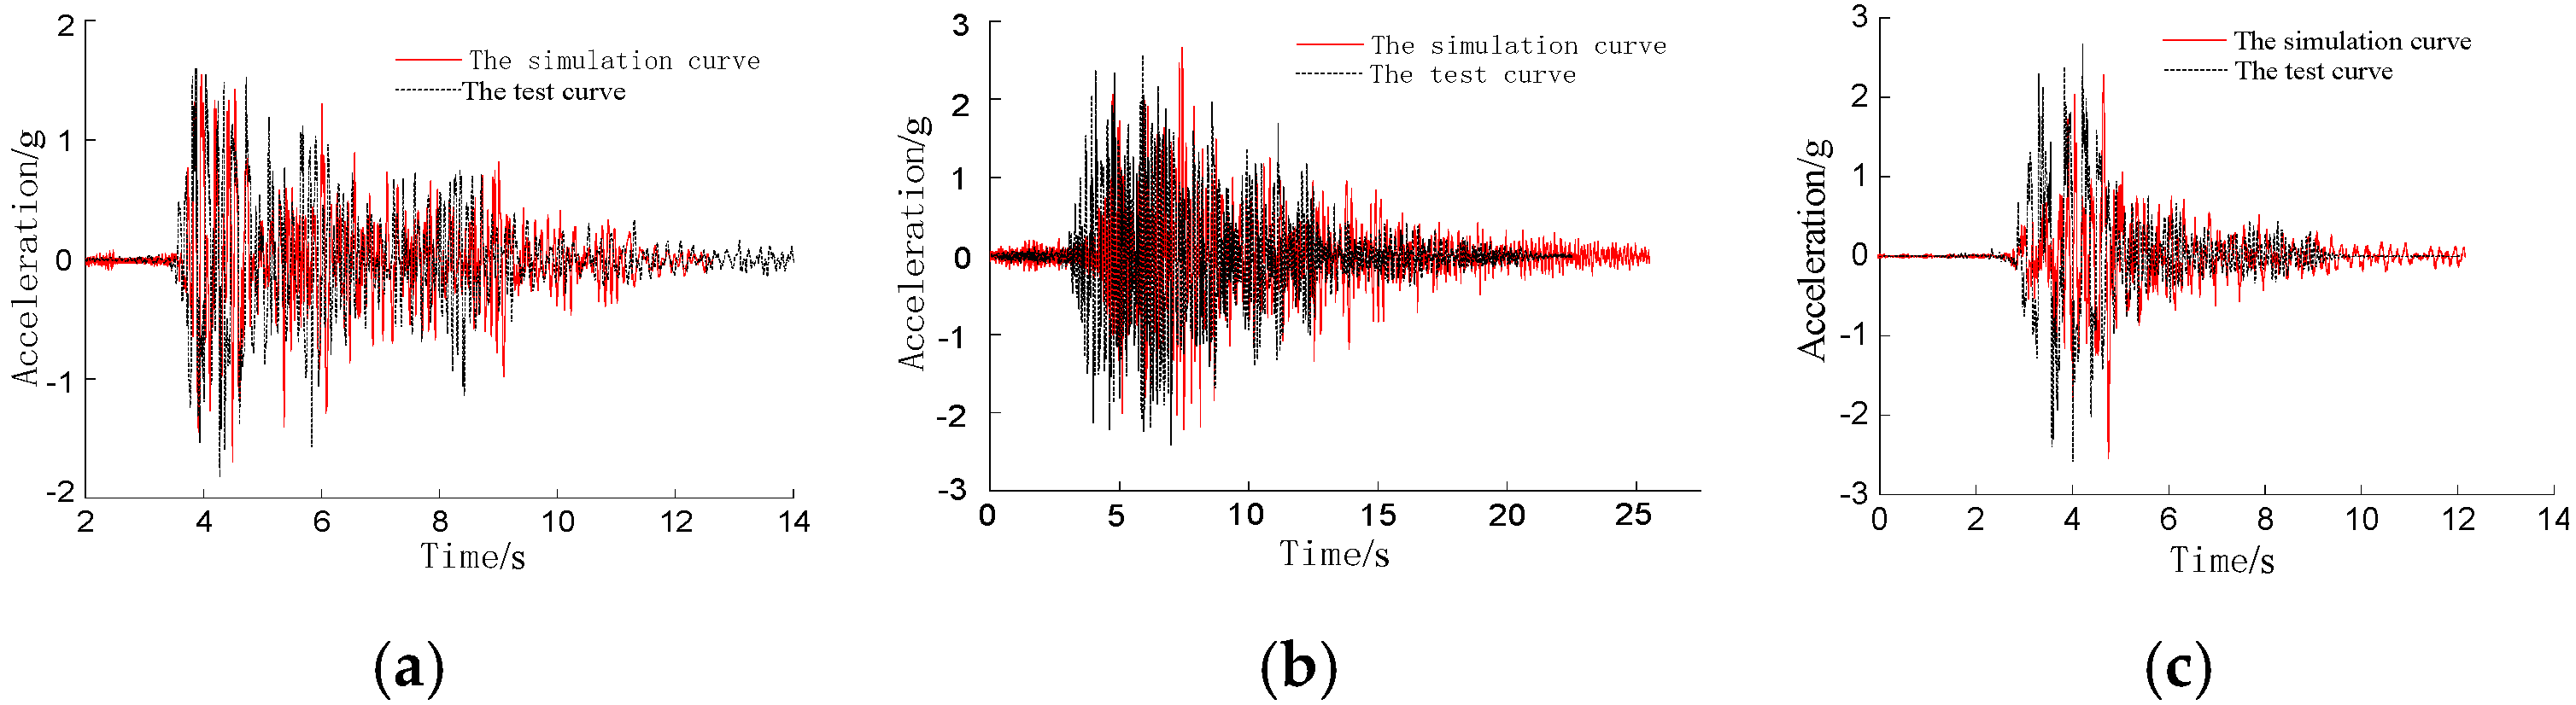
Figure 13.
Comparison diagram of the acceleration simulation and test on top of an uncontrolled tower under an 8-degree large earthquake. (a) El-Centro record. (b) Jiangyou record. (c) Artificial wave.
Figure 13.
Comparison diagram of the acceleration simulation and test on top of an uncontrolled tower under an 8-degree large earthquake. (a) El-Centro record. (b) Jiangyou record. (c) Artificial wave.
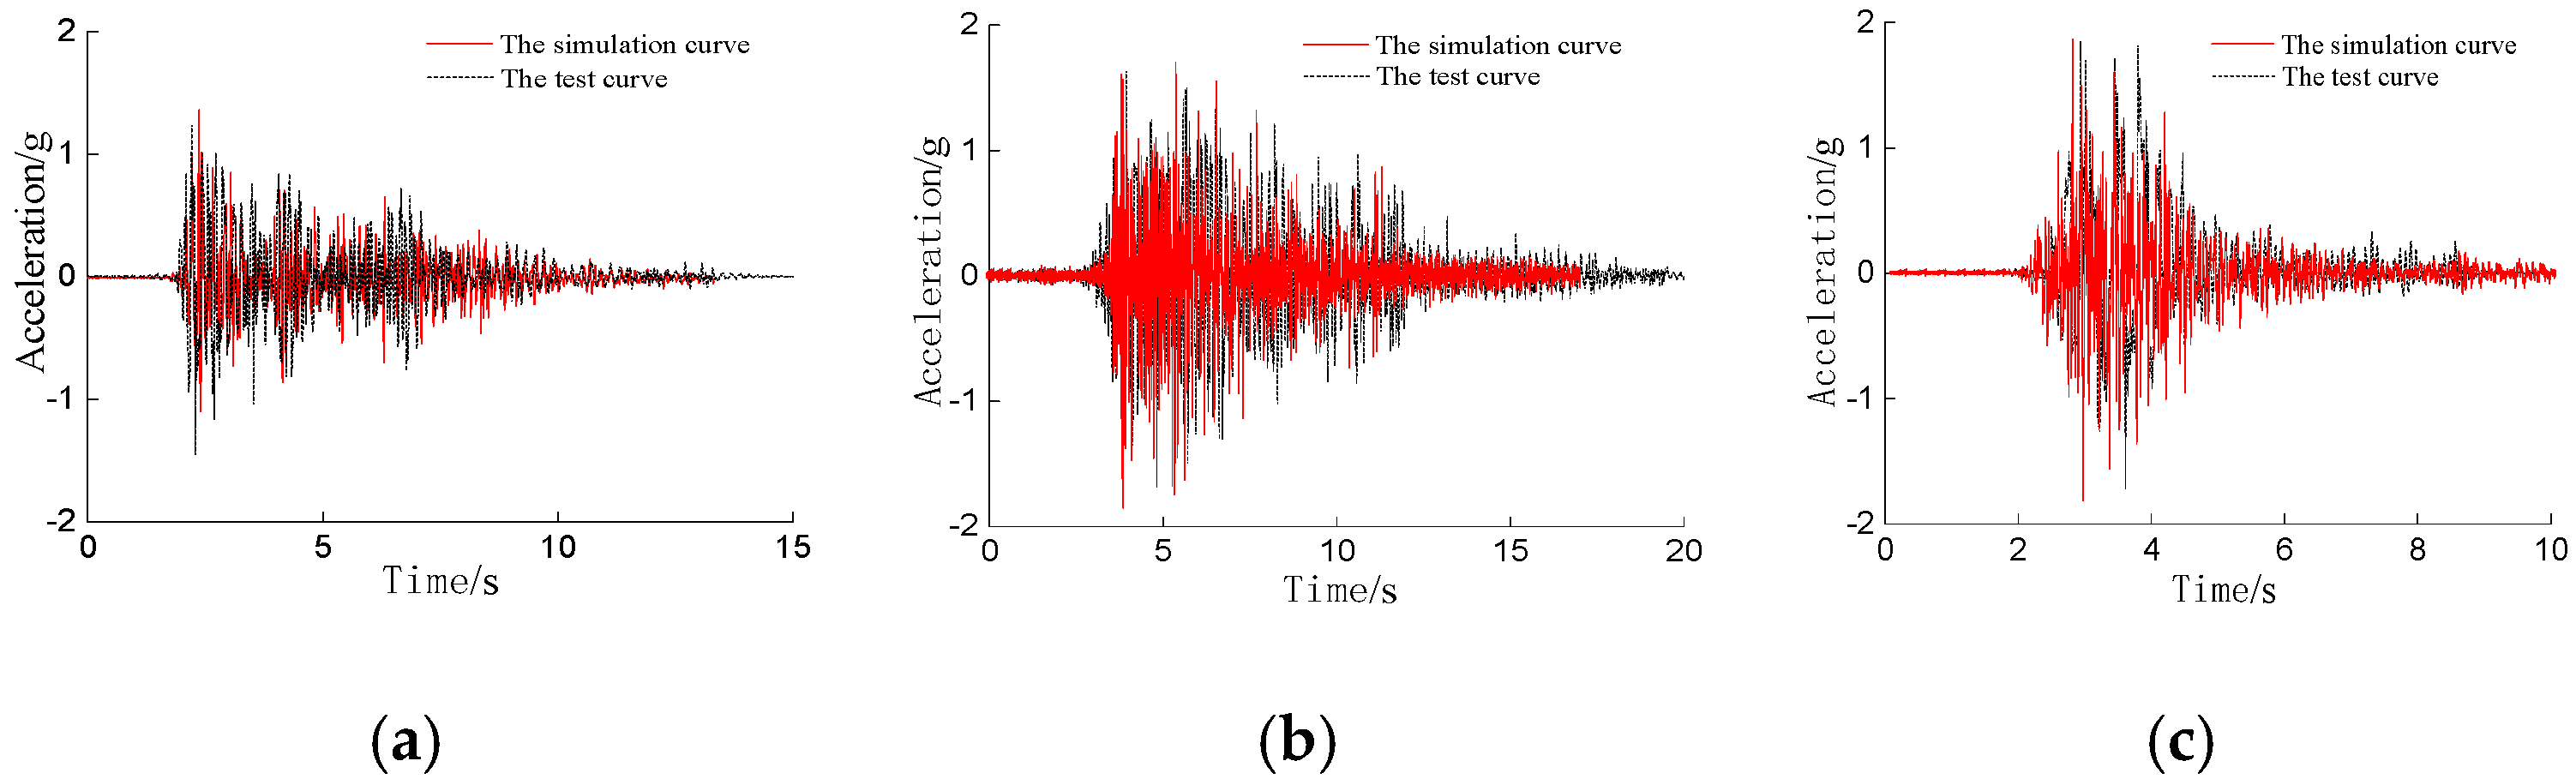
Figure 14.
Comparison diagram of the acceleration simulation and test on top of a controlled tower under an 8-degree large earthquake. (a) El-Centro record. (b) Jiangyou record. (c) Artificial wave.
Figure 14.
Comparison diagram of the acceleration simulation and test on top of a controlled tower under an 8-degree large earthquake. (a) El-Centro record. (b) Jiangyou record. (c) Artificial wave.
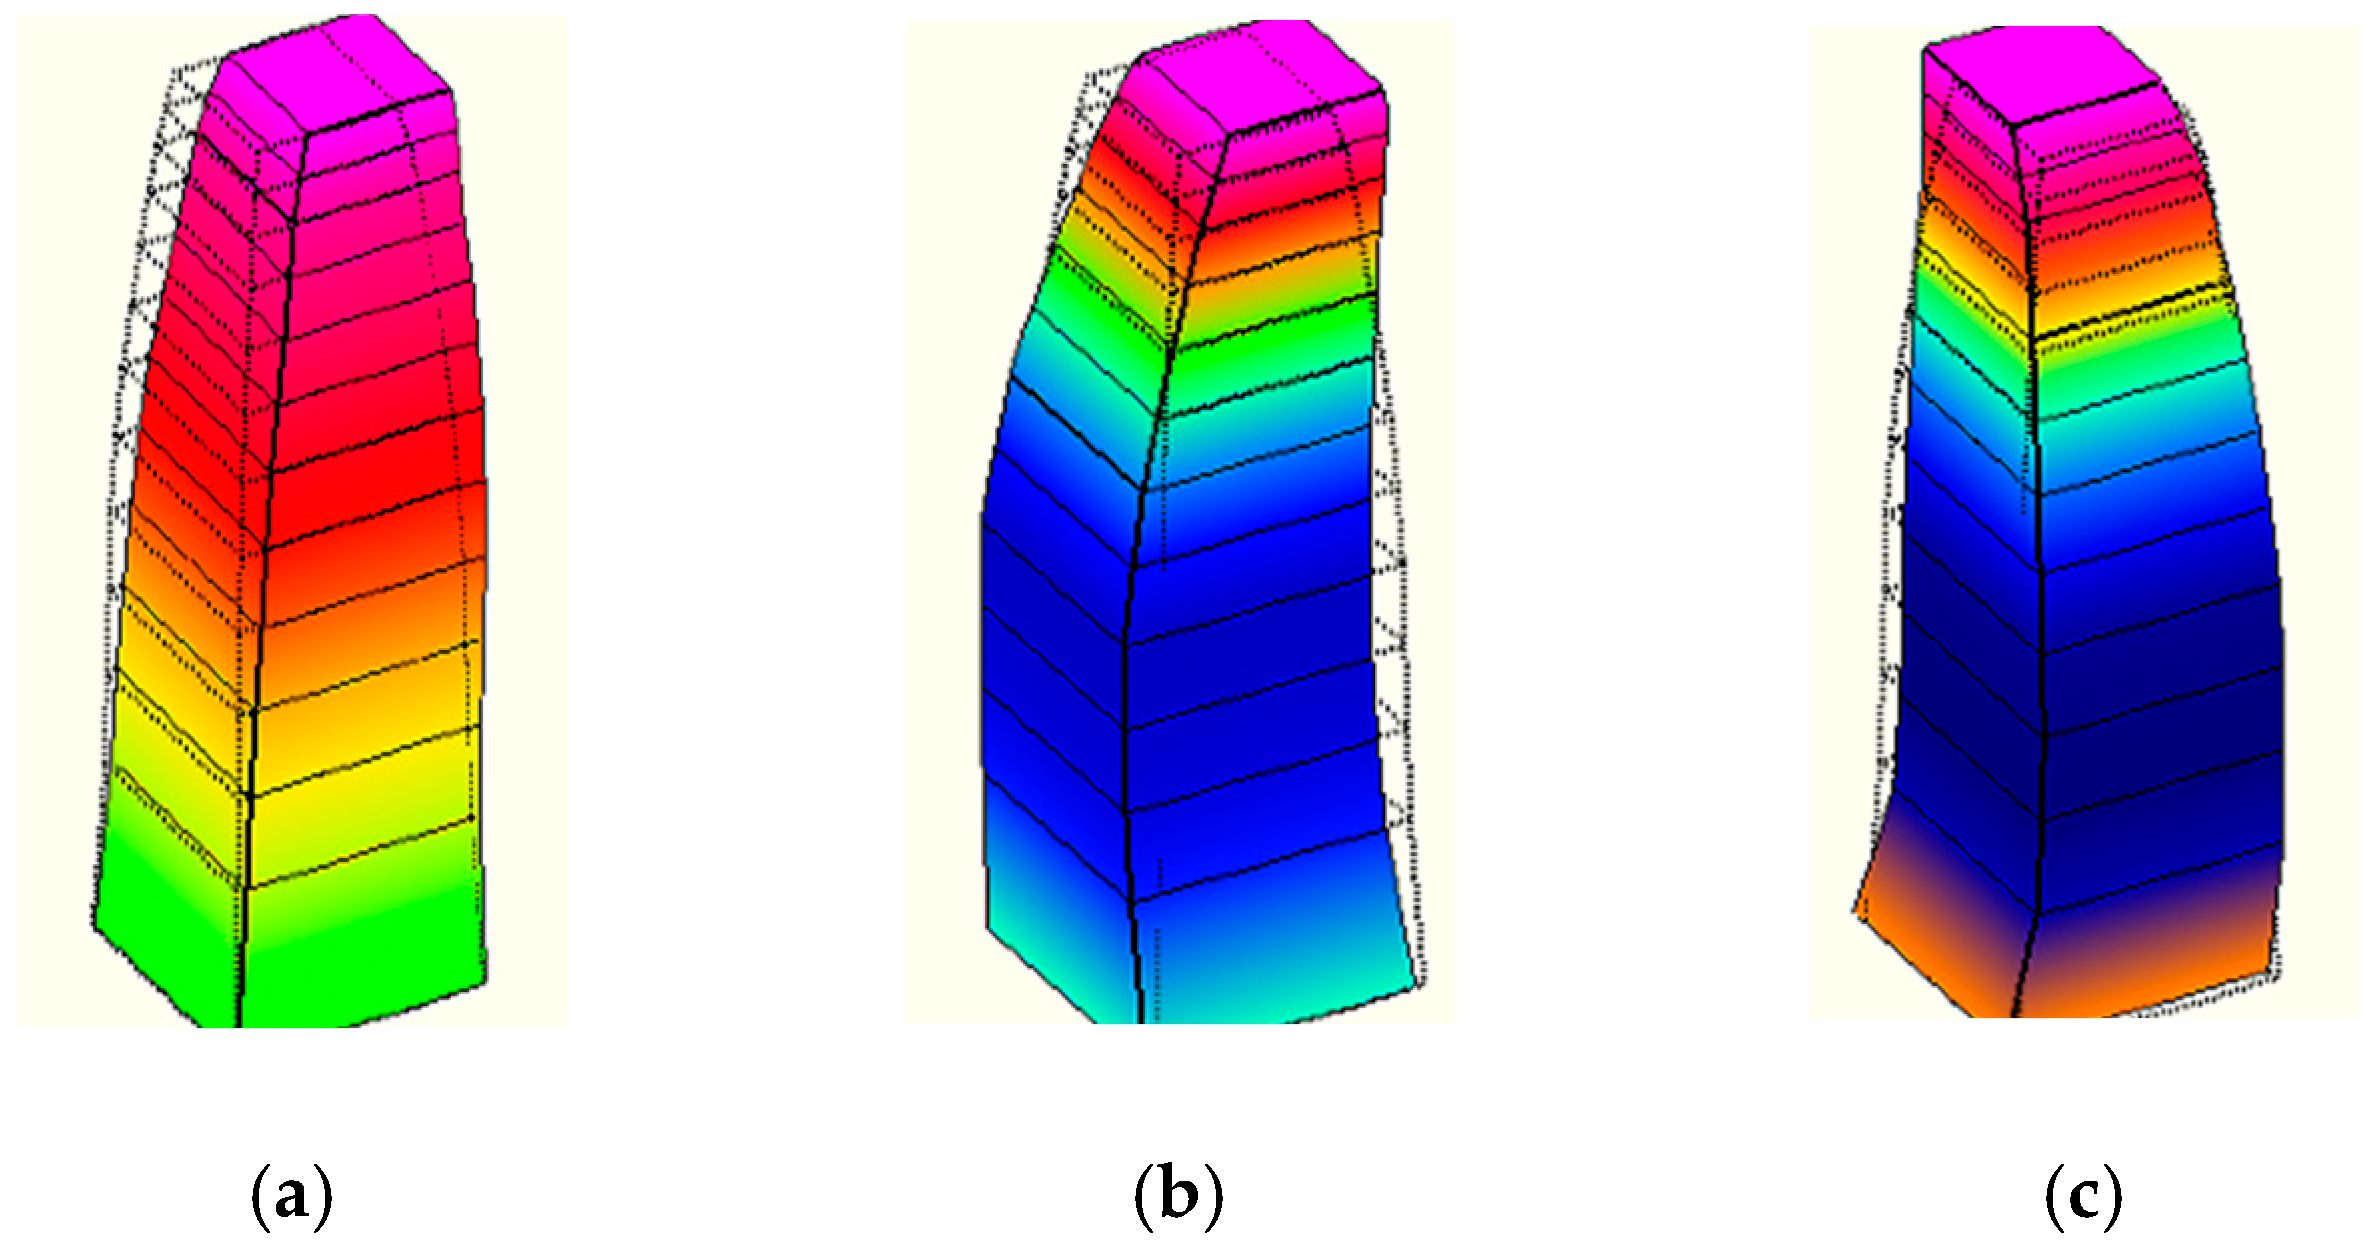
Figure 15.
Mode modal diagram of the Small Wild Goose Pagoda. (a) First-level mode. (b) Second-level mode. (c) Third-level mode. (Note: the color change of each mode only indicates the amplitude change of that mode).
Figure 15.
Mode modal diagram of the Small Wild Goose Pagoda. (a) First-level mode. (b) Second-level mode. (c) Third-level mode. (Note: the color change of each mode only indicates the amplitude change of that mode).
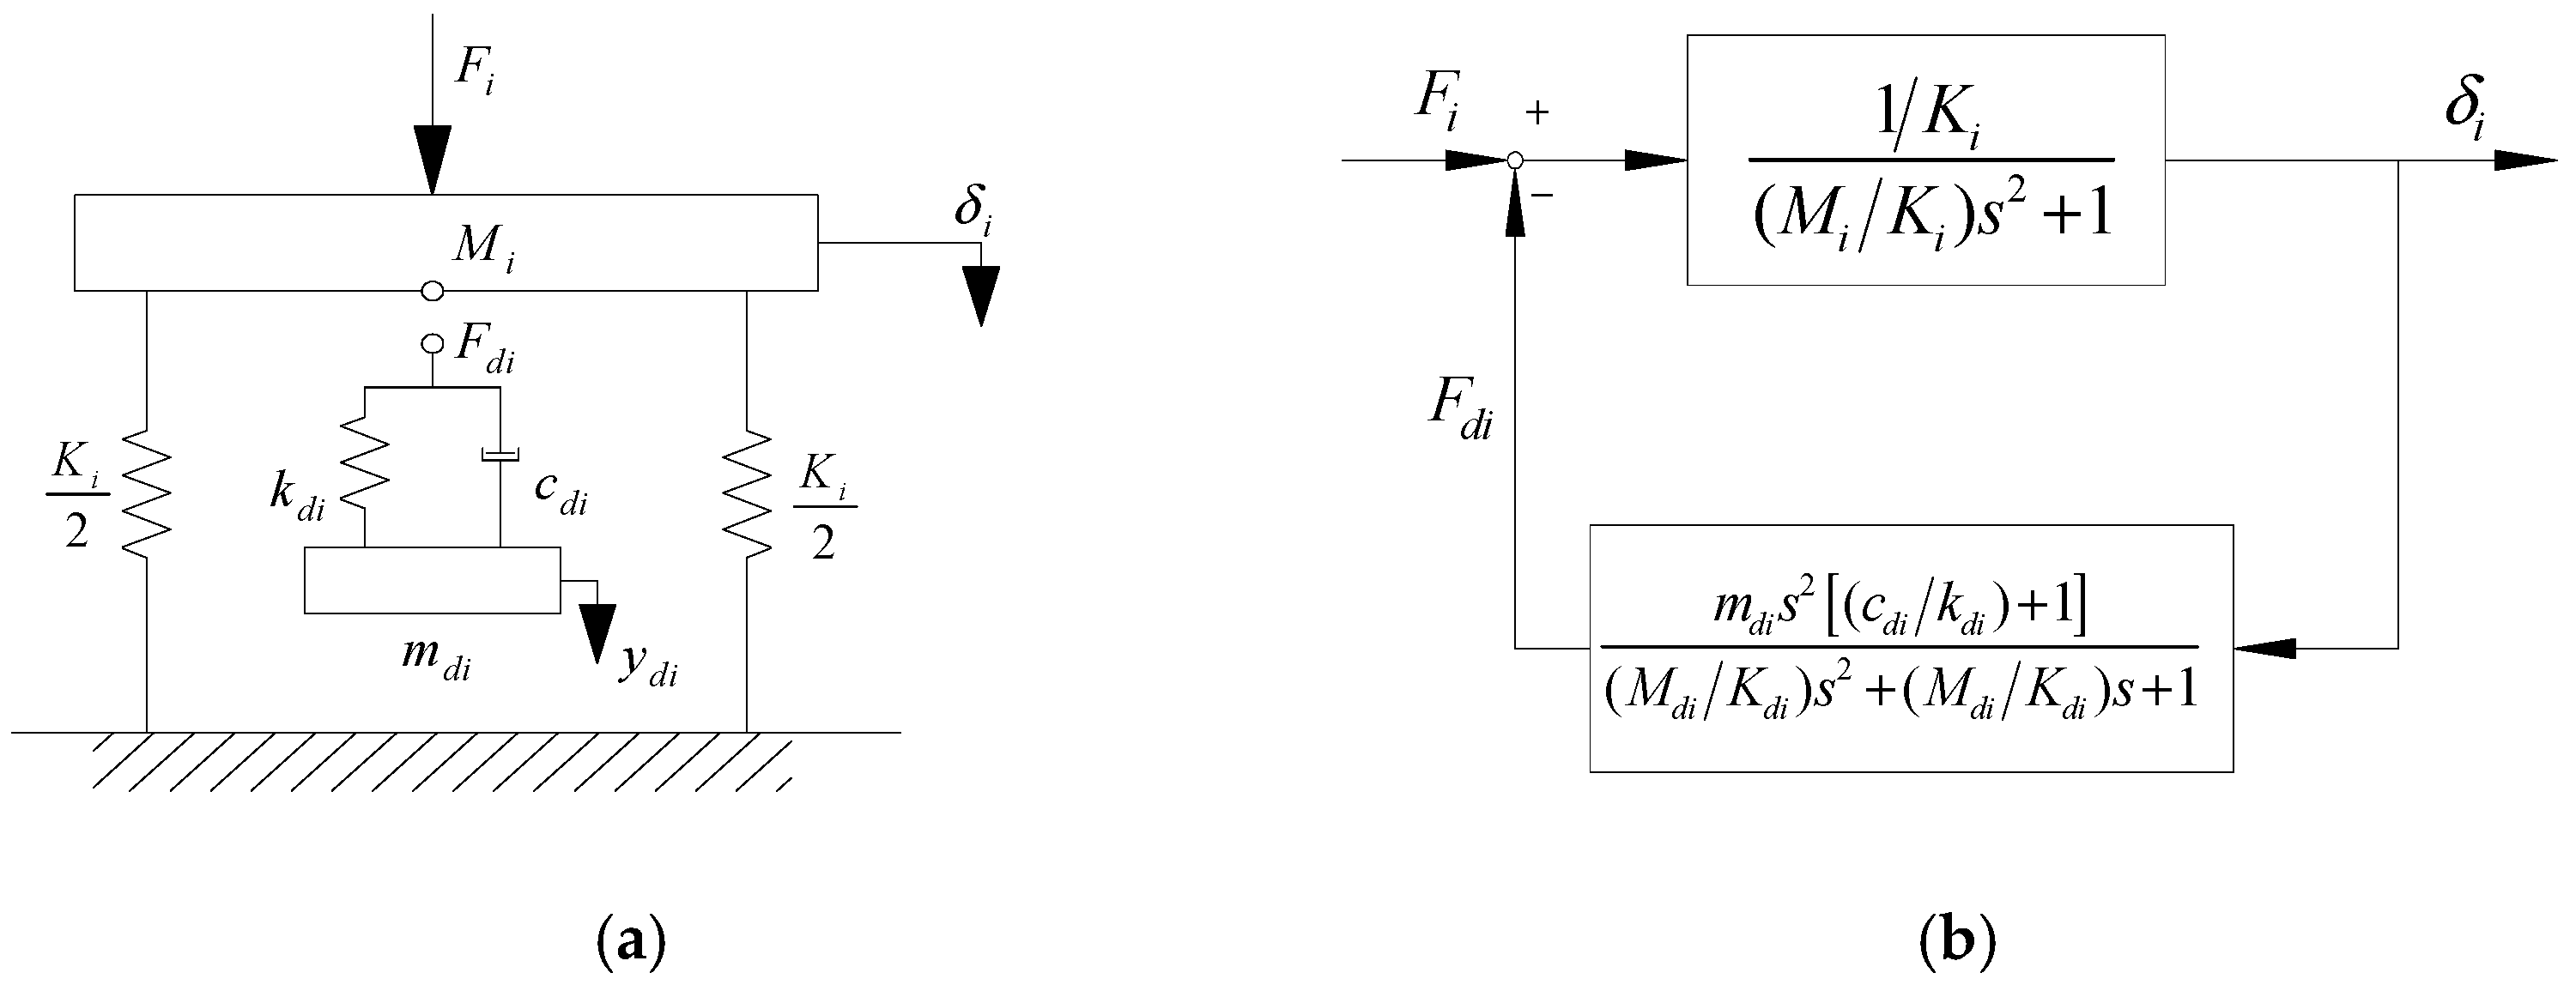
Figure 16.
A simplified model diagram of the vibration reduction system is added to the single-degree-of-freedom system of the i-th Mode. (a) Mechanical model. (b) Control flow chart.
Figure 16.
A simplified model diagram of the vibration reduction system is added to the single-degree-of-freedom system of the i-th Mode. (a) Mechanical model. (b) Control flow chart.
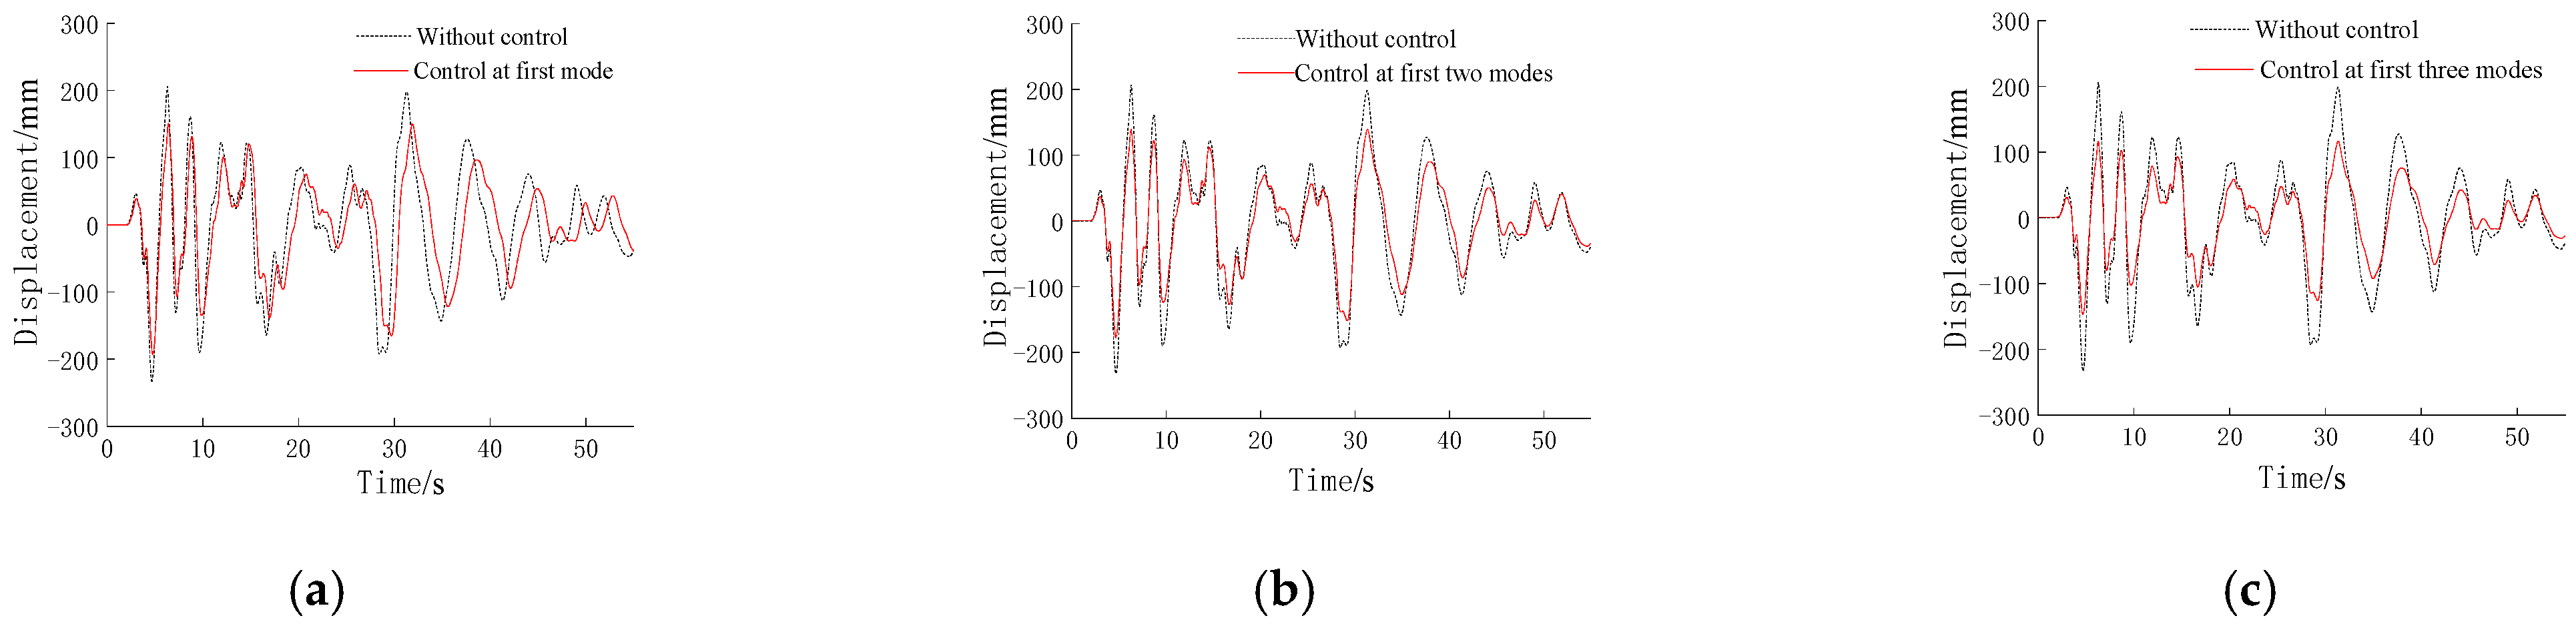
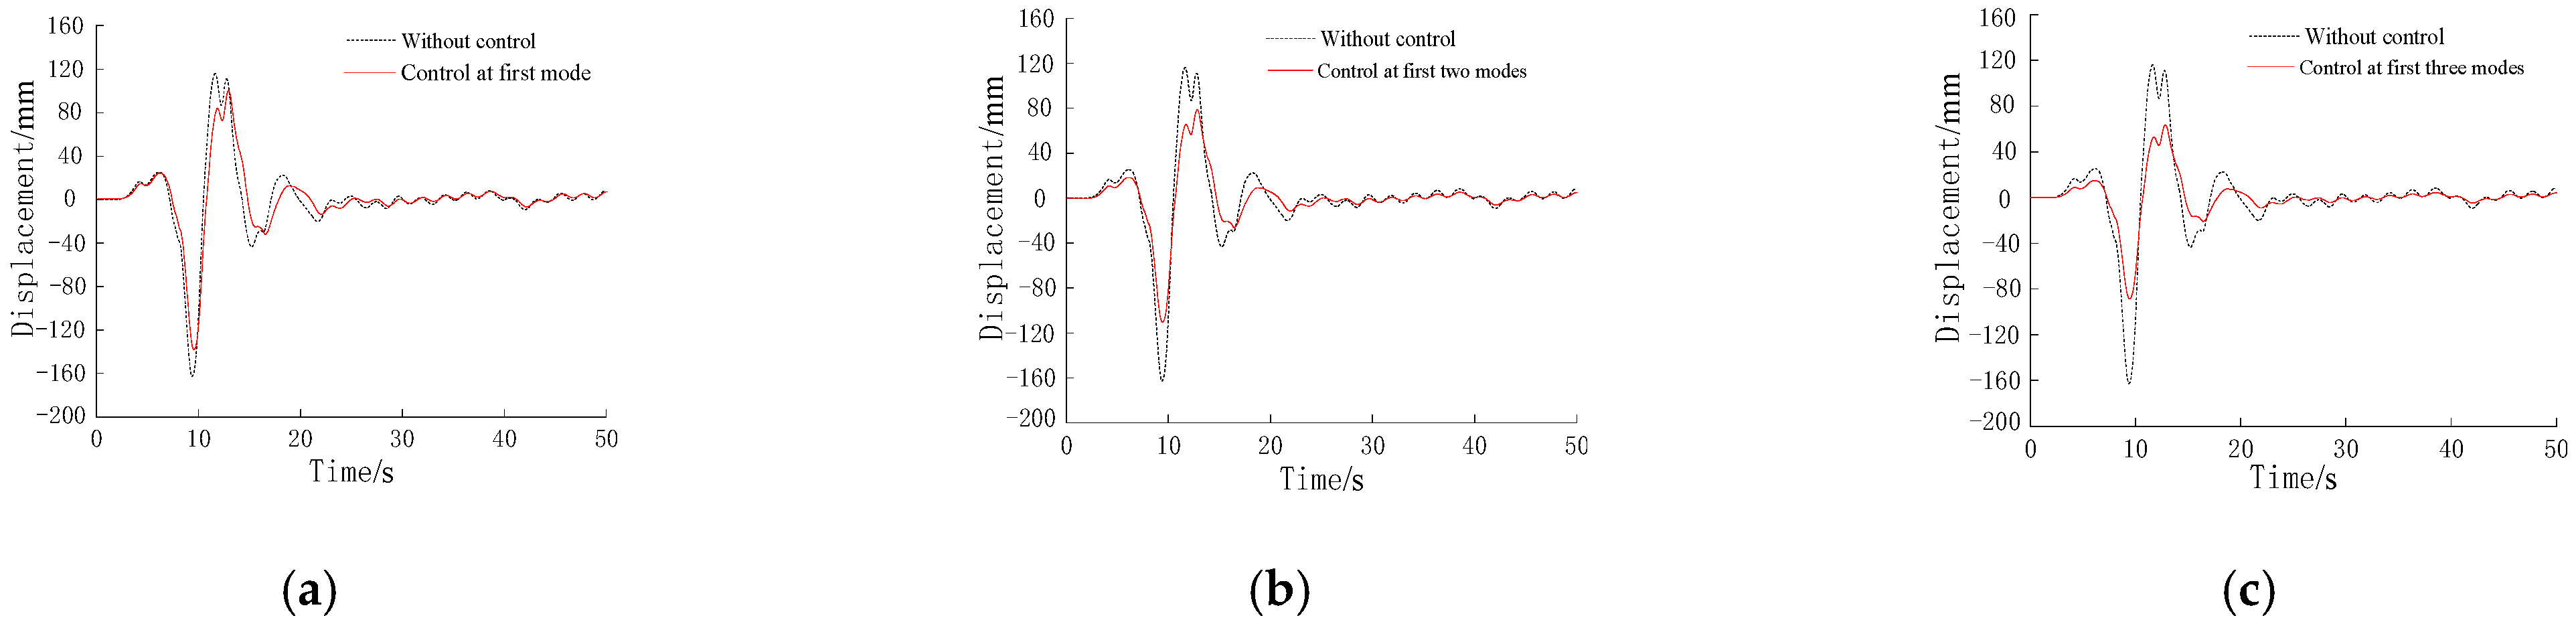
Figure 17.
Time history of displacement by optimized control at different modes under the El-Centro seismic record. (a) First mode. (b) First two modes. (c) First three modes.
Figure 17.
Time history of displacement by optimized control at different modes under the El-Centro seismic record. (a) First mode. (b) First two modes. (c) First three modes.
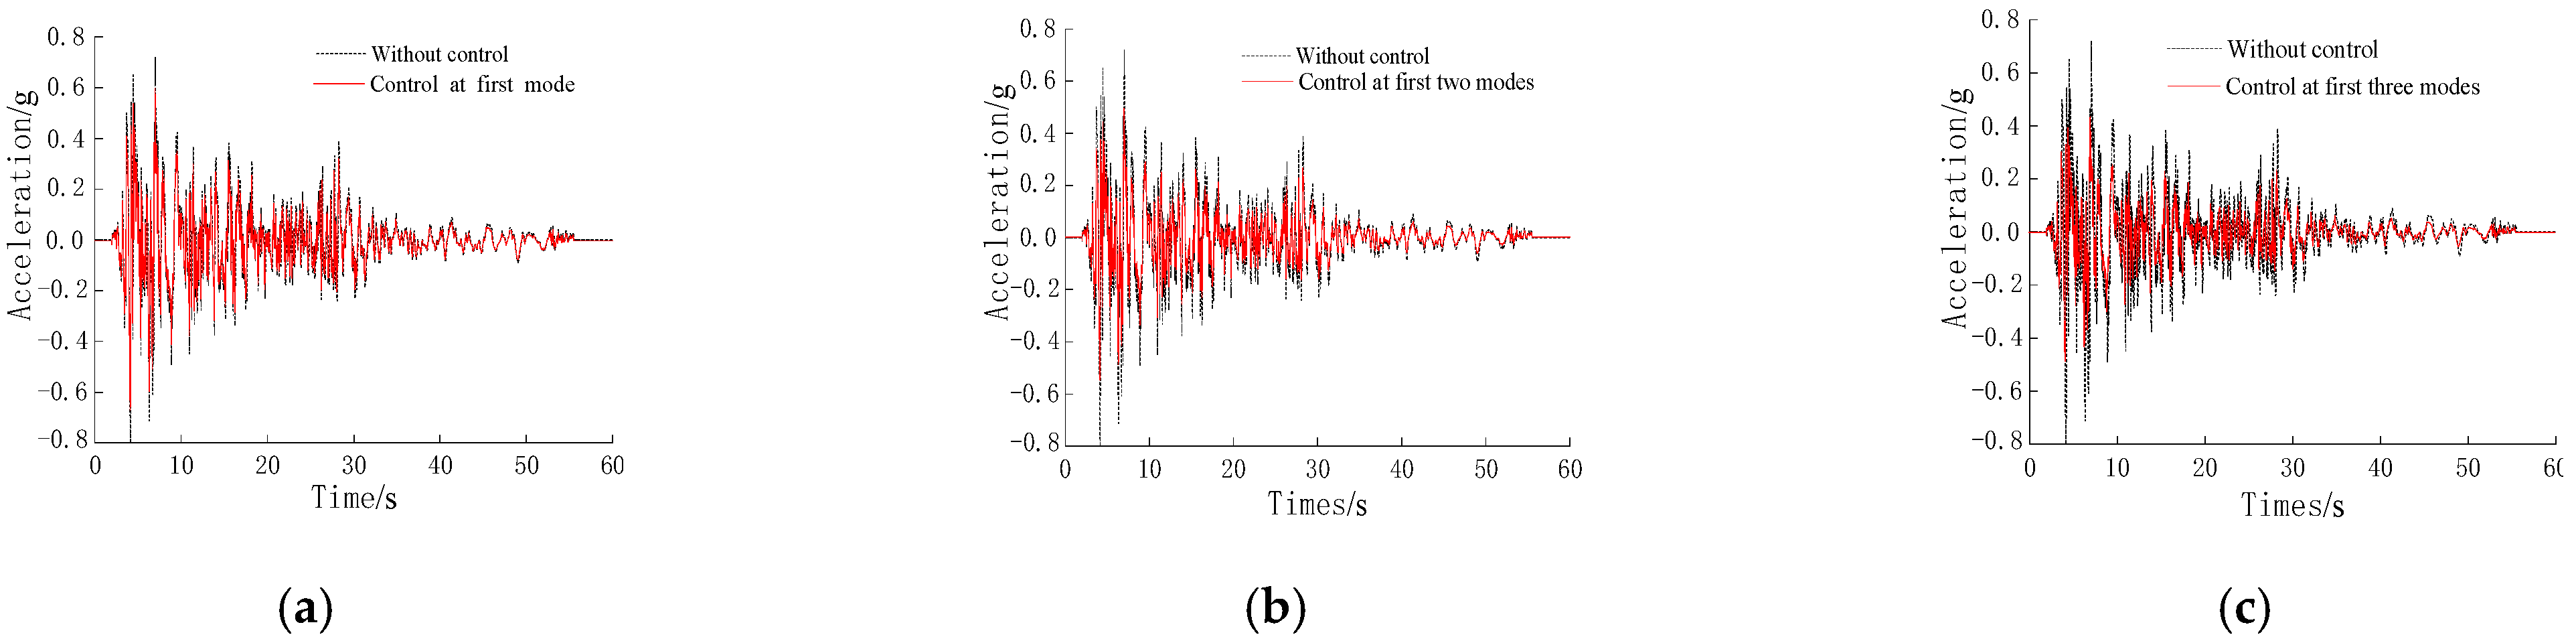
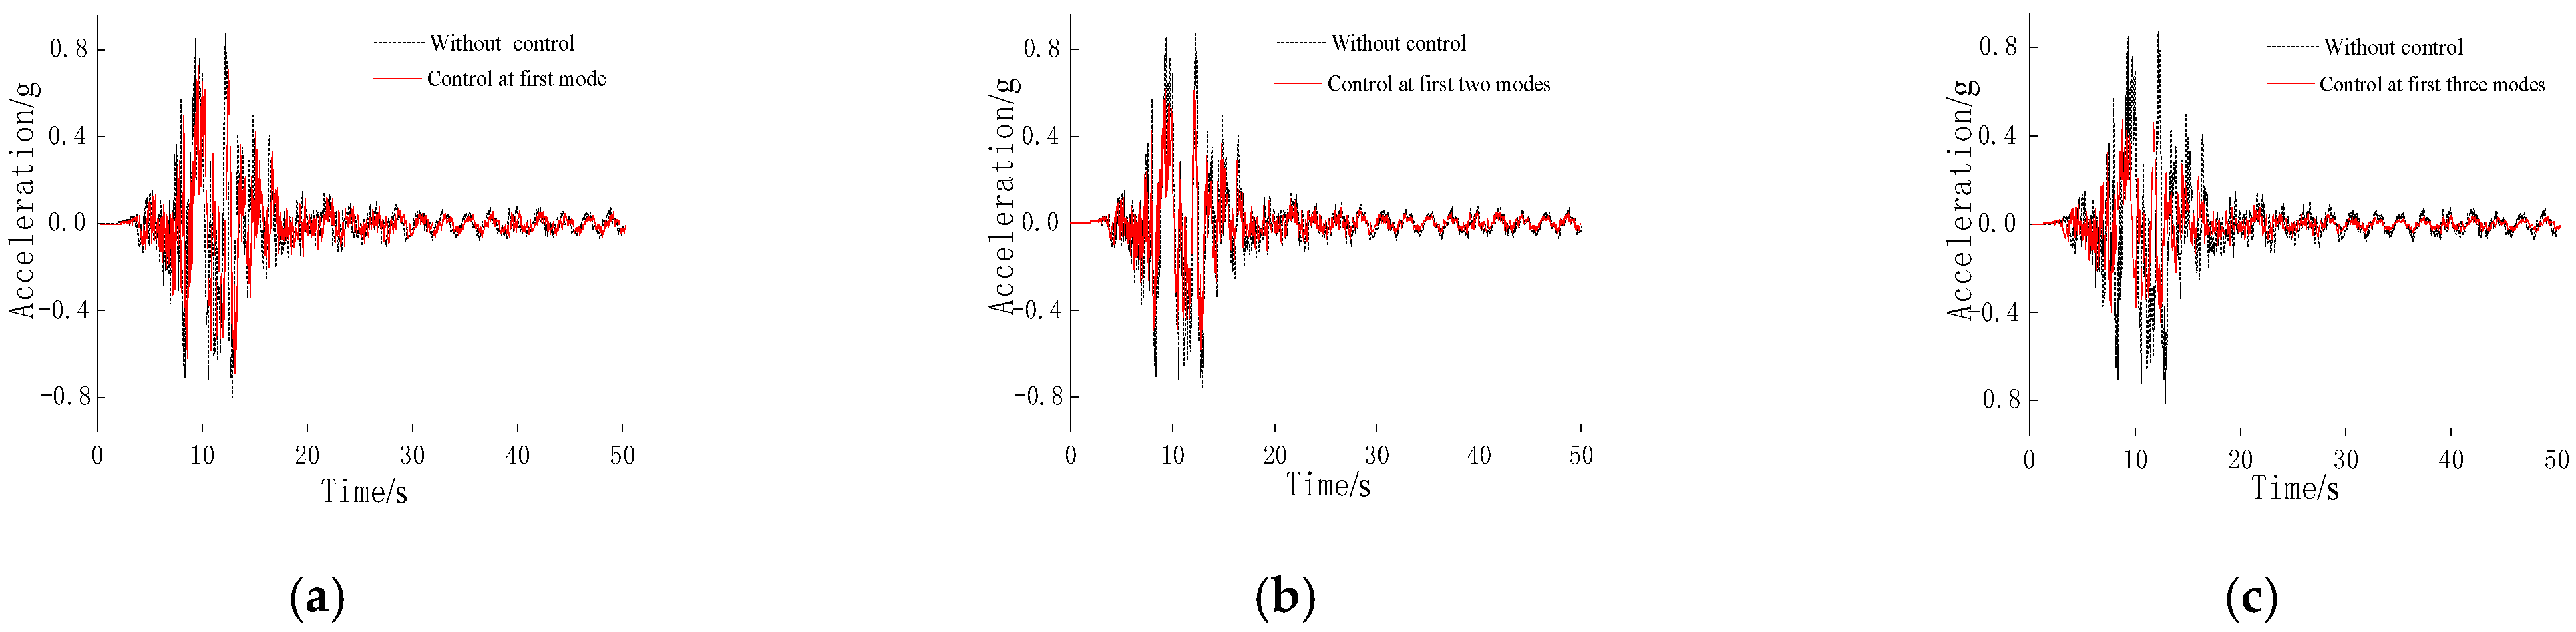
Figure 18.
Time history of acceleration by optimized control at different modes under the El-Centro seismic record. (a) First mode. (b) First two modes. (c) First three modes.
Figure 18.
Time history of acceleration by optimized control at different modes under the El-Centro seismic record. (a) First mode. (b) First two modes. (c) First three modes.
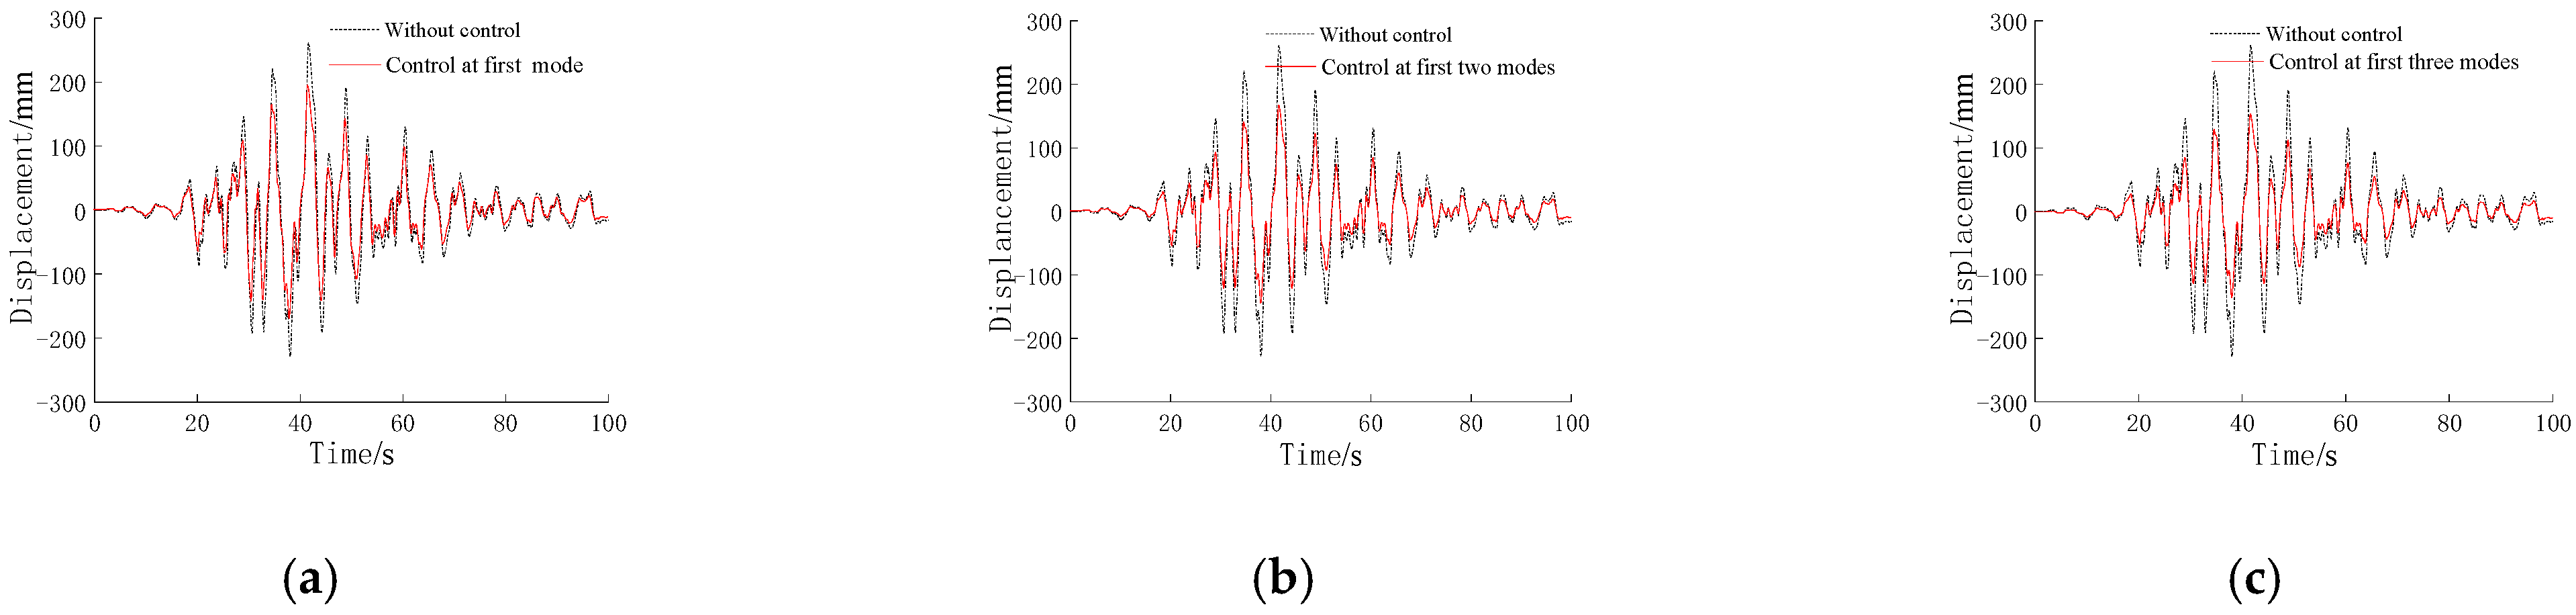
Figure 19.
Time history of displacement by optimized control at different modes under the Jiangyou seismic record. (a) First mode. (b) First two modes. (c) First three modes.
Figure 19.
Time history of displacement by optimized control at different modes under the Jiangyou seismic record. (a) First mode. (b) First two modes. (c) First three modes.
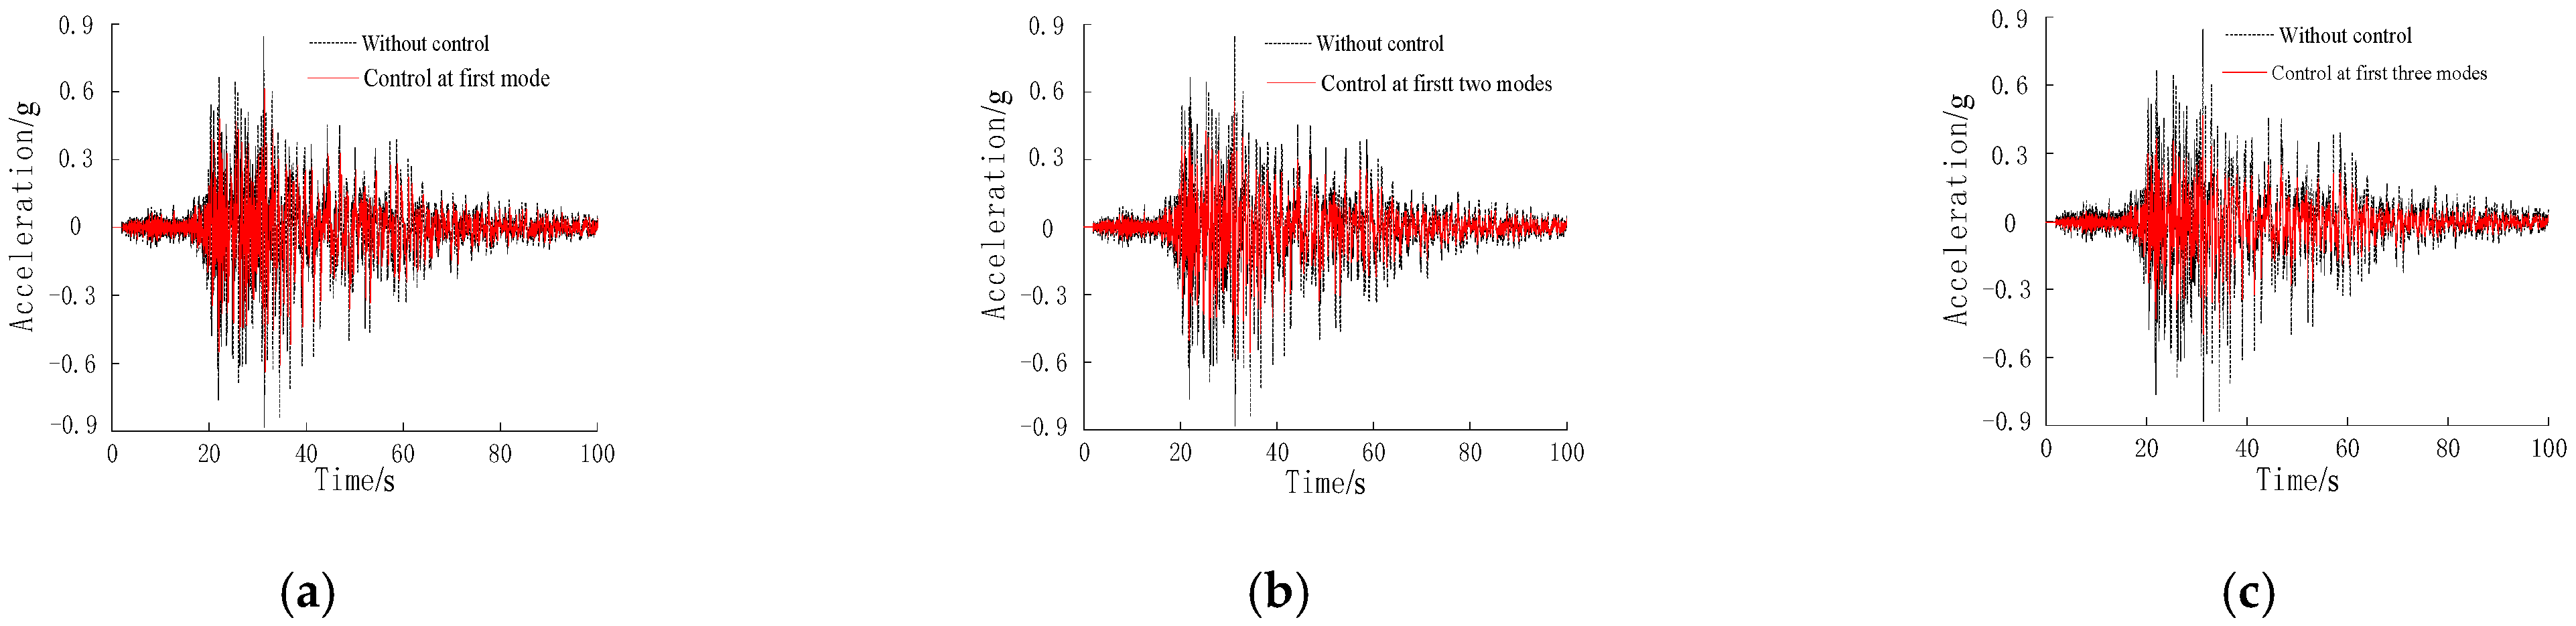
Figure 20.
Time history of acceleration by optimized control at different modes under the Jiangyou seismic record. (a) First mode. (b) First two modes. (c) First three modes.
Figure 20.
Time history of acceleration by optimized control at different modes under the Jiangyou seismic record. (a) First mode. (b) First two modes. (c) First three modes.
Figure 21.
Time history of displacement by optimized control at different modes under the artificial wave. (a) First mode. (b) First two modes. (c) First three modes.
Figure 21.
Time history of displacement by optimized control at different modes under the artificial wave. (a) First mode. (b) First two modes. (c) First three modes.
Figure 22.
Time history of displacement by optimized control at different modes under the artificial wave. (a) First mode. (b) First two modes. (c) First three modes.
Figure 22.
Time history of displacement by optimized control at different modes under the artificial wave. (a) First mode. (b) First two modes. (c) First three modes.
Table 1.
Model similarity relation table.
Table 1.
Model similarity relation table.
| Similar Physical Quantity | Symbol | Formula | Similarity Ratio |
|---|
| size | Sl | model l/archetype l | 0.1 |
| elasticity modulus | SE | model E/archetype E | 1 |
| mass | Sm | Model m/archetype m | 0.00361 |
| density | Sρ | Sρ = Sm/Sl3 | 3.61 |
| accelerated velocity | Sa | Sa = SE Sl2/Sm | 2.77 |
| stress | Sσ | Sσ = SE/Sɑ | 0.361 |
| time | St | | 0.19 |
| displacement | Sw | Sw = Sl | 0.1 |
| velocity | Sv | | 0.526 |
| frequency | Sf | Sf = 1/St | 5.26 |
Table 2.
Natural vibration frequency and period of the Small Wild Goose Pagoda model structure.
Table 2.
Natural vibration frequency and period of the Small Wild Goose Pagoda model structure.
| Test Condition | Lowest Frequency | Second Frequency |
|---|
| Frequency (Hz) | Period (s) | Frequency (Hz) | Period (s) |
|---|
| Without control | Before the earthquake | 5.83 | 0.17 | 14.13 | 0.071 |
| Small earthquake | 5.31 | 0.19 | 14.12 | 0.071 |
| Medium earthquake | 5.05 | 0.20 | 13.98 | 0.072 |
| Large earthquake | 4.71 | 0.21 | 13.81 | 0.072 |
| With control | Before the earthquake | 6.08 | 0.16 | 15.23 | 0.066 |
| Small earthquake | 5.98 | 0.17 | 15.23 | 0.066 |
| Medium earthquake | 5.93 | 0.17 | 14.97 | 0.067 |
| Large earthquake | 5.45 | 0.18 | 14.97 | 0.067 |
Table 3.
The extremum acceleration of the top floor of the tower with no control condition under 8-degree earthquakes (g).
Table 3.
The extremum acceleration of the top floor of the tower with no control condition under 8-degree earthquakes (g).
| | El−Centro Wave | Jiangyou Wave | Artificial Wave |
|---|
| Max | Min | Max | Min | Max | Min |
|---|
| Small earthquake | 0.647 | −0.661 | 0.603 | −0.624 | 0.688 | −0.694 |
| Medium earthquake | 1.231 | −1.304 | 1.770 | −1.815 | 1.972 | −1.938 |
| Large earthquake | 1.813 | −1.914 | 2.354 | −2.460 | 2.664 | −2.589 |
Table 4.
The extremum acceleration of the top floor of the tower with control condition under 8-degree earthquakes (g).
Table 4.
The extremum acceleration of the top floor of the tower with control condition under 8-degree earthquakes (g).
| | El−Centro Wave | Jiangyou Wave | Artificial Wave |
|---|
| Max | Min | Max | Min | Max | Min |
|---|
| Small earthquake | 0.552 | −0.570 | 0.512 | −0.528 | 0.587 | −0.604 |
| Medium earthquake | 0.886 | −0.937 | 1.338 | −1.387 | 1.461 | −1.474 |
| Large earthquake | 1.239 | −1.458 | 1.739 | −1.782 | 1.830 | −1.714 |
Table 5.
The maximum relative displacement of the top floor of the tower with no control condition under 8-degree earthquakes (mm).
Table 5.
The maximum relative displacement of the top floor of the tower with no control condition under 8-degree earthquakes (mm).
| | El-Centro Wave | Jiangyou Wave | Artificial Wave |
|---|
| Measured Displacement | Relative Displacement | Measured Displacement | Relative Displacement | Measured Displacement | Relative Displacement |
|---|
| Small earthquake | 5.011 | 3.197 | 4.354 | 2.094 | 15.16 | 5.318 |
| Medium earthquake | 9.485 | 5.819 | 8.169 | 3.530 | 28.89 | 10.19 |
| Large earthquake | 16.84 | 11.87 | 12.23 | 5.908 | 62.06 | 31.83 |
Table 6.
The maximum relative displacement of the top floor of the tower with control condition under 8-degree earthquakes (mm).
Table 6.
The maximum relative displacement of the top floor of the tower with control condition under 8-degree earthquakes (mm).
| | El-Centro Wave | Jiangyou Wave | Artificial Wave |
|---|
| Measured Displacement | Relative Displacement | Measured Displacement | Relative Displacement | Measured Displacement | Relative Displacement |
|---|
| Small earthquake | 3.550 | 2.021 | 3.594 | 1.376 | 13.87 | 3.509 |
| Medium earthquake | 7.668 | 4.117 | 7.068 | 2.442 | 23.97 | 7.057 |
| Large earthquake | 13.21 | 8.051 | 10.03 | 4.098 | 49.49 | 23.32 |
Table 7.
The Small Wild Goose Pagoda dynamic characteristic value.
Table 7.
The Small Wild Goose Pagoda dynamic characteristic value.
| Project | Level 1 | Level 2 | Level 3 |
|---|
| Frequency (Hz) | 1.348 | 3.401 | 5.303 |
| Cycle (s) | 0.74 | 0.29 | 0.19 |
| Damping ratio/% | 0.902 | 2.201 | 6.560 |
Table 8.
The recommended design value of the SMA-SPDS parameters for the prototype structure of the Small Wild Goose Pagoda.
Table 8.
The recommended design value of the SMA-SPDS parameters for the prototype structure of the Small Wild Goose Pagoda.
| | Quality (kg) | Swing Length (m) | SMA Diameter (mm) | Number of SMA |
|---|
| Level one | 832 | 1.534 | 1.0 | 6 |
| Level two | 634 | 1.241 | 4 |
| Level three | 459 | 0.953 | 4 |
Table 9.
Comparison of the optimal control displacement with SMA-SPDS.
Table 9.
Comparison of the optimal control displacement with SMA-SPDS.
| Seismic Wave | Number of Modes
under Control | Maximum Displacement of Structure (mm) |
|---|
| Without Control | Optimized Control | |
|---|
| El-Centro | First one | 232.96 | 191.06 | 17.9% |
| First two | 163.25 | 29.9% |
| First three | 140.28 | 39.8% |
| Jiangyou | First one | 266.34 | 211.63 | 23.5% |
| First two | 183.34 | 33.7% |
| First three | 152.89 | 44.7% |
| Artificial wave | First one | 163.45 | 133.52 | 18.3% |
| First two | 108.71 | 33.5% |
| First three | 86.84 | 46.9% |
Table 10.
Comparison of the optimal control acceleration with SMA-SPDS.
Table 10.
Comparison of the optimal control acceleration with SMA-SPDS.
| Seismic Wave | Number of Modes
under Control | Maximum Displacement of Structure (mm) |
|---|
| Without Control | Optimized Control | |
|---|
| El-Centro | First one | 0.81 | 0.68 | 16.0% |
| First two | 0.55 | 32.1% |
| First three | 0.50 | 38.2% |
| Jiangyou | First one | 0.87 | 0.63 | 27.5% |
| First two | 0.60 | 31.0% |
| First three | 0.47 | 46.0% |
| Artificial wave | First one | 0.83 | 0.77 | 7.2% |
| First two | 0.58 | 30.1% |
| First three | 0.45 | 45.8% |


