New Suburbanism: Sustainable Spatial Patterns of Tall Buildings

Department of Urban Planning and Policy, College of Urban Planning and Public Affairs, University of Illinois at Chicago, Chicago, IL 60607, USA
Buildings 2018, 8(9), 127; https://0-doi-org.brum.beds.ac.uk/10.3390/buildings8090127
Submission received: 18 August 2018
/
Revised: 4 September 2018
/
Accepted: 10 September 2018
/
Published: 13 September 2018
Abstract
:Much of the anticipated future growth in North America will occur in suburbia. The critical challenge that we will face is how to accommodate this growth in a sustainable and resilient manner. While the past 50 years have been characterized by suburban sprawl and low-rise development, “suburban sustainability” is increasingly making its way into the planning and urban design policy realm. This research investigates the spatial patterns of tall buildings in 24 suburban communities of three different regions including, Washington, D.C., Miami, and Chicago. The study identifies 10 different spatial patterns that prevail in suburbia and provides a concise summary of these patterns and reflects on their spatial and urban design aspects. The research concludes that the Tall Buildings and Transit-Oriented-Development (TB-TOD) model, an urban design approach that refers to vertical mixed-use clusters centered on mass-transit nodes, is one of the sustainable options for large regions going forward. The paper also discusses the challenges to the TB-TOD model implementation, mainly limited transit lines and community resistance. It ends by offering directions for future research.
1. Introduction
Much of the anticipated future building development in North America will occur in suburbs, defined generally as areas that fall between the outskirts of cities and rural areas [1]. In the case of the United States, demographers project that inhabitants will increase by roughly 100 million by 2037, and predict that 70% of the added population will reside in suburbia [1,2,3]. To accommodate the increased population in typical low-rise suburbs, the built environment would need to expand by about 50%, leading to additional massive sprawl [1,2,4]. The crucial aspect of 21st century urban development will be increased suburbanization, and the critical planning issue will be how to accommodate the increased population in a sustainable and resilient manner [5,6,7].
Overall, there is consensus among scholars (e.g., [1,2,8,9,10,11]) that the current model of suburban sprawl is unsustainable because it contributes to a variety of environmental, social, and economic problems. Massive suburban expansion has fueled inefficient spatial patterns characterized by massive street networks, scattered shopping plazas, big-box retailers, isolated business centers, and gated communities. These land-use patterns have resulted in the wasteful use of water, energy, land, and have amplified air and water pollution and greenhouse gas emissions. Suburbia has eaten up lots of natural habitat, damaged natural ecosystems, and entailed building expansive, costly infrastructure of roads, sewer and power lines, and the like. Further, suburban sprawl has been linked to social problems stemming from increased separation and isolation of communities and individual residents. The automobile-dependent lifestyle required in the suburbs has been blamed for causing health problems such as obesity and related diseases.
Simultaneously, shifts in the U.S. demographic structure continue to indicate an increase in non-traditional families with fewer or no children. Today, two-thirds of suburbia is inhabited by childless households; and consequently, there are anticipated shifts in housing needs, favoring apartment living over single-family detached homes [1,12]. Researchers anticipate that only 12% of the 100 million people to be added by 2037 will have children. Further, many of the new population will be either single-person or empty nester households [1]. These demographic changes will likely cause serious shifts in the housing market; for example, the market will experience a greater demand for apartments and less demand on single-family detached housing [13,14,15]. Other factors that will decrease demand on single-family housing are the recent economic downturn, rising property taxes, and rising gas prices. These factors have made the exurban commute less palatable and have forced some to abandon their McMansions (i.e., oversized houses in suburbia). Simultaneously, aging Baby Boomers are downsizing and moving into multifamily housing near rail lines, while Millennials are not as dependent on autos, and are more interested in environmentally-friendly commutes [2,14,16].
Indeed, there is a cultural shift favoring sustainability that prioritizes saving energy, preserving land, promoting mass transit, and facilitating walkable environments. Reducing the ecological footprint of the American suburbs is emerging as a priority for planners, environmentalists, elected officials, architects, developers, and citizens alike. At the government level—local, state, and federal—new policies are beginning to reflect this goal. The U.S. government is providing incentives for increasing height and boosting density in low-rise suburban environments in return for providing public benefits like affordable housing and vibrant public spaces. Indeed, many suburban redevelopment plans aspire to transform declining retail centers and neighborhoods into vibrant, compact, mixed-use communities with improved pedestrian connectivity.
1.1. New Suburbanism
Suburban redevelopment or what literature refers to as “New Suburbanism” has been pioneering this cultural shift. New Suburbanism attempts to recover, remedy, and correct a path of development and spatial patterns that, if continued, will cause devastating economic, environmental and social consequences. It represents concentrated efforts through a wide-spectrum of projects (including retrofitting, re-inhabiting, and re-greening existing sites, upgrading infrastructure, or developing new sites) by planners, architects, environmentalists, sociologists, and the like. They all aim to improve the declining conditions of the suburbs. There is a growing need for careful intervention by working with local communities and governments to enhance environmental quality, facilities, amenities and transportation systems, and to respond to new housing demand in suburban communities. There is a call to reshape, rescale, and reintegrate big-box regional and national chain retailers with local economies and activities to foster a sense of authenticity and connection to specific locales [9,15].
New Suburbanism shares similar goals to that of popular urban planning paradigms, including Transit-Oriented-Development (TOD), Smart Growth, and New Urbanism. The common principles among these movements aim to reduce harm resulting from suburban decline, curb sprawl, reduce car traffic, and foster mixed-use developments. They aim to halt or reverse suburban decline, reduce irresponsible sprawl, reinvigorate socio-economic activities, and promote compact and mixed-use developments. Planners view that retrofitting declining suburbs by creating denser developments will be a better choice than expanding outward. Such an alternative will help to preserve natural land and eco-system as well as save on building costly infrastructure [1]. Throughout the country, retrofit projects replace, repurpose, or transform low-rise, older suburban neighborhoods and dying shopping malls into new high-density, mixed-use developments. Suburban planners and elected leaders are gradually discerning that these strategies are necessary for their communities to survive and thrive by attracting new businesses and residents and boosting the tax base [17].
1.2. Tall Buildings and New Suburbanism
Across the United States, we see urban planning and design efforts that stress sustainability, characterized by dense, compact, multi-function, walkable, cycle-able, vibrant developments served by mass transit. We are gradually seeing policies that promote the creation of “urban villages” that provide concentrated density of people and activities [16]. The United States government is providing incentives for increasing height and boosting density in low-rise suburban environments. Some suburbs have already been active in building tall and others have been preparing thoughtful plans to integrate high-rise developments into their communities [17]. Certainly, one way to create a compact development is by applying vertical density in the form of mid-rise and high-rise buildings. As a form of compactness, vertical clusters shorten travel distances on a site, thereby improving accessibility [17,18].
Research has observed new projects that integrate high-rises in suburban places along major corridors and near mass-transit nodes [16,17,18]. Recent research has highlighted this phenomenon in suburban places such as Anaheim and Fremont in California; Irving in Texas; Queens in New York; Pearland and Woodlands in Houston, Arlington in Virginia; Bellevue in Washington; White Flint in Maryland; and Evanston and Shamburg in Chicago. This “New Suburbanism” is viewed as a response to a generation of young workers who desire downtown living and employers who prefer moving away from suburban campuses [19,20,21,22]. In some suburban communities, for example in Reston, VA, residential complexes are being demolished to construct mainly high-rise buildings [23].
1.3. Research Questions
This research examines the role of vertical density in stimulating sustainable developments in American suburbs. It investigates the role of spatial patterns and tall buildings in reducing the harms of sprawl. There is a plethora of research on the historic development of suburbs, and there are extensive studies on retrofitting, redesigning, and redeveloping suburbia. There are also plenty of studies on tall buildings that address many aspects of their developments, including structural stability, architectural design, vertical transportation, façade technologies, and renewable energies. Similarly, there is plenty of research on sustainability and compact, mixed-use developments. However, research on sustainable tall building development in suburban settings is lacking, and this work intends to fill this knowledge gap. It attempts to address the subsequent interrelated questions:
- What are the spatial patterns of tall buildings in suburbia?
- When, why, and how can tall buildings be integrated into suburbia?
- What are the “sustainable” spatial patterns for integrating tall buildings in suburban communities?
- What are the constrains in the path of applying vertical density in suburbia?
2. Methods
To address the above questions, the study embarked on examining recent and future tall building developments in 24 suburban communities located in three major U.S. regions: Washington, D.C., Miami, and Chicago. The selection criterion involved examining the suburbs that contained the greatest number of tall buildings (10 stories and higher) in their respective regions. Only constructed buildings were considered in the study. Buildings of other categories such as “under construction,” “proposed,” or “visionaries” were not included.
The three selected regions were chosen due to their distinct differences. For example, Washington, D.C. is a governmental center; Miami is a tourist destination; and Chicago is a business and commercial hub. In addition, Washington, D.C. is facing an accelerated urban and suburban growth; Miami is experiencing decent growth; and Chicago undergoes slow growth. Further, Miami has a hot climate, Chicago has an extended cold winter; and Washington, D.C. enjoys a relatively mild weather.
The involved regions were examined extensively by using aerial photographs, land use maps, as well as by conducting field visits. Data of tall buildings were obtained from multiple sources, including the Council on Tall Buildings and Urban Habitat, Emporis, municipalities, and villages. Geocoding was performed using Geographic Information Systems and verification of results was conducted by examining recent aerial photographs provided by Google Earth and Bing. Clarifications of some of the planning issues were carried out by emailing and calling respective municipalities. In addition, secondary sources were used throughout. Consequently, by employing multiple validation measures, research accuracy is considerably high. That is, buildings’ locations and their information/attribute data were accurate.
3. Case Studies
3.1. Washington, D.C. Metropolitan Area
Metropolitan Washington, D.C. is a geographic area that centers on the capital of the United States (also known as the District of Columbia), and includes parts of Maryland, Virginia, and West Virginia. According to the United States Census, the metropolitan area covers 5564 square miles and contains 5,860,342 people. The region also enjoys a high median income and offers job opportunities provided by the federal government, the defense industry, engineering and technology companies, as well as think tanks, non-profit agencies, and major research universities. Tourism in the region is significant: hospitality and service industries are growing, as are information and technology services. Washington, D.C. is located in a sub-tropical zone that features four distinct seasons. Within 30 miles from its center, Washington, D.C. is globally connected by three major airports: Ronald Reagan Washington National Airport, Dulles International Airport in Virginia, and Baltimore-Washington International Airport in Maryland. Two commuter rail lines service the D.C. area: the Virginia Railway Express (VRE) and Maryland Area Regional Commuter (MARC). Amtrak trains shuttle passengers mainly from the northeastern United States, with eight routes connecting in the Union Station. Bus systems also service the central area. Interstate 495, known as the “Capital Beltway,” is an important link and landmark for D.C. citizens; to be “inside the beltway” is to be known as a Washington insider.
The paper presents the examined suburbs in Washington, D.C. Metropolitan Area in an order based on the number of tall buildings (10-stories high and greater) that they contain (Table 1). Table 2 presents the spatial profile of the examined suburbs. Figure 1 shows the location of the examined suburbs in the Washington, D.C. Metropolitan Area and Figure 2 displays the locations of the 10 tallest buildings in each suburban community.
3.1.1. Rosslyn-Ballston (R-B) Corridor, Arlington, VA
The Rosslyn-Ballston (R-B) Corridor is located in Arlington County, Virginia, in close proximity to Washington, D.C. The 3.3-mile R-B Corridor comprises of two nodes of distinct high-rise clusters placed at Ballston and Rosslyn. Between Rosslyn and Ballston, three nodes of high-rise development concentrate around three neighborhoods: Courthouse, Clarendon, and Virginia Square.
The Rosslyn-Ballston (R-B) Corridor story starts as early as the 1960s when Arlington underwent rapid growth. The initial plan suggested expanding the regional rail system by running it above ground within the median of Interstate 66, bypassing existing commercial R-B Corridor. However, county officials and residents successfully argued and lobbied for an underground line that would run under the R-B Corridor in order to better connect the corridor with the region. They specifically suggested five Metro stations that serve the neighborhoods of Rosslyn, Ballston, Courthouse, Clarendon, and Virginia Square (Figure 2).
Beginning in 1972 and over the course of a dozen years, Arlington County drafted a General Land Use Plan (GLUP) to ensure growth in desired areas. The overall plan suggested a “bull’s-eye approach,” that would concentrate activities in close proximity (one-quarter mile walking distances) of the Metro stations. The plan also envisioned a “tapered density” scheme, where buildings’ height drops gradually as one moves from a Metro station toward the surrounding low-rise, single-family residential neighborhoods [25,26].
3.1.2. Silver Spring, MD
Silver Spring is a suburban community in Montgomery County, Maryland. Its area is about 7.92 square miles, with a population of 76,716. First high-rise buildings were constructed in the 1960s to create commercial hubs. Silver Spring then witnessed a slow growth until the beginning of the 21st century onward when about 15 new tall buildings were constructed (Figure 2). The Silver Spring CBD Sector Plan embraces a TB-TOD model. The land use and development recommendations in the Sector Plan encourage employing tall buildings near the Metro stations. The Plan also outlines recommended transit facilities needed to discourage single occupancy driving. Silver Spring is envisioned as a lively place fueled by active pedestrian life and robust commercial activities. A wide-spectrum mix of office, retail, housing entertainment and restaurant and civic places are meant to activate the downtown [26,27,28].
3.1.3. Tysons Corner, VA
Tysons Corner, also known simply as Tysons, is a suburban community in the heart of Northern Virginia. It covers about 4.27 square miles and contains a nighttime population of about 20,000 people—9481 households with 4754 families reside in the community. It is the 12th largest employment center in the U.S., employing 120,000 people in various fields [29]. This suburban community grew up around its popular malls, a recognizable spatial pattern in suburban communities around the country. Since it houses major Fortune 500 company headquarters and other high-profile companies, Tysons has gained substantial fame. It also features modern architecture and tall buildings.
However, Tysons suffers from “hodge-podge,” placeless spatial patterns and an urban environment that lacks visual order. An auto-oriented place with massive parking lots inhibits pedestrian mobility and civic life. In addition, due to its large daytime population (greater than 100,000), Tysons experiences a high level of traffic congestion [30]. In response, planners have envisioned creating four major TB-TODs around the four new station areas: Tysons West (Spring Hills Station), Tysons Central 7 (Greensboro Station), Tysons Central 123 (Tysons Corner Station), and Tysons East (McLean Station), (Figure 2). All these areas share a common scheme of mixed-use and pedestrian-friendly environments. However, each of these areas is supposed to evoke a distinct “personality” by exhibiting special perceptual characteristics and providing varied services and functions. For example, Tysons West is supposed to provide entertainment and performing art activities augmented with restaurants open after the workday ends. Tysons Central 123 area will be reinforced as a robust business, commercial, retail, and shopping district. Tysons Central 7 will host commercial office space, while Tyson East will be a mixed-use residential area [29].
3.1.4. North Bethesda, MD
North Bethesda is a suburban community in Montgomery County, Maryland, located 12.5 miles northwest of Washington, D.C. It is bordered on the north by the City of Rockville. It has a total area of 8.9 square miles with a population of 43,828 people. North Bethesda is served by three Washington Metro stations along the Red Line, including the Twinbrook, White Flint, and Grosvenor-Strathmore. It is also served by the Ride On bus system. Its business district houses the corporate headquarters of major companies and agencies [27]. A considerable number of tall buildings are located within a quarter-mile radius from the White Flint Metro Station (Figure 2).
3.1.5. Bethesda, MD
Bethesda is a suburban community in southern Montgomery County, Maryland—about seven miles northwest of central D.C. Its area is about 13.2 square miles, with a population of 63,374. Bethesda contains a number of corporate and government headquarters and national institutions. Bethesda’s main commercial corridor is Wisconsin Avenue, and “Downtown Bethesda” is located at the intersection of three major roads, including Wisconsin Avenue, Old Georgetown Road, and East-West Highway. Today, that same intersection is the location of the Washington Metro Red Line Bethesda Station. Dense construction followed the opening of the Bethesda Metro Station [27]. Subsequently, Bethesda’s CBD has become synonymous with Transit Oriented Development (Figure 2).
The employed TB-TOD model embraces a pyramidal profile where tallest buildings cluster around the Metro station. As the case with the R-B Corridor plan, buildings’ height and density are reduced as one moves away from the Metro station, approaching existing low-rise single-family houses. The step-down scheme helps to mitigate the scale problem that emerged between the high-rise and low-rise environments. Additionally, parks, playgrounds, and open spaces are fused around tall buildings developments in order to further mitigate the scale problem. Planning in Bethesda today continues with these principles as the foundation for maintaining the character and quality of life for which Bethesda has always been known.
3.1.6. Alexandria, VA
Approximately six miles south of downtown Washington, D.C., Alexandria is a suburban community with population of about 151,218. Alexandria houses mainly professionals working in the U.S. military, the Federal civil service, the United States Patent and Trademark Office and for private companies that offer contract services to the federal government. Importantly, new and future developments follow the TB-TOD model. Many high-rise developments are located in close proximity to the Eisenhower Avenue Metro Station [30,31] (Figure 2).
3.1.7. Reston, VA
Reston is a suburban community in Fairfax County, Virginia. It is strategically located just 10 min away from Dulles Airport. The population is about 60,000 with an area about 15 square miles. What is fascinating about Reston is that it is a planned community, founded in 1964 and built on planning and urban design principles similar to those of New Urbanism. Although it predated the movement, Reston shares many New Urbanism design concepts of creating mixed-use, compact and walkable environments with a mix of housing types. Reston offers a place where residents can live, work, and play [30].
In 2009, Fairfax County started working on a new master plan for Reston. The County aims to follow the same planning vision and principles that have been set for Tysons Corner of high-density and mixed-use urban core. The Reston redevelopment vision follows the TB-TOD model where it places tall buildings near the planned transit nodes along the Silver Line extension, which is currently underway (Figure 2). The new stations are part of a 23-mile Metro Silver Line extension connecting downtown Washington to the Washington Dulles International Airport. In summer 2014, the Wiehle-Reston East Station opened in Reston. Two additional Silver Line stations—the Reston Town Center Station and the Herndon Station—are planned to open in 2018. It is envisioned that the TB-TOD model will support a vibrant, mixed-use community, ensure diverse housing options [30].
3.1.8. Rockville, MD
Placed in the core region of Montgomery County, Maryland, Rockville is the county governmental seat and a prime incorporated suburban community. With population of about 61,209 inhabitants, it is the third-largest incorporated suburb in Maryland. Rockville is the home of a large number of biotechnology and computer software companies as well as federal government institutions, high-end malls, and retails [27]. It contains high-rise buildings, few under construction, and plans to build newer ones—all in close proximity to the Rockville Metro Station (Figure 2).
3.2. Miami Metropolitan Area
The Miami metropolitan area, commonly referred to as South Florida, covers an area of 6137 square miles and encompasses a tri-county area including Miami-Dade, Broward, and Palm Beach Counties. It enjoys a tropical monsoon climate characterized by hot and humid summers with average highs in the 90s, and short and mild winters with average highs in the 70s. The region receives an abundance of rain, especially from May through mid-October. The total population of the Miami metropolitan area is approximately 5.5 million, with Miami-Dade County claiming the majority. The Miami region attracts people from all over the world because it enjoys beautiful weather, gorgeous beaches, wonderful amenities (e.g., restaurants, coffee shops, bars, hotels, entertainment facilities, etc.), an attractive tax structure, as well as a spectacular cultural mix. Due to the same reasons, international investors, particularly Latin Americans and Europeans, are attracted to the area. Latin American business people feel at home since the great majority of the population speaks Spanish. Consequently, the Miami region experiences continuous demand and growth; currently, it is the seventh-most populous metropolitan statistical area (MSA) in the United States [24].
The paper presents the examined suburbs in Miami Metropolitan Area in an order based on the number of tall buildings (10-stories high and greater) that they contain (Table 3). Table 4 presents the spatial profile. Figure 3 shows the location of the examined suburbs in the Miami Metropolitan Area and Figure 4 displays the locations of the 10 tallest buildings in each suburban community.
3.2.1. Miami Beach, FL
Miami Beach is a suburban resort community located about 10 miles east of downtown Miami. This suburban community occupies a land area of approximately 7.63 square miles with a population of 91,026 [2]. Miami Beach comprises a series of human-made islands and peninsulas created from the dredging of Biscayne Bay in the late 19th and early 20th centuries. Historically, the population of Miami Beach boomed following World War II. Another population boom occurred when Fidel Castro came into power in Cuba in 1959, resulting in a huge influx of Cubans and thus a shift in the demographic composition of the area, which has persisted over time. Money followed these booms, and the 1980s and 1990s again witnessed a multi-billion-dollar infusion of investment and development in the area, further establishing Miami Beach as a high-end tourist destination. With a rich tourism-based economy, miles of public and private beaches, and convenient access, Miami Beach has established itself as the metro area’s premiere resort community [31,32,33].
Miami Beach is also home to major Art Deco buildings and a spectrum of art performances such as the Art Basel Miami Beach, one of the major art shows in the U.S. The annual Art Basel show and other art, festival and recreational activities have attracted the ultra-wealthy, including major international investors, to Miami Beach. In turn, these crowds have fueled the economy, spurred developments, and financed various projects, including luxury high-rises. High-rise and mid-rise developments spread along the waterfront. There are also high and mid-rise residential and commercial developments along major commercial corridors. They contain luxury hotels and high-end condominiums and apartments (Figure 4). Interestingly, five of the tallest buildings cluster in the southern tip of the peninsula. Perhaps, the rationale seems to stem from close proximity to water views. The southern tip maximizes these views from three directions—east, south, and west. A similar situation exists in Manhattan, N.Y., where tall buildings cluster toward the southern tip of Battery Park City.
3.2.2. Fort Lauderdale, FL
Fort Lauderdale is widely known as “America’s Favorite Beach Community” due to its peaceful setting and spectacular natural landscape. It has seven miles of public beaches and 165 miles of canals and waterways, equating to 337 miles of shoreline [2]. Located 28 miles north of Downtown Miami, Fort Lauderdale occupies a land area of 34.77 square miles with a population of 172,389 [2,34]. Due to its large concentration of businesses, history and spatial layout, Fort Lauderdale is considered one of best suburban communities in the Miami region. As is the case with several Miami suburbs, Fort Lauderdale enjoys an extended beachfront with high-rise developments spread along it. In addition to extensive beachfront development, Fort Lauderdale has a downtown business district with nightlife activities. This suburban community has a defined core around the intersection of Las Olas Boulevard and SE 3rd Avenue, where the tallest buildings are concentrated (Figure 4).
3.2.3. Aventura, FL
Aventura is a planned suburban resort community located 18 miles northeast of downtown Miami. Aventura enjoys a land area of 2.65 square miles with a population of 37,199 [35]. According to Aventura Comprehensive Plan, the Aventura story began in the 1970s when developer Don Soffer purchased 785 acres of vacant shoreline property in Northeast Dade County. Currently, those 785 acres are fully incorporated. Soffer’s vision was to create a “community with character”, through the formation of Turnberry Associates. The area is characterized by scattered clusters of “vertical gated communities” [2] (Figure 4). Aventura also contains townhomes gated communities and exclusive single-family home waterfront communities.
3.2.4. Sunny Isles Beach, FL
Sunny Isles Beach is a suburban resort community placed 19 miles northeast of Downtown Miami. It occupies a tiny land area of only 1.02 square miles with a population of 21,720 [24]. Sunny Isles Beach’s economy centers on the hospitality and tourism industry; six of the city’s eight major employers are hotels or resort companies. For example, it is home to the luxurious Trump International Beach Resort. Sunny Isles Beach offers superb amenities, including world-renowned restaurants, nightclubs, theaters, shopping centers, parks, spas, tennis courts, and two miles of uninterrupted beach. High-rise developments of hotels and residential condominium are located along the beachfront on the east side of Collins Avenue, also demarcated as Florida State Highway A1A (Figure 4).
As is the case with several Miami waterfront suburbs, there is no room for Sunny Isles Beach to expand horizontally due to being surrounded by water bodies of the Atlantic Ocean on the east and the Intracoastal Waterways on the west. As such, Sunny Isles Beach plans to build upward by constructing several high-rises in the form of infill developments. There are currently several luxury high-rise developments under construction due for completion by 2019. These buildings range from 20 to 57 stories and are mainly residential condominiums.
3.2.5. Coral Gables, FL
Coral Gables is a suburban resort community located about seven miles southwest of downtown Miami. It occupies a land area of 12.92 square miles with a population of 49,631 [24]. Resting on the southwest edge of Miami’s city limits, Coral Gables is one of the metro area’s oldest incorporated suburbs. Coral Gables started as a “street car” suburb and was one of the first suburbs to incorporate gated communities and homeowners’ associations. It is home to the University of Miami, which was founded in 1925, the same year the city was incorporated.
The downtown commercial district, known as “the Miracle Mile,” was designed by George Merrick in the 1950s. Its spatial layout embraces a compact mixed-use development, where businesses are located within walking distances from residents. The majority of commercial development occurred along the Miracle Mile in the 1960s. During this period, zoning height restrictions were waived and several high-rises were built, attracting large companies to the area [35]. High-rise developments in Coral Gable follow a sporadic pattern along major corridors. They also appear in dispersed sites forming new urban nodes. However, they concentrate in the Miracle Mile District (Figure 4).
3.2.6. Boca Raton, FL
Boca Raton is a suburban community in Palm Beach County located 45 miles north of downtown Miami. It occupies a land area of 29.33 square miles with a population of 89,407 [24]. It is the headquarters of many major companies and is home to Florida Atlantic University. Like many South Florida communities, Boca Raton is a tourist attraction, for it provides beautiful beaches, golf courses, hotels, art museums, exhibits, festivals, jazz clubs, concerts, restaurants, boutiques, and the glittery Town Center at Boca Raton shopping mall with numerous upscale specialty shops. High-rises are spread mainly along the beachfront [2] (Figure 4).
3.2.7. Bal Harbour, FL
Bal Harbour is a suburban resort community located about 14 miles northeast of downtown Miami. It occupies a land area of 0.4 square miles with a population of 5854 [35]. It is located on the northern tip of Miami Beach. The main traffic corridor, Collins Avenue, runs north-to-south through Bal Harbour. East of Collins Avenue is the beachfront where high-rises are spread along it [2] (Figure 4).
3.2.8. Kendall, FL
Kendall is a suburban community in Miami-Dade County, located about 29 miles southwest of downtown Miami. It occupies an area of about 16.08 square miles with a population of 75,371 [24]. Downtown Kendall Urban Center District is a significant urban center that contains a concentration of tall buildings, conveniently served by the Metrorail Dadeland South Station (Figure 4). Kendall is increasingly significant in the polycentric Miami region, as new rail stations have accompanied high-rise zones [2].
3.3. Chicago Metropolitan Area
The Chicago metropolitan area comprises the City of Chicago as well as its suburban communities, covering a geographic area of 10,857 square miles. The metropolitan population is about 9.8 million people, of which approximately one-third of the population resides in the city and two-thirds in the suburbs. The Chicago region enjoys a robust, highly diversified economy and is home to a plethora of Fortune 500 companies, including McDonald’s, Kraft Foods, Sears, Abbott Laboratories, and Boeing. Among the major industries in the region are finance, transportation, manufacturing, publishing, food processing, and healthcare. Chicago experiences four seasons: mild and pleasant autumn, wet and warm spring, hot and humid summer, and cold and snowy winter. The Chicago region features the second largest and most expansive transportation system in the U.S., next to NYC. The Chicago region is home to two major airports: Midway, and O’Hare International; the latter is renowned for being among the busiest airports worldwide [2].
The paper presents the examined suburbs in Chicago Metropolitan Area in an order based on the number of tall buildings (10-stories high and greater) that they contain (Table 5). Table 6 presents the spatial profile. Figure 5 shows the location of the examined suburbs in the Chicago Metropolitan Area and Figure 6 displays the locations of the 10 tallest buildings in each suburban community.
3.3.1. Schaumburg, IL
Schaumburg, Illinois is a suburban community located 24 miles northwest of downtown Chicago. It occupies a geographic area of 19.22 square miles with a population of 74,907 [24]. Nearly all of the municipality’s land area has been developed. Schaumburg is a major employment center for the Chicago region and is home to more than 100,000 jobs. With more jobs than residents, Schaumburg attracts workers from surrounding communities, as well as from Chicago—the “reverse” commute has been common in the region in the last two decades. However, Schaumburg’s development over the years has been following a typical suburban sprawling model characterized by segregated land-use, wide roads, large parking lots, and poor mass transit.
Schaumburg contains Woodfield Mall, which is the largest mall in Illinois. With a total retail floor area of 2,172,434 square feet and over 300 stores, the mall attracts people from all over the Chicago region and beyond. It also attracts a wide-range of businesses. While some tall buildings cluster around the mall, others are found in a scattered and dispersed manner throughout the Village (Figure 6). Schaumburg has plans for a few high-rise projects in the near future.
3.3.2. Evanston, IL
Evanston is a suburban community that borders the City of Chicago on the north side; specifically, it is located 13 miles north of the Chicago Loop. It occupies a geographic area of 7.75 square miles with a population of 75,570 [35]. Evanston is renowned for its lively urban downtown, beautiful lakefront, and attractive parks. Despite the relatively high property taxes and high rents, Evanston continues to attract middle-class residents, and it persists as one of the most vibrant and stable communities in the Chicago metropolitan area. Evanston is well-connected to the Chicago region. It is easily accessible by the CTA Purple Line train, and by the Metra Union Pacific/North Line (UP-N) rail line. These two rail lines form a north-south spine that cuts through the Village, providing Evanstonians with excellent transit access to North Shore communities as far away as Kenosha, Wisconsin, to Chicago’s north lakefront neighborhoods, and to the Chicago Loop [2].
High-rise and mid-rise buildings take advantage of the provided robust mass-transit services by being located near them (Figure 6). The early 2000s witnessed significant mid- and high-rise developments in the Village, not unlike that of many Washington, D.C. suburbs, and most of these developments have occurred along the CTA Purple Line and Metra UP-N Corridor. New proposed projects such as the E2 towers on Emerson Street, and Fountain Square Tower on Church Street are prime examples of how Evanston is continuing to boost vertical density near mass-transit nodes. However, local residents are largely opposed to adding new high-rises to their community and Evanston has plans for only a few high-rise projects in the near future.
3.3.3. Oak Brook, IL
Oak Brook is a suburban community located 19 miles west of the Chicago Loop. It occupies a geographic area of 7.95 square miles with a population of 8041 [24]. Almost half of its land is utilized for single-family housing with 20% used for open space. It is considered a well-to-do community; its median household income is $131,082 and its median home value is $450,000. Similar to the case of Schaumburg, citizens that live or work in Oak Brook predominantly use automobiles for transportation. Three Metra stops barely serve the Oak Brook community. These are the Union Pacific West Line (UP-W) Elmhurst and Villa Park stops, located six and a half miles to the north, and the BNSF Line Hinsdale stop, located four miles south of Oak Brook. PACE buses serve the community mainly during rush hours. Similar to the case of Schaumburg, tall buildings in Oak Brook are scattered throughout the village with some concentration near the mall (Figure 6). The Village has no plans for development of tall buildings in the near future [2].
3.3.4. Skokie, IL
Skokie is a suburban community located about 14 miles northwest of the Chicago Loop. It occupies a land area of 10.06 square miles with a population of 65,176 [24]. It is partially served by mass transit, the CTA Yellow Line. It contains major companies and malls (Westfield Old Orchard Mall), as well as factories. The City of Chicago, nearly 14 miles to the south, is also clearly visible, illustrating Frank Lloyd Wright’s views that it is not wise to keep adding tall buildings to the central city. Cramming the city with masses of tall buildings ruins quality of life by increasing congestion and pollution. Instead, Wright believed that the best location for adding tall buildings is beyond the city, where tenants are empowered to enjoy both views of nature and the city. Other commercial tall buildings in Skokie are located within close proximity to the Westfield Old Orchard Mall (Figure 6).
3.3.5. Oak Park, IL
The Village of Oak Park borders the City of Chicago on the west side, and is located nine miles west of the Chicago Loop. It occupies a geographic area of 4.7 square miles with a population of 52,066 [24]. Nearly 80% of Oak Park’s total area is dedicated for residential use, with 80.7% of this use designated for single-family units. Commercial use makes up 10% of Oak Park, followed by green spaces, institutions, and transportation facilities. Oak Park has almost no vacant land and contains only 20 acres of industrial land [2]. Similar to the case of Evanston, Oak Park is well-connected to the region. It is directly connected to the Chicago Loop, O’Hare International Airport, and other suburbs via CTA Blue and Green Lines as well as eight CTA bus routes, 11 PACE bus routes, the Metra UP-W Line, and the Eisenhower Expressway (I-290). Residents are never more than four blocks away from a major transportation node. In 2008, Oak Park adopted a bicycle plan that outlines bicycle infrastructure improvements to be implemented over a 10-year period. By 2019, this plan will place bike lanes, shared lanes, and bicycle stations within a quarter mile of all residents. There are a few tall buildings in the community, located within close proximity to the three CTA Green Line train stations (Oak Park-Green, Ridgeland, and Austin) (Figure 6). The Village plans negligible development of tall buildings in the near future.
3.3.6. Arlington Heights, IL
Arlington Heights is a suburban community located 25 miles northwest of Chicago. It occupies a geographic area of 16.61 square miles with a population of 75,994 [24]. Engaged in transporting dairy products and vegetables to Chicago in the late 19th century, the Village was developed as a train station depot. The demographics of Arlington Heights indicate that it is relatively a middle-to-upper class community. The dominant race is white (83%) and the education level is considerably high with 51.7% of the population 25 years and older having earned a bachelor’s degree or higher, compared to 35.8% for the Chicago region. Household income is relatively high; 37.9% earns above $100,000 annually, compared to 28.6% for the Chicago region [2].
Arlington Heights is well served by major roads and by the Metra rail system (the Union Pacific/Northwest Line (UP-NW)). The community is situated northeast of the I-90/I-290 interchange, and its core is bisected by U.S. Route 14 (Northwest Highway). PACE bus lines also serve the southwestern edge of the Village. The majority of Arlington Heights’s land is dedicated to single-family homes, about 58%. Multi-story buildings and commercial development concentrate around the Metra station (Arlington Heights Station), creating a “downtown” (Figure 6).
3.3.7. Itasca, IL
Itasca is a suburban community located about 28 miles northwest of the Chicago Loop. It occupies a land area of 4.95 square miles with a population of 8811 [24]. It is close to O’Hare International Airport and major highway and rail networks, including the Metra Milwaukee District/W (MD-W) Line. Itasca contains a few tall buildings, including the pyramid crown of The Gallagher Centre, the second-tallest building in Chicago’s suburbs, next to Oak Brook Terrace Tower in Oak Brook. Itasca has recently lost companies to downtown Chicago, and this may partially explain why Itasca has no plans for office towers in the near future (Figure 6).
3.3.8. Oak Lawn, IL
Oak Lawn is a suburban community located about 15 miles southwest of the Chicago Loop. It occupies a land area of 8.59 square miles with a population of 57,073 [24]. In its early development, Oak Lawn attained success through thriving small businesses, postal services, saloons, and railroad development. Later, Oak Lawn bloomed with dynamic business districts consisting of manufacturing, retail, hospitals, and a vibrant transportation system. Most of the core area spreads along the main streets such as 95th Street and Cicero Avenue with a concentration of businesses at their intersection. Metra rail (SouthWest Service, SWS) and PACE buses serve Oak Lawn’s residents and facilitate affordable commute to Chicago. New retail and multi-story residential developments were recently constructed near the Metra SWS Station (Figure 6).
4. Discussion
This research embarked on an examination of the phenomenon of building tall in suburban communities in the United States. It investigated the geographic locations, spatial patterns, and distributions of tall buildings in 24 suburban communities within three major regions: Washington, D.C., Miami, and Chicago. The study explored possible sustainable spatial patterns to integrate tall buildings in future developments beyond the city core. Upon reviewing these case studies, the research identifies 10 major spatial models for integrating tall buildings into suburban communities, summarized in Table 7. Overall, these greatly varied spatial models provide a sharp contrast with the predominant spatial pattern of tall buildings in cities where tall buildings cluster in a central location(s), to create a “downtown” with a mono-focal or poly-focal skyline. Therefore, the spatial patterns of tall buildings in suburban communities are far more complex. It should be noted that these models are not mutually exclusive; they may overlap. For example, Tall Buildings and Major Highways (TB-MH) may overlap with Tall Buildings and Shopping Malls (TB-SM). That is, tall buildings could be placed within close proximity to both interstate highways and regional shopping malls. These identified 10 models are described and discussed in the following sections.
4.1. Tall Buildings and Major Highways (TB-MH)
The first model involves locating tall buildings along major highways, near interstate interchanges and beltways. This model is referred to as Tall Buildings and Major Highways (TB-MH). It represents an older and common practice. In this regard, Blair Kamin [22] writes, “A generation ago, suburban skyscrapers tended to be office buildings along highways.” The logic of this model is apparent because geographic areas near major highways take advantage of transport infrastructure that facilitates swift movements across the expansive regions. Many of the tall buildings located along major highways or near interstate interchanges are individual office towers, hotels, hospitals, and governmental facilities. As such, employees benefit from nearby transport networks in their daily commute. This model has prevailed due to cheaper land and/or unavailability of affordable rental space in central cities. Consequently, American suburbs became home to a greater share of office space in their regions than their cities. However, in recent years, we have seen a reversal of this trend as some companies in some regions have been relocating from the suburbs to central cities.
From an urban design perspective, tall buildings in this model are spatially scattered and follow no visual order. Although they enjoy great highway visibility, they often create an unpleasant drastic mismatch between towering human-made structures and the predominantly “low-rise” natural landscape [35,36,37]. However, as the metropolis has continued to expand, this model has become increasingly dysfunctional. Travel distances have become longer, and as more suburbs have emerged, many of these transport routes are increasingly congested. Consequently, the prime advantage of the TB-MH model of facilitating swift transport across suburbs is losing ground in the modern metropolis. Longer travel distances and congested roads make commutes tiresome, more expensive, time consuming, and more polluting to the environment.
4.2. Tall Buildings and Shopping Malls (TB-SM)
The second model refers to an older, more “traditional” practice, where tall buildings are located near major shopping malls. This model is referred to as Tall buildings and Shopping Malls (TB-SM). Regional malls are usually located away from the central city near the intersection of major highways or interstate interchanges. As such, shopping activities have functioned as spatial anchors for tall building developments. In the same manner, transport accessibility often found near shopping malls has fostered this model. However, the future relationship between ‘tall’ and ‘mall’ is uncertain, since there is an increasing number of underperforming, vacant, and dying malls. According to Jonathan O’Connell, the U.S. has about 1100 malls; only 100 are well performing, and the remaining are struggling or dying [38].
Due to lack of urban design regulations, many tall buildings in this model are placed in a scattered, dispersed, and incoherent manner. They do not follow a particular spatial layout, order, or hierarchy. Their heights change with little or no considerations to their spatial contexts, and their architectural treatments lack consideration for nearby low-rise environments. However, these tall buildings denote, and sometimes “frame” their business districts and nearby shopping malls, as they are visible from distant places. In the context of Kevin Lynch’s imageability urban design model that proposes five elements (path, node, landmark, district, and edge) to better understand and design the built environment, tall buildings can help in creating edges or landmarks [37]. Their outstanding heights make business and commercial places visible and identifiable from far distances.
Among the examined suburban communities that follow the TB-SM model are Schaumburg, Oak Brook, and Skokie in the Chicago region, as well as Tysons Corner in Washington, D.C. By scanning other locations of major regional shopping malls across the U.S., we find that tall buildings, in many cases, are located near them. Examples include: Scottsdale Fashion Square Mall in Scottsdale, Arizona; Westfield Garden State Plaza Mall in Paramus, New Jersey; Destiny USA Mall (previously known as the Carousel Center) in Syracuse, New York; South Coast Plaza Mall in Costa Mesa, California; and Lakewood Center Mall in Lakewood, California. In the TB-SM model, tall buildings are largely served by private automobiles. In some cases, tall buildings could benefit from mass transit that intends to serve shopping malls, as seen in the case of Schaumburg, Illinois, and Aventura, Florida.
4.3. Tall Buildings in Office Parks (TB-OP)
The third model of incorporating tall buildings into suburban communities comes in the form of office park development. This model is referred to as Tall buildings in Office Parks (TB-OP). Similar to the TB-MH and TB-SM models, office parks are usually located strategically near major highways and interstate interchanges. However, in the TB-OP model, tall buildings are located further away from major roads and hence not visible from the main highways. In the TB-OP model, tall buildings cluster to form isolated enclaves. They create “vertical density pockets” (VDP) embedded in the natural landscapes. As such, they are largely hidden from the public eye and are completely automobile dependent.
4.4. Tall Buildings and Airport City (TB-AC)
The three aforementioned models share a common element of locating tall buildings near major highways to connect to various communities in the expansive metropolis. In contrast, at the global stage, this fourth model involves locating tall buildings near major airports to connect nationally and internationally. This model is referred to as Tall Buildings and Airport City (TB-AC). An example of this model is clearly seen in Chicago’s suburban communities (e.g., Itasca, Schaumburg, and Arlington Heights), which enjoy close proximity to O’Hare International Airport. Furthermore, Crystal City and the Ballston-Rosslyn Corridor incorporate large numbers of tall buildings and take advantage of proximity to the Ronald Regan National Airport.
The TB-AC agrees with the Aerotropolis model proposed by John D. Kasarda and Greg Lindsay [39]. In their book, “Aerotropolis: The Way We’ll Live Next”, they explained that in the past airports were placed at cities’ peripheries. All activities, including airports’ ones, revolved around the city [39]. Today, this pattern has been turned inside out: activities of cities revolve around airports. Indeed, global companies increasingly locate near airports due to extensive international commercial activities. However, despite the increasing popularity of the TB-AC model, it faces a major challenge concerning the imposed height limit of buildings located near airports by the Federal Aviation Administration (FAA). Recently, the FAA, supported by airports and airline companies, has proposed reducing the allowable height of tall buildings near airports (that are within 10,000 ft from a runway and within a flight path) from 250 ft to 160 ft [40].
4.5. Tall Buildings and Waterfront Development (TB-WD)
A fifth model of integrating tall buildings into suburban communities involves waterfront development; this model is referred to as Tall Buildings and Waterfront Development (TB-WD). In this case, tall buildings are simply placed along the beachfront to take advantage of water views. Due to the warm climate and attractive natural beauty found in many coastal areas, these places are often in great demand. As such, tall building development under this model usually contains a variety of uses such as residential condominiums, apartments, hotels, commercial offices, and the like.
The TB-WD model is prevalent particularly when tourism is a factor, as is the case in Miami’s suburban communities, including Miami Beach, Sunny Isles, Bal Harbour, Golden Beach, Boca Raton, Aventura, etc. Tall buildings continue to be constructed to meet forecasted demand for tourism despite economic difficulties and hardships. New taller buildings are under construction and others are planned for construction. However, when tourism is not a factor, there could be less demand for building tall near waterfront areas in suburban locations, and consequently, their construction is less likely to occur. An example of this scenario is Evanston, Illinois, a suburb with a long waterfront along Lake Michigan. There are almost no tall buildings along the beachfront, partially because of the lack of robust tourism near this suburb.
4.6. Tall Buildings in Gated Communities (TB-GC)
The next model involves clustering tall buildings to create “vertical gated communities”; this model is referred to as Tall Buildings in Gated Communities (TB-GC). This model was observed particularly in some Miami suburbs, for example in the Aventura and Boca Raton communities. Aventura provides many cases where two-to-five tall buildings cluster to create their own internal world that enjoys private and exclusive amenities and services such as golf courses, parks, and marinas. Exclusivity is also reinforced by transportation means. Many of these communities have poor public transport and they depend largely on private automobiles. We may describe this model as “vertical cul-de-sacs,” for it disconnects residents from the rest of the community as the cul-de-sac does. In her influential book, Death and Life of American Cities (1961), Jane Jacobs objected all kinds of gated communities including the ones formed by high-rise developments [41]. The anonymity and exclusivity promoted by this model hinder public and civic engagement.
4.7. Tall Buildings in Suburban Downtown (TB-SD)
A seventh model of tall buildings development in suburban locations involves clustering buildings to create a “downtown”; this model is referred to it as Tall Buildings in Suburban Downtown (TB-SD). This type occurs mostly in inner suburbs that are contiguous to the central city. These suburbs are attractive because they enjoy cheaper land, quiet and peaceful environments, and are close to urban cores. Because of close proximity to the city, these suburbs usually integrate some form of public and mass transit that runs into their “downtowns”. A clear example is provided by the suburban community of Evanston, which borders Chicago. Evanston is served by multiple mass-transit systems, including the Chicago Transit Authority and Metra.
In the second-ring suburbs, clustered tall buildings may take advantage of nearness to major transport hubs such as rail. For example, tall buildings in Kendall, FL, cluster to form a “downtown” near the Metrorail Dadeland South Station that connects Kendall directly to downtown Miami. The TB-SD model is also observed in places such as Bellevue in Washington and Clayton in Missouri. These places are characterized by substantial concentration of tall buildings of significant height so they resemble downtowns of central cities.
4.8. Tall Buildings Around New Nodes (TB-NN)
In the TB-SD model, tall buildings cluster in a central location to create a “downtown.” Tall buildings may also cluster in suburban communities to anchor new urban nodes. This model is referred to as TB-NN. In this model, a few high-rises, and potentially mid-rises, cluster to create residential, commercial office, or mixed-use communities. Examples of this model are found in some Miami suburban communities such as Coral Gables and Skokie. These new urban nodes evoke “revival” to the community and may spur further development.
4.9. Tall Buildings Along Major Corridors (TB-MC)
Similar to the case of clustering buildings to create new urban nodes, tall buildings may cluster along major corridors to reinforce corridors’ imageability and functionality. This model is referred to as Tall Buildings along Major Corridors (TB-MC). Unlike the TB-HW model, where tall buildings are located “externally” along major highways or near interstate interchanges, in the TB-MC model, tall buildings are located within the community to denote new major developments. We find this model prevalent in inland suburbs such as Coral Gables and Oak Park.
4.10. Tall Buildings and Transit Oriented Development (TB-TOD)
The tenth and most promising model in present and future practices integrates tall building development near major transit nodes, particularly rails. Interestingly, this model is rooted in the history of development of many suburban communities in the United States, such as that of Chicago. This model is referred to as Tall Buildings and Transit-Oriented Development (TB-TOD). Currently, the Washington, D.C. region champions this model as demonstrated in many of its suburban communities including Reston, Tysons Corner, Bethesda, North Bethesda, Silver Spring, Crystal City, Rockville, and the Rosslyn-Ballston Corridor [42].
Similar to Washington, D.C., the Chicago region enjoys a substantial rail system and tries to follow the same TB-TOD model. John T. Slania explains this new trend in Chicago in a recent article in 2014, titled “‘Transit-oriented’ development bringing new life to suburban commuter towns”. He states:
It’s almost a no-brainer: suburban development works best when it happens along rail lines, where commuters cluster and attract restaurants and retailers to downtowns dotting the tracks. It’s the model of our fathers, the men in the gray flannel suits, who moved to the suburbs after World War II and boarded the train for the daily commute to Chicago ([2], p. 5).
The Chicago region has also been following this model, as seen in the cases of Arlington Heights, Oak Lawn, and Oak Park. Some of the TB-TOD examples are striking and drastic in terms of the alterations they bring about. For example, Tysons Corner—traditionally a quintessential automobile-dependent edge city—is being transformed into a sustainable suburban community by redirecting growth around the newly constructed four mass-transit stations. Many metropolitan regions are reconfiguring their mass-transit systems to correspond to locations of high density and tall buildings’ clusters (e.g., City of Toronto) [43]. As the City of Toronto is expanding its rail lines and bus services, it is making sure that they align with tall buildings’ clusters.
Arlington Heights has created tax increment financing (TIF) districts to make it attractive for developers to build high-rise condominiums. In turn, these new residential buildings have encouraged the development of services and amenities, including shops and restaurants [44]. Collectively, these projects have increased foot traffic and reinvigorated the once declining downtown. Professor Rachel Weber at the University of Illinois at Chicago explains that “it’s kind of a back to the future phenomenon” ([2], p. 6). Many Chicago suburbs grew up around rail lines; examples include Arlington Heights, Geneva, La Grange, Libertyville, Wheaton, and Wilmette. Charles Witherington-Perkins, Arlington Village’s director explained: “In the early days, there was a lot of controversy, especially about the high-rises and the parking. But the idea is that you have to create some kind of density (of people) to make it work” [45]. Economic factors and changing demographics are prompting suburbanites to take a second look at commuter rail.
5. Justifications of the TB-TOD Model
Among the key factors that justify the TB-TOD model are:
- high land values near transit stations;
- boosting ridership;
- supporting mixed-use development;
- fostering agglomeration and economic gains; and
- facilitating regional connectivity
5.1. Land Values
Land prices near transit stations are likely to increase; and consequently, building upward is needed to make up for the cost of the land [46]. Overall, constructing tall buildings has always been necessitated by increased land values and prices. Recent ULI’s research by MacCleery has concluded that proximity to public transit does increase land values as much as 41.6% better than land located farther away [47]. In a nutshell, increased land cost near mass-transit nodes demands building upward.
5.2. Ridership
Simply, tall buildings increase ridership, which is desperately needed to sustain mass-transit service in low-density suburban communities. Figure 7 diagrammatically shows the symbiotic relationship between tall buildings and ridership. Figure 8, Figure 9 and Figure 10 explain how tall buildings boost ridership along the R-B Corridor in Washington. D.C. These figures clearly illustrate that ridership in Rosslyn and Ballston (where tallest buildings cluster) is the greatest. As such, correlation between tall buildings and ridership is well-established [48].
Railway transport is expensive to build, operate, and maintain; and therefore, sustaining ridership must be a top priority in suburban TOD projects. Design elements and policies should work together to ensure adequate ridership (Figure 11). Already, many suburban TOD projects suffer from low ridership. Examples of this serious problem are found in TOD projects such as in Tinley Park, Oak Park, and Oak Lawn in Illinois; and in Orenco, Hillsboro, Portland, among others.
As common to TOD projects, the quarter and half- mile radii areas around mass-transit stations are most important to support ridership. Therefore, applying vertical density in these areas helps to augment ridership. In the examined suburbs in Washington, D.C., the vast majority of tall buildings (82%) are located within a 5-min/quarter-mile radius from mass transit stations and 75% of ridership comes from this catchment area. Certainly, the concentration of tall buildings within this radius contributes to this significant level of ridership. The need for vertical density within this area is further emphasized because much of this area is already taken by the station itself, by foot- and auto-traffic networks and circulation (roads, parking, drop-off and pick-up areas, sidewalks, walkways, etc.) and by ground level retail, and open spaces and plazas required to accommodate passengers’ flows in and out of the station. Consequently, it is necessary to build upward in the half-mile radius to increase ridership and accommodate various activities and functions that compete for this limited space.
Tall buildings house a large number of people. In addition, trains enjoy high capacity in transporting large crowds of people (Figure 12). A single rail line can deliver thousands of people per hour per track. In contrast, a highway delivers far fewer people per hour per lane. Research shows that a single rapid transit track can carry over 40,000 passengers per direction per hour. In cases of extreme congestion, the rail capacity may exceed 70,000 per track per hour per direction [27,46,49]. Therefore, locating tall buildings near mass transit provides a mutually beneficial relationship: tall buildings help in supplying large ridership so that the rail transport is sustained. Similarly, trains help in providing “green” means to transport large crowds of tall buildings. This further illustrates the mutually supportive relationship between ‘tall’ and ‘rail’.
5.3. Mixed-Use Development
In addition to supporting ridership, tall buildings can support mixed-use developments by accommodating more people who enlarge the customer base of shops and businesses. The TB-TOD model increases people density and boosts foot traffic (i.e., pedestrians that travel to and from the transit stations), which helps to support ground-floor retail in particular. The TB-TOD underscores pedestrian-friendly walkways and visually compelling streetscapes by creating vibrant, popular, and healthy economic cores that pay for amenities while decreasing the use of automobiles and reducing traffic congestion and environmental pollution. Through policies and incentives, plans should support good architecture and urban design that reinforce the unique character of local areas and clearly demarcate the TB-TOD zones from the surrounding low-density residential areas, as seen in the examined cases of the Washington, D.C. region [2,16,48].
5.4. Agglomeration and Economic Gains
The TB-TOD model supports agglomeration around mass-transit nodes by intensifying a spectrum of human activities in a small location. Consequently, this planning model increases productivity and economic gains. High concentrations of activities also create “knowledge spillovers” between different activities that foster innovation and enhance competition [49]. Quantitatively, a worker’s productivity may increase between 12–22% when placed in a double employment density area [2]. Therefore, the TB-TOD model not only increases efficiency in reducing travel time and shortening distances, but it also provides economic gain.
5.5. Regional Connectivity
For the future American metropolis, the TB-TOD model is envisioned to facilitate transit nodes that connect suburbs with the central city and with other suburbs. It offers a hybrid model characterized by centeredness (in terms of densifying activities around transit nodes), and decentralization (in terms of spreading the nodes around the region). As such, it has the potential to integrate and serve the increasingly fragmented and polycentric regions. The TB-TOD model improves suburban access, reduces the vehicle miles traveled (VMT) and associated air pollution, and supports walkable environments (Figure 13).
6. Challenges
The TB-TOD model is clearly one part of the solution to transform unhealthy sprawling suburban development patterns into more sustainable ones. However, on practical grounds, tall building developments in suburbs can evoke serious criticism and face barriers and challenges, which include strict zoning codes, suburban incompatibility, skyline change, lack of placemaking, disregard of human scale, parking problems, and higher construction and operational costs. Among the salient challenges are limited transit lines in suburban places, community resistance, and increasing density.
6.1. Limited Transit Lines
A major challenge for implementing the TB-TOD model is that American suburbs contain scarce transit lines. However, looking into the future, there are many efforts underway to build all types of rail transportation across the geographic scales in the United States. A vision is set for the 21st century that includes a 27,200-km (17,000-mi) national high-speed rail system, suggested to be built in four phases and completed by 2050. The system is envisioned at local, regional, and national levels [50]. Consequently, planners should play a proactive role in spotting opportunities to implement TB-TOD. As seen in the examined case studies, planners and politicians in Arlington, Virginia, persisted on building the metro line and suburban communities around it.
6.2. Community Resistance
Generally speaking, high-rise residential living in American suburbs is unpopular. For example, our review of recent developments of tall buildings in Chicago’s suburbs found that many suburban communities have objected to their introduction. Community concerns include overcrowding, traffic congestion, difficulty in finding parking, opposition to new construction in neighborhoods, “not in my backyard” (NIMBY) sentiments, increased noise and air pollution, encroachment upon residential privacy, damaging local character, and the like.
In order to mitigate potential resistance, planners and developers need to present the community with a clear articulation of benefits and create measures to ensure that existing single-family homes are buffered from large development (e.g., by stepping down heights and densities), as demonstrated in Washington’s D.C. suburban communities (Figure 14 and Figure 15). A thoughtful integration of existing and new development—residential and business—is an important component in efforts to win community support. Innovative architectural design can also help to mitigate the problems of feeling “claustrophobic” and disconnected from nature by employing slim volumes to ensure that all interior spaces are exposed directly to outdoor environments and sunlight. New designs are increasingly providing green terraces and roof gardens that lessen the problem of losing touch with nature in tall buildings [51].
6.3. Increasing Density
Importantly, not all suburbs can handle increased density. Many suburbs rely on interstate highways for commuting to the urban core and to other suburbs. Furthermore, “reverse” commutes between the urban core and suburbs have become more prevalent, highlighting the importance of these highways. In addition, these highways serve freight transport, which has been increasing exponentially in recent years. As such, ensuring smooth traffic flow on these highways is economically crucial because they allow the movement of goods across cities, states, and even neighboring nations. In particular, online retail activities have increased freight transport exponentially (Figure 16); and many of these highways are already congested and cannot handle adding more traffic. Unfortunately, freight transport involves heavyweight vehicles that cause substantial damage to roads. Repairing roads often leads to closing lanes that exacerbates traffic congestion. Therefore, suburban communities must require that developers undertake a robust traffic analysis as part of their land entitlement process to ensure that increasing density will not result in increased congestion.
Indeed, there could be a “tipping point” for density, where adding more density beyond that point will result in decreasing quality of life [52,53,54,55] (Figure 17). The tipping point could vary from one project to another, and as such, studies are needed to examine the tipping point for each project. Therefore, it is important to monitor density impact. Traffic must be monitored in key locations at peak hours and in peak directions. Traffic forecasts are not always accurate, and unintended overcrowding may occur due to higher demand in certain areas. Economic and social activities may unexpectedly overrun planned capacity, and hence, planned retrofits may result in unintended consequences of traffic jams and noise. Therefore, traffic engineers should conduct traffic flow counts and assess traffic patterns in key locations and at peak periods. Traffic engineers should conduct surveys and counts to determine mode split, transit and automobile usage at employment, residential, and retail sites. Planners and architects also need to conduct user satisfaction surveys to learn about tenants’ experiences of new and retrofitted suburban spaces. These surveys could be conducted at five-year intervals or so, depending on the traffic situation. The first surveys, before implementing TB-TOD, would serve as a baseline of measurement; subsequent surveys would include the impact of the introduced developments.
7. Concluding Remarks
Overall, this research tackles intricate, complex, and interrelated issues concerning sustainable ways to incorporate vertical density in suburbia. Vertical density is an important component of compact developments and the challenge is figuring out where and when to apply it so that future growth is accommodated in a sustainable and resilient manner. Specifically, this research investigated methods of integrating tall buildings into suburbia and examined the role of spatial patterns of tall buildings in promoting “sustainable” developments. By examining 24 suburbs located in three regions (Washington, D.C., Miami, and Chicago), the study identified 10 different spatial patterns of tall buildings as follows:
- Tall Buildings and Major Highways (TB-MH);
- Tall Buildings and Shopping Malls (TB-SM);
- Tall Buildings in Office Parks (TB-OP);
- Tall Buildings and Airport City (TB-AC);
- Tall Buildings and Waterfront Development (TB-WD);
- Tall Buildings in Gated Communities (TB-GC);
- Tall Buildings in Suburban Downtown (TB-SD);
- Tall Buildings around New Nodes (TB-NN);
- Tall Buildings along Major Corridors (TB-MC);
- Tall Buildings and Transit-Oriented-Development (TB-TOD).
The study argued that the Tall buildings and Transit-Oriented-Development (TB-TOD) model is one of the most appropriate to integrate tall buildings into the metropolis. The case studies examined in the Washington, D.C. region vividly illustrate this model. Importantly, locating tall buildings in suburbs away from mass transit is a “triple” mistake. First, such a planning strategy will reinforce the use of the automobile as the sole means of transport; thus, increasing vehicle miles traveled (VMT). Second, automobile travel damages the environment by increasing air and water pollution. Third, increasing automobile dependence in a concentrated fashion, as tall buildings may do, will potentially increase traffic congestion in neighborhoods, and clog nearby arterials and major highways. Therefore, increasing suburban density without proper planning may make suburban communities even more unsustainable through increasing travel demand, fostering traffic congestion, and generating more CO2 emission. Greater densities could result in compromising pedestrian spaces and increasing encroachment on natural environments. As such, the integration of tall buildings should consider providing open spaces, respect human scale, ease parking problems, support local services and facilities, and augment public transport [52].
8. Future Research
This research investigated tall buildings in three regions in the United States, including Washington, D.C., Miami, and Chicago. Future studies may further examine this phenomenon in other suburban communities in the same regions or in other regions in the United States, as well as in other countries such as Canada and Australia. For example, Toronto’s suburbs have been extremely active in constructing tall buildings. Similarly, many Australian suburbs (for example Sydney, Melbourne, and Brisbane) have been planning and constructing tall buildings.
Future research could also examine tall buildings in edge cities and the possibilities of retrofitting them. Interestingly, Tysons Corner near Washington, D.C. is a known example of an unsustainable edge city, but serious plans are underway to transform it into a sustainable place. Major plans will concentrate future developments around the four newly completed stations. Future research is needed to assess the effectiveness of this project and to identify transferable lessons to other edge cities. Similar to Tysons, many of these edge cities are considered to be unsustainable places, and future research may examine the opportunity to transform them into more sustainable places.
Funding
This project received no funding.
Acknowledgments
The author deeply thanks reviewers for reading and commenting on this long paper. It has been difficult to cut information without compromising on the contents. All maps and graphics are by the author unless noted. In addition, the author from the noted sources compiled all tables.
Conflicts of Interest
The author declares no conflict of interest.
References
- Dunham-Jones, E.; Williamson, J. Retrofitting Suburbia; Wiley: New York, NY, USA, 2011. [Google Scholar]
- Al-Kodmany, K. New Suburbanism: Sustainable Tall Building Development; Routledge: New York, NY, USA, 2016. [Google Scholar]
- Forsyth, A. Defining Suburbs. J. Plan. Lit. 2012, 27, 270–281. [Google Scholar] [CrossRef] [Green Version]
- Wood, A.; Du, P. Dense Downtown vs. Suburban Dispersed: A Pilot Study on Urban Sustainability. In Proceedings of the “Cities to Megacities: Shaping Vertical Dense Urbanism” by the Council of Tall Buildings and Urban Habitat, Shenzhen, Guangzhou and Hong Kong, China, 16–21 October 2016; pp. 34–50. [Google Scholar]
- Du, P.; Wood, A.; Stephens, B.; Song, X. Life-Cycle Energy Implications of Downtown High-Rise vs. Suburban Low-Rise Living: An Overview and Quantitative Case Study for Chicago. Buildings 2015, 5, 1003–1024. [Google Scholar] [CrossRef] [Green Version]
- Williamson, J. Designing Suburban Futures: New Models from Build a Better Suburb; Island Press: Washington, DC, USA, 2013. [Google Scholar]
- Kotkin, J. The New Suburbanism: A Realist’s Guide to the American Future; The Planning Center: Costa Mesa, CA, USA, 2005. [Google Scholar]
- Chakrabarti, V. A Country of Cities: A Manifesto for an Urban America; Metropolis Books: New York, NY, USA, 2013. [Google Scholar]
- Duany, A.; Plater-Zyberk, E.; Speck, J. Suburban Nation: The Rise of Sprawl and the Decline of the American Dream; Farrar, Straus and Giroux: New York, NY, USA, 2000. [Google Scholar]
- Gallagher, L. The End of the Suburbs: Where the American Dream Is Moving; Reprinted by Portfolio; Penguin: London, UK, 2014. [Google Scholar]
- Kunstler, J.H. The Geography of Nowhere: The Rise and Decline of America’s Man-Made Landscape; Simon & Schuster: New York, NY, USA, 1994. [Google Scholar]
- McLennan, J. Density and Sustainability: A Radical Perspective. Trim Tab, Second Quarter. 2009. Available online: http://www.thescavenger.net/social-justice-sp-24912/environment/198-density-and-sustainability-a-radical-perspective-8493.html (accessed on 15 August 2018).
- Nelson, A.C. Reshaping Metropolitan America: Development Trends and Opportunities to 2030; Island Press: Washington, DC, USA, 2013. [Google Scholar]
- Al-Kodmany, K. The Logic of Vertical Density: Tall Buildings in the 21st Century City. Int. J. High-Rise Build. 2012, 1, 131–148. [Google Scholar]
- De Jong, J. New Sub Urbanism; Routledge: London, UK, 2013. [Google Scholar]
- Al-Kodmany, K.; Ali, M. The Future of Cities: Tall Buildings and Urban Design; WIT Press: Southhampton, UK, 2012. [Google Scholar]
- Du, P.; Wood, A.; Ditchman, N.; Stephens, B. Life Satisfaction of Downtown High-Rise vs. Suburban Low-Rise Living: A Chicago Case Study. Sustainability 2017, 9, 1052. [Google Scholar] [CrossRef]
- Al-Kodmany, K. Eco-Towers: Sustainable Cities in the Sky; WIT Press: Southhampton, UK, 2015. [Google Scholar]
- Al-Kodmany, K. Placemaking by Tall Buildings. J. Urban Int. 2011, 16, 252–269. [Google Scholar] [CrossRef]
- Al-Kodmany, K. Sustainability and the 21st Century Vertical City: A Review of Design Approaches of Tall Buildings. Buildings 2018, 8, 40. [Google Scholar] [CrossRef]
- Ali, M.M.; Al-Kodmany, K. Tall Buildings and Urban Habitat of the 21st Century: A Global Perspective. Build. J. 2012, 2, 384–423. [Google Scholar] [CrossRef]
- Kamin, B. Suburban Tall Meets Suburban Sprawl. Chicago Tribune Online. 14 February 2010. Available online: http://articles.chicagotribune.com/2010–02–14/classified/ct-met-kamin-suburban-tall-20100213_1_skyscraper-frank-lloyd-wright-tallest-building (accessed on 15 August 2018).
- Reston Association. Reston Development and Redevelopment. Available online: http://www.reston.org/DevelopmentFutureofReston/DevelopmentFutureOverview/tabid/833/Default.aspx (accessed on 15 August 2018).
- U.S. Census Bureau. Available online: http://www.census.gov/ (accessed on 15 August 2018).
- Emporis. Available online: http://www.emporis.com/ (accessed on 15 August 2018).
- Arlington County. Rosslyn-Ballston Corridor: Retail Action Plan. 2001. Available online: http://arlingtonva.s3.amazonaws.com/wp-content/uploads/sites/31/2014/03/RB-Retail-Plan1.pdf (accessed on 15 August 2018).
- Montgomery County. Available online: http://www.montgomerycountymd.gov/index.aspx (accessed on 15 August 2018).
- Silver Spring Center. Downtown Silver Spring’s Upcoming Wave of Development. 2014. Available online: http://urbanmidatlantic.blogspot.com/2014/11/downtown-silver-springs-upcoming-wave.html (accessed on 15 August 2018).
- Garreau, J. Edge City; Doubleday: New York, NY, USA, 1991. [Google Scholar]
- Fairfax County. Available online: http://www.fairfaxcounty.gov/tysons/ (accessed on 15 August 2018).
- City of Alexandria. Available online: https://alexandriava.gov/ (accessed on 15 August 2018).
- O’Connell, J. National Science Foundation Headquarters Will Move from Ballston to Alexandria. The Washington Post Online. 7 June 2013. Available online: http://www.washingtonpost.com/local/national-science-foundation-headquarters-will-move-from-ballston-toalexandria/2013/06/07/43ec85b2-cfac-11e2-8845-d970ccb04497_story.html (accessed on 15 August 2018).
- Kleinberg, K.; Parks, A.M.; Gillan, J. Miami Beach: A History; Centennial Press: Kewaskum, WI, USA, 1994. [Google Scholar]
- Dellagloria, R. Historian’s New Project: Aventura. Miami Herald Online. 2 January 2009. Available online: http://www.sethbramsonbooks.com/SethBramsonBooks/Press_Room_files/Historian%27s%20New%20project%20-Aventura.pdf (accessed on 15 August 2018).
- Al-Kodmany, K. Guidelines for Enhancing Placemaking with Tall Buildings. Int. J. Archit. Res. 2018, 12, 5–23. [Google Scholar] [CrossRef]
- City of Skokie. Available online: http://www.skokie.org/ (accessed on 15 August 2018).
- Lynch, K. The Image of the City; MIT Press: Cambridge, MA, USA, 1960. [Google Scholar]
- O’Connell, J. The Fall and Overhaul of the American Mall. The Washington Post. 30 January 2015. Available online: http://www.washingtonpost.com/business/capitalbusiness/the-fall--and-overhaul--of-the-american-mall/2015/01/30/cf9f05f4-a650-11e4-a7c2-03d37af98440_story.html (accessed on 15 August 2018).
- John, D.; Kasarda, J.D.; Lindsay, G. Aerotropolis: The Way We’ll Live Next; Penguin Group: London, UK, 2010. [Google Scholar]
- Lowy, J. Tall Buildings Reduction Near Airports Proposed. Claims Journal Online. 30 June 2014. Available online: http://www.claimsjournal.com/news/national/2014/06/30/251089.htm (accessed on 15 August 2018).
- Jacobs, J. The Death and Life of Great American Cities; Random House: New York, NY, USA, 1961. [Google Scholar]
- Meyer, E. An Oasis of Stability Amid a Downturn. The New York Times Online. 6 October 2009. Available online: http://www.nytimes.com/2009/10/07/realestate/commercial/07ballston.html?pagewanted=all&_r=0 (accessed on 15 August 2018).
- Blackett, M. High Rise Apartments and Transit City Project in the City of Toronto. 2008. Available online: spacingtoronto.ca/2008/05/02/high-rise-apartments-and-transit-city/ (accessed on 15 August 2018).
- Al-Kodmany, K. The Vertical City: A Sustainable Development Model; WIT Press: Southampton, UK, 2018. [Google Scholar]
- Landau, S.B.; Williams, C. Rise of the New York Skyscraper, 1865–1913; Yale University Press: New Haven, CT, USA; London, UK, 1996. [Google Scholar]
- Cervero, R. Suburban Gridlock; CUPR/Transaction: Edison, NJ, USA, 2013. [Google Scholar]
- MacCleery, R. ULI Research Roundup: The Impact of Transit on Property Values. 2013. Available online: http://uli.org/infrastructure-initiative/uli-research-roundup-the-impact-of-transit-on-propertyvalues/ (accessed on 1 June 2015).
- Litman, T. Land Use Impacts on Transport. Victoria Transport Policy Institute. 2011. Available online: www.reconnectingamerica.org/assets/Uploads/Land-Use-Impacts.pdf (accessed on 15 August 2018).
- Audretsch, D. Agglomeration and the Location of Innovative Activity. Oxf. Rev. Econ. Policy 2008, 14, 18–29. [Google Scholar] [CrossRef]
- Transit Cooperative Research Program (TCRP). The Role of Transit in Creating Livable Metropolitan Communities. 1997. Available online: http://www.reconnectingamerica.org/assets/Uploads/bestpractice170.pdf (accessed on 15 August 2018).
- Joint Center for Housing Studies of Harvard University (JCHSHU). 2013. Available online: http://www.jchs.harvard.edu/sites/jchs.harvard.edu/files/jchs_americas_rental_housing_2013_1_0.pdf (accessed on 15 August 2018).
- Mann, T. Building Economics for Architects; John Wiley & Sons: New York, NY, USA, 1992. [Google Scholar]
- Campoli, J.; MacLean, A. Visualizing Density; Lincoln Institute of Land Policy: Cambridge, UK, 2007. [Google Scholar]
- Urban Land Institute (ULI). Getting Density Right: Tools for Creating Vibrant Compact Development; National Multi Housing Council, Urban Land Institute: Washington, DC, USA, 2008. [Google Scholar]
- Li, J. Study: Online Shopping Behavior in the Digital Era. Forrester Research Online Retail Forecast, 2010 to 2017. 10 May 2013. Available online: http://www.iacquire.com/blog/study-online-shopping-behavior-in-the-digital-era (accessed on 15 August 2018).
Figure 1.
Locations of the examined suburbs in the Washington, D.C. Metropolitan Area (Map by author).
Figure 1.
Locations of the examined suburbs in the Washington, D.C. Metropolitan Area (Map by author).

Figure 2.
Spatial patterns of tall buildings in suburban communities of Washington, D.C. Metropolitan Area. Each map shows the locations of the ten tallest buildings in its respective suburb.
Figure 2.
Spatial patterns of tall buildings in suburban communities of Washington, D.C. Metropolitan Area. Each map shows the locations of the ten tallest buildings in its respective suburb.

Figure 3.
Locations of the examined suburbs in the Miami Metropolitan Area.

Figure 4.
Spatial patterns of tall buildings in suburban communities of Miami Metropolitan Area. Each map shows the locations of the ten tallest buildings in its respective suburb.
Figure 4.
Spatial patterns of tall buildings in suburban communities of Miami Metropolitan Area. Each map shows the locations of the ten tallest buildings in its respective suburb.

Figure 5.
Locations of the examined suburbs in the Chicago Metropolitan Area.

Figure 6.
Spatial patterns of tall buildings in suburban communities of Miami Metropolitan Area. Each map shows the locations of the ten tallest buildings in its respective suburb.
Figure 6.
Spatial patterns of tall buildings in suburban communities of Miami Metropolitan Area. Each map shows the locations of the ten tallest buildings in its respective suburb.

Figure 7.
Tall buildings and rail transit feature mutually supportive relationship.

Figure 8.
The spatial distribution of the tallest buildings in the Ballston-Rosslyn Corridor, Arlington, VA. They are clustered within a quarter-mile radius of their respective metro stations in the five neighborhoods: Ballston, Virginia Square, Clarendon, Courthouse, and Rosslyn.
Figure 8.
The spatial distribution of the tallest buildings in the Ballston-Rosslyn Corridor, Arlington, VA. They are clustered within a quarter-mile radius of their respective metro stations in the five neighborhoods: Ballston, Virginia Square, Clarendon, Courthouse, and Rosslyn.

Figure 9.
Metro ridership in the Rosslyn-Ballston Corridor. Red dots represent locations of transit stations, and grey bars represent ridership. When comparing Figure 8 and Figure 9, note that highest ridership coincides with tall buildings clusters.

Figure 10.
Metro ridership in Washington, D.C. region. Red bars represent location of transit stations and their ridership.
Figure 10.
Metro ridership in Washington, D.C. region. Red bars represent location of transit stations and their ridership.

Figure 11.
Railway transport is expensive to build, operate, and maintain; and therefore, sustaining ridership must be a top priority particularly in suburban TOD projects. Design elements and policies should work together to ensure adequate ridership [2].
Figure 11.
Railway transport is expensive to build, operate, and maintain; and therefore, sustaining ridership must be a top priority particularly in suburban TOD projects. Design elements and policies should work together to ensure adequate ridership [2].

Figure 12.
The graph shows the green transportation priority scheme in relation to number of people crossing a 3.5 m (11.5 ft)—wide space during a one-hour period [16].
Figure 12.
The graph shows the green transportation priority scheme in relation to number of people crossing a 3.5 m (11.5 ft)—wide space during a one-hour period [16].

Figure 13.
The diagram schematically illustrates a green transportation spatial hierarchy of a multi- modal system [29].
Figure 13.
The diagram schematically illustrates a green transportation spatial hierarchy of a multi- modal system [29].

Figure 14.
Land use in relation to density and transit nodes [2].
Figure 14.
Land use in relation to density and transit nodes [2].

Figure 15.
Relationship between buildings’ heights and transit stations [16].
Figure 15.
Relationship between buildings’ heights and transit stations [16].


Figure 17.
Density “tipping point.” After a certain point, benefits of density decrease exponentially [2].
Figure 17.
Density “tipping point.” After a certain point, benefits of density decrease exponentially [2].


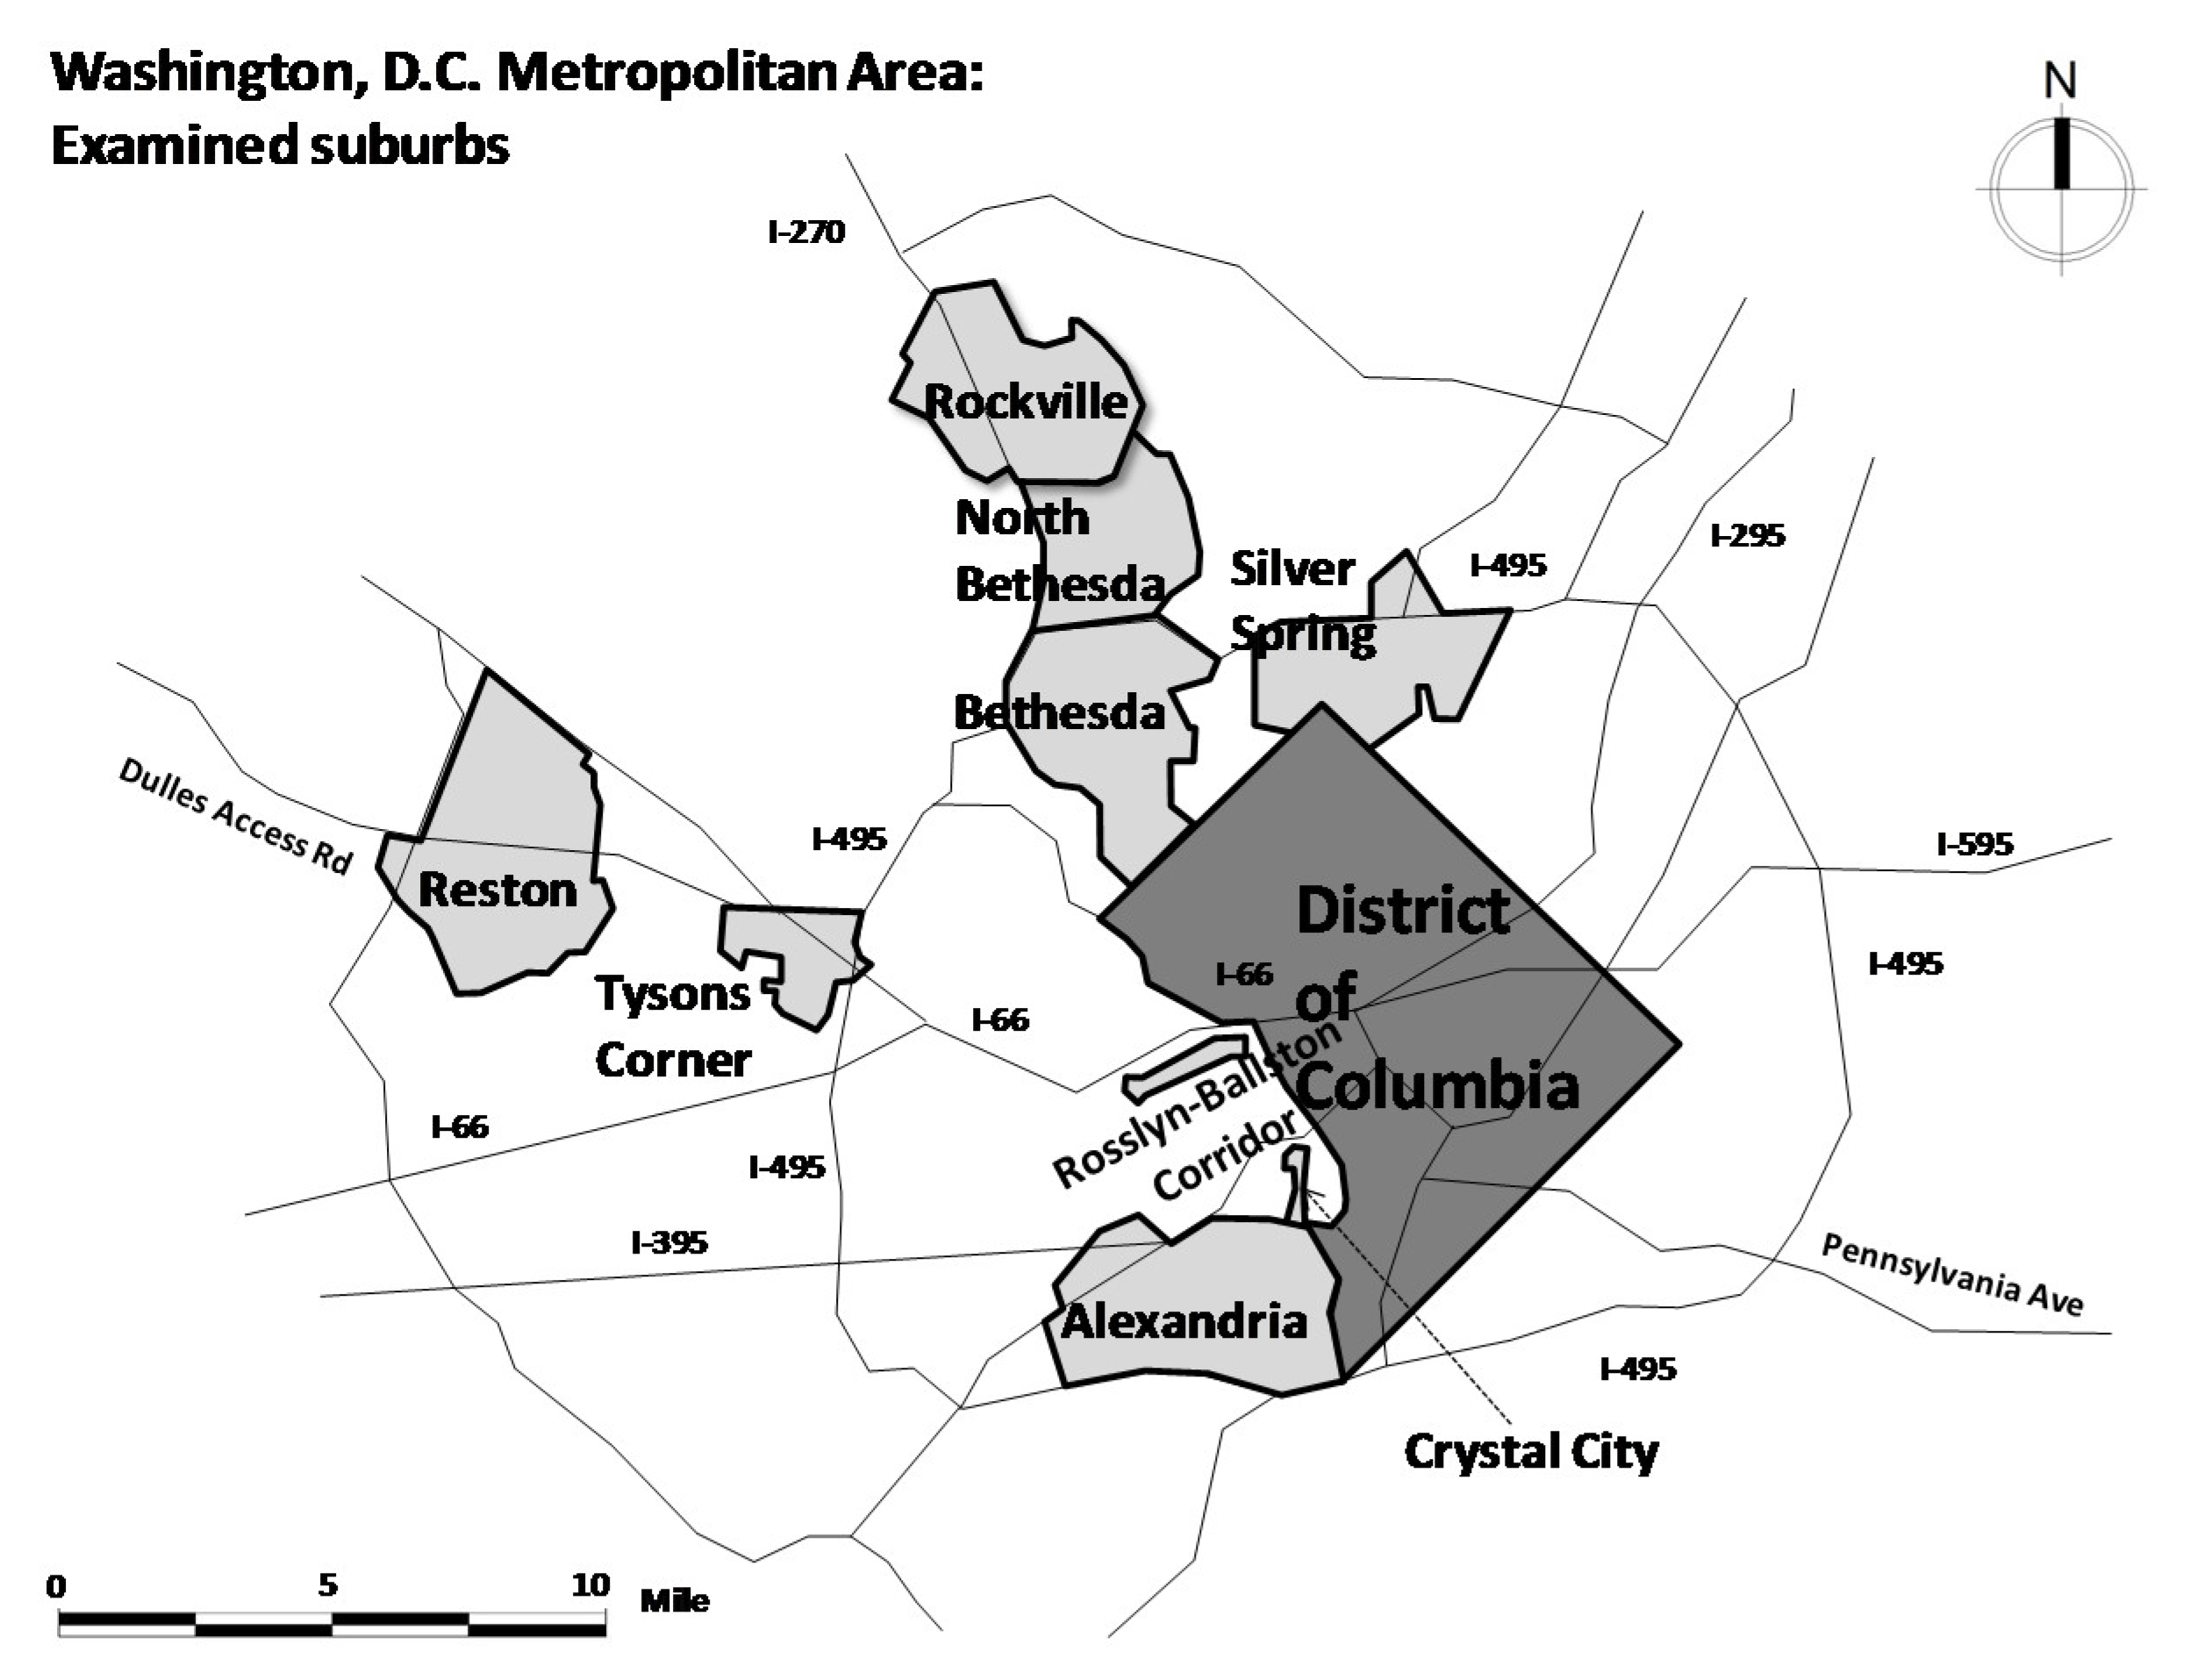
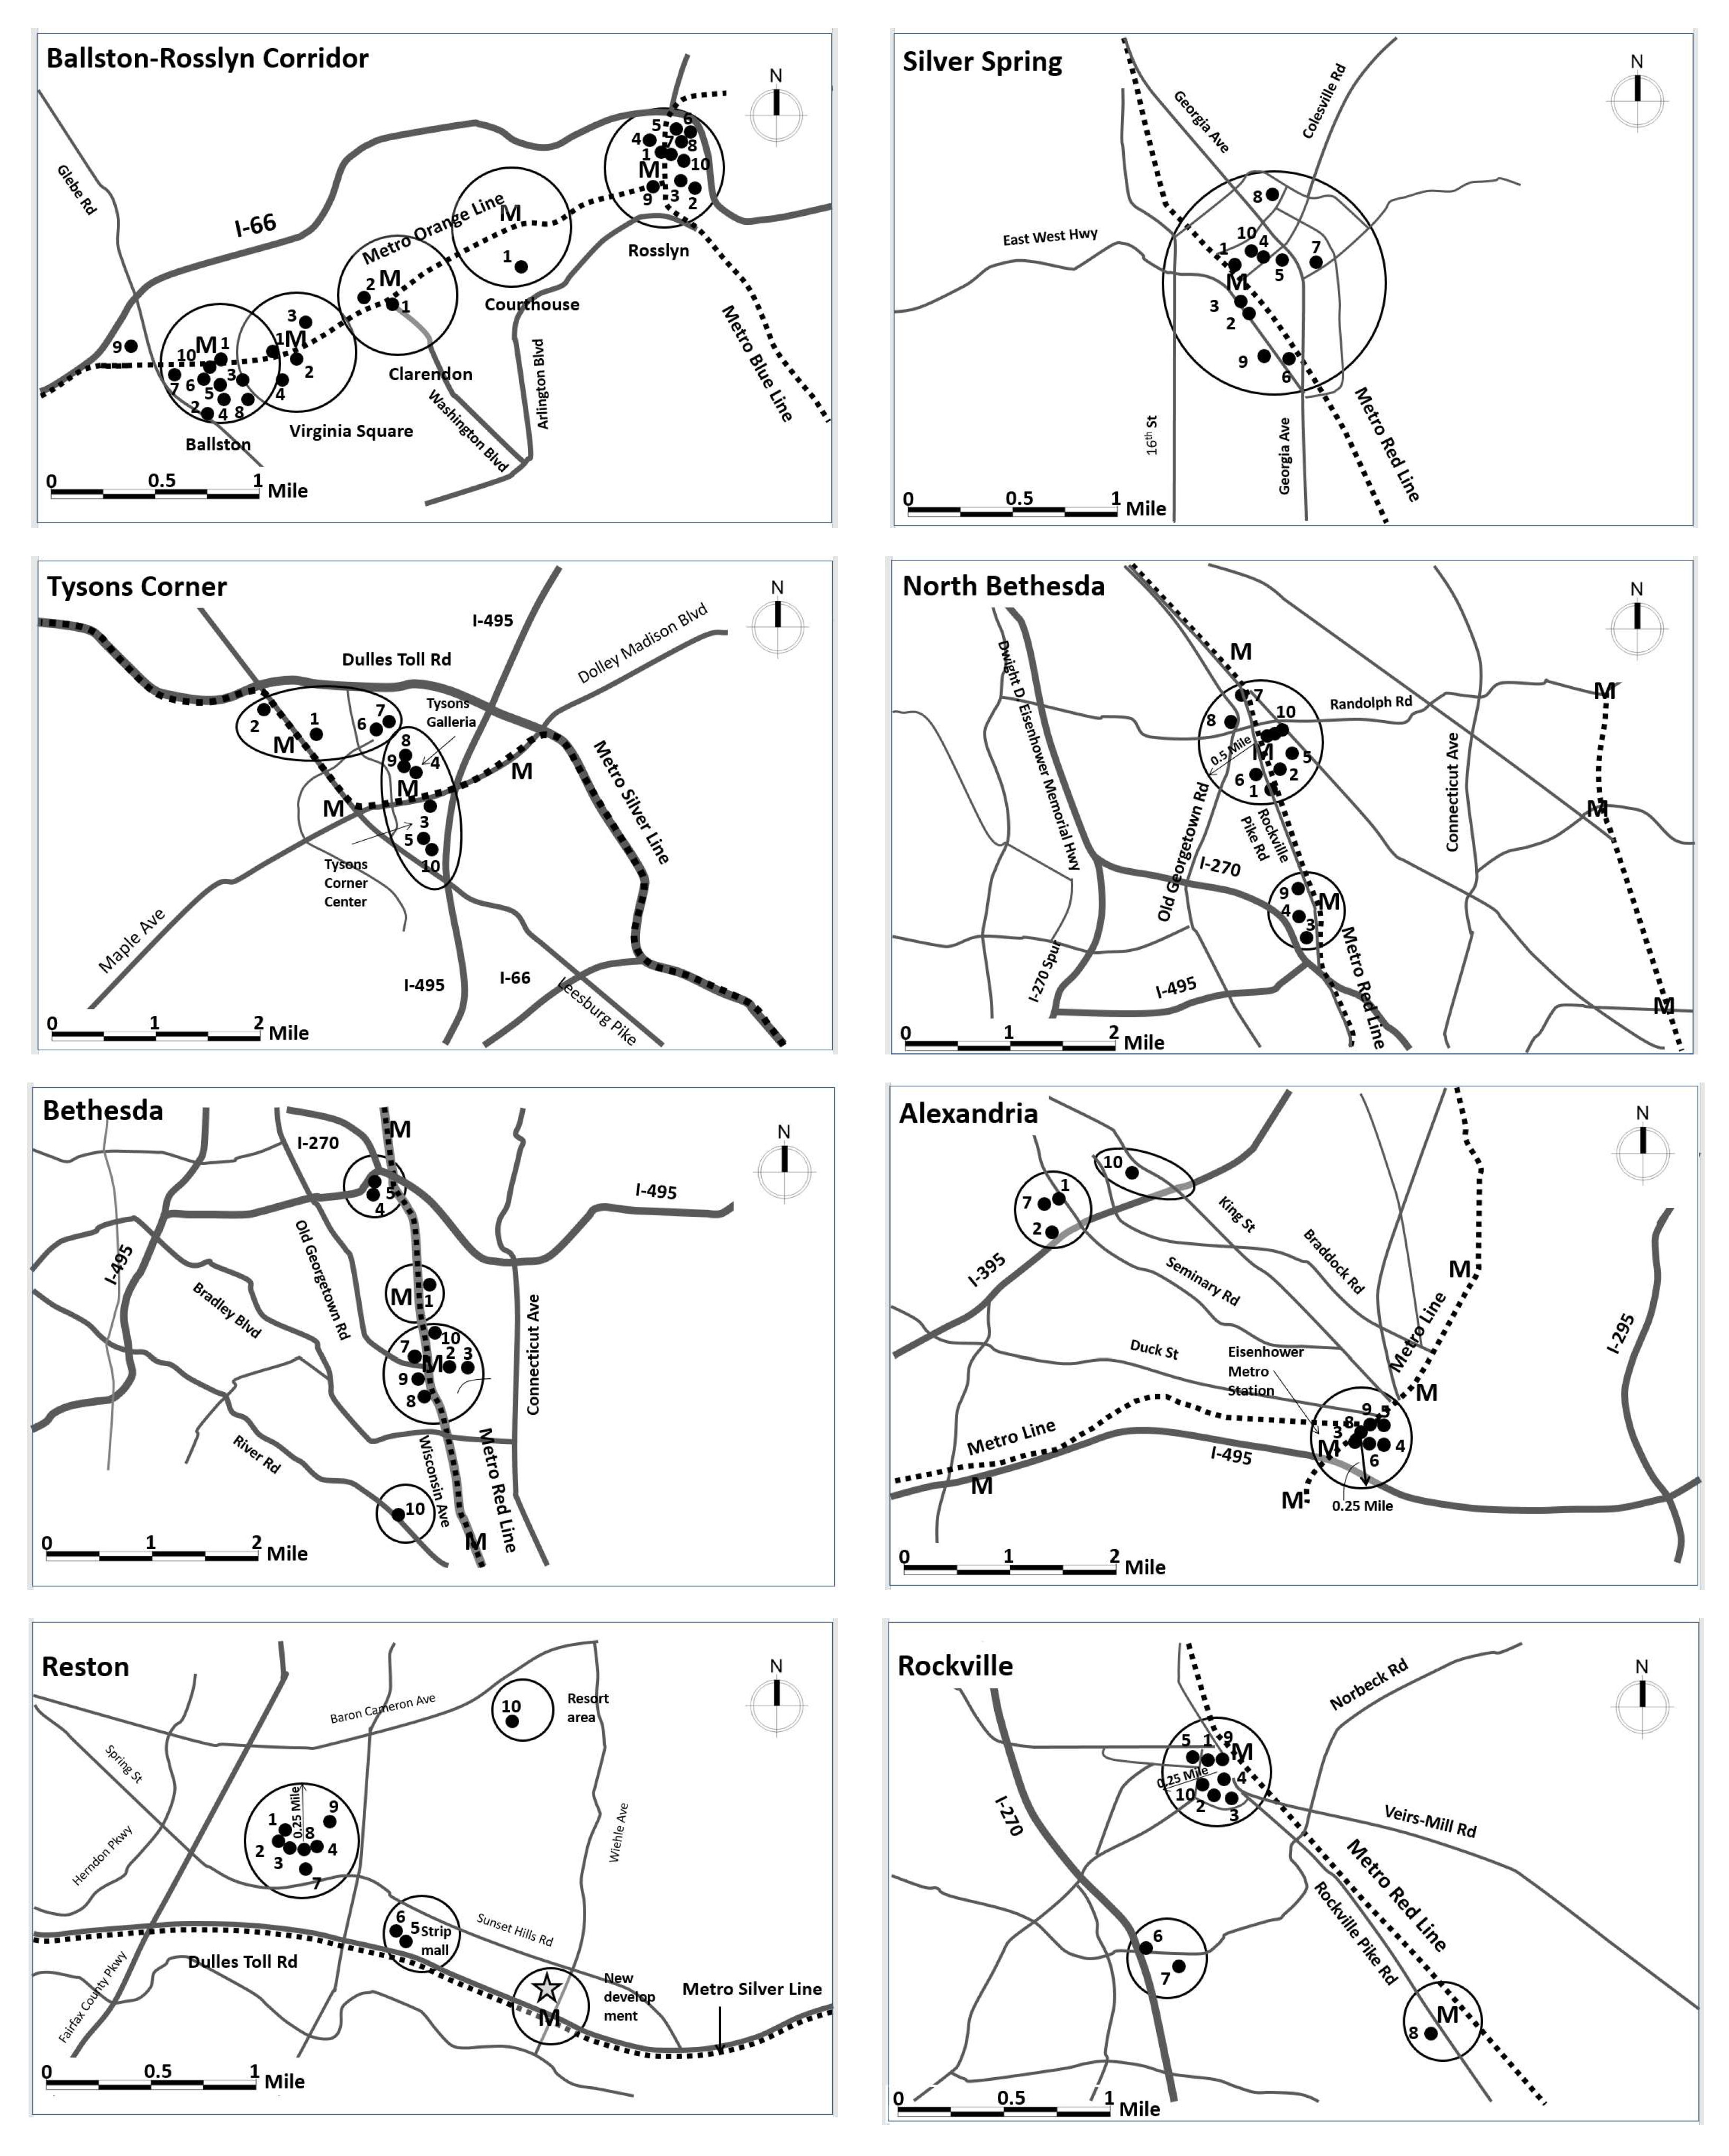
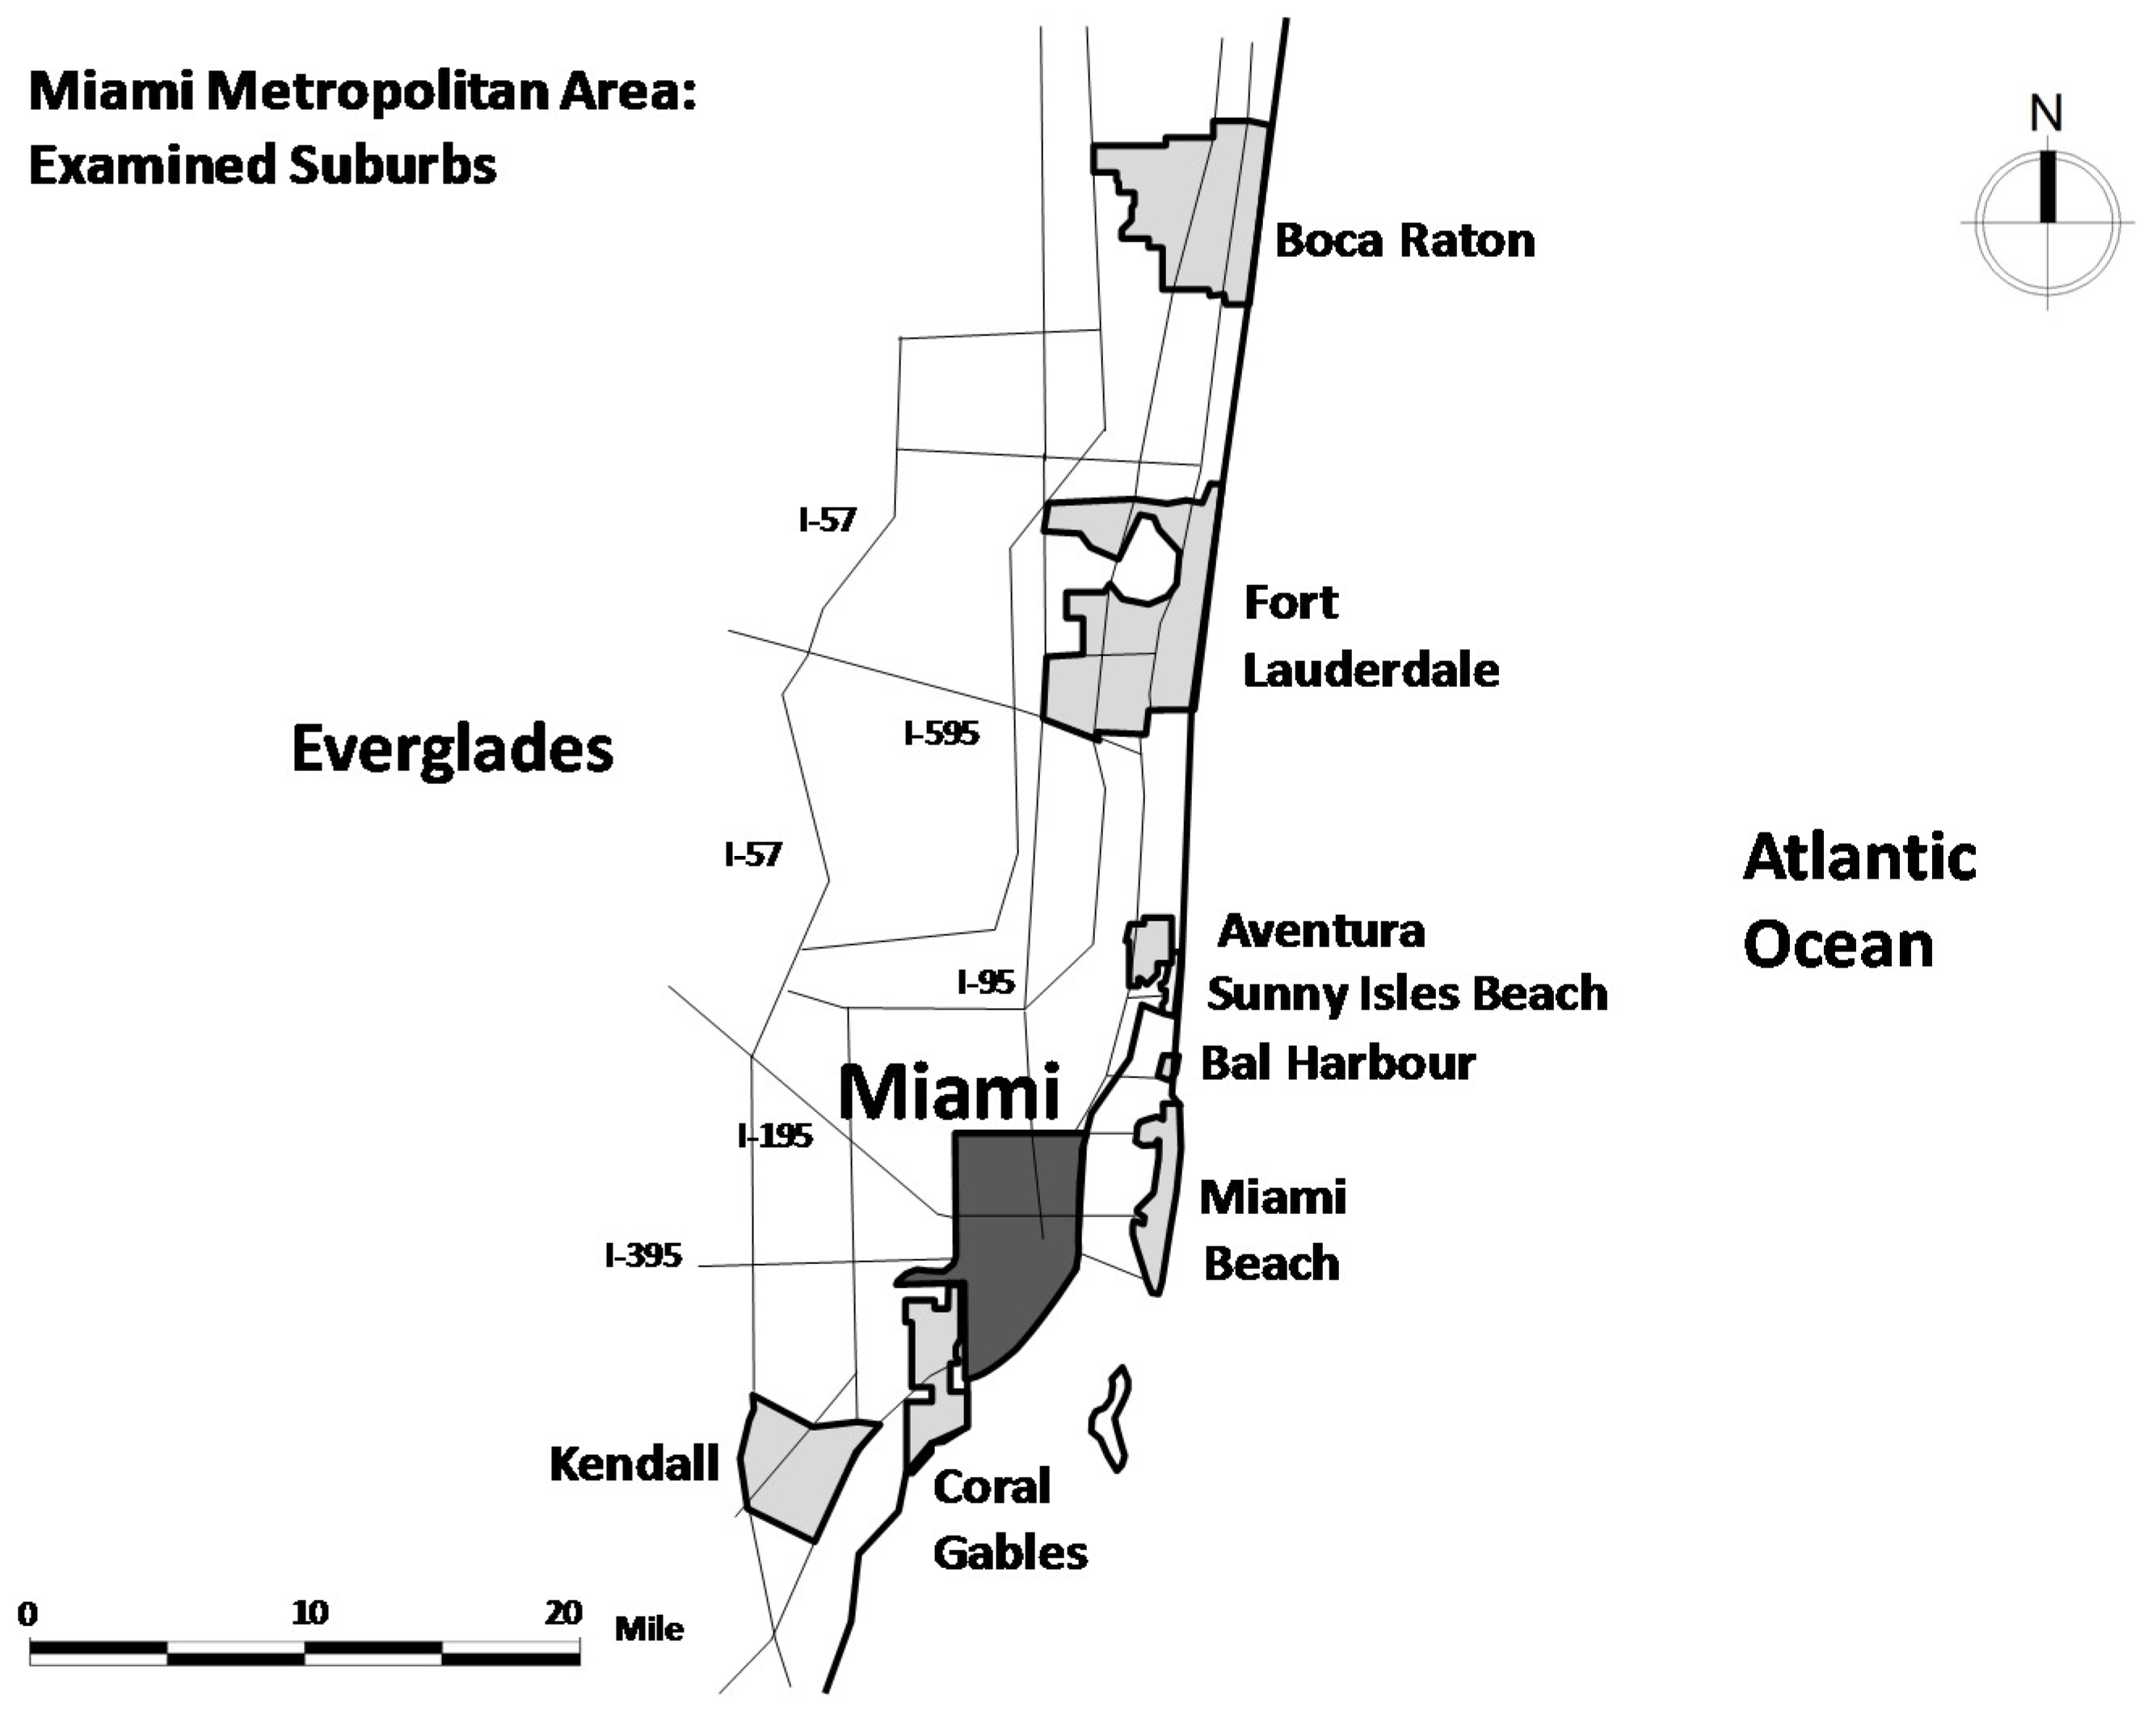
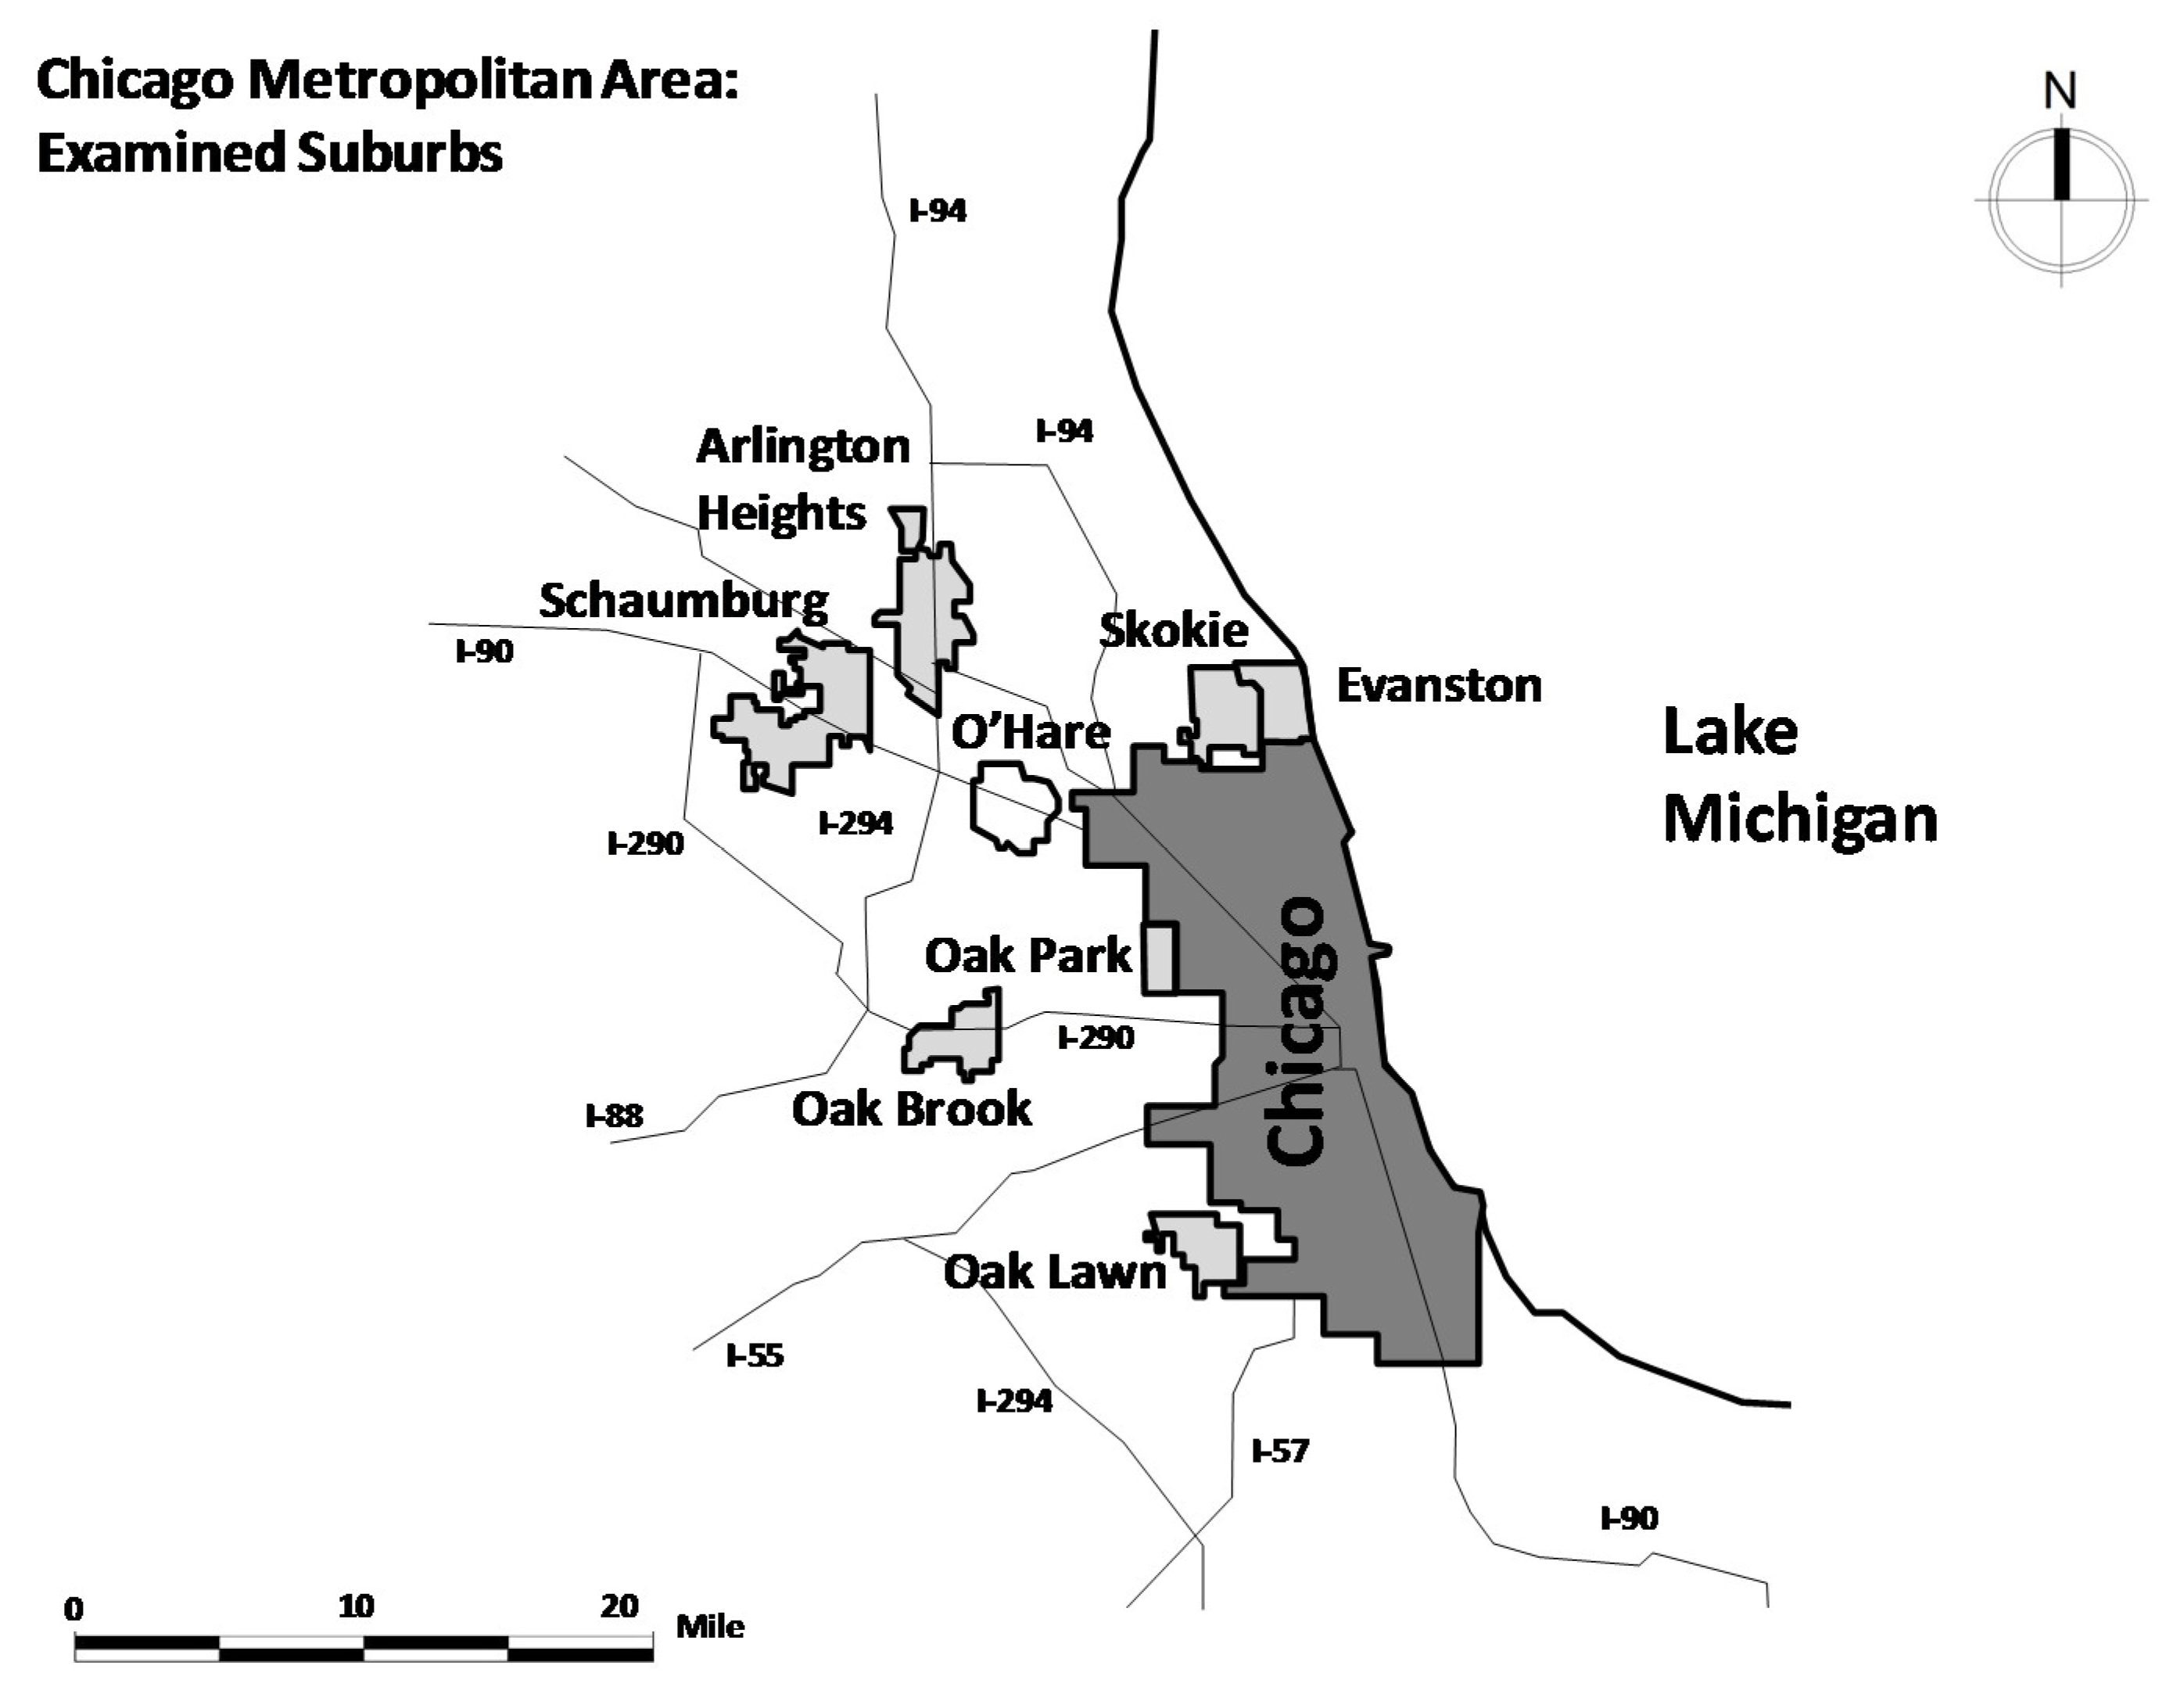
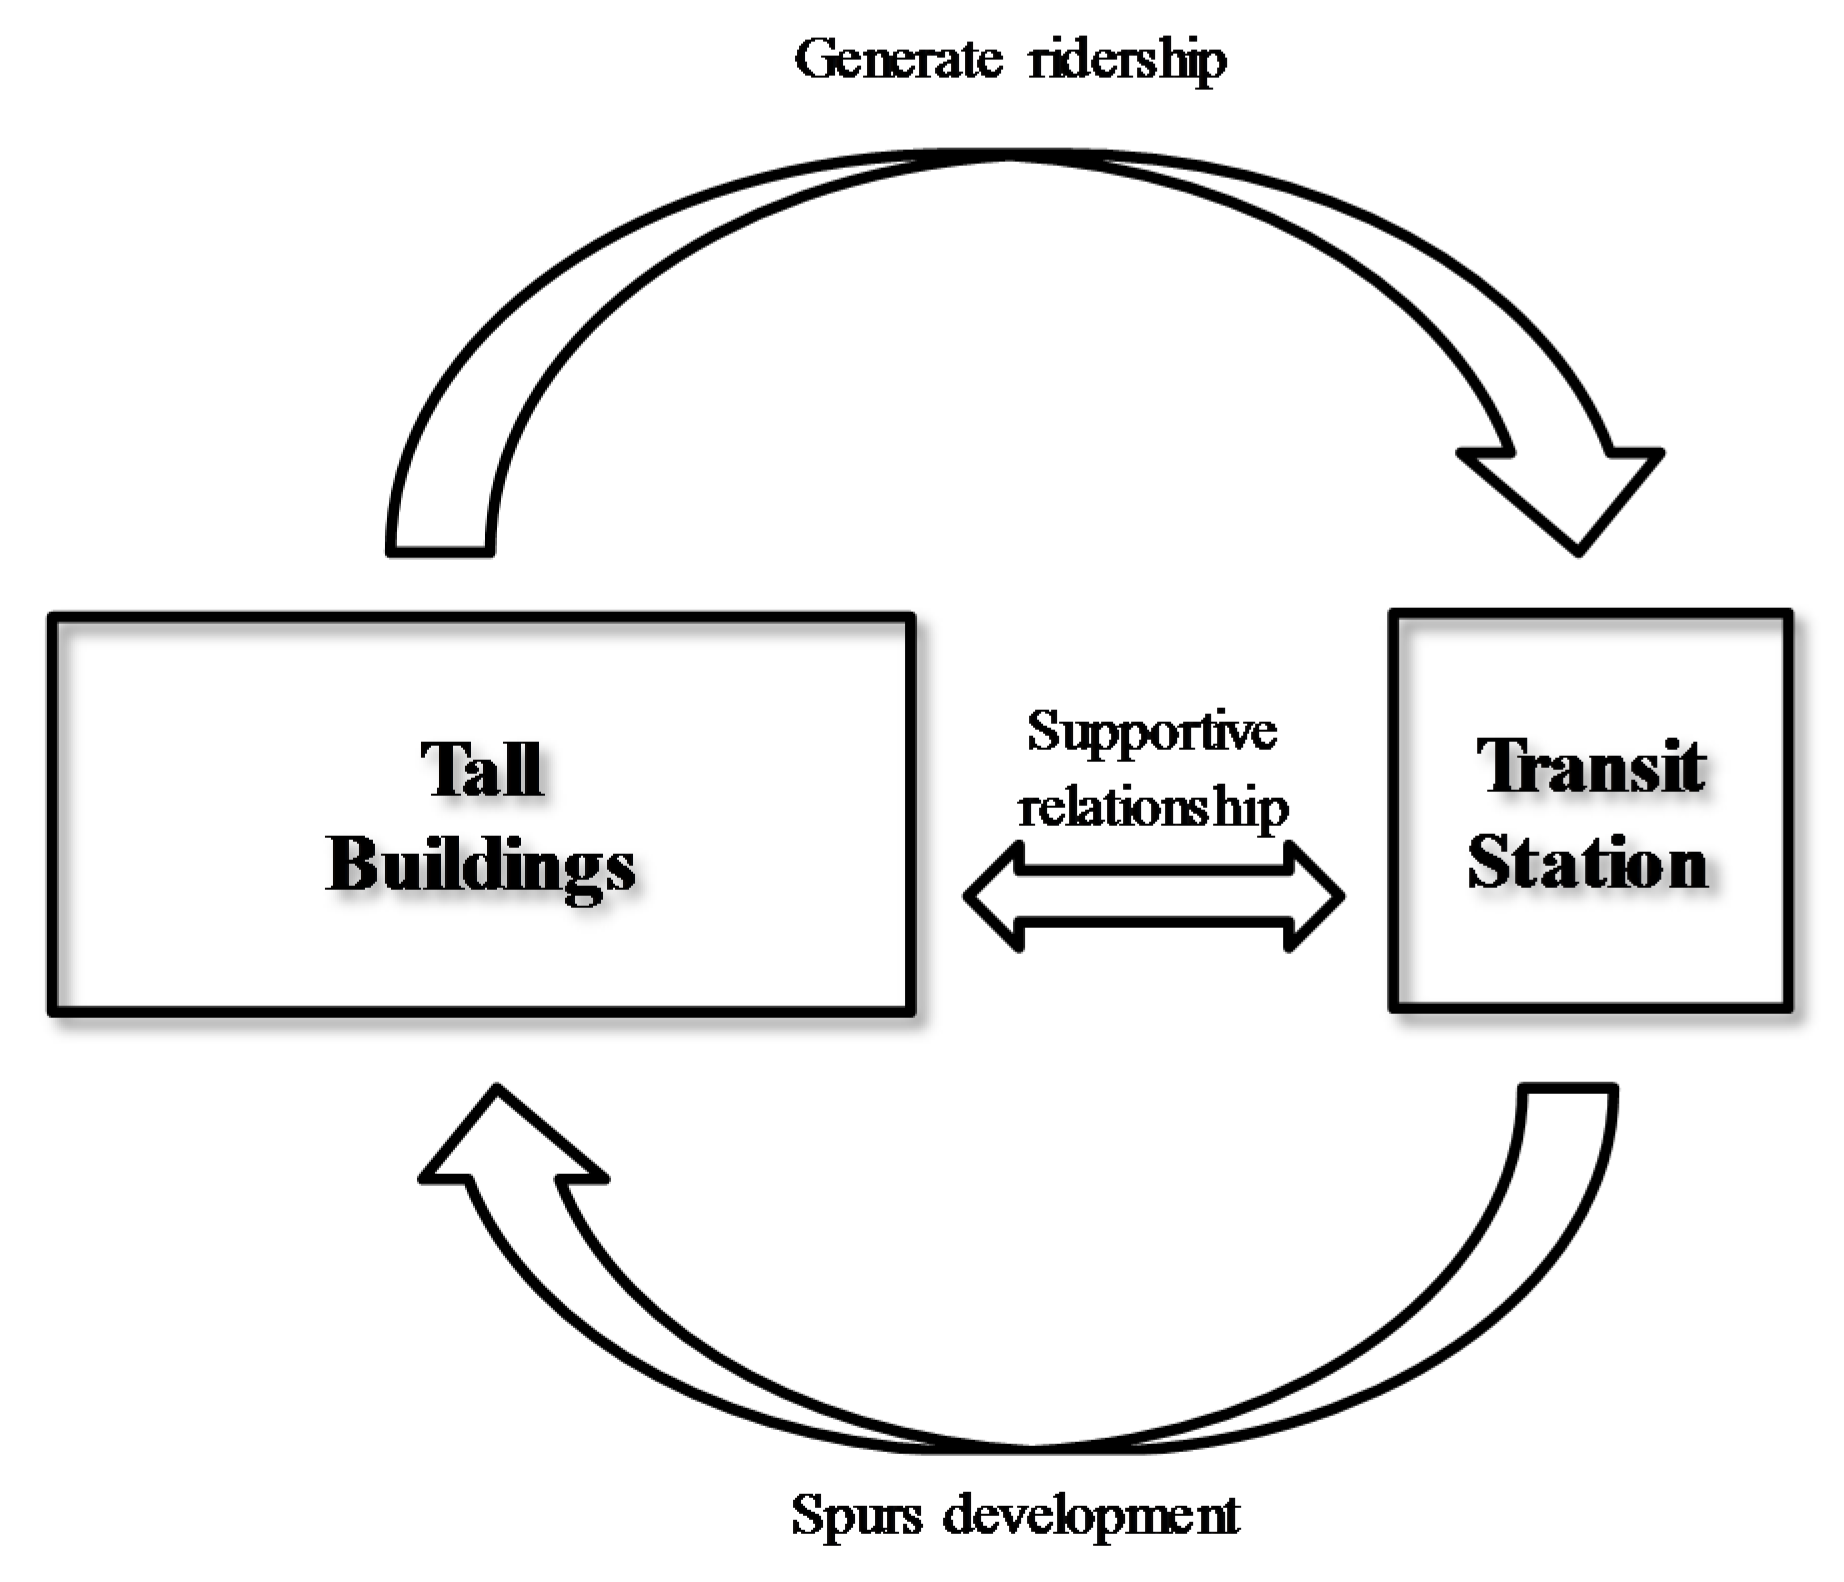
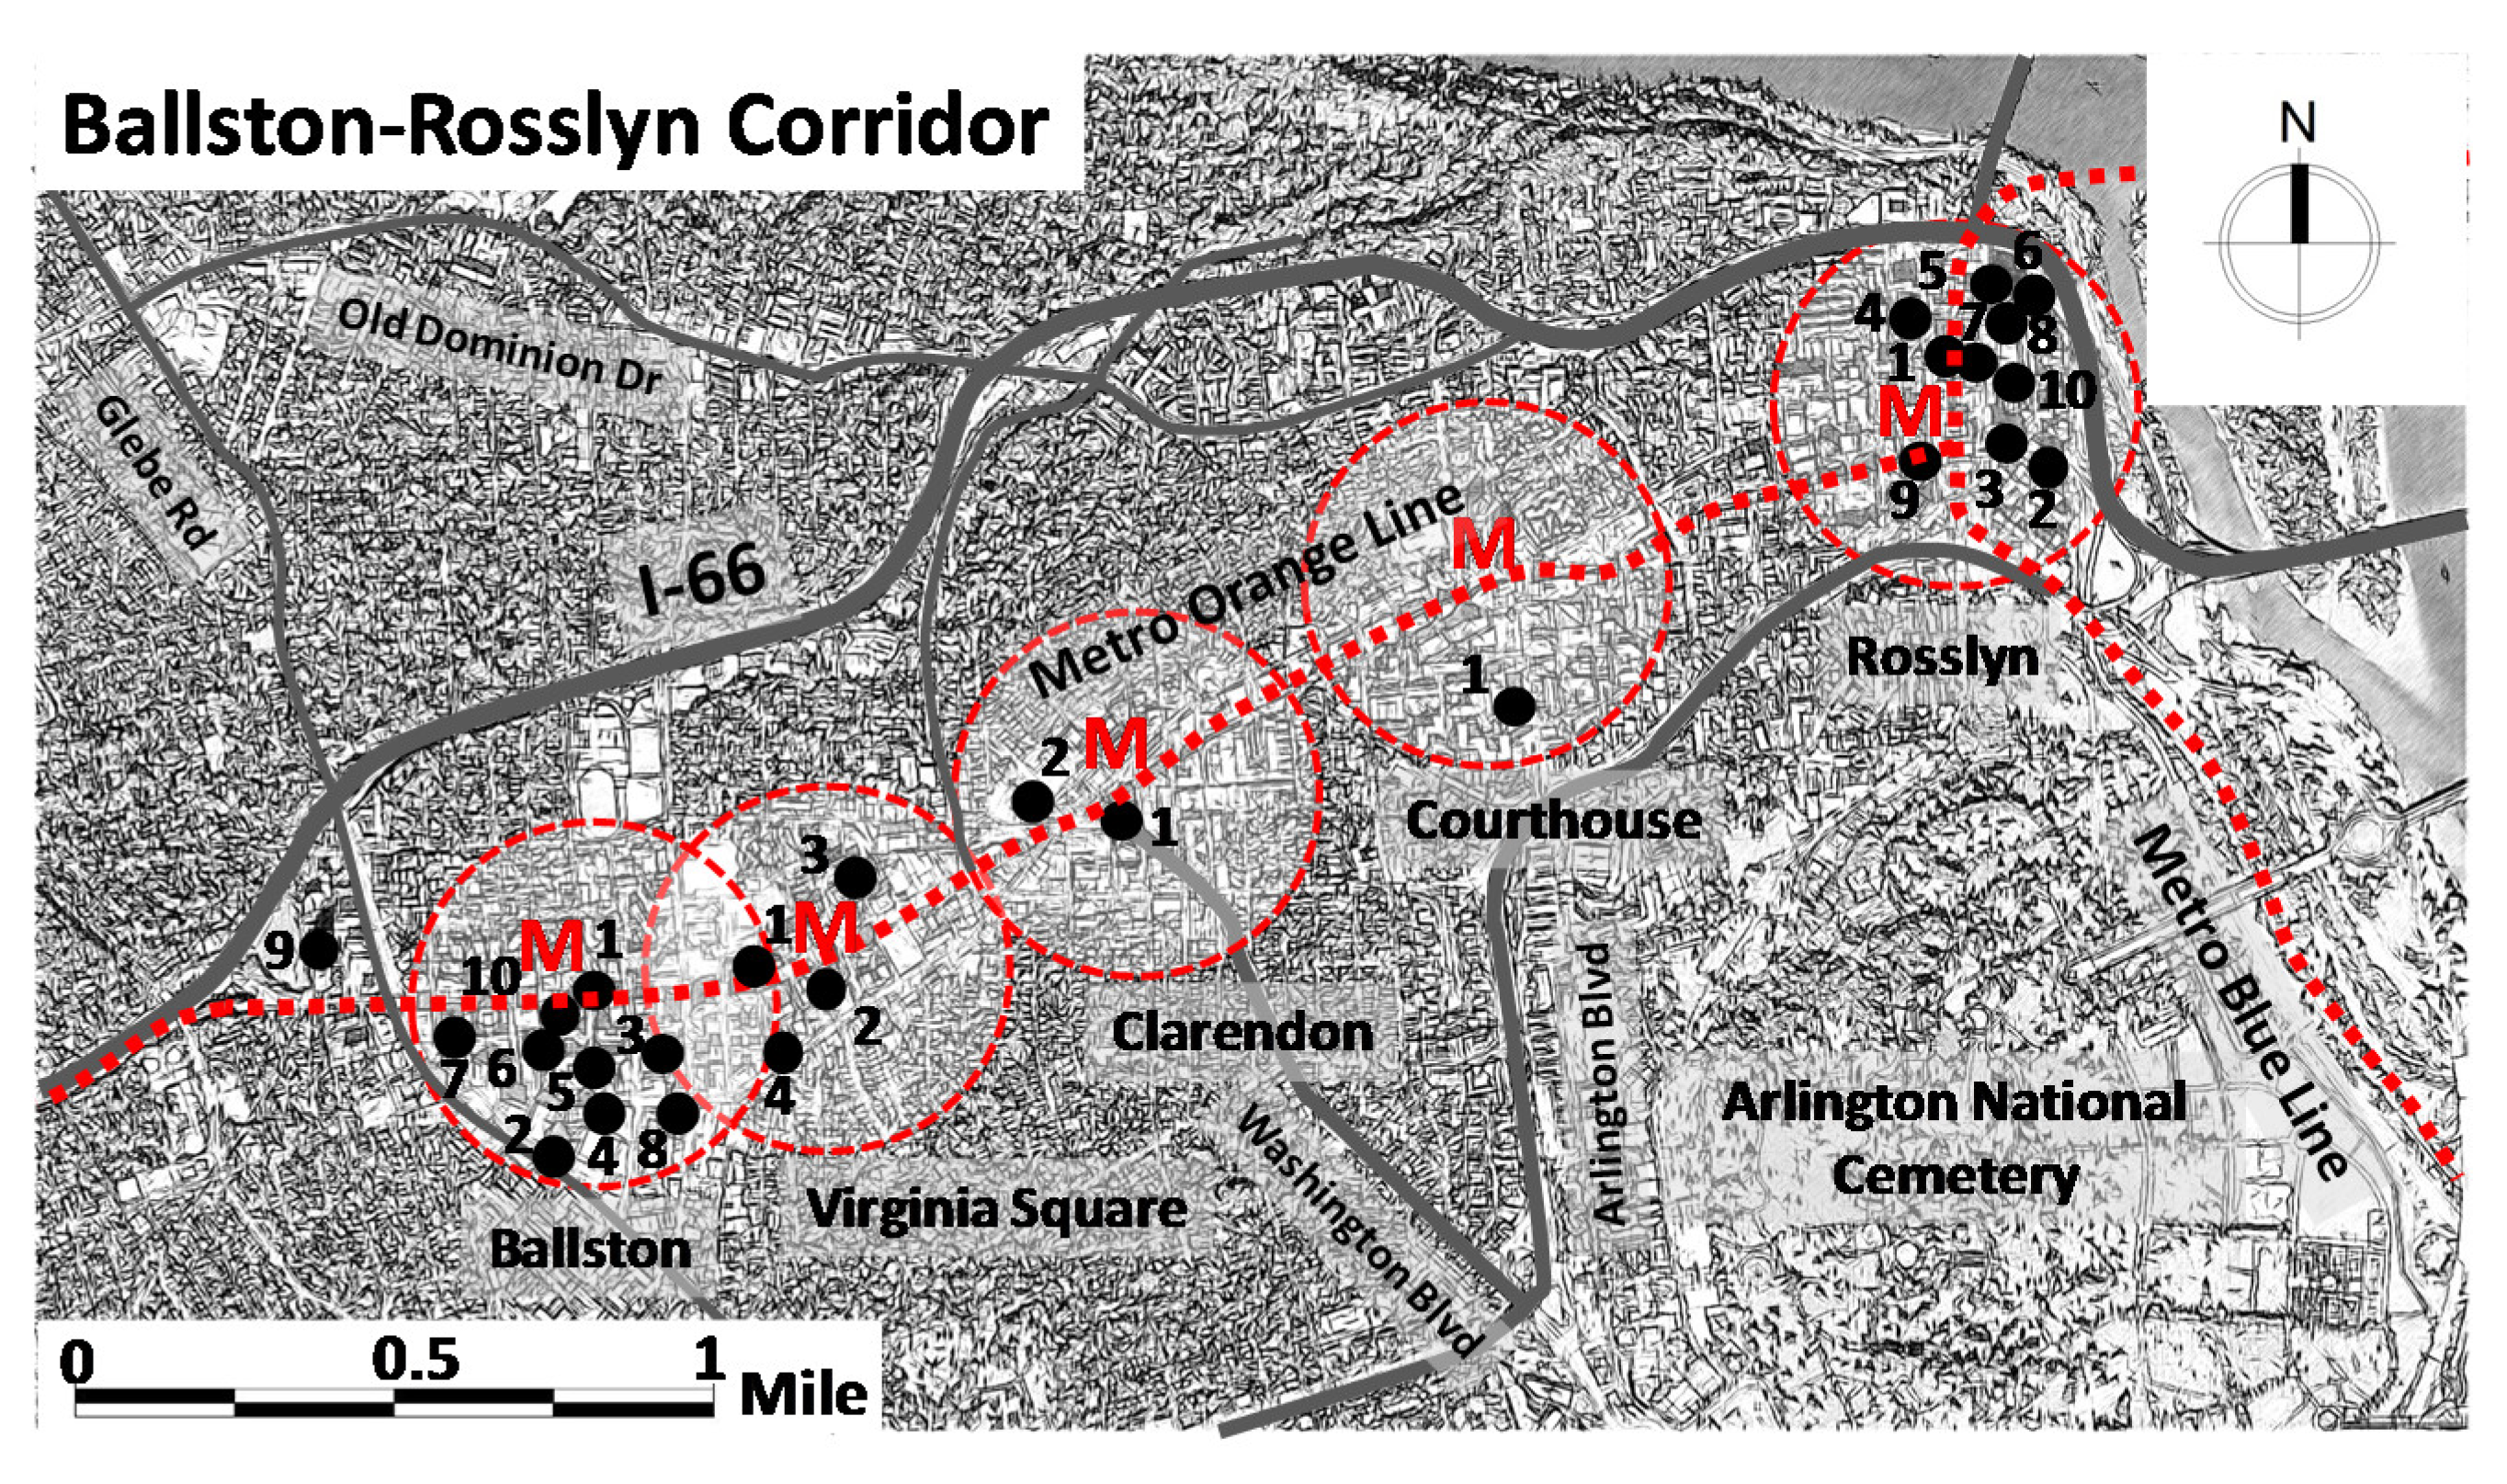
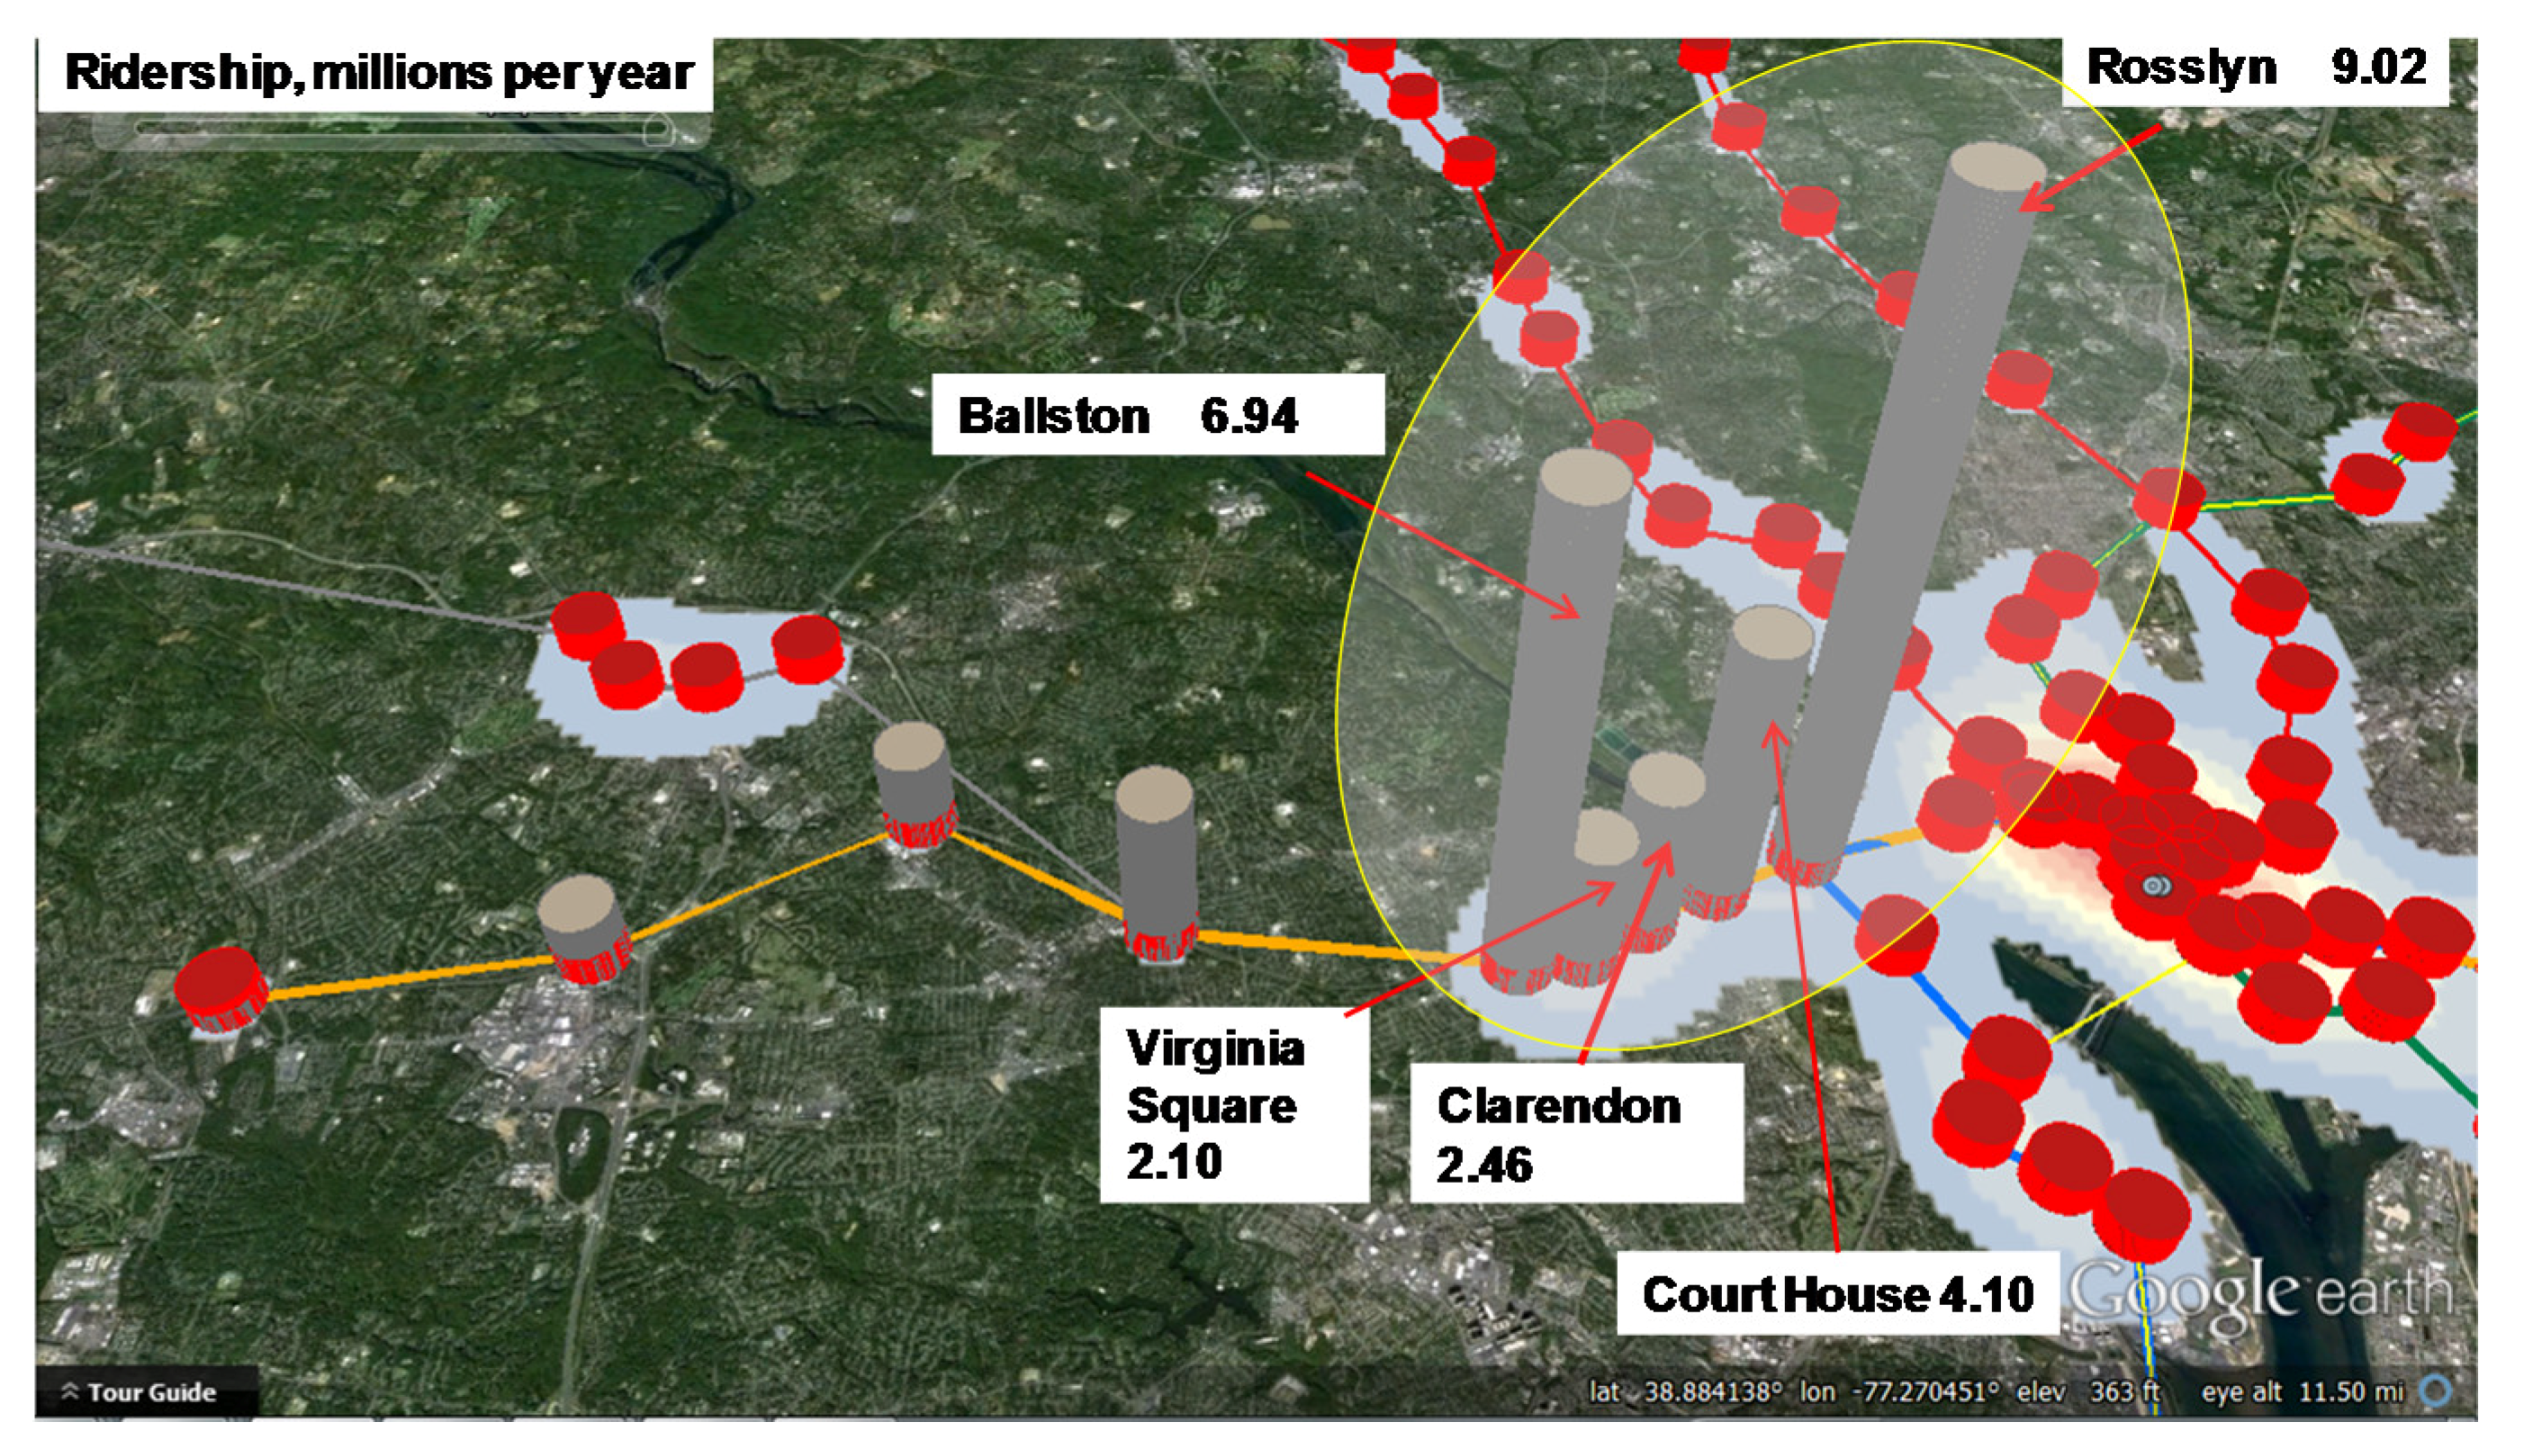
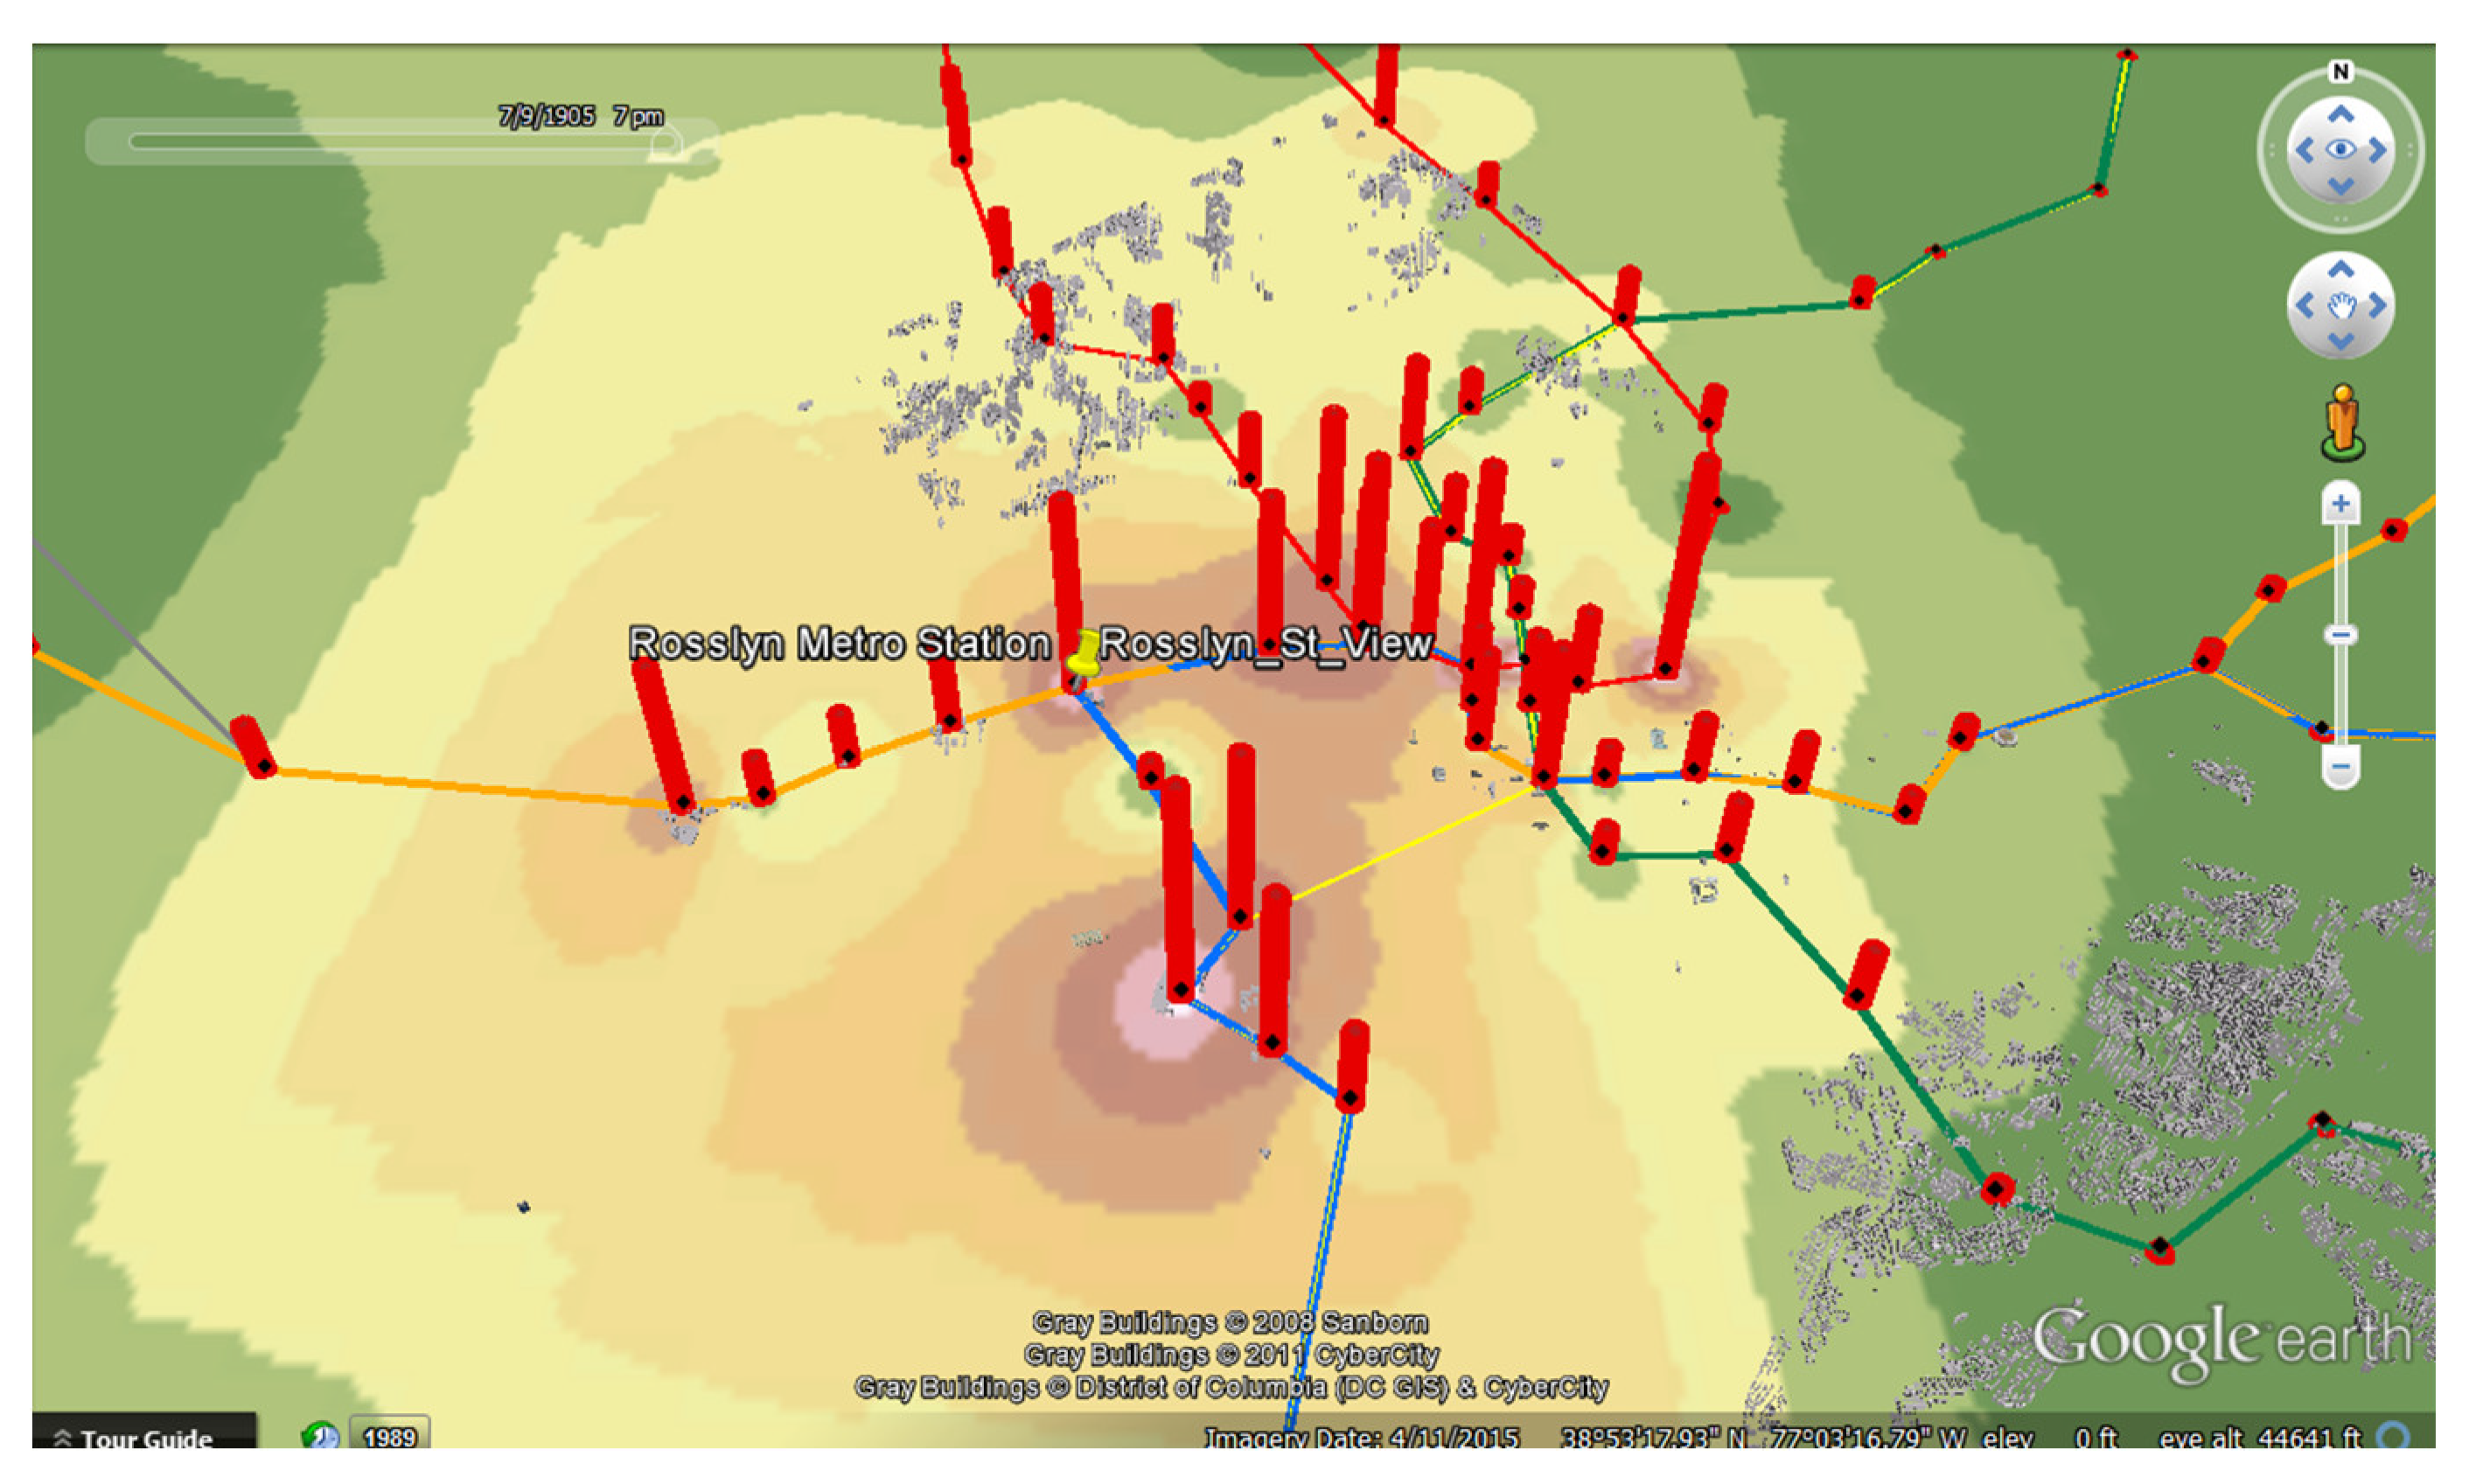
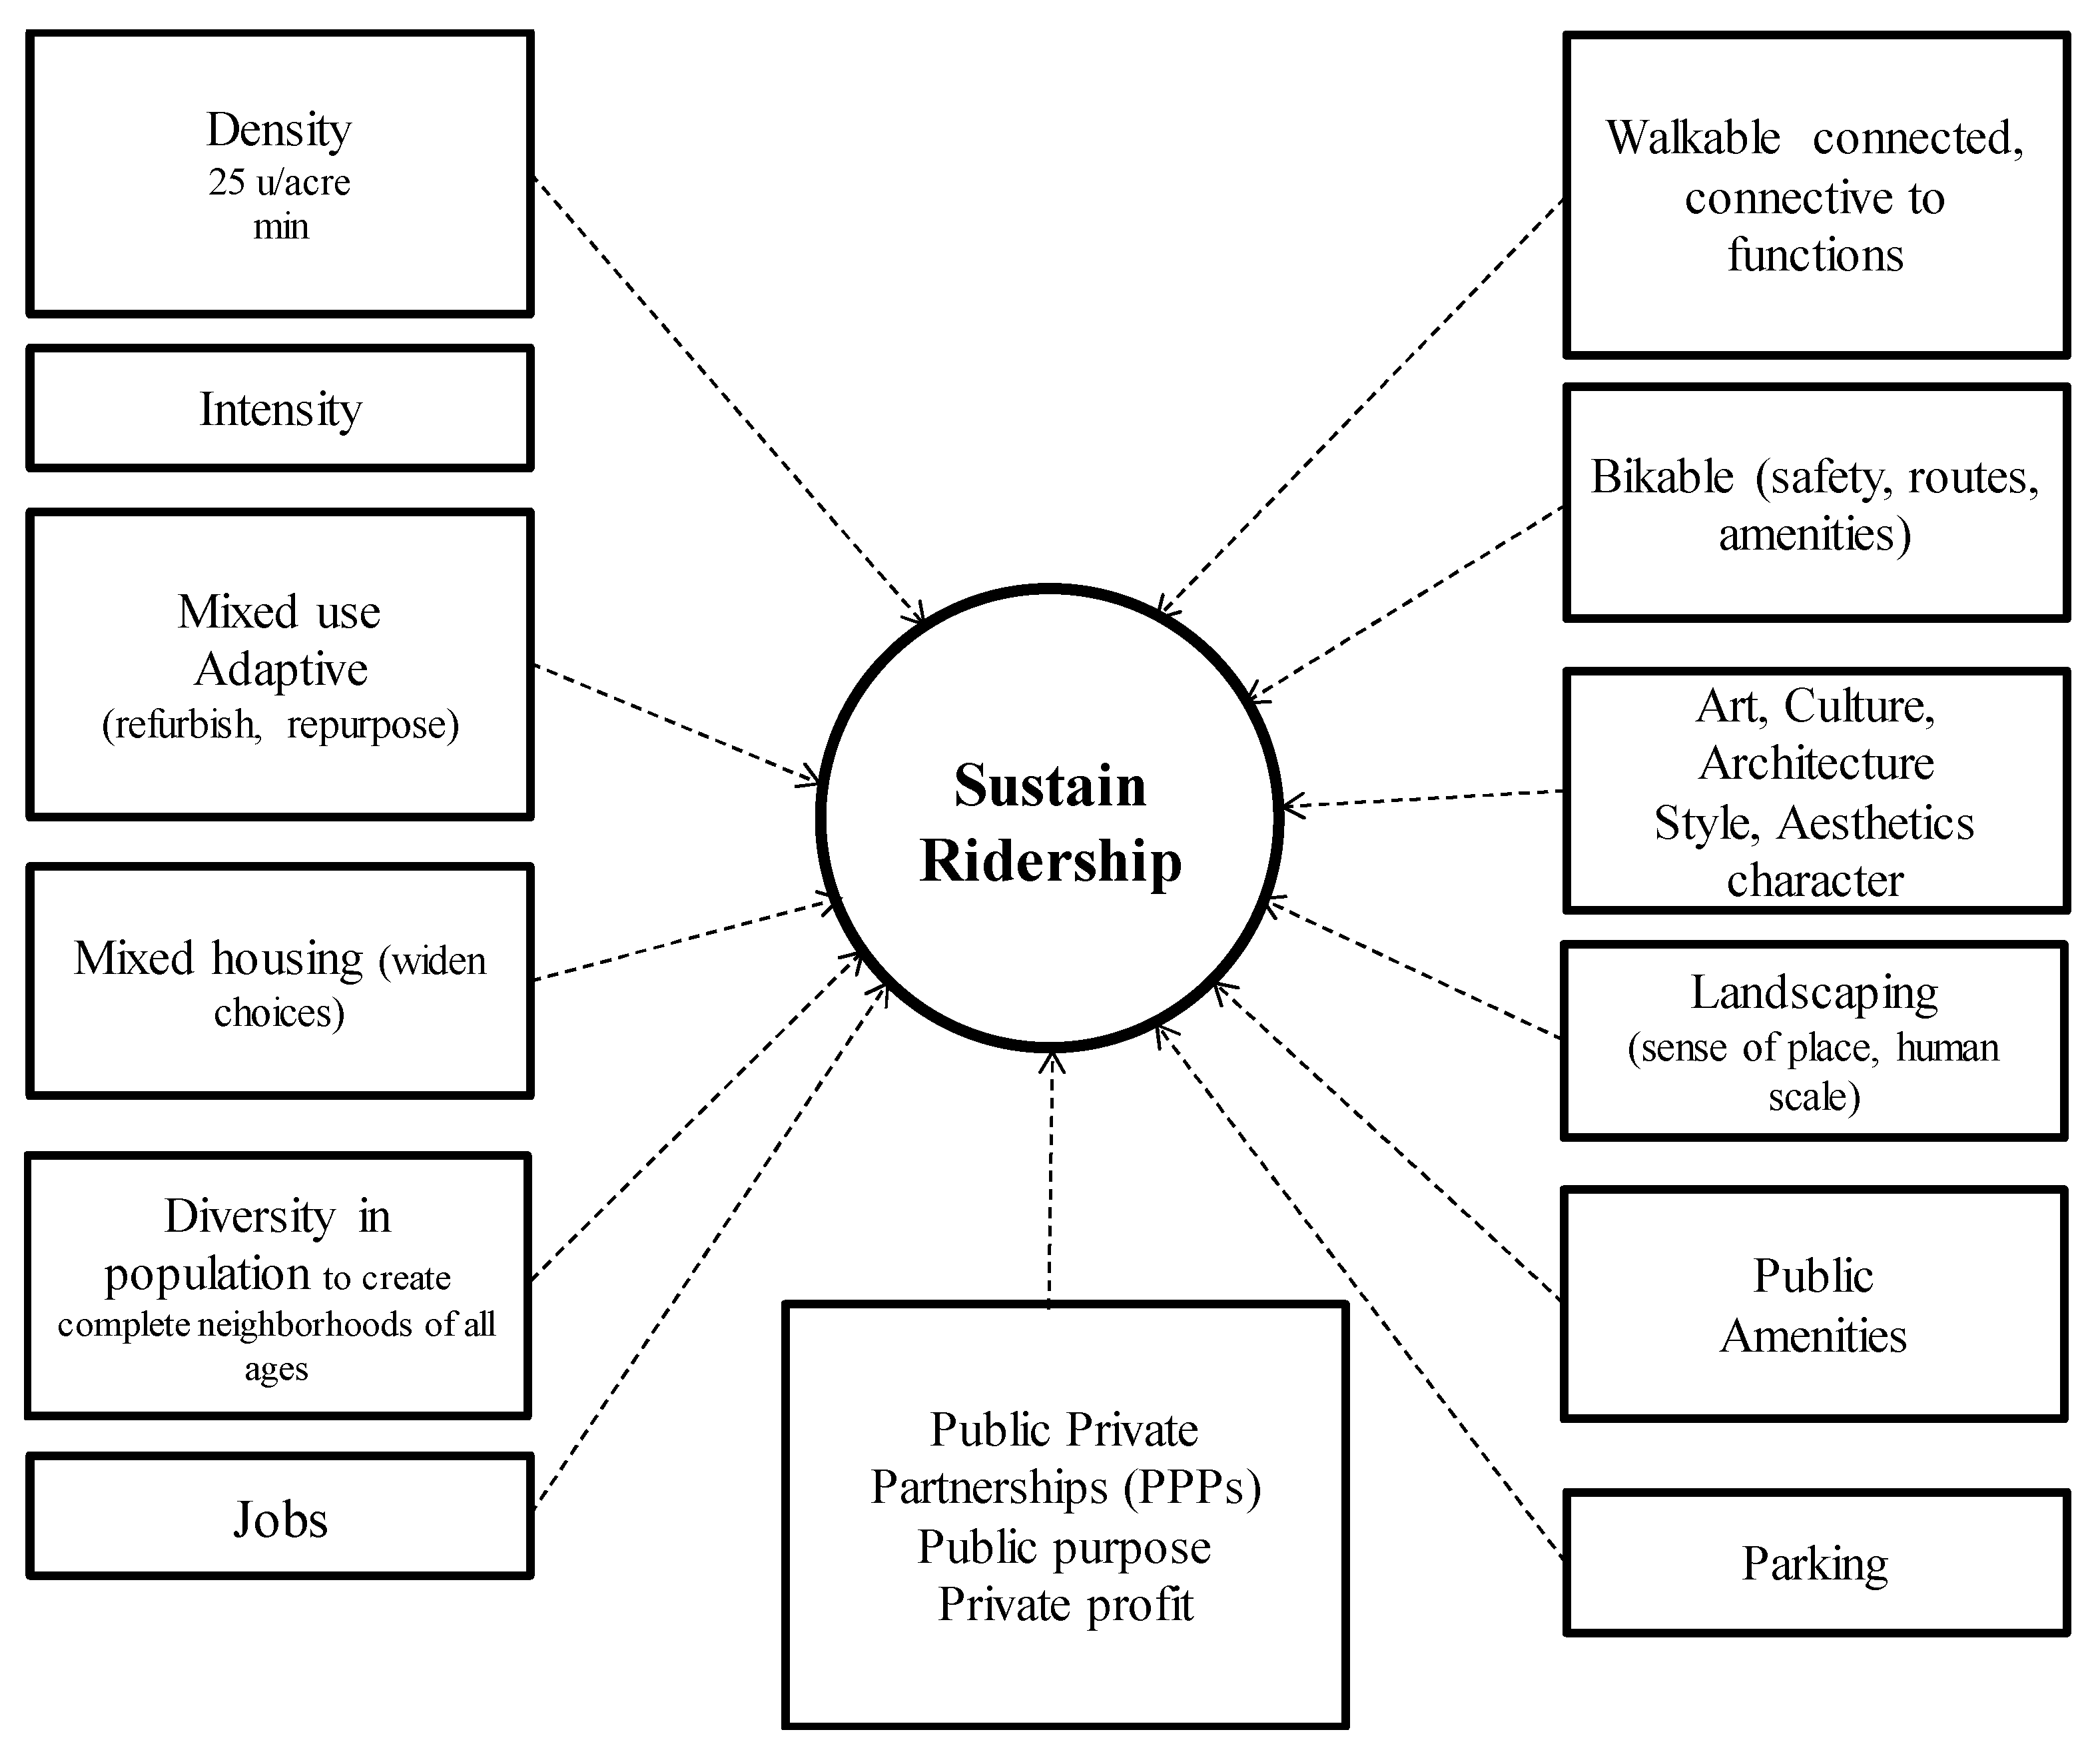
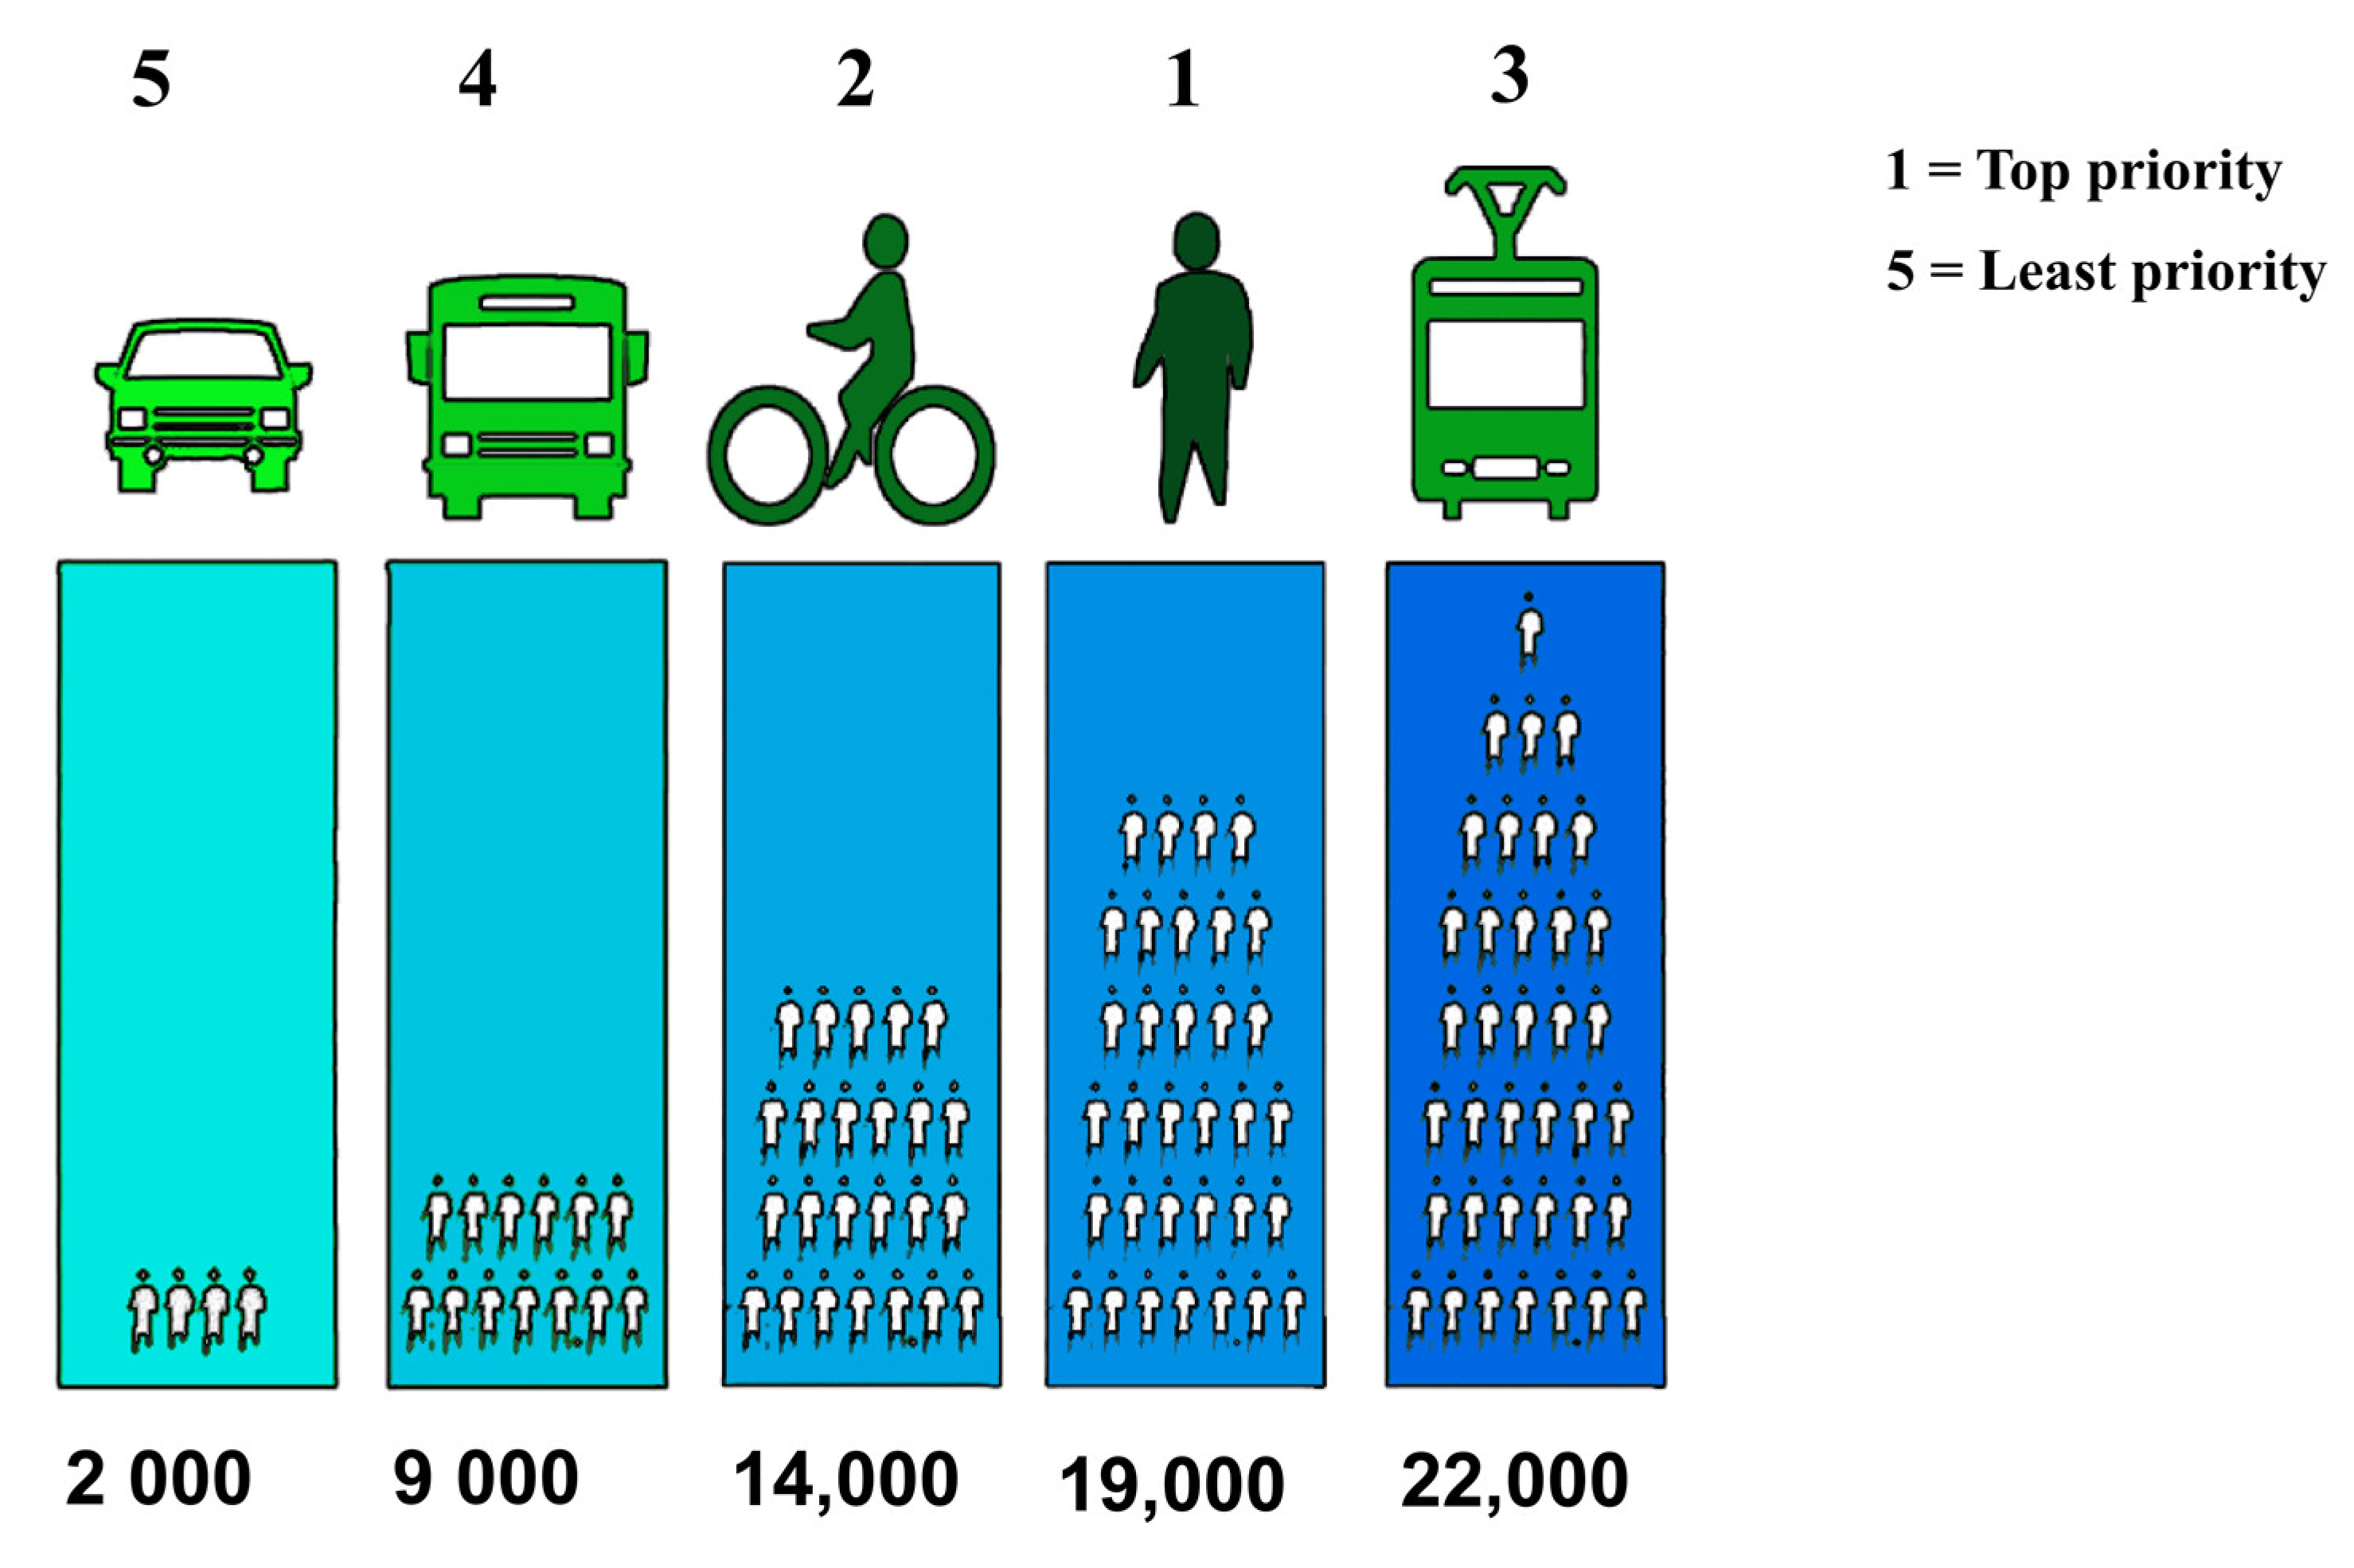
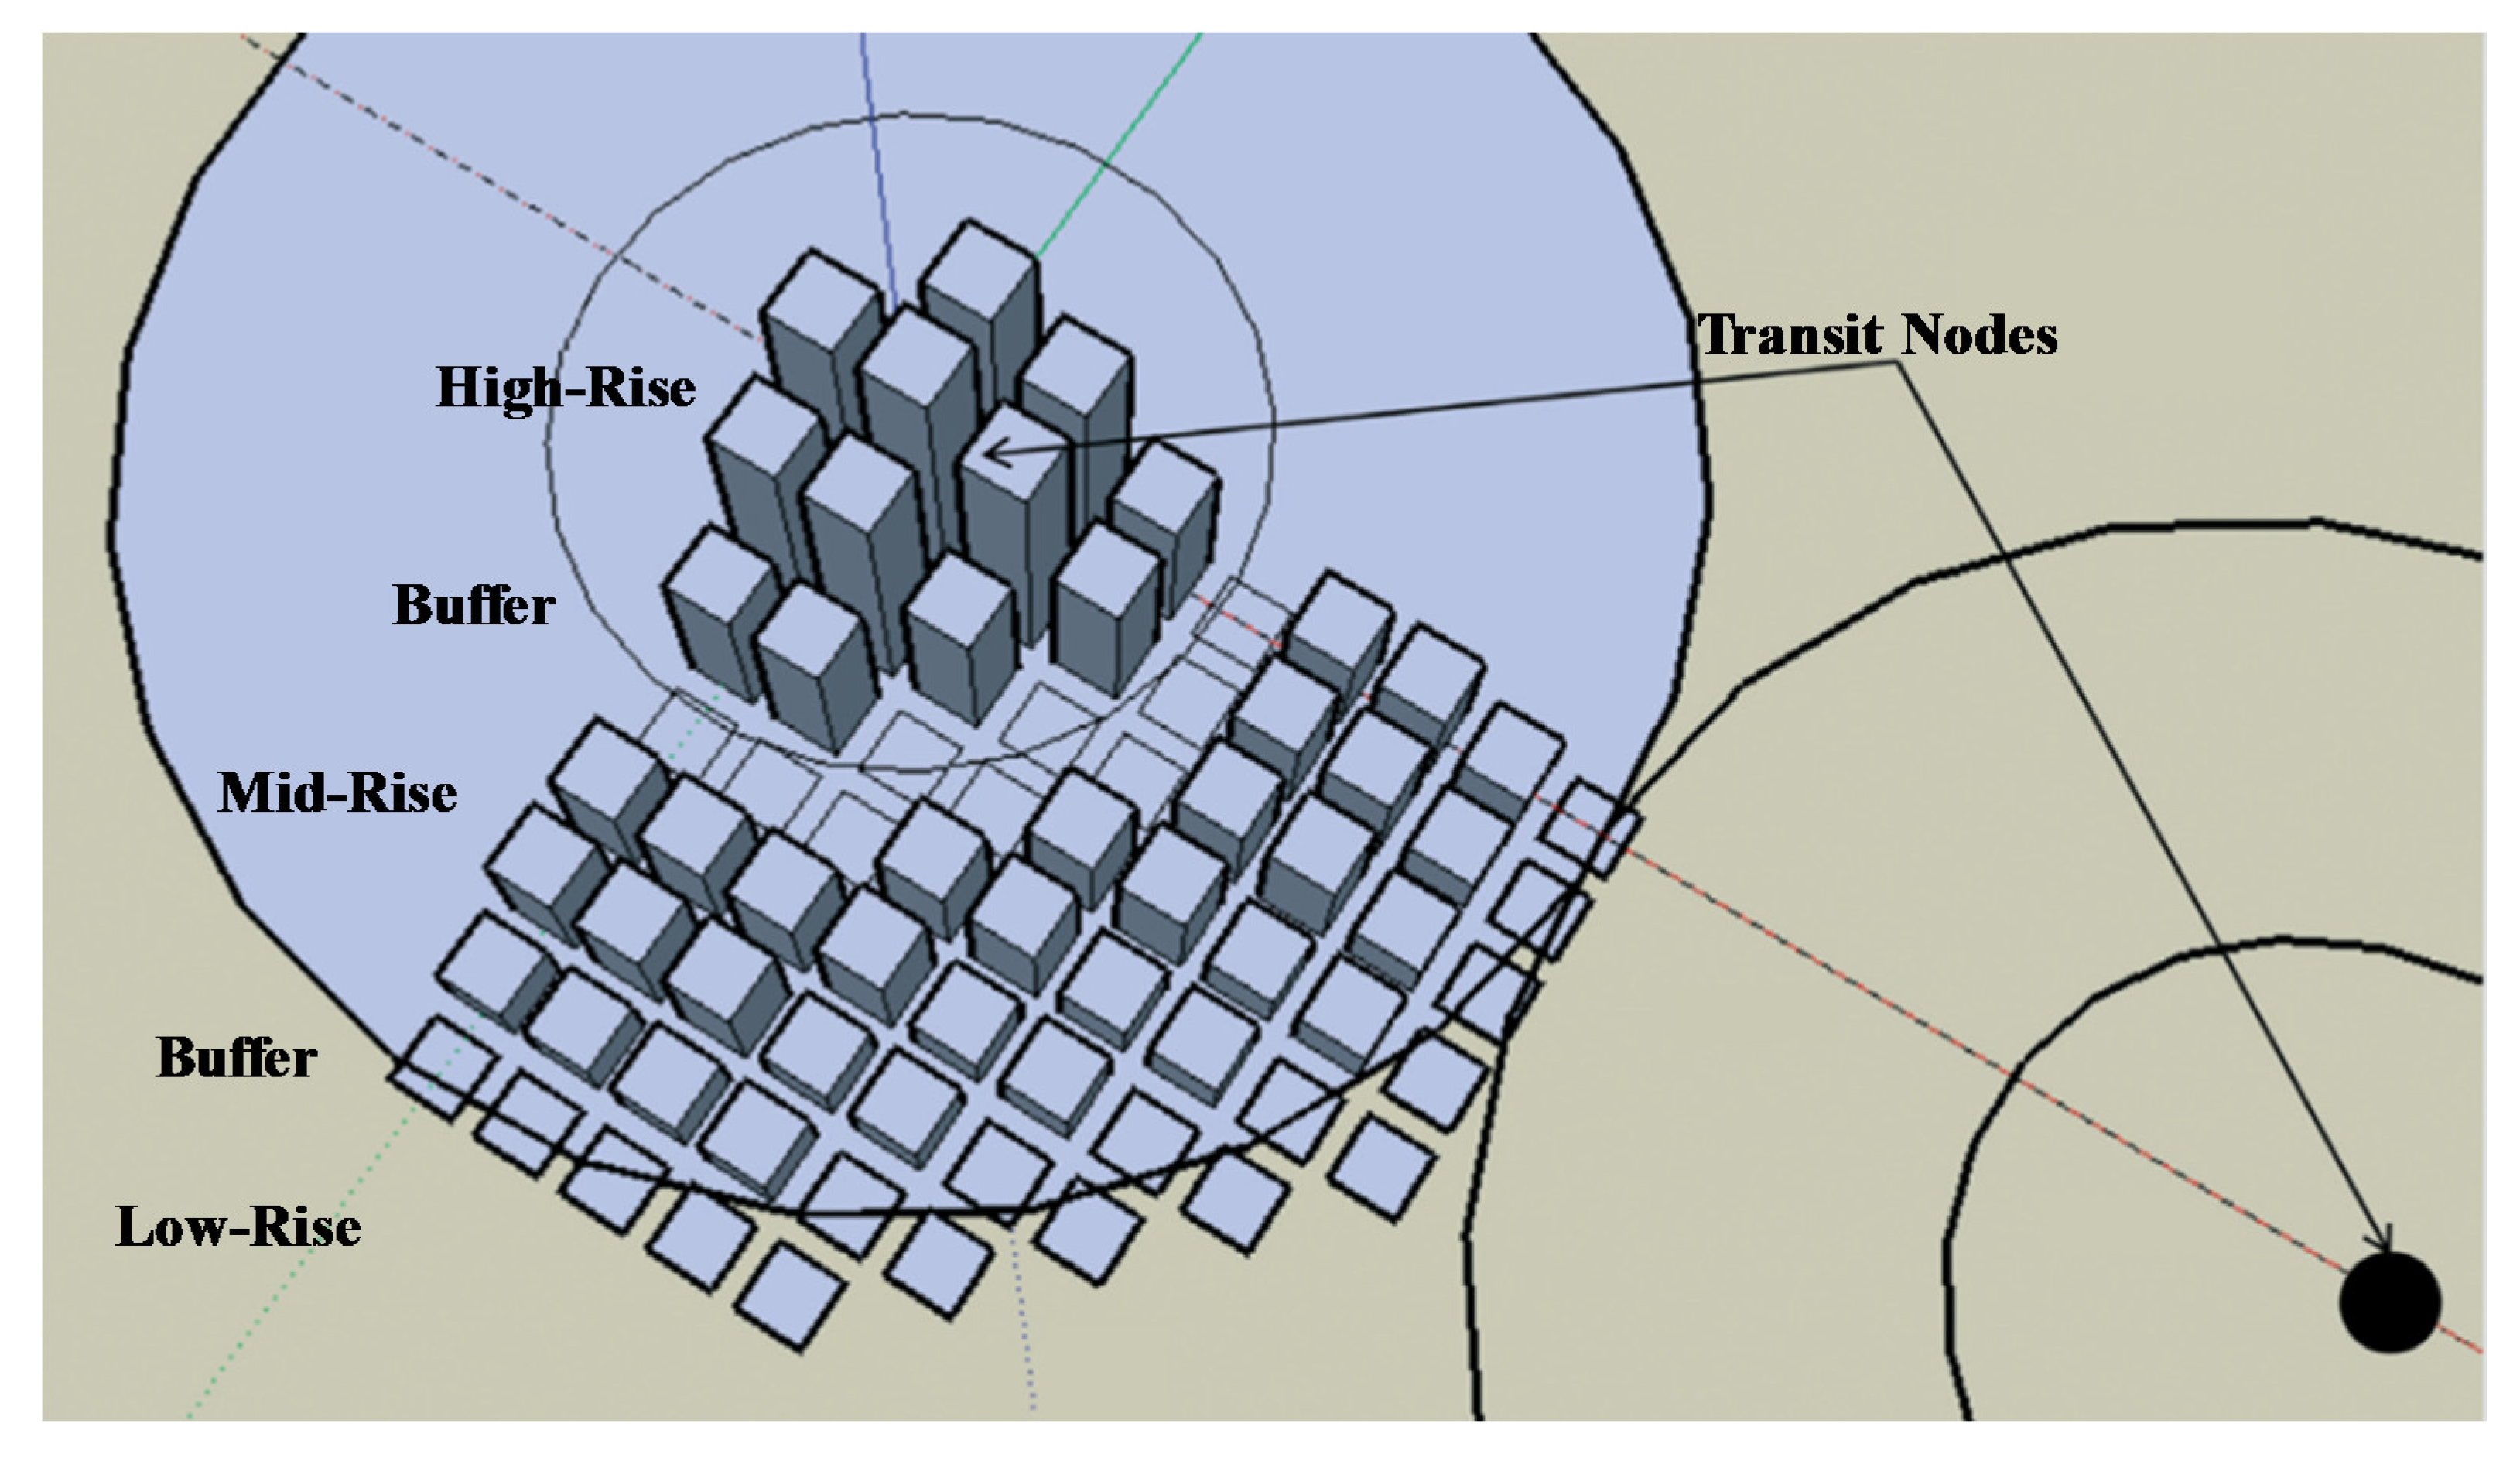
Table 1.
The examined suburbs in the Washington, D.C. Metropolitan Area.
| Region | Suburban Community | County | State | |
|---|---|---|---|---|
| Washington, D.C. | 1 | Rosslyn-Ballston (R-B) Corridor | Arlington | VA |
| 2 | Silver Spring | Montgomery | MD | |
| 3 | Tysons Corner | Fairfax | VA | |
| 4 | North Bethesda | Montgomery | MD | |
| 5 | Bethesda | Montgomery | MD | |
| 6 | Alexandria | Fairfax | VA | |
| 7 | Reston | Fairfax | VA | |
| 8 | Rockville | Montgomery | MD |
Table 2.
Summary of the spatial profile of the examined suburban communities in the Washington, D.C. region [24,25].
| Suburb | Population (2010) | Population (2013) | Percentage of Population Change | Land Area (sq. mi) | Density (2010; Persons Per Square Mile) | Number of Buildings 10 Stories and Taller | Tallest Building | Location (in Relation to Washington D.C.) | County | ||
|---|---|---|---|---|---|---|---|---|---|---|---|
| # Floors | Height | ||||||||||
| 1 | Rosslyn-Ballston (R-B) Corridor | 207,682 | 224,906 | 8.3% | 25.97 | 7994 | 162 | 35 | 390 ft. | 5 miles southwest | Arlington |
| 2 | Silver Spring | 71,452 | 74,476 | N.A. | 7.92 | 9021 | 58 | 17 | 390 ft. | 6 miles north | Montgomery |
| 3 | Tysons Corner | 19,627 | 20,118 | N.A. | 4.26 | 4607 | 50 | 24 | 254 ft. | 13 miles west | Fairfax |
| 4 | North Bethesda | 43,828 | 43,828 | N.A. | 8.85 | 4952 | 32 | 24 | 289 ft. | 12.5 miles northwest | Montgomery |
| 5 | Bethesda | 60,858 | 59,591 | N.A. | 13.29 | 4579 | 23 | 19 | 264 ft. | 7 miles northwest | Montgomery |
| 6 | Alexandria | 139,966 | 148,892 | 6.4% | 15.03 | 9312 | 22 | 30 | 338 ft. | 8 miles south | Fairfax |
| 7 | Reston | 58,404 | 58,396 | N.A. | 15.33 | 3809 | 21 | 21 | 276 ft. | 22 miles west | Fairfax |
| 8 | Rockville | 61,285 | 64,072 | 4.5% | 13.29 | 4611 | 10 | 21 | 225 ft. | 21 miles northwest | Montgomery |
Table 3.
The examined suburbs in the Miami Metropolitan Area.
| Region | Rank Based on Number of Tall Buildings | Suburban Community | County | State |
|---|---|---|---|---|
| Miami | 1 | Miami Beach | Miami-Dade | FL |
| 2 | Fort Lauderdale | Broward | FL | |
| 3 | Aventura | Miami-Dade | FL | |
| 4 | Sunny Isles Beach | Miami-Dade | FL | |
| 5 | Coral Gables | Miami-Dade | FL | |
| 6 | Boca Raton | Palm Beach | FL | |
| 7 | Bal Harbour | Miami-Dade | FL | |
| 8 | Kendall | Miami-Dade | FL |
Table 4.
Summary of the spatial profile of the examined suburban communities in the Miami region, FL [24,25].
| Suburb | Population (2010) | Population (2013) | Percentage of Population Change | Land Area (sq. mi) | Density (2013; Persons Per Square Mile) | Number of Buildings 10 Stories and Taller | Tallest Building | Location (in Relation to Miami Downtown) | County | ||
|---|---|---|---|---|---|---|---|---|---|---|---|
| # of Floors | Height | ||||||||||
| 1 | Miami Beach | 87,779 | 91,026 | 3.7% | 7.63 | 11,930 | 187 | 44 | 170/559 | 10 miles east | Miami-Dade |
| 2 | Fort Lauderdale | 165,502 | 172,389 | 4.2% | 34.77 | 4957 | 160 | 42 | 138/452 | 28 miles north | Broward |
| 3 | Aventura | 35,762 | 37,199 | 4.0% | 2.65 | 14,037 | 85 | 40 | 127/417 | 18 miles north | Miami-Dade |
| 4 | Sunny Isles Beach | 20,832 | 21,720 | 4.3% | 1.02 | 21,294 | 62 | 53 | 175/574 | 19 miles northeast | Miami-Dade |
| 5 | Coral Gables | 46,776 | 49,631 | 6.1% | 12.92 | 3841 | 59 | 15 | 96/315 | 7 miles southwest | Miami-Dade |
| 6 | Boca Raton | 84,401 | 89,407 | 5.9% | 29.33 | 3048 | 42 | 28 | 91/300 | 45 miles north | Palm Beach |
| 7 | Bal Harbour | 5628 | 5854 | 4.0% | 0.40 | 14,635 | 16 | 27 | 98/322 | 14 miles north | Miami-Dade |
| 8 | Kendall | 75,371 | N.A. | N.A. | 16.08 | 4687 | 15 | 28 | 96/314 | 29 miles southwest | Miami-Dade |
Table 5.
The examined suburbs in the Chicago Metropolitan Area.
| Region | Suburban Community | County | State | |
|---|---|---|---|---|
| Chicago | 1 | Schaumburg | Cook | IL |
| 2 | Evanston | Cook | IL | |
| 3 | Oak Brook | DuPage | IL | |
| 4 | Skokie | Cook | IL | |
| 5 | Oak Park | Cook | IL | |
| 6 | Arlington Heights | Cook | IL | |
| 7 | Itasca | DuPage | IL | |
| 8 | Oak Lawn | Cook | IL |
Table 6.
Summary of the spatial profile of the examined suburban communities in the Chicago region [24,25].
| Suburb | Population (2010) | Population (2013) | Percentage of Population Change | Land Area (sq. mi) | Density (2013; Persons Per Square Mile) | Number of Buildings 10 Stories and Taller | Tallest Building | Location (in Relation to Chicago Loop) | County | ||
|---|---|---|---|---|---|---|---|---|---|---|---|
| # of Floors | Height | ||||||||||
| 1 | Schaumburg | 74,227 | 74,907 | 0.9% | 19.22 | 3897 | 20 | 20 | 270 ft. | 30 miles northwest | Cook |
| 2 | Evanston | 74,486 | 75,570 | 1.5% | 7.78 | 9713 | 19 | 22 | 277 ft. | 19 miles north | Cook |
| 3 | Oak Brook | 7883 | 8041 | 2.0% | 7.95 | 1011 | 10 | 31 | 418 ft. | 20 miles west | DuPage |
| 4 | Skokie | 64,784 | 65,176 | 0.6% | 10.06 | 6478 | 6 | 20 | 196 ft. | 14 miles north | Cook |
| 5 | Oak Park | 51,878 | 52,066 | 0.4% | 4.70 | 11,077 | 6 | 19 | 232 ft. | 10 miles west | Cook |
| 6 | Arlington Heights | 75,101 | 75,994 | 1.2% | 16.61 | 4575 | 4 | 15 | 140 ft. | 26 miles northwest | Cook |
| 7 | Itasca | 8649 | 8811 | 1.9% | 4.95 | 1780 | 2 | 26 | 395 ft. | 28 miles northwest | DuPage |
| 8 | Oak Lawn | 56,687 | 57,073 | 0.7% | 8.59 | 6644 | 1 | 13 | 159 ft. | 16 miles southwest | Cook |
Table 7.
Spatial Patterns of Tall Buildings in Suburbs.
| Suburban Community | ||||
|---|---|---|---|---|
| Spatial Model | Washington, D.C. Metropolitan Area | Miami Metropolitan Area | Chicago Metropolitan Area | |
| 1 | Tall Buildings and Major Highways (TB-MH) | Fort Lauderdale | Schaumburg | |
| 2 | Tall buildings and Shopping Malls (TB-SM) | Schaumburg, Oak Brook, Skokie | ||
| 3 | Tall Buildings in Office Parks (TB-OP) | Reston | Oak Brook | |
| 4 | Tall Buildings and Airport City (TB-AC) | Rosslyn-Ballston Corridor | Itasca, Schaumburg, Arlington Heights | |
| 5 | Tall Buildings and Waterfront Development (TB-WD) | Miami Beach, Fort Lauderdale, Sunny Isles Beach, Boca Raton, Bal Harbour | ||
| 6 | Tall Buildings in Gated Communities (TB-GC) | Aventura, Boca Raton | ||
| 7 | Tall Buildings in Suburban Downtown (TB-SD) | Fort Lauderdale, Kendall | Evanston | |
| 8 | Tall Buildings around New Nodes (TB-NN) | Coral Gables, Fort Lauderdale | Skokie | |
| 9 | Tall Buildings along Major Corridors (TB-MC) | Coral Gables, Boca Raton | Oak Park | |
| 10 | Tall Buildings and Transit-Oriented-Development (TB-TOD) | Rosslyn-Ballston (R-B) Corridor, Silver Spring, Tysons Corner, North Bethesda, Bethesda, Alexandria, Reston, Rockville | Kendall | Evanston, Oak Park, Arlington, Oak Lawn |
© 2018 by the author. Licensee MDPI, Basel, Switzerland. This article is an open access article distributed under the terms and conditions of the Creative Commons Attribution (CC BY) license (http://creativecommons.org/licenses/by/4.0/).
Share and Cite
MDPI and ACS Style
Al-Kodmany, K. New Suburbanism: Sustainable Spatial Patterns of Tall Buildings. Buildings 2018, 8, 127. https://0-doi-org.brum.beds.ac.uk/10.3390/buildings8090127
AMA Style
Al-Kodmany K. New Suburbanism: Sustainable Spatial Patterns of Tall Buildings. Buildings. 2018; 8(9):127. https://0-doi-org.brum.beds.ac.uk/10.3390/buildings8090127
Chicago/Turabian StyleAl-Kodmany, Kheir. 2018. "New Suburbanism: Sustainable Spatial Patterns of Tall Buildings" Buildings 8, no. 9: 127. https://0-doi-org.brum.beds.ac.uk/10.3390/buildings8090127
Note that from the first issue of 2016, this journal uses article numbers instead of page numbers. See further details here.