Article

Subject-Specific Self-Concept and Global Self-Esteem Mediate Risk Factors for Lower Competency in Mathematics and Reading

by
Jeffrey M. DeVries
1,*,
Carsten Szardenings
2,
Philipp Doebler
2 and
Markus Gebhardt
3
1
Center for Research on Education and School Development, TU Dortmund University, 44227 Dortmund, Germany
2
Faculty of Statistics, TU Dortmund, 44227 Dortmund, Germany
3
Faculty of Human Sciences, Universität Regensburg, 93053 Regensburg, Germany
*
Author to whom correspondence should be addressed.
Submission received: 11 December 2020 / Revised: 31 December 2020 / Accepted: 2 January 2021 / Published: 7 January 2021
(This article belongs to the Section Childhood and Youth Studies)

Abstract

:
Self-concept and self-esteem are strongly tied to both academic achievement and risk factors for lower academic achievement. The German National Educational Panel Study (NEPS) provides large-scale representative longitudinal data for mathematics, reasoning as well as risk factors, self-concept and self-esteem. Based on measurements in grades five to nine, this paper produces theory-based partially mediated latent growth models with multiple indicators and mediators. This includes the predictors of special education needs (SEN) status, socioeconomic status (SES), reasoning ability, gender, and school track, with both global self-esteem and subject-specific self-concept as mediators. Significant mediatory relationships are found for SEN, gender, reasoning ability, and school track on grade 5 math and reading competence, but neither direct nor mediated effects on rate of change were found. Implications for researchers and educators are discussed.

1. Introduction

The self-perception of a child plays an important role in his or her academic development throughout the school system. Children with weaker a priori competence (DeVries et al. 2018), children with special education needs (SEN; Gebhardt et al. 2015), and children from lower socioeconomic status (SES; DeVries et al. 2018; Hanushek et al. 2011) are at risk of not reaching the same levels of academic achievement as their peers. Furthermore, girls and boys may also perform worse in math or reading respectively (Lekholm and Cliffordson 2008; Robinson and Lubienski 2011). Previous research has suggested that self-perception may play a critical role as a mediator affecting both the pace of development and level of attainment (Diseth 2011; Ferla et al. 2009; Pullmann and Allik 2008). Our study longitudinally models the complex multivariate relationship of SEN, SES, gender, subject-specific self-concept and self-esteem using data from a large-scale assessment for math and reading achievement though early to middle secondary school (5th to 9th year students).

1.1. Self-Concept and Academic Achievement

Within self-concept theory (Shavelson et al. 1976), self-concept is a multifaceted construct representing numerous aspects of self-perception in multiple contexts (Marsh 1986, 1990). Academic self-concept (Marsh 2014; Marsh and Martin 2011) encompasses self-concept relating to academic and scholastic activities. Academic self-concept further varies based upon the subject domains (e.g., math or reading; (Gogol et al. 2016), which relate to current and future subject-specific achievement (Susperreguy et al. 2018).
Current popular models of self-concept argue for a reciprocal relationship between academic self-concept and achievement (Marsh and Craven 2006). That is, a child’s math self-concept as well as his or her achievement both influence his or her subsequent achievement and self-concept. These new levels of achievement and self-concept in turn influence subsequent math self-concept and achievement. Recently, aspects of this reciprocal relationship were upheld in a large-scale, longitudinal study of German learners (Arens et al. 2020). Sixth year learners were followed for three years, and a unidirectional relationship was found where a learner’s self-concept related to subsequent achievement.

1.2. Self-Esteem and Achievement

While subject-specific self-concept relates more strongly to future academic achievement, global measures of self-esteem also relate to academic achievement (Di Giunta et al. 2013; Diseth 2011; Ferla et al. 2009). In a meta-analytic review, Valentine et al. (2004) found that although effect sizes were larger for subject-specific measures of self-perception, significant effects remained for global measures, such as self-esteem. Although, Marsh and Craven (2006) strongly favor subject-specific self-concept measures to a global self-esteem, the use of both variables in a combined model (e.g., Valentine and DuBois 2005) may provide a more complete picture, given the multi-faceted structure of self-perceptions.

1.3. Covariates and Predictors of Achievement and Self-Perception

Self-concept is also related to a number of factors that relate to academic development, for example, SEN, gender, and lower SES. In the next sections, we examine each of these topics’ relationships with academic self-concept and academic achievement.

1.3.1. Special Education Needs

Many learners with SEN are at risk for worse learning outcomes (Gebhardt et al. 2015; Korhonen et al. 2014). They may also be at risk for higher levels of social exclusion (DeVries et al. 2018; Schwab et al. 2014), which is also correlated to a lower academic self-concept and self-esteem (DeVries et al. 2018; Gurney 2018; Novita 2016), all of which may result in worse academic achievement. Furthermore, effects on self-concept may be subject specific. Recently, Savolainen et al. (2018) showed that special education support had differential effects for preteen learners on math and reading self-concept. Thus, it is important to consider both the subject-specific self-concept as well as global self-esteem of learners with SEN. Moreover, the actual experience of learners with SEN may vary greatly based on ability (Cambra and Silvestre 2003; Möller et al. 2009), and thus it is important to consider some measure reasoning alongside the presence of SEN.

1.3.2. Gender

Gender also relates to achievement in secondary schools, albeit differentially based on subject. Commonly, girls outperform boys on reading measures, and boys outperform girls on math measures (Robinson and Lubienski 2011). One explanation of this is related to self-concept theory. Within this framework, boys may be more encouraged by parents, peers, and even teachers in math classes, and girls may be more encouraged in language classes (Niepel et al. 2019). Thus, the self-concept of both girls and boys is reinforced by gender-conforming behaviors within their respective social environments.

1.3.3. Socioeconomic Status

Additionally, SES is related to achievement in study after study (Bjorklund and Salvanes 2011; Currie 2009; DeVries et al. 2018; Lekholm and Cliffordson 2008; Rambo-Hernandez and McCoach 2014). Furthermore, related variables, such as belonging to an underprivileged ethnicity, also relate to poorer achievement and self-esteem (Cvencek et al. 2018; Strand 2014). Early large-scale studies often focused on income-related variables (e.g., White et al. 1993), but a meta-analysis (Sirin 2005) indicated that effect-sizes of SES which used a broad range of variables (e.g., education, occupation, and home resources), were smaller than they were in earlier research relying on income measures alone. Sirin proposed that this might be related to a broader access to learning materials (e.g., books, media, and computers). Furthermore, Sirin’s (2005) meta-analysis showed that the predictive power of a higher SES on achievement weakened over the course of secondary school. This corresponds to other recent findings that suggest a weaker predictive power of high parental education later in secondary school (e.g., DeVries et al. 2018). Furthermore, the effects of SES have been shown to be mediated by personal engagement and self-concept-related variables (Poon 2020; Tomaszewski et al. 2020).

1.4. Towards a Combined Model

Consistent findings indicate that current levels of achievement and subject-specific self-concept relate to future achievement and self-concept within the same subject area (Arens et al. 2017; DeVries et al. 2018; Marsh and Craven 2006). However, these findings focus on self-concept and achievement levels at specific measurement points, instead of an examination of how these factors may affect the overall growth in achievement. Given the reciprocal relationship in Marsh and Craven (2006), a feedback effect may be imagined, where good grades boost self-concept which then boosts achievement. If this were the case, we would expect self-perceptions to boost the rate of growth (i.e., slope) and not just the overall level (i.e., intercept). Furthermore, gender, SES, and SEN also play an important role in the level and growth of academic achievement.
To account for these complex developmental interactions, we are proposing a mediation model where academic self-concept and global self-esteem mediate both the starting level and rate of change in achievement. This model relies on a latent growth structure, which estimates both the intercept (starting level) and slope (rate of change). Figure 1 shows a simplified model involving only a single predictor and mediator, and Figure 2 shows a model with multiple predictors and mediators. A similar model was developed by Ferla et al. (2009) to describe math achievement on PISA tests. In their model, math self-efficacy and math self-concept mediated the relationship between gender, prior achievement, and test scores. Additionally, Diseth (2011) developed a path model where self-efficacy mediated the relationship between prior GPA and current test results. In both cases, self-efficacy or self-concept predicted better strategies which lead to better outcomes. We innovate on these models by examining the growth of achievement over multiple grade levels while examining both academic self-concept and global self-esteem as mediators.

1.5. The Present Study

This paper will examine models where both global self-esteem and subject-specific self-concept mediate the effects of SES, SEN, and gender on initial competency level and growth. Given the diverse levels of competence present in children with SEN, we also include a measure of reasoning as a predictor. Similarly, we include school track as a control variable that has been shown to relate to competence as well as SES (Arens et al. 2017; Susperreguy et al. 2018).
In establishing a mediation relationship, four aspects must be demonstrated (Judd and Kenny 1981). First, the predictor variable(s) must correlate with the outcome variable. Second, the predictor variable(s) must correlate with the mediator. Third, the mediator must correlate with the outcome. As we have described above, SEN, SES, and gender all relate to academic achievement and they further relate to self-esteem and academic self-concept. Similarly, self-esteem and academic self-concept relate to successful learning. As a result, the basic prerequisites for mediation exist within this framework. However, a fourth aspect must also be demonstrated for mediation to exist. That is, the mediator variables alter the relationship between the predictor and outcome variables.
Thus, we can examine the effects of these background variables on both the starting level and growth rate of achievement in separate models for math and reading. This allows us to address our two main research questions:
  • (RQ 1) How do SES, SEN, gender, reasoning ability, and school track relate to starting level and rate of change in reading and math competency in secondary school? We expect SES and reasoning ability to boost grade 5 competency as well as rates of growth, and for children with SEN to have a lower grade 5 competency. Similarly, we expect girls to outperform boys in reading competency, and vice versa for math competency.
  • (RQ 2) Do global self-esteem and subject-specific self-concept mediate the relationship? We expect to find that both global self-esteem and subject-specific self-concept will mediate the effects predicted in the first question.

2. Methods

2.1. Participants and Data

The data are part of National Educational Panel Study (NEPS; Blossfeld et al. 2011), a multicohort large-scale longitudinal study, which has been administered for most cohorts until recently in yearly waves. We worked with data from Starting Cohort 3 (SC3), which was first sampled in fifth grade in late 2010 and 2011. We focus on grades five, seven, and nine, and we exclude children attending a special education needs school, thus ensuring that all participating children with SEN status were attending regular schools within the German education system. In all, 5923 participants were included in the math model and 5919 in the reading model.
Among other NEPS measures, reading competence (Gehrer et al. 2013) and mathematics competence (Schnittjer and Duchhardt 2015) were measured. Additionally, student reports of grades, social economic factors, migration background, gender, year of birth, self-efficacy, and self-concept were recorded. Caretakers answered—among others—questions regarding migration background and school track attended by the respective child. For additional details, particularly ambiguous cases, issues within the NEPS database, and preparation of variables for imputation, see Appendix A.

2.2. Missing Data and Multiple Imputation

The subsequent models are based on school track, special educational needs, reasoning, migration, and socioeconomic status, competence, and global self-esteem, and both math and reading self-concept. Regarding these variables, there were 6529 partially incomplete cases out of 7760, but the subsequent analysis required complete cases. Discarding incomplete cases potentially introduces biases due to sample selection (cf. Schafer and Graham 2002) and reduces sample size unnecessarily. Multiple imputation (MI) is a technique designed to deal with missing data without introducing bias and to use all of the (partially) observed data, the reported standard errors also reflecting the uncertainty about the missing values (Van Buuren 2018). In MI with chained equations (MICE), missing values are repeatedly sampled according to predictions of an imputation model (Van Buuren and Groothuis-Oudshoorn 2011). For a detailed description of the MI procedure, please see Appendix B.

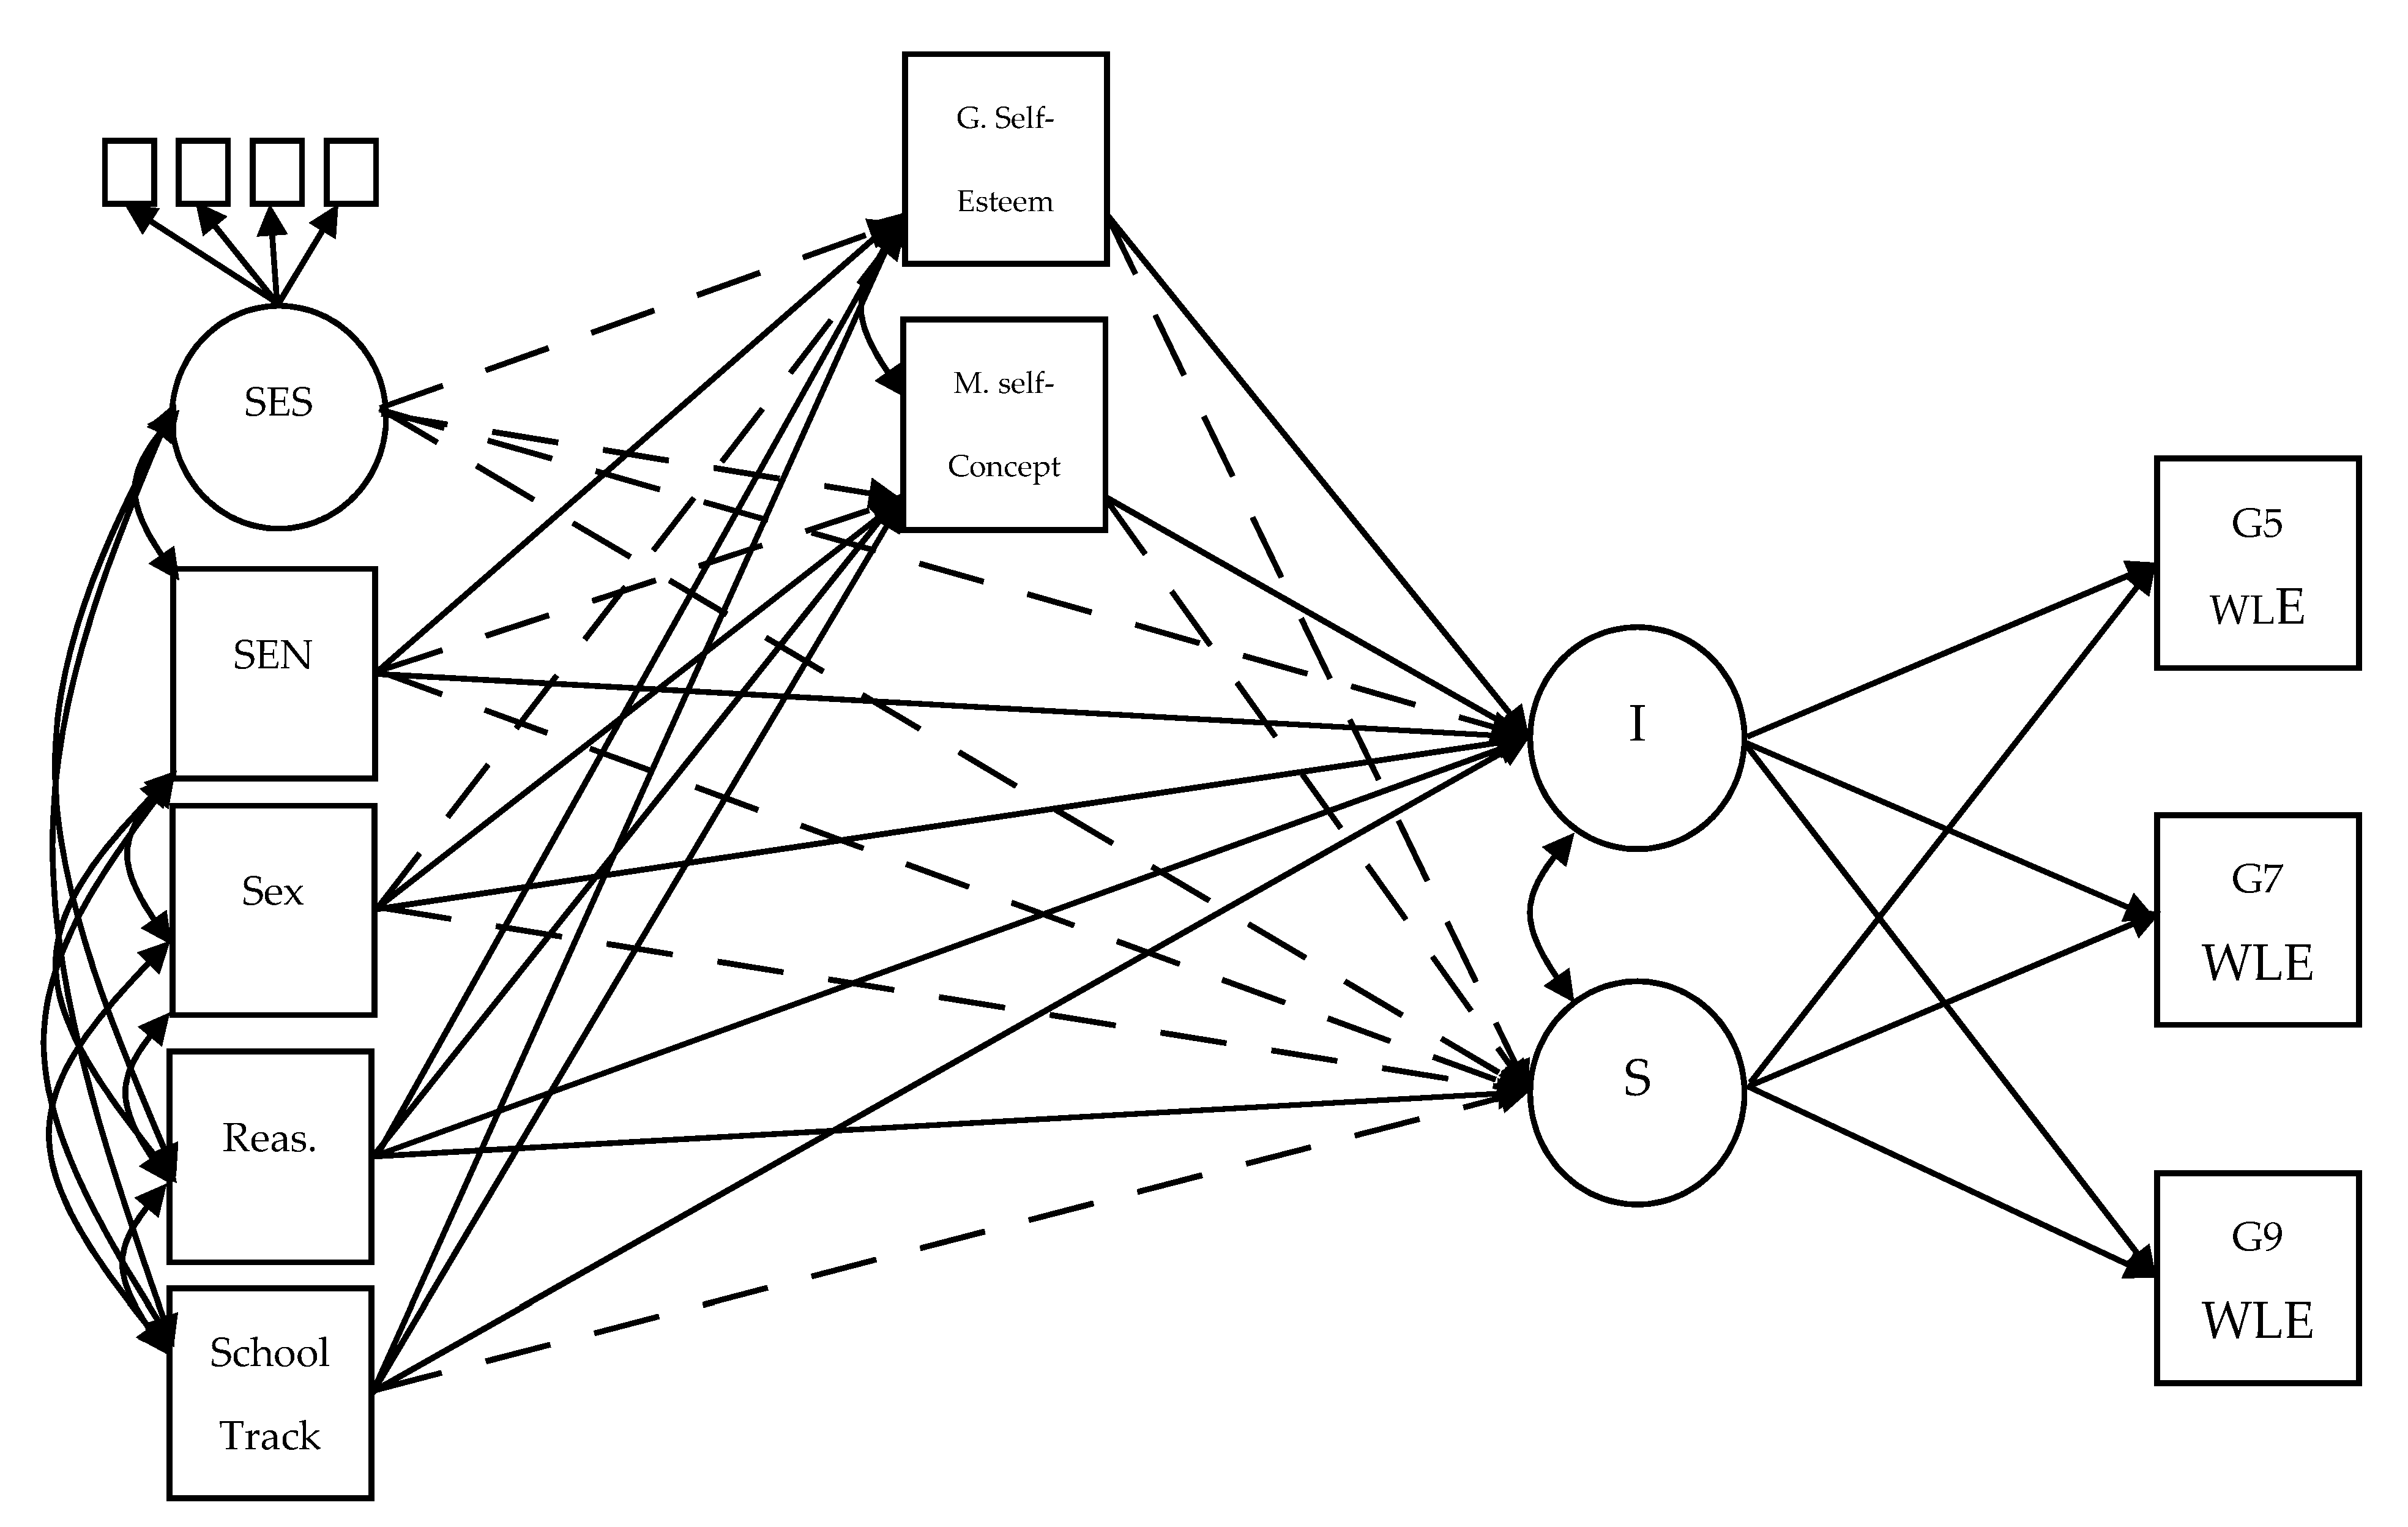
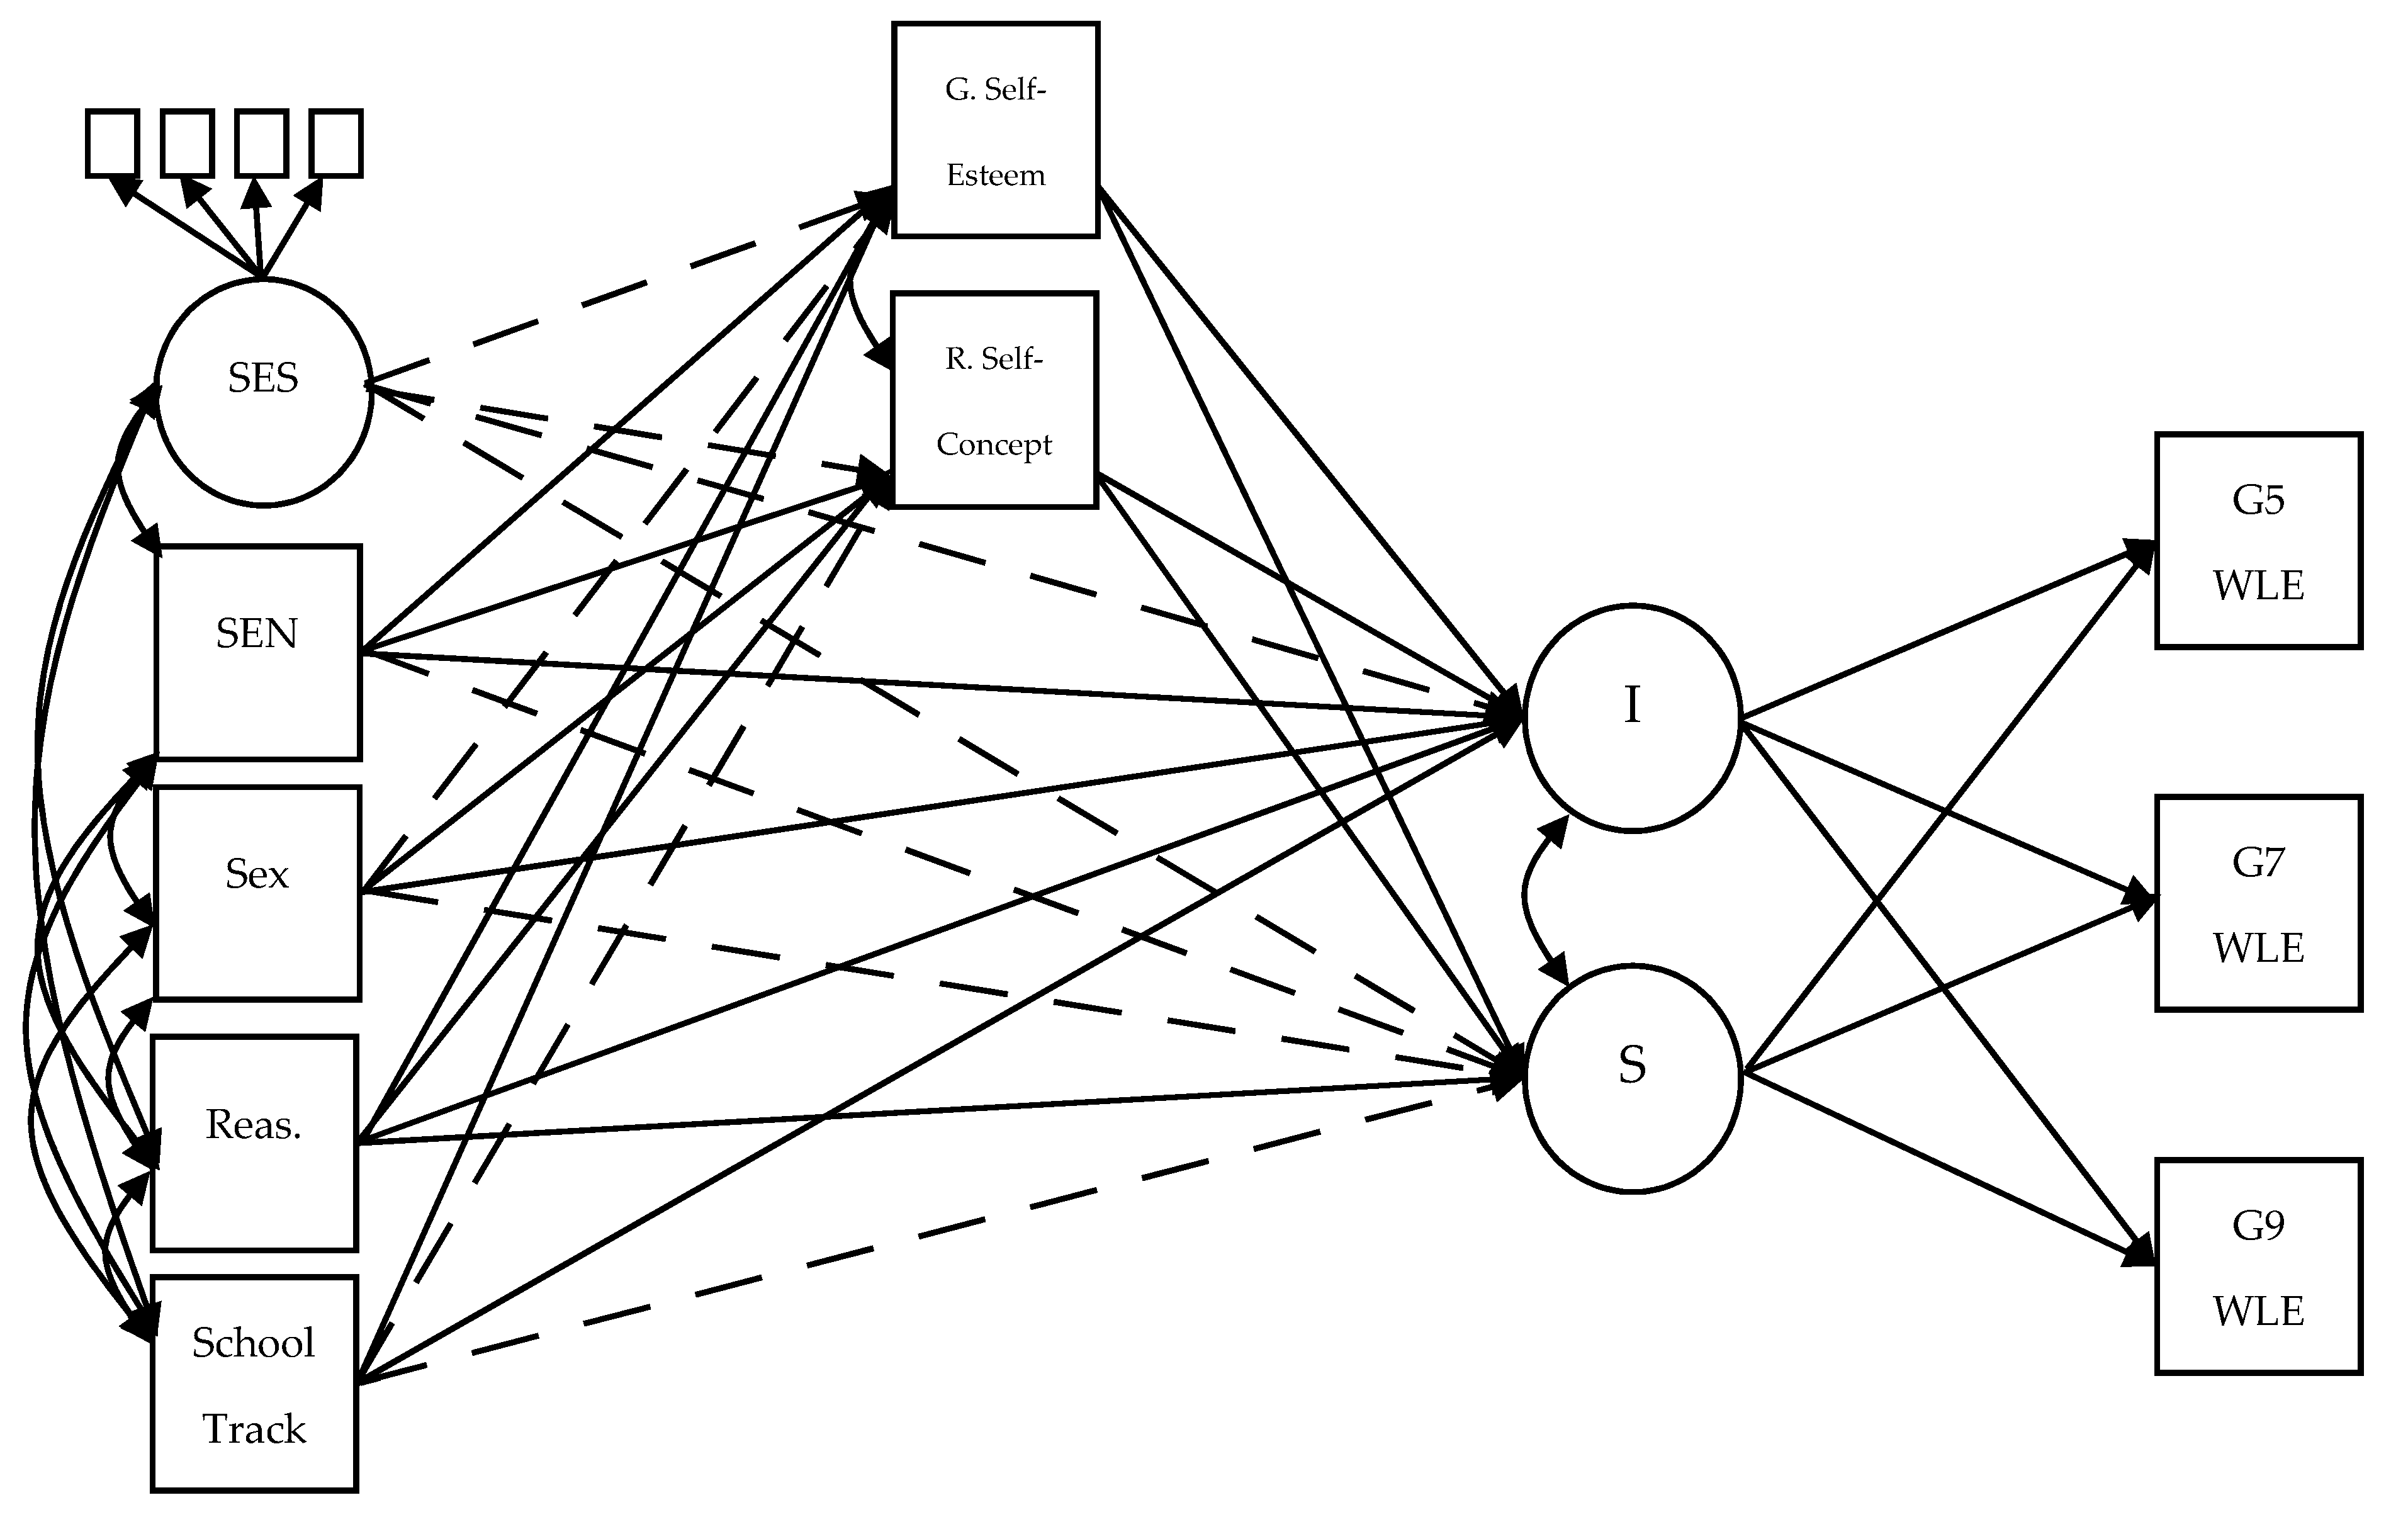
2.3. Structural Equation Modeling

2.3.1. Variables in the Models

Socioeconomic status was evaluated by student responses to what things they had at home that might help with their schoolwork (see Table 1). We conducted an exploratory factor analysis (EFA) with oblique quartimax rotation to identify the factor structure of this instrument. The EFA is summarized in Table 2. Based upon likelihood ratio testing, a 3-factor solution was found to be the best fit, with the item Room representing the first factor, the items Classics and Poems loading on second factor, and the items Desk, Software, Books, and Dictionary on a third factor. We used only the last factor to establish SES as this was the only factor with more than two items. The results of this EFA are reported in Table 2. SEN was determined by school records of a child’s diagnosis of SEN in wave 3. Reasoning was based on the number of completed items in the NEPS nonverbal reasoning ability in 5th grade (variable dgg5_sc3b in NEPS; Haberkorn and Pohl 2013).

2.3.2. Latent Growth Models

Using the imputed data, four latent growth models were fit to model the starting level and change in competence across grades five, seven, and nine: A mediation and a no mediation model were compared for both reading and math competency. These models are described in Figure 3 and Figure 4. They were implemented using the R-package lavaan (Rosseel 2012). The no-mediation models estimated latent intercepts and slopes for the change in competency over 5th, 7th, and 9th grade. The intercept and slope were then regressed on SEN, gender, reasoning ability, school track, and a latent variable for SES. In the mediation model, partial mediation was assumed, with intercept and slope also regressed on ratings of general self-esteem and of the participant’s subject-specific self-concept. Subject-specific self-concept and self-esteem were then also regressed on all predictor variables of the no-mediation model. Maximum likelihood estimation was used in a complex model with clusters based on the class ID of the student in 7th grade.
Model fit was evaluated by the comparative fit index (CFI), root mean squared error of approximation (RMSEA), and standardized root mean square residual (SRMR). Fit was considered acceptable with CFI > 0.90, RMSEA < 0.08, and SRMR < 0.08. Fits were considered good with CFI > 0.95, RMSEA < 0.05, and SRMR < 0.05 (Brown 2015; Hu and Bentler 1999).

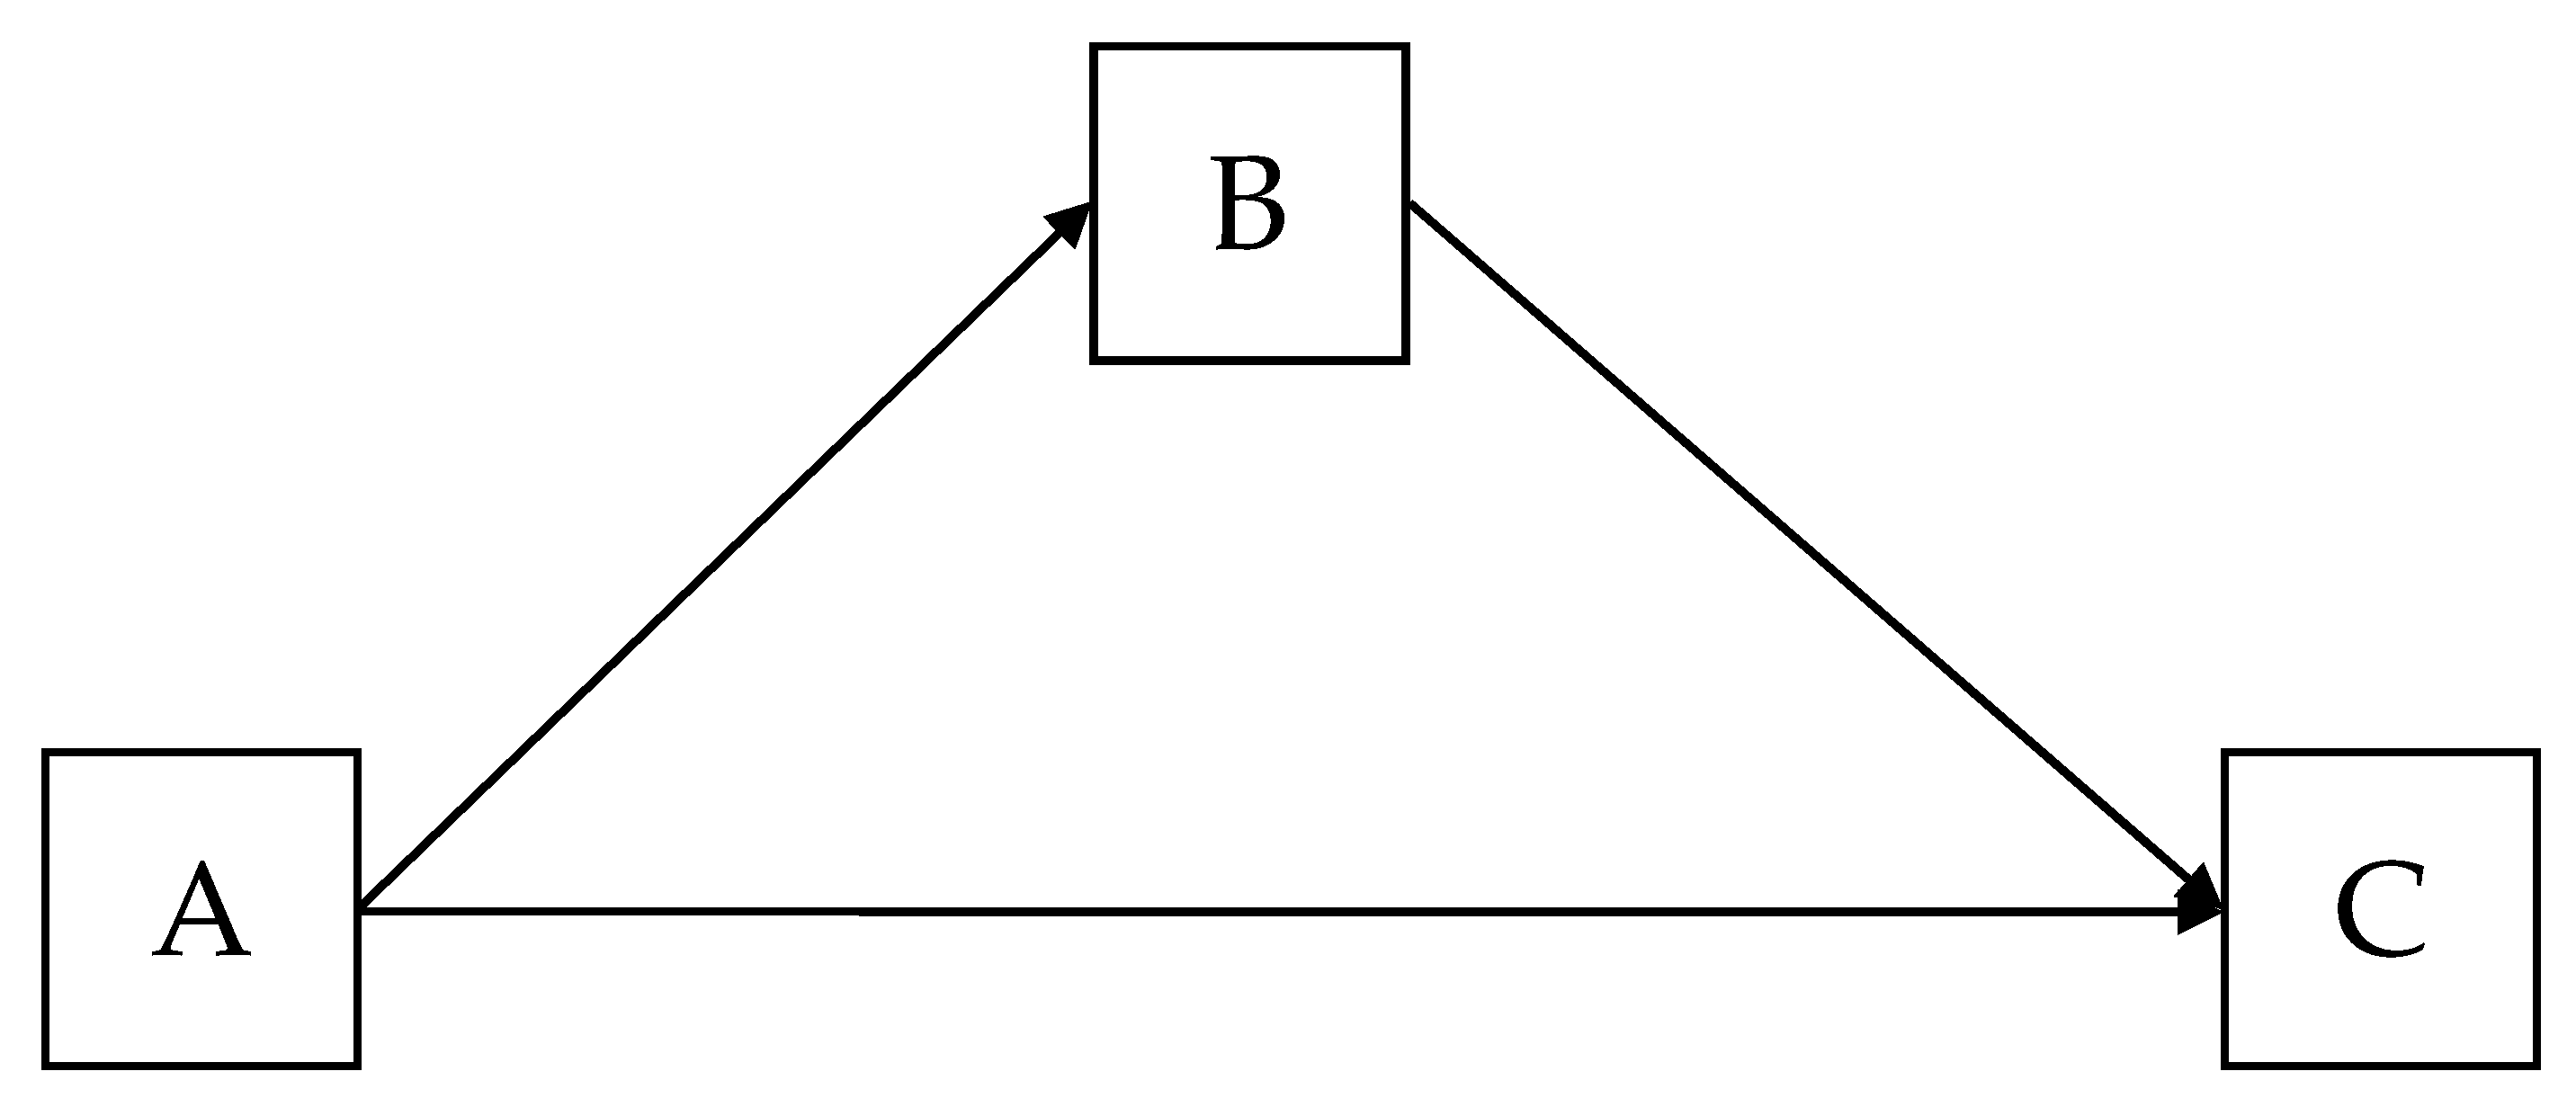
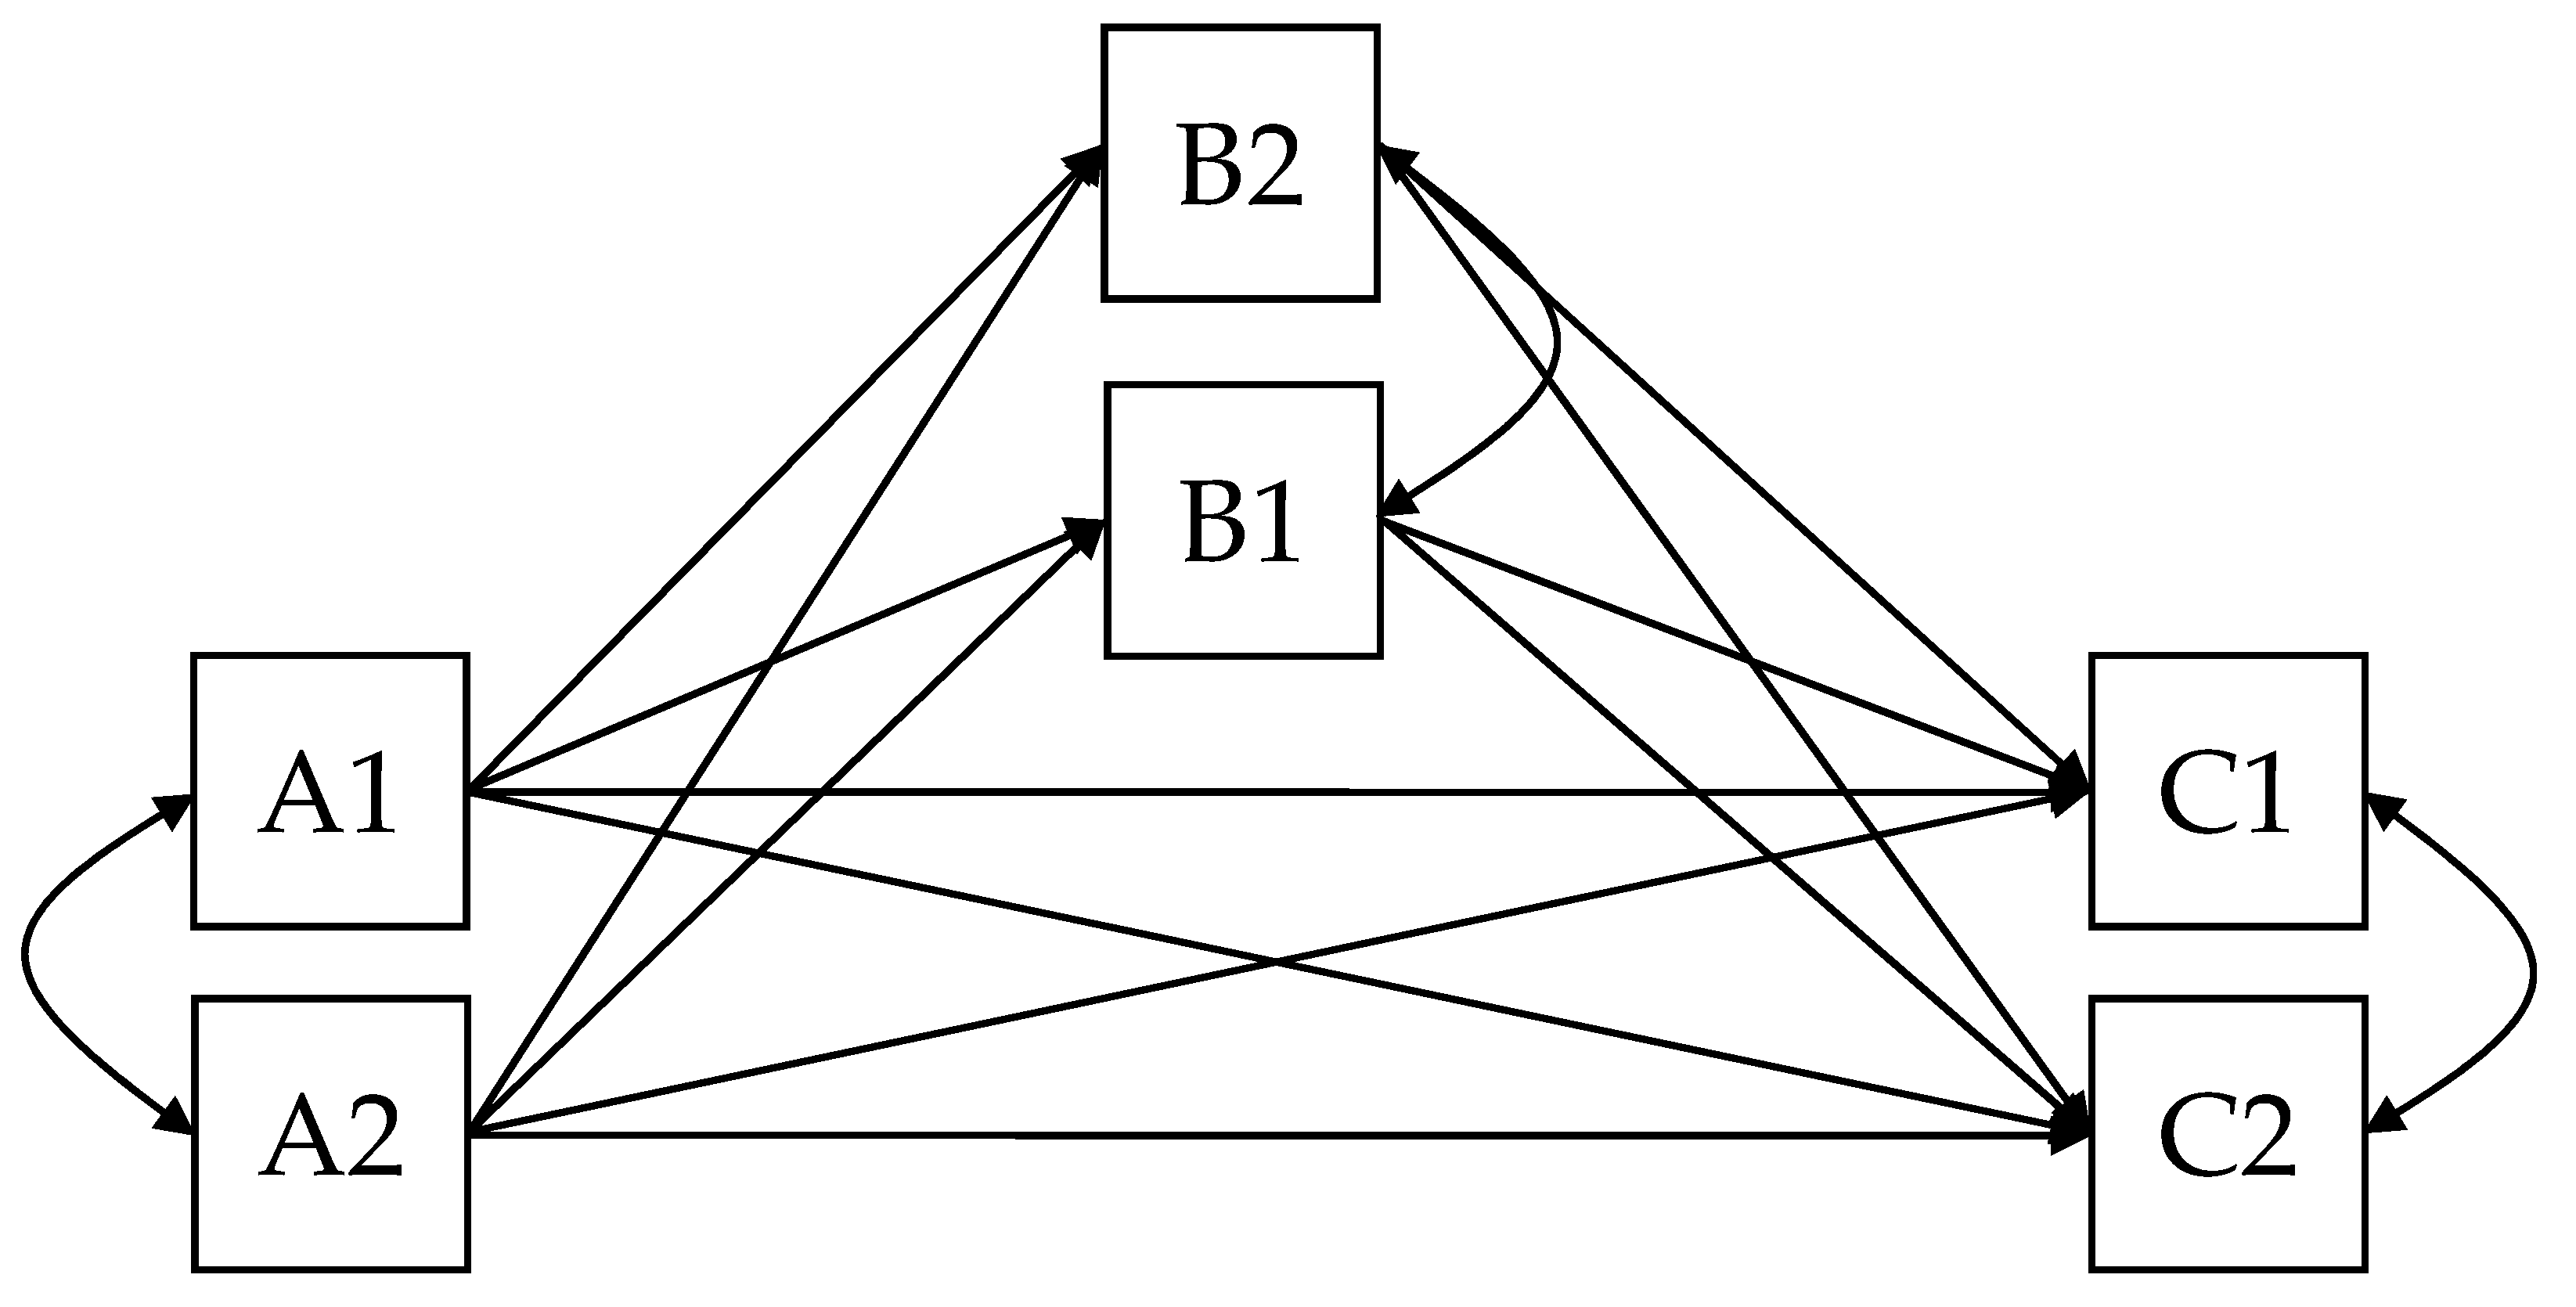
2.4. Mediation Tests

The amount of mediation was measured by the ratio of direct effects between the mediation and no mediation model and the ratio of indirect effects between both models (see MacKinnon et al. 2007). The direct ratio (DR) was given by the formula
D R = c c   ,
where c is the standardized path coefficient for the non-mediation model of the predictor onto the outcome (intercept or slope) and c′ is the same standardized coefficient in the mediation model. The indirect ratio (IR) was given by the formula
I R = a b c   ,
where c is the same as above, a is the path onto either mediator (self-esteem or subject-specific self-concept), and b is the path from that mediator onto either outcome (intercept or slope). Both ratios are informative in that the direct ratio tells us the overall level of mediation produced by both of our mediators and that the indirect ratio can provide information about the relative mediation of each separate mediator. The use of these ratios is preferred for consistent mediation effects where there are more than 500 cases (Wen and Fan 2015), and our large database provides us plenty of cases. However, as described below, there is one case of inconsistent mediation, for which we make no interpretations with either the DR or IR. We further restrict our mediation analyses to cases where there are significant path coefficients.

3. Results

3.1. Model Fit

The fits of all models are described in Table 3. In all cases, the models met the criteria for a good fit according to RMSEA and CFI. However, fit was only adequate for the no-mediation models on the metric of SRMR. Meanwhile, the fit of all mediation models was considered good. Furthermore, the fit of both mediation models was significantly better for both subjects, with χ2-math (14) = 464.9, p < 0.001, and χ2-reading (14) = 253.8, p < 0.001. Therefore, we prefer the mediation model in both cases. We examine both models in order to describe the mediation results. In all models, the factor structure of the latent SES variable was identical. All indicators loaded significantly with loadings over 0.950.

3.2. Direct Effects in the No-Mediation Model

As can be seen in Table 4, there are a number of significant relationships between predictor variables and the intercept of no-mediation model. Effects were similar across both mathematics and reading models, with significant positive relationships between reasoning score and upper school track on both reading and math model intercepts, ps < 0.001. Similarly, children with SEN had a significantly lower intercept, p < 0.001. Meanwhile, girls had a higher intercept in the reading model than boys, and a lower intercept in the math model, p < 0.01 and p < 0.001, respectively. In neither model was there a significant relationship between SES and the intercept. The only significant relationship between predictor and the slope of the latent growth model was reasoning score in the both models; children with a higher reasoning score had a slightly lower slope in both math and reading, p < 0.01 and p < 0.001, respectively. Thus, in the no-mediation model, gender, SEN, and school track all relate to the starting level of either math or reading competency, and do not relate to the rate of growth, while reasoning ability relates to a slightly slower rate of growth and a higher starting level.

3.3. Mediation

As can be seen in Table 5, the mediation model is very similar, but not identical to the no mediation model. Again, upper school track and higher reasoning scores relate to higher intercepts in reading and math models, p < 0.001. Boys have a higher intercept in the math model than girls, and a lower intercept in the reading model, p < 0.001, and children with SEN have a lower intercept in both reading and math models, p < 0.001. Reasoning score relates to a slightly lower slope in both reading and math models, p < 0.001.
Meanwhile, significant relationships exist between the predictor and mediator variables, as well as the mediators and the intercept and slope. In both math and reading models, higher self-esteem and subject-specific self-concept relate to higher intercept values, ps < 0.01. They also relate to a slightly lower slope in the reading model, ps < 0.05, but not the math model, ps > 0.05.
As the observed value of self-esteem remained constant in both models, its relationship between predictor variables was consistent across both reading and math models. Children with SEN had lower self-esteem, p < 0.001. Children in an upper school track had higher self-esteem, p < 0.001. Children with higher reasoning scores had higher self-esteem, p < 0.05.
Meanwhile, relationships of predictor variables and subject-specific self-concept varied across both models. In the math model, girls had a lower self-concept, p < 0.001, those in a higher school track had a higher self-concept, p < 0.05, and those with a higher reasoning score also had a higher self-concept, p < 0.001. SEN did not relate to math self-concept, p > 0.05. However, in the reading model, children with SEN had a lower subject-specific self-concept, p < 0.01, and those in the upper school track and girls had a higher self-concept, ps < 0.001. Reasoning score did not relate to subject-specific self-concept in the reading model.
Direct and indirect mediation values are described in Table 6. Only calculations involving significant path coefficient were considered. All others are excluded here. Columns for direct coefficients reflect the effects of both mediators, while columns for indirect coefficient reflect the specified mediator.
The significant, negative relationship between SEN and the intercept was mediated in both the reading and math models. However, the partial mediation was quite small in the math model, with a direct coefficient of 0.985. This effect was characterized by a modest indirect coefficient of global self-esteem of 0.052 and nonsignificant path coefficients for subject-specific self-concept. Meanwhile, the mediation was stronger in the reading model with a direct coefficient of 0.851. This effect was characterized by modest indirect coefficients for both global self-esteem and subject-specific self-concept of 0.062 and 0.083, respectively. Thus, self-esteem and subject self-concept are important mediators for initial reading competency level, and there is a modest mediation for self-esteem, but not subject self-concept, for the initial math competency level.
The significant relationship between gender and intercept in both math and reading models was also mediated in both models. In both cases, the mediation was moderate to strong with direct coefficients of 0.729 in the math model and 0.821 in the reading model. In both cases, only the subject-specific self-concepts were important mediators with large indirect coefficients of 0.321 and 0.178, respectively. Thus, the effect of gender on starting level is strongly mediated by subject-specific self-concept and not by self-esteem in our models.
The significant positive relationship between reasoning score and intercept was modestly mediated in the math model and weakly mediated in the reading model with direct coefficients of 0.945 and 0.982, respectively. In the math model, the indirect coefficient for subject-specific self-concept was 0.062, indicating a modest effect, while the indirect coefficient for general self-esteem was 0.007, indicating a quite small effect. Meanwhile, in the reading model, the indirect coefficient for general self-esteem was 0.011, indicating a small effect and there was no significant path coefficient for subject-specific self-concept. Thus, the effect of reasoning is weakly mediated in our models, with subject-specific self-concept playing a modest role in the math model.
The significant, positive relationship between attending the upper school track and intercept was modestly mediated in the math model and moderately mediated in the reading model with direct coefficients of 0.938 and 0.876, respectively. Small effects were noted for both subject-specific self-concept and general self-esteem in both the math models, 0.047 and 0.024, respectively, and the reading models, 0.087 and 0.038, respectively. Thus, there is a small mediation effect in both models, and both subject-specific self-concept and self-esteem remain important.
The significant negative relationship between reasoning and slope was not consistently mediated in our models. Although significant paths existed, the direct coefficient was negative in the math model, and the indirect coefficients were negative in the reading model. This is indicative of indirect mediation. This may be complicated by the likely existence of a ceiling effect. That is, children near the top of the ability level in grade 5 had less ground they could gain in grades 7 and 9 and hence, the slope will be lower in turn. Thus, we cannot draw any reliable conclusions regarding mediation of the slope in our model.

4. Discussion

Our analyses have described the complex relationship among SES, SEN, gender, global self-esteem, subject-specific self-concept and achievement over time. More specifically, we demonstrated a model where self-esteem and self-concept mediate the effect of background variables on the latent growth of math and reading competence through grades 5 to 9. The good fit of these models coincides with the theoretical background that suggests that each of our predictor variables (SEN, SES, and gender) relates to both the mediators and the outcomes. Practically speaking, this fits within the framework of self-concept theory (Marsh 2014; Shavelson et al. 1976) as well as previous work, which suggested a mediatory relationship of academic self-concept (e.g., Diseth 2011; Ferla et al. 2009).
As expected, the models show that SEN, gender, reasoning ability, and school track all relate to grade 5 competence in both math and reading. There is a negative relationship between SEN and competence, and a positive relationship between school track and nonverbal reasoning ability and competence. Meanwhile, girls had a higher reading competence and a lower math competence. We had expected to see more comprehensive effects on the slope, but that was not evident. It may be that these effects happen much earlier in development.
Furthermore, we do see that, as predicted, global self-esteem and subject-specific self-concept mediate the effects described above. The mediation effect is rather large for self-concept on gender and intercept with the strength of the direct relationship decreasing by 32% in the case of math, and 18% in the case of reading. Further, this effect was solely due to self-concept and not to self-esteem. This strongly reinforces the self-concept framework for interpreting gender effects in mathematics (Niepel et al. 2019). The mediation effect for SEN is more modest, but still sizeable, with a direct relationship reduction of 2% in math, and 15% in reading. The mediation for math was solely due to self-esteem, while in reading, it was related to both self-esteem and self-concept. Previous work has described efforts to boost both self-esteem (Rogers and Tannock 2018) and self-concept (Elbaum and Vaughn 2003) as important for learners with SEN status. Thus, higher self-esteem and self-concept may mediate part of the risk of low achievement from SEN status. However, because we only see effects at the levels of intercepts in our models, such intervention problems might not affect growth, but only ability level in secondary schools. It seems possible that earlier intervention (i.e., before secondary school) might be more effective on growth, but we were unable to examine this possibility with our data. We also note that there are significant mediation effects for both school track and reasoning ability onto grade 5 competence. Although these were included as control variables, the consistent pattern of mediation matches what is seen for the other variables of interest, i.e., a partial mediation effect.
We did not see the expected effects of SES in either model on grade 5 competence or on rate of growth. We estimated SES based on Sirin’s (2005) proposal that access to learning materials in the home environment was more predictive than only using one or two SES-related variables (e.g., income or education level). It is worth noting that while SES did not relate to our mediators or outcome variables, it consistently covaried with our other predictors in a predictable pattern (e.g., positively with SEN status and negatively with school track and reasoning ability). Sirin found that the effect of SES on learning outcomes shrank over time, which may account for our findings. Alternatively, as there is already a significant SES effect on school track within the German system, a large amount of the SES variance may be included within the school track variable.
This study had a number of strengths. We were able to develop partial mediation models with multiple predictors and mediators with effects on competency growth for grades 5, 7 and 9. These models were based upon well-established theory regarding academic self-concept and self-esteem and they adequately model the complex relationship between multiple important predictors and achievement. We further used a large, representative panel survey with many respondents (i.e., NEPS). However, some weaknesses remain. First, we only compared the possibilities of a mediation and a no-mediation relationship, and we did not test other potential models; however, because of the number of potential alternative models, it was particularly important to examine models based upon theory. Second, we only had three measurement points for competence. As a result, it is impossible to test for autoregression. Future work should include more measurement points. Third, we produced separate models for math and reading. This was due to the computational complexity of such a combined model. Fourth, we were only able to use a single measurement point of self-perception, and thus it was not possible to examine for a reciprocal or cross-lagged relationship between self-perceptions and achievement. Finally, we did see inconsistent results with respect to the slope in both models. Notably, higher reasoning related to a worse rate of growth in both models, and both of our mediators related to a worse rate of growth in the reading model. This is indicative of a ceiling effect, which future work should investigate and if possible account for.

5. Conclusions

Subject-specific self-concept and global self-esteem provide a consistent partial mediation on the effects of SEN and gender on competence for secondary students. The mediation ranges from modest to large depending on the specific predictor and outcome variables. Future researchers are encouraged to develop more comprehensive models to further explore this relationship and compare it to other possibilities. For schools and educators, interventions targeting self-concept and self-esteem may help mediate the risk for poor achievement for some learners.

Author Contributions

Conceptualization, J.M.D., C.S., P.D. and M.G.; methodology, J.M.D. and C.S.; software, J.M.D. and C.S.; validation, J.M.D., C.S., P.D. and M.G.; formal analysis, J.M.D.; investigation, J.M.D., C.S.; writing—original draft preparation, J.M.D., C.S.; writing—review and editing, J.M.D., C.S., P.D., and M.G.; supervision, P.D. and M.G.; project administration, P.D. and M.G.; funding acquisition, P.D. and M.G. All authors have read and agreed to the published version of the manuscript.

Funding

This research was funded by the DFG Priority Programme, grant number 1646, Education as a Lifelong Process, DFG-grant DO 1789/3-1.

Institutional Review Board Statement

No new IRB approval was required as the study involved analysis of already collected data.

Informed Consent Statement

Informed consent was obtained from all subjects involved in the study.

Data Availability Statement

The data presented in this study are available at National Education Panel Study website at doi:10.5157/NEPS:SC3:9.0.0

Acknowledgments

This paper uses data from the National Educational Panel Study (NEPS): Starting Cohort Grade 5, doi:10.5157/NEPS:SC3:9.0.0. From 2008 to 2013, NEPS data was collected as part of the Framework Program for the Promotion of Empirical Educational Research funded by the German Federal Ministry of Education and Research (BMBF). As of 2014, NEPS is carried out by the Leibniz Institute for Educational Trajectories (LIfBi) at the University of Bamberg in cooperation with a nationwide network.

Conflicts of Interest

The authors declare no conflict of interest.

Appendix A. Special Notes on Data Preparation

Information on the school track of a student was aggregated from student self-reports and the responses of all caretakers with children attending the same class as this student (Bayer et al. 2014). We dichotomized the remaining values to only reflect attendance of highest school track (i.e., Gymnasium) versus all other tracks.
Migration generation status was aggregated from student and parent responses (Olczyk et al. 2014). We dichotomized the provided generation status (born abroad vs. born in Germany) and compared the value with the student report of country of birth. There were no discrepancies and since the measure based on generation status yielded fewer missing data, we worked with the dichotomized generation status in subsequent analyses.
The value of school track changed over time for 60 students. Without changing schools, it is possible to change school track within a school. We set school track to be the statistical mode of the responses across waves, as this seems to most accurately reflect the received schooling. For 98 students, gender varied over time. However, in most cases the gender switched back and forth, or was only different at one point in time. We set gender to the statistical mode of a student’s responses across waves. It should be noted that time varying school track and gender could more accurately reflect reality, but apart from requiring a more sophisticated data cleaning procedure, the variation across waves was so low that this caused problems with our missing data handling (see Appendix B). Student reports of year of birth were inconsistent across waves. Some responses were impossible or implausible given grade and wave. We removed all responses for year of birth prior to 1997 and after 2002 and set a student’s year of birth to the statistical mode of his/her responses if there was any variance. This was the case for 85 students.

Appendix B. Details of Multiple Imputation

In order to obtain the desired properties of MI, two conditions must be met: The imputation model has to contain all data/variables that are later used in the analysis, and the data must be missing at random (MAR). MAR means conditional on all data used in the imputation model, the probability of an observation (response) to be missing is independent of the actual value that is missing. In order to justify the MAR assumption, the imputation model needs to incorporate variables that reasonably explain the missingness of responses. See Schafer and Graham (2002) for an introduction to multiple imputation, its technicalities, its benefits, and dangers of other methods that deal with missing data, e.g., case deletion.
Many variables that could be incorporated in our imputation model are recorded in NEPS. In practice, computation time and numerical instability necessitate a parsimonious model (compare to Van Buuren 2018, p. 167ff). Variables with more than 50% missing responses were disregarded outright (none of which were of intrinsic interest for this article). We then built the model stepwise, beginning by incorporating only the target variables, i.e., the variables used in the subsequent analysis, and background variables: gender, year of birth, and school track. The background variables were recorded once each wave but varied little between waves, resulting in colinear variables detrimental to the imputation. Hence, we converted the repeated records of year of birth, gender, and school track to time stable variables as described in the data preparation subsection.
In the next step, we expanded our imputation model: for each target variable, we added the 15 variables with the highest correlation with the target variable or with an indicator variable for its missingness (compare with Van Buuren 2018). The following variables were added: Math and German grades from 2010–2014, self-efficacy in math (four questions in 2012), motivation by competition with others in 2013, intrinsic motivation with respect to math and German in 2013, helplessness regarding German and math in 2012 and 2015, performance in orthography subtests in 2010, 2012, and 2014, satisfaction with family, friends, health, possessions, school, and overall satisfaction from 2010–2017. Finally, in order to account for the hierarchical structure of the data (cf. Van Buuren 2018, p. 197), we added adjusted class means (i.e., the mean of every other student in a student’s classroom) as a predictor for every variable.
In sum, our imputation model consists of our target variables, predictors of target variables, the predictors of predictors (determined by correlation), and the adjusted cluster means (cf. 2018, p. 168). We imputed the aforementioned variables using predictive mean matching for interval scaled variables and multinomial, ordered, or ordinary logistic regression for discrete variables.
We imputed 21 data sets with a maximum number of iterations of twenty per data set using the R package mice (Van Buuren and Groothuis-Oudshoorn 2011). We settled on twenty iterations since a prior attempt with 10 exhibited signs of non-convergence and hence possibly biased imputations. The decision of whether the specified maximum number of iterations was sufficient was based on the absence of ongoing trends or differences between data sets in the trace plots of standard deviation and mean of imputed variables.
In order to evaluate plausibility of the imputations, we compared marginal distributions of our outcome variables split by school track, gender, and SEN between the original and all imputed data sets, as well as bivariate distributions of outcome variables with independent variables. See Van Buuren (2018) for matters on convergence (p. 187ff) and diagnostic plots (p. 190ff). The results were aggregated by Rubin’s rules (Rubin 1987) using the R package semTools (Jorgensen et al. 2019).

References

  1. Arens, A. Katrin, Herbert. W. Marsh, Reinhard Pekrun, Stephanie Lichtenfeld, Kou Murayama, and Rudolf Vom Hofe. 2017. Math self-concept, grades, and achievement test scores: Long-term reciprocal effects across five waves and three achievement tracks. Journal of Educational Psychology 109: 621–34. [Google Scholar] [CrossRef] [Green Version]
  2. Arens, A. Katrin, Anne C. Frenzel, and Thomas Goetz. 2020. Self-Concept and Self-Efficacy in Math: Longitudinal Interrelations and Reciprocal Linkages with Achievement. The Journal of Experimental Education, 1–19. [Google Scholar] [CrossRef]
  3. Bayer, Michael, Frank Goßmann, and Daniel Bela. 2014. Technical Report: Generated School Type Variable t723080_g1 in Starting Cohorts 3 and 4 (NEPS Working Papers No. 46). Bamberg: Leibniz Institute for Educational Trajectories, National Educational Panel Study, Available online: https://www.neps-data.de/Portals/0/Working%20Papers/WP_XLVI.pdf (accessed on 1 December 2020).
  4. Bjorklund, Anders, and Kjell G. Salvanes. 2011. Education and Family Background: Mechanisms and Policies. In Handbooks in Economics: Vol. 26. Handbook of the Economics of Education, 1st ed. Edited by Eric A. Hanushek, Stephen Machin and Ludger Woessmann. Amsterdam: North-Holland, vol. 3, pp. 201–47. [Google Scholar]
  5. Blossfeld, Hans-Peter, Hans-Günther Roßbach, and Jutta. von Maurice, eds. 2011. Education as a Lifelong Process: The German National Educational Panel Study (NEPS) [Special issue 14]. In Zeitschrift Für Erziehungswissenschaft. Heidelberg: VS Verlag für Sozialwissenschaften. [Google Scholar]
  6. Brown, Timothy A. 2015. Methodology in the social sciences. In Confirmatory Factor Analysis for Applied Research, 2nd ed. New York and London: The Guilford Press. [Google Scholar]
  7. Cambra, Christina, and Núria Silvestre. 2003. Students with special educational needs in the inclusive classroom: social integration and self-concept. European Journal of Special Needs Education 18: 197–208. [Google Scholar] [CrossRef]
  8. Currie, Janet. 2009. Healthy, Wealthy, and Wise: Socioeconomic Status, Poor Health in Childhood, and Human Capital Development. Journal of Economic Literature 47: 87–122. [Google Scholar] [CrossRef] [Green Version]
  9. Cvencek, Dario, Stephanie A. Fryberg, Rebecca Covarrubias, and Andrew N. Meltzoff. 2018. Self-concepts, self-esteem, and academic achievement of minority and majority North American elementary school children. Child development 89: 1099–109. [Google Scholar] [CrossRef] [PubMed]
  10. DeVries, Jeffrey. M., Katharina Rathmann, and Markus Gebhardt. 2018. How Does Social Behavior Relate to Both Grades and Achievement Scores? Frontiers in Psychology 9: 857. [Google Scholar] [CrossRef] [Green Version]
  11. DeVries, Jeffrey M., Stefan Voß, and Markus Gebhardt. 2018. Do learners with special education needs really feel included? Evidence from the Perception of Inclusion Questionnaire and Strengths and Difficulties Questionnaire. Research in Developmental Disabilities 83: 28–36. [Google Scholar] [CrossRef]
  12. Di Giunta, Laura, Guido Alessandri, Maria Gerbino, Paula Luengo Kanacri, Antonio Zuffiano, and Gian Vittorio Caprara. 2013. The determinants of scholastic achievement: The contribution of personality traits, self-esteem, and academic self-efficacy. Learning and Individual Differences 27: 102–8. [Google Scholar] [CrossRef]
  13. Diseth, Åge. 2011. Self-efficacy, goal orientations and learning strategies as mediators between preceding and subsequent academic achievement. Learning and Individual Differences 21: 191–95. [Google Scholar] [CrossRef]
  14. Elbaum, Batya, and Sharon Vaughn. 2003. For which students with learning disabilities are self-concept interventions effective? Journal of Learning Disabilities 36: 101–8. [Google Scholar] [CrossRef]
  15. Ferla, Johan, Martin Valcke, and Yonghong Cai. 2009. Academic self-efficacy and academic self-concept: Reconsidering structural relationships. Learning and Individual Differences 19: 499–505. [Google Scholar] [CrossRef]
  16. Gebhardt, Markus, Christine Sälzer, Julia Mang, Katharina Müller, and Manfred Prenzel. 2015. Performance of Students with Special Educational Needs in Germany: Findings From Programme for International Student Assessment 2012. Journal of Cognitive Education and Psychology 14: 343–56. [Google Scholar] [CrossRef]
  17. Gehrer, Karin, Stefan Zimmermann, Cordula Artelt, and Sabine Weinert. 2013. NEPS framework for assessing reading competence and results from an adult pilot study. Journal for Educational Research Online 5: 50–79. [Google Scholar]
  18. Gogol, Katarzyna, Martin Brunner, Franzis Preckel, Thomas Goetz, and Romain Martin. 2016. Developmental Dynamics of General and School-Subject-Specific Components of Academic Self-Concept, Academic Interest, and Academic Anxiety. Frontiers in Psychology 7: 356. [Google Scholar] [CrossRef] [Green Version]
  19. Gurney, Peter W. 2018. Self-Esteem in Children with Special Educational Needs. Abingdon: Routledge. [Google Scholar] [CrossRef]
  20. Haberkorn, Kerstin, and Steffi Pohl. 2013. Cognitive Basic Skills (Non-Verbal) Data in the Scientific Use File. Bamberg: University of Bamberg, National Educational Panel Study (NEPS), Available online: https://www.neps-data.de/Portals/0/NEPS/Datenzentrum/Forschungsdaten/SC3/com_cogbasic2013_en.pdf (accessed on 1 December 2020).
  21. Hanushek, Eric A., Stephen J. Machin, and Ludger Woessmann, eds. 2011. Handbooks in Economics: Vol. 26. In Handbook of the Economics of Education, 1st ed. Amsterdam: North-Holland. [Google Scholar]
  22. Hu, Li-Tze, and Peter M. Bentler. 1999. Cutoff criteria for fit indexes in covariance structure analysis: Conventional criteria versus new alternatives. Structural Equation Modeling: A Multidisciplinary Journal 6: 1–55. [Google Scholar] [CrossRef]
  23. Jorgensen, Terrence. D., Sunthud Pornprasertmanit, Alexander M. Schoemann, and Yves Rosseel. 2019. Semtools: Useful Tools for Structural Equation Modeling. R Package Version 0.5-2. Available online: https://cran.r-project.org/package=semTools (accessed on 1 December 2020).
  24. Judd, Charles M., and David A. Kenny. 1981. Process Analysis. Evaluation Review 5: 602–19. [Google Scholar] [CrossRef]
  25. Korhonen, Johan, Karin Linnanmäki, and Pirjo Aunio. 2014. Learning difficulties, academic well-being and educational dropout: A person-centred approach. Learning and Individual Differences 31: 1–10. [Google Scholar] [CrossRef]
  26. Lekholm, Alli Klapp, and Christina Cliffordson. 2008. Discrepancies between school grades and test scores at individual and school level: Effects of gender and family background. Educational Research and Evaluation 14: 181–99. [Google Scholar] [CrossRef]
  27. MacKinnon, David P., Amanda J. Fairchild, and Matthew S. Fritz. 2007. Mediation analysis. Annual Review of Psychology 58: 593–614. [Google Scholar] [CrossRef]
  28. Marsh, Herbert W. 1986. Global self-esteem: Its relation to specific facets of self-concept and their importance. Journal of Personality and Social Psychology 51: 1224–36. [Google Scholar] [CrossRef]
  29. Marsh, Herbert W. 1990. A multidimensional, hierarchical model of self-concept: Theoretical and empirical justification. Educational Psychology Review 2: 77–172. [Google Scholar] [CrossRef]
  30. Marsh, Herbert W. 2014. Academic Self-Concept: Theory, Measurement, and Research. In Psychological Perspectives on the Self. Edited by Jerry Suls. Psychology Press: New York, vol. 4, pp. 59–98. [Google Scholar]
  31. Marsh, Herbert W., and Rhonda G. Craven. 2006. Reciprocal Effects of Self-Concept and Performance from a Multidimensional Perspective: Beyond Seductive Pleasure and Unidimensional Perspectives. Psychological Science: A Journal of the Association for Psychological Science 1: 133–63. [Google Scholar] [CrossRef]
  32. Marsh, Herbert W., and Andrew J. Martin. 2011. Academic self-concept and academic achievement: Relations and causal ordering. The British Journal of Educational Psychology 81: 59–77. [Google Scholar] [CrossRef]
  33. Möller, Jens, Lilian Streblow, and Britta Pohlmann. 2009. Achievement and self-concept of students with learning disabilities. Social Psychology of Education 12: 113–22. [Google Scholar] [CrossRef]
  34. Niepel, Christoph, Matthias Stadler, and Samuel Greiff. 2019. Seeing is believing: Gender diversity in STEM is related to mathematics self-concept. Journal of Educational Psychology 111: 1119–30. [Google Scholar] [CrossRef]
  35. Novita, Shally. 2016. Secondary symptoms of dyslexia: A comparison of self-esteem and anxiety profiles of children with and without dyslexia. European Journal of Special Needs Education 31: 279–88. [Google Scholar] [CrossRef]
  36. Olczyk, Melanie, Gisela Will, and Cornelia Kristen. 2014. Immigrants in the NEPS: Identifying Generation Status and Group of Origin (NEPS Working Papers No. 41a). Bamberg: Leibniz Institute for Educational Trajectories, National Educational Panel Study, Available online: https://www.neps-data.de/Portals/0/Working%20Papers/WP_XXXXIa.pdf (accessed on 1 December 2020).
  37. Poon, Kean. 2020. The impact of socioeconomic status on parental factors in promoting academic achievement in Chinese children. International Journal of Educational Development 75: 102175. [Google Scholar] [CrossRef]
  38. Pullmann, H., and J. Allik. 2008. Relations of academic and general self-esteem to school achievement. Personality and Individual Differences 45: 559–64. [Google Scholar] [CrossRef]
  39. Rambo-Hernandez, Karen E., and D. Betsy McCoach. 2014. High-Achieving and Average Students’ Reading Growth: Contrasting School and Summer Trajectories. The Journal of Educational Research 108: 112–29. [Google Scholar] [CrossRef]
  40. Robinson, Joseph P., and Sarah Theule Lubienski. 2011. The Development of Gender Achievement Gaps in Mathematics and Reading during Elementary and Middle School. American Educational Research Journal 48: 268–302. [Google Scholar] [CrossRef] [Green Version]
  41. Rogers, Maria, and Rosemary Tannock. 2018. Are Classrooms Meeting the Basic Psychological Needs of Children With ADHD Symptoms? A Self-Determination Theory Perspective. Journal of Attention Disorders 22: 1354–60. [Google Scholar] [CrossRef]
  42. Rosseel, Yves. 2012. lavaan: An R Package for Structural Equation Modeling. Journal of Statistical Software 48: 1–36. [Google Scholar] [CrossRef] [Green Version]
  43. Rubin, Donald B. 1987. Multiple imputation for nonresponse in surveys. In Wiley Series in Probability and Mathematical Statistics: Applied Probability and Statistics. New York: Wiley. [Google Scholar]
  44. Savolainen, Pirjo A., Anneke C. Timmermans, and Hannu K. Savolainen. 2018. Part-time special education predicts students’ reading self-concept development. Learning and Individual Differences 68: 85–95. [Google Scholar] [CrossRef]
  45. Schafer, Joseph L., and John W. Graham. 2002. Missing data: Our view of the state of the art. Psychological Methods 7: 147–77. [Google Scholar] [CrossRef]
  46. Schnittjer, Insa, and Cristoph Duchhardt. 2015. Mathematical Competence: Framework and Exemplary Test Items. Bamberg: University of Bamberg. [Google Scholar]
  47. Schwab, Susanne, Markus Gebhardt, Mathias Krammer, and Barbara Gasteiger-Klicpera. 2014. Linking self-rated social inclusion to social behaviour. An empirical study of students with and without special education needs in secondary schools. European Journal of Special Needs Education 30: 1–14. [Google Scholar] [CrossRef]
  48. Shavelson, Richard J., Judith J. Hubner, and George C. Stanton. 1976. Self-Concept: Validation of Construct Interpretations. Review of Educational Research 46: 407–41. [Google Scholar] [CrossRef]
  49. Sirin, Selcuk R. 2005. Socioeconomic Status and Academic Achievement: A Meta-Analytic Review of Research. Review of Educational Research 75: 417–53. [Google Scholar] [CrossRef] [Green Version]
  50. Strand, S. 2014. Ethnicity, gender, social class and achievement gaps at age 16: Intersectionality and ‘Getting it’ for the white working class. Research Papers in Education 29: 131–71. [Google Scholar] [CrossRef]
  51. Susperreguy, Maria Ines, Pamela E. Davis-Kean, Kathryn Duckworth, and Meichu Chen. 2018. Self-Concept Predicts Academic Achievement Across Levels of the Achievement Distribution: Domain Specificity for Math and Reading. Child Development 89: 2196–214. [Google Scholar] [CrossRef]
  52. Tomaszewski, Wotjek, Ning Xiang, and Mark Western. 2020. Student engagement as a mediator of the effects of socio-economic status on academic performance among secondary school students in Australia. British Educational Research Journal 43. [Google Scholar] [CrossRef]
  53. Valentine, Jeffrey C., and David L. DuBois. 2005. Effects of self-beliefs on academic achievement and vice-versa: Separating the chicken from the egg. In International Advances in Self Research: v.2. New Frontiers for Self Research. Edited by Herbert W. Marsh, Rhonda Craven and Dennis M. McInerney. Greenwich: Information Age Pub, pp. 53–78. [Google Scholar]
  54. Valentine, Jeffrey C., Dennis L. DuBois, and Harris Cooper. 2004. The Relation between Self-Beliefs and Academic Achievement: A Meta-Analytic Review. Educational Psychologist 39: 111–33. [Google Scholar] [CrossRef]
  55. Van Buuren, Stef. 2018. Flexible Imputation of Missing Data, 2nd ed. Interdisciplinary Statistics Series; Boca Raton: Chapman & Hall/CRC. [Google Scholar]
  56. Van Buuren, Stef, and Karin Groothuis-Oudshoorn. 2011. Mice: Multivariate Imputation by Chained Equations in R. Journal of Statistical Software 45: 1–67. [Google Scholar] [CrossRef] [Green Version]
  57. Wen, Zhonglin, and Xitao Fan. 2015. Monotonicity of effect sizes: Questioning kappa-squared as mediation effect size measure. Psychological Methods 20: 193–203. [Google Scholar] [CrossRef]
  58. White, Sammis B., Peter D. Reynolds, M. Marc Thomas, and Nance J. Gitzlaff. 1993. Socioeconomic Status and Achievement Revisited. Urban Education 28: 328–43. [Google Scholar] [CrossRef]
Figure 1. Simplified Partial Mediation Model. This figure depicts a partial mediation model where A and C are directly related, but the effect is also partially mediated by B.
Socsci 10 00011 g001
Figure 2. Partial Mediation Model with Multiple Predictors, Mediators and Outcomes. This figure demonstrates a more complex partial mediation model with multiple predictors, mediators, and outcomes. Additionally, both predictors covary with each other, as do both mediators and both outcomes.
Socsci 10 00011 g002
Figure 3. Mediation Model—Math. This figure describes all pathways used in the mediation model. The no mediation model was calculated by zeroing out regressions from and onto the mediators. Solid lines indicate significant paths, and dashed lines indicate non-significant paths. G5 WLE, G7 WLE, and G9 WLE refer to grade 5, 7, and 9 weighted likelihood estimates (WLE), respectively. I refers to intercept. S refers to slope. M. Self-Concept refers to math self-concept. G. Self-Esteem refers to global self-esteem. SES refers to socioeconomic status. SEN refers to special education needs. Reas. refers to nonverbal reasoning scores.
Socsci 10 00011 g003
Figure 4. Mediation Model—Reading. This figure describes all pathways used in the mediation model. The no mediation model was calculated by zeroing out regressions from and onto the mediators. Solid lines indicate significant path, and dashed lines indicate non-significant paths. G5 WLE, G7 WLE, and G9 WLE refer to grade 5, 7, and 9 weighted likelihood estimates (WLE), respectively. I refers to intercept. S refers to slope. R. Self-concept refers to readings self-concept. G. Self-Esteem refers to global self-esteem. SES refers to socioeconomic status. SEN refers to special education needs. Reas. refers to nonverbal reasoning scores.
Socsci 10 00011 g004
Table 1. Modelled variables and their characteristics in the imputed data.
NEPS IDM or %SD
Predictors
Femalet70003148.08%n.a.
Reasoning Scoredgg5_sc3b6.872.63
Upper School Track t723080_g141.77%n.a.
Special Education Needstx80505_D3.83%n.a.
Socioeconomic Status
Deskt34006a96.52%n.a.
Softwaret34006c68.25%n.a.
Bookst34006g84.20%n.a.
Dictionaryt34006h92.83%n.a.
Mediators
Math Self-Conceptt66001a_g12.920.85
Reading Self-Conceptt66000a_g12.990.66
Global Self-Esteemt66003a_g139.366.71
Competences
Grade 5 Mathmag5_sc1u−0.011.17
Grade 7 Mathmag7_sc1u0.751.24
Grade 9 Mathmag9_sc1u1.501.19
Grade 5 Readingreg5_sc1u−0.031.27
Grade 7 Reading reg7_sc1u0.721.37
Grade 9 Readingreg9_sc1u1.251.12
Note: NEPS ID refers to the label provided by the National Education Panel Study.
Table 2. Exploratory factor analysis results for home possessions and SES (oblique quartimax rotation).
Factor 1Factor 2Factor 3
Desk 0.569
Room0.867
Software 0.454
Classics 0.900
Poems 0.726
Art
Books 0.793
Dictionary 0.674
Note: All loadings under 0.4 are suppressed. Art had no loadings above this threshold.
Table 3. Model fits.
χ2dfp-ValueRMSEA90% CI RMSEACFISRMR
Math Models
No mediation588.051 0.0440.041–0.0480.9730.076
Mediation123.137<0.0010.0210.010–0.0250.9960.010
Reading Models
No mediation379.951 0.0350.032–0.0380.9820.067
Mediation126.137<0.0010.0210.017–0.0250.9950.012
Note: Models were fit with ML (maximum likelihood) estimation. df refers to degrees of freedom, RMSEA refers to root-mean square error of approximation, 90% CI RMSEA is the 90% confidence interval for the RMSEA, CFI refers to the comparative fit index, and SRMR refers to the standardized root mean square residual. The p-value is derived by comparing the respective no mediation and mediation models.
Table 4. Path coefficients—no mediation models.
Math ModelReading Model
Coefficient (SE)Standardized ValueCoefficient (SE)Standardized Value
Intercept with slope−0.015 (0.008) *−0.190−0.063 (0.012) ***−0.427
Regression on intercept
SEN−0.330 (0.072) ***−0.065−0.393 (0.078) ***−0.074
Female−0.292 (0.031) ***−0.1400.206 (0.063) **0.095
Reasoning0.187 (0.010) ***0.4690.160 (0.010) ***0.385
Upper track School0.884 (0.099) ***0.4220.793 (0.103) ***0.362
SES−0.052 (0.071)−0.025−0.007 (0.088)−0.003
Regression on slope
SEN−0.013 (0.016)−0.0230.001 (0.017)0.001
Female−0.001 (0.008)−0.0030.001 (0.013)0.003
Reasoning−0.005 (0.002) **−0.120−0.010 (0.002) ***−0.144
Upper track School0.021 (0.020)0.091−0.026 (0.024)−0.071
SES−0.007 (0.018)−0.0310.011 (0.023)0.030
Note: SEN refers to special education needs. SES refers to socioeconomic status. Standardized values reflect standardization of both latent and observed variables. * p < 0.05, ** p < 0.01, *** p < 0.001.
Table 5. Path coefficients—mediation models.
MathReading
Coefficient (SE)Standardized ValueCoefficient (SE)Standardized Value
Intercept with slope−0.014 (0.007)−0.187−0.058 (0.011) ***−0.412
Regression on intercept
SEN−0.324 (0.078) ***−0.064−0.336 (0.082) ***−0.063
Female−0.212 (0.031) ***−0.1020.170 (0.060) ***0.078
Reasoning0.176 (0.009) ***0.4430.157 (0.008) ***0.378
Upper track School0.828 (0.097) ***0.3960.694 (0.099) ***0.317
SES−0.027 (0.071)−0.0130.025 (0.086)0.012
Subject self-concept0.179 (0.016) ***0.1730.254 (0.028) ***0.154
Self-esteem0.077 (0.027) **0.0500.111 (0.034) **0.069
Regression on slope
SEN−0.015 (0.016)−0.028−0.006 (0.017)−0.006
Female0.003 (0.008)0.0130.003 (0.012)0.01
Reasoning−0.006 (0.002) *−0.131−0.010 (0.002) ***−0.140
Upper track School0.022 (0.020)0.097−0.016 (0.024)−0.045
SES−0.007 (0.018)−0.0320.007 (0.023)0.021
Subject self-concept0.008 (0.005)0.059−0.017 (0.008) *−0.063
Self-esteem−0.008 (0.006)−0.050−0.019 (0.007) *−0.071
Regression on subject self-concept
SEN0.067 (0.084)0.016−0.128 (0.043) **−0.040
Female−0.444 (0.026) ***−0.2600.145 (0.024) ***0.110
Reasoning0.054 (0.054) ***0.1670.006 (0.009)0.022
Upper track School0.198 (0.089) *0.1150.272 (0.066) ***0.205
SES−0.100 (0.076)−0.059−0.085 (0.056)−0.066
Regression on self-esteem
SEN−0.221 (0.044) ***−0.067−0.221 (0.044) ***−0.067
Female0.000 (0.027)0.0000.000 (0.028)0.000
Reasoning0.016 (0.006) *0.0610.016 (0.007) *0.061
Upper track School0.272 (0.064) ***0.2010.272 (0.065) ***0.201
SES−0.093 (0.060)−0.071−0.093 (0.061)−0.071
Note: SEN refers to special education needs. SES refers to socioeconomic status. Standardized values reflect standardization of both latent and observed variables. Gender was coded with 0 for boys and 1 for girls. * p < 0.05, ** p < 0.01, *** p < 0.001; math models, p < 0.001 and p < 0.05, respectively, but none of the other predictor variables relate to the slope, all ps > 0.05.
Table 6. Direct and indirect mediation.
MathReading
DRIR of SCIR of SEDRIR of SCIR of SE
Intercept
SEN0.985n.s.0.0520.8510.0830.062
Gender0.7290.321n.s.0.8210.178n.s.
Reasoning0.9450.0620.0070.982n.s.0.011
School Track0.9380.0470.0240.8760.0870.038
SESn.s.n.s.n.s.n.s.n.s.n.s.
Slope
SENn.s.n.s.n.s.n.s.n.s.n.s.
Gendern.s.n.s.n.s.n.s.n.s.n.s.
Reasoning1.092−0.241−0.0250.972−0.065−0.029
School Trackn.s.n.s.n.s.n.s.n.s.n.s.
SESn.s.n.s.n.s.n.s.n.s.n.s.
Note: n.s. refers to calculations involving non-significant path values, which are excluded here for ease of interpretation. DR refers to the ratio of the direct effect in the mediation model over the direct effect in the non-mediation model. IR refers to the product of the regression pathway of the predictor on the mediator, and the mediator onto the outcome over the direct effect in the non-mediation model (see Formulae (1) and (2)). SC refers to subject-specific self-concept and SE refers to general self-esteem. All values are standardized.
Publisher’s Note: MDPI stays neutral with regard to jurisdictional claims in published maps and institutional affiliations.

