Improvements in Evaluating Grids for Basic Living Infrastructure: The Case of Gwangjin District in Seoul, South Korea


1
Korea Research Institute for Human Settlements, 5 Gukchaegyeonguwon-ro, Sejong-si 30149, Korea
2
School of Family and Consumer Sciences, Texas State University, San Marcos, TX 78666, USA
3
Department of Consumer Sciences, South Dakota State University, Brookings, SD 57006, USA
*
Author to whom correspondence should be addressed.
Soc. Sci. 2021, 10(1), 26; https://0-doi-org.brum.beds.ac.uk/10.3390/socsci10010026
Submission received: 14 December 2020
/
Revised: 6 January 2021
/
Accepted: 12 January 2021
/
Published: 15 January 2021
(This article belongs to the Section Community and Urban Sociology)
Abstract
:The purpose of this study was to analyze the current status and needs of infrastructure for basic life in Gwangjin district in Seoul, South Korea. In this study, we examined whether the national minimum standard was satisfied in terms of the infrastructure for basic life in the district. Specifically, we employed and compared the empirical utilities of two types of geographic datasets, 100-square-meter grids and 500-square-meter grids. The study compares the prediction accuracy between two types of geographic datasets by employing multivariate linear estimation using influential factors. The evaluation methods for prediction accuracy were to compare the root mean of squared error (RMSE) and mean of absolute error (MAE) from each dataset. The results were as follows: (a) the dataset with 100-square-meter grids showed more significant associations among influential factors and the infrastructure than the dataset with 500-square-meter grids; (b) the 100-square-meter grids showed better prediction accuracy compared with the 500-square-meter grids; and (c) in terms of basic level local government, it was more powerful to use the datasets with 100-square-meter grids for finding blind sides of infrastructure than the datasets with 500-square-meter grids. The results imply that it is necessary to adjust urban policy by using appropriate datasets, such as 100-square-meter grids.
1. Introduction
1.1. Social Infrastructre
Researchers have broadly classified basic living infrastructures into two categories: physical infrastructure and social infrastructure (Dash and Sahoo 2010; Kumari and Sharma 2017). Although this distinction is neither collectively exhaustive nor mutually exclusive, it helps to illustrate the functional characteristics of social overhead capital (Uzawa 1999).
Physical infrastructure refers to the physical components of a system that sustain the living conditions of society (Kumari and Sharma 2017). Physical infrastructure can be improved by economic factors, such as reducing production costs and increasing labor productivity (Kumari and Sharma 2017). Thus, physical infrastructure is a significant predictor of economic development (Dash and Sahoo 2010; Kumari and Sharma 2017).
Social infrastructure, on the other hand, helps to foster the efficiency of human power (Kumari and Sharma 2017). Klinenberg (2019) explained social infrastructure as the physical conditions determining social capital development. He proposed that a robust social infrastructure supports healthy social interactions in which people forge social bonds. While physical infrastructure directly contributes to economic growth (Dash and Sahoo 2010; Kumari and Sharma 2017), social infrastructure supports the well-being and sustainability of the community (Casey 2005; Klinenberg 2019).
Infrastructure Australia, an independent statutory organization providing advice to the Australian government, defines social infrastructure as a composite system of the facilities, spaces, services, and networks that assist the quality of life and well-being (Infrastructure Australia 2019). The organization pointed out that social infrastructure enables public access to high-quality and affordable social services, thereby enhancing social safety, health, and well-being. Latham and Layton (2019) viewed social infrastructure as including public dimensions of urban life.
They counted any facilities that support public life as social infrastructure. The facilities included public institutions (e.g., libraries, schools, and playgrounds), community organizations (e.g., churches and civic associations), and commercial establishments (Klinenberg 2019; Latham and Layton 2019). The social and public functioning of infrastructure promotes better utilization of physical infrastructure by inducing a higher level of literacy, improved skills, and better health of the community members (Dash and Sahoo 2010). Thus, establishing standards of social infrastructure is critical in building and maintaining societal sustainability (Casey 2005).
The previous studies indicated that the scope of basic living infrastructure is conceptually compatible with social infrastructure. Therefore, this study considers basic living infrastructure as social infrastructure.
1.2. Issues in Measuring Social Infrastructure
The past and present Korean government has increased the annual budget to implement policies centered on quality of life and inclusion (Ministry of Health and Welfare 2018). The change of government’s budget was considered as a policy for resolving the housing shortage. The urban population concentration led to a drastic growth in housing demands. To solve the problem of the housing shortage, the Ministry of Land, Infrastructure, and Transport (MOLIT) adopted apartment development. Apartments currently account for approximately 40% of the total number of housing across the country, and they occupy 60% of the housing in Seoul (MOLIT 2018). Although a law regarding apartment management1 indicates that apartments (i.e., multi-family housing that is different from detached housing) should include affiliated facilities per household, those who resided in multi-household house were sill insufficiently provided with services from basic living infrastructure facilities.
A Social Overhead Capital (SOC) indicates essential infrastructure for daily lives, such as eating, sleeping, caring children, supporting the elderly, working, and resting (Casey 2005; Latham and Layton 2019; Uzawa 1999). The term SOC is a broad concept that includes safety and basic infrastructure facilities that are the basic premise of civilians’ daily lives. In addition, this standard is a boundary line for supplying universal social services, which are applicable for all citizens, regardless of where they live.
The Korean government recently adopted the concept of Time Distance in their policy regarding SOCs, which indicates that the distance between infrastructure facilities should be considered for the citizens’ lives (Park 2018). In other words, the concept secured the citizens’ minimum standard of basic living infrastructure, such as cultural and physical training facilities, childcare facilities, and facilities for older adults.
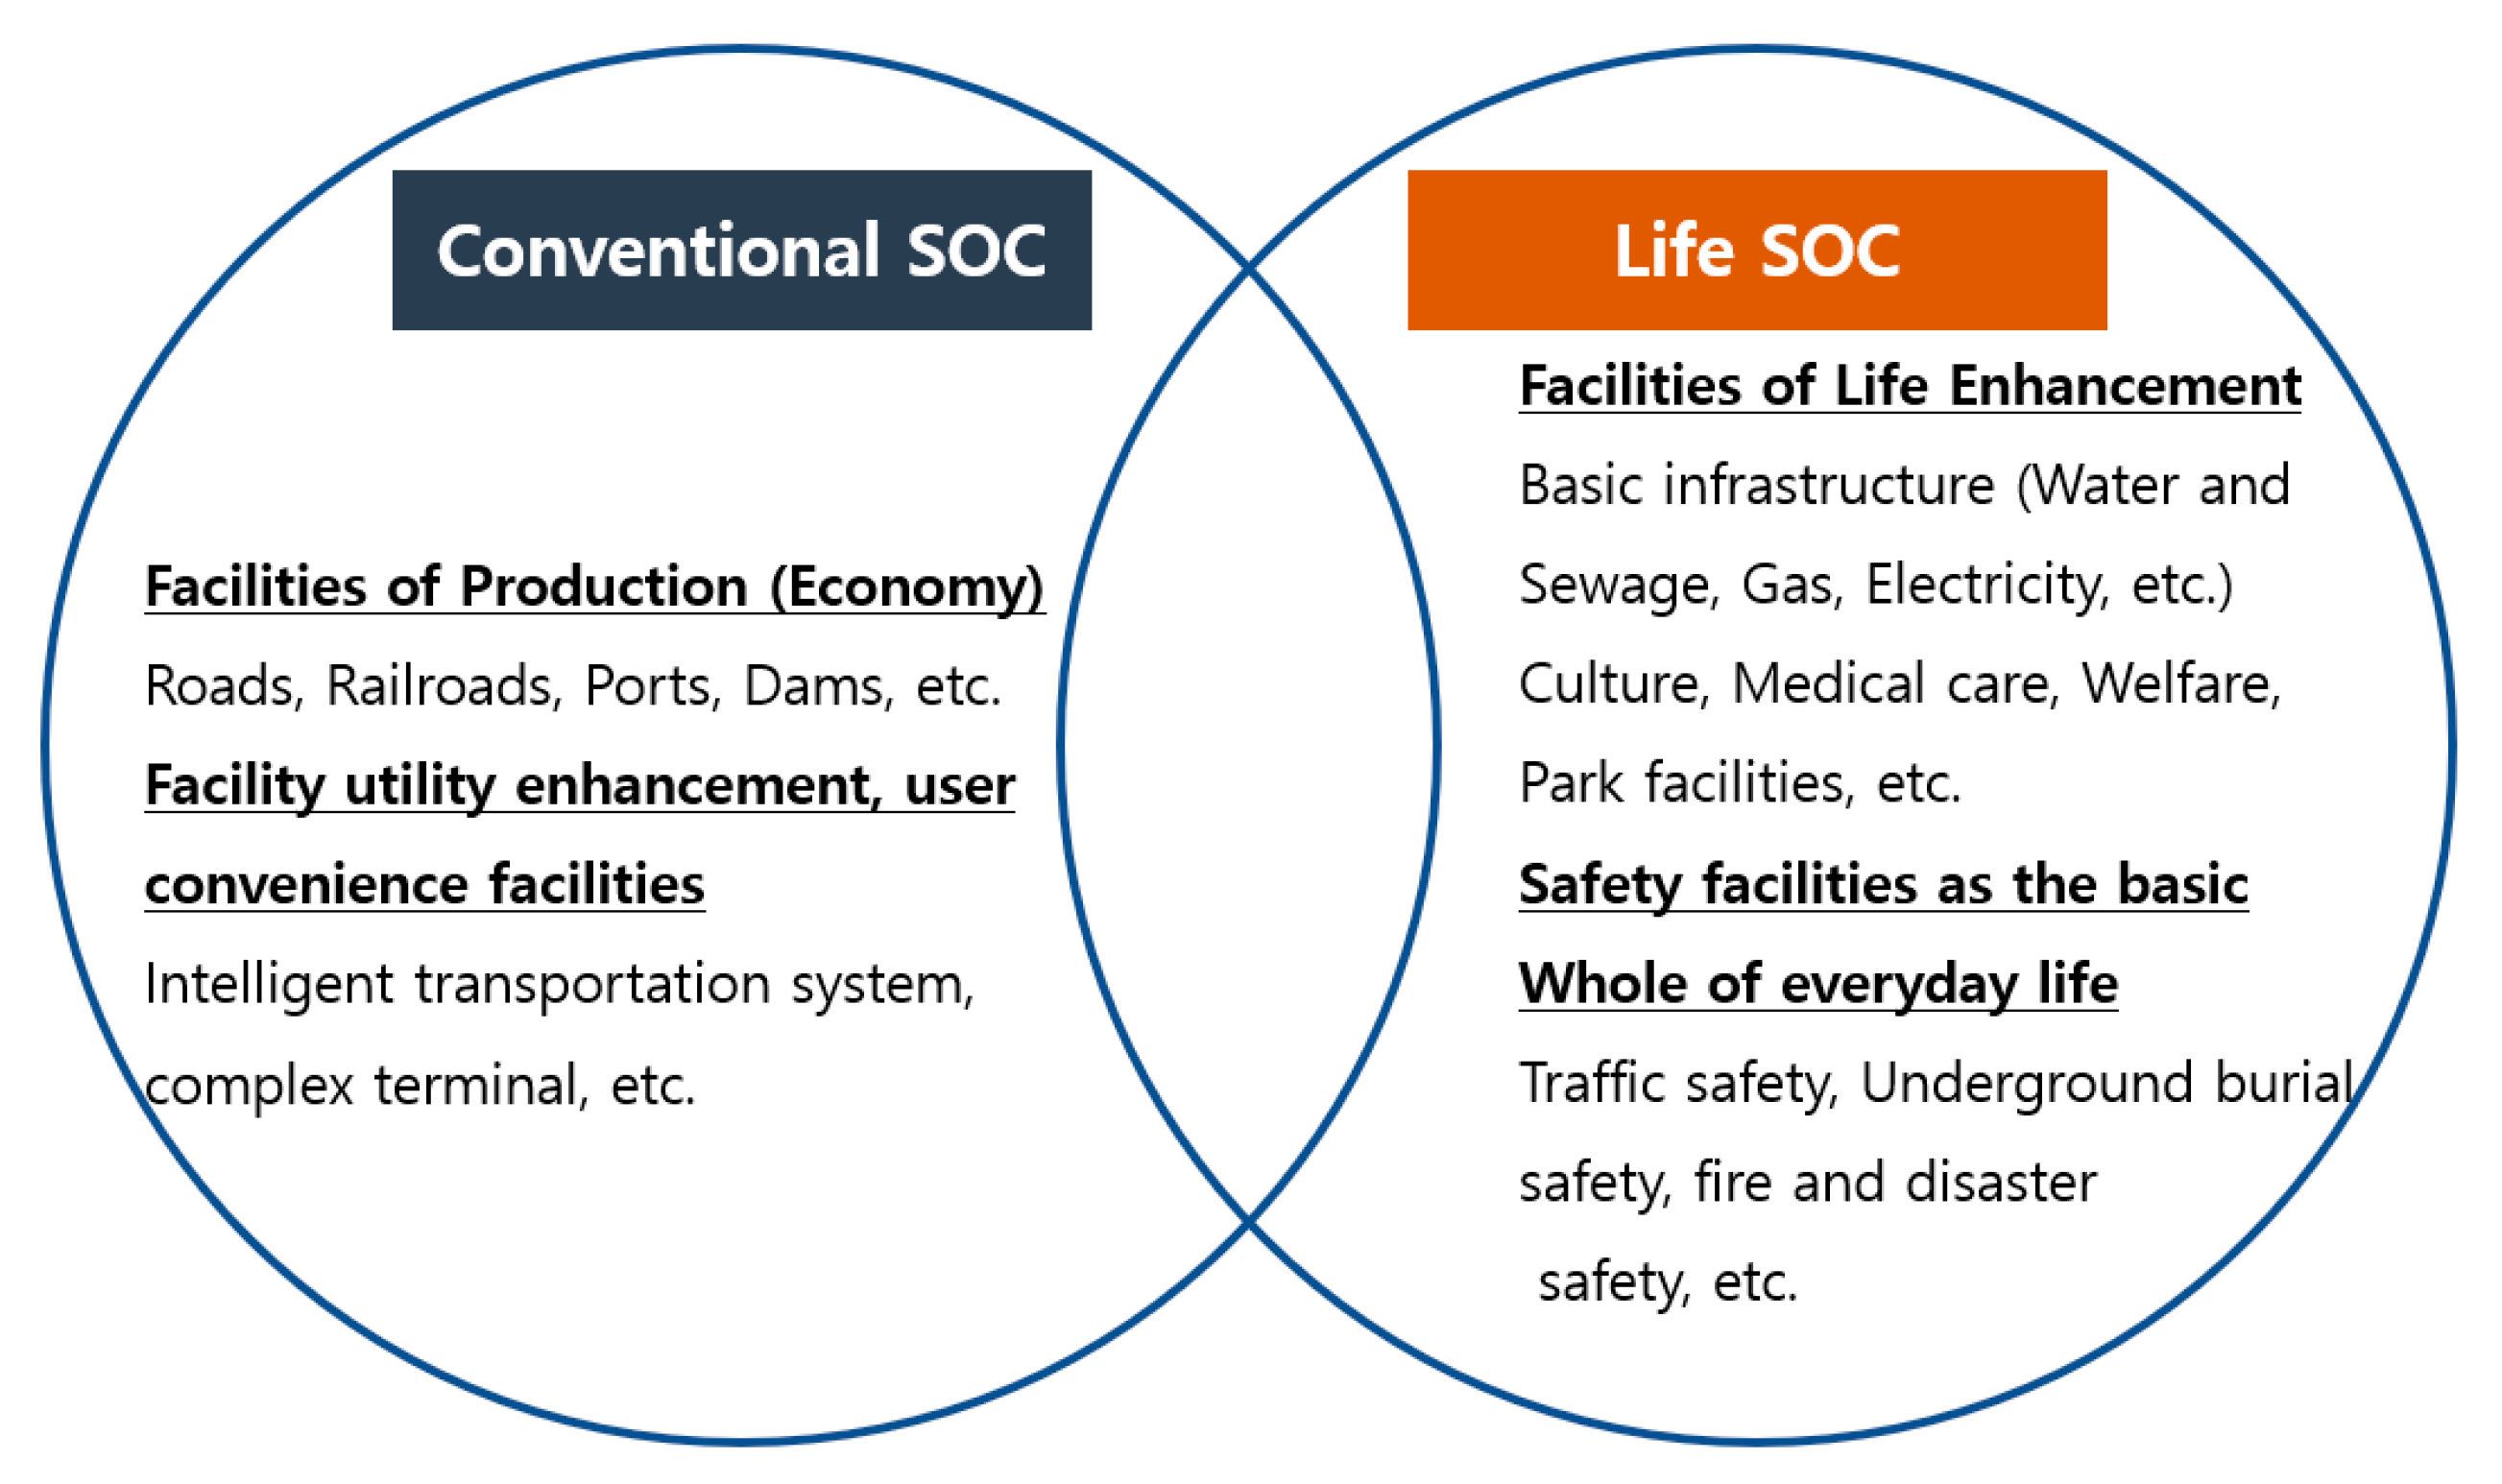
Figure 1 demonstrates the categorization of SOC facilities specified by the Act on Public-Private Partnerships in Infrastructure (2018). As shown in Figure 1, conventional SOCs include economic facilities (e.g., roads, railroads, ports, and dams) and convenience facilities (e.g., systems for convenience transportation and complex terminals). On the other hand, the SOCs related to daily life include facilities for enhancing life (e.g., basic infrastructure, cultural facilities, physical education, childcare, medical care, and parks) and facilities for securing safety (e.g., traffic systems, underground systems, and anti-disaster systems).
To provide basic living infrastructure through Urban Regeneration Projects (URP), it is necessary to identify to what extent basic living infrastructure is currently served in a site area and how much it can be provided in the future (Oh 2017). The National Urban Regeneration Basic Policy was initiated in 2013 (Urban Regeneration Information System 2013); however, there was a lack of further discussion on setting up reasonable standards regarding regional properties aligned with the scope of basic living infrastructure.
The national minimum standard of basic living infrastructure has been insufficiently discussed. For example, the investigations on the status of basic living infrastructure thus far tended to rely on each administrative district or local government. However, the research done by administrative districts may not produce accurate information because local governments could have different capabilities in performing the task. The local-oriented analyses may not fully reflect the actual phenomenon as a whole. Therefore, an alternative approach is necessary. The national government should analyze the current situation of infrastructure using big data and distribute the regionalized information to the local governments where the service needs to be improved (Korea Research Institute for Human Settlements 2018).
Due to the insufficient discussions and actions after the policy building, the management of the minimum level of SOCs should be reconsidered from the foundational stage. For instance, the method to evaluate the minimum standard should be reconsidered as there are several options to measure the Time Distance to citizens from SOC facilities. Based on the needs of the foundational stage of evaluation, this study analyzed the minimum standard and satisfaction level of basic living infrastructure using two types of evaluating grids (i.e., 100-square-meter grids and 500-square-meter grids).
The hypothesis of the study was that the smaller grid (i.e., the 100-square-meter grid) is better for measurements to understand the SOC grades when compared with the larger grid (i.e., the 500-square-meter grid). Therefore, the research question was is to investigate whether the smaller grid performed better at estimation and better predicted the SOC grades compared with the larger grid. The results suggested the 100-square-meter grid was the best measuring method for government entities to manage basic living structures in South Korea. Specifically, the findings may be beneficial to governmental professionals because the current measuring method is to use the larger grid. To achieve the study’s purpose, a specific district (i.e., Gwangjin district in Seoul, South Korea) was selected as analyzed area.
We present our study as follows: In Section 2. Literature Review, we provide the background of basic infrastructure and the research literature in South Korea; in Section 3. Methodology, we introduce the constructs of the variables and the main analytic methods in this study; in Section 4. Results, we show the main findings from the analysis; and in Section 5. Conclusions, we expand on the meaning of the findings regarding how to improve the measuring method for understanding SOCs in South Korea.
2. Literature Review
Discussions about the standards of basic living infrastructure have been had recently. N.G. Cho (2013) raised the need to build infrastructure differentiated from past infrastructure policies that were built based on the absolute needs of people’s lives. Specifically, by using descriptive comparison across major cities’ datasets in South Korea, Cho analyzed the level of supply of living infrastructure, such as cultural facilities, park facilities, educational facilities, sports facilities, and medical and health facilities across the country and indicated that there exist gaps both between cities and within cities.
In addition, P.G. Cho (2013) reviewed the laws and regulations related to urban regeneration in the station area. As a result, Cho argued that the infrastructure to be created in the future should be based on safer, more efficient, and reasonable investments and that the people’s lives should be developed in a way that makes their lives more enjoyable and comfortable.
The Korea Research Institute for Human Settlements (2014) reviewed 84 related statutes and the level of Organization for Economic Co-operation and Development (OECD) member countries in its study for the establishment of a basic policy for national urban regeneration. They presented seven sectors and 28 facilities as basic living infrastructure and set the minimum standards for them. Therefore, considering the prior studies, the standard of basic living infrastructure needs to provide conditions for supplying living infrastructure and to present plans for supplying basic living infrastructure by activating the participation of various entities.
Sung et al. (2013) analyzed the characteristics of the supply of basic living infrastructure in a maintenance project release zone based on accessibility and the changes in the level of basic living infrastructure in the areas where the maintenance project has been completed. As a result of the research, they found that the effect of accessibility improvement was limited depending on the characteristics of each facility in the supply of basic living infrastructure through maintenance after demolition. Cho and Lee (2014) attempted to establish the scope and requirements of living infrastructure by conducting Analytic Hierarchy Process (AHP) analysis targeting experts, and they argued that, by sector, childcare, parks, transportation, medical services, welfare, culture, sports, administration, water and sewerage, disaster prevention, consumption benefits, distribution, and supply were important (in that order of priority).
Thus, most of the recent studies have been attempts to set policy directions or to set a scope for the supply of living infrastructure. However, there are disadvantages in that the unit of analysis was not sophisticated, even in the case of studies that performed empirical analysis. After the enactment of the Special Act on Urban Regeneration, this study is different from the existing research in that we closely analyzed the minimum standard for basic living infrastructure (Korea Research Institute for Human Settlements 2018), which was proposed by the Life SOC Promotion Team of the Office for Government Policy Coordination, and we also examined the feasibility of the minimum standard.
3. Methodology
3.1. Subjects of the Research
As shown in Table 1, basic living infrastructure is divided into the village (walking) and local strategic point (vehicle) infrastructure. The village is divided into eight public facilities: education (kindergarten and elementary school), learning (library), day care (daycare center and welfare), medical (basic medical), sport (life physical training), rest (neighborhood parks), convenience (convenient facility and retail store), and transportation (village parking lots). The local strategic point is presented as a total of six facilities: learning (public library), day care (welfare), medical (health center and emergency medical), culture (cultural facility), sport (sport facility), and rest (neighborhood park).
In this study, 15 dongs2 in Gwangjin district were analyzed using the Euclidean Distance method by dividing the level of the national minimum standard on basic living infrastructure into the village (walking) areas and local strategic point (vehicle) as suggested in Table 1 by the SOC Promotion Group of the Office for Government Policy Coordination (Architecture and Urban Research Institute 2019). The level of meeting the minimum standards was reviewed by comparing the number of necessary infrastructures calculated according to the minimum standards for basic living infrastructure applied in Gwangjin district and the number of infrastructures for each item currently installed in living areas. The location of the basic living infrastructure facilities and the population attributes used the open source provided by the Geospatial Information Platform of the National Geographic Information Institute.
Overall, the detached housing rate was 35.12%, and apartment housing was at 44.78% (See Table 2). Among the 25 administrative districts in Seoul, Nowon district showed the highest apartment housing rate, which accounted for 80.36% of the entire housing types. In Gwangjin district, detached housing rate was at 58.10%, which indicates that Gwangjin residents are likely to live in an area with poor infrastructure3.
Through comparative analysis of the population grid and the 100 m × 100 m grid, we intended to derive policy implications by analyzing service blind spots according to the city characteristics. As shown in Table 3, the results were derived through the standardization process between data by matching the population grid. The sum of variables was standardized to analyze the matching process and the regression analysis between the 500-square-meter grid (500 × 500, hereafter) and 100-square-meter grid (100 × 100) basic living infrastructure facilities.
3.2. Dependent Variable: Grades of SOCs
The measurement method is as follows. Based on the average length of time needed for a person to reach the facilities (3 km per hour), the closer facilities were first grade, and the further facilities had a higher number of grades at 100 × 100 grids (Korea Research Institute for Human Settlements 2019). At 500 × 500, children-related facilities were rated from 0 to 5 points. This was summed up, divided by the population, and graded (equation), and thereby a lower value indicates a lower SOC environment. As the measuring institutions of 100 × 100 and 500 × 500 are different from each other, the scale was different, and thus, to compare and analyze these different scales, the same concepts of SOCs were summed and standardized, and these standardized scores were compared.
3.3. Descriptive Information of the Area
As shown in Table 4, the total population of Gwangjin district was 357,466 as of 2018, of which 48.9% was male. Looking at the land use ratio in Gwangjin district, the green area ratio was 30.9%, the residential area ratio was 68.0%, and the commercial area ratio was 0.19%. Private lands were 70.8% based on the status of each owner. The land price was 29.2%. At 100 × 100, the rate of green area was 3.61%, residential area ratio was 94.25%, commercial area ratio was 1.74%, private property ratio was 70.54%, and land price was 29.06%. At 500 × 500, green area ratio was 3.82%, residential area ratio was 94.17%, commercial area ratio was 1.56%, private property ratio was 70.70%, and land price was 28.85%.
3.4. Analysis Method
In this study, the analysis was conducted focusing on the basic living infrastructure facilities of education, learning, caring, sports, and recreation that can be analyzed by walking distance among basic living infrastructure facilities. For each analysis, regression analysis was conducted for a 100 × 100 grid and 500 × 500 grid. This is because, when different data are used, the regression analysis results can be compared with each other to determine the more suitable data among the two datasets. To compare the estimated regression analysis results using each dataset, the Root Mean of Squared Error (RMSE) and (Mean of Absolute Error (MAE) were calculated.
Stata 15 was used for regression analysis, and the basic data was calculated as results using open data provided by the Ministry of Land, Infrastructure, and Transport and the City of Seoul. The analysis model for the standardized SOC grade (Y) regression analysis is as follows in Equation (1).
where K is a constant; X1 denotes the population; X2 indicates the female ratio; X3 is the green area ratio; X4 is the housing rate; X5 is the commerce area rate; X6 denotes the private property rate; X7 is the weighted average land price; and e is the error term.
The above regression analysis model was applied equally to 100 × 100 and 500 × 500 for analysis. Each of the coefficients analyzed (B1001, B1002, …, B5001, B5002, …) can be obtained by applying the next level grade equation to the predicted and standardized SOC grade (Y’).
With regression analysis, the study derived and compared excellent models of the two population grids by measuring the grade predictability through RMSE and MAE (See Equations (2) and (3)). In addition, by analyzing the two population grids through the R2 and coefficient, we determined the model suitability and significance of each variable.
x: data, m: number of samples, h: hypothesis
where x indicates the data utilized in the analysis; m is th4 number of samples; and h denotes the hypothesis.
4. Results
Table 5 shows the results of the SOC model regression results. First, in terms of the Education SOC model, the 100 × 100 population grid was able to explain the rise or fall of grades by population, green rate, residential land rate, commercial land rate, and weighted average land price. As the commercial ratio increased by 1%, the 3.74 grade changed lower. The 500 × 500 population grid was able to explain the rise or fall of grades by the ratio of females and commerce. As the commercial ratio increased by 1%, the 4.67 grade changed lower. It was, thus, possible to explain the relationship and model in which the grade changed according to the significance of each variable with the B value of the education SOC part.
Second, in the case of the Learning SOC model, the 100 × 100 population grid was able to explain the rise or fall of grades according to the ratio of green space, residential land, and commercial land. As the residential area ratio increased by 1%, the 3.58 grade also increased. The 500 × 500 population grid was only explained by one variable of the private ownership ratio. If the private ownership ratio increased by 1%, the grade was 0.97 lower.
Third, in terms of the Care SOC models, the 100 × 100 population grid was able to explain the rise or fall of grades by the population, female ratio, and average land price. As the proportion of females increased by 1%, the grade increased by 1.08. There were not any significant variables associated with the Care SOCs in the 500 × 500 population grid.
Fourth, within the Sports SOC models, the 100 × 100 population grid was able to explain the rise or fall of grades by population, residential area, commercial land rate, and average land price. As the residential area ratio increased by 1%, the grade increased by 1.75. The 500 × 500 population grid was explained only by one variable with the average land value.
Fifth, in the case of the Rest SOC models, the 100 × 100 population grid was able to explain the rise or fall of grades by the housing rate, private land rate, and average land price. As the residential area ratio increased by 1%, the grade increased by 1.93. There were not any significant variables associated with the Rest SOCs in the 500 × 500 population grid.
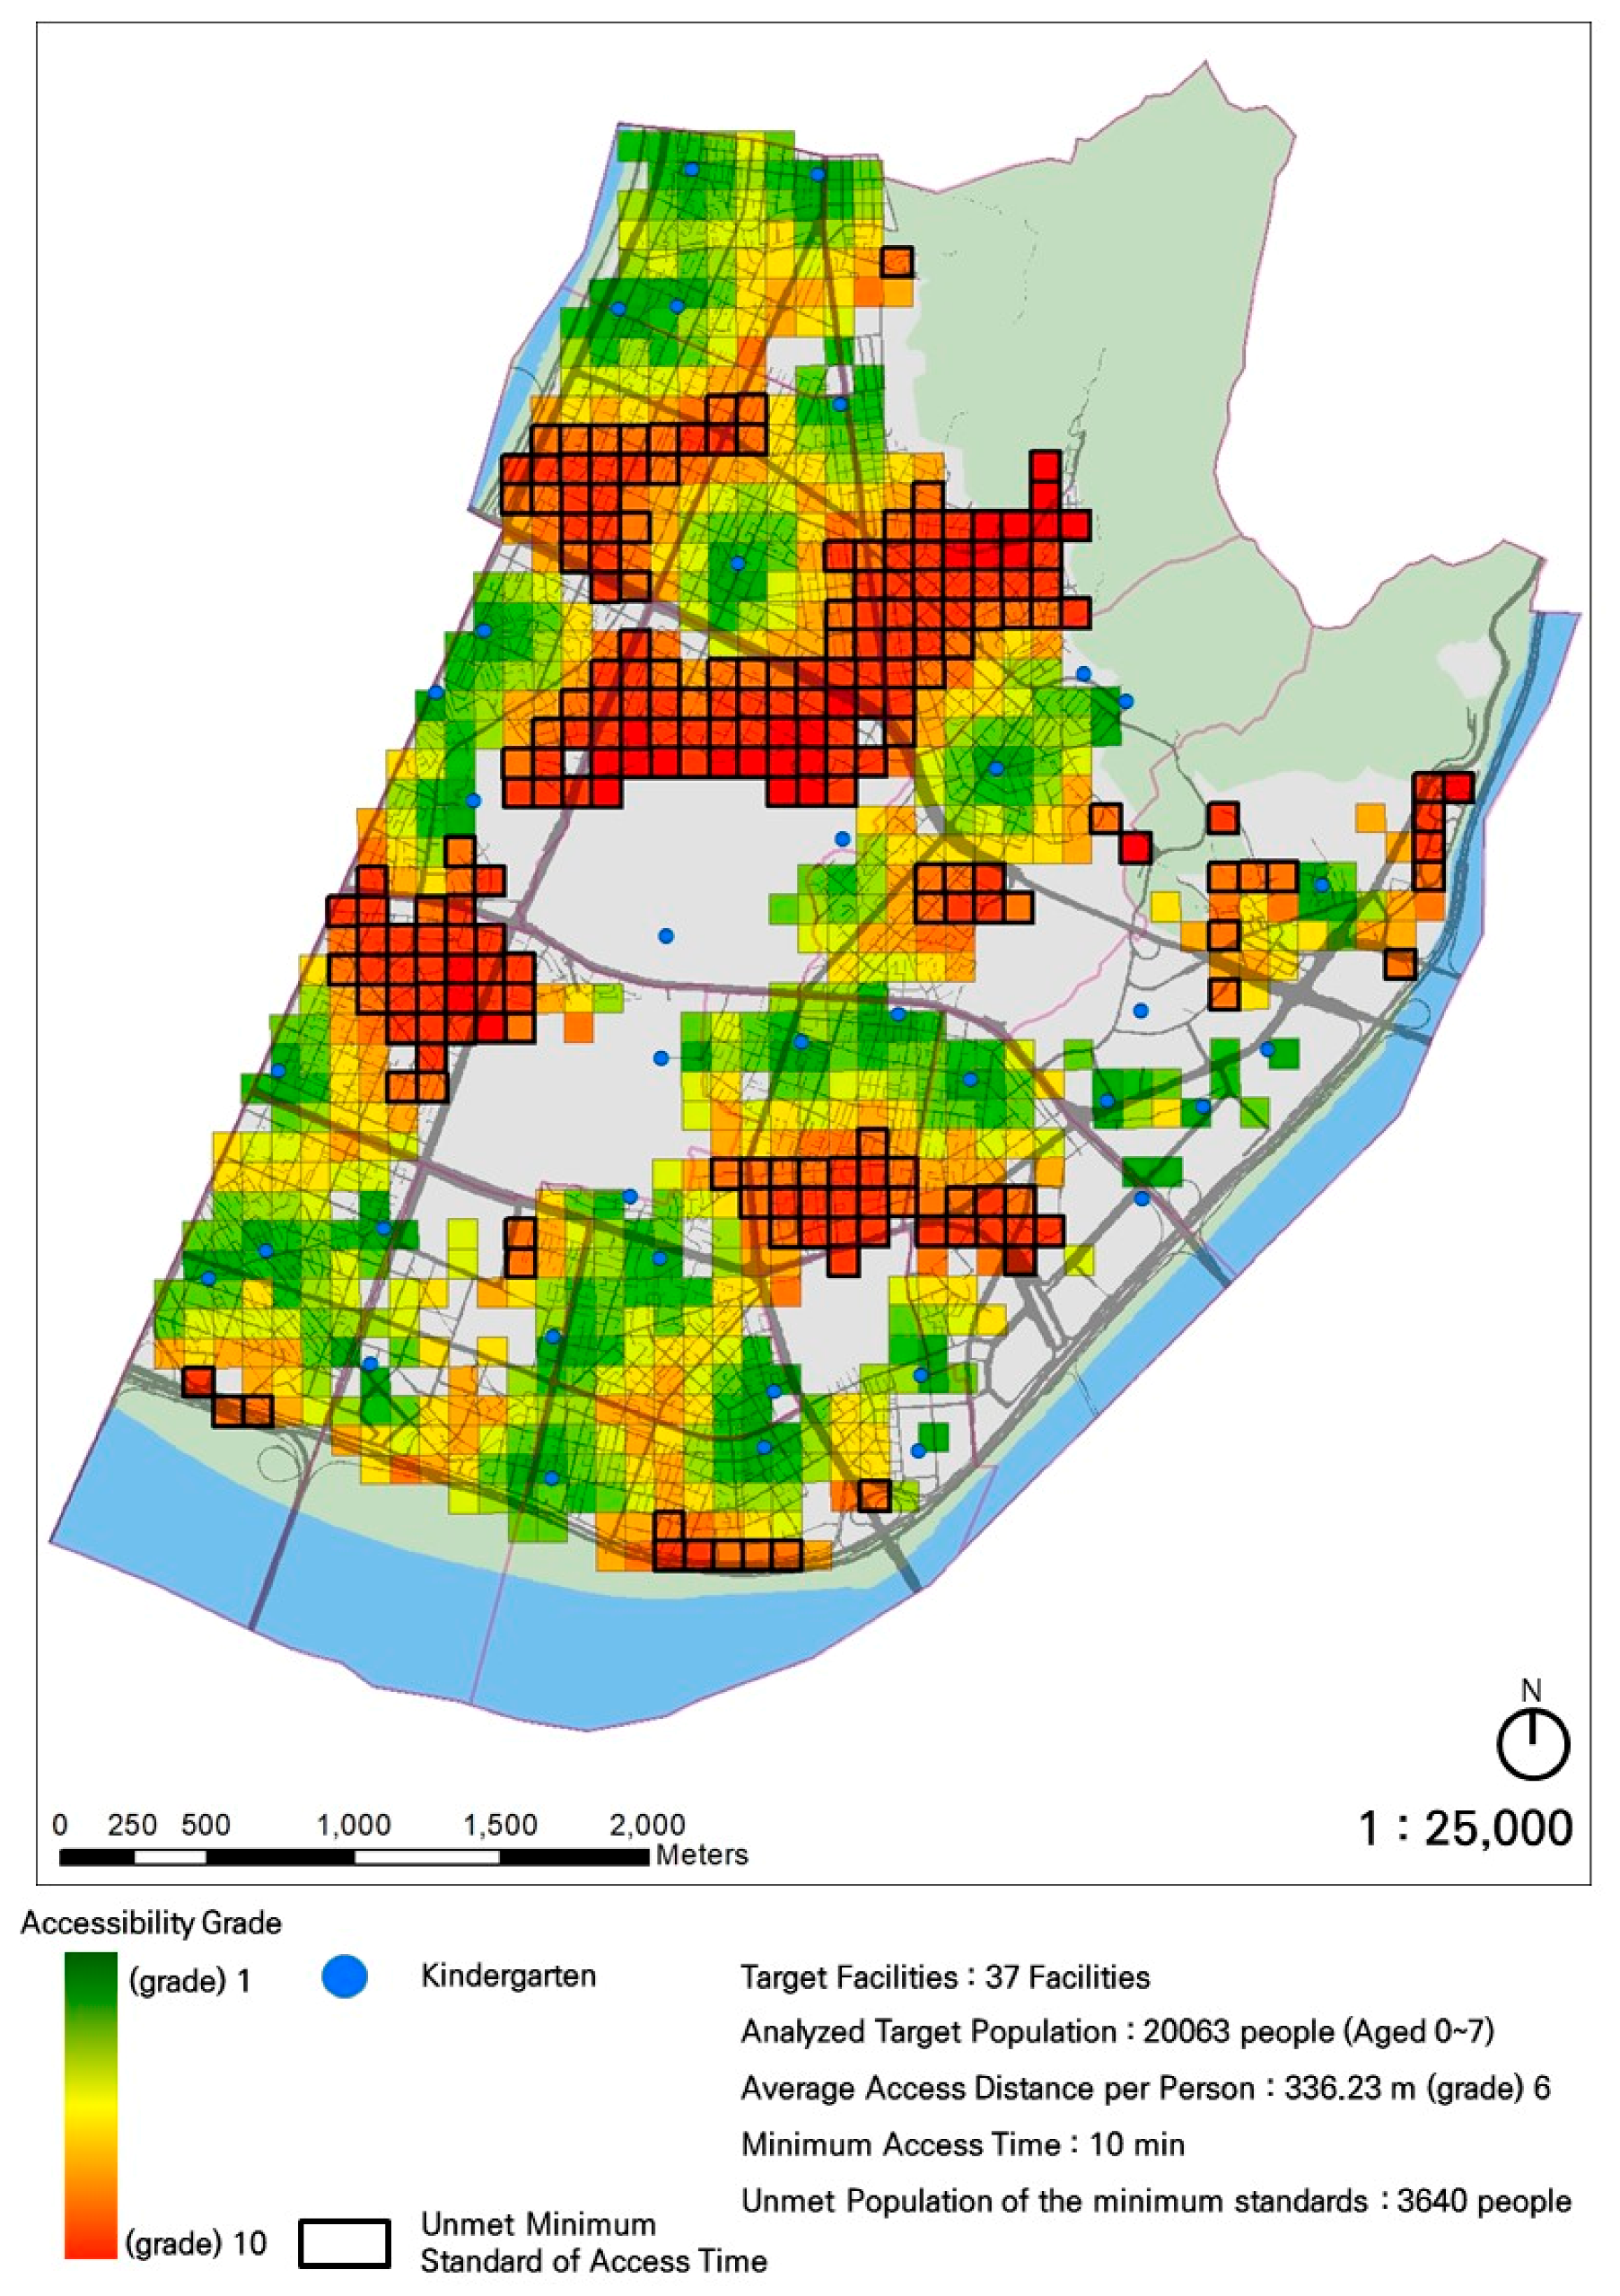
By using the 100 × 100 population grid, the geographical recognition can be visualized as shown in Figure 2. Figure 2 shows each cell distributed within the district as an example of Educational SOC. Specifically, there are noticeable clusters of low Educational SOC areas (red squares) and high Educational SOC area (green squares).
Previously, we addressed the RMSE and MAE through regression analysis for each dependent variable through 100 × 100 and 500 × 500 population grids of five basic living infrastructures. As shown in Table 6, the significance of the explanatory variables was more clearly confirmed in the 100 × 100 grid. Therefore, it can be seen that the model using the 100 × 100 grid data is a better model. The result was verified as a better model by using the data of the 100 × 100 grid, which is a dense population grid. The significance of the results indicates that the appropriate population grid should be used according to the characteristics of the city.
5. Conclusions
In this study, we aimed to analyze the effects of influential factors on the grades of SOCs in South Korea using two types of grids (i.e., a 100-square-meter grid and a 500-square-meter grid). Specifically, we compared the prediction accuracy of the grids to identify which population grid better estimated the associations between relevant factors and the SOC grades. Previous studies have used different measuring systems. Koo et al. (2019b) used a 500-square-meter grid to establish the minimum standard of basic living infrastructure while the Life SOC Promotion Team of the Office for Government Policy Coordination proposed the scope and the minimum standard of basic living infrastructure based on the 100-square-meter grid analysis.
The inconsistent measuring methods used in past studies generated the research gap questioning which type of geographic dataset produces more meaningful policy implications. Koo et al. (2019a) suggested using a 500-square-meter grid as the basic rule for consistency when documenting data; however, using a 100-square-meter grid can be effective when obtaining more detailed information. The researchers did not compare the two methods directly. Thus, this study fills the literature gap by conducting and comparing the regression models based on two different types of population grids.
This study used a regression analysis model to analyze the status and improvement points of the national minimum standard for basic living infrastructure by empirically analyzing whether the standard was met. The main analysis results are as follows.
First, the population grids of the 100 × 100 grid and 500 × 500 grid were compared with RMSE and MAE through the population, female rate, green land rate, residential land rate, commercial land rate, private land rate, and average land price. We confirmed that the model of 100 × 100 had relatively high effectiveness and influence on the variables and grades.
Second, we confirmed that the 100 × 100 grid model was superior to the 500 × 500 grid network in both explanation and prediction in all of the five basic living infrastructures compared. Third, in the case of basic local governments, the 100 × 100 grid demonstrated a higher explanatory power in the discovery of blind spots for basic living infrastructure services and the analysis of the influence between dependent variables, in comparison to the 500 × 500 grid as seen at the national level. The government sought to identify and supply an appropriate location by discovering service blind spots through the supply of basic living infrastructure.
However, the correlation between the appropriate population grid and indicators according to the characteristics of the city had not been examined. Thus, this study showed it is necessary to require policy analysis through a demographic network that takes into account regional characteristics, such as urban or rural areas. Through the correlation between these facilities and dependent variables, it is possible to reflect the urban characteristics and make policy decisions based on the population grid. Specifically, by using 100 × 100 grid models, it is possible to expect the subtle grade of SOCs. For instance, the SOC grades can be predicted by using coefficients of predictors (i.e., population, gender, green area ratio, housing rate, commercial ratio, private property ratio, and land price) like in Formula (4) to (8). Formula (4) is a predicting model for Education SOC; Formula (5) for Learning SOC; Formula (6) for Care SOC; Formula (7) for Sports SOC; and Formula (8) for Rest SOC.
By using the above formulas, policy makers may estimate how high the costs associated with the new grid system to improve the SOCs in the area are.
A limitation of the study relates to the subdivided characteristics of each basic living infrastructure in the 100 × 100 grid, although the representative basic living infrastructure was analyzed with category and correlation. Therefore, we considered that it would be meaningful to understand the factors that affect the grade through a more detailed classification between grades. In addition, although this paper was analyzed through the methodology of supplying basic living infrastructure at the basic stage at the moment, it is expected that the implications of various aspects can be explored by making and analyzing a model that considers the use and scale of facilities located by region.
Author Contributions
W.K.—Conceptualization, Data collection, Original draft; N.P.—Writing revision, Investigation; W.H.—Project administration, methodology, writing and review. All authors have read and agreed to the published version of the manuscript.
Funding
This research received no external funding.
Institutional Review Board Statement
Ethical review and approval were waived for this study because this study utilized the public data released by Korean government.
Informed Consent Statement
Not applicable.
Conflicts of Interest
The authors declare that there is no conflict of interest.
References
- Act on Public-Private Partnerships in Infrastructure, amend. art. 2, subpara. 1. 2005 & rev. 2018. Available online: https://elaw.klri.re.kr/kor_service/lawView.do?hseq=47891&lang=ENG (accessed on 20 October 2020).
- Architecture and Urban Research Institute. 2019. The Local Basic Living Infrastructure Report. Available online: https://www.codil.or.kr/filebank/original/RK/OTKCRK190154/OTKCRK190154.pdf?stream=T (accessed on 11 November 2020).
- Casey, Sharyn. 2005. Establishing Standards for Social Infrastructure. Ipswich: UQ Boilerhouse Community Engagement Centre, Available online: http://realoptionsconsulting.com.au/wp-content/uploads/2015/03/Sharyn-Casey_Establishing-Standards-for-Social-Infrastructure.pdf (accessed on 11 November 2020).
- Cho, Nam Gun. 2013. Life-centered infrastructure policy direction. National Territory 375: 47–53. [Google Scholar]
- Cho, Pan Gi, and Seung Wook Lee. 2014. Directions for the improvement of living infrastructure for the happiness. National Territory Policy Brief 456: 1–6. [Google Scholar]
- Cho, Pan Gi. 2013. Living infrastructure supply status and policy tasks. National Territory 382: 5–14. [Google Scholar]
- City of Seoul. 2020. Urban infrastructure statistics [Data Set]. The City of Seoul Archive of Public Data. Available online: https://data.seoul.go.kr/ (accessed on 12 September 2020).
- Dash, Ranjan Ku, and Pravakar Sahoo. 2010. Economic growth in India: The role of physical and social infrastructure. Journal of Economic Policy Reform 13: 373–85. [Google Scholar] [CrossRef]
- Infrastructure Australia. 2019. An Assessment of Australia’s Future Infrastructure Needs: The Australian Infrastructure Audit 2019. Available online: https://www.infrastructureaustralia.gov.au/sites/default/files/2020-10/Audit%202019_Full%20pdf_Updates%20September%202020.pdf (accessed on 5 December 2020).
- Klinenberg, Eric. 2019. Palaces for the People: How Social Infrastructure Can Help Fight Inequality, Polarization, and the Decline of Civic Life. New York: Broadway Books. [Google Scholar]
- Koo, Hyung Soo, Da Ye Lee, and Jung Eun Park. 2019a. A Strategy for the Provision of Social Infrastructure at the Regional Level. Korea Research Institute for Human Settlements. Available online: https://library.krihs.re.kr/dl_image2/IMG/07/000000030570/SERVICE/000000030570_01.PDF (accessed on 11 November 2020).
- Koo, Hyung Soo, Jung Ho Moon, Dae Jong Kim, Sang Yeon Lim, Tae Kwan Yoon, Se Jin Yoon, and Kyoung Joo Lee. 2019b. A Study Introduction and Utilization Plan for Living Infrastructure Standards. Ministry of Land, Infrastructure and Transport. Available online: https://www.codil.or.kr/filebank/original/RK/OTKCRK190264/OTKCRK190264.pdf?stream=T (accessed on 11 November 2020).
- Korea Research Institute for Human Settlements. 2014. Research Volume 1: Establishment of Basic Policy for National Urban Regeneration. Ministry of Land, Infrastructure and Transport. Available online: http://www.prism.go.kr/homepage/origin/retrieveOriginDetail.do?cond_organ_id=1613000&research_id=1613000−201400075&pageIndex=1&leftMenuLevel=120 (accessed on 20 October 2020).
- Korea Research Institute for Human Settlements. 2018. A Study on Introduction and Application of Basic Living Infrastructure Standard. Ministry of Land, Infrastructure and Transport. Available online: https://www.codil.or.kr/viewDtlConRpt.do?gubun=rpt&pMetaCode=OTKCRK190264 (accessed on 20 October 2020).
- Korea Research Institute for Human Settlements. 2019. A Guidebook to Analyze and Understand the Supply of Local SOCs. Ministry of Land, Infrastructure and Transport. Available online: https://www.codil.or.kr/filebank/original/RK/OTKCRK190154/OTKCRK190154.pdf?stream=T (accessed on 20 October 2020).
- Kumari, Anita, and Anil Kumar Sharma. 2017. Physical & social infrastructure in India & its relationship with economic development. World Development Perspectives 5: 30–33. [Google Scholar] [CrossRef]
- Latham, Alan, and Jack Layton. 2019. Social infrastructure and the public life of cities: Studying urban sociality and public spaces. Geography Compass 13: e12444. [Google Scholar] [CrossRef]
- Ministry of Health and Welfare. 2018. Providing Social Services Centered on Home and Local Communities: Community Care Is Being Promoted in Earnest. Available online: http://www.mohw.go.kr/react/al/sal0301vw.jsp?PAR_MENU_ID=04&MENU_ID=0403&CONT_SEQ=344177&page=1 (accessed on 11 November 2020).
- Ministry of Land, Infrastructure and Transport. 2018. Basic Forum for Reorganizing National Minimum Standards. Available online: https://www.codil.or.kr/filebank/original/RK/OTKCRK190264/OTKCRK190264.pdf?stream=T (accessed on 20 October 2020).
- Oh, Mintaek. 2017. Seoul’s Urban Regeneration Model. Seoul Solution. Available online: https://seoulsolution.kr/en/content/6875 (accessed on 20 October 2020).
- Park, Kyoung Nam. 2018. The Minimum Standard of Living Infrastructure Reorganized by Time Distance between Facilities. Hankuk Economy. Available online: https://www.dnews.co.kr/uhtml/view.jsp?idxno=201811281140340430721 (accessed on 20 October 2020).
- Sung, Eun Young, Yoo Kyoung Lim, and Hyun Sung Lim. 2013. Accessibility and Availability of Neighborhood Facilities in Old Residential Area. Architecture and Urban Research Institute. Available online: www.auric.or.kr/User/Rdoc/DocRdoc.aspx?returnVal=RD_R&dn=321291#.X9HqG6Gg-UI (accessed on 5 December 2020).
- Urban Regeneration Information System. 2013. National Urban Regeneration Basic Policy. Available online: https://www.city.go.kr/portal/policyInfo/urban/contents02/link.do (accessed on 11 November 2020).
- Uzawa, Hirofumi. 1999. Toward a general theory of social overhead capital. In Markets, Information and Uncertainty: Essays in Economic Theory in Honor of Kenneth J. Arrow. Edited by Graciela Chichilnisky. Cambridge: University Press, p. 253. [Google Scholar]
| 1. | Multi-Family Housing Management Act, 2018. |
| 2. | A dong is a local sector in South Korea, which is smaller than a district but larger than a street. |
| 3. | Compared to apartment buildings, detached housing locations tend to lack social infrastructure in Korea. |
| 4. | Gu means district. |
Figure 1.
Scope of basic living infrastructure. Social Overhead Capital (SOC).

Figure 2.
100 × 100 Analysis (Educational SOC) through the population grid.


Table 1.
The national minimum standard index.
| Unit | Classification | Detail Facility | Minimum Standard |
|---|---|---|---|
| Village (Walking) | Education | Kindergarten | 5–10 min |
| Elementary school | 10–15 min | ||
| Learning | Library | 10–15 min | |
| Day care | Daycare Center | 5 min | |
| Welfare | 5–10 min | ||
| Medical | Basic medical | Demand consideration | |
| 10 min | |||
| Sport | Life physical training | 10 min | |
| Rest | Neighborhood Park | 10–15 min | |
| Convenience | Convenient facility | 5 min | |
| Retail store | 10 min | ||
| Transportation | Village parking | Rate of securing rate 70% more | |
| Local strategic point (Vehicle) | Learning | Public library | 10 min |
| Day care | Welfare | 20–30 min | |
| Medical | Health center | 20 min | |
| Emergency medical | 30 min | ||
| Culture | Culture facility | 20 min | |
| Sport | Sports facility | 15–30 min | |
| Rest | Local Park | 10 min |
Table 2.
Housing types in Seoul (City of Seoul 2020).
Table 2.
Housing types in Seoul (City of Seoul 2020).
| Borough | Housing Rate | Apartment Ratio | Apartment Ranking | House Ranking |
|---|---|---|---|---|
| Seoul | 35.12% | 44.78% | ||
| Gwangjin-gu4 | 58.10% | 21.46% | 25 | 1 |
| Nowon-gu | 11.40% | 80.36% | 1 | 25 |
Table 3.
Data standardization matching process between data.
| Type | 100 × 100 | 500 × 500 |
|---|---|---|
| Theoretical | 904 | 36 |
| Practical (Real) | 904 | 252 |
Table 4.
Sample descriptive statistics.
| Variables | Gwangjin District | 100 × 100 | 500 × 500 |
|---|---|---|---|
| (n = 904) | (n = 252) | ||
| Population | 357.46 (person) | 395.43 (person) | 392.95 |
| Male | 48.90% | 193.53 (person) | 192.61 |
| Female | 51.10% | 201.90 (person) | 200.34 |
| Green area ratio | 30.90% | 3.61% | 3.82% |
| Housing rate | 68.00% | 94.25% | 94.17% |
| Commercial ratio | 0.19% | 1.74% | 1.56% |
| Private property ratio | 70.80% | 70.54% | 70.70% |
| Land Price | 29.20% | 29.06% | 28.85% |
| Average | Average | Average | |
| (Standard Deviation)/All | (Standard Deviation)/cell | (Standard Deviation)/cell | |
| Education | - | −9.70 × 10⁻⁹ | −3.50 × 10⁻⁹ |
| SOC ranking | |||
| Learning | - | −1.80 × 10⁻⁸ | 1.03 × 10⁻⁹ |
| SOC ranking | |||
| Care | - | −5.23 × 10⁻⁹ | 1.27 × 10⁻⁸ |
| SOC ranking | |||
| Sports | - | 2.74 × 10⁻⁹ | −1.94 × 10⁻⁸ |
| SOC ranking | |||
| Rest | - | 4.38 × 10⁻⁹ | 1.27 × 10⁻⁸ |
| SOC ranking |
Table 5.
Living SOCs (i.e., Education, Learning, Care, Sports, and Rest). Comparison of the rating analysis models: Regression analysis with the root mean of squared error (RMSE) and mean of absolute error (MAE).
Table 5.
Living SOCs (i.e., Education, Learning, Care, Sports, and Rest). Comparison of the rating analysis models: Regression analysis with the root mean of squared error (RMSE) and mean of absolute error (MAE).
| Division | Education SOC Model | Learning SOC Model | Care SOC Model | Sports SOC Model | Rest SOC Model | |||||||||||||||
|---|---|---|---|---|---|---|---|---|---|---|---|---|---|---|---|---|---|---|---|---|
| 100 × 100 (n = 904) | 500 × 500 (n = 252) | 100 × 100 (n = 904) | 500 × 500 (n = 252) | 100 × 100 (n = 904) | 500 × 500 (n = 252) | 100 × 100 (n = 904) | 500 × 500 (n = 252) | 100 × 100 (n = 904) | 500 × 500 (n = 252) | |||||||||||
| B | Standard Error | B | Standard Error | B | Standard Error | B | Standard Error | B | Standard Error | B | Standard Error | B | Standard Error | B | Standard Error | B | Standard Error | B | Standard Error | |
| Population | −0.00 *** | 0.00 | −0.00 | 0.00 | 0.00 | 0.00 | 0.00 | 0.00 | −0.00 *** | 0.00 | 0.00 | 0.00 | −0.00 * | 0.00 | 0.00 | 0.00 | −0.00 | 0.00 | −0.00 | 0.00 |
| Female | −0.22 | 0.39 | 3.25 ** | 1.16 | 0.9 | 0.41 | −1.16 | 1.18 | −1.08 ** | 0.38 | 0.41 | 1.19 | −0.07 | 0.39 | −0.80 | 1.19 | −0.01 | 0.40 | −1.56 | 0.19 |
| Green area ratio | 2.32 ** | 0.88 | 1.08 | 2.02 | −2.68 ** | 0.90 | −2.43 | 2.05 | −0.10 | 0.86 | −2.13 | 2.07 | 0.33 | 0.86 | 0.17 | 2.06 | −1.40 | 0.89 | −0.70 | 2.07 |
| Housing rate | 1.80 * | 0.87 | 0.41 | 1.98 | −3.58 *** | 0.89 | −3.40 | 2.01 | −0.80 | 0.85 | −2.94 | 20.2 | −1.75 * | 0.85 | −0.11 | 2.01 | −1.93 * | 0.88 | 0.28 | 2.02 |
| Commercial ratio | 3.74 *** | 0.94 | 4.67 * | 2.22 | −3.57 *** | 0.97 | −3.70 | 2.26 | 1.10 | 0.92 | −2.45 | 2.28 | −2.43 ** | 0.92 | 2.38 | 2.26 | −1.37 | 0.96 | −1.37 | 2.28 |
| Private property ratio | −0.11 | 0.17 | −0.12 | 0.46 | −0.05 | 0.17 | 0.97 * | 0.47 | −0.32 | 0.16 | −0.34 | 0.47 | 0.30 | 0.16 | 0.99 | 0.47 | 0.47 ** | 0.17 | −0.26 | 0.47 |
| Land Price | −0.00 ** | 0.00 | −0.00 | 0.00 | −0.00 | 0.00 | 0.00 | 0.00 | −0.00 *** | 0.00 | 0.00 | 0.00 | −0.00 * | 0.00 | −0.00 * | 0.00 | −0.00 *** | 0.00 | −0.00 | 0.00 |
| Constant | −1.30 | 0.87 | −1.90 | 1.99 | 3.53 *** | 0.90 | 3.09 | 2.03 | 1.89 * | 0.80 | 2.80 | 2.04 | 1.70 * | 0.86 | 0.11 | 2.03 | 1.99 * | 0.89 | 1.04 | 2.04 |
| R2 | 0.10 | 0.08 | 0.041 | 0.045 | 0.14 | 0.03 | 0.13 | 0.04 | 0.07 | 0.03 | ||||||||||
| RMSE | 0.95 | 0.96 | 0.98 | 0.98 | 0.93 | 0.97 | 0.93 | 0.98 | 0.96 | 0.98 | ||||||||||
| MAE | 0.80 | 0.82 | 0.76 | 0.76 | 0.77 | 0.80 | 0.73 | 0.76 | 0.80 | 0.77 | ||||||||||
Note: * p < 0.05; ** p < 0.01; and *** p < 0.001. In the 100 × 100 Education SOC model, B = −0.0003697 (p < 0.001) for populations; B = −1.91 × 10⁻⁹ (p = 0.001) for land price. In the Learning SOC model, B = −3.37 × 10⁻¹⁰ (p > 0.05) for the land price of 100 × 100; B = −8.4 × 10⁻⁶ (p > 0.05) for a population of 500 × 500; and B = −1.37 × 10⁻⁹ (p > 0.05) for land prices of 500 × 500. In the 100 × 100 Care SOC model, B = −0.0003575 (p < 0.001) for a population; and B = −2.12 × 10⁻⁹ (p < 0.001) for land prices. In the Sports SOC model, B = −0.0001448 (p = 0.021) for a population of 100 × 100; B = −1.30 × 10⁻⁹ (p = 0.018) for land prices of 100 × 100; and B = −3.37 × 10⁻⁹ (p = 0.021) for land prices of 500 × 500. In the 100 × 100 Rest SOC model, B = −3.83 × 10⁻⁹ (p < 0.001) for land prices.
Table 6.
Comparison of the data model results.
| Type | 100 × 100 | 500 × 500 | ||
|---|---|---|---|---|
| RMSE | MAE | RMSE | MAE | |
| Education SOC |  |  | ||
| Learning SOC |  |  | ||
| Care SOC |  |  | ||
| Sports SOC |  |  | ||
| Rest SOC |  |  | ||
Publisher’s Note: MDPI stays neutral with regard to jurisdictional claims in published maps and institutional affiliations. |
© 2021 by the authors. Licensee MDPI, Basel, Switzerland. This article is an open access article distributed under the terms and conditions of the Creative Commons Attribution (CC BY) license (http://creativecommons.org/licenses/by/4.0/).
Share and Cite
MDPI and ACS Style
Kang, W.; Park, N.; Heo, W. Improvements in Evaluating Grids for Basic Living Infrastructure: The Case of Gwangjin District in Seoul, South Korea. Soc. Sci. 2021, 10, 26. https://0-doi-org.brum.beds.ac.uk/10.3390/socsci10010026
AMA Style
Kang W, Park N, Heo W. Improvements in Evaluating Grids for Basic Living Infrastructure: The Case of Gwangjin District in Seoul, South Korea. Social Sciences. 2021; 10(1):26. https://0-doi-org.brum.beds.ac.uk/10.3390/socsci10010026
Chicago/Turabian StyleKang, Wooseok, Narang Park, and Wookjae Heo. 2021. "Improvements in Evaluating Grids for Basic Living Infrastructure: The Case of Gwangjin District in Seoul, South Korea" Social Sciences 10, no. 1: 26. https://0-doi-org.brum.beds.ac.uk/10.3390/socsci10010026
Note that from the first issue of 2016, this journal uses article numbers instead of page numbers. See further details here.