
Demographics of Sudanese University Students in Relation to Regional Conflict and Underdevelopment


1
Department of Information Technology, Faculty of CSIT, Alzaiem Alazhari University, Khartoum 13311, Sudan
2
Department of Science and Mathematics, Texas A&M University-Central Texas, Killeen, TX 76549, USA
3
Department of Information Systems, CEMIS College, University of Nizwa, Birkat Al-Mouz, Nizwa PC 616, Oman
*
Author to whom correspondence should be addressed.
Soc. Sci. 2021, 10(3), 89; https://0-doi-org.brum.beds.ac.uk/10.3390/socsci10030089
Submission received: 5 January 2021
/
Revised: 15 February 2021
/
Accepted: 23 February 2021
/
Published: 3 March 2021
(This article belongs to the Special Issue Social and Economic Implications of Skill and Educational Mismatch)
Abstract
:This research examines regional differences in higher education participation rates in Sudan, and their relations with socioeconomic factors related to development, such as human development index (HDI), women’s status, urban/rural, and source of income. We pay special attention to areas of Sudan where long-running conflicts exist. Two datasets are used: the 2009 National Baseline Household Survey, conducted by Sudan’s Central Bureau of Statistics; and 2016–2017 matriculating students’ data, obtained from Sudan’s Ministry of Education. Regression analysis of the household survey data shows that the most significant factors associated with university attendance are having electricity at home, having a mother who has completed primary education, and being from a non-conflict region. University entrance data shows that young adults from conflict regions lag markedly behind the rest of Sudan in entering students’ academic level. Educational resources in Sudan are densely concentrated in the capital Khartoum, and higher-performing students (especially males) from all regions tend to enroll in universities in Khartoum. Regional universities’ student bodies consist largely of lower-performing students from the same region, especially in conflict regions. Women’s participation in higher education is robust, and women bachelor’s students outnumber men. Our analysis suggests that the following policies could be most effective in improving regional higher education enrollment rates and outcomes: (1) improve infrastructure (electric power in particular) in underserved regions; (2) provide widespread primary education for women; (3) put additional resources into regional universities, to encourage geographical diversity and to better serve women in underdeveloped regions.
Keywords:
Sudan; higher education; university students; development; regional; conflict; women; demographics; diversity1. Introduction
In this section, we discuss the general interrelations between regional conflicts, and developmental inequities, and education in Africa, and then introduce the motivation and scope of our research that focus particularly on Sudan.
1.1. Developmental Inequities, Conflict, and Education in African Countries
In many African countries, there are extreme differences between regions within the country, in terms of both ethnic composition and development. This is a legacy of the division of Africa into nations according to colonial administration. In many cases, tribes with competing interests have been thrown together and tasked with making a common way forward. All too often, the result has been an ongoing power struggle leading to social unrest, flareups of violence, and even armed conflict. Such conflicts involve a complex interplay of factors related to the level of resource scarcity, the resilience of customary dispute resolution mechanisms, patterns of intercommunity interaction, government policies, and political interests Østby et al. (2009).
Education is an essential resource for any nation, especially in developing countries and those hoping to escape the cycle of violence and illiteracy Bishai (2008). Education plays a crucial role in securing economic and social progress and improving income distribution, which reduces the reasons for conflict. Education also has an important role to play in the process of post-conflict reconciliation by addressing the legacies of conflict.
On the other hand, conflicts and their consequences directly affect the provision of education. Violence and discrimination negatively affect school climate, attendance, learning ability and academic performance of learners. School buildings are destroyed, teachers are killed or flee, and those which remain are unpaid and untrained. Not surprisingly, families are unwilling to send their children to school when security is poor. Most unschooled children are either from very poor rural areas or from conflict areas. Opportunities for informal education and youth and adult learning may similarly be curtailed. Previous studies of African nations as well as other regions have examined the relationship between higher education and development level. Reference Bloom et al. (2014) provides evidence that higher education is essential for technological catch-up for nations that are behind the development curve. The study in Hanushek (2016) agrees that higher education can contribute to knowledge capital which is essential for growth, but argues that additional years of schooling have little impact on development unless cognitive skills are addressed. Reference Glewwe et al. (2014) finds that education has less of an impact on development in sub-Saharan Africa than in other world regions, possibly because of poor educational quality.
Numerous previous studies have also examined the relation between higher education and conflict. Reference Tahirsyzaj (2010) investigates developments at the University of Prishtina in Kosovo during the five years following the civil war. Despite pushes for reform on the part of international stakeholders, the quality of education continues to suffer, largely because of insufficient inclusion and compensation of local faculty. A more comprehensive examination of the coevolution of higher education and externally-funded reconstruction projects is given in Feuer et al. (2013). The author of Milton (2013) takes post-conflict Iraq and Libya as case studies, and concludes that higher education has great potential for promoting a range of processes leading to post-conflict reconstruction and recovery. Similar studies based on observations of Colombia, Kenya, and Cote d’Ivoire are provided in Pacheco and Johnson (2014) and Johnson (2019): both studies highlight the importance of universities in post-conflict rebuilding and reconciliation. Reference Johnson (2019) points out that the wrong kind of higher education can actually worsen conflicts, but that an educated population is more capable of finding peaceful solutions for grievances. It may be noted that all of the aforementioned studies are based on qualitative observations, and do not rely on comprehensive databases.
1.2. Motivation and Scope of This Research
Even before independence, the nation of Sudan has been plagued with regional inequities, which have also affected the educational system. Decades of regional, mainly ethnically based conflicts have only worsened the situation. Bishai (2008) Successive regimes since independence in 1956 have found it difficult to win general acceptance from diverse political constituencies Sabr et al. (2020) and promote equitable development on a nationwide basis. In particular, long-running animosity and open war between north and south led finally to the secession of southern states and the forming the Republic of South Sudan in 2011. In the remaining states, widening inequality and poor infrastructure remain major obstacles to Sudan’s socioeconomic development GPE (2019).
The current study focuses on regional differences in higher education in Sudan, with special attention to regions in which conflict and underdevelopment are endemic. Our goal is to evaluate the extent to which the educational situation reflects the development situation, and to formulate data-driven educational policies that address conflict situations and developmental inequities. No previous studies of this type have been conducted for Sudan, due to the unavailability of relevant data. Fortunately, data are now available that enable a systematic study of tertiary education demographics. Electronic submission for admission to public and private higher education institutions in Sudan began in the academic year 2014–2015. As a consequence, comprehensive university admissions data are now available, including factors of interest such as student’s GPA, sex, state of origin, and student’s preferred and admitting department/university. Anonymized admissions data for the academic year 2016–2017 were obtained from the Ministry of Higher Education and Scientific Research of Sudan MOHE (n.d.). We examine the regional characteristics in various factors of geographical factors (state of origin, state of preferred and admitting universities), performance factors (GPA ranking, acceptance percentages) and preference factors (preferred/admitted field of study). Data for bachelor’s and diploma students are examined separately. The bachelor’s degree is a 4-year degree (or 5 years in specialized fields like medical and engineering), while a diploma degree is a lower-level degree requiring two or three years of study at university.
Graphical data analysis is a powerful methodology for the exploration, characterization, mining, and presentation of data Unwin (2015); Wainer and Thissen (1981). Since analyses of Sudan’s university admissions data should be conducted annually, we have created a set of general-purpose software programs (written in open-source R programming language) to assist in graphical data analysis of the data. The programs are designed to enable policymakers with little knowledge of mathematics or statistics to draw important conclusions from the data. This is accomplished by generating visual representations of categorical data that reveal practically significant relationships between variables and categories. Information-rich graphs are automatically generated. Displayed data are arranged in order to bring out similarities and trends related to different factors, such as geographical region (of university and student’s origin), subject area, GPA, gender, and so on. Data are also portrayed from multiple aspects, and these different data representations enable the user to identify relationships between factors. Examples of such relationships include regional variations in GPA or acceptance rates; differences between genders in terms of choice of department Hamid et al. (2020).
The remainder of this paper is organized as follows. Section 2 provides a necessary background on the current situation in Sudan with respect to regional disparities in development, regional conflicts, and the overall educational system. Section 3 describes methods used, including research questions that guided the research; data files used; software used in the analysis; and steps used in the preprocessing of data. Section 4 presents results, mostly in the form of graphs generated by the software, together with discussions of each graphs’ significance. Section 5 contains a summarized discussion of the results, and Section 6 offers conclusions.
2. Background
This section provides necessary background on Sudan’s current regional characteristics and educational system. In the first part, we give a general overview, and explain our division of Sudan into seven regions. In the second part, we give region-by-region descriptions of these regions, with particular reference to development level and current conflicts. In the third part, we explain Sudan’s current educational system.
2.1. Overview of Sudan’s Regional Characteristics
The Republic of Sudan (known also as the North Sudan after the South Sudanese referendum in 2011) has deep historical roots in the ancient kingdom of Kush, which flourished for about 3000 years, beginning around 2500 B.C. The kingdom had capitals successively at Kerma, Napata, and Meroe, which are all located in present-day Northern and River Nile states Micalizio (2018). The subsequent history of Sudan has been turbulent, with the region divided into various kingdoms and sultanates, as well as periods of domination by Egypt and the Ottoman Empire, as well as Great Britain, from which it gained independence in 1956. For much of Sudan’s history, power has been disproportionately concentrated in the hands of leaders from tribes along the Nile, especially from Northern regions, and their political and economic dominance continues until now.
The name Sudan is from the Arabic “bilad al sudan” which means “the land of the black people”. The very name of Sudan expresses what is perhaps the major social division within the country. Ethnic groups within Sudan are generally designated as either “Arab” or “Black African”, where Arabs form the majority. Africans tend to live in tropical areas in the south, while Arabs inhabit northern desert areas. However, many locations have significant presence of both groups Mareng (2009). Both Africans and Arabs are further subdivided into hundreds of tribes and language groups, which is a significant obstacle to effective collaboration on a national level Britannica (2020).
Along with this tribal diversity has come a diversity of regional conflicts between tribes or groups of tribes. Several factors have contributed to creating conflict in Sudan, but all are ultimately related to competition over wealth and resources. The most important of these resources is land, which is used for agriculture or livestock care and is also exploited for resources such as oil and groundwater. Conflicts extend to the political sphere as well, as many small political parties are ethnoregionally based, and focused particularly on local interests. Historically, these parties have formed unstable alliances, sometimes joining together in opposition, although they have little in common except opposition to the party in power Morton (1989).
Sudan has extreme regional disparities ethnically, economically, and politically, and because of changing realities, it is not a straightforward task to demarcate Sudan into distinct regions. The administrative division of Sudan has varied over time. At independence in 1956, Sudan was divided into nine regions Cahoon (1991), six of which lie in present-day Sudan. Since then, multiple administrative reorganizations have taken place. Currently, Sudan is divided into 18 states Law (2015), as shown in Figure 1. West and South Kordofan were merged in 2005 and re-separated in 2013. In the following, West and South Kordofan together are referred to as “South Kordofan”.
Based on geographical, historical, and anthropological considerations, Ryle (2011) divides current-day Sudan into five regions: the northern heartland, centered on Khartoum; Nubia in the north bordering Egypt; the eastern desert stretching to the Red Sea; Darfur and Kordofan in the West; and the southern areas bordering South Sudan. In order to equalize regional populations as well as to reflect current economic and political situations that are more fully described in the following discussion, we propose a modified division of states into seven regions. In Table 1, these regions are listed in order of increasing HDI (human development index), and states within regions are listed in order of increasing HDI. Population estimates are 2016 projections based on the 2008 Sudan census, obtained from CBS (2018), while state HDI estimates are obtained from Global_Data_Lab (2019). Regional HDI values are obtained from state HDI values, weighted by population. The table shows that within regions, the HDI level is fairly consistent, except in the Kassala region, where Red Sea State’s HDI far surpasses the other states due to the influence of Port Sudan Law (2015).
Figure 2 shows the time evolution of relative HDI (individual state HDI minus Sudan’s average HDI) from 1990–2017 for the different states of Sudan. States in the same region are indicated with the same color and marker type. Three states in three different regions have seen large relative gains: Nahr El Nil (Nile River), Al Gezira, and the Red Sea. The states where serious, long-running conflicts have persisted (North and West Darfur, South Kordofan, and Blue Nile ) maintained substandard HDI’s over the entire 27-year period, without substantial gains or losses (except for West Darfur, which has moved up three places in the state rankings). The largest relative declines in HDI were in North Kordofan and White Nile, neither of which is a conflict zone. Overall, over the 27-year period, Sudan’s national HDI increased from 0.33 to 0.50 at a nearly constant rate.
2.2. Region-By-Region Descriptions
The following subsections provide brief introductions to development, ethnic composition, and internal conflicts for the seven regions of Sudan identified in Section 2.1.
In the following subsections, we briefly characterize the regions of Sudan defined in Table 1, especially with reference to conflict and development level. This background information will provide insight into the causes of regional differences in higher education demographics.
2.2.1. Khartoum
The Khartoum region includes the three largest cities in Khartoum: Omdurman, Khartoum, and Bahri, and comprises about 40% of Sudan’s total urban population. The three cities (also known as the “Triangle Capital”) are separated by the White, Blue, and combined Nile Rivers. It has served as the administrative hub for Sudan since the early early 1800’s, when Egypt gained control over Sudan. It was the site of several key battles over colonial control: the seige of Khartoum in 1884–1885, during which the Mahdi threw off joint Egyptian-British control, and established an independent state, and the seige of Omdurman in 1899, following which colonial rule was re-established, lasting until 1956. Khartoum has also been the site of several post-independence coup d’etats and revolutions, in 1958, 1964, 1969, 1985, 1989, and 2019, but has been spared long-running armed conflicts that have plagued much of the rest of Sudan.
Since the 1960s, the Triangle Capital has seen a massive influx of immigrants, many of whom live in “squatter cities”. Some of these new arrivals are fleeing conflicts in neighboring countries (including South Sudan) and other regions of Sudan, while others are from rural areas and seek greater economic opportunities. This immigration is largely responsible for Sudan’s increasing urbanization rate of about 4% per year.
Before the separation of South Sudan, wealth from the oil industry was used for massive development projects, including the development of a central business district, along with residential complexes, two five star hotels, a new airport for the city and two new bridges. However, development has stalled in recent years as Sudan’s overall economic picture has worsened drastically: GDP per capita has tumbled from a high of 1910 USD in 2015 to 442 USD in 2019 Macrotrends (2020).
2.2.2. Northern Region
The Northern region contains two states, North and River Nile. The region is sparsely populated, with much of the population concentrated along the Nile River. The population is distributed among several Nubian and Arab tribes. The area has experienced no major conflicts since Sudan’s independence, and apart from Khartoum, is the richest area of Sudan. After Khartoum, it has the lowest poverty rate (34%) and the highest rates of primary school attendance (84%). As mentioned previously, this region has played a key role in Sudan’s history, and much of Sudan’s current intellectual, political and economic elite, although based in Khartoum, and has ancestral and extended family connections with the Northern region Ryle (2011). In the early days of Sudanese higher education under British colonialism, most students were from the north and from the Nile basin. Northerners have also driven the current government’s emphasis on Arabic culture and conservative Islamic ideology over the past several decades. This has led to an expansive policy that promotes the widespread availability of higher education but promotes rote learning over academic rigor Gasim (2010).
2.2.3. Gezira Region
Historically, Gezira lay within the Blue Nile region together with current-day White Nile, Sennar, and Blue Nile states. We have identified Gezira as a separate region due to its high population and higher HDI level. Gezira also has lower poverty rates (38% versus over 50% for the other three states) and higher primary school attendance (73% versus 61%) Demombynes and Romeo (2011). After Khartoum, Gezira is the most populous state, and has the highest population density. The Gezira project (begun under the colonial administration in 1925), one of the largest irrigation schemes in the world, enables the cultivation of almost 9000 square kilometers. In 2010, management of the irrigated fields transferred from the government to individual landowners Ali (2020). Gezira’s population is 80% rural and mostly concentrated near irrigated areas, although only about 30% rely on agriculture for their main income. Gezira is also home to several industries related to processing of agricultural products. Its stability and economic opportunities makes it attractive to immigrants, who come in large numbers from other states Encyclopedia Britannica (2019). The main ethnicity is Arab, with Nubians the largest minority.
2.2.4. Central South Region
The Central South region in our division consists of the three states White Nile, Sennar, and North Kordofan. Historically, Sennar was the seat of the Funj (or Black, or Blue) sultanate, which controlled various parts of Sudan (including Kordofan) over a 300-year period until the 1800’s Global Security (2017); Spaulding (2016). The Funj were distinctively African, as opposed to Arabic-oriented regimes that have dominated the region since the Funj’s decline Ryle (2011). White Nile State straddles the White Nile, which was the historical eastern boundary of Kordofan. The more heavily populated southeastern part of current North Kordofan province resembles neighboring White Nile State in terms of livelihood, development level and ethnic composition Acidri (2013). Primary school attendance rates range from 59–66% in the three states. In recent decades, the region has seen the development of irrigation projects. Sugar is an important cash crop, as is gum arabic. Ethnically, the population comprises a mix of Arab and African tribes. North Kordofan is also home to many itinerant pastoralists that move seasonally to provide pasture for their livestock (camels, goats, and sheep). The long term decline in rainfall in North Kordofan has led to competition for grazing. During drier seasons, northern pastoralists move from the north to southern parts of the state and there are more local livestock movements within more southerly agro-pastoral areas, leading to disputes between agro pastoralists and pastoralists over grazing areas and rights and access to water.
2.2.5. Kassala
The Kassala region contains three states: Red Sea, Kassala and Gedaref. The region’s largest city is Port Sudan, which is the main port and the Sudanese gateway to the outside world. Much of the economic elite class originates from the Northern Region, whose forbears were active in the building of Port Sudan at the beginning of the 20th century. The indigenous inhabitants comprise many tribes, many of which fall in the category of Beja. The Beja have inhabited the region for thousands of years as camel herders. However, recent droughts, increased immigration, and the advent of mechanized farming have depleted grazing lands and forced many to relocate to shantytowns outside of Port Sudan and other urban areas, where many live in dire poverty. Besides the Beja, the relative prosperity of Port Sudan has attracted immigrants from a variety of tribes an ethnicities, and inter-communal tensions sometimes erupt into open clashes and the destruction of property.
Beja grievances against the central government because of perceived neglect of their interests led to the formation of the Beja Congress in 1952, which has intermittently engaged in armed struggle against the government, albeit at much lower levels than in the Darfur or South regions. In 2011, the Beja Congress joined the Sudan Revolutionary Front (SRF), a coalition of armed opposition groups mainly from south and west Sudan Global Security (2014), as well as several tribes of Arabic origin.
Further south, Kassala state is home to over 100,000 refugees from Eritrea, which borders Kassala to the east. Some of these refugees have integrated with the local population, which shares a common ethnicity. The majority however remain in camps, and view Kassala as a staging ground for eventual moves to more prosperous locations in Sudan or other countries IRIN (2011). The state also attracts immigrants from other parts of Sudan, especially from conflict-ridden areas in the south and west.
Kassala is also the site of New Halfa, where Nubians from near the Egyptian border were forcibly relocated due to the construction of the Aswan High Dam in the early 1960s. The resettlement brought serious hardships to the new immigrants, both in terms of alienation due to loss of ancestral lands and in terms of economic loss, due to serious flaws in the planned irrigation scheme. The forced displacement and resettlement failed to create permanent social development. Immigrants are forced to rely on self-determined farming practices, supplemented by other occupations. The vast economic and social differences between the compensated resettled Nubians and the host population of nomads and migrant workers have led to fragmentation and resentment among the different ethnic groups Mahgoub (2014); Wallin (2014).
2.2.6. Darfur
The Darfur region currently consists of five states: North, South, East, West, and Central Darfur. The name Darfur is from “dar fur”, Arabic for “the land of the Fur”. Historically, it was an Islamic sultanate located in the western Sudan. The Fur were the ruling ethnic group in the Darfur region until 1916. Darfur is home to some 80 tribes and ethnic groups divided between nomads and sedentary communities. Although the indigenous peoples of Darfur (the Fur, and several other ethnic groups) and the Arabs have always had relatively distinct identities, they generally got along well until resources became scarce. In the 1970s and 1980s, the severity of these conflicts increased as a result of environmental degradation. Moreover, migration from Chad increased the population, putting further pressure on already scarce land resources. Historically, most of these conflicts pitted “Arabs” against “Africans”, but during recent years, inter-Arab fighting has been more common Brosché (2011). The conflict among the various tribes and ethnic groups has been aggravated by the central government’s neglect, and by local government officials’ alliance with, and bias toward their own tribe or ethnic group Brosché (2011); Kifle (2015). The fighting escalated in 2003 when the Sudan Liberation Movement/Army (SLM/A) and the Justice and Equality Movement (JEM) took up arms against the government. Although commonly perceived as struggle of the marginalised “African” rebels against a negligent central government, this characterization is an oversimplification which fails to take into account the highly complex social situation Brosché (2011).
2.2.7. South
The South region in our division consists of two of the most conflict-ridden states in Sudan: South Kordofan and Blue Nile. Since the 1980s, these states had been the main theatres in the civil war between the central government in Khartoum and the Sudan People’s Liberation Army (SPLA). In 2005, the Comprehensive Peace Agreement (CPA) cleared the way for a referendum which eventually led to the independence of South Sudan. However, the two border states were not included in the referendum.
Ongoing conflicts in the region have similar causes to those in Darfur. Population pressures, environmental degradation, change in climatic conditions and cultural practices are key instigators of conflicts, which usually occur between pastoralists and settled agriculturalists and among pastoralists themselves. All of the 23 conflicts recorded by the UNDP in Kordofan region of Sudan in 2001 were resource-based, and all were among settlers and pastoralists (UNDP Sudan 2007). These local level resource-based clashes were at times interwoven with national and regional dynamics Kifle (2015). The discordant atmosphere is further exacerbated by fragmentation within ethnic groups, often along generational lines. The Nuba tribe (which inhabits the Nuba mountains) is divided between those supporting the SPLM/A and others who started their own movements. Within the Misseriya community, there exist severe conflicts between youth leaders and traditional leaders. Among the youth, many deem the traditional leaders illegitimate, as they accuse them of having been co-opted by the government and of being out of contact with the grievances of the young and of local communities Brosché (2011).
By June 2011, large-scale conflict engulfed South Kordofan’s Nuba Mountains area, later spreading to Blue Nile in September. Within just a few weeks, this new war saw the mobilization of thousands of men and huge quantities of weapons and ammunition, air strikes, and the displacement of hundreds of thousands of people. The new conflict pits the Sudanese army and paramilitaries against former members of the southern SPLA, and allied elements of the Darfur armed opposition. Gramizzi and Tubiana (2013). The cumulative impact of decades of fighting is evident in the deterioration of infrastructure and services, lack of government resources, and consequent instability and insecurity Elmagboul (2015).
The southern-most state of Blue Nile has experienced serious conflict since 1987. The reasons and dynamics of conflict are similar to those that are operative in South Kordofan.
2.3. Higher Education in Sudan
2.3.1. Historical Background
Sudan’s educational disparities reflect the distinct policies pursued by British governors during the period of the Anglo-Egyptian condominium (1899–1955). The North and the South of the country (modern-day Sudan and South Sudan, respectively) were administered separately, with the curriculum of the North taking place in Arabic and reflecting its Islamic heritage Bishai (2008).
Institutions of higher education in Sudan have a long history of interaction with politics and this effect continues until now. Universities have been affected directly by the political climate, as well as being instigators of political change. Graduates of Gordon Memorial College (which later became Khartoum University) established the Graduates’ Congress in 1902, which paved the way for the creation of the main political parties in Sudan. The Graduates’ Congress was the focus of the independence movement, and its leaders formed the new administration when self-rule became reality Mayada et al. (2020).
The Ministry of Higher Education and Scientific Research (MOHE) was initiated in 1971 to carry out the task of setting policies and rules for all higher education institutions, plans and programmes for higher education and scientific research and providing coordination between its institutions. Higher education and scientific research institutions consist of universities, government and private institutions, research centres and institutes that are established under their own laws and founding orders Amine (2010).
Like many other Nile Basin countries, Sudan adopted higher education reforms in the 1990s, with the aim of increasing student enrollment, establishing new public universities, and facilitating the establishment of new private institutions Elhadary (2010). As a result of the reform, the number of higher education institutions (private and public) has proliferated: as of 2020, there were 128 higher education institutions (HEIs), of which 36 are public and 20 private universities, 53 private colleges and 19 technical university colleges Mayada et al. (2020). Moreover, during this period, in line with the government’s political orientation, the MOHE steered higher education towards increasing Arabization Abdalla (2017), an emphasis that was reflected both in curriculum and methods of instruction.
The Evaluation and Accreditation Commission (EVAC) was established in 2003 under the authority of MOHE, in order to provide oversight over performance of higher education institutions. The Commission has established standards nine focal areas: institutional framework, governance and administration, infrastructure and services, human resources, students and graduates, teaching and learning resources, scientific research and graduate studies, community services, and quality management. However, most of these standards are not enforced by universities. Poor facilities, overburdened teachers (who are forced to take outside teaching positions to supplement their meagre incomes), and excessively high student to faculty ratios (the national average in 2016 was 42 to 1) represent the typical situation in Sudanese universities. Furthermore, many of the best candidates for faculty positions opt instead for positions in Saudi Arabia or the Gulf states, where they receive much higher pay Abdalla (2017).
2.3.2. Geographical Educational Policies
Prior to 2009, a policy was put in place to give special consideration to student applicants from less developed states. Under this policy, different states’ applicants have separate competitions for admission. In addition, a special percentage is allocated to students from rural and remote regions and war-torn areas Amine (2010).
Additional measures were taken to promote geographical diversity in higher education, in that new universities were established throughout Sudan, to better serve regional students Amine (2010). Unfortunately, providing sufficient funding for these universities has been a challenge, given the precarious state of Sudan’s economy and the government’s heavy spending on military (in 2018, 70% of the budget went towards military spending, and a total of 3% towards all levels of education Dabanga (2018)).
2.3.3. Bachelor’s Versus Diploma Degrees
There are two types of university-level degrees available to high school graduates: bachelor’s and diploma. Bachelor’s is a four-year degree (or five years, for certain specialties like medicine and engineering): students are generally full time, and classroom attendance is typically required. Diploma degrees, on the other hand, are less standardized. Like ’certificates’ in the US, these are not accredited degrees, but rather the curricula are set by individual universities (with the approval of the MOHE). For universities, these are sources of additional revenue, and typically tuition costs for diploma degrees are higher than the cost of a bachelor’s. For some students, diploma degrees are attractive because they only require 2–3 years of study, and furthermore, can be earned while working. A diploma can provide a salary boost for graduates who work for the government.
3. Materials and Methods
In this section, we describe in detail the methods and resources used in this study, including research questions, data sources and preprocessing, software, and statistical methods employed in the data analysis.
3.1. Research Questions
Since the focus of this study is the relation between regional development level and participation in higher education, we analyze admitted students’ data for regional differences in demographic variables that are related to social and economic development, including: urban/rural residence, income, parents’ education, and students’ sex. In addition to participation rates, the relationship between student performance and these variables is also relevant. Based on these considerations, the following research questions were formulated:
- (A)
- What demographic factors, such as region of origin, urban/rural residence, family income quantile, parents’ education, and living conditions, are associated with lower rates of university attendance among college-age students?
- (B)
- Can regional differences in rates of university attendance be explained by differences in the demographic factors mentioned above?
- (C)
- Does the balance between 2-year and 4-year degree seeking students depend on region of geographical origin?
- (D)
- Do the proportions of male and female students that attend university depend on students’ region of origin?
- (E)
- Are there significant differences in the academic performance (percentile) of students between students from different regions?
- (F)
- Do university and college students from different regions exhibit differences for what and where they prefer to study?
- (G)
- Are universities in Sudan diverse as far as the geographical origin of students: and does the level of diversity depend on the region in which the university is located?
- (H)
- Do students tend to prefer to study in universities in their own region or not? If so, does this tendency depend on the students’ region of origin or other factors?
- (I)
- Is there evidence of regional bias in admissions?
3.2. Source Data
This research utilizes two data sets, described as follows.
The first dataset is the National Baseline Household Survey (NBHS) conducted in Sudan in 2009 CBS (2014). The survey was conducted over a two-month period. Overall, 528 households in each state were selected according to a stratified two-stage design, using a sampling frame based on the 2008 Sudan Population and Housing Census. Refugee camps and homeless were excluded. These data include demographic data for all regions of Sudan, and provide economic and social information. In our research, the NBHS dataset was used to determine rates of university attendance among Sudanese young adults, as well as socioeconomic factors associated with university attendance.
The second dataset was the application and admissions data for public universities for the academic year 2016–2017 obtained from the Office of Admission of the Ministry of Higher Education of the Republic of Sudan. Application data, acceptance data for bachelor’s and diploma degrees are kept in three separate Microsoft® Excel files. For the 2016–2017 academic year, there were a total of 209,653 applications, with 82,501 admissions for bachelor’s and 20,150 admissions for diploma respectively. The data sets include variables of different types, including binary, categorical, numerical and ranked variables.
The applications and admissions data were preprocessed as follows. All attendance sheets for each academic year were combined into a single data frame. Attendance and acceptance data for each year were merged by form number. Data rows with empty fields or missing values were also discarded. Some variables were renamed and/or recoded. Based on these operations, the following variables were constructed for each student:
- Student’s sex
- Student’s class rank percentile (<25, 25–50%, 50–75%, 75–90%, 80–100% ) computed on the basis of secondary school GPA
- Student’s preferred university
- Student’s preferred department
- Student’s home state
- University attended by student
- State of university attended by student
- Student admitted by preferred university (yes/no),
- Student admitted by preferred department (yes/no),
- Preferred university is located in student’s home state (yes/no),
- Attended university is located in student’s home state (yes/no).
3.3. Graphical Data Analysis
In this section, we discuss the graphical analysis procedures used to analyze the data. The graphical analysis software was written using the R programming language with the RStudio interface.
3.3.1. R and RStudio
The R programming language provides a software environment for scientific computing, statistical analysis, reporting and graphical representation. RStudio provides an integrated development environment, with separate windows for data display, program editing, code execution, etc., and debugging capabilities that are useful in development work Quora (2020).
The ‘ggplot2’ package developed for R by Hadley Wickham was used to produce graphics for data display. Unlike most other graphics packages, ggplot2 has a deep underlying grammar based on Wilkinson’s Grammar of Graphics Wickham (2016). This grammar enables ggplot2 to create new graphics that are precisely tailored for each problem; although ggplot2can be used to build up highly complex data displays, it relies on a small set of core principles, and is relatively easy to learn.
3.3.2. Graphical Data Representations: Spineplots and Double-Decker Plots
Visual or graphical representations of data can be the best way to show statistical relationships between the quantities being measured: “a picture is worth a thousand words”. For this reason, data visualization has become an important and active field of study Pastizzo et al. (2002).
Probably the most common graphical tool for visualization of categorical data is the simple bar chart. However, the bar chart is limited in the information that it can convey. There are modifications that give more detailed information. Two such modifications are the spine plot and double-decker plot, which are described below.
A spine plot closely resembles a bar chart, but differs in that the width of the bars shows relative sizes of categories. For example, Figure 4 shows several spine plots side by side. The first plot on the left relates to 19–21-year-old individuals in the South region of Sudan. Each individual is either of urban or rural origin; and each individual either is or is not a university student. Thus, we are considering two variables with two categories each: Urban (NO or YES) and university student (NO or YES). The colored bars above “NO” show the division of rural individuals into university students/nonstudents, as in a conventional bar graph. The width of the “NO” bar is proportional to the number of rural individuals, while the width of the “YES” bar is proportional to the number of urban individuals. Thus, the relative sizes of all four combinations in South region can be immediately seen based on the relative sizes of corresponding colored rectangles. This makes for an easy comparison between different regions, as shown in Figure 4, which gives spine plots for all seven regions. Both spineplots and double-decker plots are particular variants of mosaic plots, in which the area of colored rectangles are used to denote relative frequencies of different variables Hornik et al. (2006).
Note that spine plots should only be used when the relative frequencies corresponding to the different bar variables are meaningful. For example, in Figure 11, a bar chart is used, because the frequencies of the different bar categories depend on independent sample sizes and thus should should not be compared.
Double-decker plots are an enhanced version of spine plot which represents relative frequencies for three categorical variables instead of two Hofmann (2001). Figure 18 is a double-decker plot that represents three categorical variables which characterize Sudanese students: GPA rank (above or below 50%), region of university attended by the student (seven categories) and region of student’s origin (seven categories). Each bar in the plot corresponds to students in a single GPA category and from a single region: the colors in that bar represent how these students’ universities are divided among the different regions of Sudan. In this case, the relative widths of any two bars can be compared: for example, from the plot, we can see that the number of Darfurian students with GPA rank above is roughly equal to the number of Northern students with a GPA rank below , because the corresponding bars have almost the same width. Furthermore, we may compare the sizes of any two colored areas: so for example, from Figure 18, we may conclude that there are more below-average students from South region studying in Khartoum than from Kassala, because of the relative areas of the two corresponding navy-blue areas in the figure. Thus, double-decker plots enable the direct comparison of any combination of the three categorical variables depicted.
For our double-decker plots, we used the “VCD” package within the R software system Hornik et al. (2006). All plots use the “viridis” color scheme, which has several advantages, including being interpretable by the colorblind, as well as printable in black-and-white Smith and van der Walt (2015).
3.3.3. Software Structure and Function
The software consisted of two R scripts, one for data formatting and one for graphical data a"nalysis. The data formatting script performed several data preprocessing tasks, including data merging, data cleaning (deleting variables and records with empty fields; renaming variables) and data transformation (mapping variable values and calculating of secondary variables). These data manipulations are described in more detail in the “Data preprocessing” subsection below. The graphical analysis script made extensive use of ggplot2 commands. The software is designed to support systematic data exploration and analysis. The software also contains an option to calculate the statistical significance (chi-square values) for differences as indicated by a graphical analysis of the data.
3.4. Statistical Significance
Bar plots and their derivatives can show proportions or nominal values, but do not directly indicate whether or not difference in proportions are statistically significant. Since we are making a large number of comparisons, it is inconvenient for us to perform statistical significance tests for all comparisons. Instead, we establish a general guideline for significance as follows. The formula for the standard deviation of a proportion derived from a data set with n records is , where is the true proportion. In our case, we are dealing with datasets with over 20,000 records, and we are looking at proportions within classes of at least 500 records. It follows that the standard deviations for all of the proportions within our graphical representations are dominated by or . Accordingly, we will set a robust standard and conclude that any two proportions that differ by or more are significantly different in a statistical sense.
4. Results
In all graphs and tables, for ease of comparison, the regions of Sudan are listed in order of increasing development.
4.1. Regional Attendance Rates and Related Factors
4.1.1. Demographic Factors Related to University Enrollment in Sudan
Table 2 shows demographic factors related to education and social situation, and their relation to university attendance. The strongest predictor of university attendance was ownership of a computer, but only 10% of the sample fit this category. Mother’s education at primary school level or above was the second most reliable predictor of university attendance: 50% of 19–21-year-olds that had primary-educated mothers attended university, while only 23% of those with less educated mothers did not. (Note that we grouped non-respondents to the parents’ education question as “no primary”, because we would expect non-respondents to be much more likely to have lower levels of education.) In view of the fact that measured female attendance rates were much higher than male, it stands to reason that mother’s education was an important factor in determining whether their daughters go to university. Since only 42% of respondents in the 19–21 year old age bracket were female, it is quite likely that females in this age group were underreported, and it is also likely that unreported females would be less likely to be university attenders. On the other hand, the strongest predictor of university non-attendance was lack of electricity: of the 40% of 19–21-year-old respondents living in households without electricity, only 11% attended university. This should not be surprising, since having no electricity makes it much more difficult to obtain suitable lighting and other conditions for study.
4.1.2. Regional Dependence of Factors Related to Enrollment in Higher Education
The factors described in Table 2 are broken down by region in Figure 3, Figure 4, Figure 5, Figure 6, Figure 7, Figure 8, Figure 9 and Figure 10. From these graphs, we may visually discern three important general tendencies.
First, for each individual region, we find that the bar on the right is consistently larger than the bar on the right. This indicates that factors that favor university attendance are favorable regardless of region. However, the impact of factors varies considerably from region to region. For example, in Figure 4, we see a 25 percentage point difference between female and male participation rates in Al Gezira, while the difference is roughly 10 percent for Kassala and Khartoum. Similarly, Kassala shows over 35 percent differences in university participation rates based on parents’ education, while in Khartoum, Northern, and Al Gezira, the difference is 20 percent or less.
Second, with few exceptions, the “yes” bars grow larger across the graphs from right to left. This indicates that regardless of category, university attendance rates are larger for regions that have been identified as more developed. An exception is Kassala, which has very high levels of university participation for individuals that are urban or have educated parents. This is likely due to the presence of an educated upper class in Port Sudan, which is much more developed than the rest of Kassala.
Third, we find that the width of right bar consistently increases from left to right across the different graphs. This indicates that almost without exception, factors which favor university attendance are more prevalent in more developed regions. This effect is especially pronounced for parents’ education levels (as shown in Figure 7 and Figure 8, as well as having electricity (see Figure 9).
4.1.3. Regression Analysis
A stepwise regression of university participation was performed using the variables in Table 2 as independent variables. The seven regions were coded as numerical values 1 through 7, so that increasing value reflects increasing HDI. When all variables (except for “has computer”) were included, a model was obtained in which the significant variables are has electricity; mother has primary or higher education; region; and sex (forward and backward stepwise procedures gave the same model). Coefficients for this model are given Table 3.
If mother’s education is excluded as an independent variable, then source of income (salaried vs. self-employed) becomes included as a factor. If mother’s education and having electricity are both excluded, then urban residence and income quartile additionally become significant factors. Coefficients for the regression models without mother’s education and without both mother’s education and having electricity are excluded and given in Table 4 and Table 5 respectively.
The above results should be considered in light of the fact that all of the factors in Table 2 are highly correlated. Measures of accuracy of models with and without mother’s education level and electricity are shown in Table 6. When mother’s education is excluded from the model, AIC increases by 11% and McFadden’s pseudo- increases by 6.5%: when electricity is included, the effects on AIC and pseudo- are tripled, indicating that electricity is an especially important factor.
We may focus particularly on regions in which there are conflicts, namely South and Darfur. If we recode the “regions” variable so that South and Darfur are assigned to ‘0’ and all other regions are assigned to ‘1’, we obtain a model with AIC of 809.9, which is only 0.4% larger than the full model which ranks regions numerically, and which has a pseudo- value that is virtually identical to the best model. This implies that most of the regional difference can be explained by the difference between those regions where armed conflict is endemic and those that are relatively peaceful. The regression coefficients for the conflict/no conflict model are given in Table 7.
4.2. Regional Demographic Composition of Incoming University Students
In the following sections, the regional dependence for student proportions is related to the factors described in the research questions.
4.2.1. Bachelor’s versus Diploma Degrees
Figure 11 shows the relative proportion of bachelor’s and diploma students for different regions in Sudan. Apart from Kassala (where Port Sudan is located), the proportion of diploma students for less-developed regions is relatively low, around 10%. This may seems surprising, because one might have expected that less developed regions would have a larger proportion of students in less academically challenging degree programs. In Section 4.2.6, we will see that there are relatively few opportunities for diploma training outside of Khartoum, which may make it difficult for students from poorer regions from enrolling in diploma programs.
4.2.2. Sexual Composition of Incoming Students by Home Region
Figure 12 and Figure 13 show the sexual composition of incoming (2016–2017) bachelor’s and diploma students respectively by region of origin. Female proportions for bachelor’s admits range from 40% for Darfur to over 60% for Khartoum and Northern regions. There is a 10–20% gap between South and Darfur and the other regions. On the other hand, South and Darfur have among the highest proportions of female diploma students, about 20 percentage points above Gezira, that has the lowest percentage.
Note that Figure 12 shows that under 50% of incoming students from South or Darfur are female. At first sight, this seems to be inconsistent with Figure 4, which appears to show that female 19–21-year-olds from the South and Darfur regions participate in higher education at much higher rates than males. The inconsistency is resolved by noting that the “female” bars are much thinner, which indicates that the female sample is much smaller. This would seem to indicate that young adult females were significantly under-reported in the survey, and those that were reported tend to have higher education levels. This may reflect the sociological and cultural conditions of those two regions.
4.2.3. Academic Level of Incoming University Students by Home Region
Figure 14 and Figure 15 show the academic ranking of incoming (2016–2017) bachelor’s and diploma students respectively, classified according to their home region. In Sudan, the academic rank of secondary students is determined by their performance on examinations that are standardized throughout Sudan. This implies that there is a uniform standard for the academic ranking of students, regardless of region.
It is evident from Figure 14 that students from Khartoum have a considerable advantage over students from the rest of Sudan. About 50% of students from Khartoum are in the top quartile, which is 20% more than second-place Gezira. At the other end of the scale, both South and Darfur have fewer than 10% of students in the top quartile, and over 70% in the bottom half, compared to Khartoum, where less than 25% rank in the bottom half. Other regions stand midway between the two worst regions and Khartoum.
Figure 15 shows that just as for bachelor’s students, diploma students from South and Darfur are among the worst performing, with less than 18% in the top quartile and over 55% in the bottom half. However, it is Gezira diploma students rather than Khartoum students that stand out academically, with over 40% in the top quartile. This may be related to the fact that a large percentage of diploma students are male—perhaps male students in Gezira see more economic opportunity in the professional trades, so diploma programs attract better male students.
4.2.4. Acceptance Rates by Region
Figure 16 and Figure 17 show the applicants’ receiving their first, second, or third choice by home region for different rank percentiles, for bachelor’s and diploma students, respectively. Figure 16 shows that different regions have widely different acceptance rates into preferred programs for bachelor’s students, even for students with comparable rank percentiles. The acceptance rates for South are above 60% regardless of rank percentile, while for Darfur and Gezira, the acceptance rates for the most part range between 35% and 55%. The high acceptance rates for South may reflect Sudan government’s policy of giving special consideration to student applicants from underdeveloped areas which was mentioned in Section 2.3.2. Figure 17 shows the preferred department acceptance rates for diploma students are much higher than for bachelor’s students, across all regions.
4.2.5. Regional University Attendance for Students from Different Home Regions
Figure 18 shows the regional distribution of universities attended by bachelor’s students from different home regions. The distributions for below-average students (bars labeled ‘<50) are shown separately from above-averages students (bars labeled ‘>). For all regions except Darfur, the majority of students attend universities in their own region. This tendency is especially pronounced among below-average students. Over 90% of students from Khartoum study in Khartoum, while at the other end of the scale, only about 42% of Darfurian students attend universities in Darfur. We may also see a strong tendency for higher-achieving students to study in Khartoum, as evidenced by the tall blue bars for “<50” for all home regions. This indicates the strong possibility of a “brain drain”, where the best and most qualified graduates end up remaining in Khartoum after finishing their studies. By comparing the width of the two bars for each home region, we see once again that South and Darfur lag far behind in terms of proportion of above-average students, while the Khartoum far surpasses the other regions (followed by Gezira).
Figure 19 shows the regional diversity of the bachelor’s student bodies for universities in different regions. Proportions for male and female students are shown separately. Universities outside of Khartoum do not exhibit much geographical diversity: for example, virtually all of the students attending universities in Darfur are from Darfur. This is also true for women students in Kassala, Gezira, and Northern regions. Universities in South get 90% of their students from South and Darfur regions. It is evident that universities in these regions are not able to attract outside students, possibly because of poor facilities and low academic level. Sudanese women are much less likely than men to study outside of their own region: in Sudanese culture, many young women are encouraged to stay at home during their university studies, while young men are less tied to the home. By comparing the widths of the female and male bars for each university region, we see that female enrollment is larger than male for most regions outside of Khartoum: South is an exception.
Figure 20 is analogous to Figure 19, and shows the regional diversity of diploma students enrolled in different regions. More than half of all diploma students are enrolled in Khartoum, where over 50% of male students are from outside Khartoum. Female diploma students enrolled in Khartoum are much less diverse; and outside Khartoum, there is very little geographical diversity among diploma students in different regions. The graph reflects the large numbers of students from provincial areas who earn diploma degrees in order to establish a career in Khartoum, which is the hub of economic activity on Sudan.
We have seen that Khartoum is the destination of many students outside of Khartoum. We may investigate this further for individual universities. Figure 21 show the regional bachelor’s enrollment in a selection of universities in Khartoum. Proportions for students in the lower three quartiles the and top quartile of class rank are shown as separate bars for each university. The universities are listed by order of increasing proportion of top-quartile students (as can be seen by the increasing width of the “>75” bar in each pair of bars). Comparing pairs of bars for the different universities, we see that top-quartile students are consistently less geographically diverse—the proportion of Khartoum students among top-quartile students is higher, and the proportion of Darfurian students is lower. Furthermore, by comparing universities, we see that at universities, an increasing proportion of top-quartile students is correlated with a decrease in geographical diversity of students, among both lower- and higher-ranked students. The universities with a stronger Islamic orientation (University of Holy Quran and Omdurman Islamic University) exhibit much greater geographical diversity than universities more oriented towards Western-style academics (Sudan University of Science and Technology (SUST), Khartoum University).
4.2.6. Regional Variations in Academic Departments
There are more than 40 different departments that award bachelor’s or diploma degrees. To simplify our analysis of the regional dependence of departments, we divide these departments into categories, as shown in Table 8.
We may examine the regional characteristics of university academic departments from two perspectives: first, the departmental distributions for students from different home regions; and second, the departmental distributions offered by universities in different regions.
Besides region, two factors that strongly influence departmental enrollments are class rank and sex. These dependencies are highlighted by Figure 22 and Figure 23, which are double-decker plots that show department category enrollments by region for female and males students for students in the lower 75% and upper quartile of academic rank, respectively.
For the lower ranking students, Figure 22 shows that business and education are the primary areas of study, with women preferring education over business and men vice-versa. Although education is a low-paying profession, it offers a more convenient schedule than other professions for women who want to raise a family. Only a few men in the lower three quartiles enroll in engineering (about 5% from South and Darfur), while virtually no lower-ranking students enter the field are nonexistent, except for about 4% of women from South.
For students in the top quartile, the situation is completely changed. In Figure 23, we see that high-ranking female students gravitate towards the health field, regardless of region, followed by business: in Sudanese society, doctor is seen as a prestigious and appropriate profession for women. For male students, business and law are preferred, followed by engineering (except in Khartoum, where the order is reversed). Men in Sudan are expected to be family breadwinners, and this expectation is an important motivator in men’s choice of study area. There is a scarcity of engineering students from South and Darfur regions (as well as a scarcity of top-ranked students in general from those regions, as the thinness of the bars for these regions in Figure 23. We conclude that most regional variations in departmental enrollments are mainly due to regional differences in academic proficiency.
Figure 24 shows regional characteristics of departmental study from the point of view of university location, for entering bachelor’s and diploma students respectively. Although all bachelor’s department categories are represented in all regions, there is a greater balance of students in education in universities in less developed regions. South region has a strong emphasis on business, unlike other less developed regions. South, Darfur, and Gezira have less focus on engineering than other regions, which may reflect the agricultural orientation of the economies in those three regions.
We may revisit the question of “brain drain” from the point of view of students’ area of study. Figure 25 and Figure 26 show the proportion of students who study outside their home regions depends on their academic level, for students in education and business respectively (the Khartoum region is excluded, because nearly all students from Khartoum also study there). The tendency for better students to leave their home region is not consistent across regions or departments. In both education and business, students from South and Gezira overwhelmingly elect to study outside their home regions. For South, this likely indicates a low level of instruction; while for Gezira, this probably results from the proximity of Khartoum, which has better opportunities for study. For other regions, we do not see this same tendency for better students to leave home: indeed, above-average students in Kassala have a greater tendency to study at home than below-average students.
Figure 27 addresses the question of regional dependence on department for diploma students. It shows that regions with higher development levels also show a greater preference for business by diploma students of both sexes. The single exception is South, which is also notable for the very high proportion of women who study business accounting. Between the sexes, the preferences are not as differentiated as for bachelor’s students, except that men consistently show greater preference for engineering, while women from less-developed areas show a greater preference for technology.
Figure 28 shows the departmental composition of diploma degrees for universities in different regions. Well over half of diploma students study in Khartoum, especially in the areas of engineering and business management. There is a notable emphasis on technology in the least-developed regions, including the high-conflict regions South and Darfur, which show as thin bars, since diploma enrollments are low in these two regions. As with bachelor’s, South has the highest proportion of business students among all regions of Sudan.
5. Discussion
With reference to the research questions listed in Section 3.1, we may make the following observations:
- There are several regional factors that are associated with higher development levels that are also associated with higher participation in higher education. The most prominent of factors are having electricity at home, and mother having primary education. Other development-linked factors that were associated with higher rates of university attendance were urban origin; family income from salary; and income quartile.
- Even when the above factors are accounted for, residents of regions with endemic conflict (Darfur or South) had lower levels of university participation. We may conjecture that either conflict has a direct lowering effect on university enrollment, or both conflict and university participation are affected by similar, unidentified factors.
- The proportion of diploma students compared to bachelor’s is smallest for students from the two conflict regions (Darfur and South). Khartoum has the largest proportion of diploma degree students. These proportions parallel the regional availability of diploma degrees: most opportunities for diploma study are found in Khartoum.
- More developed regions have higher proportions of women students. Of the seven regions studied, only the two conflict regions had a majority of male bachelor’s students. In contrast, Most regions have a majority of male diploma students, especially in Gezira. The differences in gender balance may be attributed to the fact that, for cultural reasons, men are more highly motivated than women to earn higher incomes, and the primary purpose of diploma degrees is to gain qualifications that will bring increases in salary.
- The two conflict regions lag noticeably behind the rest of Sudan in terms of academic level of matriculating university students. About 45% of students from conflict regions were in the lowest quartile of academic achievement nationwide, while less than 9% were in the top quartile. In contrast, the capital region Khartoum greatly surpasses all other regions, with only 8% in the lowest quartile, while 50% are in the top quartile. These figures underscore the extreme contrasts between Khartoum and the rest of Sudan, and particularly the outlying conflict areas.
- Bachelor’s students from less developed areas tend to major in business or education, with women showing a strong preference for education. Very few students from conflict areas study engineering, which may correlate with the underdeveloped infrastructure found in these areas.
- Regional universities outside of Khartoum lack diversity: students mostly come from the same region, and tend to be lower performing. Diversity in universities in Khartoum is variable: universities with a more Islamic emphasis tend to be more regionally diverse, while universities with more secular curricula have larger proportions of students from Khartoum. This may reflect the generally more secular orientation of young Sudanese people who come from Khartoum, and the more conservative religious outlook of those who come from more rural regions.
- Higher education resources and opportunities are heavily concentrated in Khartoum. Higher performing bachelor’s students from all over Sudan tend to go to Khartoum, although women students have a stronger tendency to stay in their own region. The majority of diploma studies take place in Khartoum: universities in conflict areas (especially in South) currently offer few opportunities for diploma study.
- We found no evidence of admissions bias against students from low-performing regions. On the contrary, admissions rates for students from South to preferred schools surpassed all other regions. This may be due to preferential policies of the government, or it may simply be due to the fact that students from South set their sights lower and apply to less selective universities.
6. Conclusions
It is clear that certain regions of Sudan, particularly those that have been subjected to protracted conflict, are disadvantaged with respect to higher education. Enrollment rates are lower; students that do enroll are not as well-prepared; more academically-able students tend to leave the region for their studies; local universities have a lower academic level. Part of this deficiency can be attributed to poor infrastructure (such as electrification) as well as parents’ (specifically, mothers’) lack of educational background. The lower level of women’s education in conflict-prone regions raises the additional possibility of regional cultural attitudes that interfere with the development of women’s human potential. Further sociological research into the status of women in these regions would be needed to determine whether this is the case.
Despite this gloomy picture, there are some reasons for optimism. Many university students (particularly women) from South and Darfur enter the field of education, and many of these obtain their university education locally. If these students obtain jobs as educators in their home regions, this will improve primary and secondary education (particularly of young women), and consequently raise the development level, alleviate reasons for conflict, and set in motion an upward cycle that could eventually lead to increasingly capable university graduates. However, for this to happen, the government of Sudan must make an investment in these regions’ university’s education departments, as well as providing sufficient compensation to primary and secondary teachers so that teaching is an attractive profession (particularly to men, who currently avoid education as a profession). Unfortunately, due to continuing economic instability in Sudan, the government has limited resources for making these investments. Where government support is lacking, regional universities may be able to generate additional revenue by offering diploma degrees, particularly in the areas of accounting and IT.
Author Contributions
Conceptualization, M.H. and S.F.; Formal analysis, M.H. and C.T.; Investigation, M.H. and C.T.; Methodology, M.H. and C.T.; Project administration, S.F.; Resources, C.T.; Software, M.H. and C.T.; Supervision, C.T. and S.F.; Validation, M.H. and C.T.; Visualization, M.H. and C.T.; Writing—original draft, M.H.; Writing—review and editing, M.H., C.T. and S.F. All authors have read and agreed to the published version of the manuscript.
Funding
This research received no external funding.
Institutional Review Board Statement
Not applicable.
Informed Consent Statement
Not applicable
Data Availability Statement
Acknowledgments
We are grateful to the Fulbright Program administered by the U.S. Department of State, and for Alzaeim Alazhari University for enabling this collaboration. We are also grateful to the Economic Research Forum data portal ([email protected]) for providing access to the NBHS 2009 data. We are also grateful to the anonymous reviewers, who made several valuable suggestions.
Conflicts of Interest
The authors declare no conflict of interest.
References
- Abdalla, Suliman Zakaria Suliman. 2017. Quality assurance in Sudanese higher education: Current status and challenges ahead. Journal of Total Quality Management 17: 1–18. [Google Scholar]
- Acidri, James. 2013. Sudan Livelihood Profiles, North Kordofan State; Washington, DC: U. S. Agency for International Development (USAID).
- Ali, Osman. 2020. Sudan First State of Environment and Outlook Report 2020. Nairobi: UN Environment Programme. [Google Scholar]
- Amine, Azrou E. 2010. A Decade of Higher Education in the Arab States (1998–2009): Achievements & Challenges (Regional Report). In Towards an Arab higher Education Space: International Challenges and Societal Responsibilities: Proceedings of the Arab Regional Conference on Higher Education. Edited by B. Lamine. Beirut: UNESCO. [Google Scholar]
- Bishai, Linda S. 2008. Sudanese Universities as Sites of Social Transformation. Washington, DC: United States Institute of Peace (USIP). [Google Scholar]
- Bloom, David E., David Canning, Kevin J. Chan, and Dara Lee Luca. 2014. Higher Education and Economic Growth in Africa. International Journal of African Higher Education 1: 22–57. [Google Scholar] [CrossRef] [Green Version]
- Britannica (website). 2020. Sudan Culture. Available online: https://www.britannica.com/place/Sudan/Cultural-life (accessed on 26 February 2021).
- Brosché, Johan. 2011. The Crises Continue: Sudan’s Remaining Conflicts. Milano: Italian Institute for International Political Studies. [Google Scholar]
- Cahoon, Ben. 2020. States of the Sudan Since 1991. Available online: http://www.worldstatesmen.org/Sudan_prov.html (accessed on 16 October 2020).
- Central Bureau of Statistics (CBS). 2014. NBHS 2009—Harmonized Household Income and Expenditure Surveys (HHIES). Version 2.0 of Licensed Data Files. Sudan. Available online: http://erf.org.eg/data-portal/ (accessed on 26 February 2021).
- Central Bureau of Statistics (CBS). 2018. Sub-National Population Projections of Sudan and Age-Sex Composition. Available online: https://web.archive.org/web/20170312172126/http://cbs.gov.sd/files/Pop._Proj._by_satates137.pdf (accessed on 20 October 2020).
- Dabanga. 2018. Sudanese MPs ’Will Protest 2018 Budget in Parliament’. Available online: https://www.dabangasudan.org/en/all-news/article/sudanese-mps-will-protest-in-parliament-against-2018-budget (accessed on 29 December 2020).
- Demombynes, Gabriel, and Alessandro Romeo. 2011. A Poverty Profile for the Northern States of Sudan. Washington, DC: World Bank, Poverty Reduction and Economic Management Unit. [Google Scholar]
- Elhadary, Yasin Abdalla Eltayeb. 2010. Equity in and Access to Higher Education in Nile Basin Countries: The Case of Sudan. In Reshaping Research Universities in the Nile Basin Countries. Book II. Kampala: Fountain Publishers, pp. 79–100. [Google Scholar]
- Elmagboul, Niveen Salah Eldin Ibrahim. 2015. Effect of Civil War on Livelihood of Three Villages/Blue Nile State, Sudan. International Journal of Research in Humanities and Social Studies 2: 69–75. [Google Scholar]
- Encyclopedia Britannica. 2019. Al-Jazira. Available online: https://www.britannica.com/place/Al-Jazirah-region-The-Sudan (accessed on 16 October 2020).
- Feuer, Hart Nadav, Anna-Katharina Hornidge, and Conrad Schetter. 2013. Rebuilding Knowledge: Opportunities and Risks for Higher Education in Post-Conflict Regions. Bonn: Center for Development Research, University of Bonn. [Google Scholar]
- Gasim, Gamal. 2010. Reflecting on Sudan’s Higher Education Revolution Under Al-Bashir’s Regime. Journal of Comparative & International Higher Education 2: 50–53. [Google Scholar]
- Glewwe, Paul, Eugenie Maiga, and Haochi Zheng. 2014. The Contribution of Education to Economic Growth: A Review of the Evidence, with Special Attention and an Application to Sub-Saharan Africa. World Development 59: 379–93. [Google Scholar] [CrossRef] [Green Version]
- Global_Data_Lab. 2019. Subnational Human Development Index (4.0). Available online: https://globaldatalab.org/shdi/shdi/SDN/ (accessed on 22 December 2020).
- Global Partnership for Education (GPE). 2019. Sudan: Building the Foundation for a Strong Education System. Available online: https://www.globalpartnership.org/content/sudan-building-foundation-strong-education-system (accessed on 16 October 2020).
- Global Security. 2014. Beja Congress. Available online: https://www.globalsecurity.org/military/world/para/beja.htm (accessed on 20 October 2020).
- Global Security. 2017. The Funj—1504–1761. Available online: https://www.globalsecurity.org/military/world/sudan/history-funj.htm (accessed on 16 October 2020).
- Gramizzi, Claudio, and Jérôme Tubiana. 2013. New War, Old Enemies: Conflict Dynamics in South Kordofan. Geneva: Small Arms Survey. [Google Scholar]
- Hamid, Monira, Christopher Thron, and Sallam Fageeri. 2020. Status and Trends in University Admissions for Women in Sudan: A graphical data analysis. Social Sciences & Humanities Open 2: 100076. [Google Scholar]
- Hanushek, Eric A. 2016. Will More Higher Education Improve Economic Growth? Oxford Review of Economic Policy 32: 538–52. [Google Scholar] [CrossRef]
- Hofmann, Heike. 2001. Generalized Odds Ratios for Visual Modeling. Journal of Computational and Graphical Statistics 10: 628–40. [Google Scholar] [CrossRef]
- Hornik, Kurt, Achim Zeileis, and David Meyer. 2006. The strucplot Framework: Visualizing Multi-way Contingency Tables with vcd. Journal of Statistical Software 17: 1–48. [Google Scholar]
- Johnson, Ane Turner. 2019. University Infrastructures for Peace in Africa: Tthe Transformative Potential of Higher Education in Conflict Contexts. Journal of Transformative Education 17: 173–94. [Google Scholar] [CrossRef]
- Kifle, Alagaw Ababu. 2015. State-building and Non-state Conflicts in Africa. Strategic Review for Southern Africa 37: 99. [Google Scholar]
- Law, Gwillim. 2015. States of Sudan. Available online: http://www.statoids.com/usd.html (accessed on 26 February 2021).
- Macrotrends. 2020. Sudan GDP Per Capita 1960–2020. Available online: https://www.macrotrends.net/countries/SDN/sudan/gdp-per-capita (accessed on 26 February 2021).
- Mahgoub, Farida. 2014. Current Status of Agriculture and Future Challenges in Sudan; Uppsala: Nordic Africa Institute.
- Mareng, Chuei D. 2009. The Sudans Dimensions: A Country Divided by Ethnicity and Religion. African Journal of Political Science and International Relations 3: 532–39. [Google Scholar]
- Mayada, Beshir Mamoun, Nafisa Elmahi Ahmed, and Muna Elhag Mohamed. 2020. Higher Education and Scientific Research in Sudan: Current Status and Future Direction. African Journal of Rural Development 5: 115–46. [Google Scholar]
- Micalizio, Caryl-Sue. 2018. The Kingdoms of Kush. Available online: https://www.nationalgeographic.org/media/kingdoms-kush/ (accessed on 16 October 2020).
- Milton, Sansom. 2013. The Neglected Pillar of Recovery: A Study of Higher Education in Post-War Iraq and Libya. Ph.D. dissertation, University of York, York, UK. [Google Scholar]
- Ministry of Higher Education and Scientific Research (MOHE). n.d. Available online: http://www.mohe.gov.sd/index.php (accessed on 26 February 2021).
- Morton, John. 1989. Ethnicity and Politics in Red Sea Province, Sudan. African Affairs 88: 63–76. [Google Scholar] [CrossRef]
- Integrated Regional Information Networks (IRIN). 2011. Eritrea-Sudan: Refugees Battling for a Better Life. Available online: https://www.refworld.org/docid/4e204b772.html (accessed on 2 November 2020).
- Østby, Gudrun, Ragnhild Nordås, and Jan Ketil Rød. 2009. Regional Inequalities and Civil Conflict in Sub-Saharan Africa. International Studies Quarterly 53: 301–24. [Google Scholar]
- Pacheco, Ivan F., and Ane Turner Johnson. 2014. Higher Education in Post-Conflict Conditions. International Higher Education 74: 8–9. [Google Scholar] [CrossRef] [Green Version]
- Pastizzo, Matthew J., Robert F. Erbacher, and Laurie B. Feldman. 2002. Multidimensional Data Visualization. Behavior Research Methods, Instruments, & Computers 34: 158–62. [Google Scholar]
- Quora. 2020. R and RStudio. Available online: https://www.quora.com/What-is-the-difference-between-R-and-RStudio (accessed on 26 February 2021).
- Ryle, John. 2011. The Sudan Handbook. Rochester: Boydell & Brewer Ltd. [Google Scholar]
- Sabr, Mohy el Din, Ahmad Alawad Sikainga, Jay L. Spaulding, Robert O. Collins, Ahmed S. Al-Shahi, and Economist Intelligence Unit. 2020. Sudan. Britannica. Available online: https://www.britannica.com/place/Sudan (accessed on 16 October 2020).
- Smith, Nathaniel, and Stéfan van der Walt. 2015. A Better Default Colormap for Matplotlib. Paper presented at the Python in Science (SciPy) Conference, Austin, TX, USA, July 6–12. [Google Scholar]
- Spaulding, Jay. 2016. Funj Sultanate of Sinnar. The Encyclopedia of Empire. [Google Scholar] [CrossRef]
- Tahirsyzaj, Armend. 2010. Higher Education in Kosovo: Major Changes, Reforms, and Development Trends in the Post-Conflict Period at the University of Prishtina. Interchange 41: 171–83. [Google Scholar] [CrossRef]
- Unwin, Antony. 2015. Graphical Data Analysis with R. Boca Raton: CRC Press. [Google Scholar]
- Wainer, Howard, and David Thissen. 1981. Graphical Data Analysis. Annual Review of Psychology 32: 191–241. [Google Scholar] [CrossRef]
- Wallin, Marianna. 2014. Resettled for Development: The Case of New Halfa Agricultural Scheme, SUDAN; Uppsala: Nordic Africa Institute.
- Wickham, Hadley. 2016. Ggplot2: Elegant Graphics for Data Analysis. Berlin and Heidelberg: Springer. [Google Scholar]
Figure 1.
Map of States of Sudan (from https://en.wikipedia.org/wiki/Geography_of_Sudan (accessed on 13 December 2020)). 1 Khartoum; 2 North Kordofan; 3 Northern; 4 Kassala; 5 Blue Nile; 6 North Darfur; 7 South Darfur; 8 South Kordofan; 9 Gezira; 10 White Nile; 11 River Nile; 12 Red Sea; 13 Gedarif; 14 Sennar; 15 West Darfur; 16 Central Darfur; 17 East Darfur; 18 West Kordofan (merged with South Kordofan in 2005, and re-established in 2013).

Figure 2.
Relative human development index (HDI) (0 = Sudan average) of modern states of Sudan, 1990–2017. States in the same region are denoted by lines of the same color. Data were obtained from Global_Data_Lab (2019).
Figure 2.
Relative human development index (HDI) (0 = Sudan average) of modern states of Sudan, 1990–2017. States in the same region are denoted by lines of the same color. Data were obtained from Global_Data_Lab (2019).

Figure 3.
University attendance rates for rural and urban 19–21-year-olds, by region.

Figure 4.
University attendance rates by sex of 19–21-year-olds, by region.

Figure 5.
University attendance rates by source of income (self-employed or salaried) for 19–21-year-olds, by region.
Figure 5.
University attendance rates by source of income (self-employed or salaried) for 19–21-year-olds, by region.

Figure 6.
University attendance rates by income quartile for 19–21 year olds, by region.

Figure 7.
University attendance rates by father’s education level for 19–21-year-olds, by region.

Figure 8.
University attendance rates by mother’s education for 19–21-year-olds, by region.

Figure 9.
University attendance rates for 19–21-year-olds without/with electricity, by region.

Figure 10.
University attendance rates for 19–21-year-olds without or with computer, by region.

Figure 11.
Percentages of bachelor’s and diploma students by region 2016–2017.

Figure 12.
Male/female proportions by home region, incoming bachelor’s students 2016–2017.

Figure 13.
Male/female proportions for incoming diploma students 2016–2017.

Figure 14.
Academic rank by home region, incoming 2016–2017 bachelor’s students.

Figure 15.
Academic rank by home region, incoming diploma students 2016–2017.

Figure 16.
Percentage of bachelor’s (2016–2017) applicants receiving first, second, or third choice by home region for different rank percentile ranges (0–25%, 50–75%, 90–100%).
Figure 16.
Percentage of bachelor’s (2016–2017) applicants receiving first, second, or third choice by home region for different rank percentile ranges (0–25%, 50–75%, 90–100%).

Figure 17.
Percentage of diploma (2016–2017) applicants receiving first, second, or third choice by Home region for different rank percentile ranges (0–25%, 50–75%, 90–100%).
Figure 17.
Percentage of diploma (2016–2017) applicants receiving first, second, or third choice by Home region for different rank percentile ranges (0–25%, 50–75%, 90–100%).

Figure 18.
Double-decker plot showing the proportion of students attending universities in different regions according to home region for below average (<) and above average (> 2016–2017 incoming bachelor’s students.
Figure 18.
Double-decker plot showing the proportion of students attending universities in different regions according to home region for below average (<) and above average (> 2016–2017 incoming bachelor’s students.

Figure 19.
Double-decker plot showing the regional diversity of universities in different regions for 2016–2017 incoming male and female bachelor’s students.
Figure 19.
Double-decker plot showing the regional diversity of universities in different regions for 2016–2017 incoming male and female bachelor’s students.

Figure 20.
Double-decker plot showing the regional diversity of universities in different regions for 2016–2017 incoming male and female diploma students.
Figure 20.
Double-decker plot showing the regional diversity of universities in different regions for 2016–2017 incoming male and female diploma students.

Figure 21.
Comparison of geographic diversity of lower-ranking students (below 75th percentile) versus higher ranking students (above 75th percentile) that entered bachelor’s programs in (2016–2017), for selected universities in Khartoum (double-decker plot).
Figure 21.
Comparison of geographic diversity of lower-ranking students (below 75th percentile) versus higher ranking students (above 75th percentile) that entered bachelor’s programs in (2016–2017), for selected universities in Khartoum (double-decker plot).

Figure 22.
Double-decker plot of department category distributions by home region, for entering female and male bachelor’s students in the bottom three quartiles of academic ranking.
Figure 22.
Double-decker plot of department category distributions by home region, for entering female and male bachelor’s students in the bottom three quartiles of academic ranking.

Figure 23.
Double-decker plot of department category distributions by home region, for entering female and male bachelor’s students in the top quartile of academic ranking.
Figure 23.
Double-decker plot of department category distributions by home region, for entering female and male bachelor’s students in the top quartile of academic ranking.

Figure 24.
Spine plot of departmental enrollments (by category) by university region for bachelor’s students (2016–2017).
Figure 24.
Spine plot of departmental enrollments (by category) by university region for bachelor’s students (2016–2017).

Figure 25.
Double-decker plot showing proportions of bachelor’s students in education who study in their home regions, for lowest-quartile and top three quartile students.
Figure 25.
Double-decker plot showing proportions of bachelor’s students in education who study in their home regions, for lowest-quartile and top three quartile students.

Figure 26.
Double-decker plot showing proportions of bachelor’s students in business who study in their home regions, for lowest-quartile and top three quartile students.
Figure 26.
Double-decker plot showing proportions of bachelor’s students in business who study in their home regions, for lowest-quartile and top three quartile students.

Figure 27.
Double-decker plot of department category distributions by home region, for entering female and male diploma students.
Figure 27.
Double-decker plot of department category distributions by home region, for entering female and male diploma students.

Figure 28.
Spine plot departmental enrollments (by category) by sex for university region for diploma students (2016–2017).
Figure 28.
Spine plot departmental enrollments (by category) by sex for university region for diploma students (2016–2017).


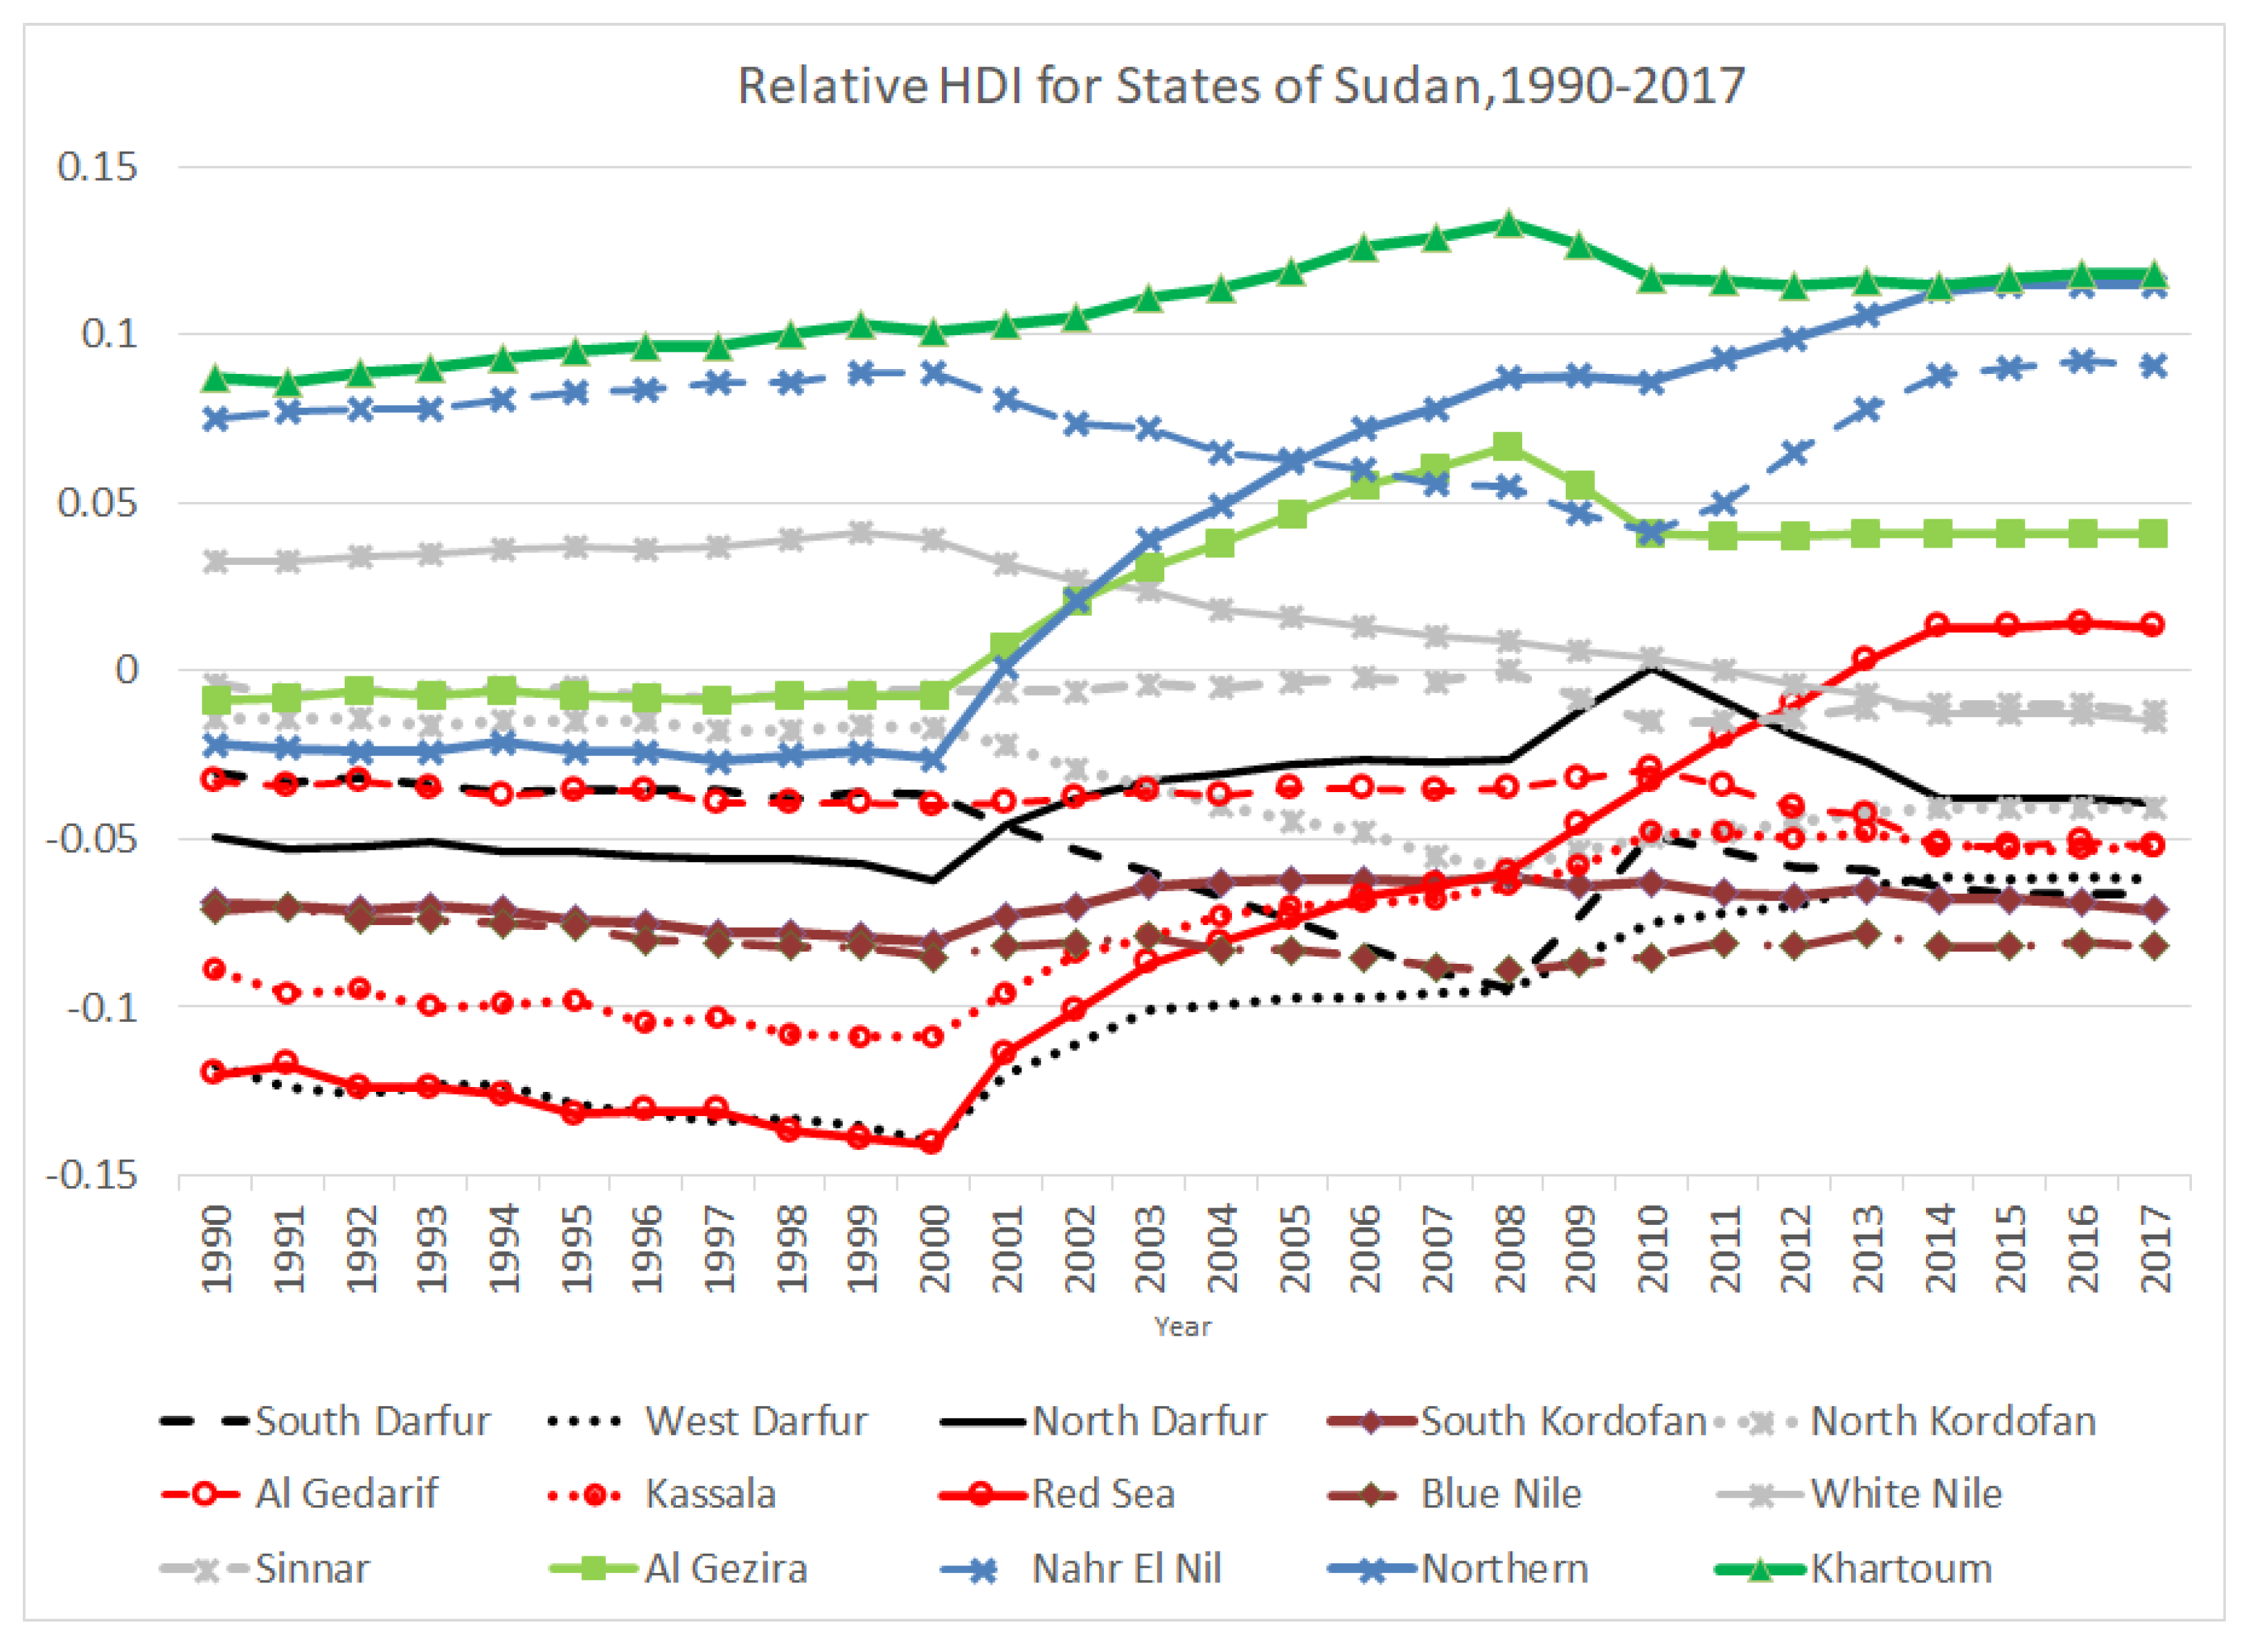
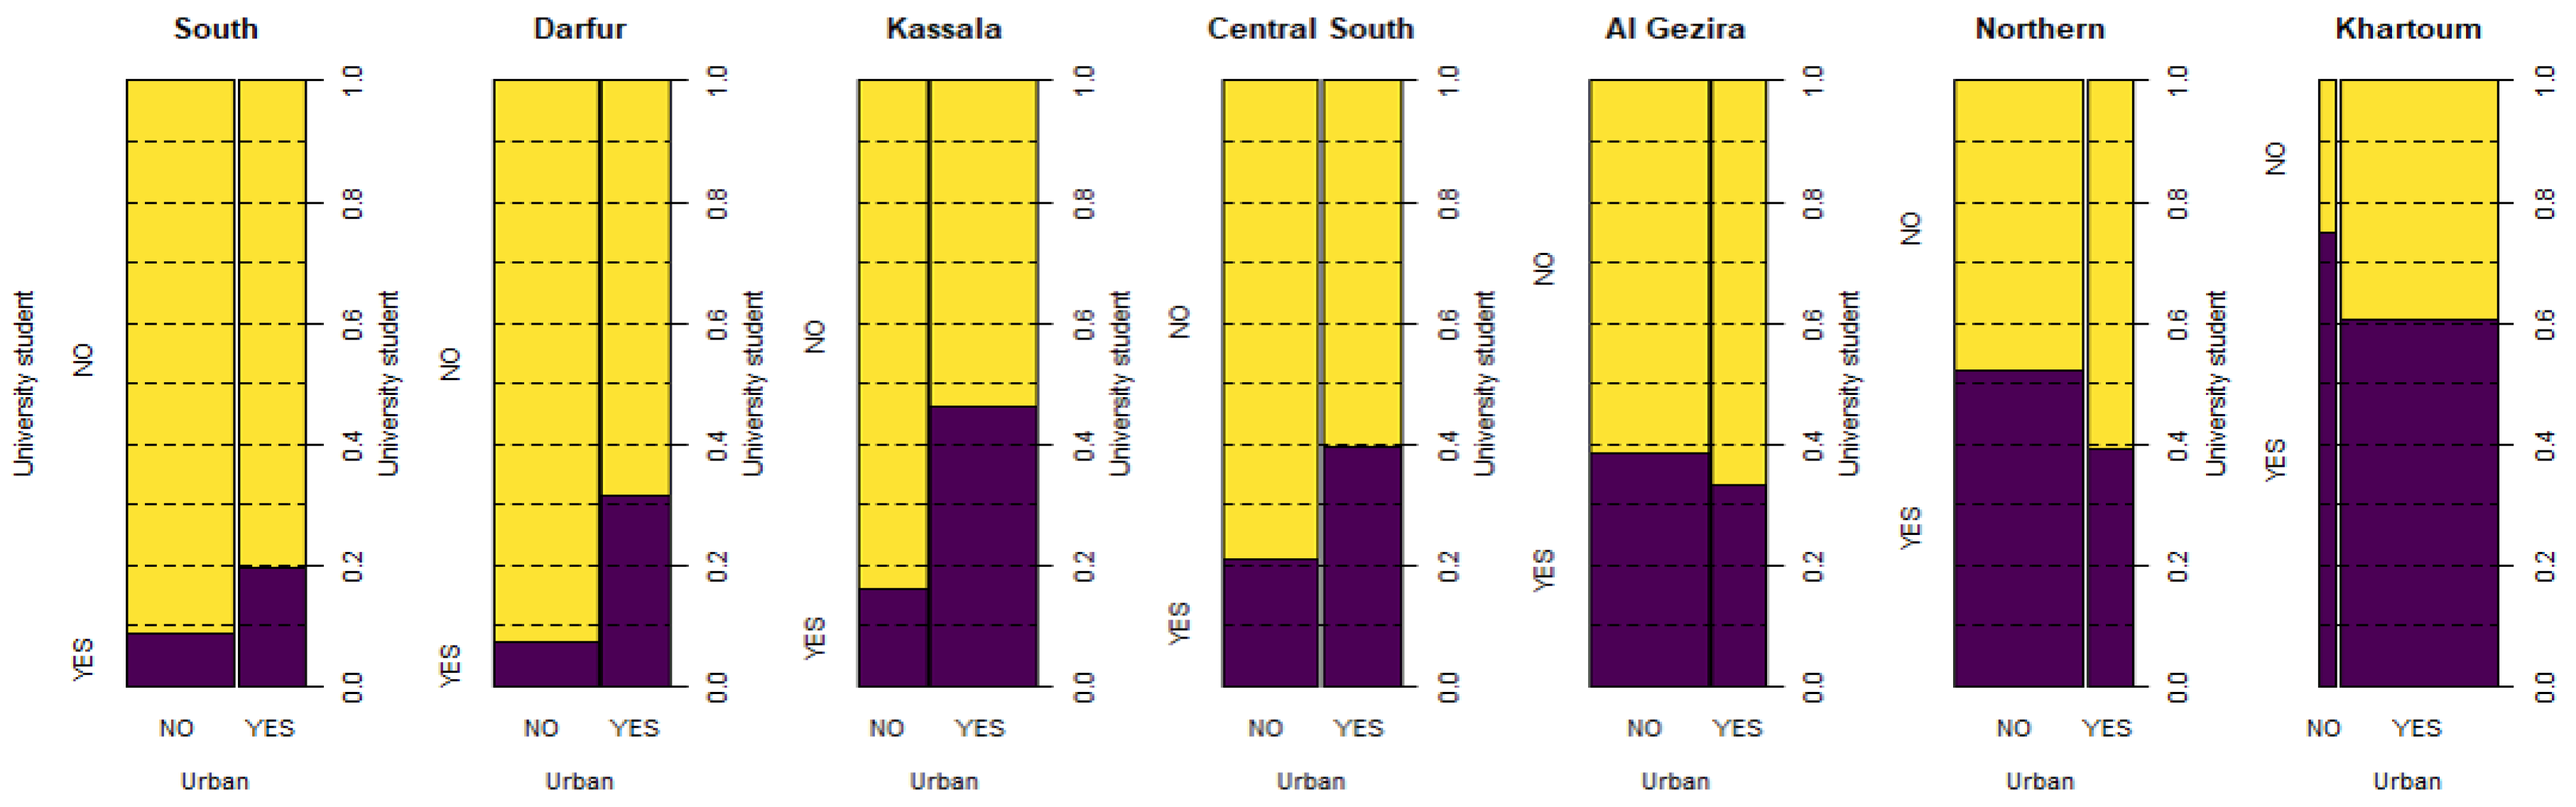
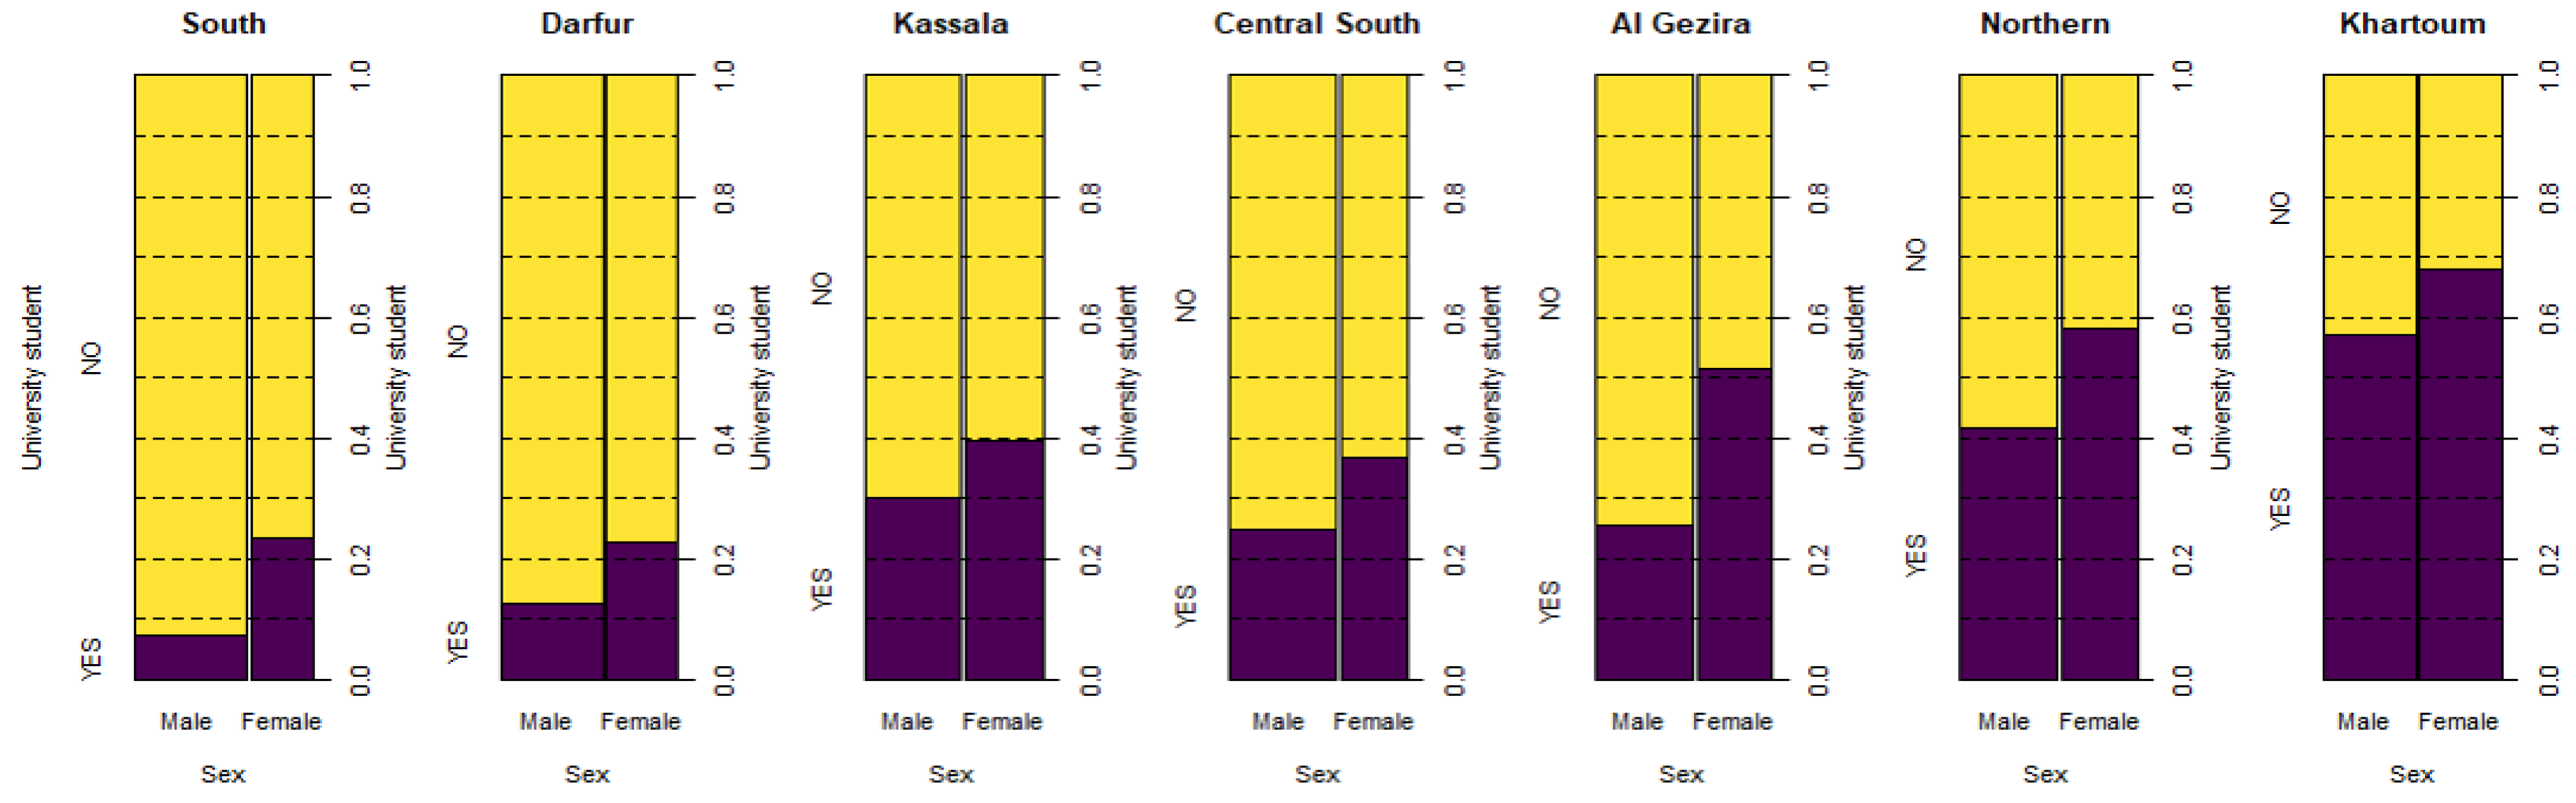
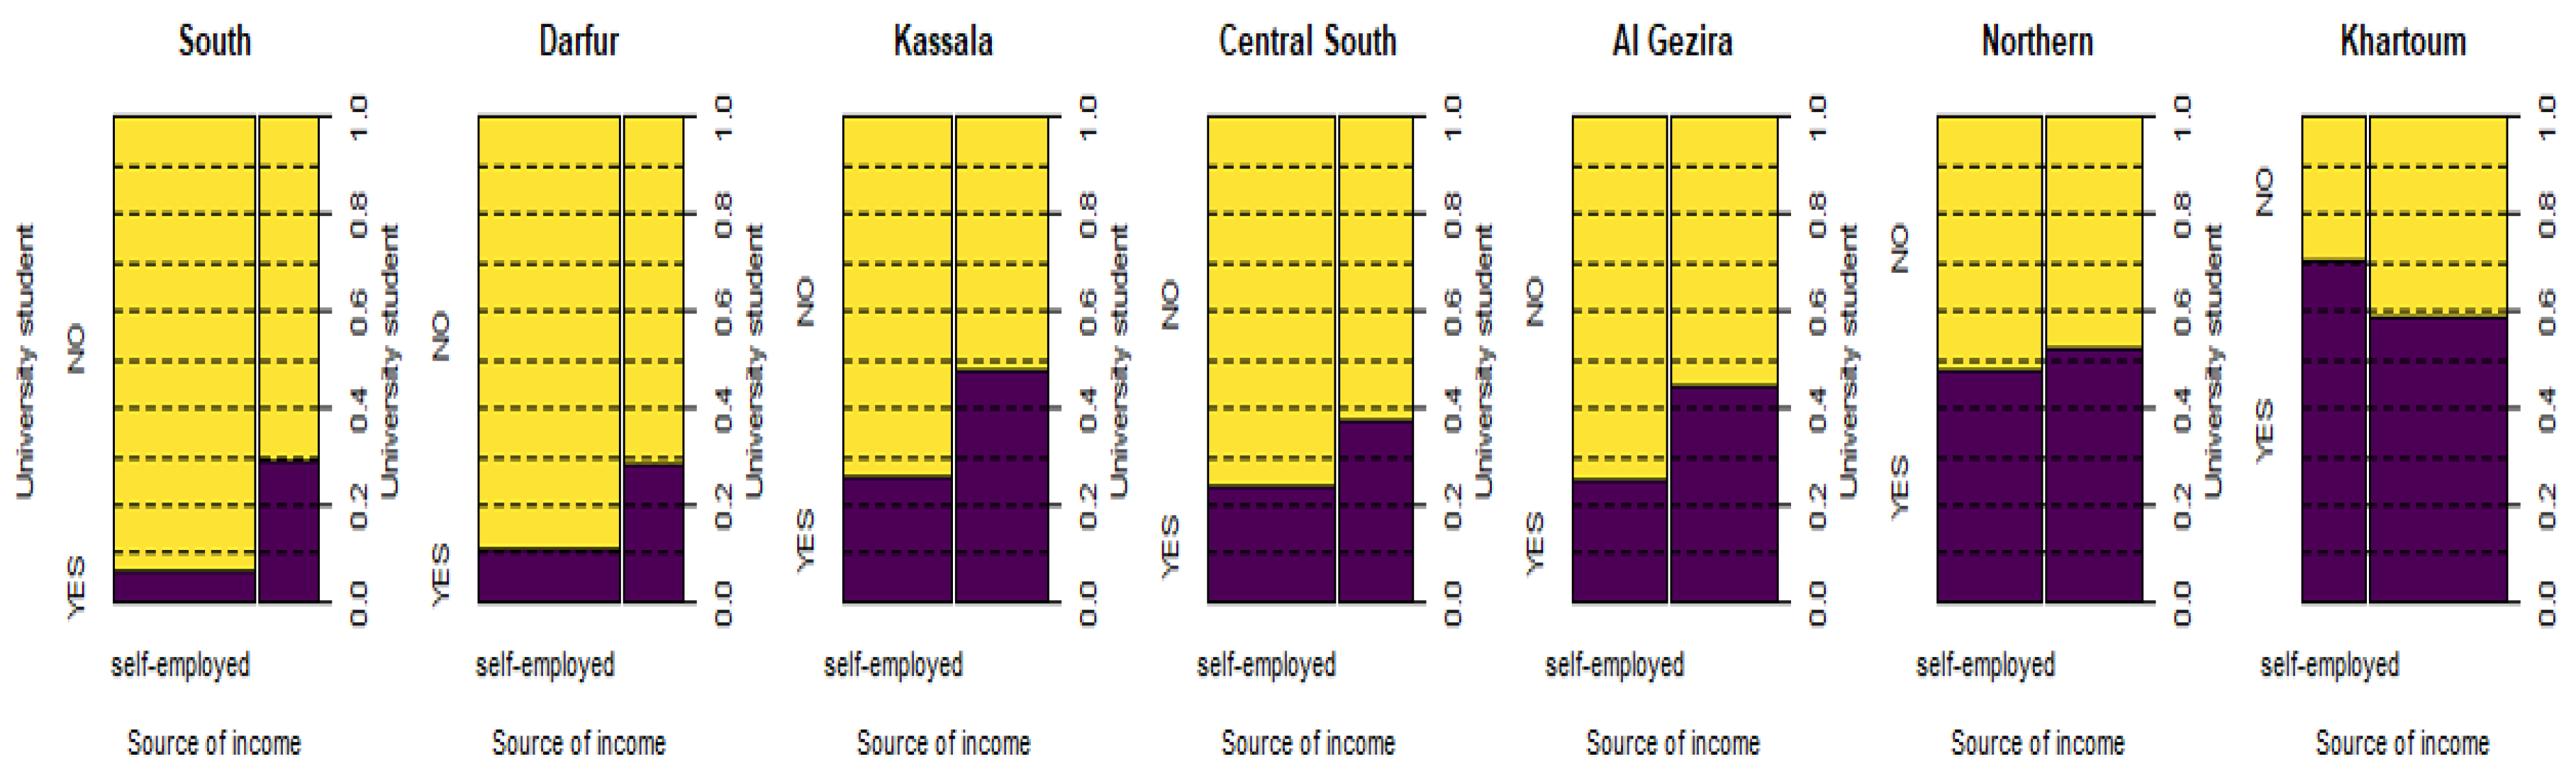
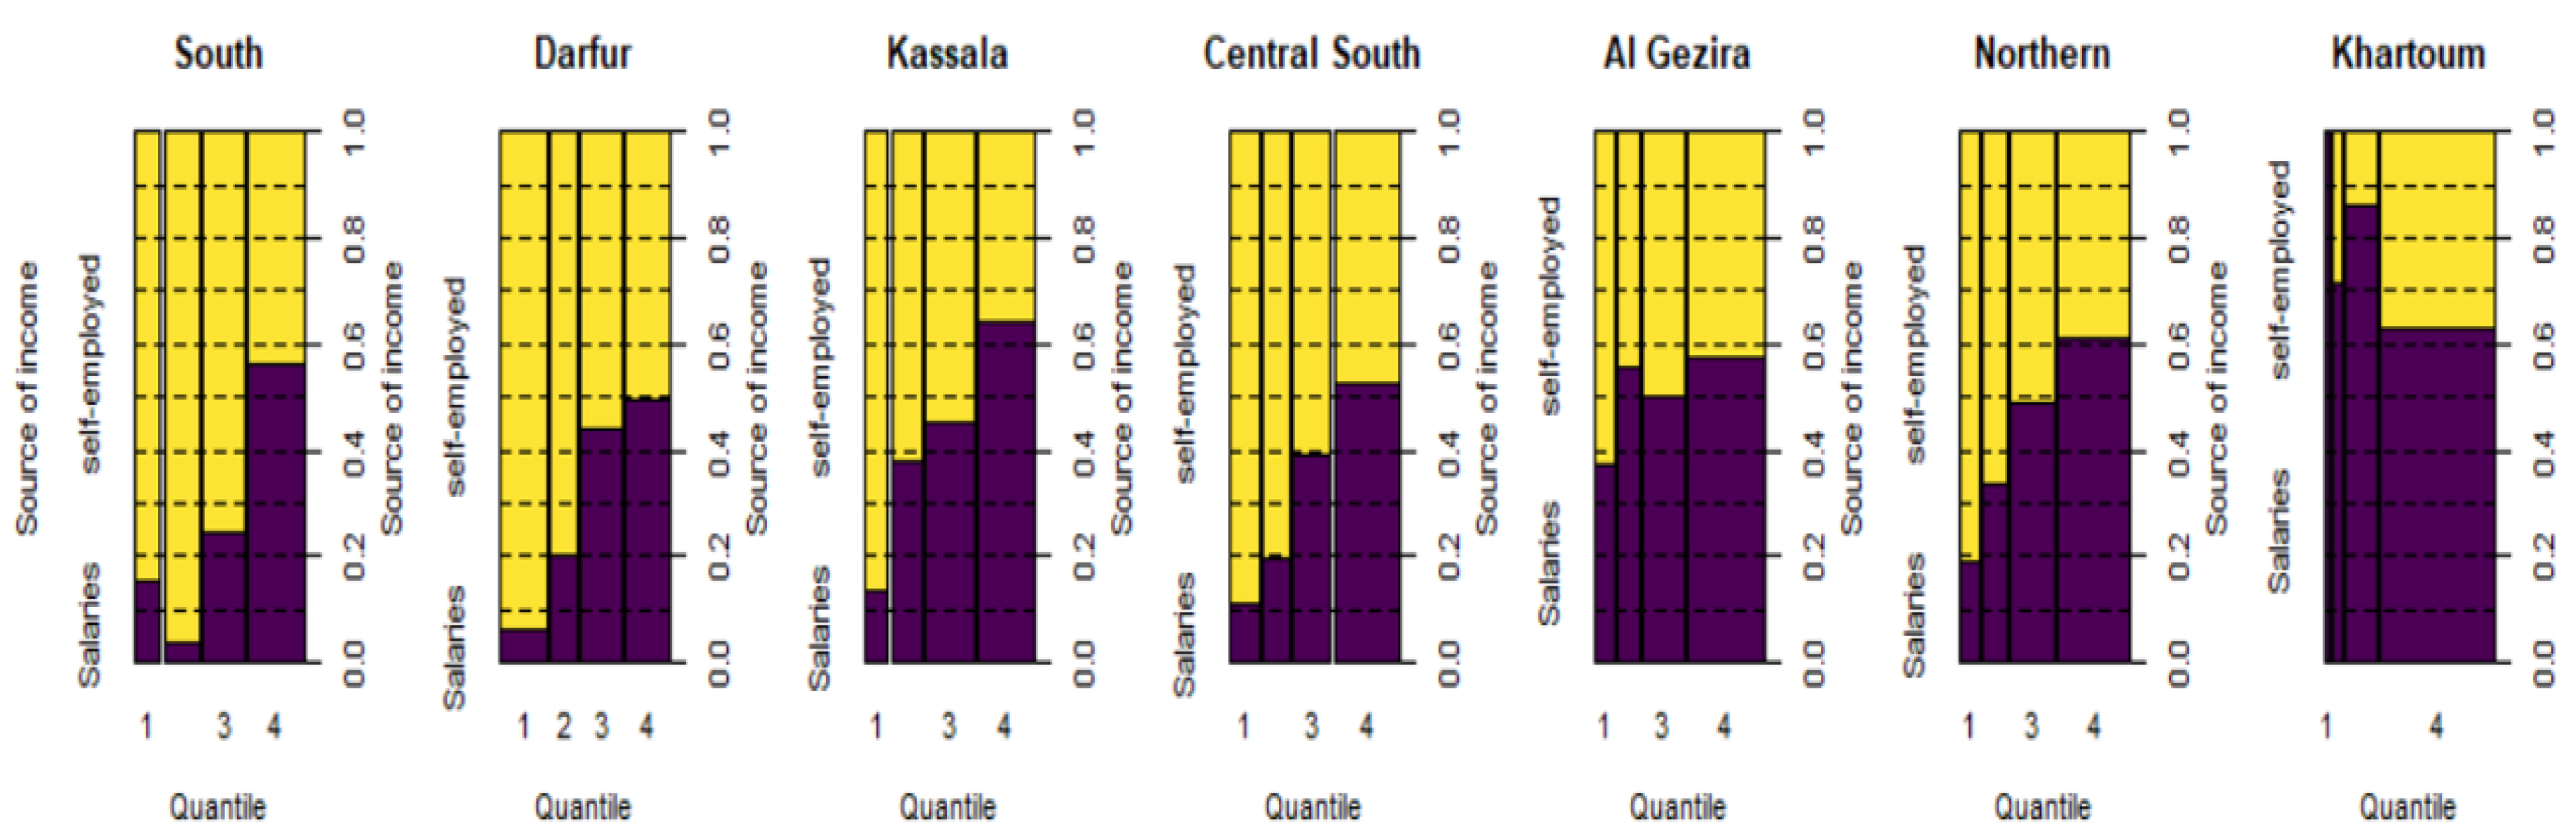
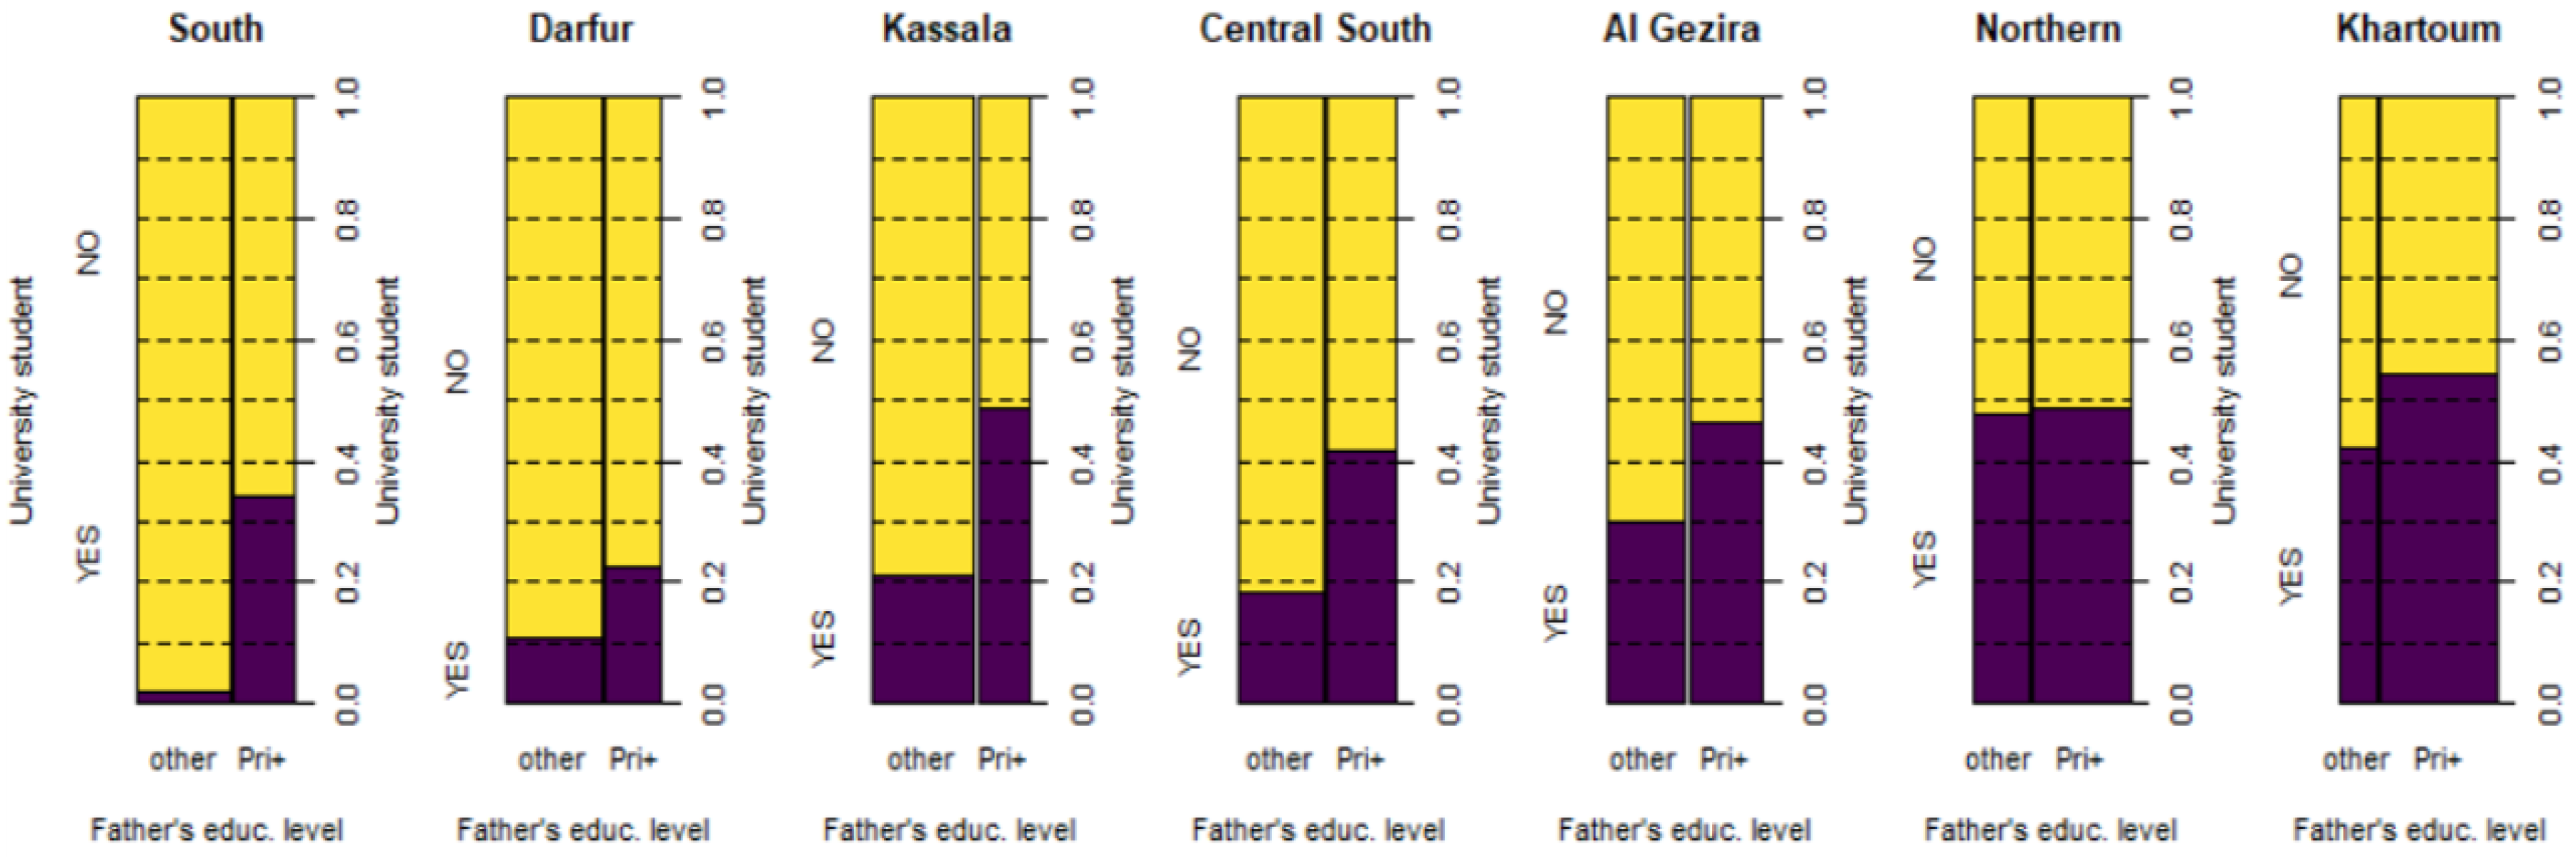
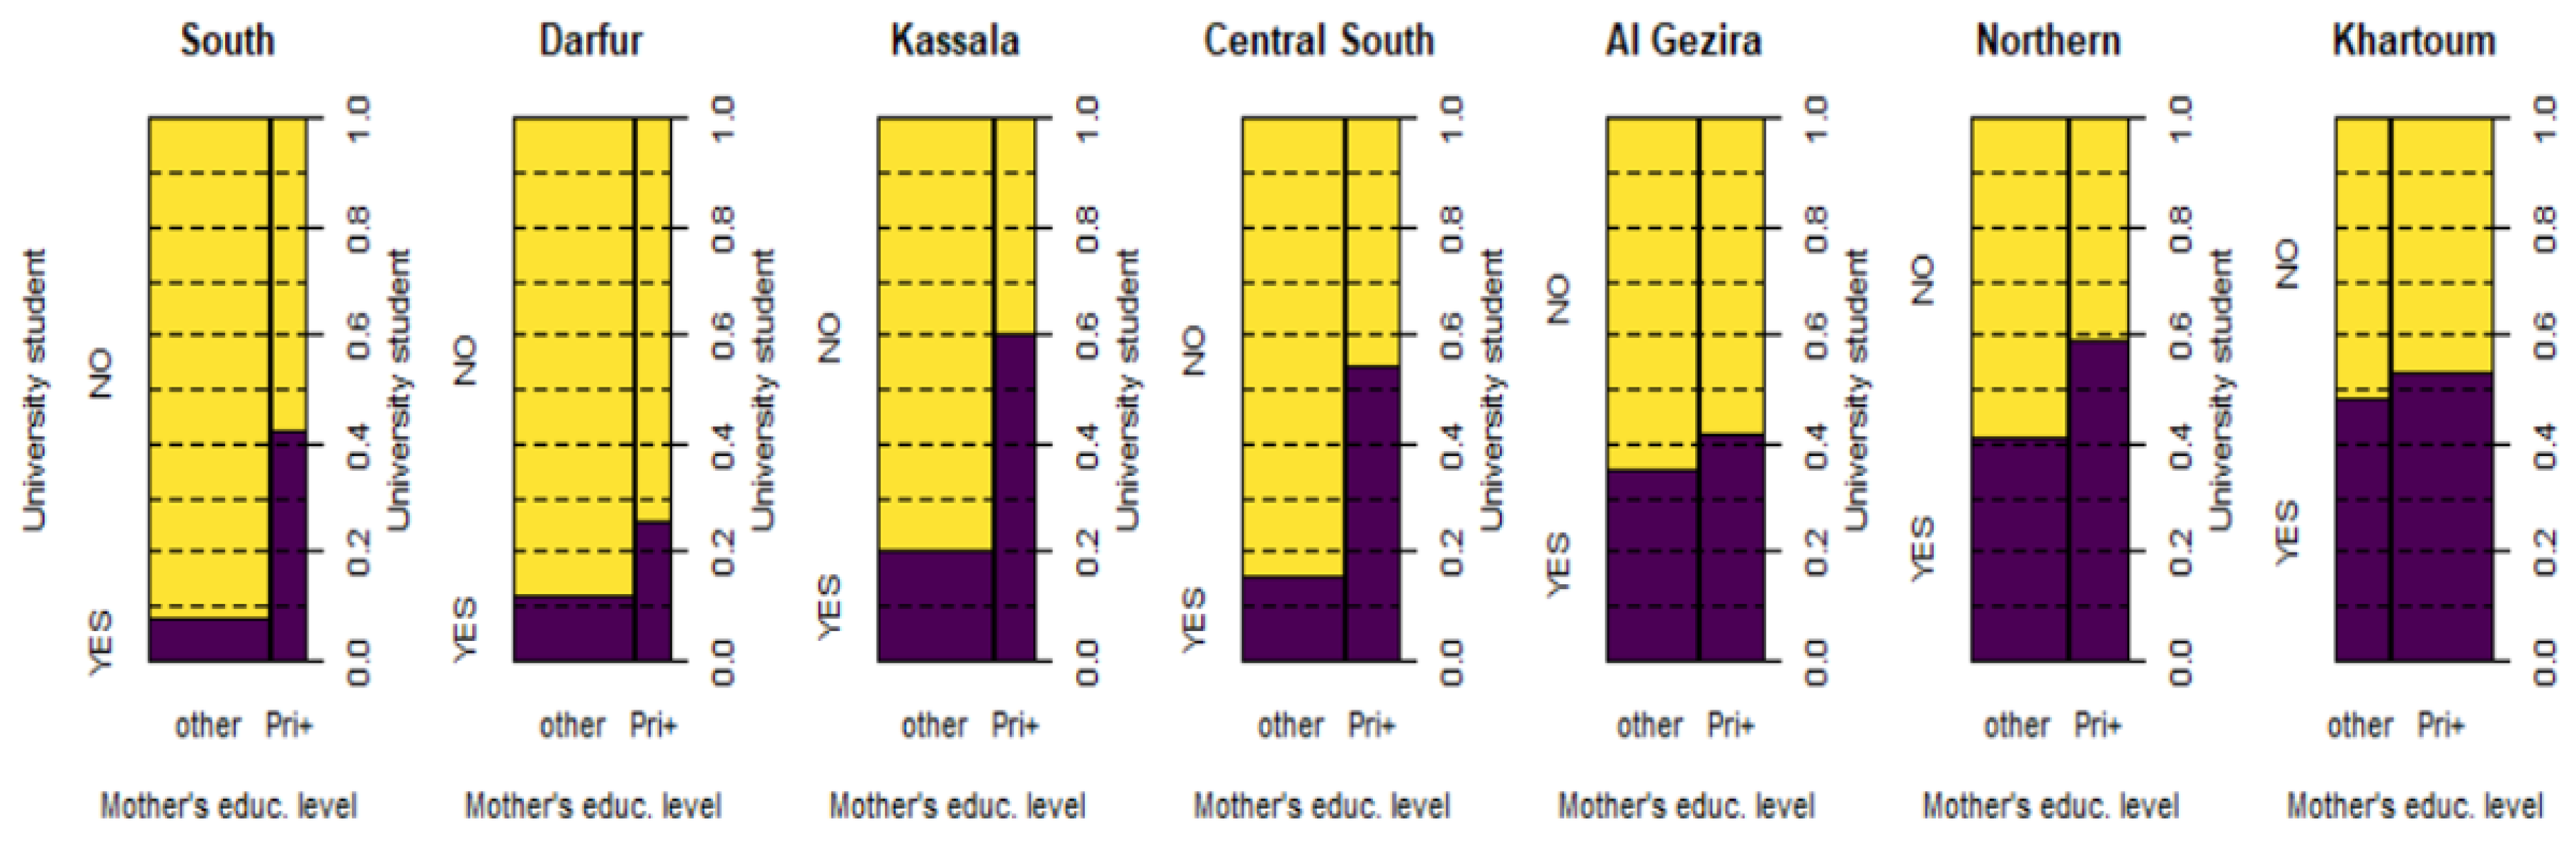
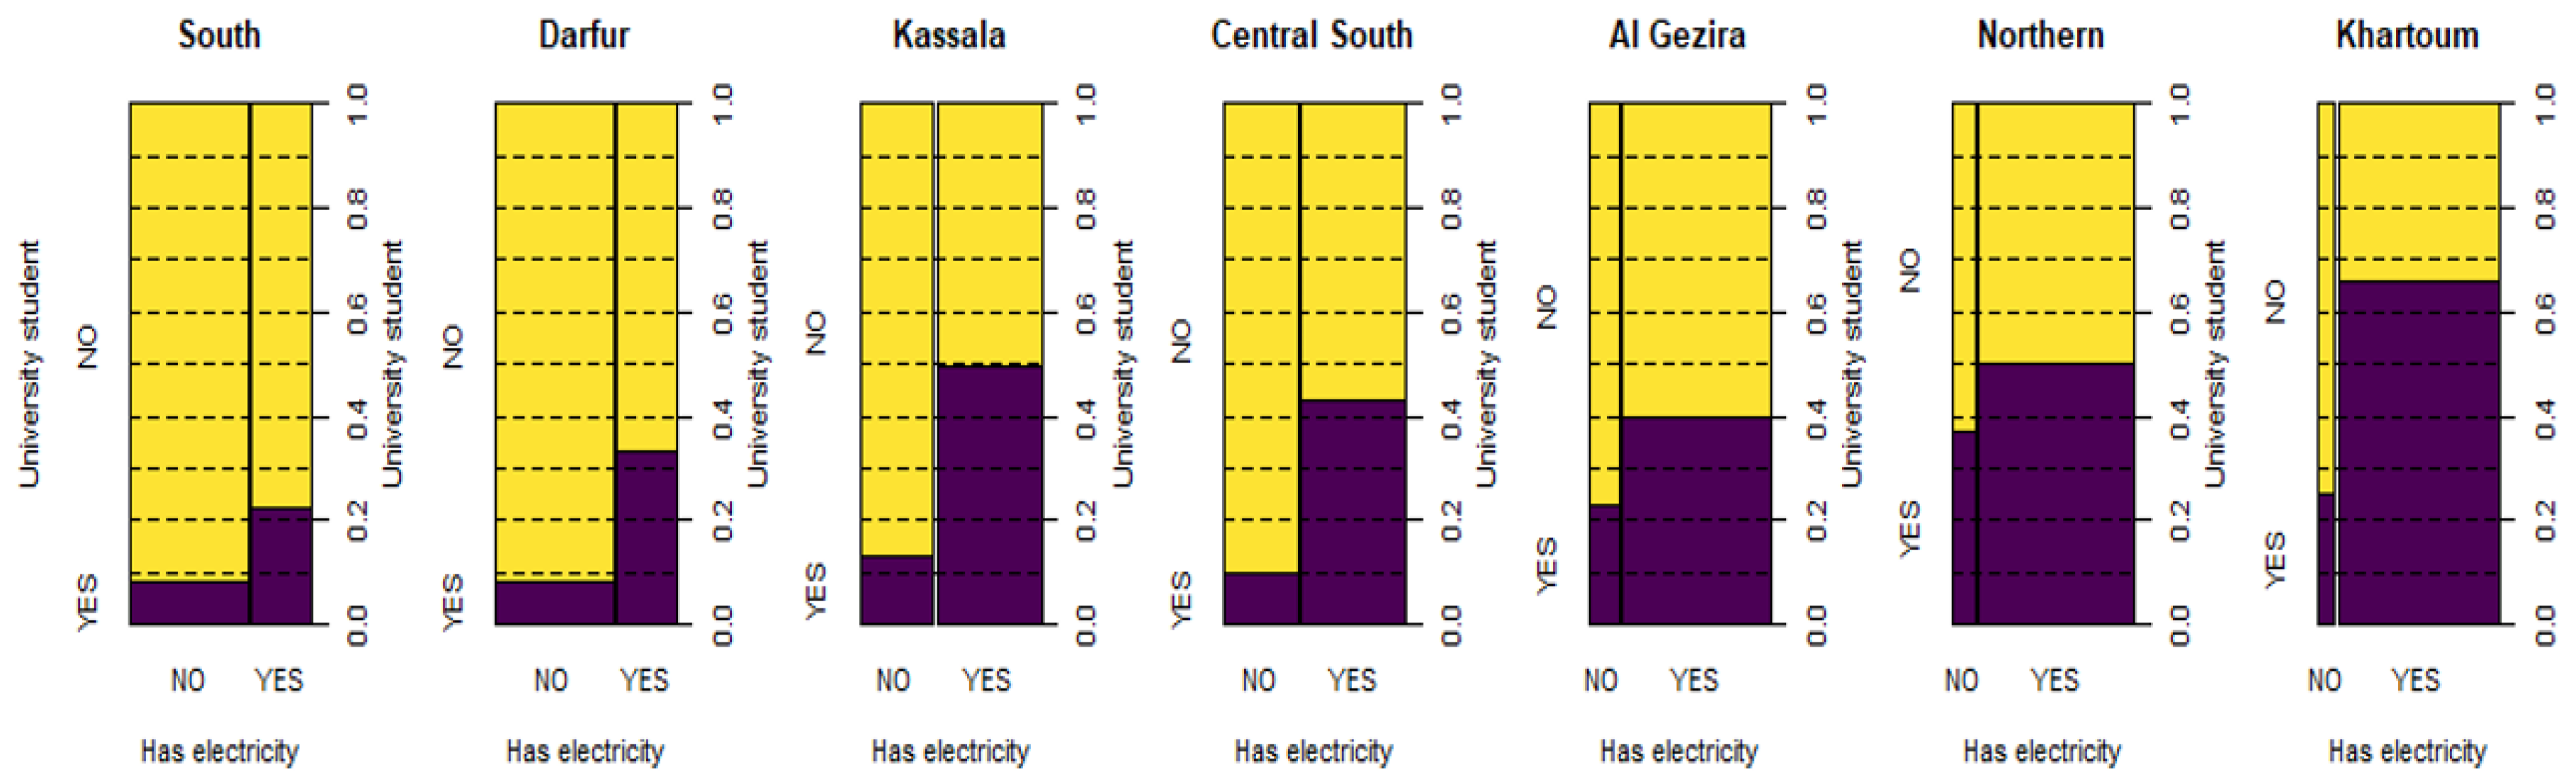
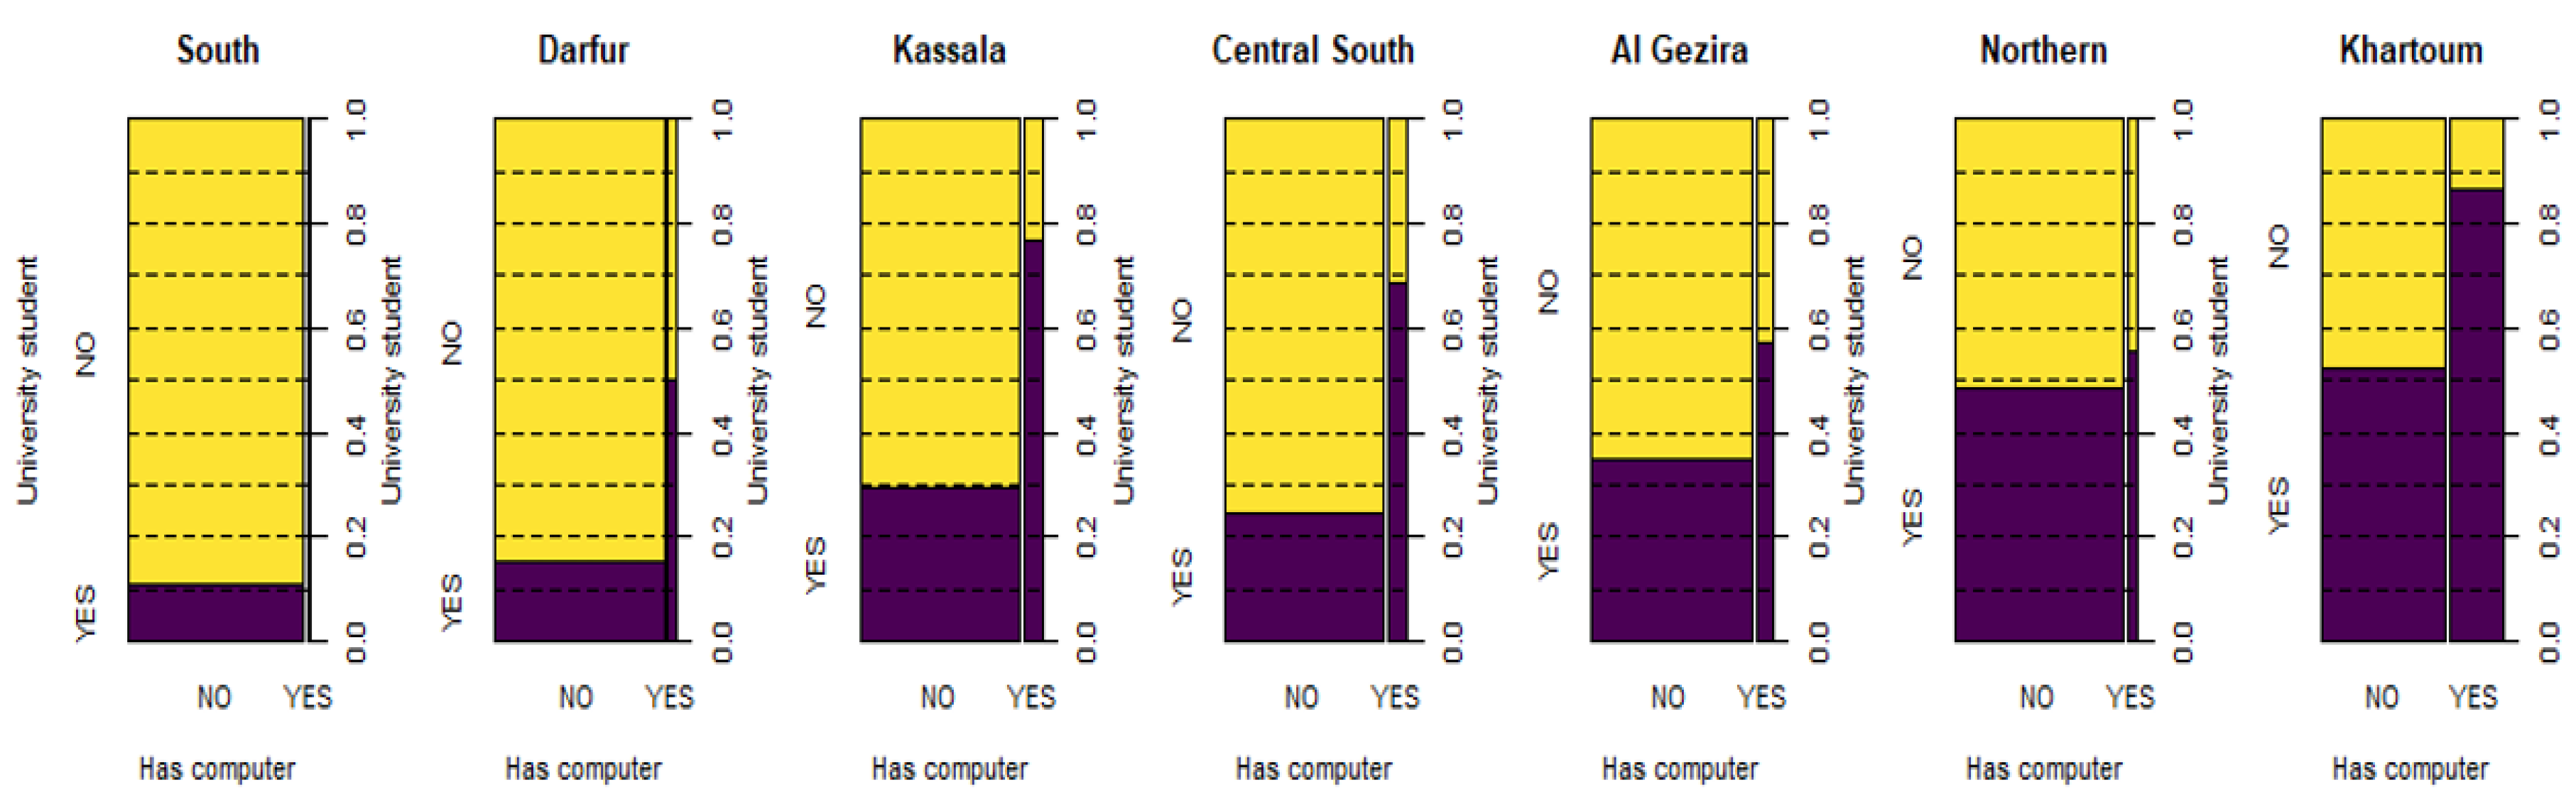
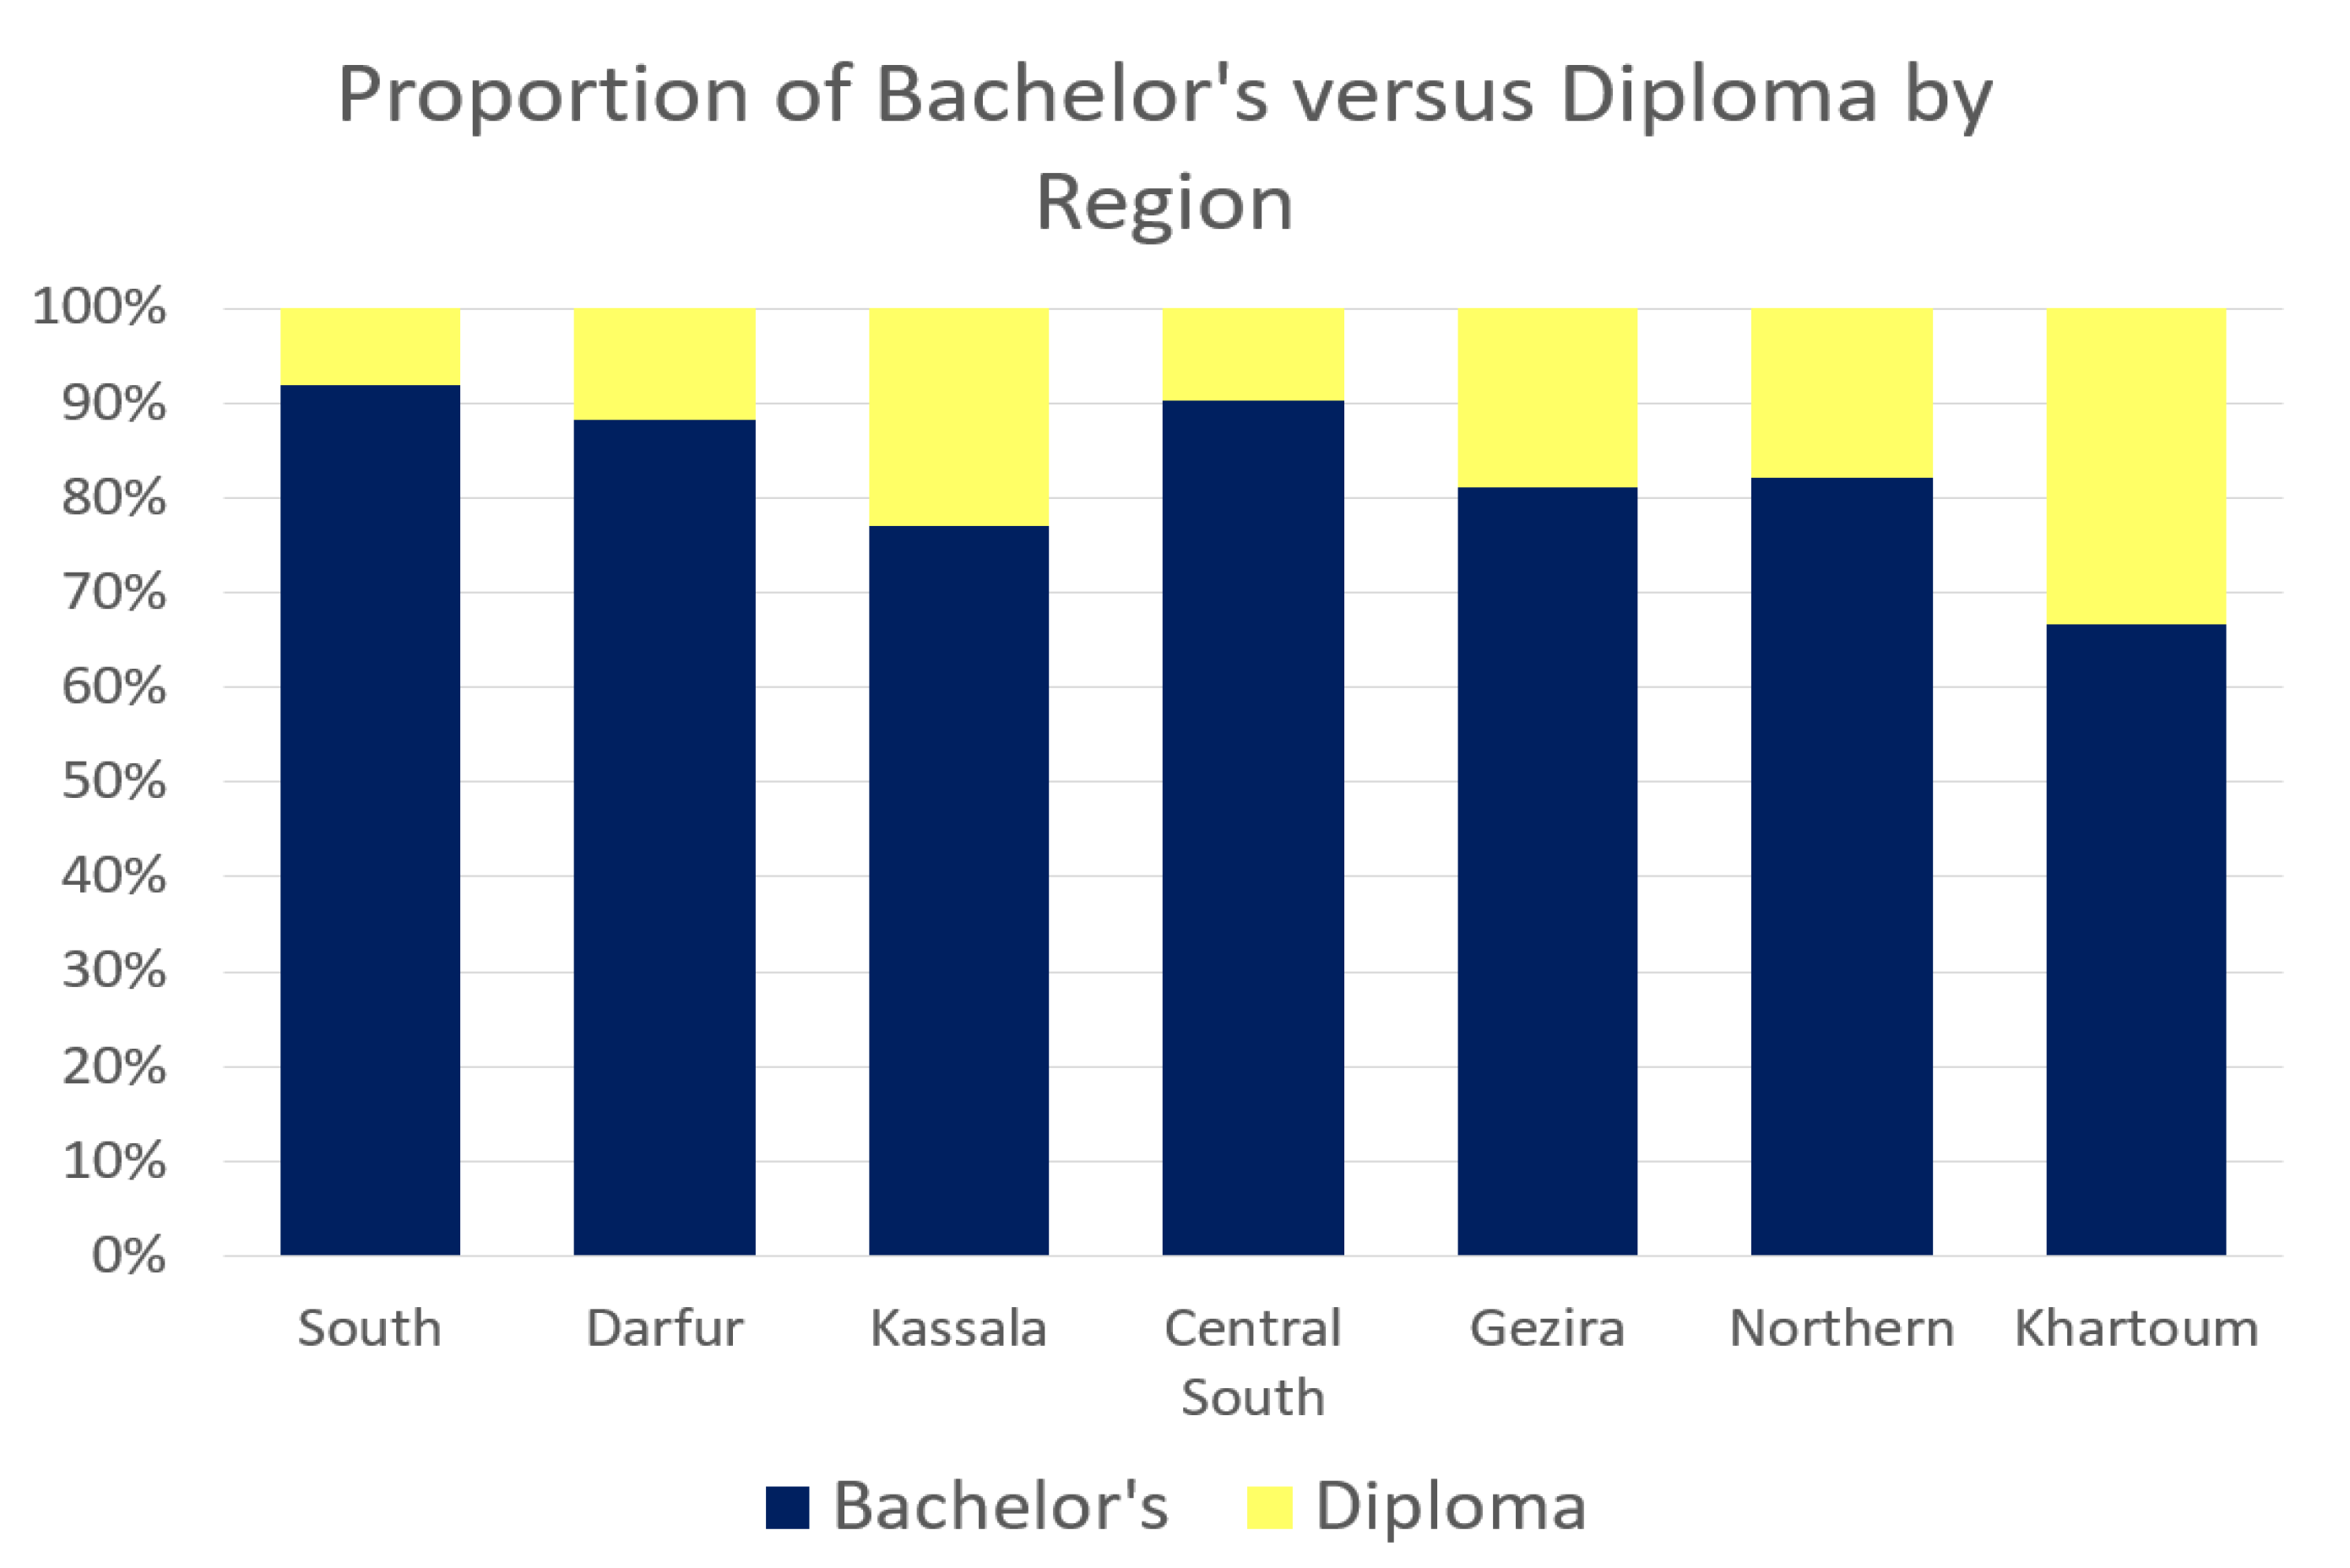
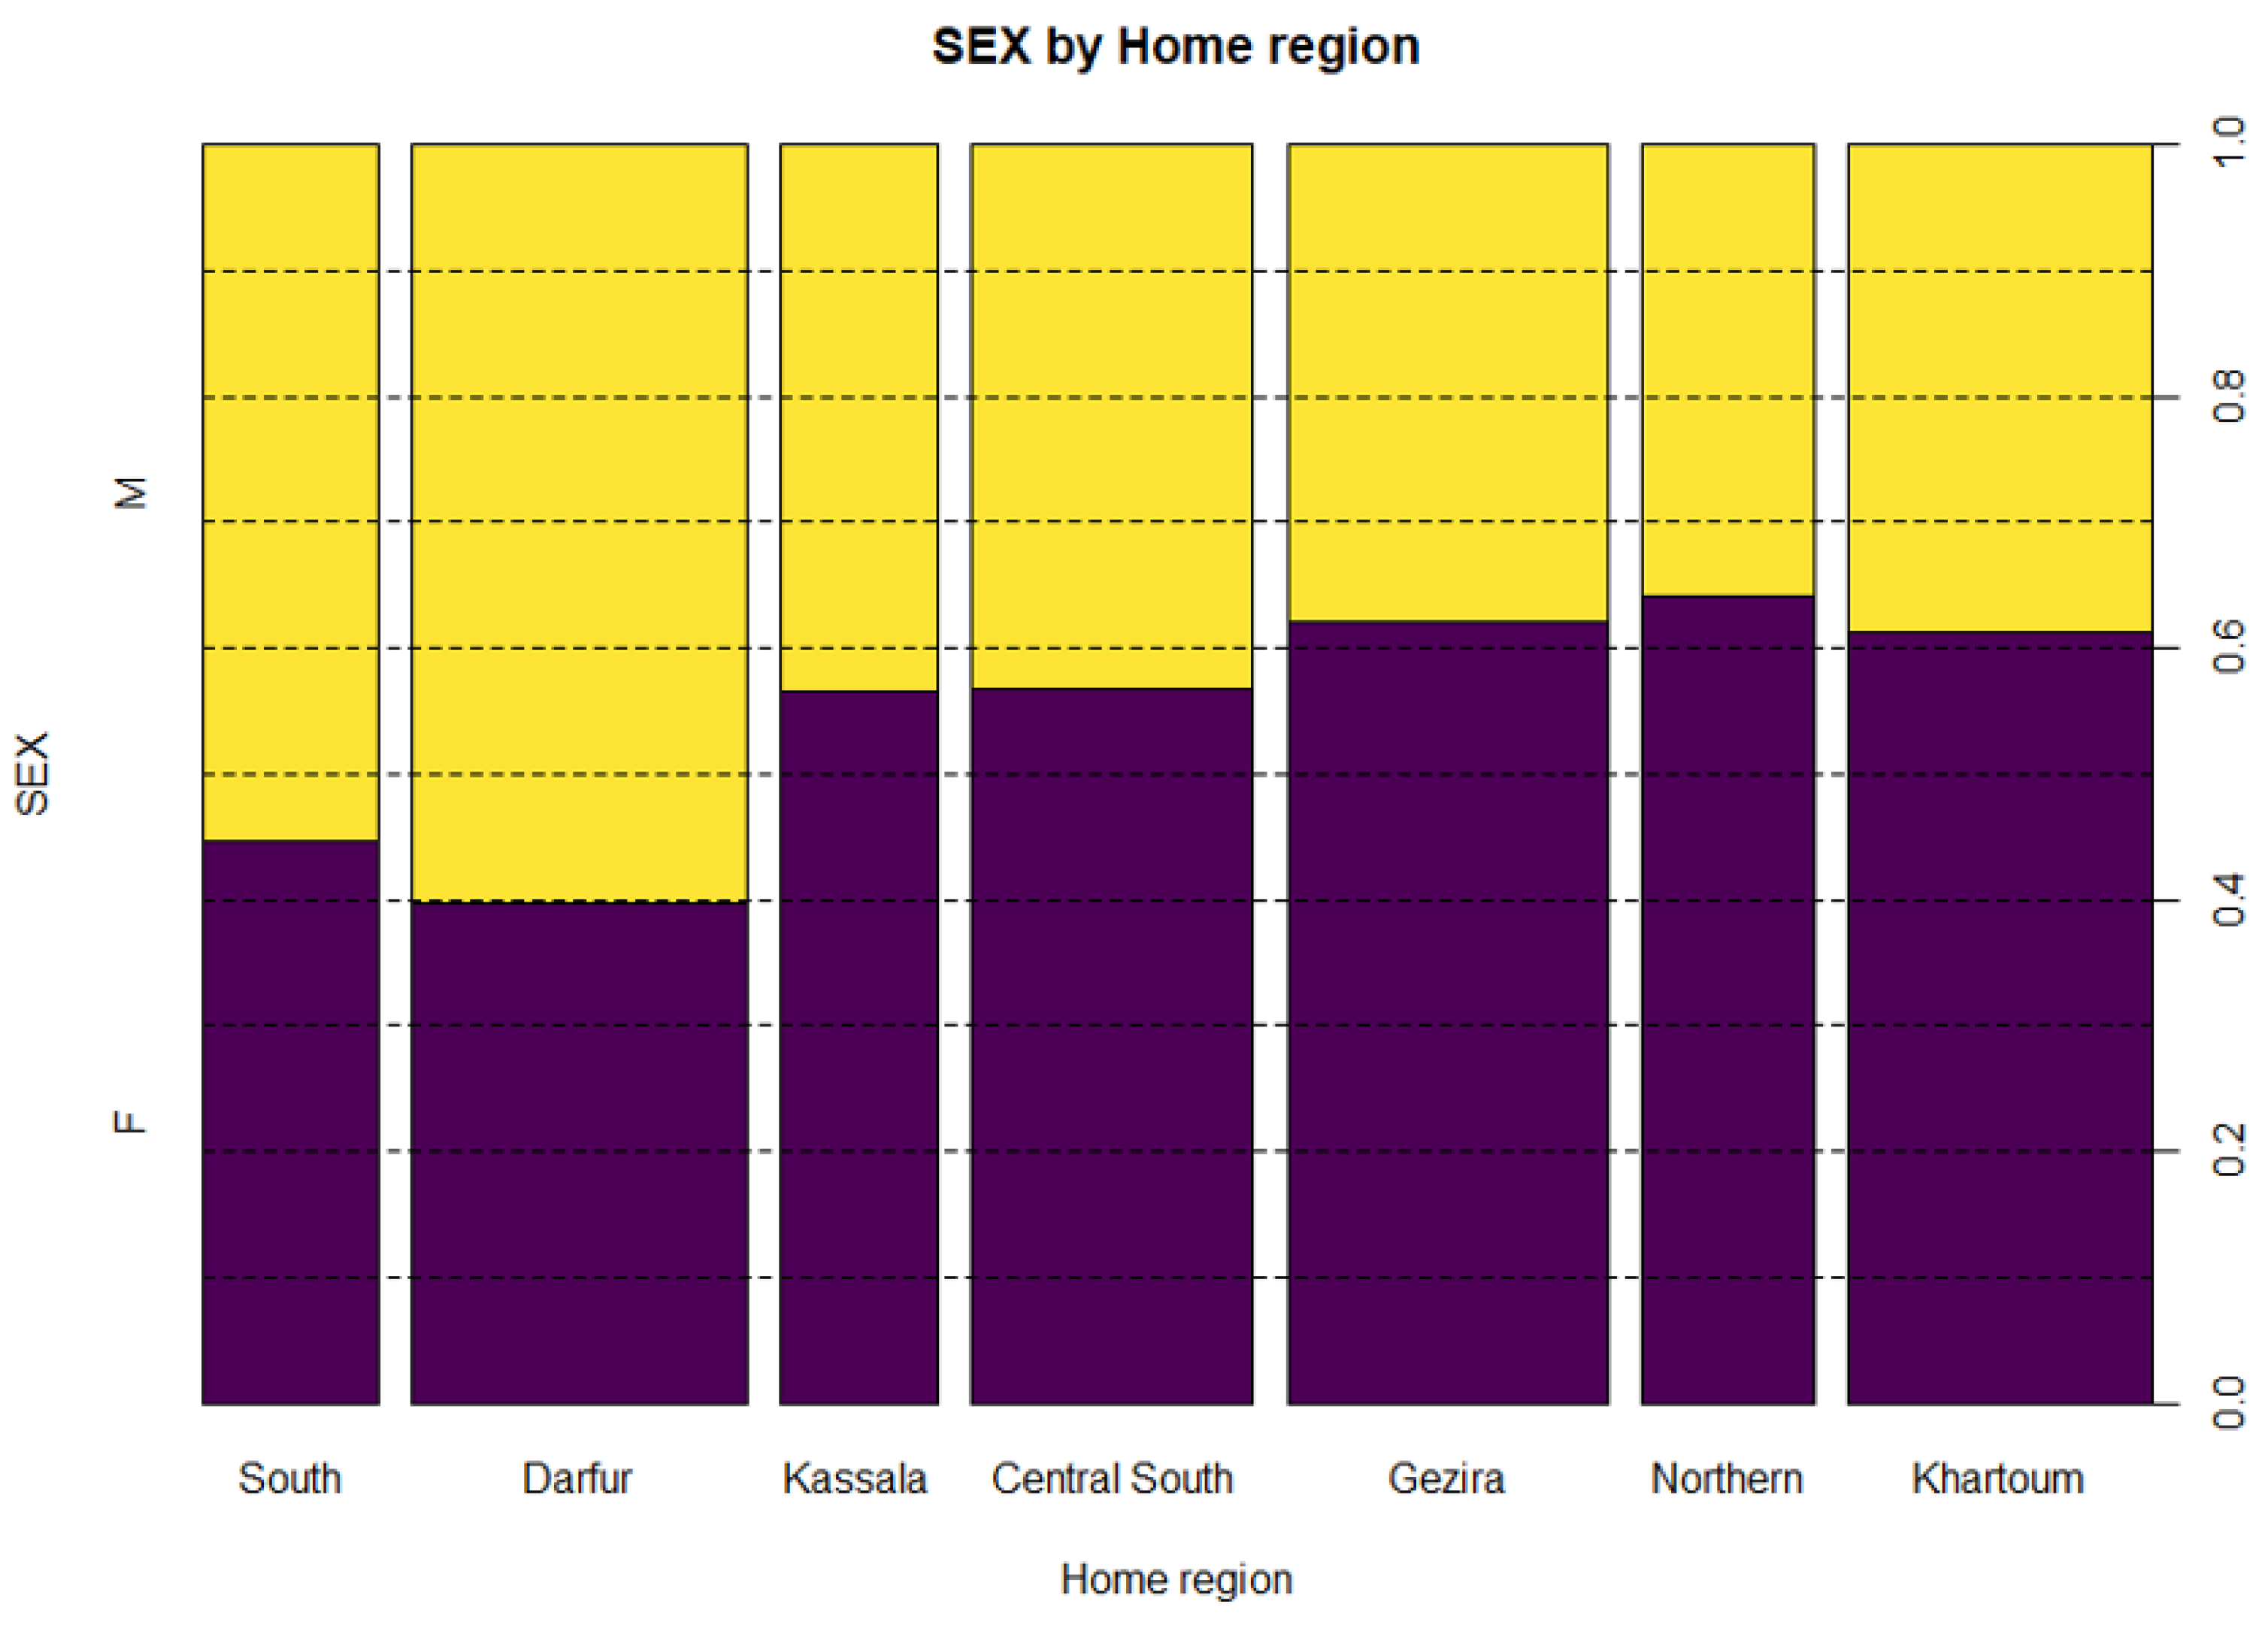
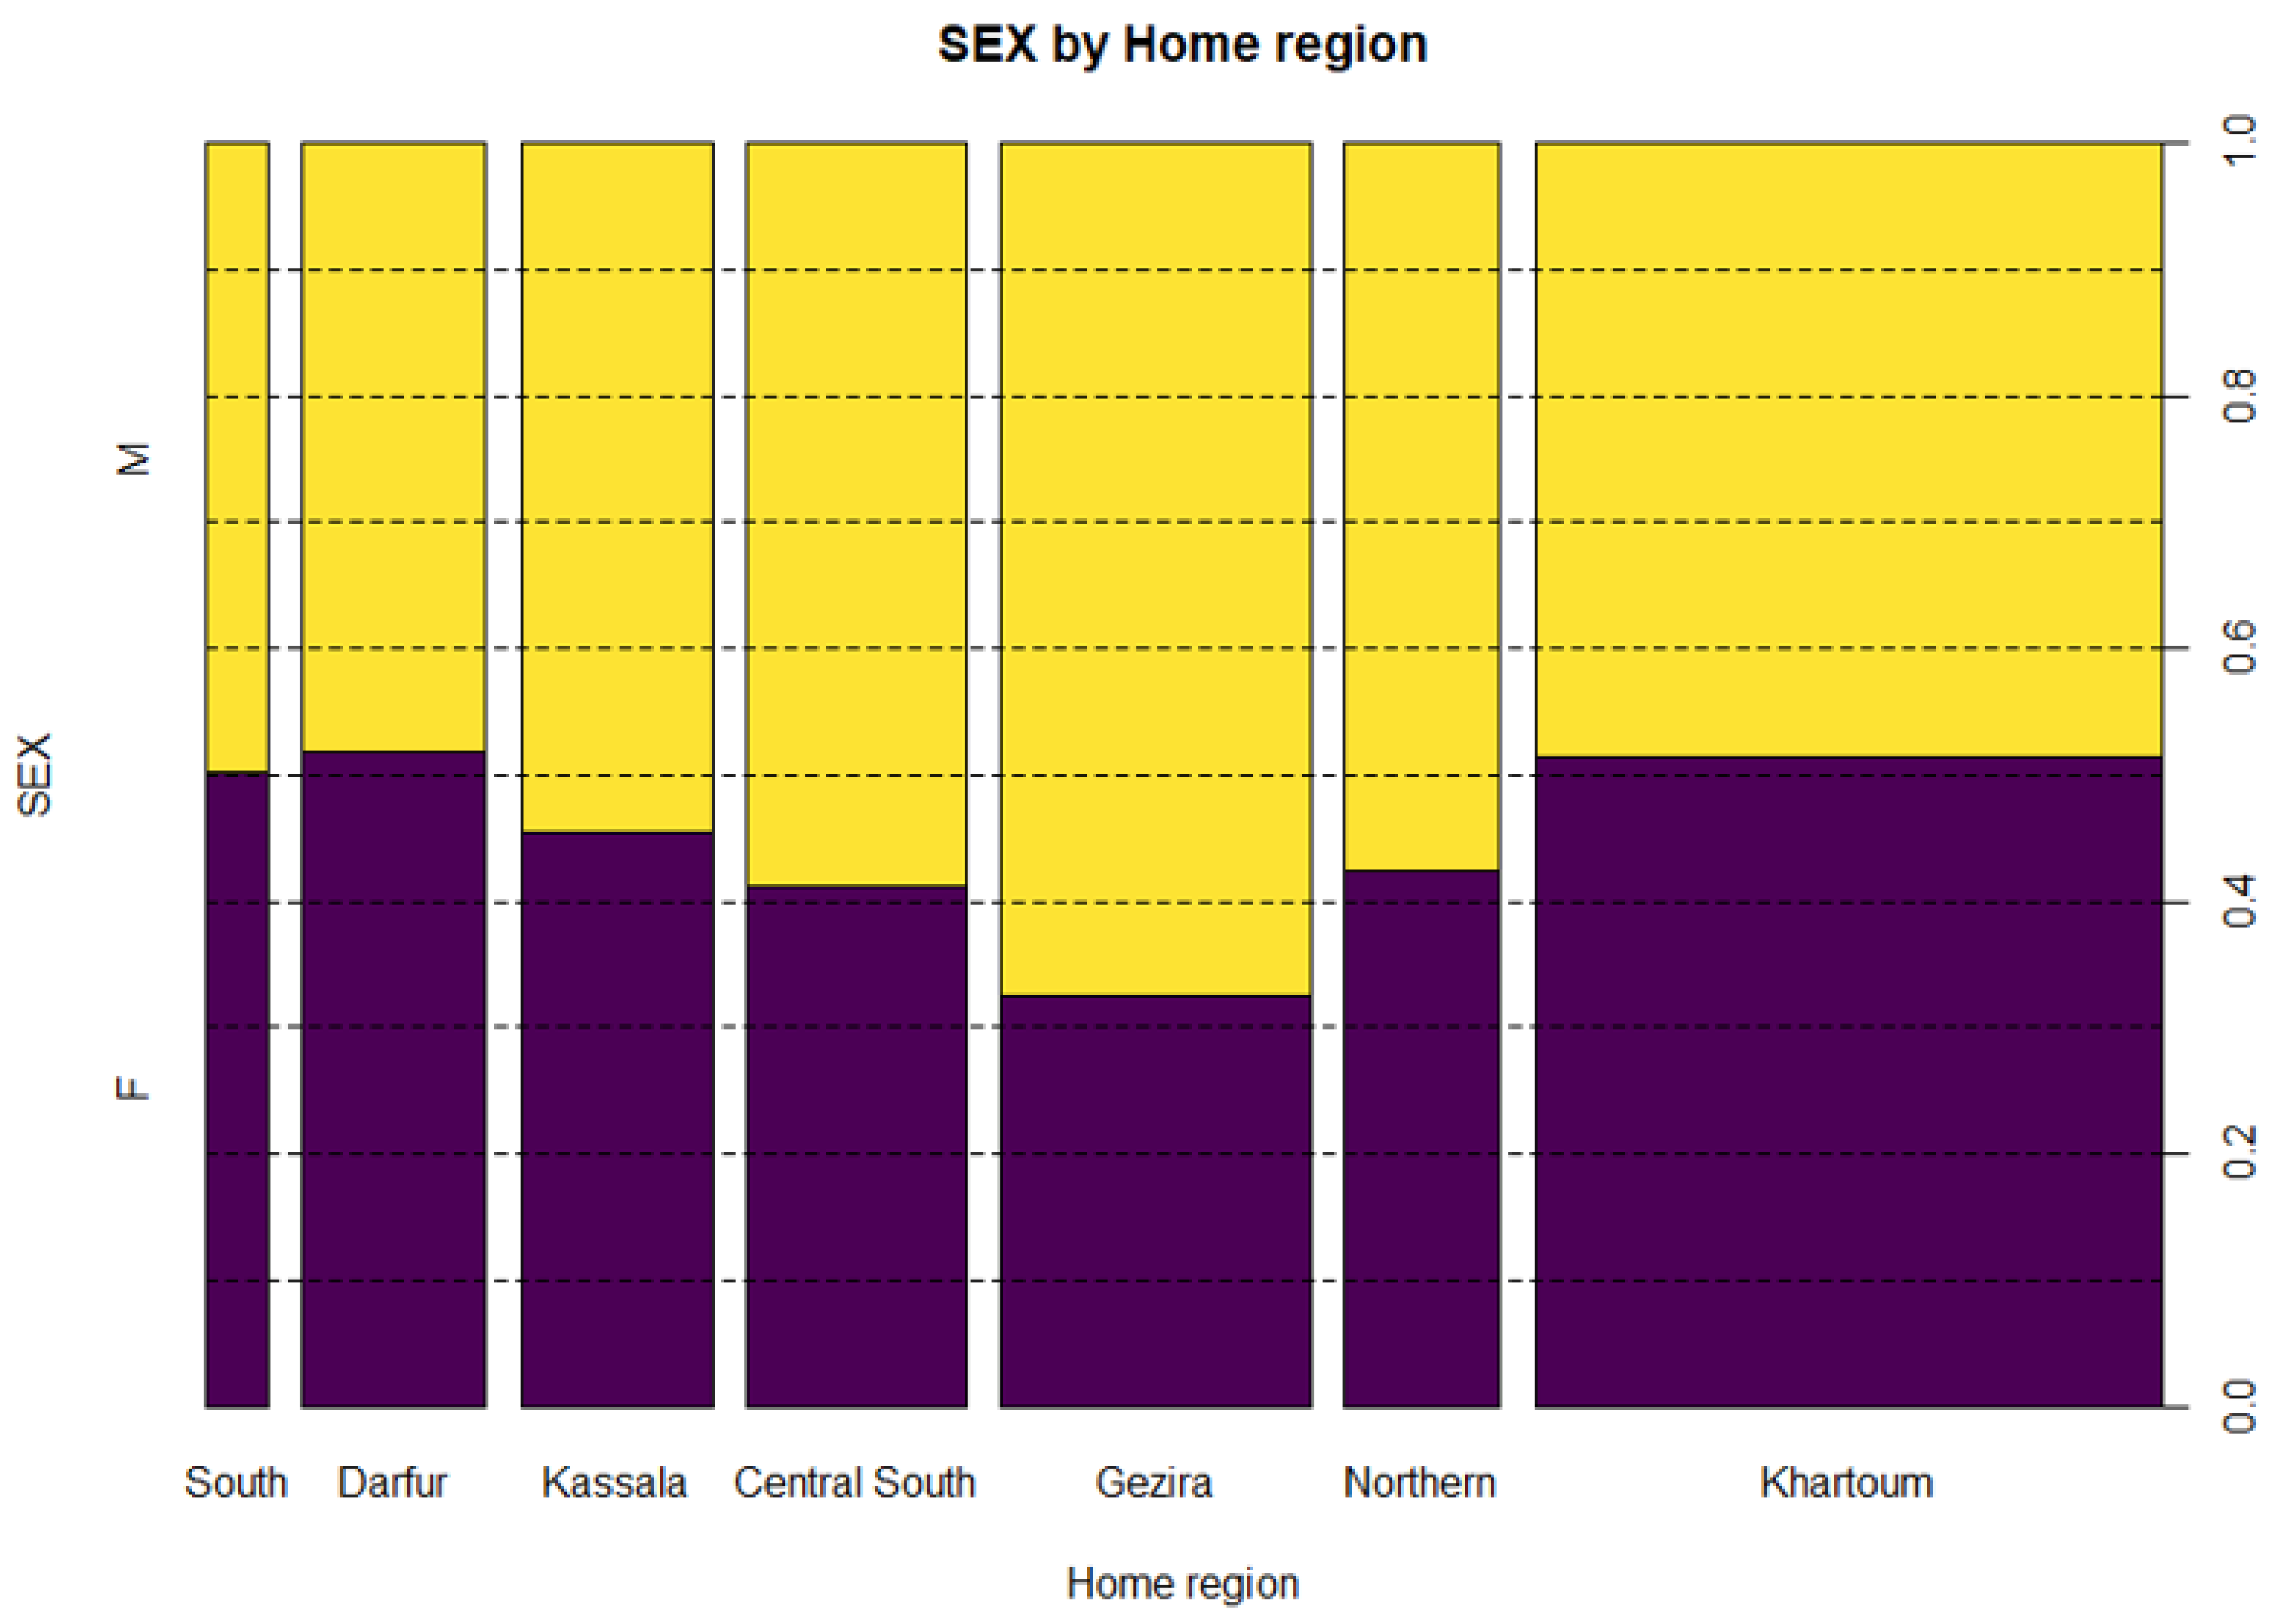
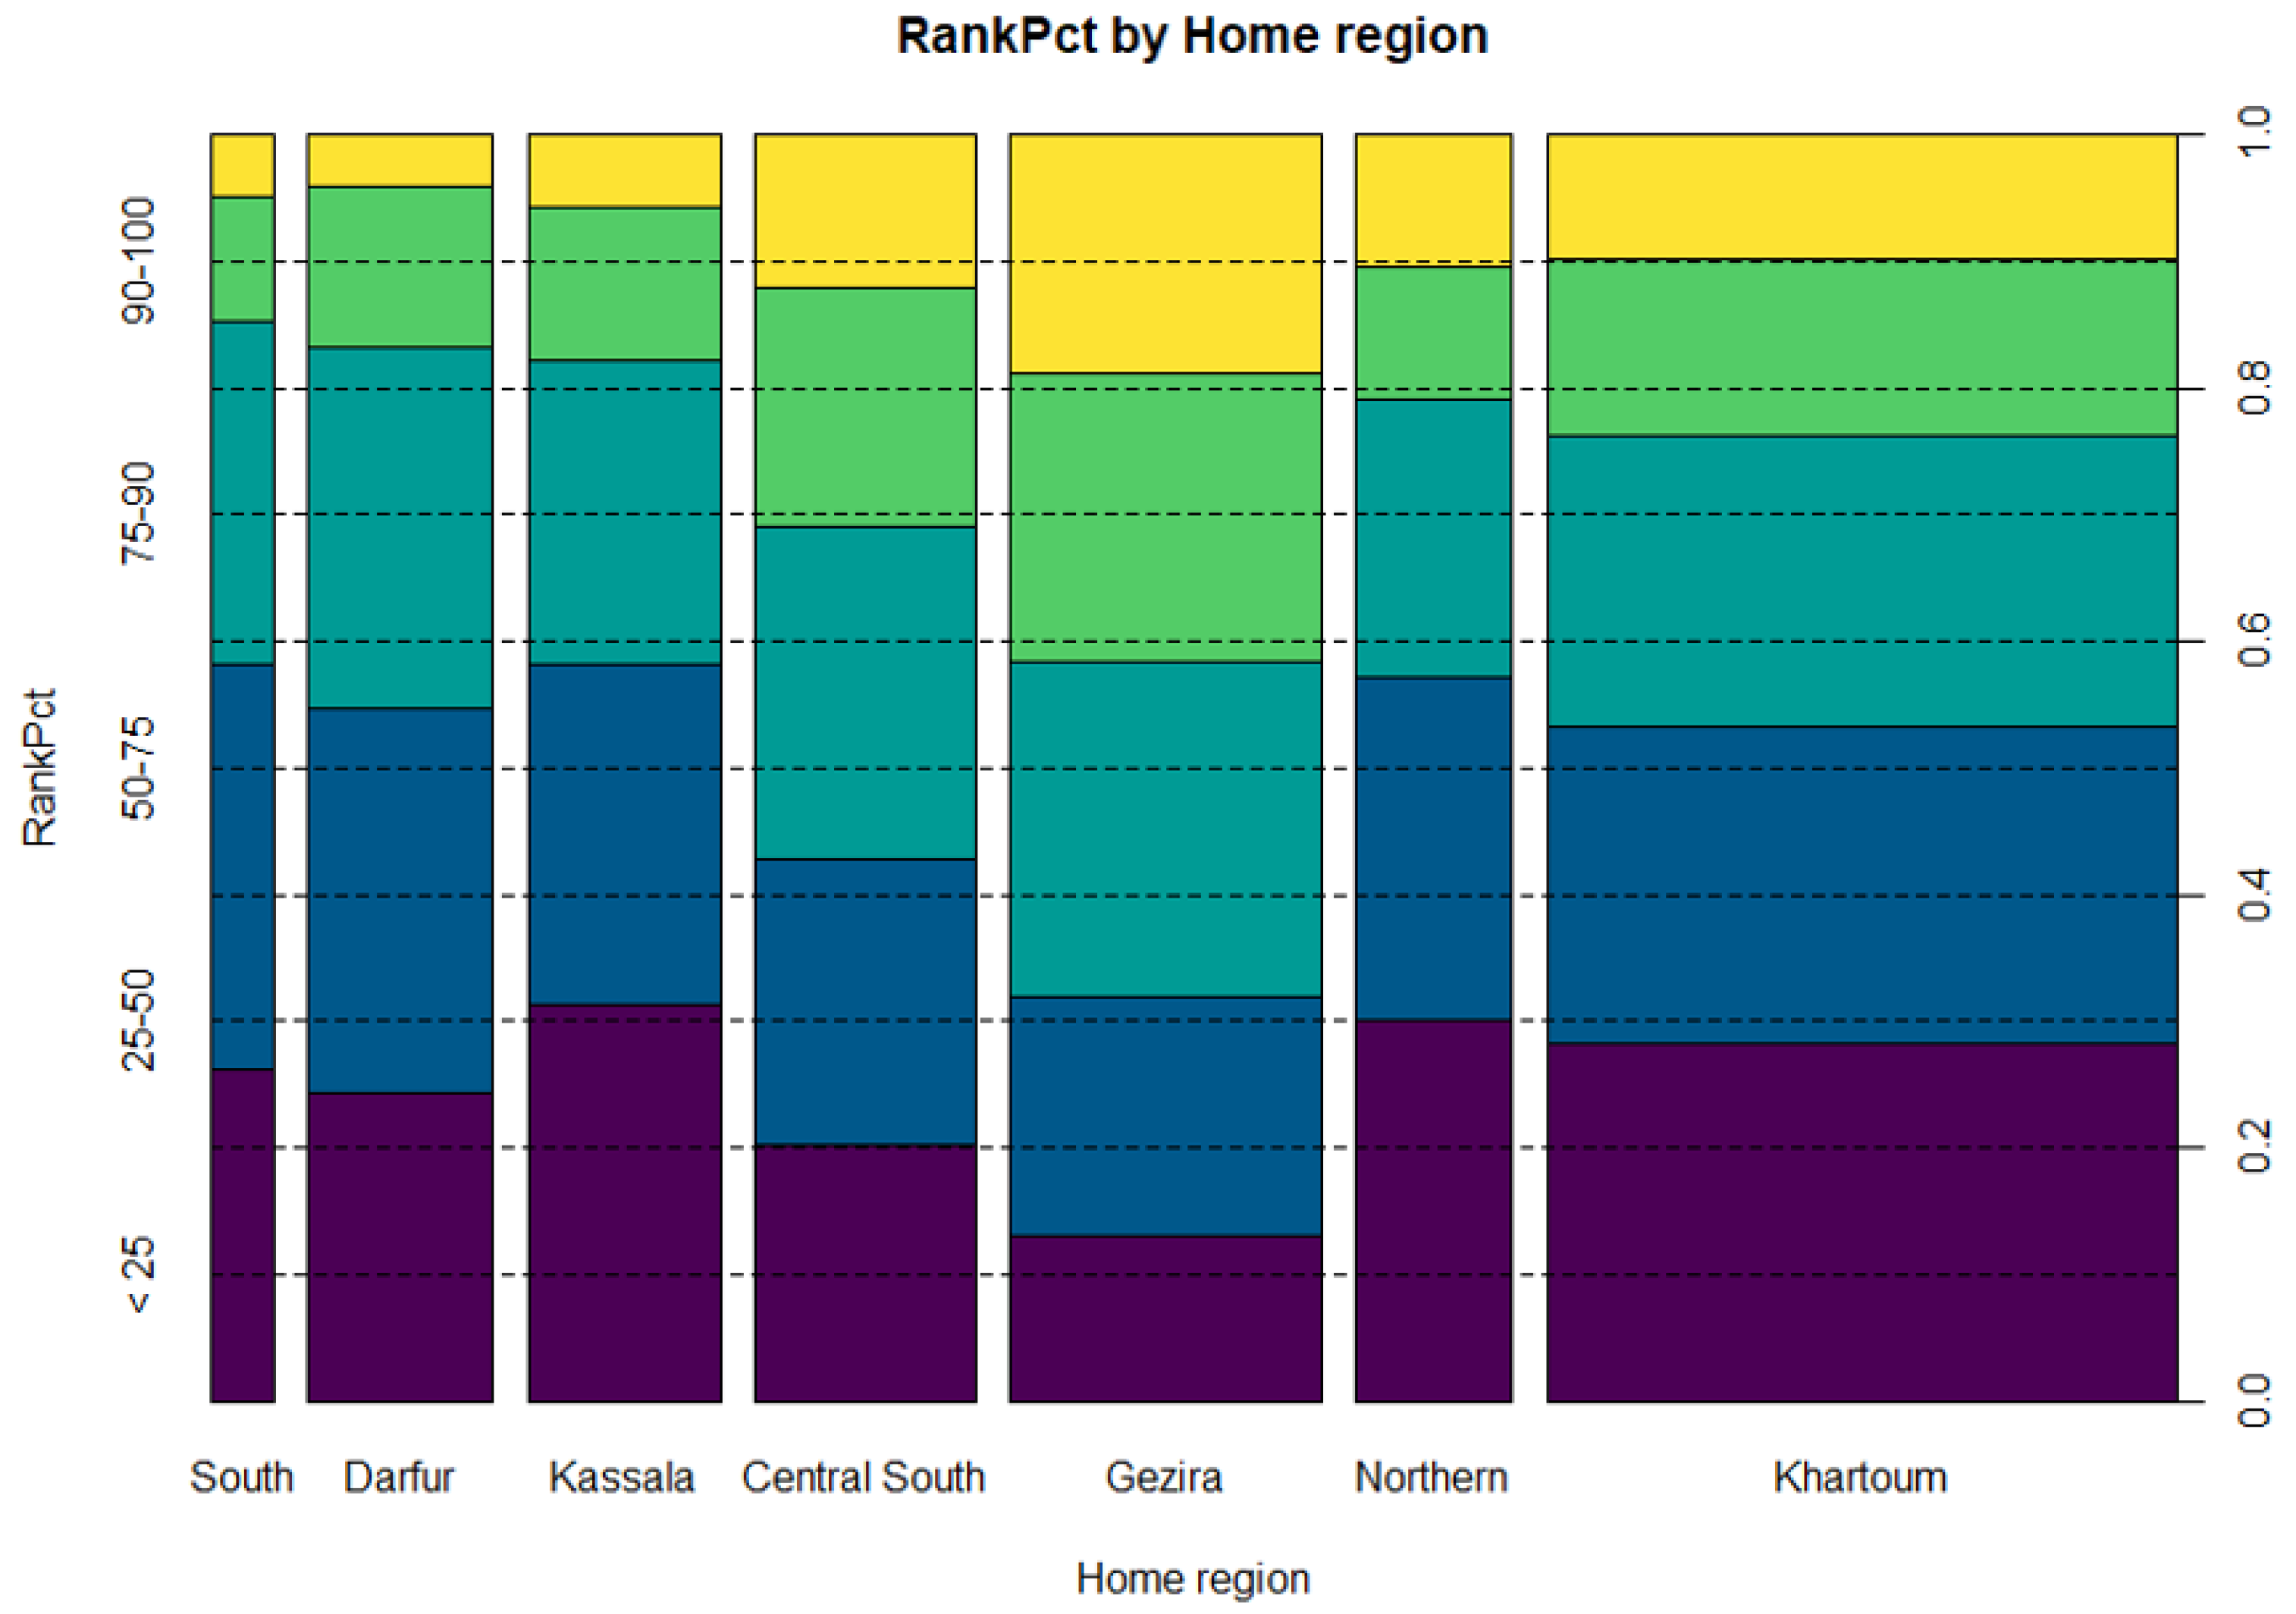
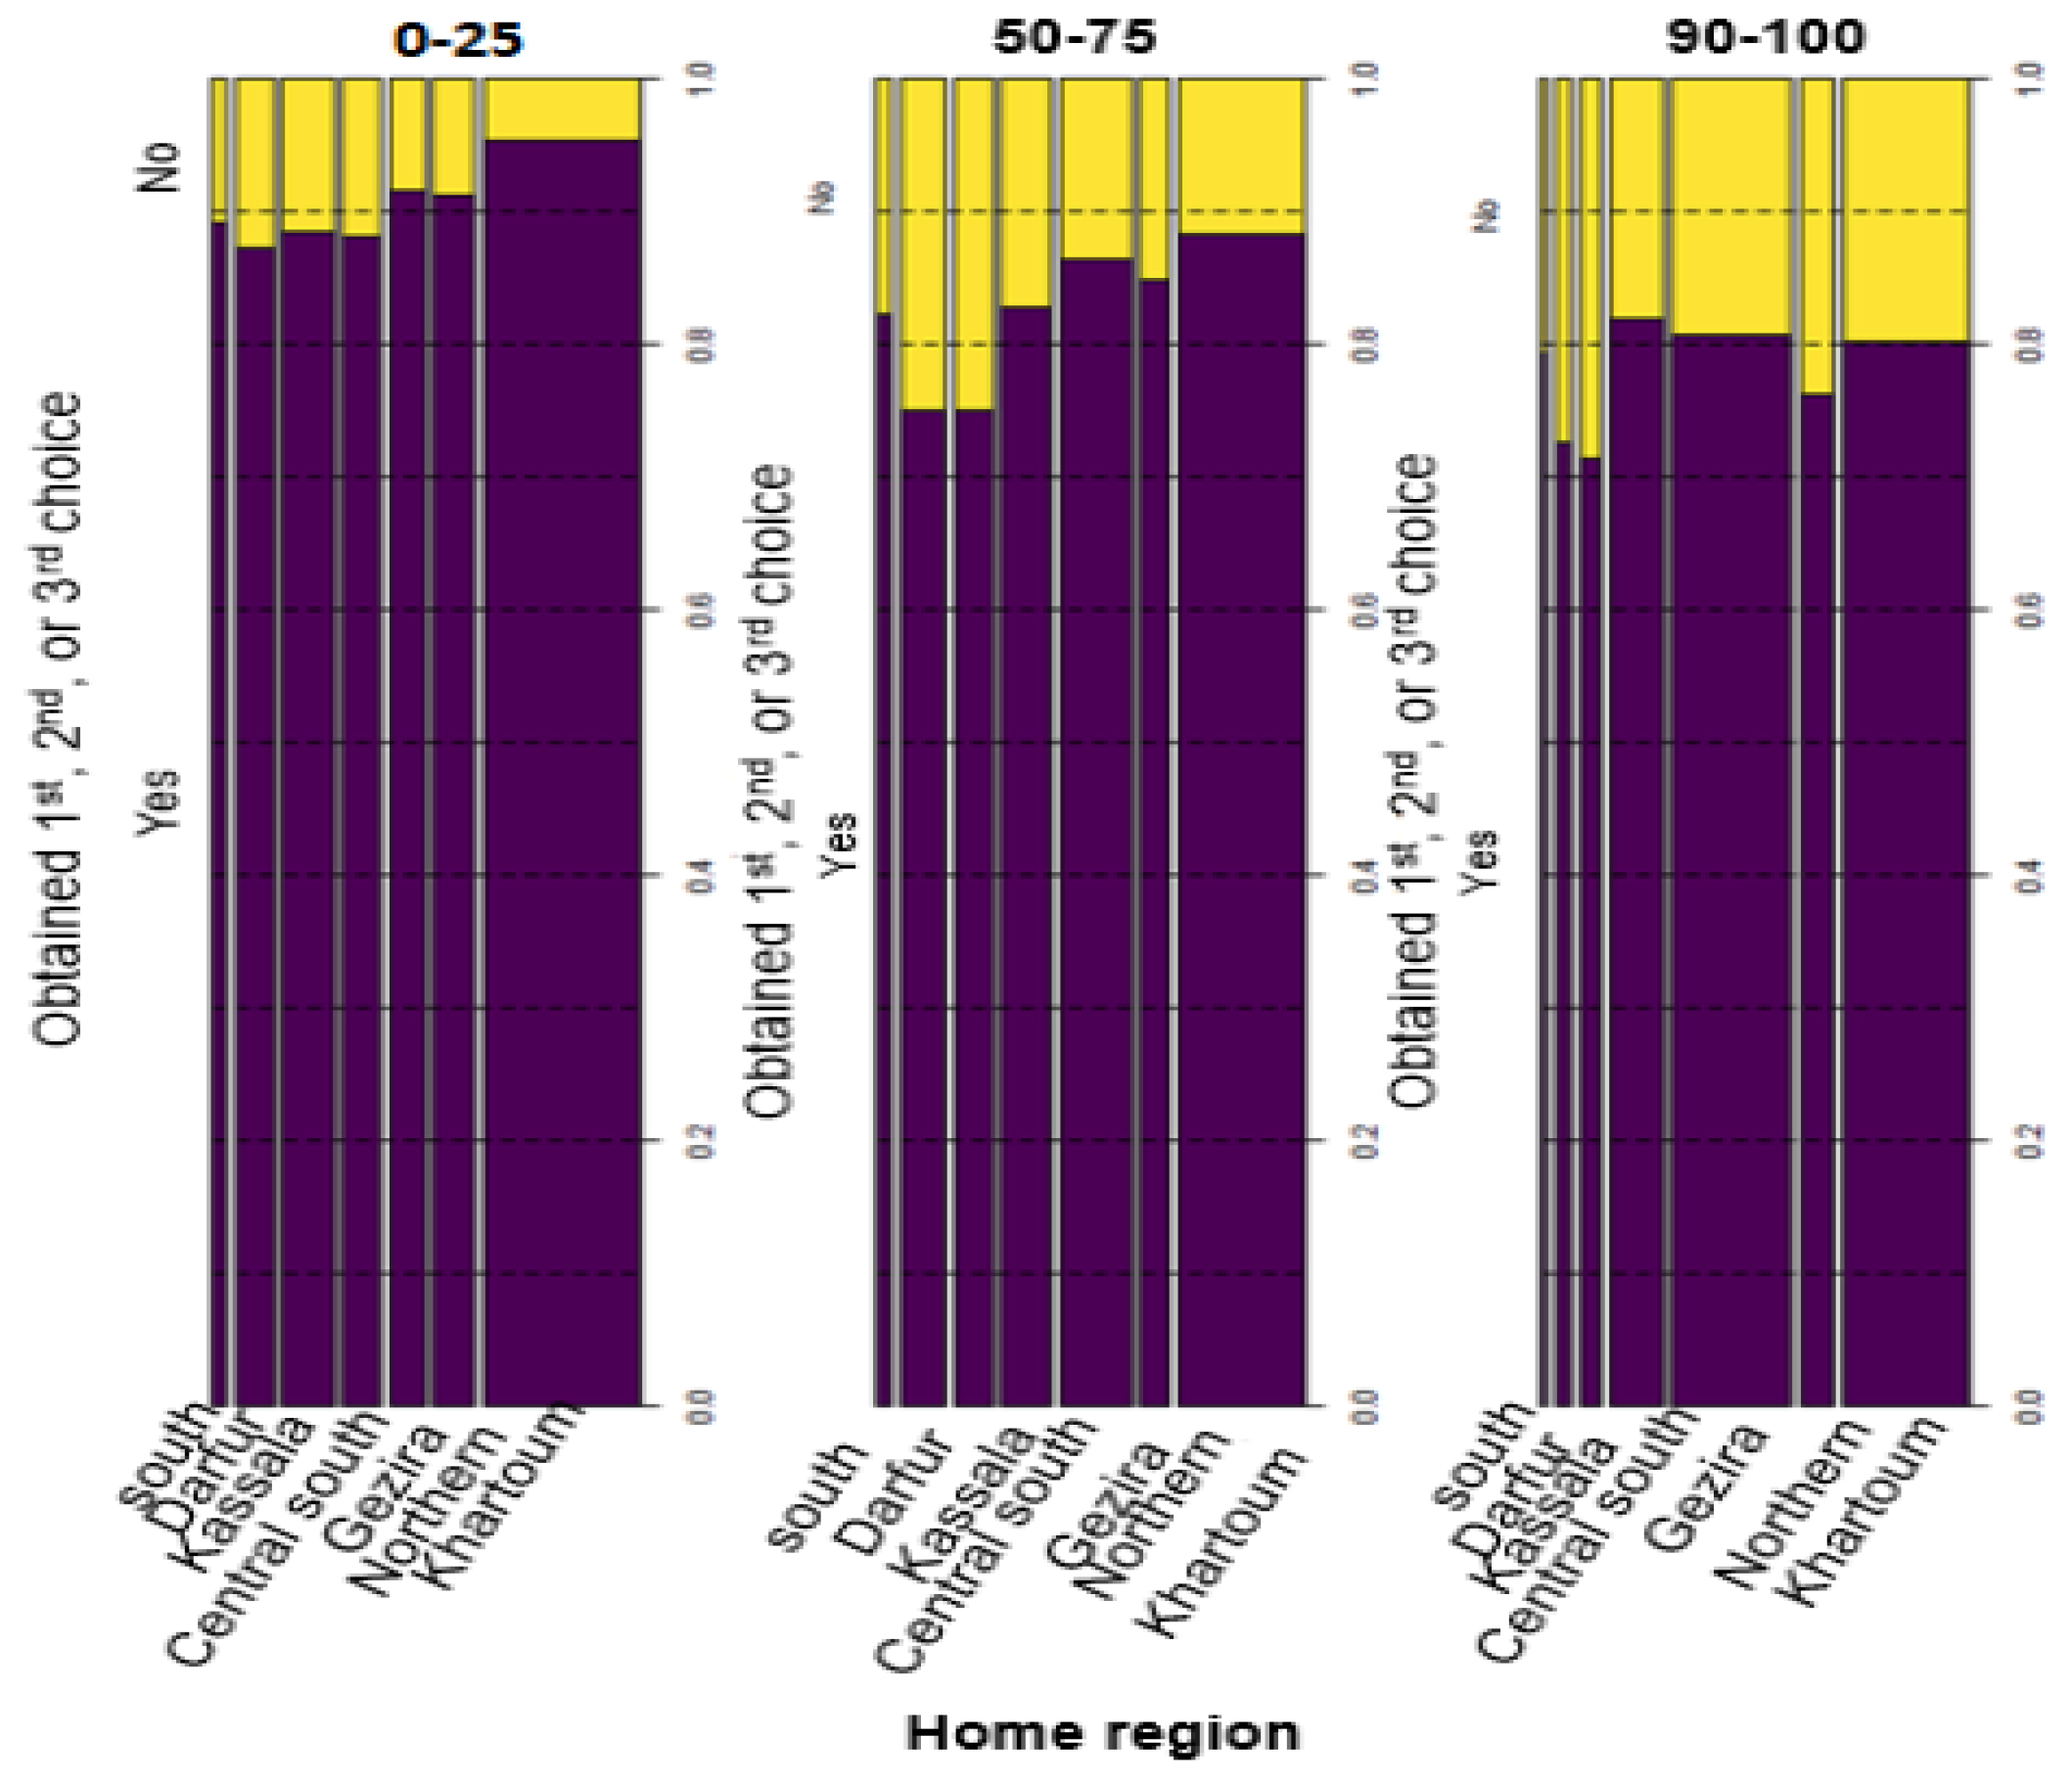
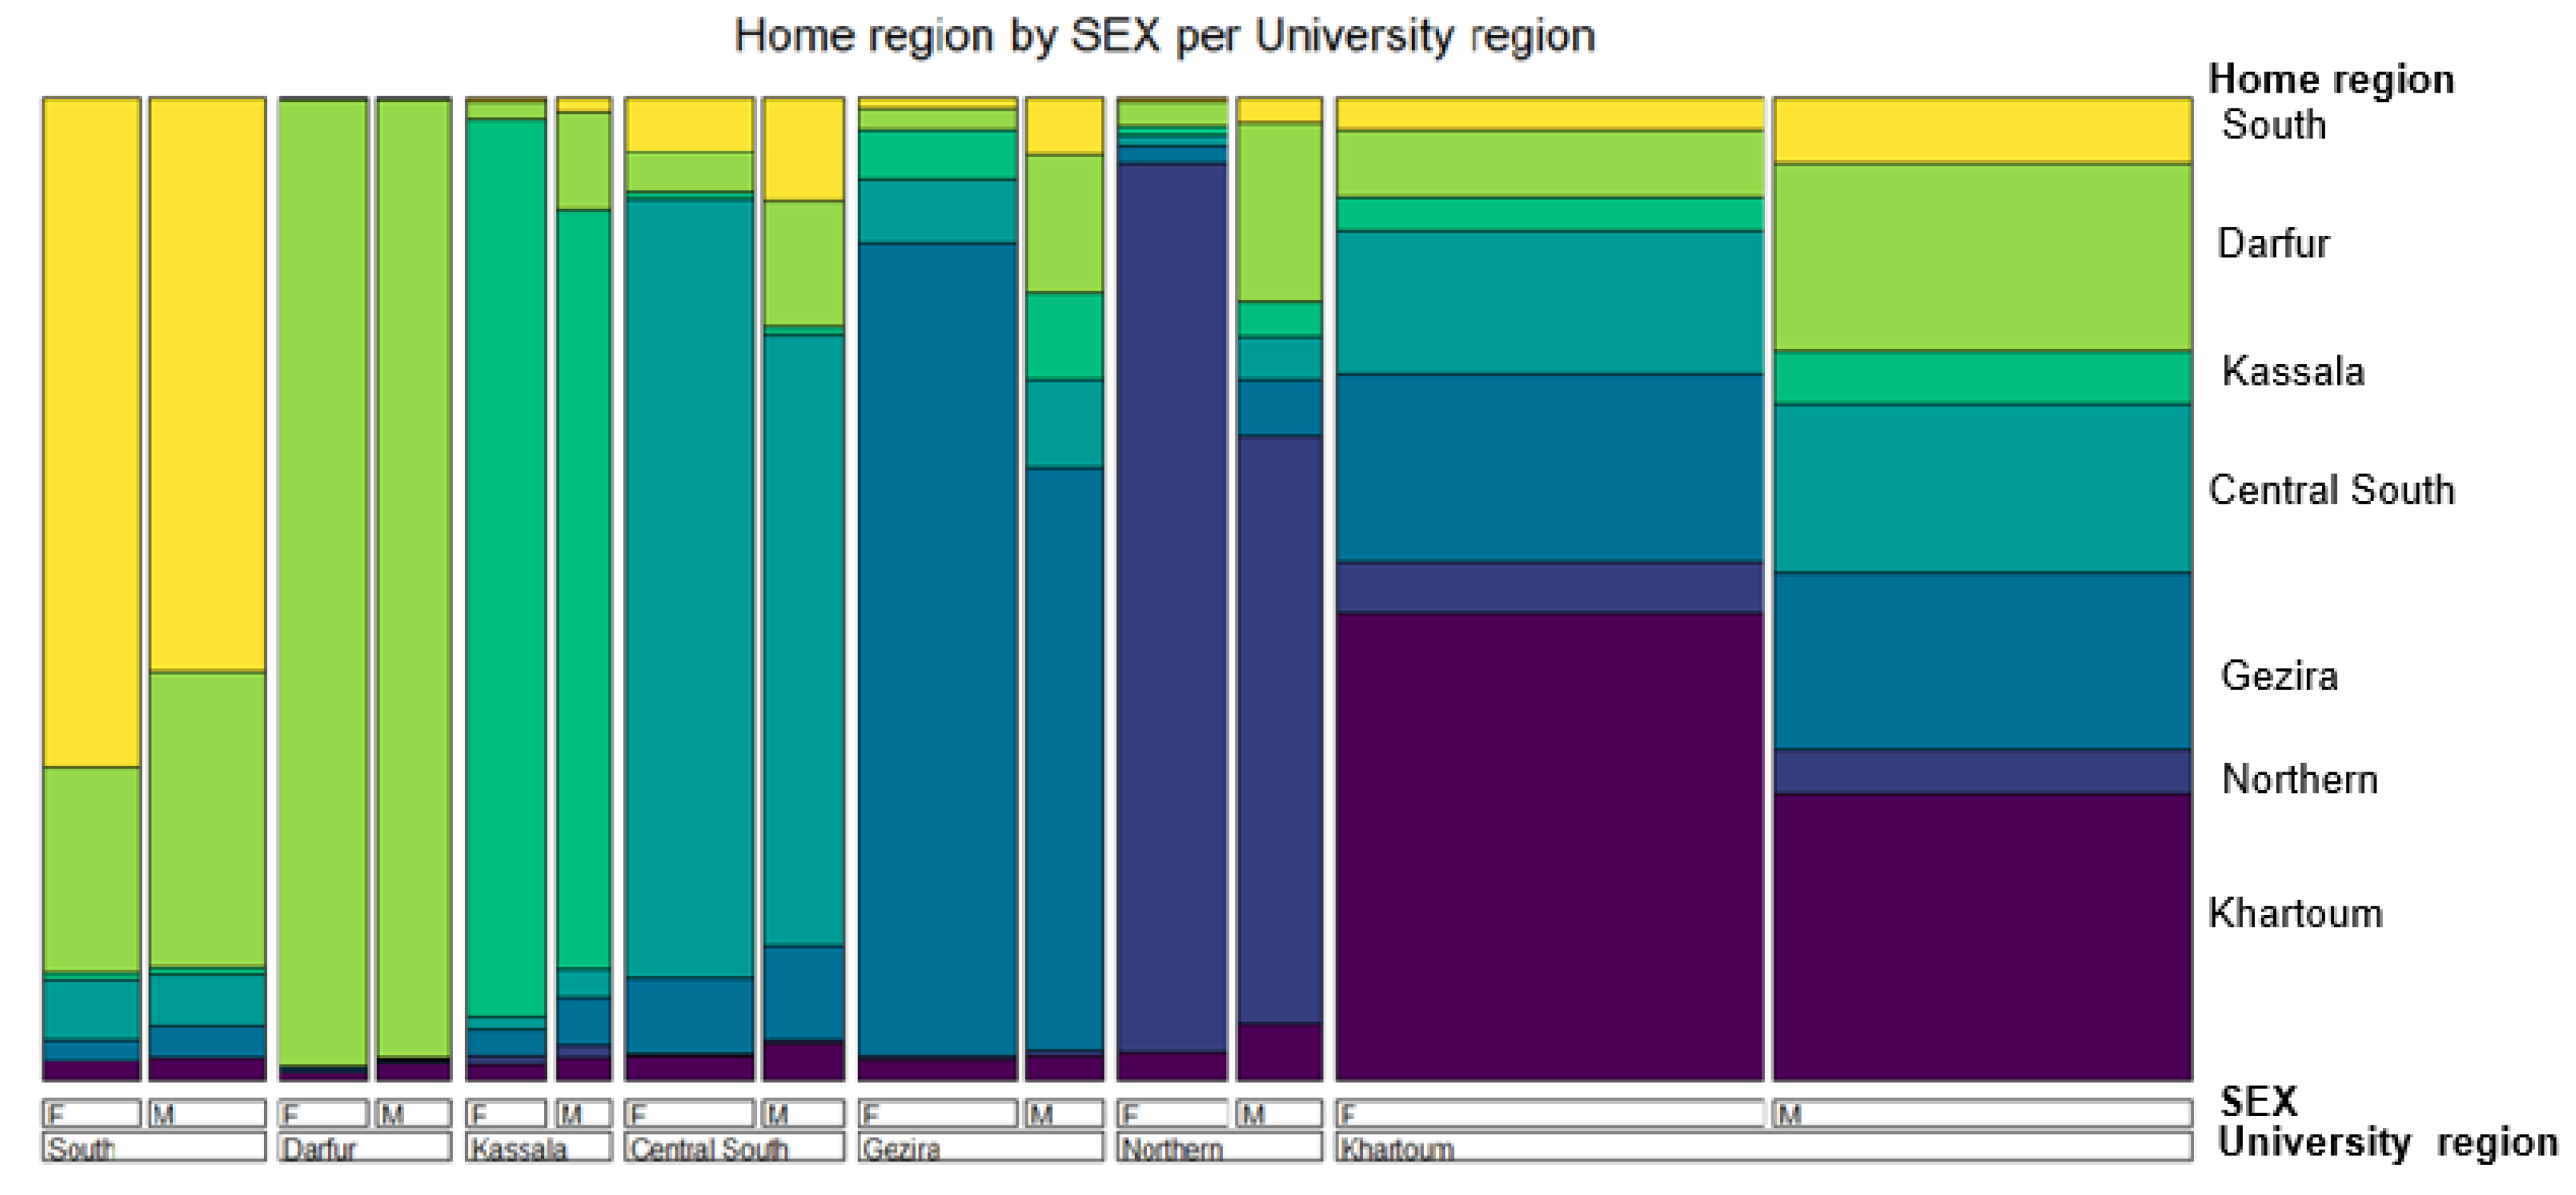
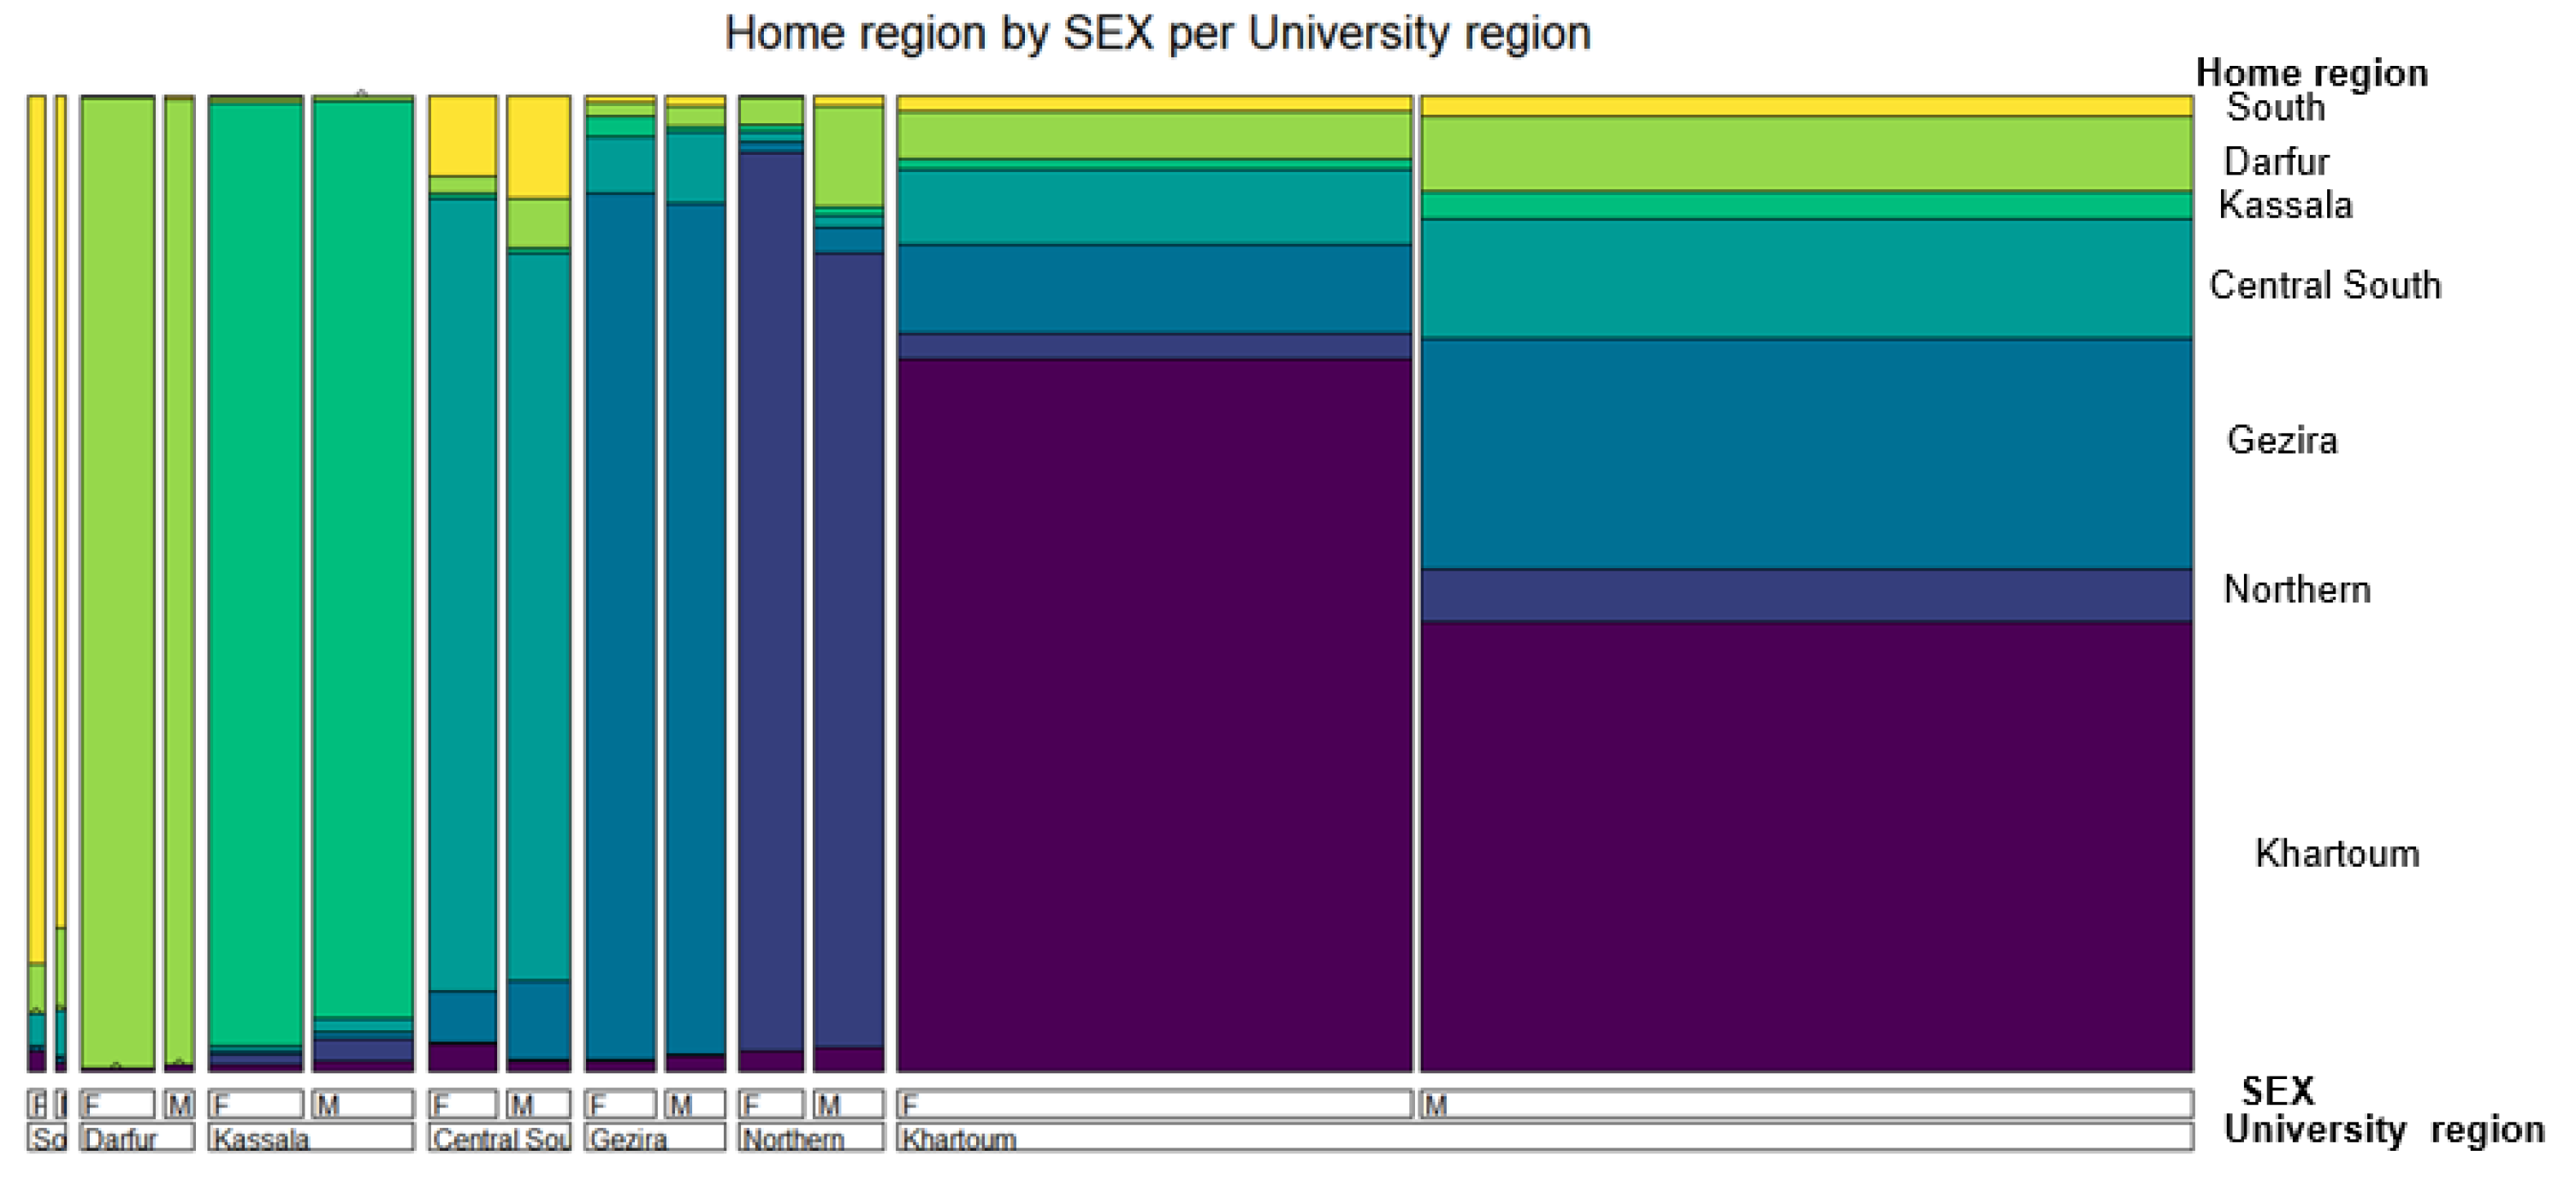
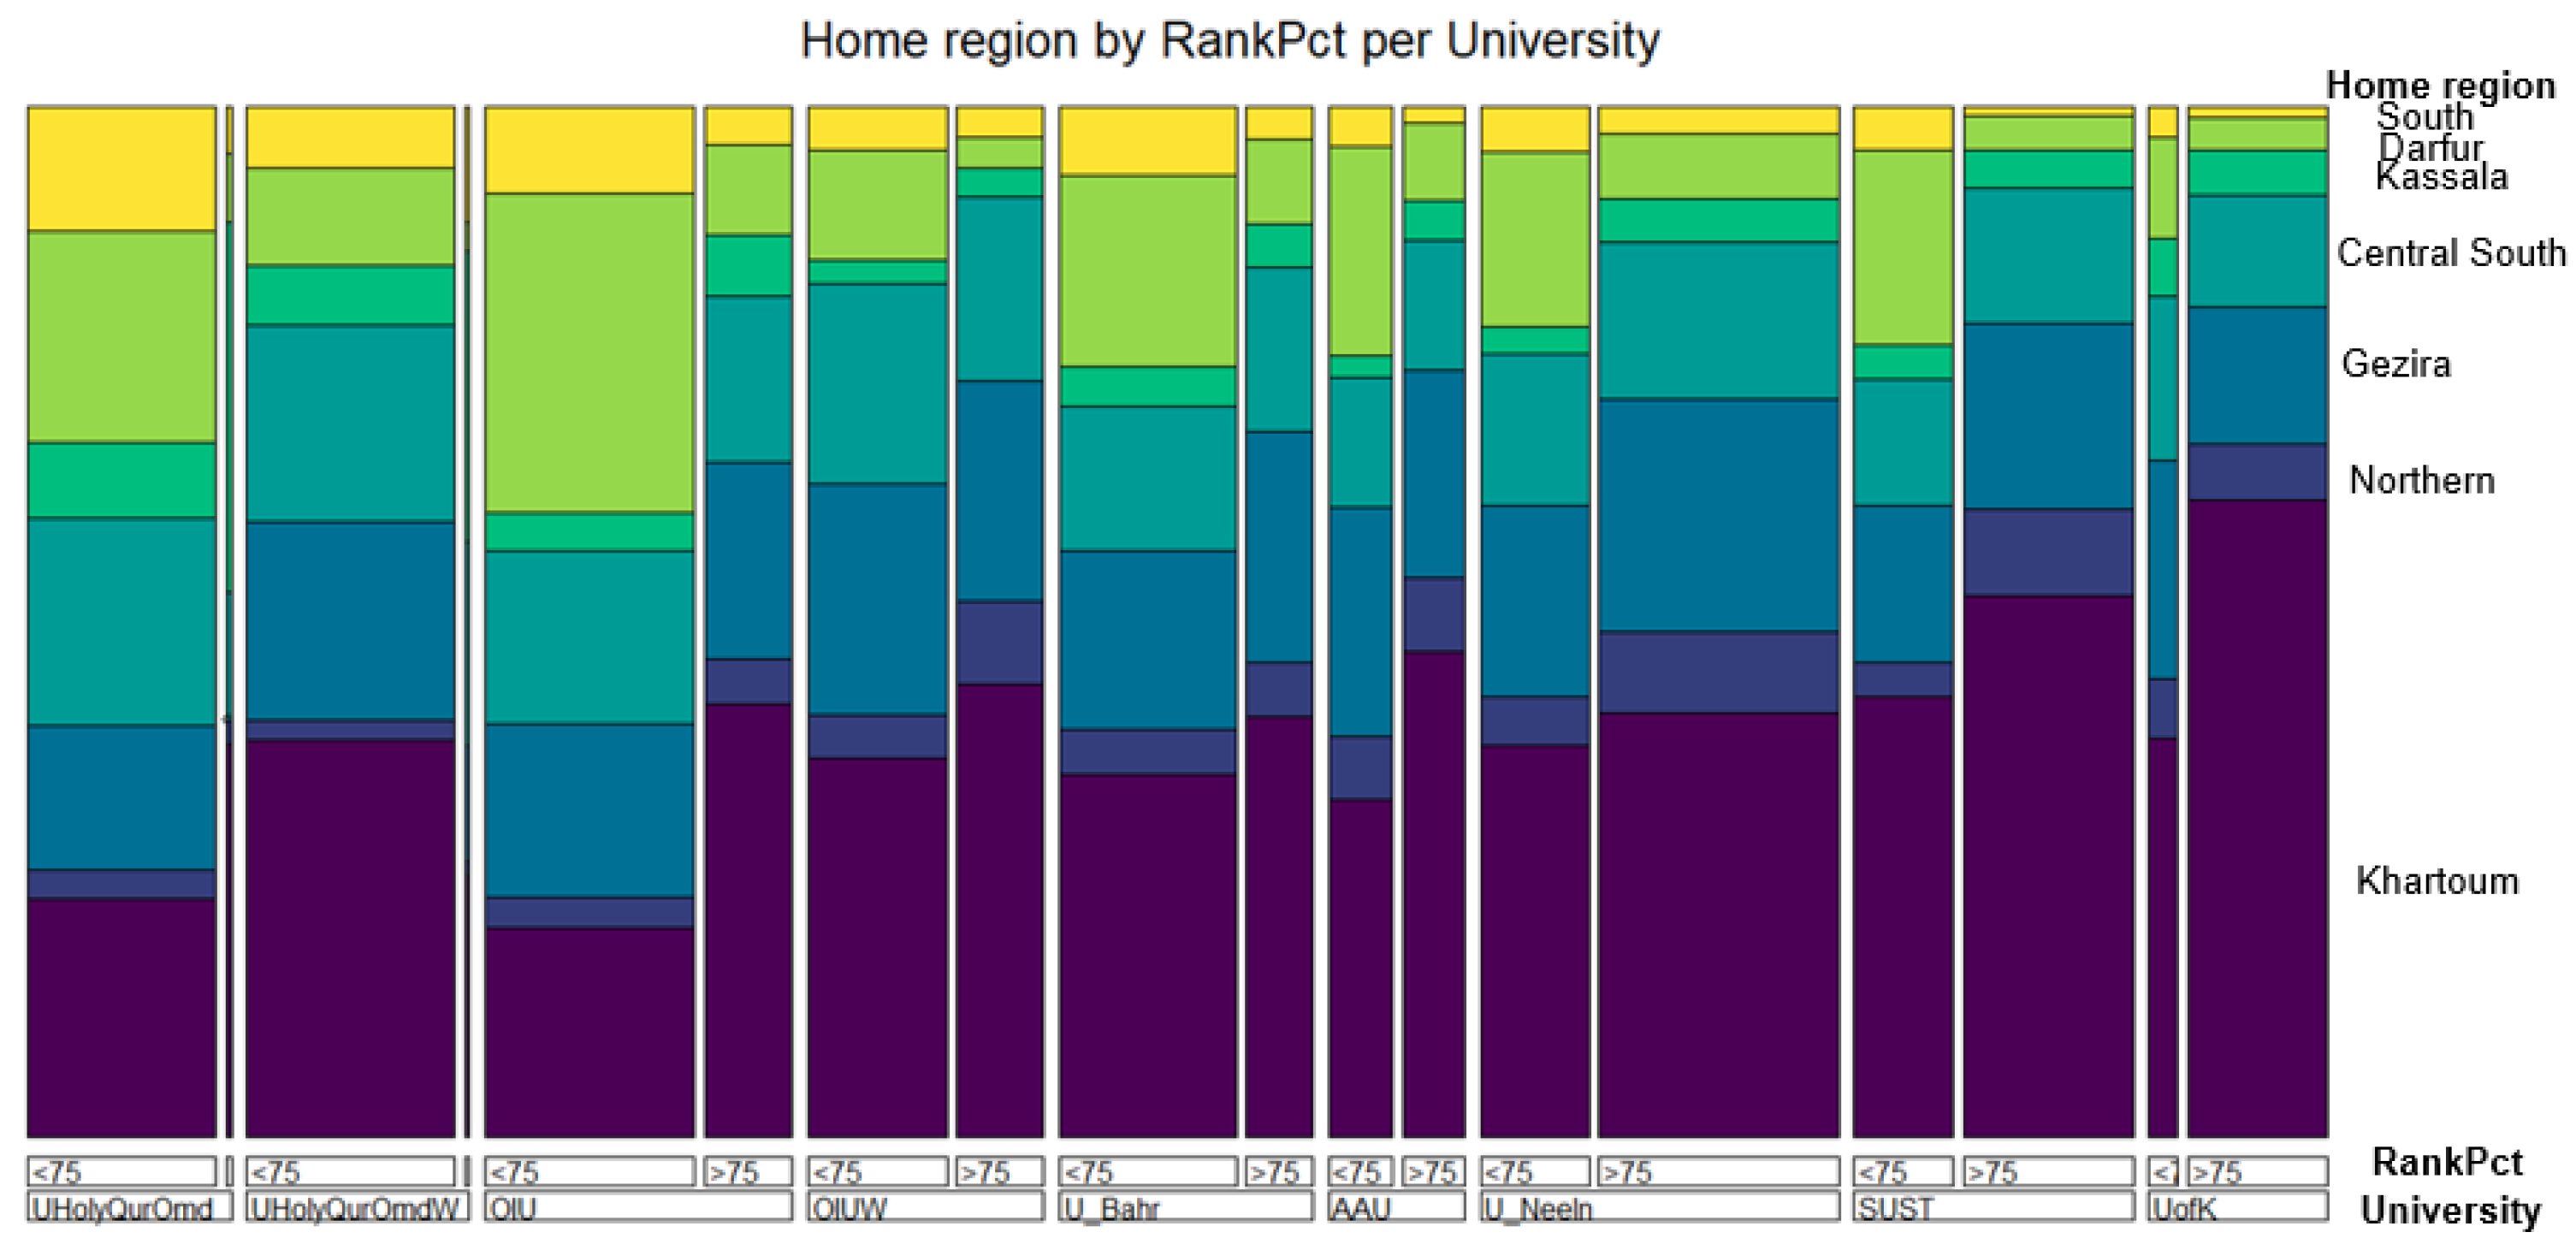
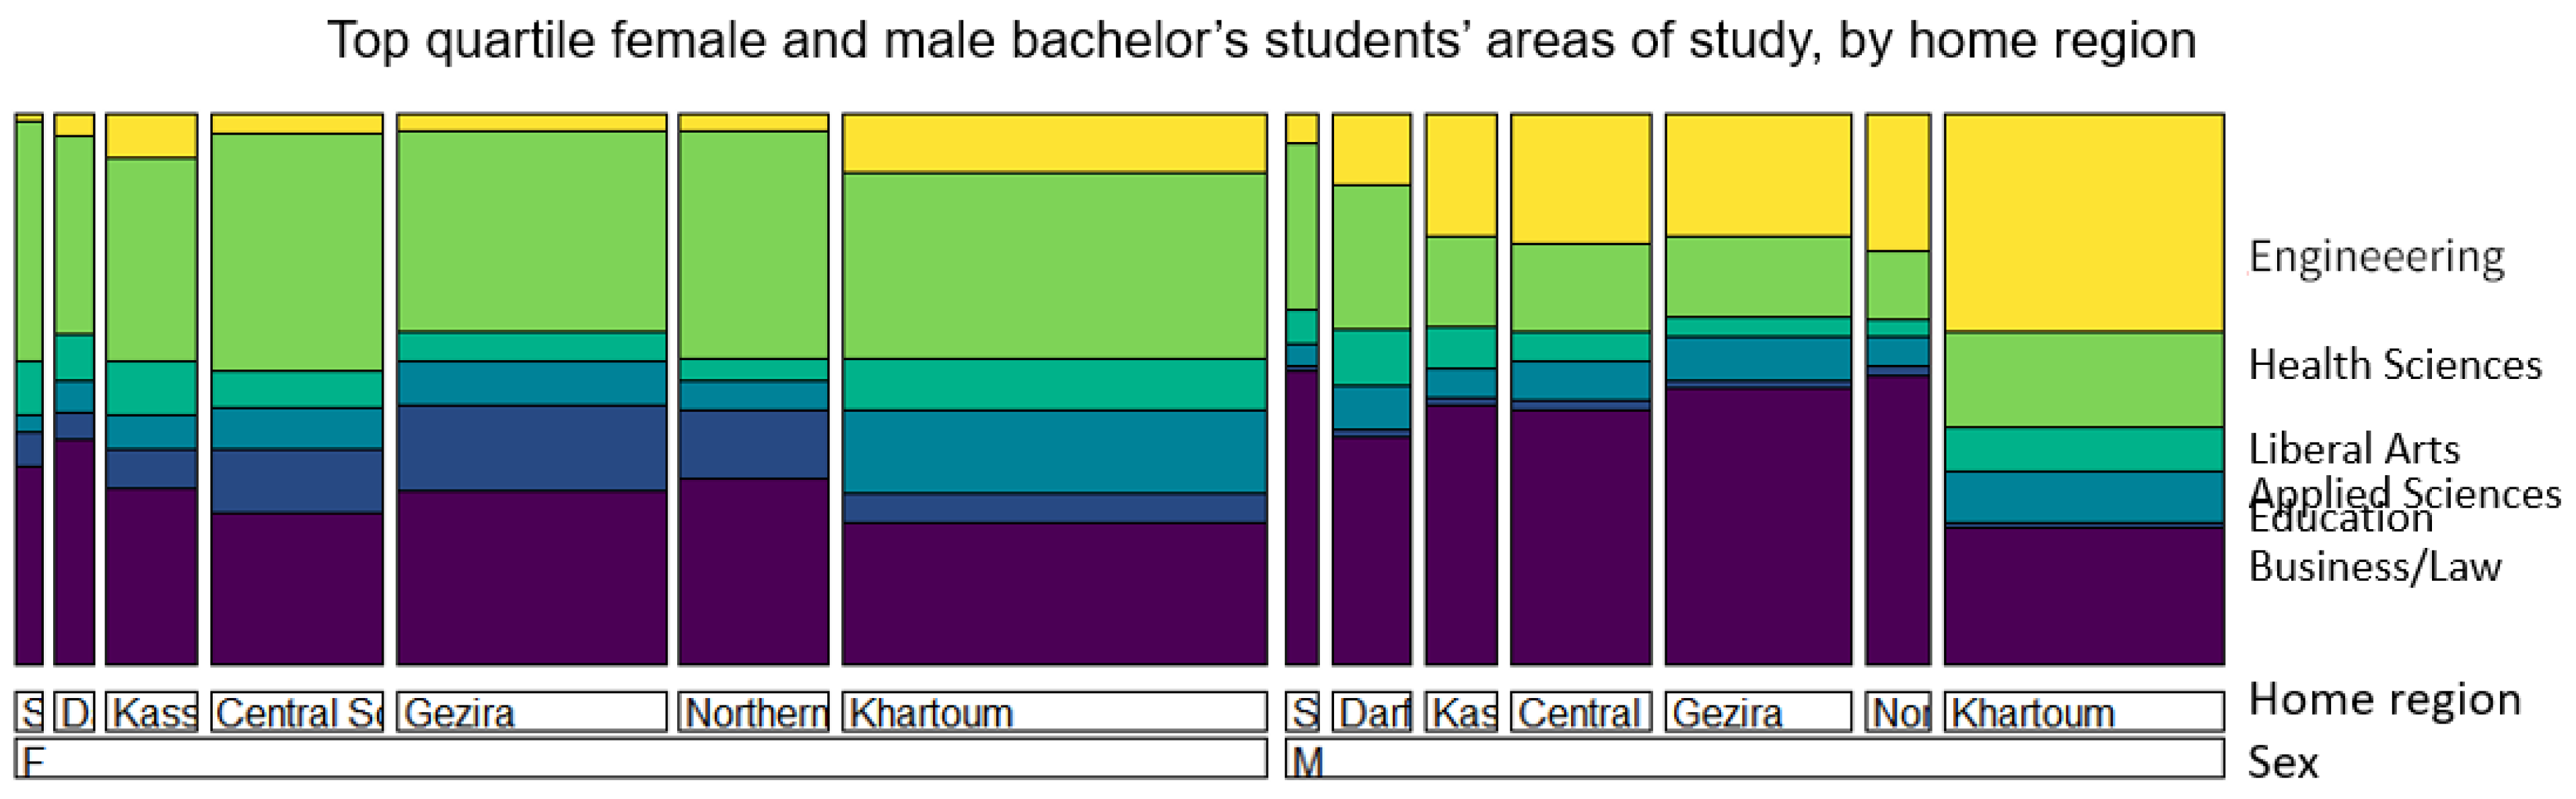
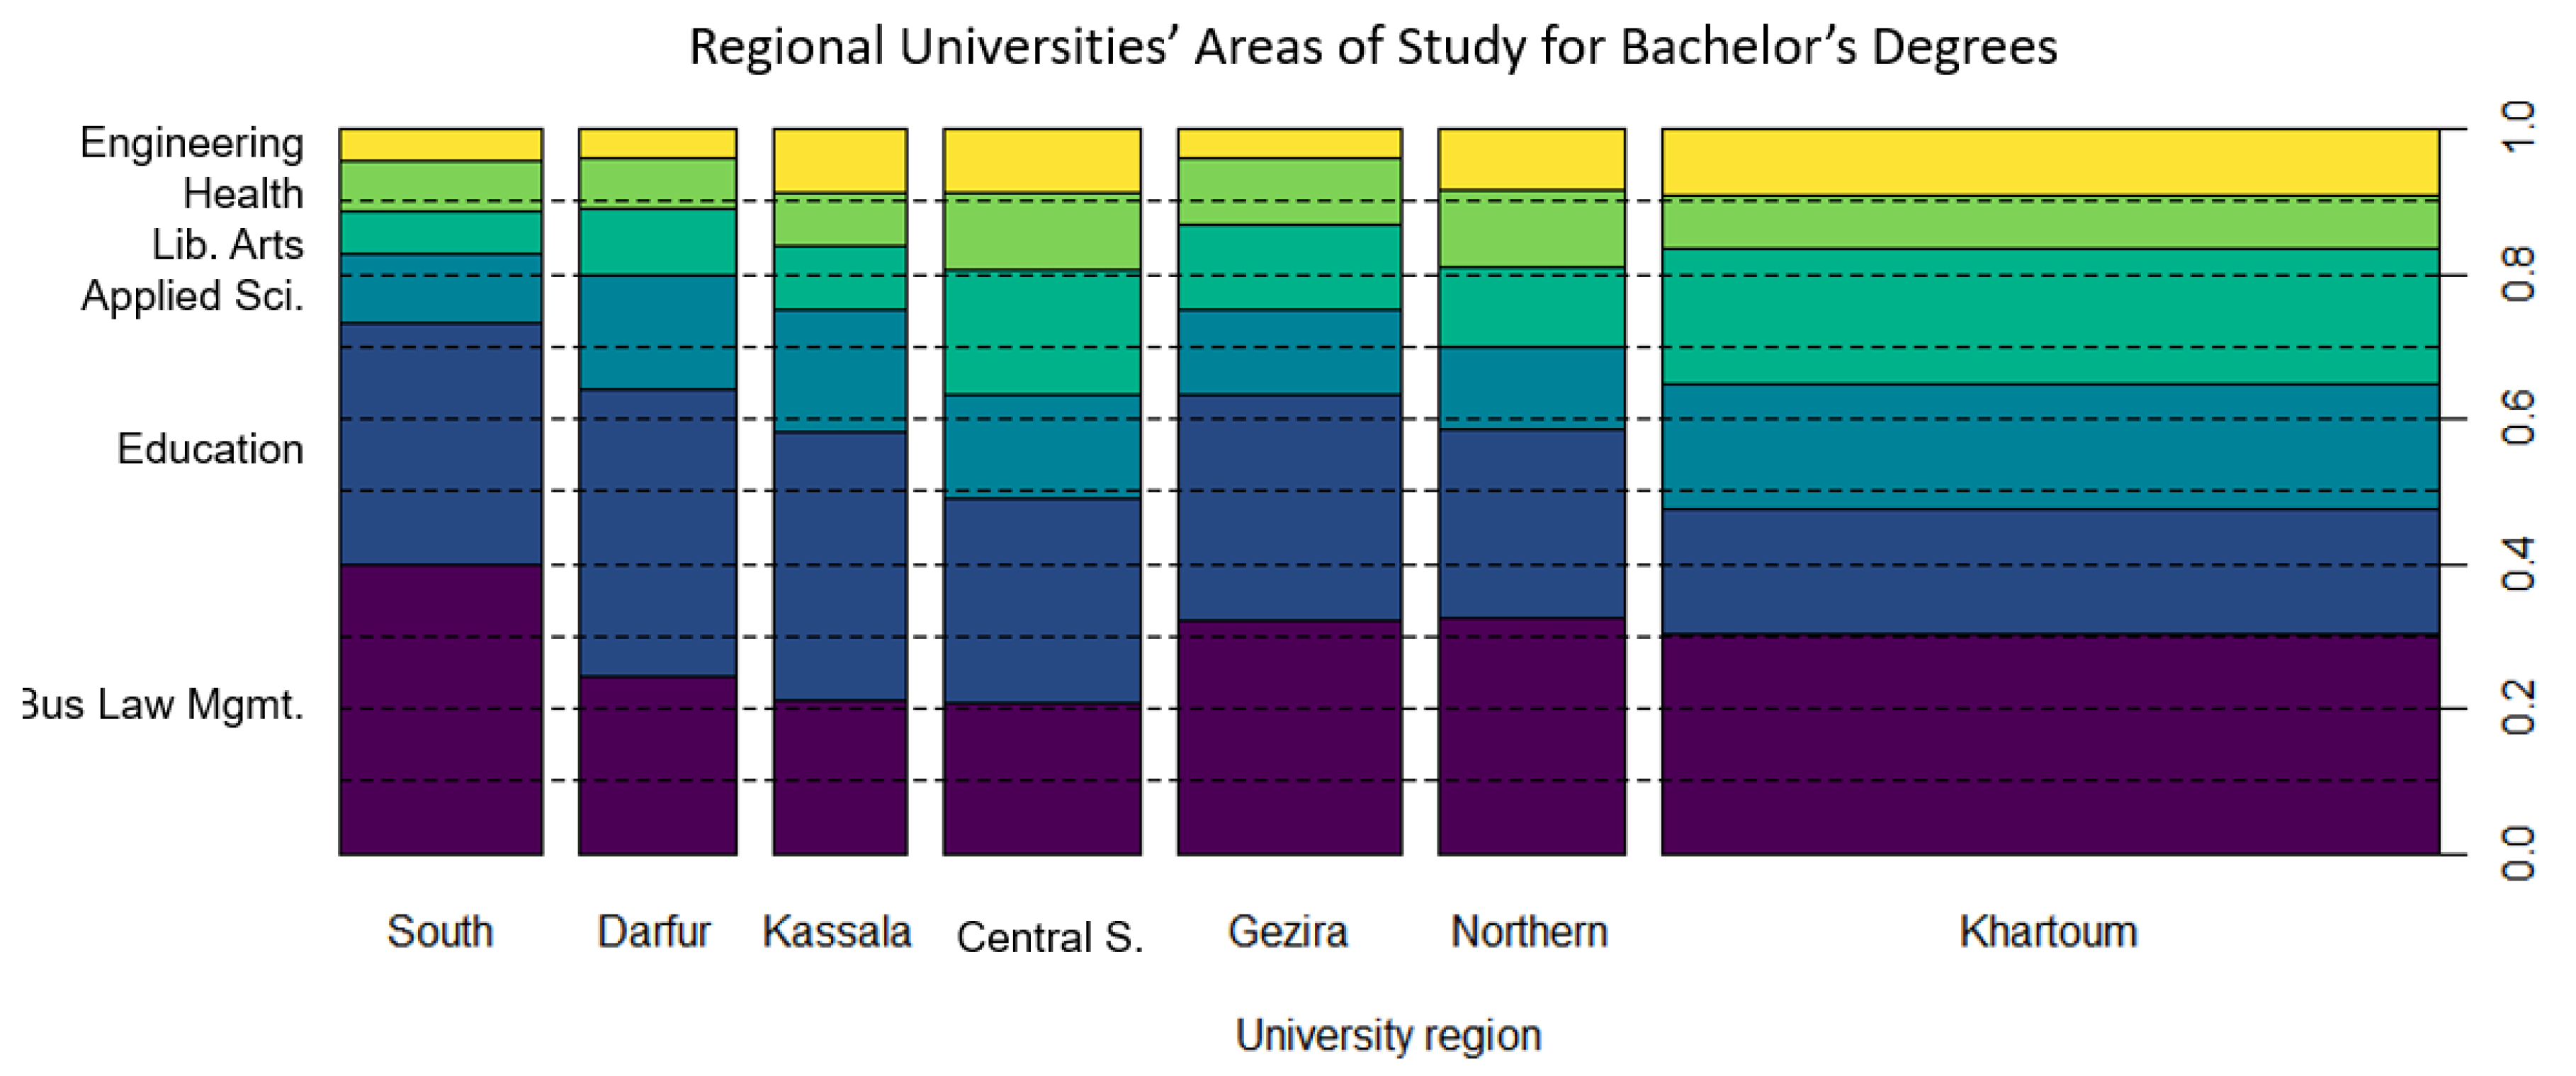
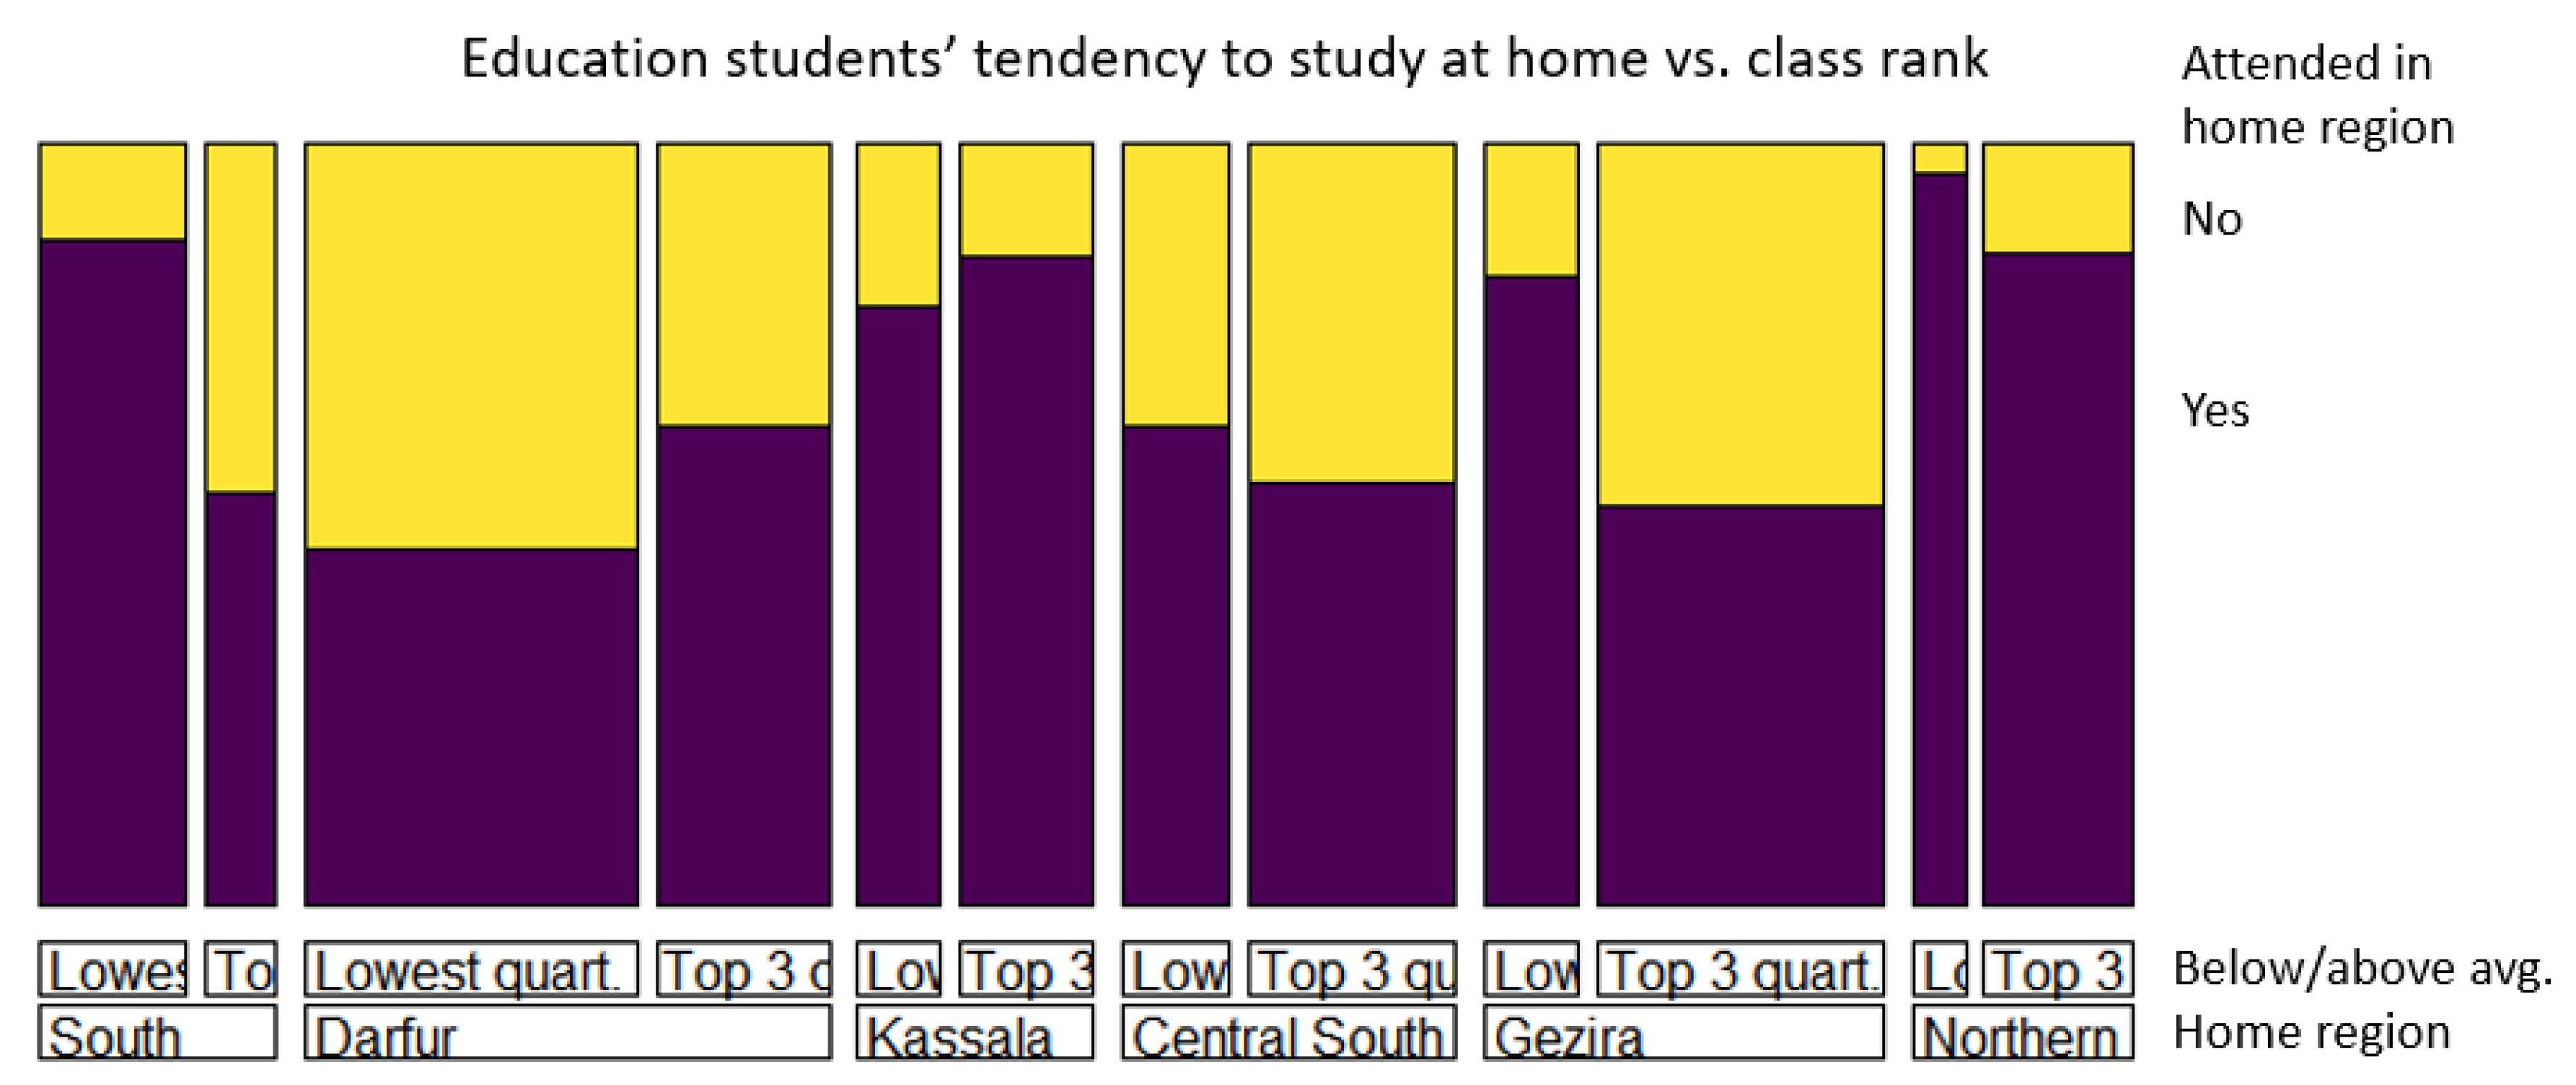
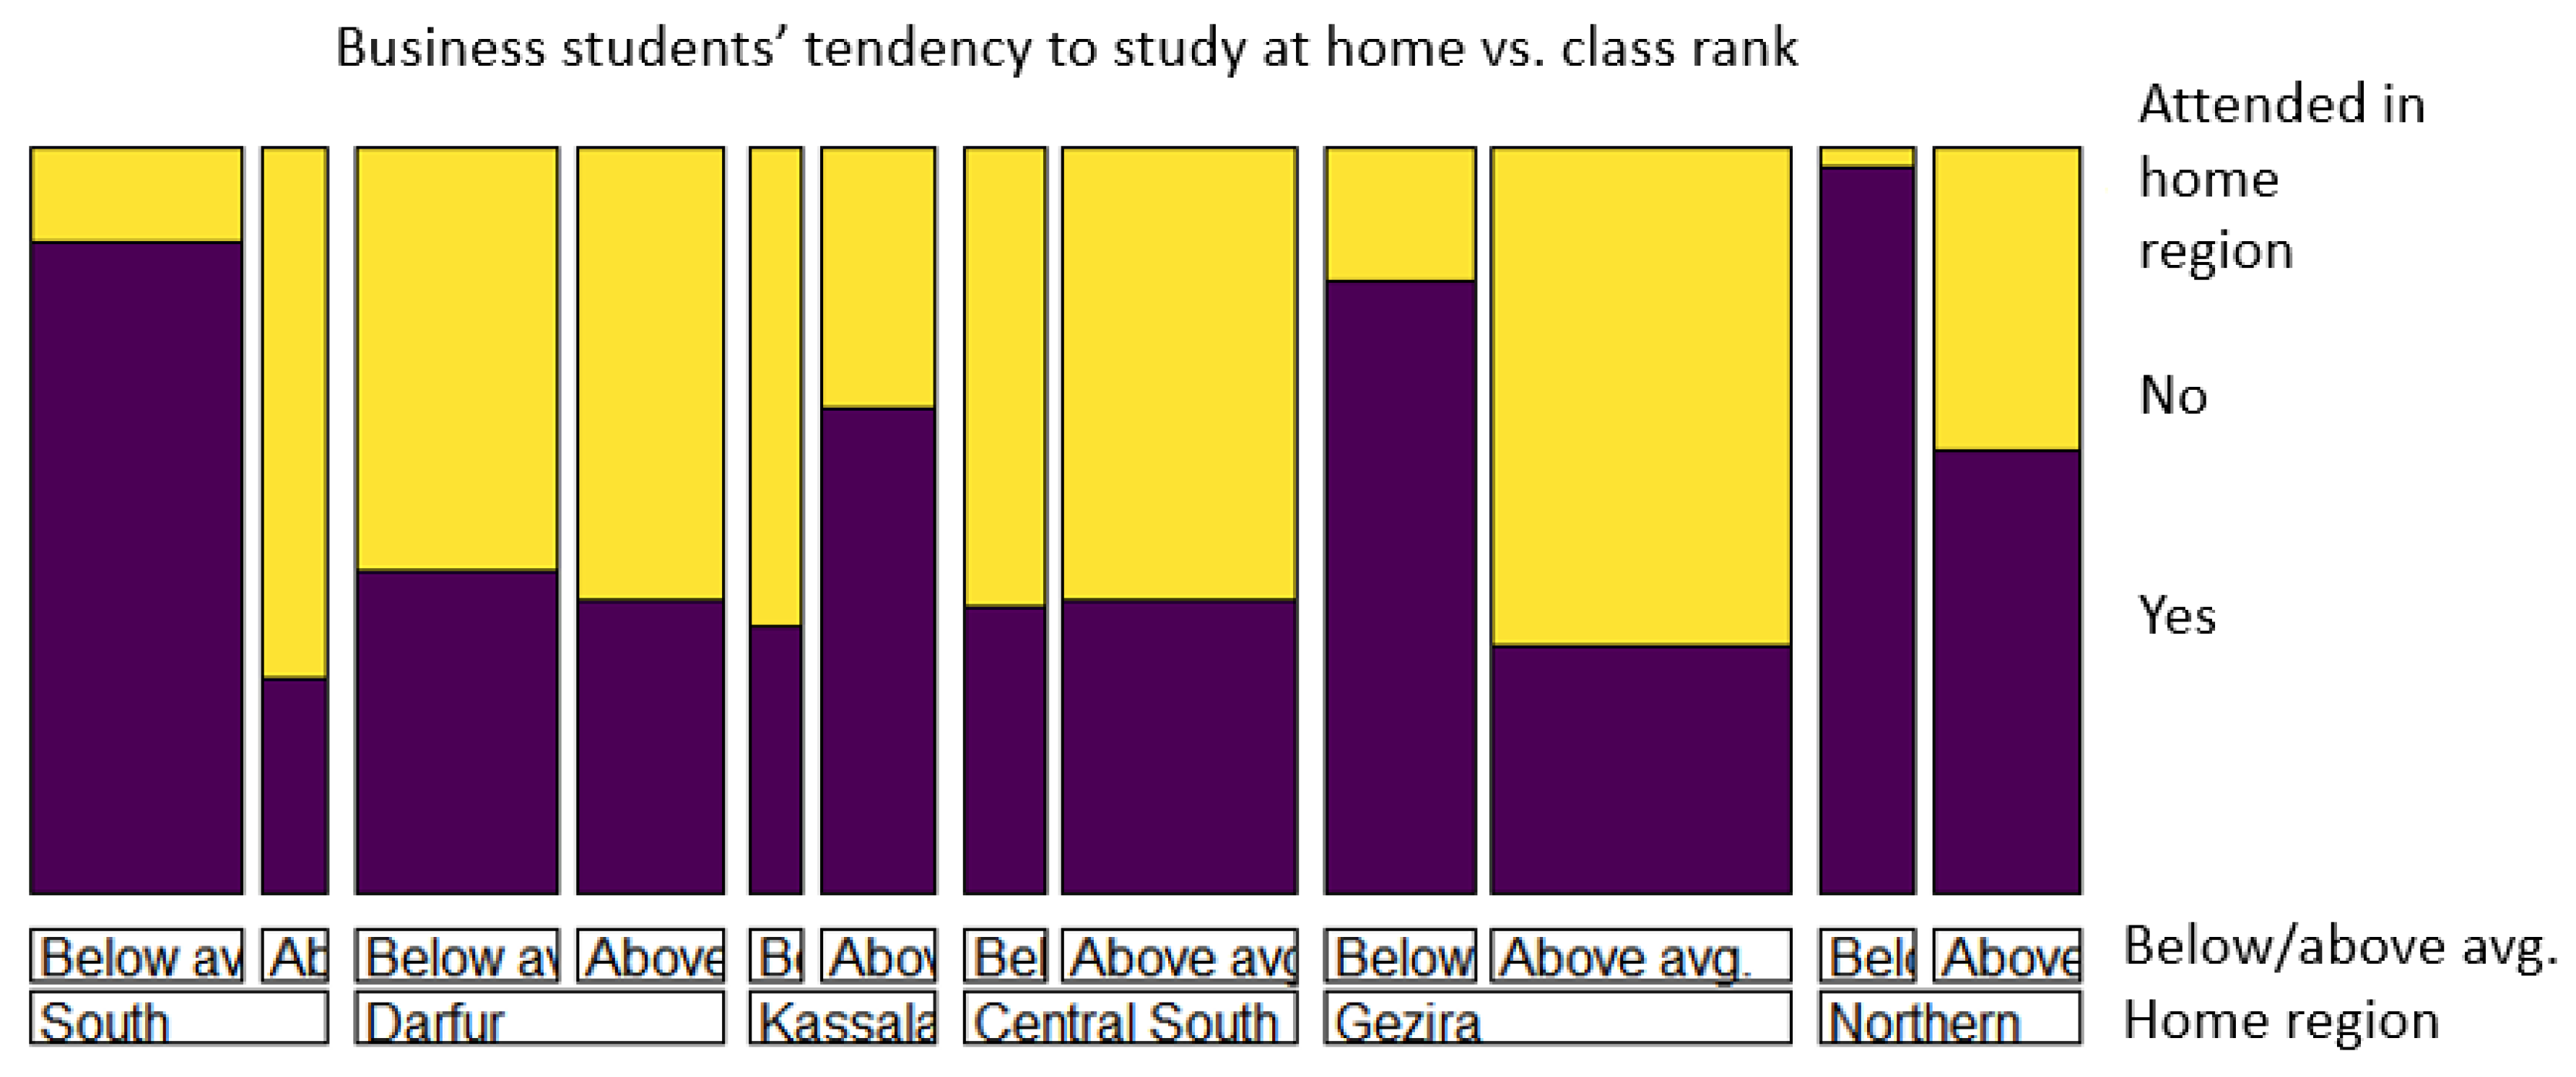
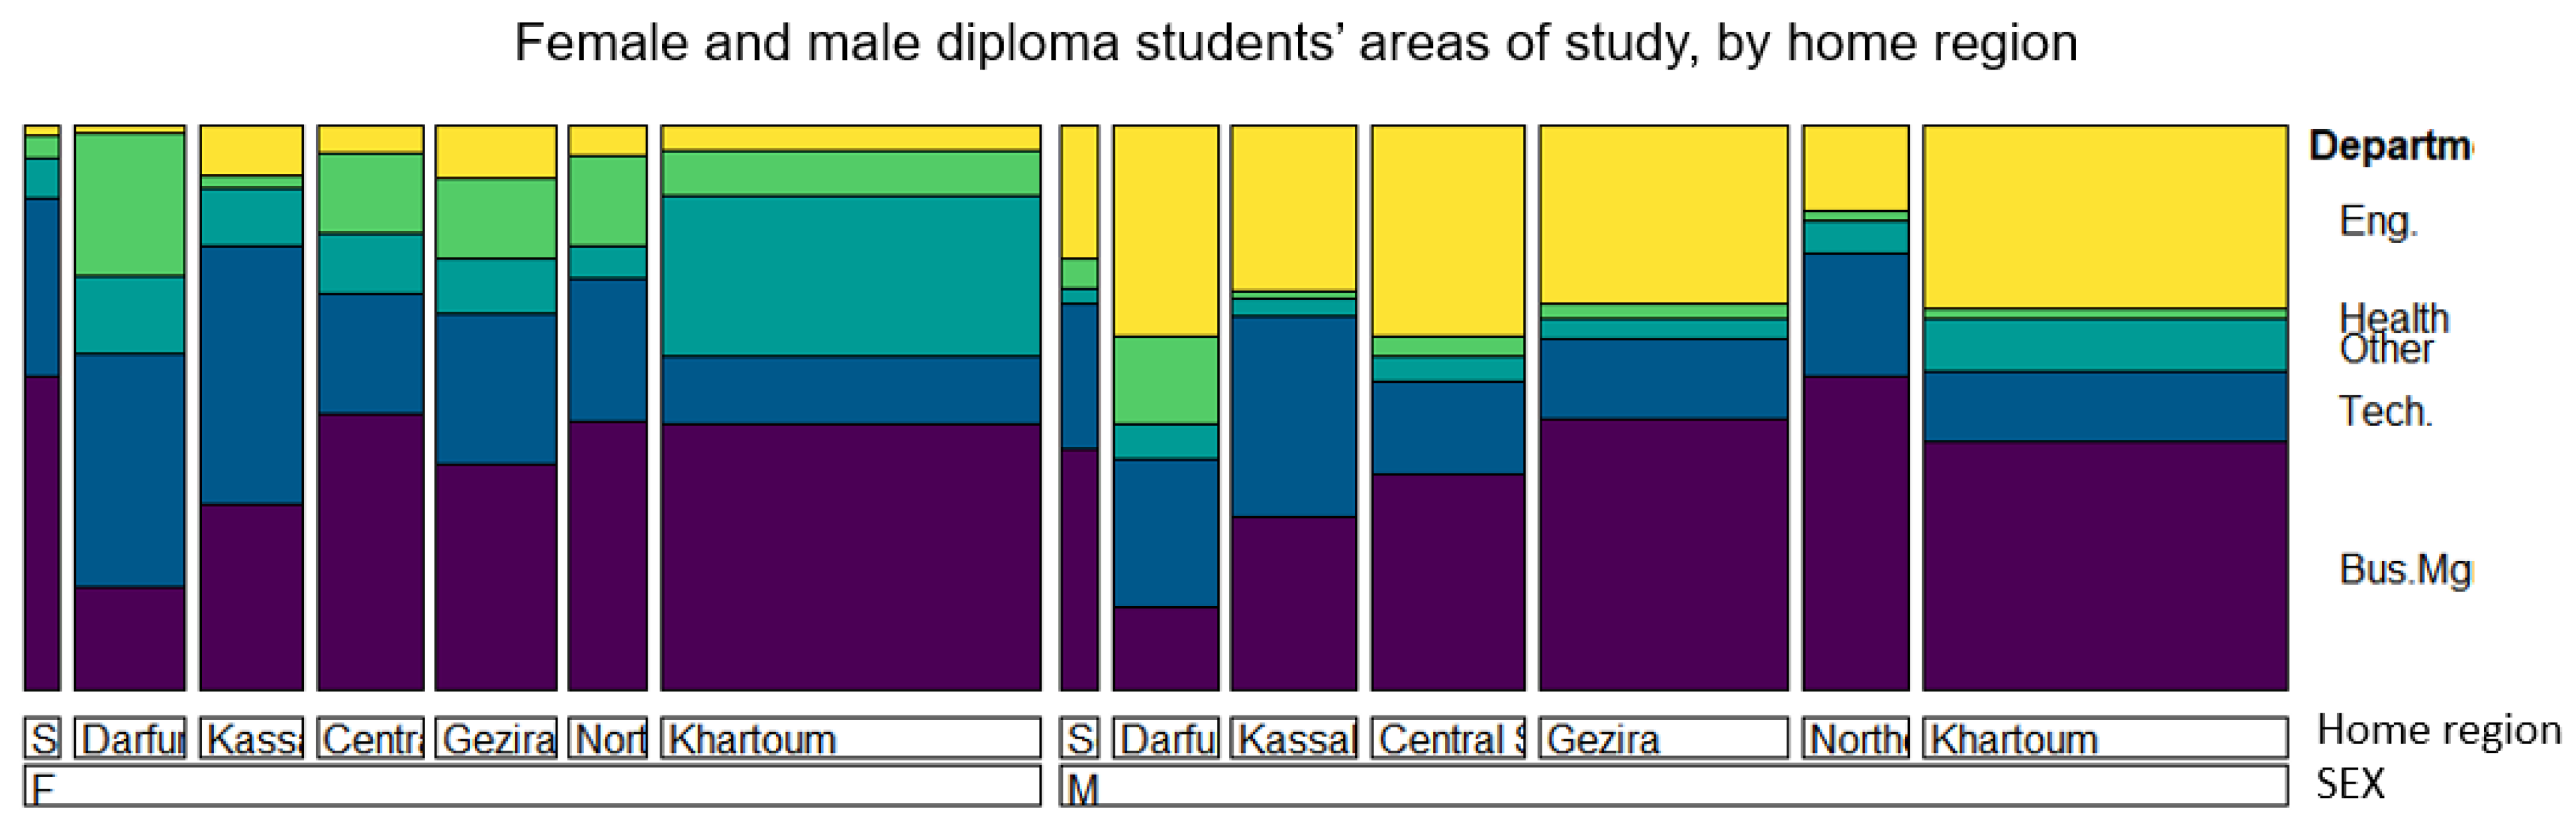
Table 1.
Population and human development index (HDI) for different regions and states in Sudan CBS (2018); Global_Data_Lab (2019). Regional HDI values are obtained from states’ values, weighted by population.
Table 1.
Population and human development index (HDI) for different regions and states in Sudan CBS (2018); Global_Data_Lab (2019). Regional HDI values are obtained from states’ values, weighted by population.
| HDI Rank | Region/State | Population (2016 proj.) | HDI (2018) |
|---|---|---|---|
| 1 | Khartoum region | 7,385,158 | 0.625 |
| 2 | North region | 2,316,524 | 0.611 |
| Northern | 887,011 | 0.625 | |
| River Nile | 1,429,513 | 0.602 | |
| 3 | Gezira region | 4,759,764 | 0.547 |
| 4 | Central South region | 7,242,603 | 0.478 |
| Sennar | 1,777,982 | 0.493 | |
| White Nile | 2,324,444 | 0.488 | |
| North Kordofan | 3,140,177 | 0.463 | |
| 5 | Kassala region | 5,817,005 | 0.468 |
| Red Sea | 1,445,353 | 0.518 | |
| Kassala | 2,360,038 | 0.453 | |
| Gadarif | 2,011,614 | 0.450 | |
| 6 | Darfur region | 9,044,343 | 0.446 |
| North Darfur | 2,280,885 | 0.461 | |
| West Darfur | 1,675,025 | 0.439 | |
| South Darfur | 5,088,433 | 0.434 | |
| 7 | South region | 3,033,261 | 0.426 |
| South Kordofan | 1,983,895 | 0.431 | |
| Blue Nile | 1,049,366 | 0.416 |
Table 2.
Socieconomic factors associated with university attendance among 19–21-year-olds, using data from CBS (2014).
| Factor | Urban | Salaried | Income in Upper 75% | Female | Father Primary ed. or Above | Mother Primary ed. or Above | Has Electricity | Has Computer |
|---|---|---|---|---|---|---|---|---|
| % of all 19–21 year olds with factor | 47% | 42% | 83% | 42% | 47% | 32% | 60 % | 10% |
| % without factor that attend university | 24% | 23% | 15% | 26% | 19 % | 23% | 11 % | 28% |
| % with factor that attend university | 41% | 44% | 36% | 41% | 43% | 50% | 46% | 73% |
| p-value | <0.0001 | <0.0001 | <0.0001 | <0.0001 | <0.0001 | <0.0001 | <0.0001 | <0.0001 |
Table 3.
Coefficients for best logistic regression model including all variables in Table 2.
Table 3.
Coefficients for best logistic regression model including all variables in Table 2.
| Estimate | Std. Error | z Value | Pr(>|z|) | |
|---|---|---|---|---|
| (Intercept) | −3.03011 | 0.25478 | −11.893 | < *** |
| Male/female | 0.44578 | 0.17385 | 2.564 | 0.010341 * |
| Region | 0.21084 | 0.04718 | 4.469 | *** |
| Has electricity | 1.40932 | 0.22797 | 6.182 | *** |
| Mother has primary ed. | 0.66190 | 0.18230 | 3.631 | 0.000283 *** |
*** p < 0.001, * p < 0.05.
Table 4.
Coefficients for best logistic regression model including all variables in Table 2, excluding mother’s education.
Table 4.
Coefficients for best logistic regression model including all variables in Table 2, excluding mother’s education.
| Estimate | Std. Error | z Value | Pr(>|z|) | |
|---|---|---|---|---|
| (Intercept) | −3.02838 | 0.25501 | −11.876 | < *** |
| Has electricity | 1.50297 | 0.22891 | 6.566 | *** |
| region | 0.21359 | 0.04669 | 4.575 | *** |
| Male/female | 0.46289 | 0.17244 | 2.684 | 0.00727 ** |
| Self-employed/salaried | 0.35574 | 0.18134 | 1.962 | 0.04979 * |
*** p < 0.001, ** p < 0.01, * p < 0.05.
Table 5.
Coefficients for best logistic regression model including all variables in Table 2, excluding mother’s education and electricity.
Table 5.
Coefficients for best logistic regression model including all variables in Table 2, excluding mother’s education and electricity.
| Estimate | Std. Error | z Value | Pr(>|z|) | |
|---|---|---|---|---|
| (Intercept) | −3.22667 | 0.31833 | −10.136 | < *** |
| Region | 30206 | 0.04515 | 6.689 | *** |
| Rural/urban | 0.53228 | 0.18199 | 2.925 | 0.003447 ** |
| Male/female | 0.55793 | 0.16895 | 3.302 | 0.000959 *** |
| Rural/urban | 0.51683 | 0.18029 | 2.867 | 0.004147 ** |
| Income quartile | 0.16995 | 0.08941 | 1.901 | 0.057328 |
*** p < 0.001, ** p < 0.01.
Table 6.
Measures of accuracy: AIC and McFadden pseudo- for Models 1,2,3.
| Full Model | w/o Mother’s Primary ed. | w/o Mother’s ed. & Electricity | |
|---|---|---|---|
| AIC: | 807.0 | 816.3 | 850.0 |
| Pseudo- | 0.173 | 0.162 | 0.130 |
Table 7.
Regression coefficients for model in which conflict regions and no-conflict regions are coded as 0 and 1, respectively.
Table 7.
Regression coefficients for model in which conflict regions and no-conflict regions are coded as 0 and 1, respectively.
| Estimate | Std. Error | z Value | Pr(>|z|) | |
|---|---|---|---|---|
| (Intercept) | −3.7398 | 0.3977 | −9.404 | < *** |
| Has electricity | 1.3580 | 0.2340 | 5.804 | *** |
| Non-conflict region | 0.8492 | 0.2089 | 4.066 | *** |
| Mother has primary ed. | 0.6204 | 0.1844 | 3.363 | 0.00077 *** |
| Sex | 0.4585 | 0.1736 | 2.642 | 0.00824 ** |
| Salaried | 0.3091 | 0.1847 | 1.674 | 0.09422 |
*** p < 0.001, ** p < 0.01.
Table 8.
Departments belonging to different categories, for bachelor’s and diploma departments.
| Department Category | Departments |
|---|---|
| Bachelor’s departments | |
| Applied Science | Agriculture, Computer Science, Botany, Nutrition, Veterinary |
| Bus. Law, Management | Business admin., Law, Tourism, Economics, Social Political Sci. |
| Engineering | Architectural, Chemical, Civil, Electrical, and Mechanical Engineering |
| Education | Education, Art & Education |
| Health Science | Health Science |
| Liberal Arts | Geography, Language & Literature, Mathematics |
| Diploma departments | |
| Business Management | Business Accounting, Tourism |
| Engineering | Electrical, Vehicle, Civil Engineering and Shipbuilding |
| Health | Animal Health, Chemistry Lab Tech, Biology Lab Tech, Medical Assistant, Medical Statistics |
| Other | Agriculture, Kindergarten Ed., Art, Journalism, Social Work and Libraries |
| Technology | IT, Applied Statistics, Physics Lab Tech |
Publisher’s Note: MDPI stays neutral with regard to jurisdictional claims in published maps and institutional affiliations. |
© 2021 by the authors. Licensee MDPI, Basel, Switzerland. This article is an open access article distributed under the terms and conditions of the Creative Commons Attribution (CC BY) license (http://creativecommons.org/licenses/by/4.0/).
Share and Cite
MDPI and ACS Style
Hamid, M.; Thron, C.; Fageeri, S. Demographics of Sudanese University Students in Relation to Regional Conflict and Underdevelopment. Soc. Sci. 2021, 10, 89. https://0-doi-org.brum.beds.ac.uk/10.3390/socsci10030089
AMA Style
Hamid M, Thron C, Fageeri S. Demographics of Sudanese University Students in Relation to Regional Conflict and Underdevelopment. Social Sciences. 2021; 10(3):89. https://0-doi-org.brum.beds.ac.uk/10.3390/socsci10030089
Chicago/Turabian StyleHamid, Monira, Christopher Thron, and Sallam Fageeri. 2021. "Demographics of Sudanese University Students in Relation to Regional Conflict and Underdevelopment" Social Sciences 10, no. 3: 89. https://0-doi-org.brum.beds.ac.uk/10.3390/socsci10030089
Note that from the first issue of 2016, this journal uses article numbers instead of page numbers. See further details here.