Evolving Patterns of Aggression: Investigating the Structure of Gang Violence during the Era of Civil Gang Injunctions

1
Criminal Justice Department, California State University San Bernardino, San Bernardino, CA 92407, USA
2
Center for Criminal Justice Research, California State University San Bernardino, San Bernardino, CA 92407, USA
*
Author to whom correspondence should be addressed.
Soc. Sci. 2020, 9(11), 203; https://0-doi-org.brum.beds.ac.uk/10.3390/socsci9110203
Submission received: 11 September 2020
/
Revised: 5 November 2020
/
Accepted: 6 November 2020
/
Published: 11 November 2020
(This article belongs to the Special Issue Research on Gang-Related Violence in the 21st Century)
Abstract
:Mapping the structural characteristics of attack behavior, this study explores how violent conflict evolved with the implementation of civil gang injunctions (CGIs). Networks were generated by linking defendants and victims named in 963 prosecutions involving street gangs active in the City of Los Angeles (1998–2013). Aggregating directed ties to 318 groups associated with the combatants, we compare four observations that correspond with distinct phases of CGI implementation—development (1998–2001), assent (2002–2005), maturity (2006–2009), and saturation (2010–2013). Using a triad census to calculate a ratio of simple patterns (retaliation, directed lines, and out-stars) to complex three-way interactions, we observed that CGIs were associated with a substantive thickening of conflict—greater complexity was found in conflict relations over time. Dissecting the nature of change, stochastic actor-oriented models (SAOMs) show that enjoined gangs are more likely to initiate transitive closure. The findings suggest that crime control efforts must make regular adjustments in response to the evolving structure of gang interactions.
1. Introduction
The harm generated by gang violence extends beyond members and their rivals, threatening entire communities. The murder of Michael (20) and Timothy Bosch (21) illustrates this point. The brothers were hanging out in Culver West Alexander Park on 27 September 2003 (Noonan 2008). A Culver City Boys (CCB) gang member approached, and pointing a gun to Timothy’s head, declared his affiliation and asked whether the victims belonged to a rival gang. Not believing the victims’ denials, the brothers were shot. Bystanders are also caught in the crossfire. Melody Ross (16), a cheerleader at Wilson High School in Long Beach had just left her homecoming football game in 2009 and was sitting with a friend on a curb outside her school. Nearby stood two Rollin 20’s Crips gang members, both of whom were not students. Melody did not know them. Two Insane Crips rival gang members approached, exchanging gang slurs with the Rollin’ 20’s Crips. One of the Insane Crips shot in the Rollin 20’s Crips direction. Both Rollin 20’s Crips were wounded: Melody Ross died (Vives and Bolch 2009). As these cases show, gang violence puts all members of the community, gang and non-gang involved, at great risk.
To stop the spread of violence, the City of Los Angeles adopted several crime control strategies, one of which was to enact civil gang injunctions (CGIs) targeting the most violent groups. Across successive administrations, three City Attorneys enacted a total of 46 civil gang injunctions targeting 72 gangs. One of the aims behind the use of injunctions was to suppress the kinds of social interactions thought to facilitate gang violence. A critical feature of most CGIs is a clause designed to restrict a gang’s ability to exert a visible public presence in specific neighborhoods.
While research shows that focused crime-reduction interventions can reduce crime (Braga and Weisburd 2012), there is still a need to understand how targeting the most problematic actors, such as the most violent gangs by implementing a CGI, impacts the larger community. Why? Because gang violence is an inherently social phenomenon (Lewis and Papachristos 2020)—embedded in a community of combatants, targeting one gang is likely to generate ripple effects throughout the social landscape that includes other groups with whom the target gang interacts. Targeting one, or a set of highly aggressive gangs, stands to reshape the structure of violence across the conflict network.
By understanding how crime control efforts shape networked violence, we are in a better position to develop interventions that minimize displaced aggression, reduce gang conflict, and improve public safety. While the structure of gang violence has been investigated within a single gang (e.g., McCuish et al. 2015), within identifiable neighborhoods and large regions (e.g., Randle and Bichler 2017; Tita and Radil 2011; Radil et al. 2010), and across cities, i.e., Boston (Papachristos et al. 2013), Chicago (Lewis and Papachristos 2020; Papachristos 2009), Montreal (Descormiers and Morselli 2011), and Newark (McGloin 2007), to the best of our knowledge, this study is among the first to investigate shifting patterns in the structure of street gang violence associated with a protracted crime control strategy such as CGIs. The present study extends network investigations of gang conflict by comparing four violence networks generated from incidents occurring within a 16-year study period (1 January 1998–31 December 2013). Our primary aim is to document whether there were substantive shifts in the structure of violence that correspond with phases of CGI adoption in the City of Los Angeles.
This paper unfolds as such. Before we outline how we investigated gang violence networks, we briefly describe CGIs as implemented in California and explore current thinking about violence networks and the implications for gang control strategies. After describing the methodology used, we report on two sets of analyses—triadic censuses and stochastic actor-oriented models—before discussing the most salient implications of this investigation of gang-involved violence.
2. Background
2.1. CGIs and Focused Deterrence
CGIs are a crime control strategy designed to impose behavioral restrictions on gangs and/or gang members within designated areas. The City of Los Angeles defines a gang as a group of allied individuals working toward a common purpose who engage in violent, unlawful, or criminal activity to achieve their aims. The group brands itself with symbols (e.g., tattoos and colors), often has common demographic characteristics and may exert control over specific areas within neighborhoods (LAPD 2020). CGIs fall under California Civil Code, sections 3479 and 3480, which permit civil restrictions on activity found to be a public nuisance. Of interest to the present study, CGIs impose restrictions on public behaviors within designated areas, known as “safety zones”. Gang members can be subjected to enhanced penalties for engaging in illegal behavior in the safe zone (e.g., selling drugs, vandalism, and threatening/intimidation). Other specifications may require individuals to adhere to a curfew or avoid hanging out with other gang members in public (this includes driving, walking, standing, or appearing together in the public’s view). Restrictions are also imposed on the gang itself such as; no gathering in public areas, no lookouts or loitering, and no recruiting children.
CGIs can be framed as a focused-deterrent strategy directed at reducing gang-involved violence. Focused deterrence is a problem-focused policing approach, which calls for targeting individuals or groups that are driving crime in specific areas (Braga and Weisburd 2012). Those who violate CGIs may face civil sanctions, such as financial penalties (up to $1000) or they may receive gang enhancements on their sentences (up to 25 years). These sanctions are meant to send a clear message to targeted individuals that the cost of engaging in the prohibited behaviors is high. By imposing behavioral restrictions and increasing penalties for engaging in those behaviors, CGIs are intended to deter gang violence in the community.
Implicit in the use of CGIs is the notion that social interactions trigger violence. For example, violence may occur when gang members congregate in public space, particularly if the location is known to be linked to a specific gang member (i.e., someone’s home) or controlled by the gang (e.g., established turf or set space). Here, social interactions expose individuals to risk when rivals pass by looking for conflict. Thus, some of the stipulations included within CGI conditions aim to remove opportunities to become involved in social interactions that may lead to violent altercations, i.e., do not drive, stand, sit, walk, gather or appear with other gang members in public view or anyplace accessible within designated areas of the city (usually areas claimed as gang turf).
Most studies examining the effectiveness of civil gang injunctions explore the reduction in crime within designated areas. Studies find that CGIs are associated with a decline in serious and violent crime in areas with safe zones (e.g., Carr et al. 2017; Grogger 2002; LA Grand Jury 2004; Ridgeway et al. 2019). While previous research has found most crime control effects to be short lived (e.g., Maxson et al. 2005; O’Deane and Morreale 2011), a more recent study by Ridgeway et al. (2019) examining quarterly crime reports from the Los Angeles Police Department (LAPD) between 1988 and 2014 found a 5% short-term decline in crime, as well as a 18% long-term decline in crime in targeted areas. Even though research examining the impact of CGIs on levels of crime in focal neighborhoods have typically found positive effects, studies focusing on individuals targeted by the CGIs have been less encouraging. For example, interviewing gang members subjected to CGI restrictions, Swan and Bates (2017) discovered that individuals continued their gang activities after CGIs were imposed on them; their activities shifted to neighborhoods without gangs or to rival gang territory, which intensified existing conflict. Exploring the structure of post-CGI conflict among 23 Bloods and Crips gangs, (Bichler et al. [2017] 2019) discovered the most aggressive gangs became more enmeshed in a web of violence and more centrally located in chains of violence post-injunction—CGIs were associated with increased violence (Bichler et al. [2017] 2019).
Why would violence increase post-CGI? Because, as much as CGIs may help to remove opportunities for conflict, they also contribute to reshaping the local social landscape, which may displace, alter the nature of, or generate more violent conflict. Each gang is embedded in a local social system wherein groups vary on their perceived social standing within the community (e.g., dominance and street respect), control of resources (such as drug sales), and physical proximity to other groups (Lewis and Papachristos 2020). The imposition of a CGI is a public announcement that the group is under increased scrutiny and that their public behavior is restricted. As such, CGIs alter the local social system, and may push gangs to other areas to remain competitive (e.g., expanding drug markets by invading rival territories), leading to more aggression. It is also plausible that as enjoined gangs refrain from public displays of dominance, their territorial control may faulter leading other groups to attack. Thus, investigating how the social landscape of gang-related violence changes in response to coordinated crime control interventions enriches our understanding of conflict dynamics in a way that may support the development of more effective prevention measures.
2.2. Networked Violence
The dynamics of gang violence are complex and constantly shifting. Research in this area has regularly focused on the behaviors of the gangs and/or individual gang members; often using ethnographic and survey-based research, to understand changes in gang-on-gang violence. Studies examined gang cohesion (Decker 1996; Hennigan and Sloane 2013; Klein and Maxson 2010; Papachristos 2013), motivating factors for gang behavior such as turf disputes (Braga et al. 2006; Papachristos et al. 2010), social influences (Hennigan and Spanovic 2012; Stafford and Warr 1993), and interpersonal disputes (Papachristos and Kirk 2006); as well as, the amorphous nature of gang membership (e.g., Decker 1996; Melde and Esbensen 2013) to understand shifts in violence. Contributing to this body of work, we concur with recent arguments suggesting that there is a need to use structural metrics to understand how violent social interactions among pairs of gangs shape gang violence at the community level (e.g., Lewis and Papachristos 2020).
Violent encounters involving gang members do not occur in isolation. Rather, gang members are embedded within an intricate web of social relations that aggregates to form a complex network of interlinkages binding gangs within a larger community of violence. At the individual level, individuals respond to what they learn or experience, and in turn, this reaction facilitates additional ripple effects, often spreading in a hyperdyadic process toward new people (See: Christakis and Fowler 2009). For instance, when a gang member suffers an injury or perceived harm to reputation or status, the individual (or group acting on their behalf) will react in some fashion, often in an effort to reciprocate harm (e.g., Papachristos et al. 2013, 2015). Notably, the individuals involved in the initial act of violence may not be the actors who retaliate. Instead, other members of the group may initiate violence, toward the original aggressor or someone else associated with the aggressor’s gang. Thus, there are advantages to aggregating violent conflict to the group level when examining the pattern of conflict—gang-on-gang attacking behavior may better capture the web of conflict.
While an initial act of violence can set a sequence of interactions into motion, fueling continued conflict, transference or retaliation is not necessarily the most likely outcome (e.g., Randle and Bichler 2017). Investigating the likelihood of direct retaliation (reciprocated violence) relative to other reactions, Lewis and Papachristos (2020) also find evidence of generalized retaliation wherein gangs unable to reciprocate directly against the group that murdered one of their own, launch attacks directed at other gangs. Of critical importance in understanding how violent conflict ripples through communities is the structure and topography of the local social neighborhood. Structural hierarchies are likely to exist that reflect local patterns of social dominance. In network terms, the local social neighborhood includes everyone a focal individual is directly connected to, referred to as alters, as well as all the links among those alters. Local social neighborhoods are important because they influence what information groups receive and how they react to events, providing a glimpse into the social context within which a focal gang is embedded. These patterns may be indicative of competitive dominance (Brantingham et al. 2019).
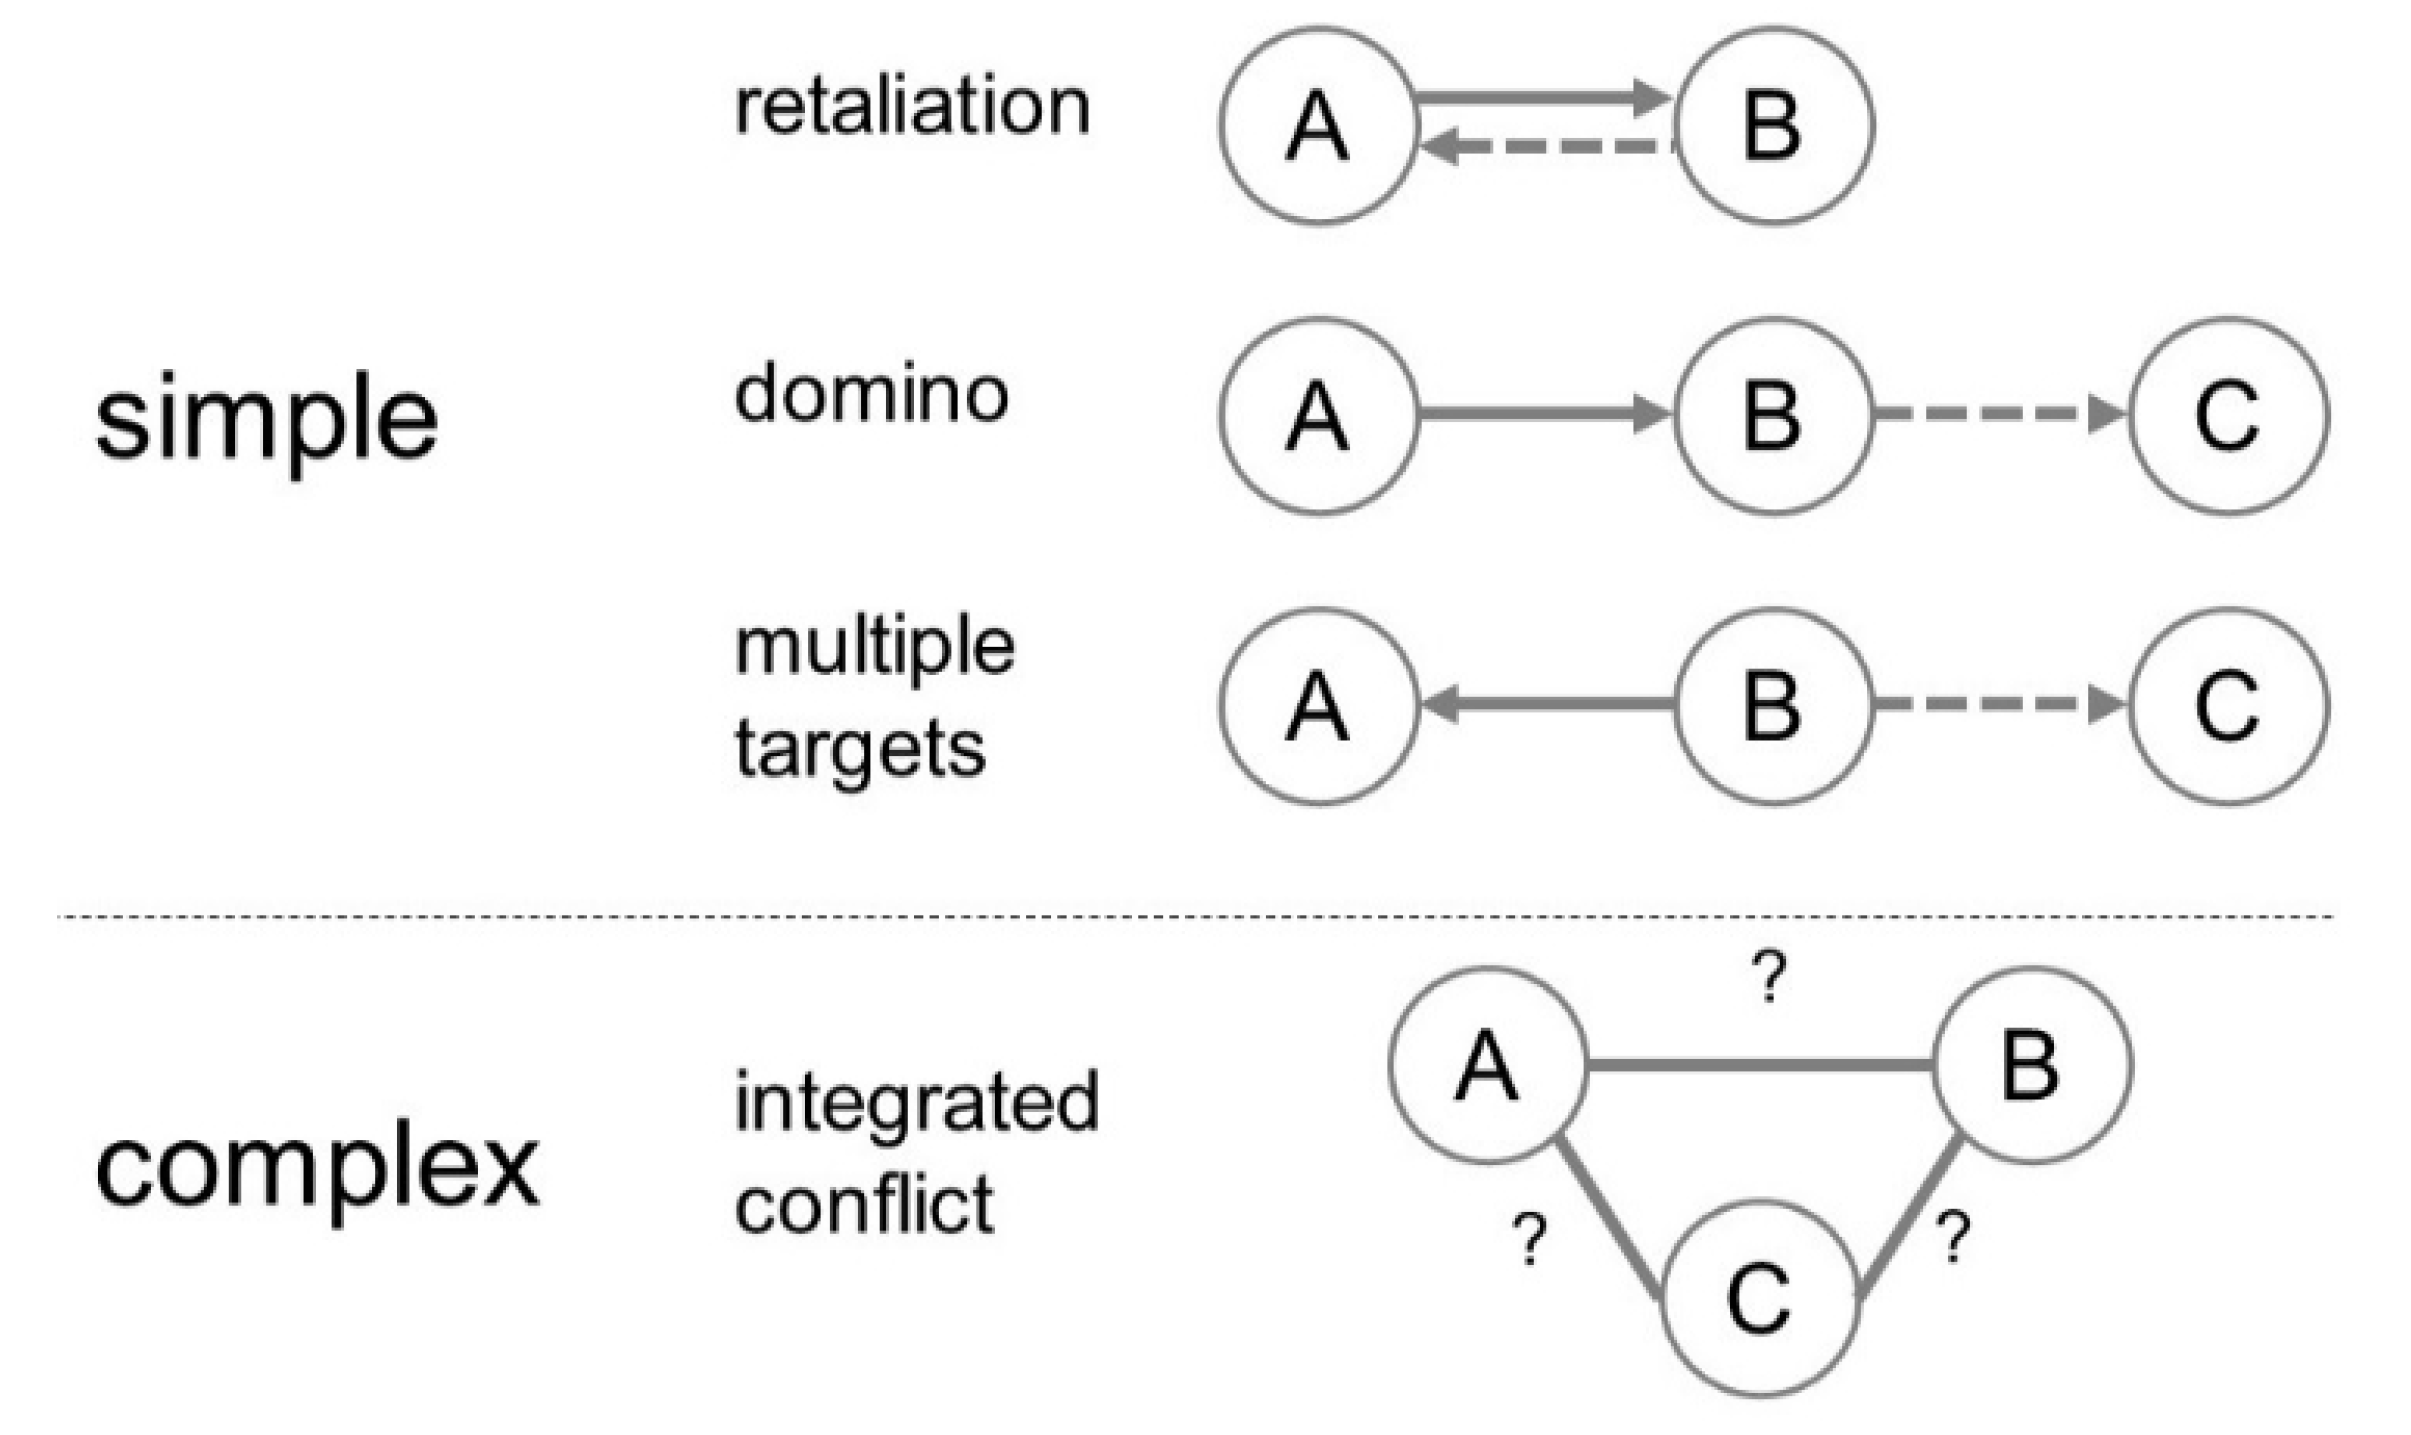
Figure 1 illustrates two sets of interaction patterns that may result from an initial violent event. Circles represent gangs and the directed arrows originate at the aggressor and terminate at the victim. The dashed arrows depict the reaction from an initial aggression (solid line). Looking at the transmission of aggression, three simple structures are profiled. Direct retaliation by the aggrieved group may occur when groups have equivalent stature within the community. Imbalanced patterns of violence may indicate the groups have unequal social status. For instance, a knock on or domino effect representing a directed line suggests that the victimized gang is unable to respond directly, instead they attack another group of lesser status. When direct retaliation does not occur, the group can become emboldened, reacting to their “success” by launching several attacks aimed at different groups (referred within network analytic approaches as out-star structures) to improve their position of dominance.
Prior research using network analytics observe different hierarchical structures that may reflect differential positions of competitive dominance. For instance, mapping conflict among 158 primarily Blood and Crip gangs active in Los Angeles, Randle and Bichler (2017) discovered a high level of internal conflict (within group violence), in-star and out-star structures (wherein a group was attacked by multiple gangs, or a gang attacked many others), and directed lines (one gang attacks another who then attacks a third group). More in tune with the present study, (Bichler et al. [2017] 2019) investigate the structure of violence for 23 Bloods and Crips gangs under civil gang injunctions, in the City of Los Angeles. While there is a tendency for the most violent groups to be victimized the most, local hierarchies exist (e.g., directed lines); and attack networks change significantly over time. Investigating murder in Chicago, Lewis and Papachristos (2020) significantly extend this line of inquiry by testing the likelihood that different local structures shape the larger network of violence, discovering that direct reciprocity differs by group attributes (e.g., race) and that other more complex structural features, associated with generalized reciprocity, vary significantly over time when short observation windows are used (e.g., two years). Of note, these authors also found that a few particularly aggressive groups are central to spreading violence through the network (in network terms this is activity spread) and that when two gangs are attacked by the same aggressor, they attack each other (reflecting the network structure called popularity closure).
Complex structures, like popularity closure, involve three-way relations of integrated conflict among a set of actors A, B, and C: these structures may reflect a social hierarchy of dominance among gangs (Papachristos 2009; Papachristos et al. 2013). When someone from gang A kills a member of gang B, and a member of gang B responds by attacking a third party from gang C, a triadic structure emerges that closes the loop: the loop closes when the third party to the violence, gang C, shoots a member from gang A. To illustrate that there are many different complex structures in addition to the scenario just described, the lines labeled with question marks in Figure 1 can be replaced with directed arrows. Specifically, there are seven different configurations of interest: A→B←C, A→C; A←B←C, A→C; A←B→C, A←→C; A→B←C, A←→C; A→B→C, A←→C; A→B←→C, A←→C; and A←→B←→C, A←→C.
Mapping the network of violence that emerges from local conflict, provides insight into the larger community dynamics that may facilitate aggression. It is possible to support interdiction efforts by observing change in these patterns. Where gang violence is characterized by simple structures, and prolific aggressors dominate, crime control strategies may best target the main instigators of violence, particularly when there is a small set of aggressors generating pockets of violence. Where the ratio of simple to complex structures favors integrated patterns of conflict, a multi-faceted approach targeting inter-related sets of gangs may yield greater violence reduction. Crime control strategies would stand to be more effective if a set of combatants were targeted, rather than a single aggressor.
2.3. Current Study
The imposition of a civil gang injunction is, without doubt, a clear public admonition of a group’s behavior. As such, it should trigger a shift in violent behavior, in either the frequency of aggression, direction of attack, or selection of targets (Randle and Bichler 2017; Bichler et al. [2017] 2019). While individual level changes in behavior are expected as police officers interact with specific gang members, the sanction is directed toward the entire group. By aggregating individual-level interactions to the gangs each combatant affiliates with, we can map out emergent gang-on-gang conflict patterns (Lewis and Papachristos 2020). Joining the local social conflict neighborhoods of individual gangs will reveal the emergent community structure of violent relations.
By examining an entire community of conflict, we extend prior research that investigated a single gang (e.g., McCuish et al. 2015), a single neighborhood (e.g., Brantingham et al. 2019), or drew from a subset of gangs sharing a characteristic, i.e., predominantly African American gangs, such as Bloods and Crips (Randle and Bichler 2017; Bichler et al. [2017] 2019). In addition, comparing across successive waves of observations offers a way to explore the cumulative effect of multiple CGIs on the structure of violence. As more gangs are enjoined, the effect of this crime control strategy may evolve. To date, only one study has documented the long-term effect of the CGI experience in Los Angeles (see Ridgeway et al. 2019): while this spatial investigation revealed neighborhood trends, it was unable to expose changes in the social interactions among gang members. For instance, violence may decline in affected neighborhoods if CGIs drive gang members away. However, as Swan and Bates (2017) discovered through an ethnographic study involving interviews with gang members, criminal behavior and interactions may shift to communities in other cities (not proximate displacement)—a network approach is needed to investigate this possibility.
Our general expectation is that aggression levels change following the imposition of CGIs, with targeted gangs becoming more deeply embroiled in complex patterns of violence (Bichler et al. [2017] 2019; Lewis and Papachristos 2020). Gang associations are dynamic (Ouellet et al. 2019), and as individuals respond to perceived harms to address challenges to social status (Papachristos 2009), conflict may erupt that involves unexpected combatants (Descormiers and Morselli 2011), particularly given that the structure of violent relations is unstable, shifting substantially between observations (Lewis and Papachristos 2020). The imposition of a CGI is a gang-specific attack, and successive attacks on groups operating within a street gang community could generate a cumulative effect that substantively alters the structural indicators of competitive dominance. With little prior work documenting the nature of structural change to expect, we posit that while the embeddedness of conflict is likely to be unstable, the overall tendency should be that complexity will increase given that gangs may shift activities to new areas (Swan and Bates 2017). At the community level, as more gangs are enjoined there may be a saturation effect, thus, when the CGI adoption curve reaches the assent and maturity phases this should correspond to shifting ratios of simple to complex patterns across successive observation periods, i.e., more popularity closure. At the gang level, the most aggressive groups may exhibit a significant growth in dominance, meaning they attack more following the imposition of a CGI.
3. Methods
3.1. Case Identification and Network Generation
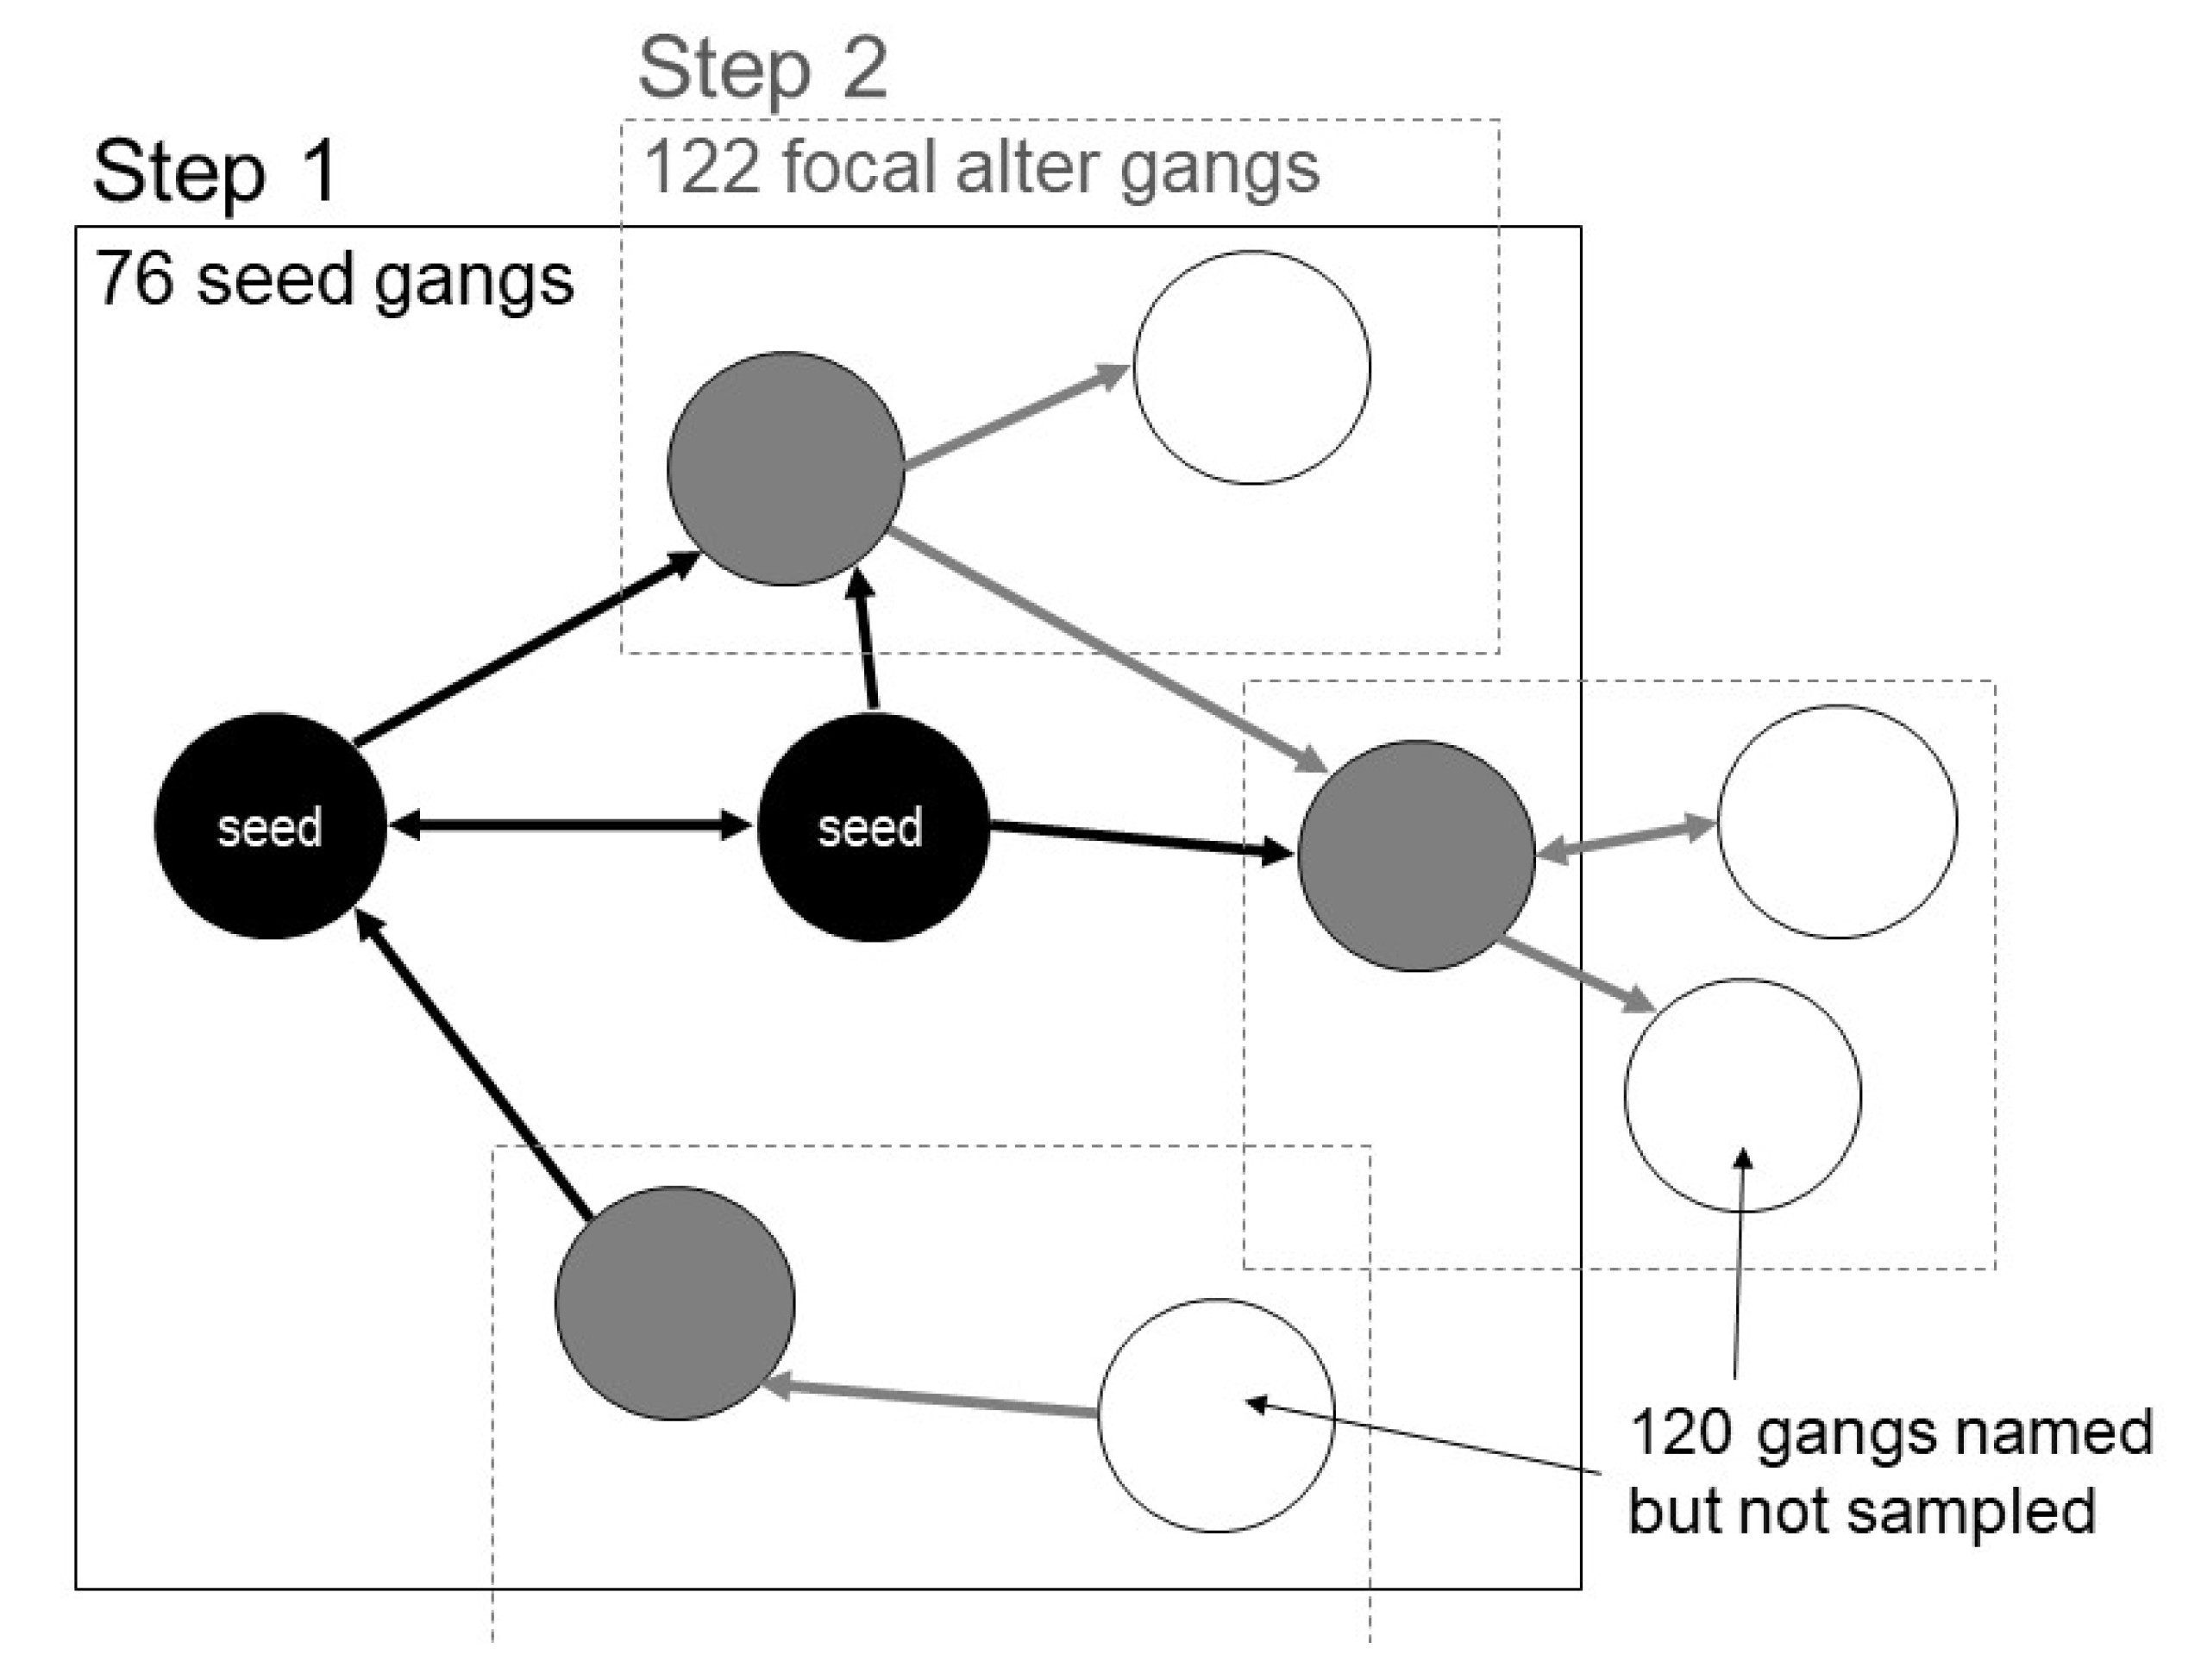
A 2-step sampling method was used to identify cases of street gang violence (See: Figure 2). The first step involved identifying cases associated with seed gangs. Seeds are the starting actors used when sampling with a link-tracing method. In this study, seed gangs include all LA-based gangs (and cliques) named in civil gang injunctions filed in the City of Los Angeles between 1 February 2000 and 24 September 2013. We used the advanced search parameters of Westlaw and LexisNexis to restrict the hits returned to California court cases occurring within the designated observation period. Next, all other gangs associated with named victims or co-offenders were searched. Formal names and variations of gang names were used in this second step to ensure comprehensive case capture. The 2-step sampling procedure generates complete egocentric networks for 76 seed gangs and 122 alters (groups involved in conflict with the seed gangs). In general terms, this sample constitutes 198 case studies. Egocentric networks include the focal actor (e.g., each seed gang) and all connections among those actors directly connected to focal actors (alter gangs). Representing the local social world in which actors are embedded, egocentric networks provide a glimpse into the social network as seen from the actor’s perspective. The 120 additional groups identified in the second step (see the secondary alters illustrated with white symbols in Figure 2) constitute the boundary of the network, as we do not have complete information about the conflict patterns involving their local social neighborhoods.
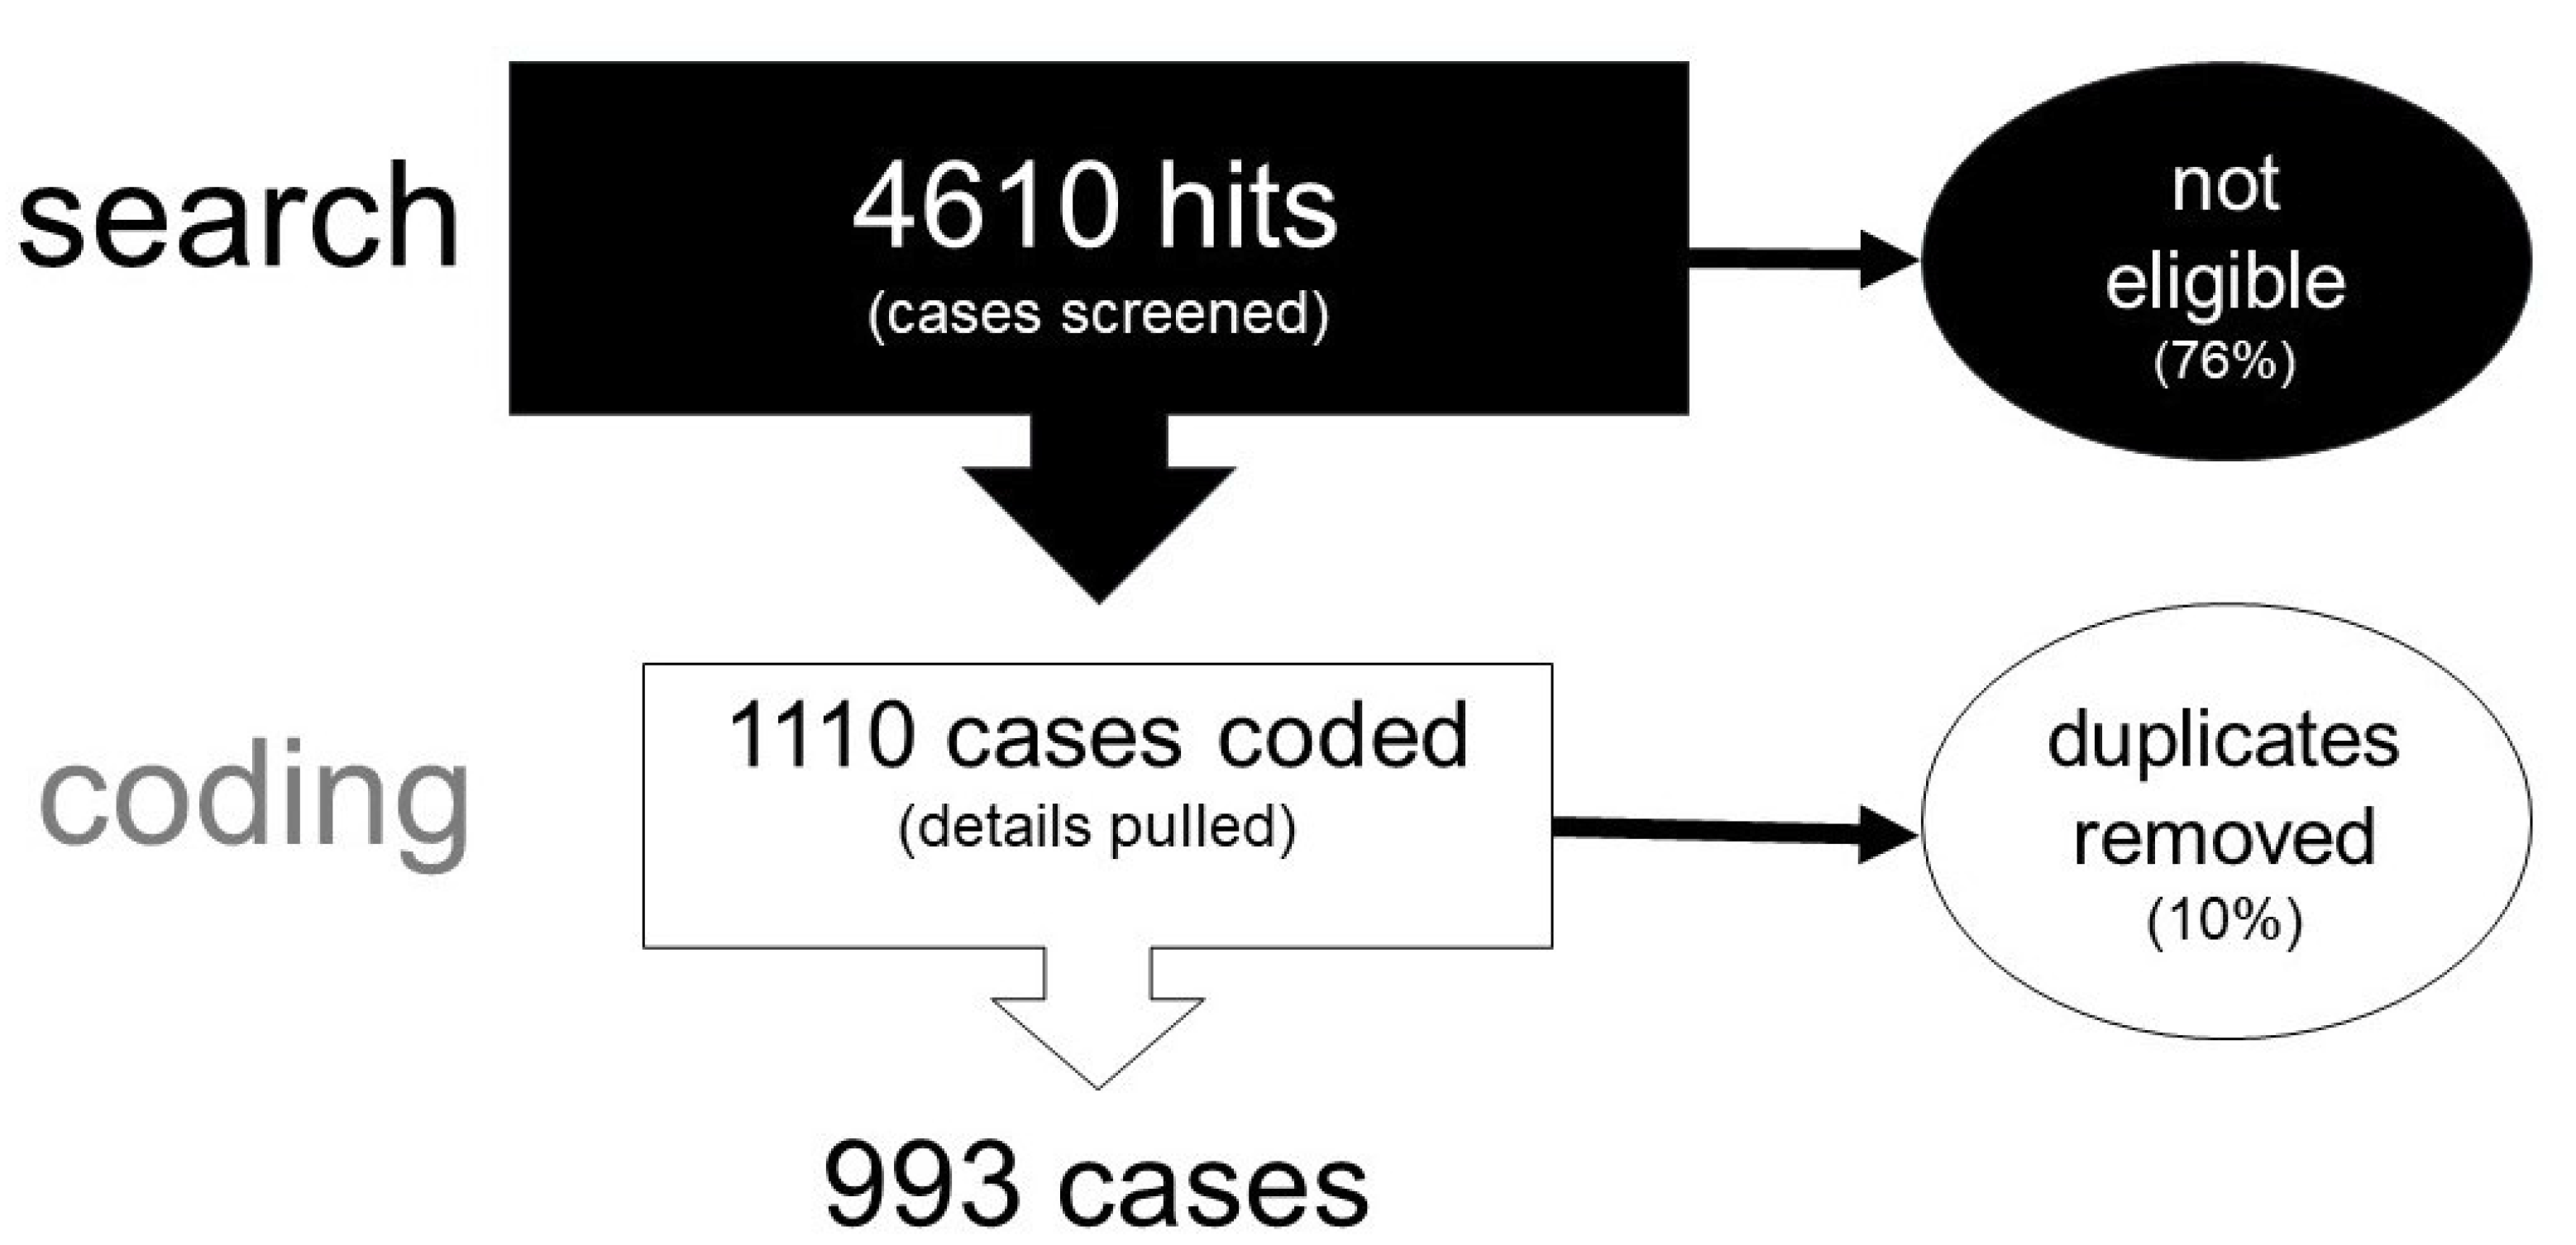
The sampling procedure generated 4610 cases. Four inclusion criteria were applied to focus the investigation on gang violence originating from the City of Los Angeles:
- The case involved at least one gang known to be based in the City of Los Angeles;
- There was at least one charge/conviction for a violent crime (e.g., assault with a deadly weapon, attempted homicide, or homicide);
- At least one defendant was tried as an adult;
- The crime occurred between 1 January 1997 and 31 December 2016 somewhere within the five-county study region—Los Angeles, Orange, Ventura, Riverside and San Bernardino.
As illustrated in Figure 3, this screening protocol reduced the sample to 993 cases—35 additional Mexican Mafia cases were identified but not included here as they did not involve a direct act of violence perpetrated by this group.
Extracting information from the 993 cases found to satisfy all inclusion criteria, we identified 1771 defendants and 1944 victims1. Exploring combatants’ age was challenging given a large amount of missing information (27% of subjects); however, incidents regularly involved interactions among adults and young people (only 35 cases were known to involve only juveniles or minors). Exploring age further, approximately 20% of individuals (n = 3004 individuals with age reported) involved in these violent conflicts were known to be under 21 years of age (16.6% were juveniles; 3.1% were minors). From a case perspective, 34% of cases (n = 993) involved at least one minor or juvenile, and from a group perspective, 55% of 307 street gangs observed in this sample were involved in at least one conflict involving someone reported to be under 21.
Approximately 77% of cases (n = 993) involved murder or attempted murder, with the remainder distributed across robberies (12%, including carjacking), assaults (9%) and other types of violence (2%). Most incidents involved gun crime (91%). Investigating incident location, we discovered that 70% occurred in the City of Los Angeles, and while the remaining 30% of cases transpired in 84 different cities spanning from Oakland to San Diego, most occurred in cities within a one-hour drive (no traffic) from Los Angeles. Within the City of Los Angeles, violent incidents occurred in 97 identifiable neighborhoods or areas.2 Most cases involved a social context wherein offenders did not act alone, such as parties or other social gatherings, however, 64.9% of cases list co-offenders and approximately half of these incidents (31% of cases) describe 2 or more co-offenders. In approximately 51% of cases, a single victim was named.
Valued, directed conflict networks were generated by linking each defendant and accomplice named in the case to each identified victim. As such, directed ties (referred to as arcs) represent acts of aggression. This means that if there were two co-offenders and one victim, two arcs were generated; two co-offenders and two victims resulted in four directed acts of aggression; and one offender attacking three victims resulted in three aggressions. Amplifying the amount of violence in this way permits us to weight the network to reflect the dominance of gangs. When multiple gang members attack, or a lone offender victimizes a group of people, community impacts are magnified as this level of aggression stands to inflict greater street terrorism.
Associated gangs and cliques were recorded for each offender and victim. Due to the extensive amount of missing clique information, we aggregated ties by the gang in order to investigate gang-on-gang violence. Since some victims were not known to be affiliated with a gang, 11 additional group categories were used—7 law enforcement and criminal justice agencies, and 4 community groups (community, drug dealer, drug involved, and pimps).
Investigating the number of cases identified per year, we discovered censuring: few cases occurred before 1998 or after 2013.3 As a result, we reduced the 20-year observation period to a 16 year period. As discussed shortly, this distribution better mirrors the trend in CGI enactments, and only results in a 3% loss of cases.
Applying final data cleaning protocol, we arrive at the sample used in this analysis. The final sample is drawn from 963 cases and includes 318 groups with 3710 arcs (representing 625 unique conflict dyads). The loss of 4.6% of arcs (179 offender/victim dyads) is the byproduct of missing case details—23 ties were lost due to missing information about the year when the crime occurred and the rest were lost due to missing gang affiliation (e.g., a victim or offender was described as a gang member but the gang was not named). Despite finding a high level of connectivity—96.6% of groups are linked in one large connected structure—the conflict network exhibits low cohesion. Of all the possible conflict combinations, 3.4% of the groups were connected by at least one act of violence.
3.2. Analytic Framework
To investigate the cumulative impact of CGIs across 16 years, we used four observation periods—development (15% of CGIs filed from 1998–2001), assent (40% filed 2002–2005), maturity (35% filed 2006–2009), and saturation (10% filed 2010–2013). CGIs are inherently a prosecutorial crime control mechanism aimed at addressing chronic community crime problems, thus, exploring the change in cases generated is an appropriate analytic framework. We considered the social-legal context of the adoption curve of what was at the time, an innovative crime control strategy, when developing observation periods. The development period constitutes a baseline under the leadership of Los Angeles City Attorney James K Hahn, during which this wave of CGIs began. This period includes two years prior to the filing of the first CGI in order to capture the violent events that generated the political and community impetus leading to the use of this gang control strategy. The next two periods encapsulate growing use of this innovation, split between assent and maturity periods, both of which span City Attorney Rockard J. Delgadillo’s term in office. The final observation captures the saturation phase in the adoption curve of CGI implementation in Los Angeles; during this period, Carmen A. Trutanich was the City Attorney of Los Angeles.
Since network structures are based on relational data, our analytic approach includes two procedures, each designed to account for interdependence between observed relationships (Krackhardt and Stern 1988). First, we use a triad census to catalogue the different classes of simple and complex structures found in each phase of CGI adoption. Triad counts have long served as a foundation upon which to generate theories about relational patterns, when studying associations among sets of three people (See: Wasserman and Faust 1994). With few prior studies investigating in detail, there is little evidence upon which to select specific local patterns of street gang violence that may give rise to the overall network structure observed during each phase of CGI adoption (See for example: Lewis and Papachristos 2020). If the overall complexity of conflict changes, as identified by the triad counts, we can dissect the nature of change with stochastic actor-oriented models (SOAMs).
SOAMs are part of a class of longitudinal statistical modeling techniques (part of the exponential family of random graph models, or ERGMs) used to test hypotheses about factors thought to be conducive to change or evolution in the network. Several theoretical assumptions underly these kinds of models, e.g., patterns reflect structural processes, and networks are dynamic and react to multiple, simultaneous processes (Robins and Lusher 2013, p. 10). Focused on the decisions of actors, SOAMs assume that actors control their outgoing ties, making changes to meet their needs and circumstances. These changes advance actor objectives. For instance, with regard to competitive dominance, efforts to restore a gang’s reputation may lead a gang to attack the group who previously victimized them (reciprocity) or to attack a group already victimized by other gangs (indegree popularity). SOAMs differ from other ERGMs in that they do not seek to explain the emergent network resulting from local connectivity, instead, the intent is to identify which factors explain changing network structure across successive periods. Thus, if our triad census uncovers a shift in structural complexity, these models can help dissect how the network evolved across successive phases of CGI implementation.
Using a method of moments maximum likelihood estimation process, these models run a multi-variate logistic regression to explain change in ties (formation or dissolution). Applied to gang violence, a tie forms when a new conflict occurs among pairs of gangs at T + 1, or T2, and dissolves when a prior attack (occurring in T1) is not repeated in T2. In essence, this means that we can look at the relative impact of different change elements and interaction effects (e.g., the imposition of an injunction while controlling for the tendency of highly violent gangs to attack more over time), and we can do this while modeling cumulative effects of multiple CGIs. We generated parameter estimates with an initial value of gain set at 0.2, with deviation values calculated from 1000 iterations. Estimates are stable if convergence occurs and t-ratios are near a value of 0.1: our final models achieved this threshold. For an explanation of this application, see (Snijders 2011; Snijders et al. 2010; Ripley et al. 2020).
3.3. Network Descriptions
The conflict network observed for each period of CGI implementation varied in size and cohesion (see Table 1) and there was a substantial drop in the percent of groups embroiled in internal conflict during the maturity phase. Networks were characterized as having a low level of interconnectivity (measured with density), meaning that the webs of conflict were sparse, and over time, there was a slight decrease.4 Groups were also generally characterized as being situated in star-like networks: this means that a gang may attack two other gangs, but those victimized gangs were not observed to fight each other. Clustering coefficients confirm this attack pattern. Theoretically, the average clustering coefficient ranges from 0, suggesting that the pattern of conflict ties linked to each gang looks more like a star centered on the focal gang, to a 1, where there would be a thickly connected mass of fighting.5 As reported in Table 1, the average clustering coefficients ranged between a 0.08 and 0.14. This means that on average, gangs were not embroiled in tight dense clusters of fighting. [Note: following established protocol, the statistics reported that describe overall network structure were calculated on dichotomized networks. Ties in a dichotomized network are binary, meaning they are scored a value of “1” if any conflict occurred between the pair and “0” if there was no observed conflict.]
Networked violence evolved with each phase of CGI use. Looking at the network structure over time, the Jaccard Coefficient of similarity finds that between development and the assent phase only 12% of the conflict relations involve the same pattern of violence, meaning that for 12% of conflicts, the same aggressor and victim links exist.6 Between assent and maturity, we found the most similarity in overall network connectivity, 16% of unique ties involved the same pair of groups in a consistent role (aggressor or victim). The least similarity was found between the maturity and saturation phases. Said another way, we can interpret these values to suggest that conflict patterns changed over time. The Pearson correlation coefficient tells us that while the tie structure changed, the value associated with ties (as used here this score reflects the number of aggressions) was somewhat consistent (the Pearson was moderately strong).7 Conflict relations with a lot of aggressions in one time period tend to also exhibit a lot of aggressions in the subsequent time period.
4. Results
4.1. General Structure of Violence—Simple vs. Complex
Exploring the structure of conflict through a triad census, we investigated the level of complexity interweaving groups that were involved in violence. Selecting specific patterns of conflict and tallying the number observed for each configuration provides an opportunity to calculate a ratio; where simple structures dominate, violence suppression efforts could independently target select aggressors, and where complex patterns emerge, actions require a coordinated approach focused on a set of interlinked combatants. While it is conventional to count many lower order simple structures, a shift in the ratio between types of structures over time can reveal important changes in the topography of conflict.
Across periods, we found a substantial amount of simple structures reflecting a domino pattern of aggression where one group attacked another, who in turn attacked a third group (see the percentages reported in Table 2). This pattern has been interpreted to suggest that groups are not of equal status or resources, and thus, groups are unable to retaliate for attacks. Instead they prey upon groups perceived as weaker than themselves (e.g., Papachristos (2009)). Of course, without detailed information about the specific groups involved, this interpretation is subjective. We also observed a relatively high level of multi-target attack behavior where one gang victimizes two other groups.
A prominent result of this inquiry was the dramatic change in the ratio between simple and complex structures. While the developmental period, when civil gang injunctions were first introduced, exhibited many simple structures (50:1), the violence network observed during the assent period exhibited a major structural change. As more gangs faced injunctions, the complexity of conflict patterns changed as indicated by the ratio. In the final two observation periods we found ratios decline precipitously. This suggests that gang violence in general became more integrated. The direct implication is that as the CGI strategy took effect, new or additional coordinated actions were needed to quell the conflict among sets of gangs.
A community level analysis offers insight into macro-level changes, but does not reveal if there were differential effects on enjoined gangs compared to non-enjoined gangs? Table 3 reports on the patterns of conflict observed for enjoined gangs compared to focal alters with no injunction. All groups with egocentric networks containing at least two alters were selected for this analysis. Then, a triad census was conducted for each phase. Since some gangs did not have sufficiently large egonets for each phase, the sample size varies. Overall, simple structures were more prevalent irrespective of injunction status. We found low levels of direct retaliation and a higher proportion of domino patterns (directed chains), with one notable exception. During the assent phase (2002–2005), when CGIs were being used more frequently, enjoined gangs were observed to shift to attacking multiple targets (out-star patterns). Of note, the ratio of simple to complex structures declined a little for enjoined gangs until the final observation, suggesting that there was a small increase in complex interactions as more groups were sanctioned. The pattern was different for non-enjoined groups, although, by the final phase there was no appreciable difference in ratios.
4.2. Shifting Patterns of Violence
Table 4 reports several SOAMs disentangling how patterns of violence changed across phases of CGI implementation. Several notable patterns are found. First, gangs may have a long memory as new attacks are more likely to involve reciprocated violence. (Recall that each observation captures 4 years of conflict: this means that a gang member’s murder in T1 could be reciprocated with a murderous attack on the aggressor more than four years later). The baseline model also shows that tie changes are not likely to form transitive triplets (significant negative effect for transitive triplets), except among gangs with CGIs. This means that we observe a tendency among gangs with CGIs to attack in a manner that generates a transitive triplet with another CGI restricted gang (the effect remains significant across subsequent models). In other words, gangs with CGIs exhibit a tendency to form three-way conflicts with other enjoined gangs. Further, although initially important, the probability that a new attack generates balance (where gangs exhibit a tendency to attack others that they are structurally similar to, meaning they also attack the same alters) weakens with the introduction of gang attributes. Meaning, when we control for group characteristics differential social status emerges—some groups have more competitive advantage. Interestingly, whether a focal gang or its combatant has a CGI does not account for tie formation or dissolution, instead, popularity is the most significant factor. Gangs suffering a lot of attacks in an initial observation will suffer more in subsequent observation. Gangs who attack a lot, are less likely to be attacked in a subsequent observation (outdegree popularity), suggesting that overt aggression may ward off attack. Notably, while change is significant across all models, the rate of change from assent (T2) to maturity (T3) is the greatest.
5. Discussion
5.1. Implications
Our results suggest that the structure of gang violence changed across successive observations. While the implementation of CGIs covaried with the evolving structure of violence overall (global effect), the impact was smaller when comparing enjoined gangs to alters. Dissecting how patterns of violence changed we found that CGI gangs were more apt to attack other groups under an injunction, and that excessively aggressive groups (measured with outdegree popularity) were less likely to be victimized at a subsequent observation. These findings provide some support for the idea that targeted enforcement strategies can facilitate change in gang violence—we found that over time, as more injunctions were filed, the nature of gang conflict became more complex.
Integrating social network theory with crime opportunity theory, (Bichler 2019) argues that crime opportunity flows through a network. It is an individual’s contacts and interactions with others that exposes them to crime. If we consider Papachristos’ (Papachristos 2009, p. 75) conclusion to be valid, that gang members “kill because they live in a structured set of social relations in which violence works its way through a series of connected individuals”, then it can be argued that variable criminal behavior, such as the use of violence, can be explained by differential positioning within the network. Aggregating to the group level, this means that the topography of social relations may explain intergroup violence, with some groups being “better” positioned to become embroiled in conflict with other groups. Taken further, changing the social landscape should alter the opportunities to fight, which should affect the level of violence observed. Applying this argument to the present study, CGIs were intended to change how gang members interact in public settings. More specifically, the stipulations included in most CGIs have the potential to reduce the visibility of enjoined gangs (prohibitions against congregating in public) which should decrease their exposure to gang-on-gang and gang-on-community interactions. As a result, violence should decline. However, this was not found.
What the architects of the original CGIs failed to appreciate was just how important inter-gang conflict is in shaping conflict networks. If opportunity has a network component, then changing the behavior, and thus, social position of one group, will trigger a ripple effect through the network, affecting other actors. To implement opportunity reducing strategies, the social network must be considered as actors do not function in isolation. For instance, exploring the social processes associated with risk of victimization, Green et al. (2017) show that gun violence spreads through a process of social contagion (63% of 11,123 episodes occurring in Chicago, 2006 to 2014), transmitted through social interactions, with alters being victimized on average 125 days after the victimization of their infector. Investigating how local patterns shape violence at the network level, Lewis and Papachristos (2020) show that complex transitive local patterns, actor characteristics, and group attributes (dominant actors) shape violence networks. Contributing to this line of inquiry, our results suggest that continued investigations of emerging and changing structure are needed, particularly those drawing from different information sources. Comparing self-report and community observations with police records, arrests, cases prosecuted, and convictions (and appeals), helps to uncover how criminal justice filtration processes and social interactions (intimidation of witnesses) influence the nature of networks generated.
5.2. Reducing Gang Violence
Apart from (Bichler et al. [2017] 2019), the structure of conflict pre- and post-injunction has not previously been investigated for a community of actors. The limitation of (Bichler et al. [2017] 2019) is their focus on only Bloods and Crips. In the present study we sought to add to the literature by extending the boundaries of the community. Though principally limited to capturing Hispanic and African American street gangs operating in the City of Los Angeles, this study enriches our understanding of the structure of intergroup conflict. Moving forward, subsequent research should consider how gang attributes contribute to shaping the social landscape of gang relations. To bolster the effect of focused deterrent strategies like CGIs, we need to incorporate control variables and other rival causal factors to better account for shifting structure and the imbalance between groups that may reflect positions of competitive dominance. Reviewing recent findings, three explanatory variables are beginning to emerge: (1) group dynamics as reflected in membership or size of territory controlled (Brantingham et al. 2019), internal cohesion (Ouellet et al. 2019), and race/ethnic homophily (e.g., Gravel et al. 2018; Papachristos et al. 2013); (2) intersecting aspects of geographic and social connectivity as evident in the spatial distribution of gang violence (Tita and Radil 2011); and (3) internet banging that generates links between web-based provocations (posts that advance gang objectives, promote reputation, and disrespect other gangs) and physical violence (e.g., Décary-Hétu and Morselli 2011; Dmello and Bichler 2020; Moule et al. 2014). By understanding the explanatory power of these factors, future research can continue to improve targeted crime control strategies.
5.3. Limitations
We acknowledge several potential limitations to this study. First, we must consider the data source—this study drew from prosecuted cases generating appeals. Appeal cases typically involve the most serious and violent incidents, which does not capture the full range of gang violence—recall that 77% of the cases investigated in this study involve murder or attempted murder. The LAPD reported that 3390 gang-related homicides occurred during the study period, and that approximately 51% were cleared with arrest, and not all cases went to trial (LAPD 2017, 2020; Snibbe 2018). Comparing study cases to reported clearance rates, we estimate that the sample includes at least 34% of cleared gang homicides. Though limited in scope, the types of incidents captured in these cases are the forms of violence CGIs are meant to deter. Understanding the structure emerging from these cases provides a glimpse into how CGIs are impacting behaviors stemming from the most serious forms of gang violence. As CGIs are rooted in problem-based prosecutorial strategies, compiling information from 198 case studies is a reasonable effort to generate direction for continued exploration and development of court-based crime control strategies.
In addition, this study offers a point of comparison to Lewis and Papachristos (2020) who used violence known to police—incidents known to police constitute a measure of crime situated at the opposite end of the criminal justice information continuum to what we investigated. Comparing our results to their study raises questions about which kinds of incidents filter out as cases move through the system. For instance, are direct acts of retaliation less likely to result in a successful prosecution? Further, to what extent does victim or witness cooperation impact case movement through the system? To date, network science has yet to explore how criminal procedures and case characteristics filter cases, affecting the nature of relations identified at the dyadic level, as well as the network structures that emerge when conflict is mapped as a social network. The insight gained from such investigation could inform prosecutorial efforts to enhance social justice.
Second, gang identities were not always well documented in the data, thereby generating a coding issue. For example, individuals may have been listed as gang members without identifying the specific gang they belonged to. Further, naming conventions were not consistent across cases. For instance, within the cases being coded as involving members of the 83 Gangster Crips, gang affiliations were identified at trial by different names—Eight Tray Crips, Westside Eight Tray, and 8 Tray Gangsters. This inconstancy in naming made it harder to identify which gang defendants and victims belonged to. In addition, while individual association with the larger parent gang may have been recorded, clique or subset information was missing. Large gangs are known to have identifiable subgroups. These subgroups include people who co-offend together. Since some gangs are reported to have upwards of a thousand members, understanding violent interactions involving subgroups may result in more effective counter measures. The extensive, labor-intensive cleaning protocol developed to deal with these issues lead us to strongly suggest that a greater effort should be made to be consistent when describing gangs and gang associations during investigations and trials. Meanwhile, these issues with naming conventions afflict all gang research, and thus, our results are comparable to the current literature.
Finally, the directionality of conflict may be arbitrary in some cases. In cases where the victim is an innocent bystander, directionality is clear (there is a clear victim and aggressor). However, when gangs are being equally aggressive, directionality is not as straightforward. For example, in cases where you cannot determine who the aggressor in the situation is, the survivor of a conflict is often associated with being the defendant while and individual who is fatally wounded is associated with being the victim. Yet, this designation does not necessarily capture the true nature of the conflict. Subsequent analysis should consider non-directed intergang violence. By reconfiguring how relational information is used to generate the conflict networks, we can conduct sensitivity analysis to test the robustness of findings given described data limitations.
6. Conclusions
The fatal consequences of street gang violence extend beyond the identified combatants, spreading into the fabric of a community by involving individuals with no known gang association. Adopting a social network approach to this investigation, we describe the long-term effects that a dedicated CGI program has on the structure of gang conflict originating from the City of Los Angeles. While the prolonged use of CGIs by different city attorneys is associated with some pronounced, albeit potentially short-term, reductions in crime, our findings suggest that while crime at the community level may decline, the structure of conflict thickens, becoming more complex and embedded, though more so for some gangs than others. Moreover, CGI implementation patterns have cumulative effects. Continued effort is needed to develop strategies that will disentangle the web of violence that continues to plague communities.
Author Contributions
Conceptualization, G.B. and A.N.; methodology, G.B.; formal analysis, G.B.; data curation, G.B. and C.I.; writing—original draft preparation, G.B., C.I., and A.N.; writing—review and editing, G.B. and A.N.; visualization, G.B.; project administration, G.B. and A.N.; funding acquisition, G.B. and A.N. All authors have read and agreed to the published version of the manuscript.
Funding
This research was supported by a grant, no. 2017-JF-FX-0043, awarded by the Office of Juvenile Justice and Delinquency Prevention, Office of Justice Programs, U.S. Department of Justice, to the California State University San Bernardino. The opinions, findings, and conclusions and recommendations expressed are those of the authors only.
Conflicts of Interest
The authors declare no conflict of interest.
References
- Bichler, Gisela. 2019. Understanding Criminal Networks: A Research Guide. Berkeley: University of California Press. [Google Scholar]
- Bichler, Gisela, Alexis Norris, Jared R. Dmello, and Jasmin Randle. 2019. The Impact of Civil Gang Injunctions on Networked Violence between the Bloods and the Crips. Crime and Delinquency 65: 875–915. First published 2017. [Google Scholar] [CrossRef]
- Braga, Anthony A., and David L. Weisburd. 2012. The Effects of Focused Deterrence Strategies on Crime: A Systematic Review and Meta-Analysis of the Empirical Evidence. Journal of Research in Crime and Delinquency 49: 323–58. [Google Scholar] [CrossRef]
- Braga, Anthony A., Jack McDevitt, and Glenn L. Pierce. 2006. Understanding and preventing gang violence: Problem analysis and response development in Lowell, Massachusetts. Police Quarterly 9: 20–46. [Google Scholar] [CrossRef]
- Brantingham, P. Jeffrey, Matthew Valasik, and George E. Tita. 2019. Competitive dominance, gang size and the directionality of gang violence. Crime Science 8: 1–20. [Google Scholar] [CrossRef] [Green Version]
- Carr, Richard, Molly Slothower, and John Parkinson. 2017. Do gang injunctions reduce violent crime? Four tests in Merseyside, UK. Cambridge Journal of Evidence-Based Policing 1: 195–210. [Google Scholar] [CrossRef] [Green Version]
- Christakis, Nicholas A., and James H. Fowler. 2009. Connected: The Surprising Power of Our Social Networks and How They Shape Our Lives. New York: Little, Brown and Company. [Google Scholar]
- Décary-Hétu, David, and Carlo Morselli. 2011. Gang presence in social network sites. International Journal of Cyber Criminology 5: 876–90. [Google Scholar]
- Decker, Scott H. 1996. Collective and normative features of gang violence. Justice Quarterly 13: 243–64. [Google Scholar] [CrossRef]
- Descormiers, Karine, and Carlo Morselli. 2011. Alliances, Conflicts, and Contradictions in Montreal’s Street Gang Landscape. International Criminal Justice Review 21: 297–314. [Google Scholar] [CrossRef]
- Dmello, Jared R., and Gisela Bichler. 2020. Assessing the Impact of Civil Gang Injunctions on the Use of Online Media by Criminal Street Gangs. International Journal of Cyber Criminology 14: 16–34. [Google Scholar]
- Gravel, Jason, Blake Allison, Jenny West-Fagan, Michael McBride, and George E. Tita. 2018. Birds of a feather fight together: Status-enhancing violence, social distance and the emergence of homogenous gangs. Journal of Quantitative Criminology 34: 189–219. [Google Scholar] [CrossRef]
- Green, Ben, Thibaut Horel, and Andrew V. Papachristos. 2017. Modeling Contagion Through Social Networks to Explain and Predict Gunshot Violence in Chicago, 2006 to 2014. JAMA Internal Medicine 177: 326–33. [Google Scholar] [CrossRef]
- Grogger, Jeffrey. 2002. The effects of civil gang injunctions on reported violent crime: Evidence from Los Angeles county. Journal of Law and Economics 45: 69–90. [Google Scholar] [CrossRef]
- Hanneman, Robert A., and Mark Riddle. 2005. Introduction to Social Network Methods. Riverside: University of California, Available online: http://faculty.ucr.edu/~hanneman/ (accessed on 13 April 2020).
- Hennigan, Karen M., and David Sloane. 2013. How implementation can affect gang dynamics, crime, and violence. Criminology and Public Policy 12: 7–41. [Google Scholar] [CrossRef]
- Hennigan, Karen, and Marija Spanovic. 2012. Gang dynamics through the lens of social identity theory. In Youth Gangs in International Perspective. New York: Springer, pp. 127–49. [Google Scholar]
- Klein, Malcolm W., and Cheryl L. Maxson. 2010. Street Gang Patterns and Policies. New York: Oxford University Press. [Google Scholar]
- Krackhardt, David, and Robert N. Stern. 1988. Informal networks and organizational crises: An experimental simulation. Social Psychology Quarterly 51: 123–40. [Google Scholar] [CrossRef]
- Los Angeles County Civil Grand Jury. 2004. A management review of civil gang injunctions. In Los Angeles County Civil Grand Jury. Final Report 2003–2004. pp. 177–389. Available online: http://www.grandjury.co.la.ca.us/gjury03-04/LACGJFR_03-04.pdf (accessed on 13 April 2020).
- Landis, J. Richard, and Gary G. Koch. 1997. The measurement of observer agreement for categorical data. Biometrics 33: 159–74. [Google Scholar] [CrossRef] [Green Version]
- Los Angeles Police Department. 2017. Homicide Report 2017. Available online: http://assets.lapdonline.org/assets/pdf/2017-homi-report-final.pdf (accessed on 13 April 2020).
- Los Angeles Police Department. 2020. Gangs. Available online: http://www.lapdonline.org/get_informed/content_basic_view/ 1396 (accessed on 13 April 2020).
- Lewis, Kevin, and Andrew V. Papachristos. 2020. Rules of the Game: Exponential Random Graph Models of a Gang Homicide Network. Social Forces 98: 1829–58. [Google Scholar] [CrossRef]
- Maxson, Cheryl L., Karen M. Hennigan, and David C. Sloane. 2005. “It’s getting crazy out there”: Can a civil gang injunction change a community? Criminology and Public Policy 4: 577–606. [Google Scholar] [CrossRef]
- McCuish, Evan C., Martin Bouchard, and Raymond R. Corrado. 2015. The Search for Suitable Homicide Co-Offenders among Gang Members. Journal of Contemporary Criminal Justice 31: 319–36. [Google Scholar] [CrossRef]
- McGloin, Jean Marie. 2007. The Continued Relevance of Gang Membership. Criminology and Public Policy 6: 231–40. [Google Scholar] [CrossRef]
- Melde, Chris, and Finn-Aage Esbensen. 2013. Gangs and violence: Disentangling the impact of gang membership on the level and nature of offending. Journal of Quantitative Criminology 29: 143–66. [Google Scholar] [CrossRef]
- Moule, Richard K., Jr., David C. Pyrooz, and Scott H. Decker. 2014. Internet adoption and online behaviour among American street gangs: Integrating gangs and organizational theory. British Journal of Criminology 54: 1186–206. [Google Scholar] [CrossRef]
- Noonan, Ari L. 2008. Gang-Tied Killer of Bosch Brothers Convicted 4 1/2 Years Later. The Front Page. January 31. Available online: https://www.thefrontpageonline.com/news/gang-tied-killer-of-bosch-brothers-convicted-4-12-years-later (accessed on 23 December 2019).
- O’Deane, Matthew D., and Stephen A. Morreale. 2011. Evaluating the effectiveness of gang injunctions in California. Journal of Criminal Justice Research 2: 1–32. [Google Scholar]
- Ouellet, Marie, Martin Bouchard, and Yanick Charette. 2019. One gang dies, another gains? The network dynamics of criminal group persistence. Criminology 57: 5–33. [Google Scholar] [CrossRef] [Green Version]
- Papachristos, Andrew V. 2009. Murder by Structure: Dominance Relations and the Social Structure of Gang Homicide. American Journal of Sociology 115: 74–128. [Google Scholar] [CrossRef]
- Papachristos, Andrew V. 2013. The Importance of Cohesion for Gang Research, Policy, and Practice. Criminology and Public Policy 12: 49–58. [Google Scholar] [CrossRef]
- Papachristos, Andrew V., and David S. Kirk. 2006. Neighborhood effects on street gang behavior. Studying Youth Gangs 12: 63–84. [Google Scholar]
- Papachristos, Andrew V., David Hureau, and Anthony A. Braga. 2010. Conflict and the Corner: The Impact of Intergroup Conflict and Geographic Turf on Gang Violence. Available online: https://papers.ssrn.com/sol3/papers.cfm?abstract_id=1722329 (accessed on 10 April 2020).
- Papachristos, Andrew V., David M. Hureau, and Anthony A. Braga. 2013. The Corner and the Crew: The Influence of Geography and Social Networks on Gang Violence. American Sociological Review 78: 1–31. [Google Scholar] [CrossRef] [Green Version]
- Papachristos, Andrew V., Anthony A. Braga, Eric Piza, and Leigh S. Grossman. 2015. The Company You Keep? The Spillover Effects of Gang Membership on Individual Gunshot Victimization in a Co-Offending Network. Criminology 53: 624–49. [Google Scholar] [CrossRef]
- Radil, Steven M., Colin Flint, and George E. Tita. 2010. Spatializing social networks: Using social network analysis to investigate geographies of gang rivalry, territoriality, and violence in Los Angeles. Annals of the Association of American Geographers 100: 307–26. [Google Scholar] [CrossRef]
- Randle, Jasmin, and Gisela Bichler. 2017. Uncovering the Social Pecking Order in Gang Violence. In Crime Prevention in the 21st Century. Edited by Benoit Leclerc and Ernesto Savona. New York: Springer, pp. 165–86. [Google Scholar]
- Ridgeway, Greg, Jeffrey Grogger, Ruth A. Moyer, and John M. Macdonald. 2019. Effect of gang injunctions on crime: A study of Los Angeles from 1988–2014. Journal of Quantitative Criminology 35: 517–41. [Google Scholar] [CrossRef]
- Ripley, Ruth M., Tom A. B. Snijders, Zsófia Boda, András Vörös, and Paulina Preciado. 2020. Manual for RSiena. Oxford: Department of Statistics and Nuffield College, University of Oxford. [Google Scholar]
- Robins, Garry, and Lusher Dean. 2013. What are exponential random graph models? In Exponential Random Graph Models for Social Networks. Edited by Dean Lusher, Koskinen Johan and Robins Garry. Cambridge: Cambridge University Press, pp. 9–15. [Google Scholar]
- Snibbe, Kurt. 2018. How many homicides go unsolved in California and the nation? Orange County Register. April 29. Available online: https://www.ocregister.com/2018/04/29/how-many-homicides-go-unsolved-in-california-and-the-nation/ (accessed on 13 April 2020).
- Snijders, Tom A. B. 2011. Network dynamics. In The SAGE Handbook of Social Network Analysis. Edited by John Scott and Peter J. Carrington. Thousand Oaks: Sage, pp. 501–13. [Google Scholar]
- Snijders, Tom A. B., Gerhard G. Van de Bunt, and Christian E. G. Steglich. 2010. Introduction to stochastic actor-based models for network dynamics. Social Networks 32: 44–60. [Google Scholar] [CrossRef]
- Stafford, Mark C., and Mark Warr. 1993. A reconceptualization of general and specific deterrence. Journal of Research in Crime and Delinquency 30: 123–35. [Google Scholar] [CrossRef]
- Swan, Richelle S., and Bates Kirstin A. 2017. Loosening the ties that bind: The hidden alarms of civil gang injunctions in San Diego county. Contemporary Justice Review 20: 132–53. [Google Scholar] [CrossRef]
- Tita, George E., and Steven M. Radil. 2011. Spatializing the social networks of gangs to explore patterns of violence. Journal of Quantitative Criminology 27: 521–45. [Google Scholar] [CrossRef]
- Vives, Ruben, and Ben Bolch. 2009. Student at Long Beach’s Wilson High Fatally Shot after Homecoming Game. Los Angeles Times. November 1. Available online: https://www.latimes.com/local/la-me-wilson-shooting1-2009nov01-story.html (accessed on 23 December 2019).
- Wasserman, Stanley, and Katherine Faust. 1994. Social Network Analysis: Methods and Applications. Cambridge: Cambridge University Press. [Google Scholar]
- Watts, Duncan J. 1999. Networks, dynamics, and the small world phenomenon. American Journal of Sociology 105: 493–592. [Google Scholar] [CrossRef] [Green Version]
| 1 | Inter-rater agreement was assessed on case inclusion criteria and identification of variables capturing defendant characteristics, victim characteristics, witness characteristics, characteristics of other individuals involved in the case (e.g., gang experts and responding officers), and situational elements of the case. Coders were assessed on a training sample of cases raging in difficulty level (the most difficult cases involving multiple incidents spanning across different periods of time, each period consisting of different incident elements). We observed a Cohen’s Kappa of 0.84, indicating substantial agreement between the ten coders (Landis and Koch 1997). However, when just looking across defendant and victim characteristic the agreement increased (k = 0.96). This indicates that in capturing the defendants and victims’ names, aliases, demographics, and which gangs they belong to, there was almost perfect agreement. Subsequent random spot checks of coding confirmed reliable retrieval of offenders, victims, and their gang affiliation. |
| 2 | The inclusion criterion specified that at least one individual associated with a case was known to be an active member of a gang based in the City of Los Angeles, but the incident did not have to occur within the city boundaries. For instance, a gang member from Los Angeles could travel to San Diego and become involved in a violent altercation with a gang local to the San Diego region. Moreover, only one person involved in the incident had to have a Los Angeles affiliation, other participants (accomplices and victims) were not required to be, and as such, the gang violence represented by this sample was observed to spill out from the City of Los Angeles into proximate and distal locations. In addition, due to economic and social conditions affecting housing availability and regional migration patterns associated with the 2008 economic crisis, many LA-based gang members relocated from the city to suburban locations, such as Lancaster. Thus, regional migration patterns may also contribute to the observed spread of incident locations. |
| 3 | Censuring resulted from two factors: (1) left-censoring corresponds with the origin of the development of digital case retrieval systems, i.e., LexisNexis; and right-censoring corresponds to court processing timeframes. |
| 4 | Density is a measure of cohesion that calibrates how interconnected actors are within a network (Wasserman and Faust 1994, p. 101). As used here, this metric tabulates the number conflicts observed among gangs in the network, relative to the number of potential conflict relations that could exist if every gang was in combat with every other gang. High scores indicate that gangs are well connected. |
| 5 | The average clustering coefficient is a measure of cohesion that is based on how many triplets (grouping of three actors) are present in a network (Watts 1999, p. 498). As used here, this measure calculates the number of threesomes (triplets) that are observed (sets of three gangs that are all in conflict with each other), relative to the all triplets that are possible (all permutations of sets of three nodes) that could exist within the network. Lower scores highlight that potentially important sub-groups exist within the network. |
| 6 | The Jaccard coefficient of similarity is a measure of association, based on how many shared ties are present between actors when different observations of the network are compared. Networks must be binary and include the same actors (Hanneman and Riddle 2005). As used here, this statistic measures the number of conflicts among gangs that are present when observed at time 1 compared to a subsequent observation at time 2. The resulting score is the percentage of ties that are the same in two observations of the network. |
| 7 | The Pearson correlation coefficient is a measure of association, like Jaccard; however, networks must be valued (Hanneman and Riddle 2005). This statistic calibrates the level of similarity of tie values, in this case, number of conflicts among pairs of gangs across two observations. |
Figure 1.
Structure of Violent Conflict.

Figure 2.
The 2-Step Sampling Process.

Figure 3.
Case Identification Protocol.


Table 1.
Network Description by Phase.
| Variables | Development (1998–2001) | Assent (2002–2005) | Maturity (2006–2009) | Saturation (2010–2013) |
|---|---|---|---|---|
| Network Size | ||||
| Groups | 113 | 173 | 197 | 124 |
| Aggression (unique attack arcs/total aggressions) | 152/599 | 247/1315 | 264/1242 | 145/554 |
| Internal conflicts (percent of unique conflicts) | 16 (10.5%) | 28 (11.3%) | 22 (8.0%) | 15 (10.3%) |
| Cohesion | ||||
| Number of components (connected structures) | 10 | 8 | 15 | 9 |
| Percent of groups in the largest component | 78.8% | 90.2% | 82.7% | 83.9% |
| Density | 4.4% | 4.0% | 3.0% | 3.4% |
| Average clustering coefficient | 0.11 | 0.12 | 0.14 | 0.08 |
| Structural Similarity | ||||
| Jaccard coefficient of similarity (with prior period) | -- | 12.0% | 16.1% | 10.1% |
| Pearson correlation coefficient (with prior period) | -- | 0.400 | 0.393 | 0.427 |
Table 2.
Triad Census by Observation Period.
| STRUCTURE | DEVELOPMENT (1998–2001) | ASSENT (2002–2005) | MATURITY (2006–2009) | SATURATION (2010–2013) | |
|---|---|---|---|---|---|
| SIMPLE1 | Retaliation 2 | 661 (14 ties; 9.6%) | 1262 (16 ties; 5.8%) | 1271 (16 ties; 5.5%) | 142 (4 ties; 4.3%) |
| Domino | 79 (54.5%) | 121 (43.8%) | 162 (55.9%) | 47 (50.5%) | |
| Multiple targets | 52 (35.8%) | 139 (50.3%) | 112 (38.6%) | 42 (45.2%) | |
| COMPLEX3 | 3-way integrated conflict | 16 | 33 | 44 | 12 |
| RATIO OF SIMPLE TO COMPLEX | 50:1 | 46:1 | 35:1 | 19:1 | |
1 Percentage distributions for simple structures are based on patterns of retaliatory conflict rather than permutations. For instance, the denominator in the development phase was 145 (14 reciprocal arcs, 79 domino patterns, and 52 multi-target attacks). 2 Retaliation sets counted in a triad census include situations where actors A and B have a mutual conflict, but no one attacks C. Internal conflict is ignored in this calculation. Since every permutation is counted, the reciprocity scores do not reflect the true count of reciprocated violence. Investigating actual situations where violence is reciprocated and is not linked to internal conflict, we count the following: 14 reciprocated ties during the start-up period), 16 reciprocal ties in the building period, 16 reciprocal ties in the peak period, and 4 reciprocal ties in the decline period. 3 Complex ties include seven configurations: triad sets 9–10 and 12–16 as listed by UCInet. Specifically, this includes A->B<-C, A->C; A<-B<-C, A->C; A<-B->C, A<->C; A->B<-C, A<->C; A->B->C, A<->C; A->B<->C, A<->C; and A<->B<->C, A<->C.
Table 3.
Triad Census Comparing Egonet Structure of Enjoined Gangs to Focal Alter Gangs 1.
| SAMPLE | STRUCTURE | DEVELOPMENT (1998–2001) | ASSENT (2002–2005) | MATURITY (2006–2009) | SATURATION (2010–2013) |
|---|---|---|---|---|---|
| 74 ENJOINED GANGS 2 | SIMPLE Retaliation 4 Domino Multiple targets | 99 9 (9%) 57 (58%) 33 (33%) | 218 12 (5%) 97 (45%) 109 (50%) | 183 12 (7%) 101 (55%) 70 (38%) | 56 3 (5%) 28 (50%) 25 (45%) |
| COMPLEX (3-way integrated conflict) | 23 | 51 | 61 | 16 | |
| RATIO | 4:1 | 4:1 | 3:1 | 4:1 | |
| AVG. RATIO 5 | 5:1 (n = 43) | 4:1 (n = 60) | 3:1 (n = 56) | 4:1 (n = 41) | |
| 74 FOCAL ALTERS 3 | SIMPLE Retaliation 4 Domino Multiple targets | 44 2 (5%) 21 (48%) 21 (48%) | 52 3 (6%) 25 (48%) 24 (46%) | 95 7 (7%) 54 (57%) 34 (36%) | 32 1 (3%) 19 (59%) 12 (38%) |
| COMPLEX (3-way integrated conflict) | 9 | 18 | 26 | 9 | |
| RATIO | 5:1 | 3:1 | 4:1 | 4:1 | |
| AVG. RATIO 5 | 6:1 (n = 41) | 3:1 (n = 55) | 4:1 (n = 52) | 4:1 (n = 43) |
1 Values reported sum the number of structures observed for all egos. 2 Cliques named in injunctions are omitted from this analysis. 3 To be included in this analysis, we selected all alters from the main file (consolidating cases from 1998 to 2013) with egonetworks with a size of 2 or greater. 4 Egocentric networks will only be observed to exhibit retaliations as counted in a triad census as A<->B, C if reciprocal ties exist among alters. For this reason, we counted among alters and reciprocal conflict involving the ego manually. 5 The n varies because some groups did not have sufficiently large egonetworks in each phase. To account for this variation, an average ratio was calculated—the average ratio looks at the average number of simple patterns per group compared to the average number of complex patterns.
Table 4.
SAOM Investigation of Structural Complexity (* p < 0.05).
| Factors | Baseline | Transitivity Dissection | Actor Attributes | Full Model | Parsimony | |||||
|---|---|---|---|---|---|---|---|---|---|---|
| β | S.E. | β | S.E. | β | S.E. | β | S.E. | β | S.E. | |
| Structural | ||||||||||
| Reciprocity | −1.849 * | 0.761 | −0.355 | 0.445 | 5.997 * | 1.182 | 3.827 * | 0.369 | 5.540 * | 1.836 |
| Trans. triplets | −2.917 * | 0.819 | ||||||||
| CGI Trans. triplets | 2.212 * | 0.872 | 0.737 | 0.361 | 4.491 * | 0.836 | 2.478 * | 0.664 | 4.079 * | 0.997 |
| Trans. mediated triplets | −0.94 | 1.086 | 1.032 | 0.618 | ||||||
| Trans. reciprocated triplets | 1.682 | 2.684 | −0.798 | 2.492 | ||||||
| 3-cycles | 1.120 | 1.222 | 2.346 | 1.621 | ||||||
| Balance | 0.488 * | 0.065 | 0.214 * | 0.099 | 0.118 | 0.168 | ||||
| Betweenness (control) | −2.488 * | 0.310 | −0.187 | 0.334 | ||||||
| Actor Attributes | ||||||||||
| Indegree-popularity | 0.045 * | 0.017 | 0.025 * | 0.009 | 0.045 * | 0.019 | ||||
| Outdegree-popularity | −4.734 * | 1.078 | −2.839 * | 0.328 | −4.328 * | 1.506 | ||||
| CGI alter | −0.229 | 0.480 | ||||||||
| CGI ego | −0.5036 | 0.664 | ||||||||
| CGI similarity | −0.7984 | 0.488 | ||||||||
| Rate of Change | ||||||||||
| Period 1, T1 to T2 | 0.881 * | 0.054 | 1.128 * | 0.075 | 0.952 * | 0.0605 | 0.945 * | 0.058 | 0.955 * | 0.061 |
| Period 2, T2 to T3 | 1.056 * | 0.059 | 1.534 * | 0.105 | 1.168 * | 0.0718 | 1.183 * | 0.071 | 1.176 * | 0.077 |
| Period 3, T3 to T4 | 0.961 * | 0.054 | 1.291 * | 0.089 | 1.036 * | 0.0628 | 1.036 * | 0.066 | 1.043 * | 0.064 |
| Estimate Performance | ||||||||||
| T Ratio (model convergence) | 2 under 0.1 | all under 0.1 | all under 0.1 | all under 0.1 | all under 0.1 | |||||
Publisher’s Note: MDPI stays neutral with regard to jurisdictional claims in published maps and institutional affiliations. |
© 2020 by the authors. Licensee MDPI, Basel, Switzerland. This article is an open access article distributed under the terms and conditions of the Creative Commons Attribution (CC BY) license (http://creativecommons.org/licenses/by/4.0/).
Share and Cite
MDPI and ACS Style
Bichler, G.; Norris, A.; Ibarra, C. Evolving Patterns of Aggression: Investigating the Structure of Gang Violence during the Era of Civil Gang Injunctions. Soc. Sci. 2020, 9, 203. https://0-doi-org.brum.beds.ac.uk/10.3390/socsci9110203
AMA Style
Bichler G, Norris A, Ibarra C. Evolving Patterns of Aggression: Investigating the Structure of Gang Violence during the Era of Civil Gang Injunctions. Social Sciences. 2020; 9(11):203. https://0-doi-org.brum.beds.ac.uk/10.3390/socsci9110203
Chicago/Turabian StyleBichler, Gisela, Alexis Norris, and Citlalik Ibarra. 2020. "Evolving Patterns of Aggression: Investigating the Structure of Gang Violence during the Era of Civil Gang Injunctions" Social Sciences 9, no. 11: 203. https://0-doi-org.brum.beds.ac.uk/10.3390/socsci9110203
Note that from the first issue of 2016, this journal uses article numbers instead of page numbers. See further details here.