Article

Management of Microbiological Contamination of the Water Network of a Newly Built Hospital Pavilion

by
Osvalda De Giglio
1,
Giusy Diella
1,
Marco Lopuzzo
1,
Francesco Triggiano
1,
Carla Calia
1,
Chrysovalentinos Pousis
1,
Fabrizio Fasano
1,
Giuseppe Calabrese
2,
Vincenza Rafaschieri
2,
Lucia Federica Carpagnano
2,
Matilde Carlucci
2,
Loreto Gesualdo
3,
Maria Luisa Ricci
4,
Maria Scaturro
4,
Maria Cristina Rota
4,
Lucia Bonadonna
5,
Luca Lucentini
5 and
Maria Teresa Montagna
1,*
1
Regional Reference Laboratory of Clinical and Environmental Surveillance of Legionellosis, Department of Biomedical Science and Human Oncology, University of Bari Aldo Moro, Piazza G. Cesare 11, 70124 Bari, Italy
2
A.O.U. Policlinico di Bari, 70124 Bari, Italy
3
Department of Emergency and Organ Transplantation-Nephrology, Dialysis and Transplantation Unit, University of Bari Aldo Moro, 70124 Bari, Italy
4
Department of Infectious Diseases, Istituto Superiore di Sanità, Viale Regina Elena, 00161 Rome, Italy
5
Department of Environment and Health, Istituto Superiore di Sanità, Viale Regina Elena, 00161 Rome, Italy
*
Author to whom correspondence should be addressed.
Submission received: 20 October 2020 / Revised: 13 January 2021 / Accepted: 14 January 2021 / Published: 16 January 2021
(This article belongs to the Section Waterborne/Foodborne/Airborne Pathogens)

Abstract

:
The good installation, as well as commissioning plan, of a water network is a crucial step in reducing the risk of waterborne diseases. The aim of this study was to monitor the microbiological quality of water from a newly built pavilion before it commenced operation. Overall, 91 water samples were tested for coliforms, Escherichia coli, enterococci, Pseudomonas aeruginosa and Legionella at three different times: T0 (without any water treatment), T1 (after treatment with hydrogen peroxide and silver ions at initial concentration of 20 mg/L and after flushing of water for 20 min/day for seven successive days) and T2 (15 days later). Coliforms were detected in 47.3% of samples at T0, 36.3% at T1 and 4.4% at T2. E. coli was isolated in 4.4% of the samples only at T1, while enterococci appeared in 12.1% of the samples at T1 and in 2.2% at T2. P. aeruginosa was isolated in 50.5% of the samples at T0, 29.7% at T1 and 1.1% at T2. Legionella pneumophila serogroup 8 was isolated in 80.2% of the samples at T0, 36.3% at T1 and 2.2% at T2. Our results confirmed the need for a water safety plan in new hospital pavilions to prevent the risk of waterborne diseases.

1. Introduction

In health facilities, the water used for drinking, hygiene and medical purposes can affect the health of patients, staff and other users of the facility, as the quality standards prescribed by national regulations controlling the quality of drinking water, the Italian Legislative Decree no. 31 of 2001 (Lgs.D.31/01) [1], are not always able to guarantee the safety of vulnerable patients [2]. Some hydrophilic microorganisms (e.g., Pseudomonas aeruginosa, Legionella, fungi) can cause serious infections if present in the water used to wash wounds, burns, medical devices and humidifiers, with the risk of an inauspicious outcome in patients with a high risk of infection [2,3,4,5,6,7,8].
Enteric pathogens of fecal origin can enter the water supply due to accidental malfunction of the sewage system, while environmental organisms, such as Legionella, Pseudomonas and fungi, can grow in systems that use water (e.g., cooling towers) or in water networks in which the flow is not continuous [9]. Even new buildings and/or hospital renovations can cause malfunctions of the plumbing system as vibrations or significant changes in the water pressure can lead to the detachment of biofilms, releasing microorganisms into the water. Furthermore, soil could enter the system during the construction of new network sections [2].
In recent years, particular attention has been paid to nosocomial legionellosis [8,10,11,12,13,14]. The association between drinking water and nosocomial legionellosis was first described about 40 years ago [15]. The complexity of hospital water systems and the vulnerability of hospitalized patients increase the risk of Legionella transmission with severe outcomes. The new European Drinking Water Directive introduces a new approach that includes the assessment of possible risks, including legionellosis, deriving from domestic distribution systems [16]. Various disinfection techniques (chemical disinfection, ultraviolet light and high temperature) were employed as water disinfection systems. Most of them were found to be useful to control the average load of Legionella, but its complete eradication has not yet been demonstrated [17].
Legionella replicates between 20 °C and 50 °C, with more rapid growth occurring when temperatures approach 40 °C [18]. Whereas most hydrophilic bacteria do not survive such high temperatures, Legionella adapts easily by continuing to reproduce within amoebae and can cause a severe form of pneumonia known as Legionnaires’ disease [8,11,19,20]. In Italy, 2964 cases of legionellosis were reported in 2018 (incidence rate = 48.9 cases per 1 million inhabitants) of which 3.4% were of nosocomial origin [21].
The aim of this study was to manage and monitor the microbiological quality of the water network in a newly built hospital pavilion located in a large university hospital in Apulia (southern Italy), before it commenced operation.

2. Results

2.1. Physical and Chemical Parameters of Water Sample

Table 1 shows the mean value of results of the physico-chemical analysis carried out on the water samples collected at time T0 (without any water treatment), T1 (after treatment with hydrogen peroxide and silver ions at initial concentration of 20 mg/L and after flushing water for 20 min/day for seven successive days) and T2 (15 days later). The limit values recommended by Lgs.D. 31/01 were reported.

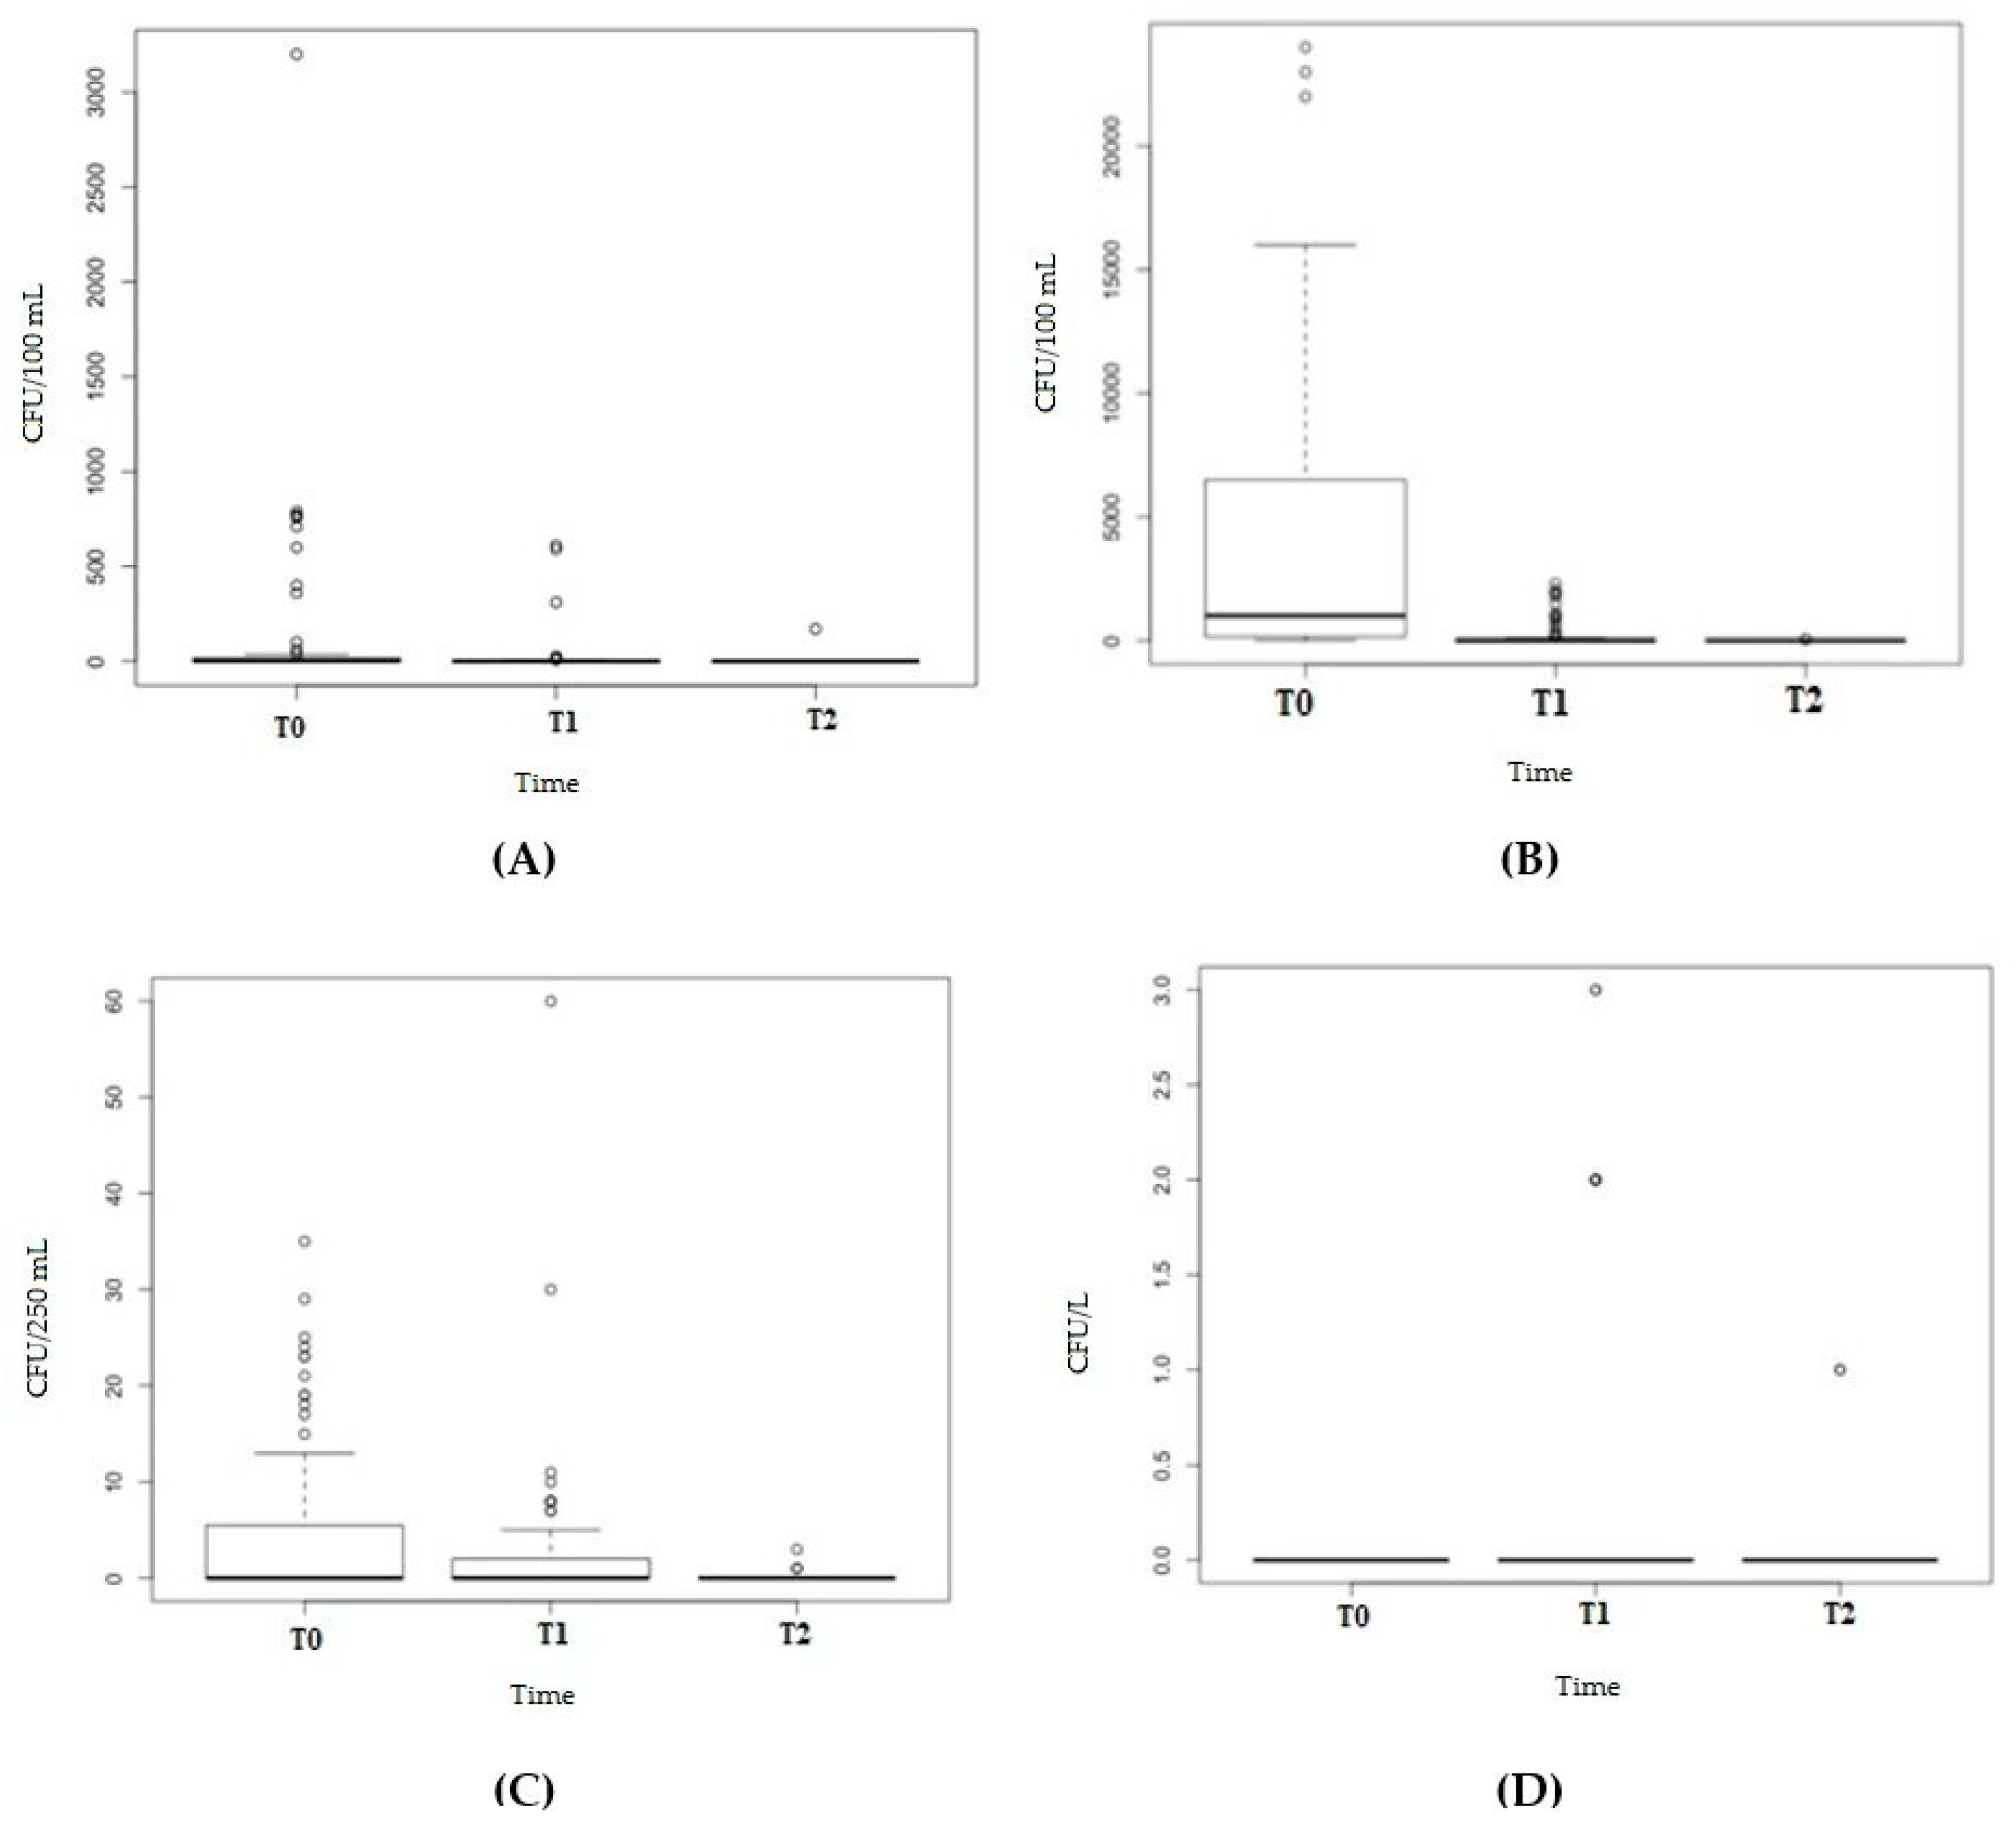
2.2. Bacterial Detection

Coliforms were detected in 47.3% (43/91) of water samples at T0, 36.3% (33/91) at T1 and 4.4% (4/91) at T2. A statistically significant difference was detected at T2 compared with T0 (χ2 Yates correction = 41.4197, p-value < 0.0001) and T1 (χ2 Yates correction = 26.5961, p-value < 0.0001). The Lilliefors (Kolmogorov–Smirnov) normality test showed no normal distribution of the load (D = 0.26741, p-value < 0.0001). The median value of the coliform load was <1 CFU/100 mL at T0 (range < 1–35), T1 (range < 1–60) and T2 (range < 1–3) (Figure 1A). The Friedman rank-sum test (χ2 = 50.429, df = 2, p-value < 0.0001) and post-hoc Conover’s test for a two-way analysis (each analysis with p-value < 0.001) showed statistically significant differences in coliform load at T0, T1 and T2. There were no statistically significant differences in the positivity rate (Table 2) and load (Table 3) of coliforms between taps and showers.
Escherichia coli was detected in 4.4% (4/91) of samples only at T1, with no statistically significant differences in the positivity rate over time (Fisher’s F test p-value = 0.12) (Table 2). The median value of the load was <1 CFU/100 mL (range < 1–2) (Table 3).
Enterococci (Figure 1B) were not isolated at T0, but they appeared in 12.1% (11/91) of samples at T1 (median load value = <1 CFU/100 mL, range < 1–3) and in 2.2% (2/91) at T2 (each, 1 CFU/100 mL). Statistically significant differences were present among the positivity rates between T0 and T1 (0% vs. 12.1% Fisher’s F test p-value = 0.0007), between T1 and T2 (12.1% vs. 2.2% Fisher’s F test p-value = 0.02), but not between T0 and T2 (0% vs. 2.2%, Fisher’s F test p-value = 0.49). The Lilliefors (Kolmogorov–Smirnov) normality test showed no normal distribution of the load (D = 0.53728, p-value < 0.0001). The Friedman rank-sum test (Friedman χ2= 18.216, df = 2, p-value = 0.0001) and post-hoc Conover’s test showed statistically significant differences (p-value < 0.001) in the enterococci load at T0, T1 and T2.
No statistically significant differences in the enterococci positivity rate between taps and showers were detected at the different time points (Table 2). Showers showed a higher enterococci load than taps at T2 (W = 737, p-value = 0.02) (Table 3).
The P. aeruginosa positivity rate showed a decrease at different times: from 50.5% at T0 to 29.7% at T1 (T0 vs. T1: χ2 Yates correction = 7.4108, p-value = 0.006) and to 1.1% at T2 (both T0 vs. T1 and T1 vs. T2: Fisher’s F test p-value < 0.0001). The Lilliefors (Kolmogorov–Smirnov) normality test showed no normal distribution of the load (D = 0.43874, p-value < 0.0001). The median value of P. aeruginosa was <1 CFU/250 mL at T0 (range < 1–3200), at T1 (range < 1–610) and at T2 (range < 1–170) (Figure 1C). The Friedman rank-sum test (Friedman χ2 = 47.041, df = 2, p-value < 0.0001) and post-hoc Conover’s test showed statistically significant differences (p-value < 0.0001) in the P. aeruginosa load at different time periods (T0, T1 and T2), revealing a decrease in the load. There were no statistically significant differences between taps and showers in terms of the positivity rate (Table 2) and load (Table 3) of P. aeruginosa.

2.3. Legionella Detection

Legionella pneumophila sg 8 was isolated from 80.2% (73/91) of water samples at T0, from 36.3% (33/91) at T1 (T0 vs. T1—χ2 Yates correction = 34.36; p-value < 0.00001) and from 2.2% (2/91) at T2 (both T0 vs. T2 and T1 vs. T2 Fisher’s F p-value < 0.0001). The Lilliefors (Kolmogorov–Smirnov) normality test showed no normal distribution of the load (D = 0.24695, p-value < 0.0001). The median value of the load resulted in 1000 CFU/L (range < 50–24,000) at T0 and <50 CFU/L (range < 50–2300) at T1 and T2 (range <50–50) (Figure 1D). The difference between L. pneumophila loads at different time periods during the analysis was statistically significant (Friedman χ2 = 112.87, df = 2, p < 0.0001—post hoc Conover’s test for a two-way analysis with p-value < 0.0001).
Table 2 shows a comparison of the L. pneumophila positivity rates between taps and showers, with a statistically significant difference only detected at T2 (Fisher’s F-test p-value = 0–0.07% vs. 8.3%). Taps showed a higher load than showers at T0 (Wilcoxon rank-sum test with continuity correction W = 1091.5, p-value = 0.01) and a lower load at T2 (W = 737, p-value = 0.02) (Table 3).
A Poisson regression model was used to perform multivariate analysis of the L. pneumophila load compared with the load of other microorganisms (Table 4).
The results showed a large increase in the relative risk (RR) of the L. pneumophila load for each increase in the coliform load (+1.449%). The P. aeruginosa load was directly proportional to the L. pneumophila load, whereas the E. coli and enterococci loads were inversely proportional to the L. pneumophila load.

3. Discussion

The water safety in healthcare facilities could be underestimated in a new building. According to Guidelines for the Design and Construction of Health Care Facilities [22], a new construction must follow a control plan for the water network, including Legionella investigation [23]. This plan should contain a risk assessment that identifies water treatment systems and points of water use that require intervention control strategies to mitigate potential hazards. The installation, modification and maintenance of plumbing systems must be adequate, by virtue of the awareness of the overall scheme of the system and its operation [2]. To achieve this goal, a multidisciplinary approach is necessary and should involve epidemiologists, hospital safety officers, architects, engineers, as well as clinicians and microbiologists.
According to previous studies [9,12], our results revealed high microbiological contamination of the water network, probably due to the long period of inactivity before the inauguration of the new pavilion. While Gram-negative bacteria and fungi tend to adhere to biofilms at or near distal points of use [3,8,24], Legionella can also colonize deep hospital infrastructures and is responsible for nosocomial cases of legionellosis [10,25]. Fortunately, as reported by some Authors [17], our remediation interventions (i.e., flushing with hydrogen peroxide and silver ions for 20 min/day for one week) resulted in an overall decrease in the bacterial load.
According to some Authors, the protocol undertaken showed an important role in preventing biofilm formation, which can support Legionella growth [26,27]. We wanted to examine both the taps and the showers to see if there were different positivity rates and microbial loads. Our results showed that all remediation interventions were less effective for Legionella between T0 and T2 for showers than for taps. According to a previous report [28], shower hoses promote bacterial growth near a critical end-user exposure path within the building’s drinking water pipes. They are typically exposed to warm water (rather than just cold or hot) and would be subject to distal end cooling, even when used with properly regulated hot water recirculation systems [29].
The hydrogen peroxide and silver ions are active agents against bacteria, yeast, fungi, viruses, spores, proto-, and metazoans [30]; they are included in the Italian Guidelines for the Control and Prevention of Legionellosis [31]. It is compatible with different pipeline materials and does not react with the organic constituents in the water to form dangerous residues with respect to chlorine, sodium hypochlorite and monochloramine treatment [32]. European directives do not establish a concentration limit for hydrogen peroxide in drinking water, although the German and British version of the EN 902:2016 [33] provides a dosage up to 17 mg/L [17]. The hydrogen peroxide and silver ions are stable at high temperatures, and its disinfection power increases significantly as water temperature increases [31].
According to some studies, our results confirmed that the water distribution system consisting of galvanized iron, as opposed to plastic material (polyethylene and polyvinyl chloride) [34,35], together with prolonged use of the disinfectant, inhibited the colonization of Legionella [31].
Regarding the practice of flushing as preventive measure, although this information is specific to Legionella species, our study showed that it may also provide a benefit in reducing the concentration of other waterborne pathogens and potential exposure [36].
Waterborne Gram-negative bacteria (other than Legionella) that may infect hospitalized patients may be introduced into the water supply via colonized patients, and then spread through the environment [23]. Although the role of the environment is unclear in many nosocomial outbreaks, sink drains have been repeatedly implicated in reports of the transmission of Gram-negative bacteria, including Pseudomonas and Klebsiella [36,37]. The attribution of an outbreak to sink drain contamination was usually based on similar genotypic patterns and the termination of the outbreak following remediation of the contaminated sink drain [37,38,39].
In conclusion, poor water system design in new hospital buildings or limited use of the water network, if not properly managed, can represent a danger for patients and healthcare professionals, as evidenced by some recorded outbreaks (due to Legionella or P. aeruginosa) in newly built hospitals in Germany. In one of these outbreaks, P. aeruginosa colonization was not eliminated even after heat treatment and continued disinfection with chlorine dioxide. As a result, the building was vacated [9]. Therefore, the Water Safety Plan approach is required to focus on managing risks throughout all steps in the water supply chain from source water catchment through treatment processes to storage, distribution and handling of drinking water [40]. In new or renovated buildings, adequate planning of microbiological checks of the water network before the start of activities is the first step in minimizing infectious risks. Malfunction of the water network and the corrective actions to reestablish the water quality (e.g., emptying the system, especially if it is not possible to maintain weekly flushing), can be very expensive and can include the transfer of patients and/or the suspension of activities within a ward. Furthermore, if the level of microbial contamination, as in the case of Legionella, varies over a short period of time [41,42], inadequate sampling can lead to ill-informed decision-making (e.g., whether or not to disinfect, or what type of treatment to adopt), compromising the safe and effective management of hospital wards.

4. Materials and Methods

4.1. Study Design

This study was carried out from April to May, 2020, in a large university hospital in Apulia, southern Italy, which comprised 1400 beds in 33 separate buildings. A new seven-story building (basement, ground floor and five floors) covering a total of 6000 square meters was selected for this study. The installation of the water system powered by municipal water and equipped with galvanized iron pipelines was started in 2018 and ended in February 2020. In April 2020, within the Water Safety Plan (WSP) implementation program, a systematic monitoring and disinfection program of water network was started.
Water samples from all of the end points of use (67 taps and 24 showers—91 samples in total) were collected in April 2020 (T0, without any water treatment), for a microbiological check before the inauguration. The following month (T1, i.e., after disinfection of the water network with hydrogen peroxide and silver ions and after flushing water for 20 min every day for seven successive days) and 15 days later (T2) the sampling was repeated.
Physico-chemical and microbiological parameters (coliforms, E. coli, enterococci, P. aeruginosa) and Legionella were investigated using the methods described below.

4.2. Water Disinfection

The method of disinfection with hydrogen peroxide and silver ions was continuous, i.e., without interrupting the water to the user. The injection of product was performed at make-up cold water pipe to the hot water boiler and was normally equal to 20 mg/L. A pulse-emitting counter was installed on the make-up pipe to the boiler in order to control the dosage of the product in proportion to the flow of water supplied to the user. Once the dosage was calibrated, it was advisable to periodically check the concentration of residual product at the users and in the recirculation pipe, which must remain between 10 and 15 mg /L of product detected with the control kit (Cillichemie, Milan, Italy).
Together with disinfectant, to prevent the formation of any limescale deposits or the initiation of corrosion processes, an anticorrosive product based on sodium hydroxide (2.5–10%), sodium carbonate (≤ 2.5%), salicylic acid, sodium salt (≤ 2.5%) and phosphoric acid (≤ 2.5%) was administered continuously.

4.3. Physico-Chemical Parameters

Each sample was analyzed for the physico-chemical parameters provided by Lgs. D. 31/01 [1]. The temperature, pH and conductivity were measured with a multiparametric probe (Edge, Hanna Instrument Inc.; Woonsocket, RI, USA). Chemical parameters (hardness, free chlorine, chlorides, ammonium, nitrites, nitrates) were analyzed by colorimetric reaction with Spectrophotometer HI83399 (Hanna Instrument Inc; Woonsocket, RI, USA).
In particular, the measurement of ammonia concentration in the solution was based on the ASTM Manual of Water and Environmental Technology, D1426-92, Nessler method [43], (HI 93733 reagent). Free chlorine was evaluated following the US EPA (United States Environmental Protection Agency) Method 330.5 [43] with N, N-diethyl-p-phenylene diamine (DPD, HI 93701 reagent). The EPA Diazotization method 354.1 [43] was used to analyze Nitrite (HI 93707 reagent). Total hardness was evaluated using the EPA recommended method 130.1 (HI 93735 reagent) [44]. The Cadmium Reduction Method (Method EPA 353.2) was used for the colorimetric determination of nitrate as nitrogen (HI 93728 reagent) [44]. The Mercury (II) Thiocyanate Method (Method EPA 325.2) with the specific reagent (HI 93753 reagent) was used for the colorimetric determination of chloride [44].

4.4. Microbiological Investigation

Sampling and processing procedures were performed according to the Italian Lgs.D.31/01 [1] relating to coliforms, Escherichia coli, enterococci and Pseudomonas aeruginosa. Cold water samples (1 L) were collected from all taps and showers in sterile bottles with sodium thiosulphate pentahydrate (0.01%, w/v), to neutralize the chlorine present in water samples, and transported to the laboratory at 4 °C to be analyzed within 4 h. Specific aliquots of each sample were filtered through a cellulose ester membrane with a diameter of 47 mm and a pore size of 0.45 µm (Millipore, Milan, Italy).
For E. coli and coliform investigations, 100 mL of each water sample was filtered, and the membrane placed on plates containing Chromogenic Coliform Agar (Biolife Italiana Srl, Milan, Italy). After incubation at 36 ± 2 °C for 24 ± 2 h, the blue-violet colonies were identified as E. coli, and the salmon pink, oxidase-negative colonies were identified as coliforms [45].
For the isolation of enterococci, 100 mL of the sample was filtered; the membrane was placed on Slanetz and Bartley agar medium (Biolife Italiana Srl, Milan, Italy) and incubated at 36 ± 1 °C for 48 h. When dark pink-red colonies developed the membrane was transferred to a plate containing Bile Esculin Azide agar (Biolife Italiana Srl, Milan, Italy) and incubated at 44 °C for 2 h. Brown colonies with brown-black halos and positive catalysis were identified as enterococci [46].
P. aeruginosa was investigated in 250 mL of sample. After sample filtration, the membrane was placed on a plate containing Pseudomonas Selective Agar supplemented with cetrimide (0.20 g) and nalidixic acid (15 mg) (Microbiol, Cagliari, Italy) and incubated at 36 ± 2 °C for 44 ± 4 h. Blue-green pyocyanin-producing colonies were directly confirmed to be P. aeruginosa [47].
The samples were considered compliant to Lgs.D.31/01 when E. coli, coliforms and enterococci were absent from 100 mL of each sample (limit of detection, LOD < 1 CFU/100 mL), and P. aeruginosa was absent from 250 mL of sample (LOD < 1 CFU/250 mL).

4.5. Legionella Investigation

Hot water samples (1L) were collected from all showers and taps, in sterile dark glass containers containing sodium thiosulphate pentahydrate (0.01%, w/v) to neutralize chlorine present in the water and were transported immediately at environmental temperature (19.1 °C; range 18.7–24.1 °C) to be analyzed within 24 h [30]. Each sample was filtered through a 0.2 μm isopore nylon membrane, 47 mm in diameter (Millipore Corporation, Bedford, MA, USA). Each membrane was suspended in 10 mL of the same water sample and vortexed. After, 200 μL of each sample was seeded onto GVPC (glycine vancomycin polymyxin cycloheximide) agar plates (Liofilchem Srl, Teramo, Italy), incubated at 37 ± 1 °C for 10 days in a humid environment (under 2.5% CO2) and examined after 2, 4 and 10 d of incubation. Suspect colonies were subcultured on buffered charcoal yeast extract (BCYE) agar (BioMérieux, Marcy-l’Etoile, France) with and without L-cysteine. Colonies that grew only in the presence of cysteine were identified as Legionella and confirmed using a latex agglutination test with polyvalent (Biolife Italiana Srl, Milan, Italy) and monovalent antisera (Biogenetics Srl, Tokyo, Japan). Water samples containing < 50 colony-forming units per liter (CFU/L) were considered negative for Legionella [48]; this concentration falls within the threshold below which no intervention is required in healthcare facilities [31].

4.6. Statistical Analysis

The Lilliefors (Kolmogorov–Smirnov) normality test was used to verify the normality of the distribution of the differences between the microbiological parameter values and the Legionella load at the T0 (before water treatment) and T2 time periods (after the second water treatment) [49].
The Friedman rank sum test and post-hoc Conover’s test for two-way analysis or the Wilcoxon signed rank test with continuity correction was used to compare the values of the potable parameters and Legionella loads in different analysis periods (paired data) or between taps and showers.
Either Fisher’s exact test or the χ2 test with Yates correction was used to compare the positivity of the potable parameters in the difference time period or between taps and showers. A Poisson regression model was used to perform multivariate analysis of the Legionella load compared with the loads of other microbiological parameters.
The final model included only variables with a p-value of < 0.05 in the preliminary model of all variables. To quantify the effects of the microbiological parameter load (other than Legionella), we computed the influences (eβ-1) that corresponded to the relative risk (RR) [19]. R software version 3.5.1 was used for statistical analysis, and a p-value < 0.05 was considered statistically significant.

5. Conclusions

Different bacteria may contaminate nosocomial water systems, therefore, an active and well-planned environmental surveillance strategy in hospitals is vital for prevention. In particular, public health agencies should assess the “Water Safety Plans” for new buildings and new or renovated water systems where health risks can be high.
Based on our findings, we advise that, before occupying a new pavilion, accurate environmental microbiological surveillance should be performed to reduce the risk of waterborne diseases.

Author Contributions

O.D.G., M.T.M. conceived the study. M.L., F.T., C.C., C.P., V.R. collected and analyzed the water samples. O.D.G., G.D., M.T.M. wrote the manuscript. F.F. curated data and statistically analyzed the results. G.C., L.F.C., M.C., L.G. revised the manuscript. O.D.G., L.L., M.T.M. writing—review and editing. M.L.R., M.S., M.C.R. methodology. L.B. validation. M.T.M. funding acquisition. All authors read and agreed to the final version of the manuscript.

Funding

This research was funded by the Regional Epidemiological Observatory (D.G.R. 137/2017-21, 2019), Apulia, Italy.

Institutional Review Board Statement

Not applicable.

Informed Consent Statement

Not applicable.

Data Availability Statement

Data are contained within the article.

Acknowledgments

We thank Kate Fox, DPhil, from Edanz Group for editing a draft of this manuscript.

Conflicts of Interest

The authors declare no conflict of interest.

References

  1. Decreto Legislativo 2 Febbraio 2001, n. 31. “Attuazione della Direttiva 98/83/CE Relativa alla Qualità delle Acque Destinate al Consumo Umano”. GU n. 52 del 3 Marzo 2001-Supplemento Ordinario n. 41. Available online: https://www.camera.it/parlam/leggi/deleghe/01031dl.htm (accessed on 14 October 2020).
  2. Bonadonna, L.; De Grazia, M.C.; Capolongo, S.; Casini, B.; Cristina, M.L.; Daniele, G.; D’Alessandro, D.; De Giglio, O.; Di Benedetto, A.; Di Vittorio, G.; et al. Water safety in healthcare facilities. The Vieste Charter. Ann. Ig. 2017, 29, 92–100. [Google Scholar] [PubMed]
  3. Caggiano, G.; Diella, G.; Triggiano, F.; Bartolomeo, N.; Apollonio, F.; Campanale, C.; Lopuzzo, M.; Montagna, M.T. Occurrence of Fungi in the Potable Water of Hospitals: A Public Health Threat. Pathogens 2020, 9, 783. [Google Scholar] [CrossRef]
  4. Exner, M.; Kramer, A.; Lajoie, L.; Gebel, J.; Engelhart, S.; Hartemann, P. Prevention and control of health care-associated waterborne infections in health care facilities. Am. J. Infect. Control 2005, 33, S26–S40. [Google Scholar] [CrossRef] [PubMed]
  5. Montagna, M.T.; Caggiano, G.; Lovero, G.; De Giglio, O.; Coretti, C.; Cuna, T.; Iatta, R.; Giglio, M.; Dalfino, L.; Bruno, F.; et al. Epidemiology of invasive fungal infections in the intensive care unit: Results of a multicenter Italian survey (AURORA Project). Infection 2013, 41, 645–653. [Google Scholar] [CrossRef] [PubMed] [Green Version]
  6. Montagna, M.T.; De Giglio, O.; Napoli, C.; Lovero, G.; Caggiano, G.; Delia, M.; Pastore, D.; Santoro, N.; Specchia, G. Invasive fungal infections in patients with hematologic malignancies (Aurora Project): Lights and shadows during 18-months surveil-lance. Int. J. Mol. Sci. 2012, 13, 774–787. [Google Scholar] [CrossRef] [Green Version]
  7. Montagna, M.T.; Lovero, G.; De Giglio, O.; Iatta, R.; Caggiano, G.; Montagna, O.; Laforgia, N. Invasive fungal Infections in neonatal intensive care units of Southern Italy: A multicenter regional active surveillance (AURORA Project). J. Prev. Med. Hyg. 2010, 51, 125–130. [Google Scholar]
  8. Montagna, M.T.; De Giglio, O.; Napoli, C.; Diella, G.; Rutigliano, S.; Agodi, A.; Auxilia, F.; Baldo, V.; Bisetto, F.; Arnoldo, L.; et al. Control and prevention measures for legionellosis in hospitals: A cross-sectional survey in Italy. Environ. Res. 2018, 166, 55–60. [Google Scholar] [CrossRef] [PubMed]
  9. World Health Organization. Water Safety in Buildings. 2011. Available online: https://apps.who.int/iris/handle/10665/76145 (accessed on 9 October 2020).
  10. Napoli, C.; De Giglio, O.; Bertamino, E.; Montagna, M.T. Legionellosis in health care facilities: State of the art in control and prevention in Italy. Ann. Ig. 2019, 31, 474–481. [Google Scholar]
  11. Napoli, C.; Fasano, F.; Iatta, R.; Barbuti, G.; Cuna, T.; Montagna, M.T. Legionella spp. and legionellosis in southeastern Italy: Disease epidemiology and environmental surveillance in community and health care facilities. BMC Public Health 2010, 10, 660. [Google Scholar] [CrossRef]
  12. De Giglio, O.; Diella, G.; Lopuzzo, M.; Triggiano, F.; Calia, C.; Pousis, C.; Fasano, F.; Caggiano, G.; Calabrese, G.; Rafaschieri, V.; et al. Impact of lockdown on the microbiological status of the hospital water network during COVID-19 pandemic. Environ. Res. 2020, 191, 110231. [Google Scholar] [CrossRef]
  13. Hase, R.; Miyoshi, K.; Matsuura, Y.; Endo, Y.; Nakamura, M.; Otsuka, Y. Legionella pneumonia appeared during hospitalization in a patient with hematological malignancy confirmed by sputum culture after negative urine antigen test. J. Infect. Chemother. 2018, 24, 579–582. [Google Scholar] [CrossRef] [PubMed]
  14. Muzzi, A.; Cutti, S.; Bonadeo, E.; Lodola, L.; Monzillo, V.; Corbella, M.; Scudeller, L.; Novelli, V.; Marena, C. Prevention of nosocomial legionellosis by best water management: Comparison of three decontamination methods. J. Hosp. Infect. 2020, 105, 766–772. [Google Scholar] [CrossRef] [PubMed]
  15. Tobin, J.O.; Beare, J.; Dunnill, M.S.; Fisher-Hoch, S.; French, M.; Mitchell, R.G.; Morris, P.J.; Muers, M.F. Legionnaires’ disease in a transplant unit: Isolation of the causative agent from shower baths. Lancet 1980, 2, 118–121. [Google Scholar] [CrossRef]
  16. Direttiva (UE) 2020/2184 del Parlamento Europeo e del Consiglio del 16 Dicembre 2020 Concernente la Qualità delle Acque Destinate al Consumo Umano. G.U. dell’Unione Europea L 435/1 del 23 dicembre 2020. Available online: https://eur-lex.europa.eu/legal-content/IT/TXT/PDF/?uri=CELEX:32020L2184&from=IT (accessed on 11 January 2020).
  17. Casini, B.; Aquino, F.; Totaro, M.; Miccoli, M.; Galli, I.; Manfredini, L.; Giustarini, C.; Costa, A.L.; Tuvo, B.; Valentini, P.; et al. Application of Hydrogen Peroxide as an Innovative Method of Treatment for Legionella Control in a Hospital Water Network. Pathogens 2017, 6, 15. [Google Scholar] [CrossRef] [PubMed] [Green Version]
  18. Cervero-Aragó, S.; Rodríguez-Martínez, S.; Canals, O.; Salvadó, H.; Araujo, R.M. Effect of thermal treatment on free-living amoeba inactivation. J. Appl. Microbiol. 2013, 116, 728–736. [Google Scholar] [CrossRef] [Green Version]
  19. De Giglio, O.; Napoli, C.; Apollonio, F.; Brigida, S.; Marzella, A.; Diella, G.; Calia, C.; Scrascia, M.; Pacifico, C.; Pazzani, C.; et al. Occurrence of Legionella in groundwater used for sprinkler irrigation in Southern Italy. Environ. Res. 2019, 170, 215–221. [Google Scholar] [CrossRef]
  20. Orkis, L.T.; Harrison, L.H.; Mertz, K.J.; Brooks, M.M.; Bibby, K.J.; Stout, J.E. Environmental sources of community-acquired legionnaires’ disease: A review. Int. J. Hyg. Environ. Health 2018, 221, 764–774. [Google Scholar] [CrossRef]
  21. Available online: http://www.legionellaonline.it/Not%20ISS%20nov%202019.pdf (accessed on 14 October 2020).
  22. Facility Guidelines Institute; American Society for Healthcare Engineering. Guidelines for Design and Construction of Hospitals and Outpatient Facilities; American Hospital Association: Chicago, IL, USA, 2014. [Google Scholar]
  23. Available online: https://www2.klenzoidinc.com/wp-content/themes/twentyfifteen-klenzoid/pdf/public-review-draft.pdf (accessed on 11 January 2020).
  24. Decker, B.K.; Palmore, T.N. Hospital Water and Opportunities for Infection Prevention. Curr. Infect. Dis. Rep. 2014, 16, 1–8. [Google Scholar] [CrossRef] [Green Version]
  25. Bartram, J.; Chartier, Y.; Lee, J.V.; Bond, K.; Surman-Lee, S. Legionella and the Prevention of Legionellosis; World Health Organization: Geneva, Switzerland, 2008. [Google Scholar]
  26. Husband, S.; Boxall, J. Asset deterioration and discolouration in water distribution systems. Water Res. 2011, 45, 113–124. [Google Scholar] [CrossRef]
  27. El-Chakhtoura, J.; Saikaly, P.E.; Van Loosdrecht, M.C.M.; Vrouwenvelder, J.S. Impact of Distribution and Network Flushing on the Drinking Water Microbiome. Front. Microbiol. 2018, 9, 2205. [Google Scholar] [CrossRef] [Green Version]
  28. Proctor, C.R.; Reimann, M.; Vriens, B.; Hammes, F. Biofilms in shower hoses. Water Res. 2018, 131, 274–286. [Google Scholar] [CrossRef] [PubMed]
  29. Rhoads, W.J.; Pruden, A.; Edwards, M.A. Convective Mixing in Distal Pipes Exacerbates Legionella pneumophila Growth in Hot Water Plumbing. Pathogens 2016, 5, 29. [Google Scholar] [CrossRef] [PubMed] [Green Version]
  30. Martin, N.L.; Bass, P.; Liss, S.N. Antibacterial Properties and Mechanism of Activity of a Novel Silver-Stabilized Hydrogen Peroxide. PLoS ONE 2015, 10, e0131345. [Google Scholar] [CrossRef] [PubMed]
  31. Linee Guida per la Prevenzione ed il Controllo della Legionellosi. 2015. Available online: http://www.salute.gov.it/imgs/C_17_pubblicazioni_2362_allegato.pdf (accessed on 14 October 2020).
  32. Girolamini, L.; Dormi, A.; Pellati, T.; Somaroli, P.; Montanari, D.; Costa, A.; Savelli, F.; Martelli, A.; Grottola, A.; Serpini, G.F.; et al. Advances in Legionella Control by a New Formulation of Hydrogen Peroxide and Silver Salts in a Hospital Hot Water Network. Pathogens 2019, 8, 209. [Google Scholar] [CrossRef] [Green Version]
  33. British Standards Institution. Chemicals Used for Treatment of Water Intended for Human Consumption. Hydrogen Peroxide; British Standards Institution: London, UK, 2016. [Google Scholar]
  34. Yu, J.; Kim, D.; Lee, T. Microbial diversity in biofilms on water distribution pipes of different materials. Water Sci. Technol. 2010, 61, 163–171. [Google Scholar] [CrossRef] [PubMed]
  35. Wingender, J.; Flemming, H.-C. Contamination potential of drinking water distribution network biofilms. Water Sci. Technol. 2004, 49, 277–286. [Google Scholar] [CrossRef] [PubMed]
  36. Hirsh, M.B.; Baron, J.L.; Mietzner, S.M.; Rihs, J.D.; Yassin, M.H.; Stout, J.E. Evaluation of Recommended Water Sample Collection Methods and the Impact of Holding Time on Legionella Recovery and Variability from Healthcare Building Water Systems. Microorganisms 2020, 8, 1770. [Google Scholar] [CrossRef]
  37. Hota, S.; Hirji, Z.; Stockton, K.; Lemieux, C.; Dedier, H.; Gideon, W.; Gardam, M.A. Outbreak of multidrug-resistant Pseudomonas aeruginosa colonization and infection secondary to imperfect intensive care unit room design. Infect. Control Hosp. Epidemiol. 2009, 30, 25–33. [Google Scholar] [CrossRef] [Green Version]
  38. Vergara-López, S.; Domínguez, M.C.; Conejo, M.C.; Pascual, Á.; Rodríguez-Baño, J. Wastewater drainage system as an occult reservoir in a protracted clonal outbreak due to metallo-beta-lactamase-producing Klebsiella oxytoca. Clin. Microbiol. Infect. 2013, 19, e490–e498. [Google Scholar] [CrossRef] [Green Version]
  39. Kotsanas, D.; Brett, J.; Kidd, T.J.; Stuart, R.L.; Korman, T.M.; Kidd, T.J. Disinfection of Burkholderia cepacia complex from non-touch taps in a neonatal nursery. J. Périnat. Med. 2008, 36, 235–239. [Google Scholar] [CrossRef]
  40. World Health Organization. Guidelines For Drinking-Water Quality; World Health Organization: Geneva, Swtizerland, 2017. [Google Scholar]
  41. Napoli, C.; Iatta, R.; Fasano, F.; Marsico, T.; Montagna, M.T. Variable bacterial load of Legionella spp. in a hospital water system. Sci. Total. Environ. 2009, 408, 242–244. [Google Scholar] [CrossRef] [PubMed]
  42. De Giglio, O.; Napoli, C.; Lovero, G.; Diella, G.; Rutigliano, S.; Caggiano, G.; Montagna, M.T. Antibiotic susceptibility of Le-gionella pneumophila strains isolated from hospital water systems in Southern Italy. Environ. Res. 2015, 142, 586–590. [Google Scholar] [CrossRef] [PubMed] [Green Version]
  43. ASTM International. Standard Test. Methods for Ammonia Nitrogen in Water; ASTM International: West Conshohocken, PA, USA, 2015. [Google Scholar]
  44. Methods for the Chemical Analysis of Water and Wastes (MCAWW)—EPA/600/4-79/020, 1983. EPA 600/4-79-020 Methods for Chemical Analysis of Water and Wastes. Available online: https://www.wbdg.org/ (accessed on 2 December 2020).
  45. UNI. Qualità dell’acqua—Conta di Escherichia coli e Batteri Coliformi—Parte 1: Metodo per Filtrazione su Membrana; UNI EN ISO 9308-1; UNI: Milan, Italy, 2017. [Google Scholar]
  46. UNI. Qualità dell’acqua-Ricerca ed Enumerazione di Enterococchi Intestinali—Metodo di Filtrazione su Membrana; UNI EN ISO 7899-2; UNI: Milan, Italy, 2003. [Google Scholar]
  47. UNI. Water Quality—Detection and Enumeration of Pseudomonas aeruginosa by Membrane Filtration; UNI EN ISO 16266:2008; UNI: Milan, Italy, 2008. [Google Scholar]
  48. UNICHIM. Ricerca ed Enumerazione di Legionella spp e di Legionella pneumophila Nelle Acque; UNICHIM METHOD 1037:14; UNI: Milan, Italy, 2014. [Google Scholar]
  49. Campbell, M.J.; Machin, D. Medical Statistics. A Common Sense Approach; John Wiley & Sons: New York, NY, USA, 1993; p. 142. ISBN 0-471-93764-9. [Google Scholar]
Figure 1. Box plot of the coliform load (CFU/100 mL) (A), enterococci load (CFU/100 mL) (B), P. aeruginosa load (CFU/250 mL) (C) and L. pneumophila load (CFU/L) (D), at T0, T1 and T2; CFU = colony forming units; ° = outlier values.
Pathogens 10 00075 g001
Table 1. Physical and chemical parameters of water from sampling the end points of use.
ParametersCold WaterHot WaterLimit Value 1
ValueValue
MeanRangeMeanRange
pH8.137.9–9.08.167.9–9.0≥6.5 to ≤9.5
T (°C)15.813.4–16.356.550.1–57.2-
Conductivity (µS/cm)650640–685647640–6802500
Hardness (°F)16.216–1815.315–1715–50
Free Chlorine (mg/L)0.010.00–0.010.010.00–0.010.2
Chlorides (mg/L)3026–322825–30250
Ammonium (mg/L)<0.10-<0.10-0.50
Nitrites (mg/L)<0.10-<0.10-0.50
Nitrates (mg/L)0.70.6–1.20.6 0.5–1.050
Disinfectant residual (mg/L)21.020.0–28.023.720.0–29.7-
Flow rate (L/h)550450–650550450–650-
1 According to the Italian Legislative Decree no. 31 of 2001 (Lgs.D. 31/01). - Not available.
Table 2. Comparison of the positivity rates between taps and showers.
MicroorganismPeriodTap (No./No.)Shower (No./No.)Test
ColiformsT046.3 (31/67)50.0 (12/24)χ2 = 0.0058, p-value = 0.94
T135.8 (24/67)37.5 (9/24)χ2 = 0.0101, p-value = 0.92
T24.5 (3/67)4.2 (1/24)Fisher’s F test p-value = 1
T00 (0/67)0 (0/24)Fisher’s F test p-value = 1
E. coliT14.4 (4/67)0 (0/24)Fisher’s F test p-value = 0.57
T20 (0/67)0 (0/24)Fisher’s F test p-value = 1
EnterococciT00% (0/67)0% (0/24)Fisher’s F test p-value = 1
T113.4% (9/67)8.3% (2/24)Fisher’s F test p-value = 0.72
T20% (0/67)8.3% (2/24)Fisher’s F test p-value = 0.07
P. aeruginosaT046.3% (31/67)62.5% (15/24)χ2 = 1.2696, p-value = 0.26
T129.9% (20/67)29.2% (7/24)χ2 = 0.039, p-value = 0.84
T20% (0/67)4.2% (1/24)Fisher’s F test p-value = 0.27
L. pneumophilaT085.1% (57/67)66.7% (16/24)χ2 = 2.70, p-value = 0.10
T137.3% (25/67)33.3% (8/24)χ2 = 0.01, p-value = 0.91
T20% (0/67)8.3% (2/24)Fisher’s F test p-value = 0.07
T0 = without any water treatment, T1 = after treatment the water with hydrogen peroxide and silver ions at initial concentration of 20 mg/L and after flushing water for 20 min/day for seven successive days, T2 = 15 days later; bold indicates statistically significant differences.
Table 3. Median microbiological load comparison between taps and showers.
MicroorganismPeriodTap–Median load (Range)Shower–Median load (Range)Test
Coliforms
(CFU/100 mL)
T0<1 (<1–35)<1 (<1–19)W = 784, p-value = 0.76
T1<1 (<1–60)<1 (<1–10)W = 827.5, p-value = 0.91
T2<1 (<1–3)<1 W = 768, p-value = 0.23
E. coliT1<1 (<1–2)<1W = 1140, p-value = 0.30
(CFU/100 mL)
Enterococci
(CFU/100 mL)
T1<1 (<1–3)0 (0–2)W = 847, p-value = 0.49
T2<1<1 (<1–1)W = 737, p-value = 0.018
P. aeruginosa
(CFU/250 mL)
T0<1 (<1–790)2 (<1–3200)W = 687, p-value = 0.26
T1<1 (<1–610)<1(<1–26)W = 823.5, p-value = 0.83
T2<1<1 (<1–170)W = 770.5, p-value = 0.099
L. pneumophila
(CFU/L)
T01700 (<50–24,000)325 (<50–22,000)W = 1091.5, p-value = 0.009
T1<50 (<50–2300)<50 (<50–2000)W= 868, p-value = 0.5058
T2<50<50 (<50–50)W = 737, p-value = 0.018
T0 = without any water treatment, T1 = after treatment the water with hydrogen peroxide and silver ions at initial concentration of 20 mg/L and after flushing water for 20 min/day for seven successive days, T2 = 15 days later; bold indicates statistically significant differences.
Table 4. Poisson regression model of the Legionella load-preliminary and final models.
Indipendent VariablesB(eβ-1) = RR (%)p-Value
Intercept7.06 <0.0001
Coliforms7.281449.99<0.0001
E. coli−2.277−1.00<0.0001
Enterococci−4.78−0.99<0.0001
P. aeruginosa0.070.08<0.0001
RR = Relative risk.
Publisher’s Note: MDPI stays neutral with regard to jurisdictional claims in published maps and institutional affiliations.

